Embed Size (px)
Citation preview
Particulate Particulate Matter Matter
Monitoring in Monitoring in the Eastern the Eastern Sierra RegionSierra Region
Particulate Particulate Matter Matter
Monitoring in Monitoring in the Eastern the Eastern Sierra RegionSierra RegionA Brief HistoryA Brief HistoryA Brief HistoryA Brief History
Presented byPresented byGreat Basin Unified Air Pollution Control DistrictGreat Basin Unified Air Pollution Control District
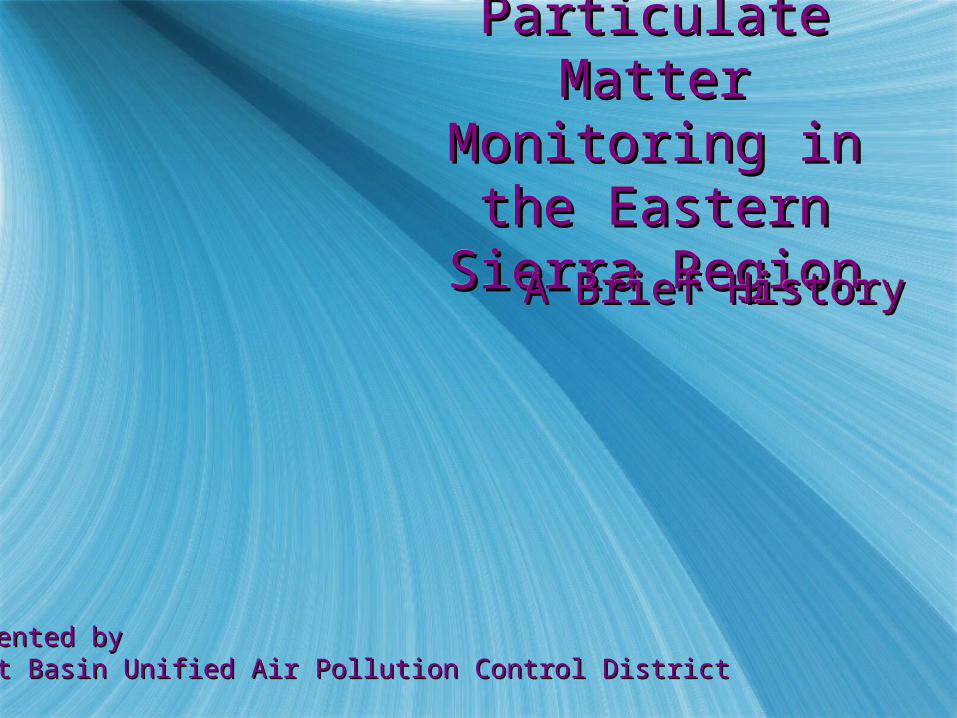
Monitoring SynopsisMonitoring SynopsisMonitoring SynopsisMonitoring Synopsis
Great Basin Unified Air Pollution Control Great Basin Unified Air Pollution Control District formed in 1974District formed in 1974
Monitoring in Eastern Sierra began in Monitoring in Eastern Sierra began in 1978 using high-volume samplers 1978 using high-volume samplers collecting total suspended particulate collecting total suspended particulate matter (TSP)matter (TSP)
District began monitoring PM10 in 1985District began monitoring PM10 in 1985 Federal EPA PM10 standard promulgated Federal EPA PM10 standard promulgated July 1, 1987July 1, 1987
Owens Valley Planning Area designated Owens Valley Planning Area designated Nonattainment for PM10 August 7, 1987Nonattainment for PM10 August 7, 1987
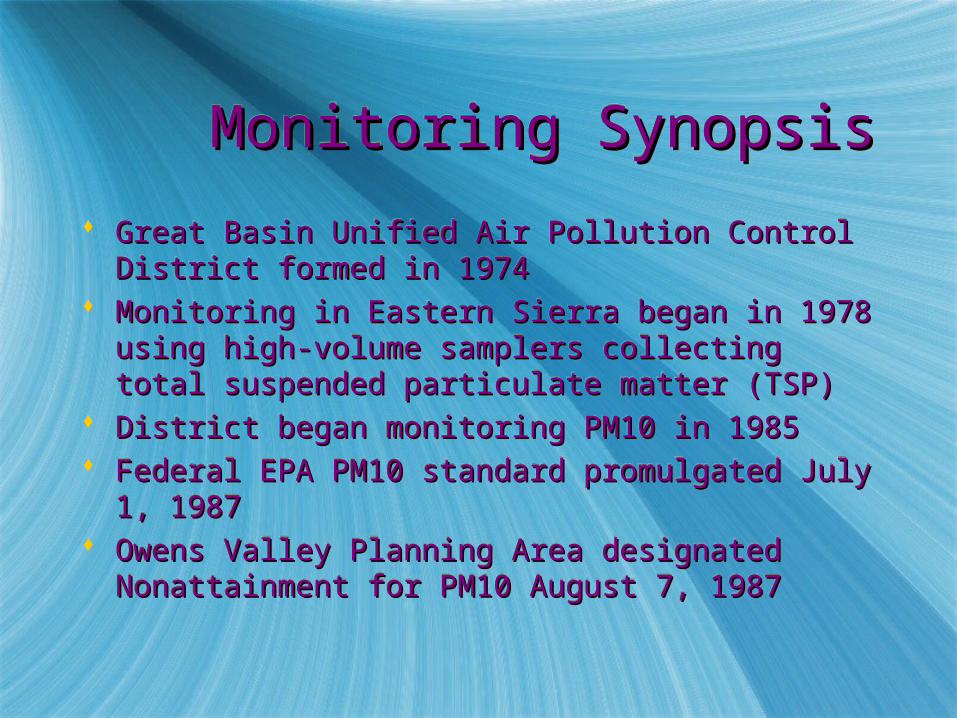
Monitoring Monitoring RationaleRationaleMonitoring Monitoring RationaleRationale
Regulation-drivenRegulation-driven
Determination of Attainment Determination of Attainment
StatusStatus
Determining ComplianceDetermining Compliance
Regulation-drivenRegulation-driven
Determination of Attainment Determination of Attainment
StatusStatus
Determining ComplianceDetermining Compliance
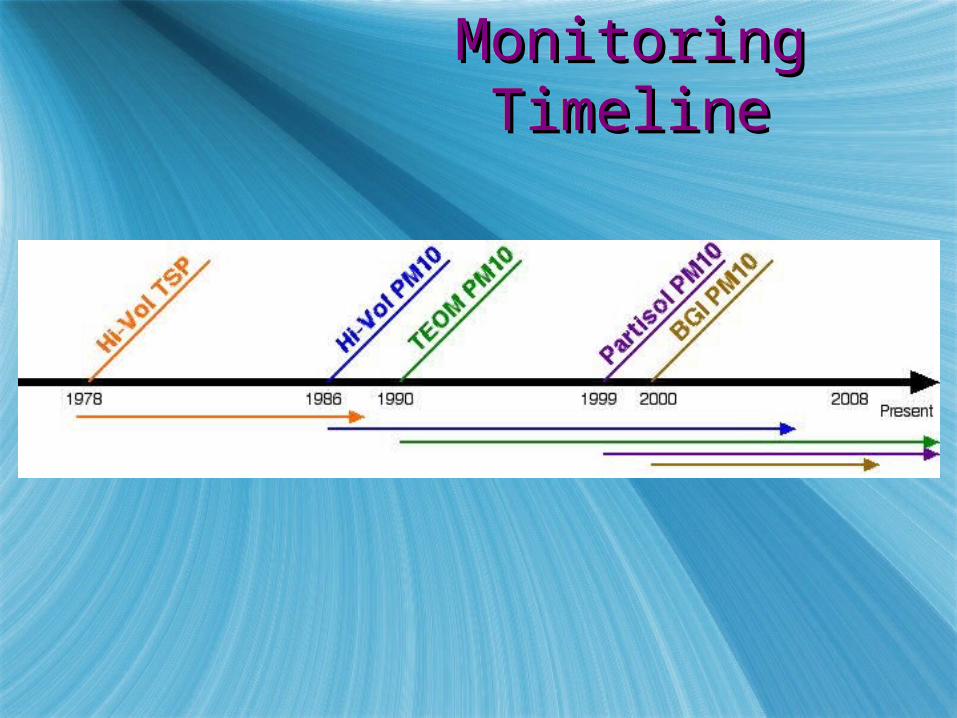
Monitoring Monitoring TimelineTimeline
Monitoring Monitoring TimelineTimeline
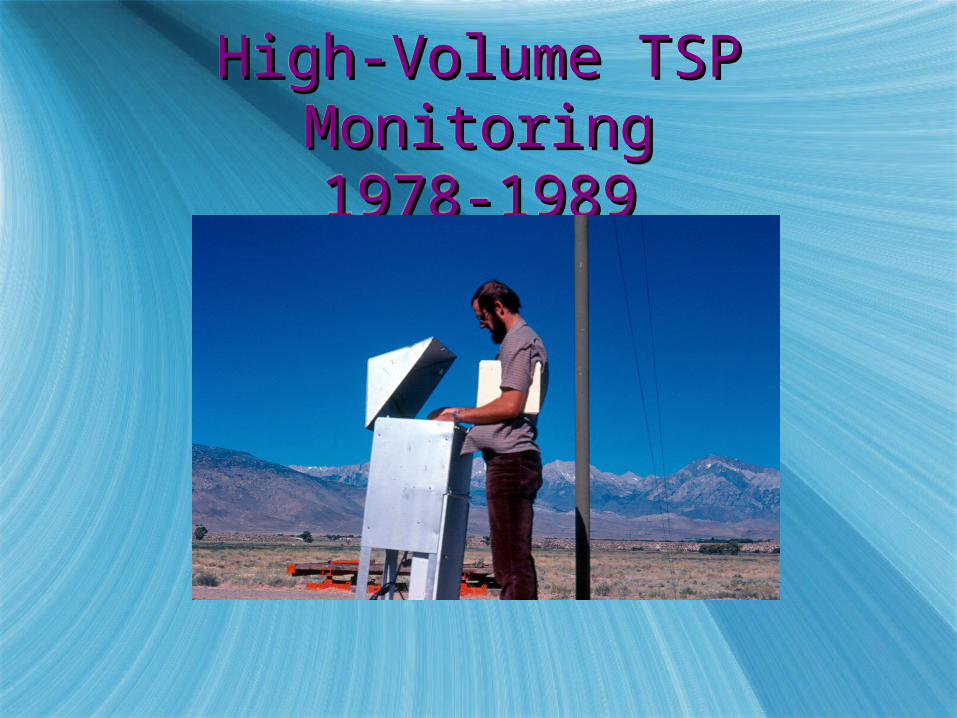
High-Volume TSP High-Volume TSP MonitoringMonitoring1978-19891978-1989
High-Volume TSP High-Volume TSP MonitoringMonitoring1978-19891978-1989
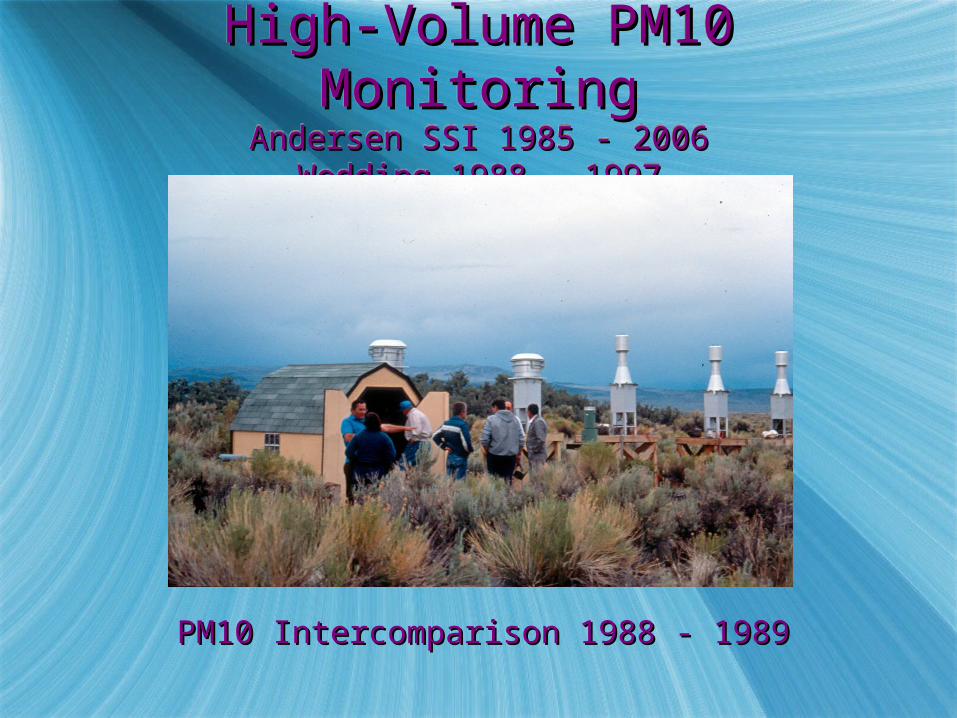
High-Volume PM10 High-Volume PM10 MonitoringMonitoring
Andersen SSI 1985 - 2006Andersen SSI 1985 - 2006Wedding 1988 - 1997Wedding 1988 - 1997
High-Volume PM10 High-Volume PM10 MonitoringMonitoring
Andersen SSI 1985 - 2006Andersen SSI 1985 - 2006Wedding 1988 - 1997Wedding 1988 - 1997
PM10 Intercomparison 1988 - 1989PM10 Intercomparison 1988 - 1989
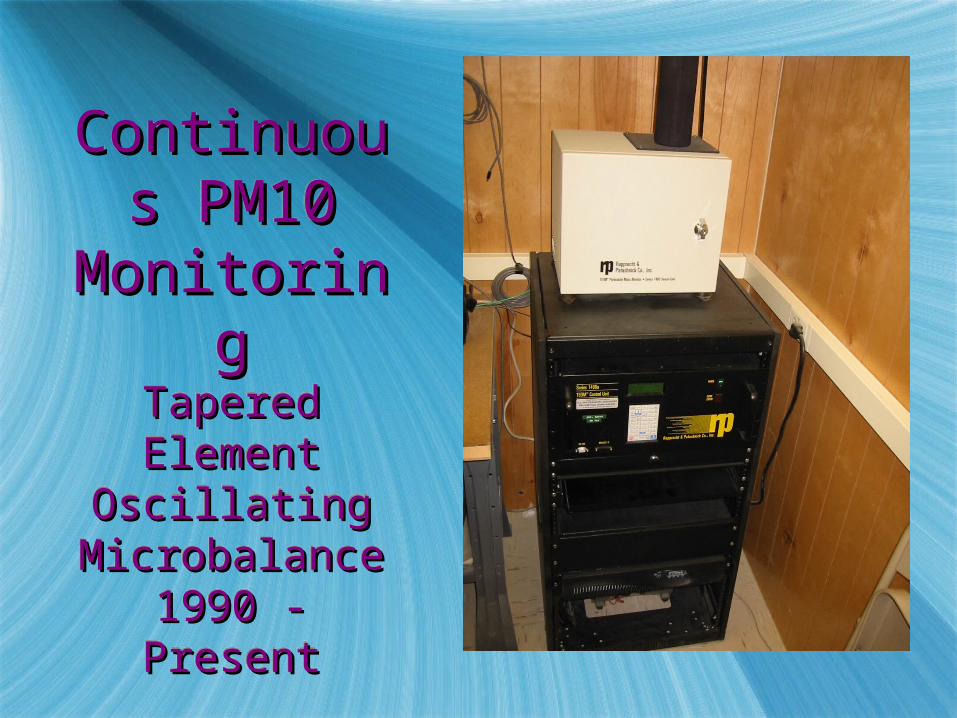
ContinuouContinuous PM10 s PM10
MonitorinMonitoringg
Tapered Tapered Element Element
Oscillating Oscillating MicrobalanceMicrobalance
1990 - 1990 - PresentPresent
ContinuouContinuous PM10 s PM10
MonitorinMonitoringg
Tapered Tapered Element Element
Oscillating Oscillating MicrobalanceMicrobalance
1990 - 1990 - PresentPresent
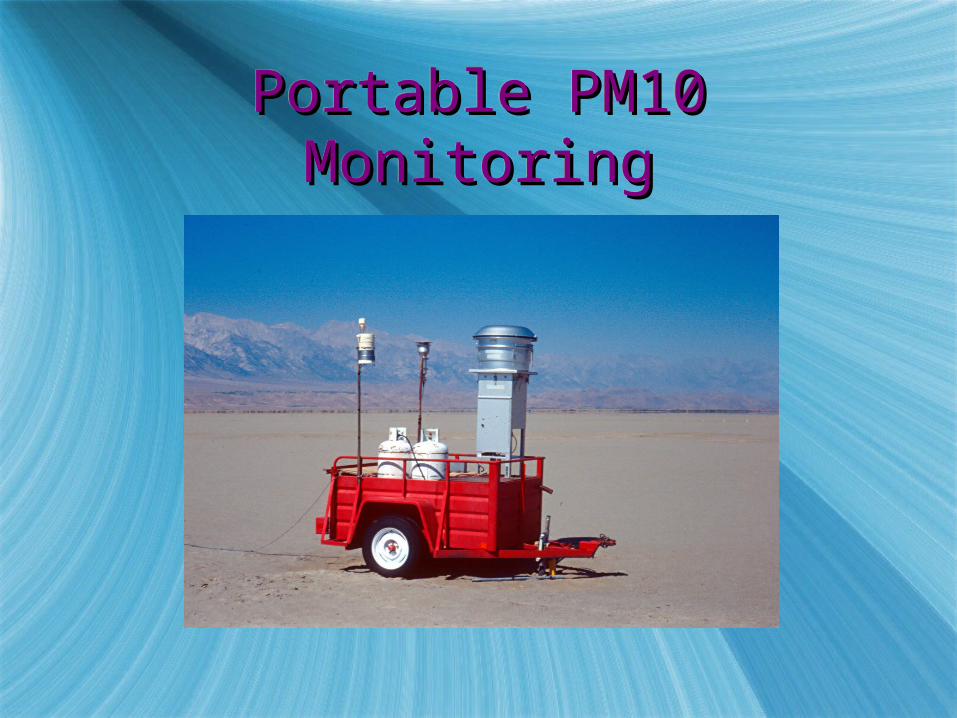
Portable PM10 Portable PM10 MonitoringMonitoring
Portable PM10 Portable PM10 MonitoringMonitoring

Portable PM10 Monitor Portable PM10 Monitor Power SystemPower System
Portable PM10 Monitor Portable PM10 Monitor Power SystemPower System
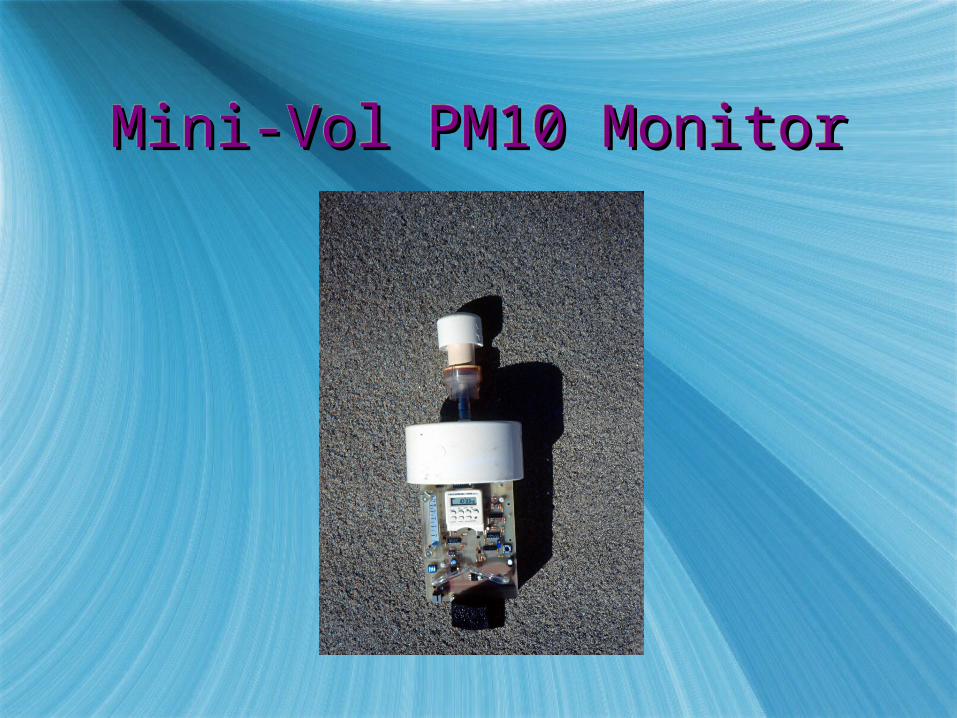
Mini-Vol PM10 MonitorMini-Vol PM10 MonitorMini-Vol PM10 MonitorMini-Vol PM10 Monitor
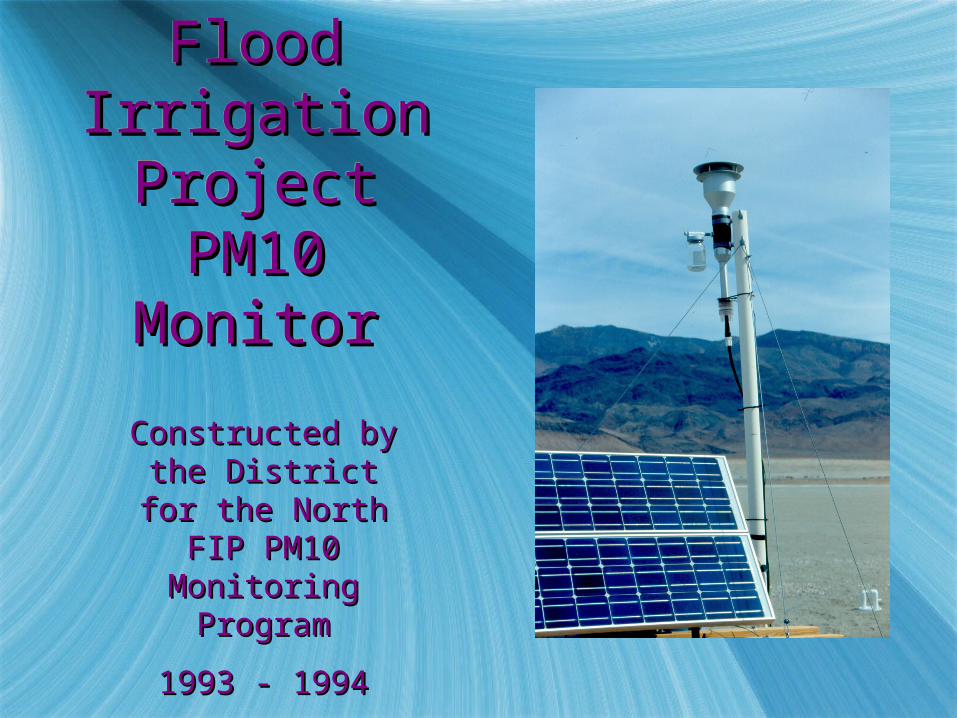
Flood Flood Irrigation Irrigation Project Project PM10 PM10
MonitorMonitor
Flood Flood Irrigation Irrigation Project Project PM10 PM10
MonitorMonitor
Constructed by the Constructed by the District for the North District for the North
FIP PM10 FIP PM10 Monitoring ProgramMonitoring Program
1993 - 19941993 - 1994
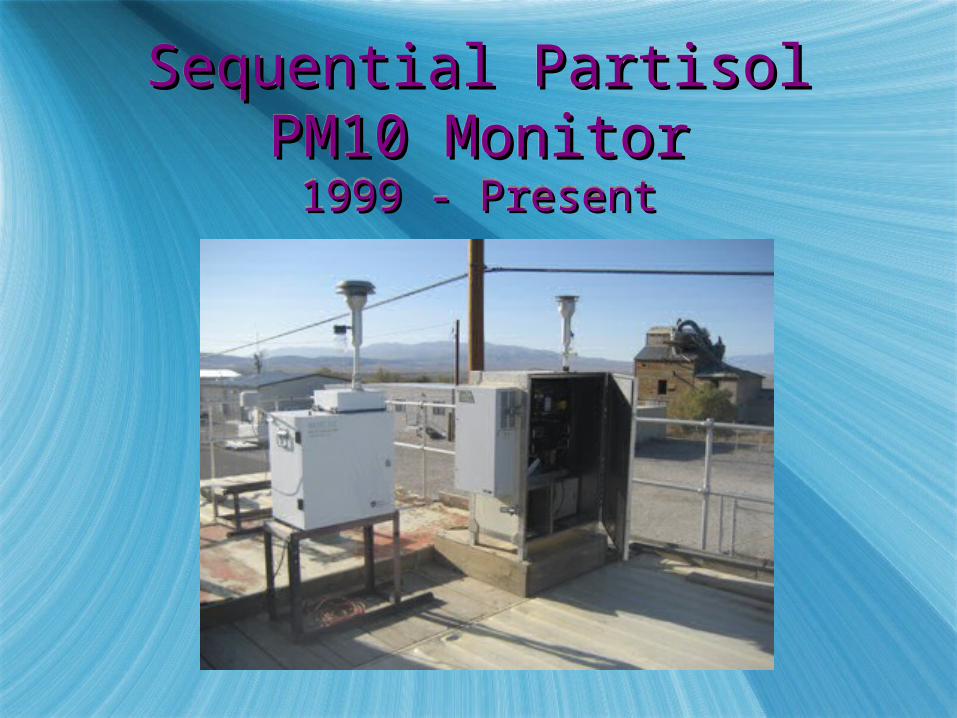
Sequential Partisol Sequential Partisol PM10 MonitorPM10 Monitor1999 - Present1999 - Present
Sequential Partisol Sequential Partisol PM10 MonitorPM10 Monitor1999 - Present1999 - Present
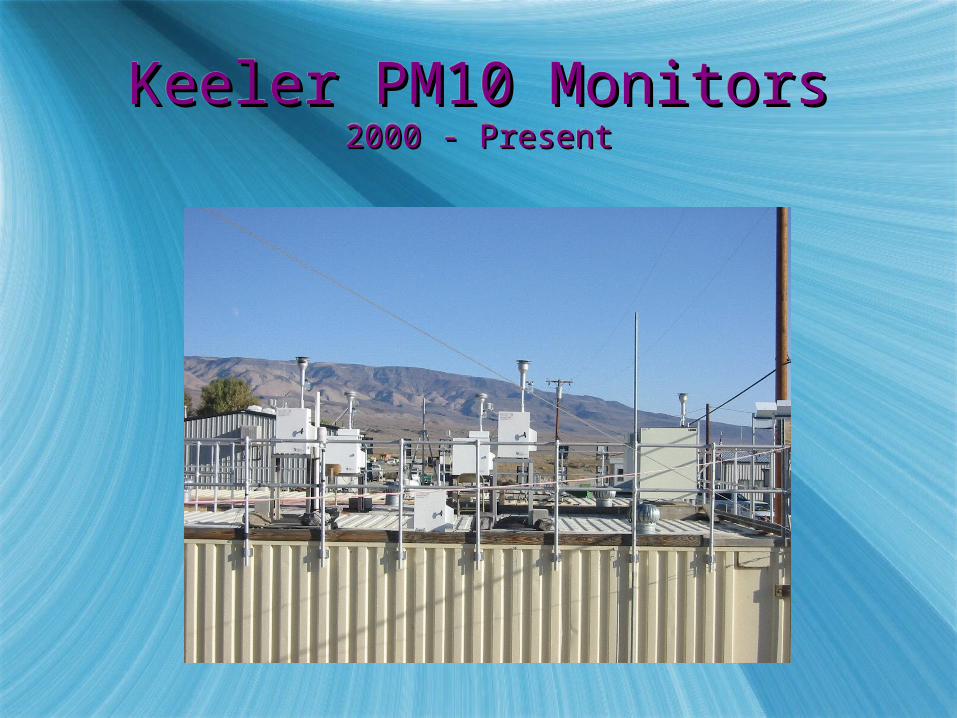
Keeler PM10 MonitorsKeeler PM10 Monitors2000 - Present2000 - Present
Keeler PM10 MonitorsKeeler PM10 Monitors2000 - Present2000 - Present
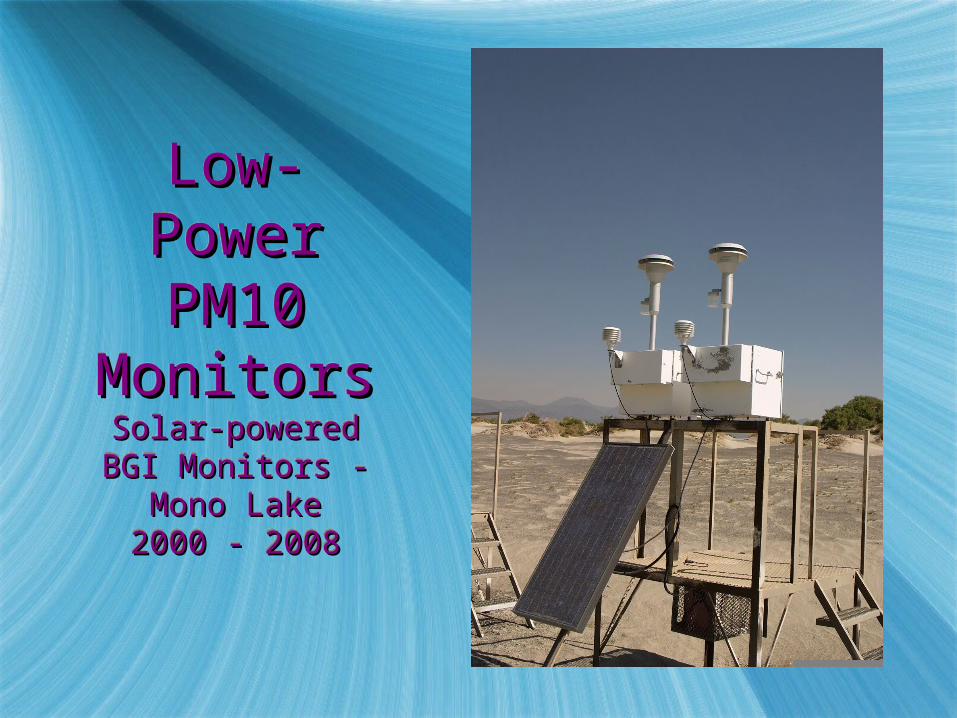
Low-Low-Power Power PM10 PM10
MonitorsMonitorsSolar-powered Solar-powered BGI Monitors - BGI Monitors -
Mono LakeMono Lake2000 - 20082000 - 2008
Low-Low-Power Power PM10 PM10
MonitorsMonitorsSolar-powered Solar-powered BGI Monitors - BGI Monitors -
Mono LakeMono Lake2000 - 20082000 - 2008
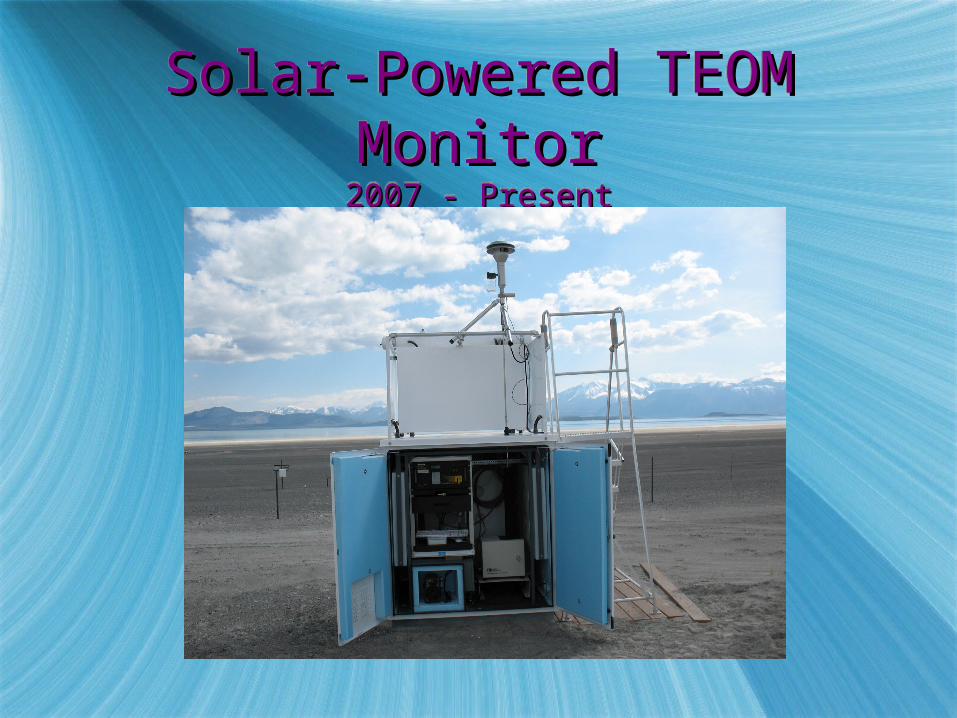
Solar-Powered TEOM Solar-Powered TEOM MonitorMonitor2007 - Present2007 - Present
Solar-Powered TEOM Solar-Powered TEOM MonitorMonitor2007 - Present2007 - Present
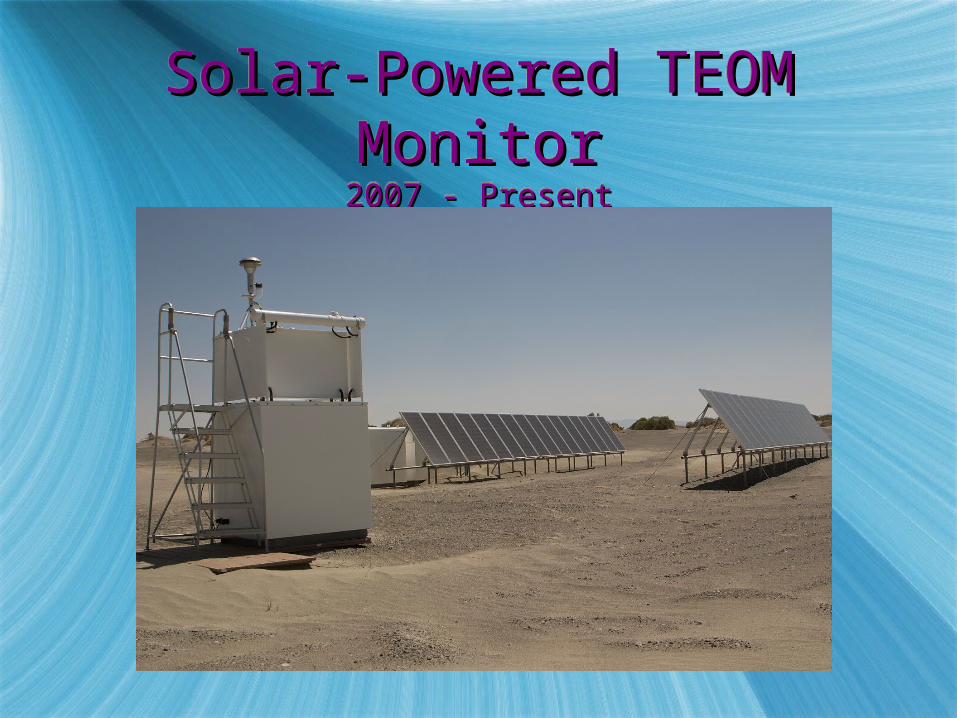
Solar-Powered TEOM Solar-Powered TEOM MonitorMonitor2007 - Present2007 - Present
Solar-Powered TEOM Solar-Powered TEOM MonitorMonitor2007 - Present2007 - Present
Special StudiesSpecial StudiesSpecial StudiesSpecial Studies
PM10 Monitoring Methods PM10 Monitoring Methods Comparison at Owens Lake 1993-Comparison at Owens Lake 1993-19991999
E-BAM - FDMS/TEOM Comparison 2005E-BAM - FDMS/TEOM Comparison 2005
Met One eSampler - TEOM Met One eSampler - TEOM
Comparison 2006`Comparison 2006`
PM10 Monitoring Methods PM10 Monitoring Methods Comparison at Owens Lake 1993-Comparison at Owens Lake 1993-19991999
E-BAM - FDMS/TEOM Comparison 2005E-BAM - FDMS/TEOM Comparison 2005
Met One eSampler - TEOM Met One eSampler - TEOM
Comparison 2006`Comparison 2006`
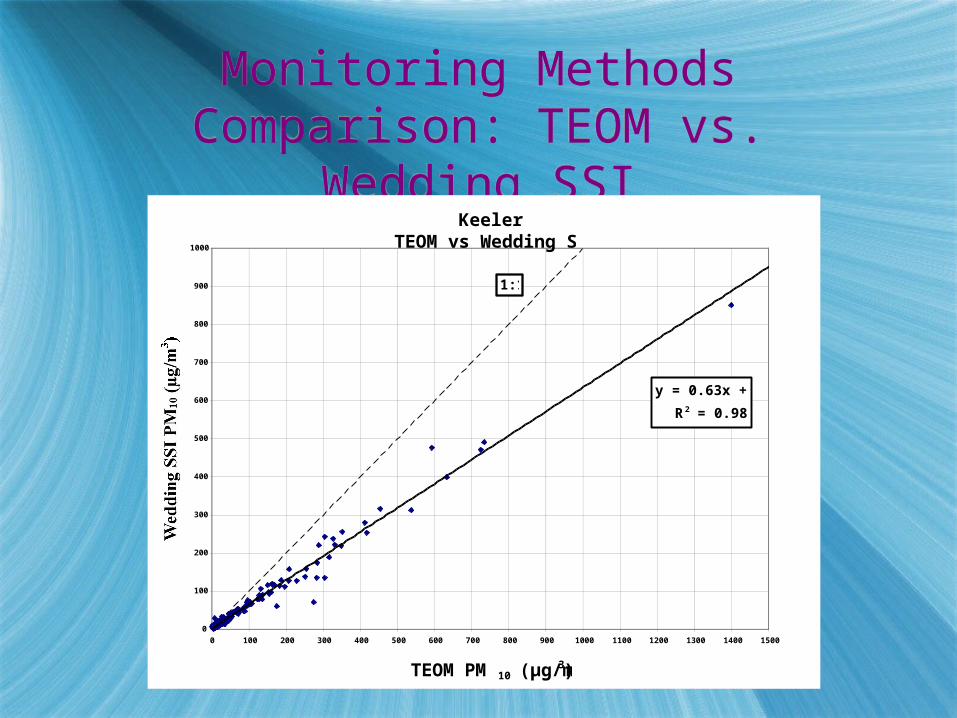
Monitoring Methods Comparison: TEOM vs.
Wedding SSI
Monitoring Methods Comparison: TEOM vs.
Wedding SSIKeeler
TEOM vs Wedding SSI
y = 0.63x + 2.38
R2 = 0.98
0
100
200
300
400
500
600
700
800
900
1000
0 100 200 300 400 500 600 700 800 900 1000 1100 1200 1300 1400 1500
TEOM PM10 (µg/m3)
Wedding SSI PM
10 (µg/m
3 )
1:1
KeelerTEOM vs Wedding SSI
y = 0.63x + 2.38
R2 = 0.98
0
100
200
300
400
500
600
700
800
900
1000
0 100 200 300 400 500 600 700 800 900 1000 1100 1200 1300 1400 1500
TEOM PM10 (µg/m3)
Wedding SSI PM
10 (µg/m
3 )
1:1
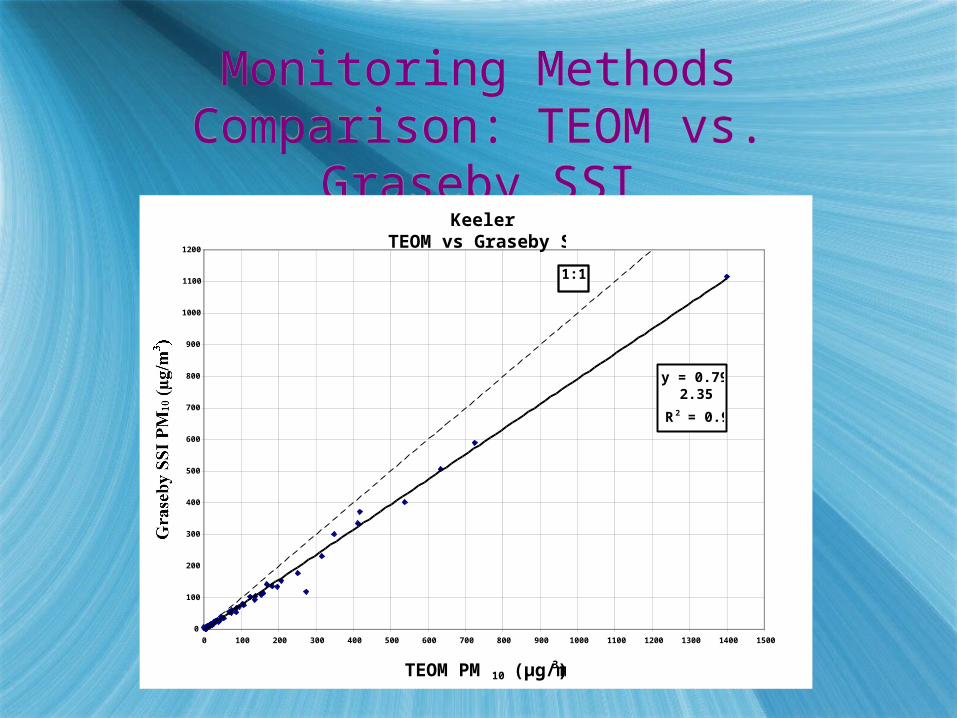
Monitoring Methods Comparison: TEOM vs.
Graseby SSI
Monitoring Methods Comparison: TEOM vs.
Graseby SSIKeeler
TEOM vs Graseby SSI
y = 0.79x - 2.35
R2 = 0.99
0
100
200
300
400
500
600
700
800
900
1000
1100
1200
0 100 200 300 400 500 600 700 800 900 1000 1100 1200 1300 1400 1500
TEOM PM10 (µg/m3)
Graseby SSI PM
10 (µg/m
3 )
1:1
Keeler TEOM vs Graseby SSI
y = 0.79x - 2.35
R2 = 0.99
0
100
200
300
400
500
600
700
800
900
1000
1100
1200
0 100 200 300 400 500 600 700 800 900 1000 1100 1200 1300 1400 1500
TEOM PM10 (µg/m3)
Graseby SSI PM
10 (µg/m
3 )
1:1
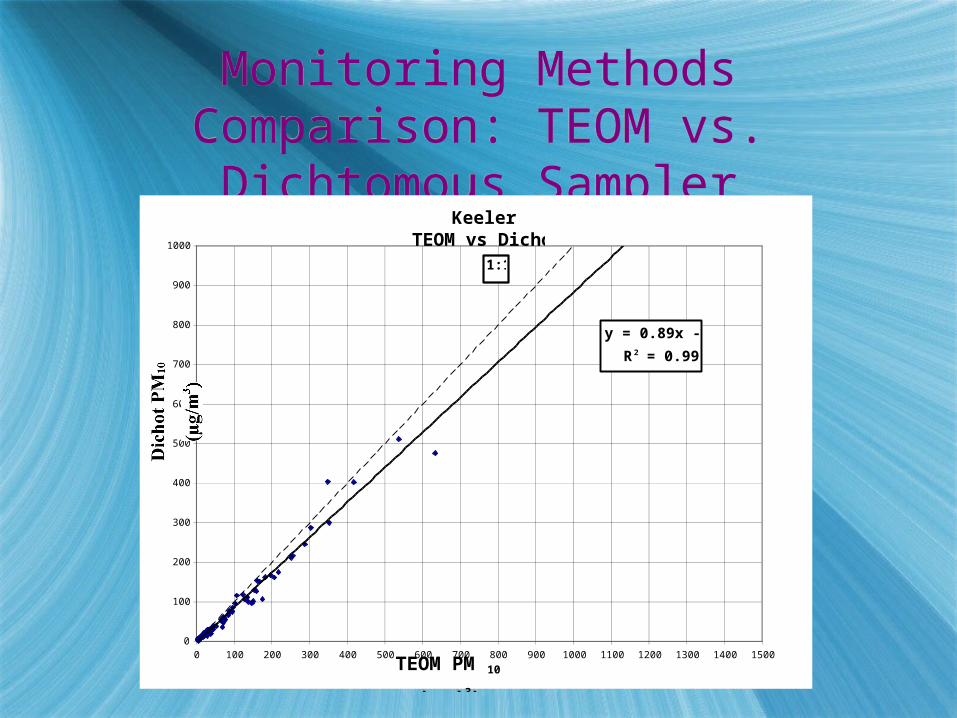
Monitoring Methods Comparison: TEOM vs. Dichtomous Sampler
Monitoring Methods Comparison: TEOM vs. Dichtomous Sampler
Keeler TEOM vs Dichot
y = 0.89x - 2.74
R2 = 0.99
0
100
200
300
400
500
600
700
800
900
1000
0 100 200 300 400 500 600 700 800 900 1000 1100 1200 1300 1400 1500TEOM PM 10
(µg/m3)
Dichot PM
10
(µg/m
3)
1:1
Keeler TEOM vs Dichot
y = 0.89x - 2.74
R2 = 0.99
0
100
200
300
400
500
600
700
800
900
1000
0 100 200 300 400 500 600 700 800 900 1000 1100 1200 1300 1400 1500TEOM PM 10
(µg/m3)
Dichot PM
10
(µg/m
3)
1:1
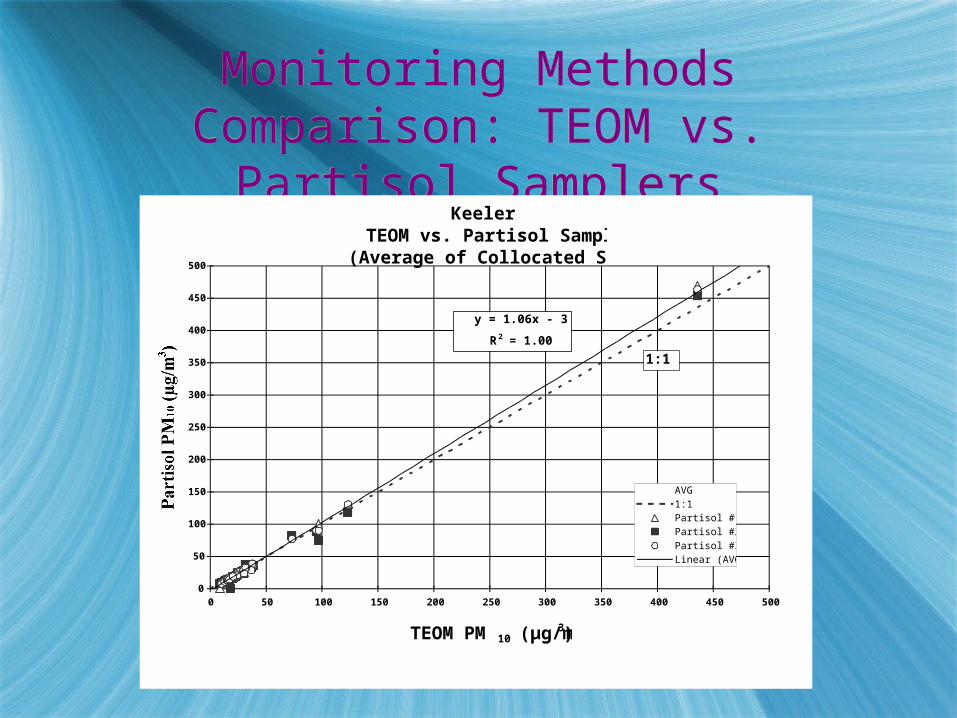
Monitoring Methods Comparison: TEOM vs. Partisol Samplers
Monitoring Methods Comparison: TEOM vs. Partisol Samplers
Keeler TEOM vs. Partisol Samplers
(Average of Collocated Samplers)
0
50
100
150
200
250
300
350
400
450
500
0 50 100 150 200 250 300 350 400 450 500
TEOM PM10 (µg/m3)
Partisol PM
10 (µg/m
3 )
AVG1:1Partisol #1Partisol #2Partisol #3Linear (AVG)
1:1
y = 1.06x - 3.46
R2 = 1.00
Keeler TEOM vs. Partisol Samplers
(Average of Collocated Samplers)
0
50
100
150
200
250
300
350
400
450
500
0 50 100 150 200 250 300 350 400 450 500
TEOM PM10 (µg/m3)
Partisol PM
10 (µg/m
3 )
AVG1:1Partisol #1Partisol #2Partisol #3Linear (AVG)
1:1
y = 1.06x - 3.46
R2 = 1.00
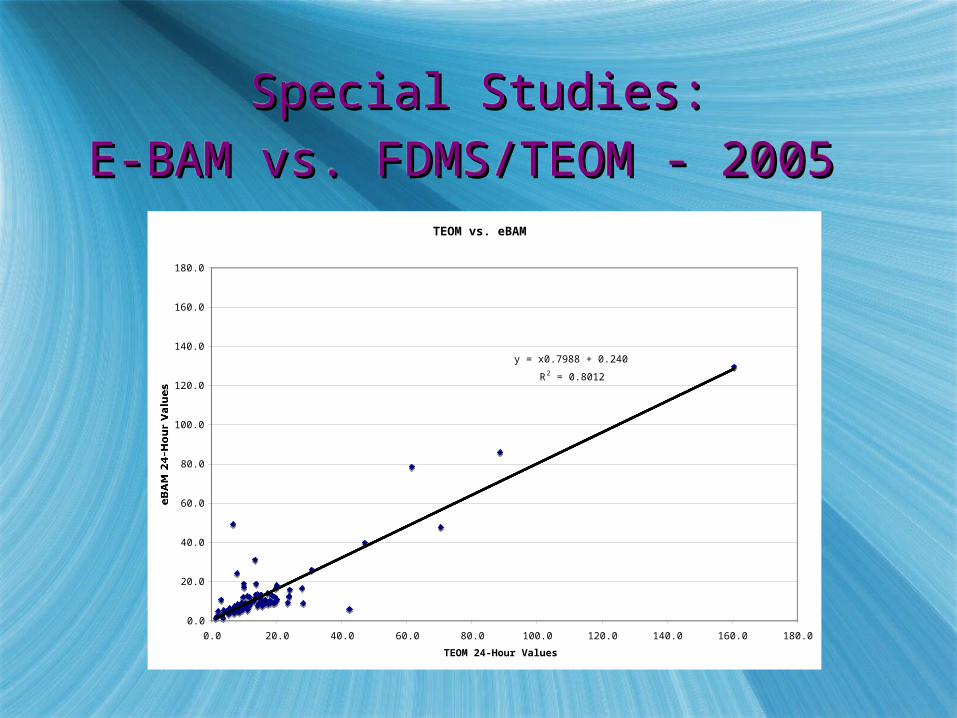
Special Studies:Special Studies:
E-BAM vs. FDMS/TEOM - 2005E-BAM vs. FDMS/TEOM - 2005 Special Studies:Special Studies:
E-BAM vs. FDMS/TEOM - 2005E-BAM vs. FDMS/TEOM - 2005 TEOM vs. eBAM
y = x0.7988 + 0.2401
R2 = 0.8012
0.0
20.0
40.0
60.0
80.0
100.0
120.0
140.0
160.0
180.0
0.0 20.0 40.0 60.0 80.0 100.0 120.0 140.0 160.0 180.0
TEOM 24-Hour Values
eBAM 24-Hour Values
TEOM vs. eBAM
y = x0.7988 + 0.2401
R2 = 0.8012
0.0
20.0
40.0
60.0
80.0
100.0
120.0
140.0
160.0
180.0
0.0 20.0 40.0 60.0 80.0 100.0 120.0 140.0 160.0 180.0
TEOM 24-Hour Values
eBAM 24-Hour Values
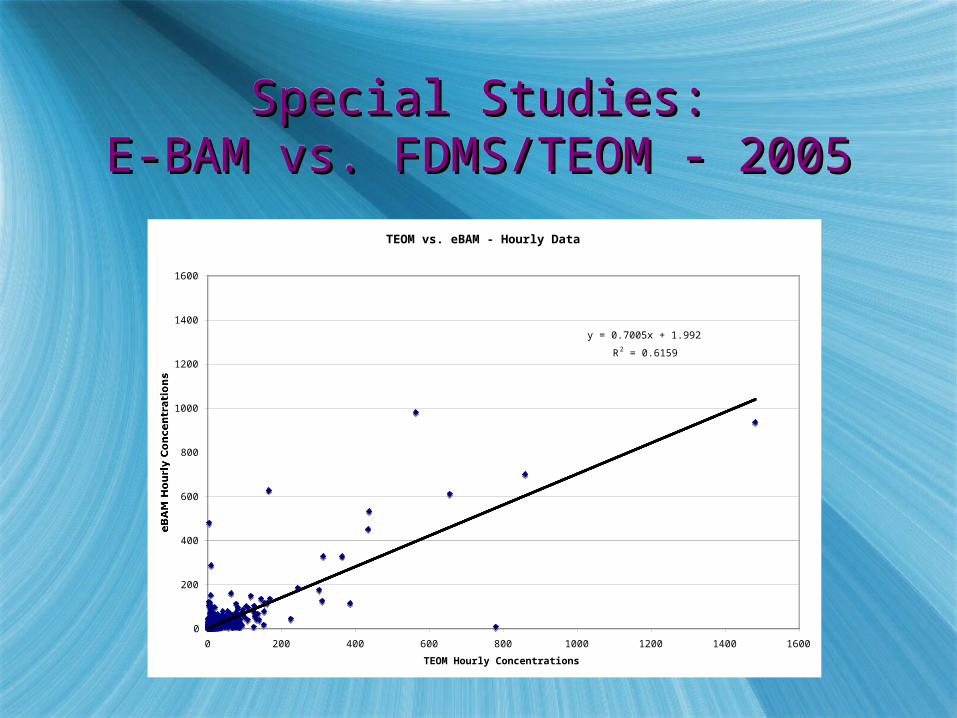
Special Studies:Special Studies:E-BAM vs. FDMS/TEOM - 2005E-BAM vs. FDMS/TEOM - 2005
Special Studies:Special Studies:E-BAM vs. FDMS/TEOM - 2005E-BAM vs. FDMS/TEOM - 2005
TEOM vs. eBAM - Hourly Data
y = 0.7005x + 1.9928
R2 = 0.6159
0
200
400
600
800
1000
1200
1400
1600
0 200 400 600 800 1000 1200 1400 1600
TEOM Hourly Concentrations
eBAM Hourly Concentrations
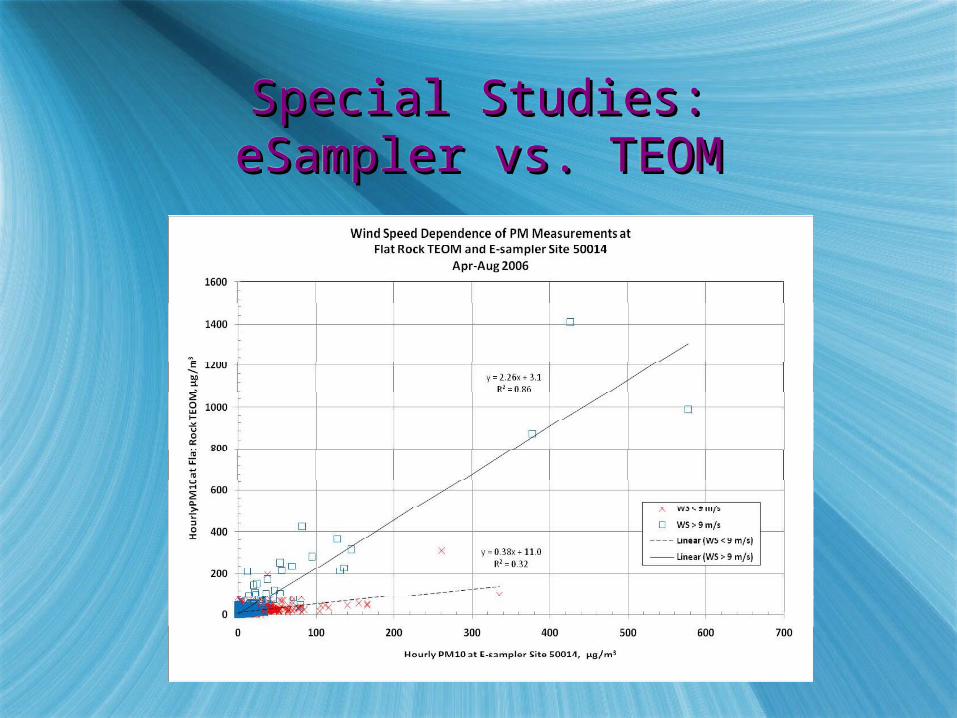
Special Studies:Special Studies:eSampler vs. TEOMeSampler vs. TEOMSpecial Studies:Special Studies:eSampler vs. TEOMeSampler vs. TEOM
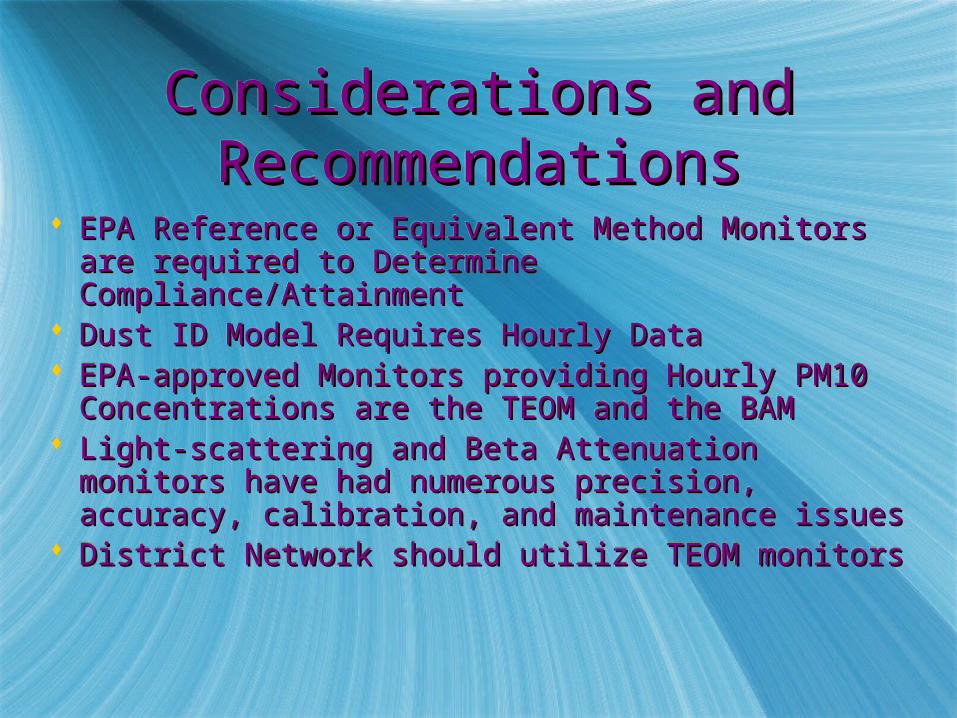
Considerations and Considerations and RecommendationsRecommendations
Considerations and Considerations and RecommendationsRecommendations
EPA Reference or Equivalent Method Monitors EPA Reference or Equivalent Method Monitors are required to Determine are required to Determine Compliance/AttainmentCompliance/Attainment
Dust ID Model Requires Hourly DataDust ID Model Requires Hourly Data EPA-approved Monitors providing Hourly PM10 EPA-approved Monitors providing Hourly PM10 Concentrations are the TEOM and the BAMConcentrations are the TEOM and the BAM
Light-scattering and Beta Attenuation Light-scattering and Beta Attenuation monitors have had numerous precision, monitors have had numerous precision, accuracy, calibration, and maintenance issuesaccuracy, calibration, and maintenance issues
District Network should utilize TEOM monitorsDistrict Network should utilize TEOM monitors