Embed Size (px)
Citation preview

ABSTRACT
PARTICULATE MATTER COMPOSITION AS A DETERMINANT OF ROS PRODUCTION IN ALVEOLAR MACROPHAGES: A
FLUORESCENCE-BASED MICROPLATE AND FLOW CYTOMETRIC BASED STUDY
Previous studies have established a link between Particulate matter (PM) exposure
and adverse health effects including pulmonary and heart disease. PM is divided into
three categories: coarse or PM10 (<10µm), fine or PM2.5 (< 2.5µm), and ultrafine (<
0.1µm) The chemical composition of PM2.5 results from a complex mixture of solid and
liquid particles: and can be highly variable depending on the time and location of a
sample collection. Redox-active components of PM2.5 such as transition metals (Cu2+ and
Fe2+) and quinones (9,10-phenanthraquinone and 1,2-naphthaquinone) are believed to
play a major role in PM2.5 toxicity, due to their ability to trigger high intracellular reactive
oxygen species (ROS) production. To better understand the relative contribution of each
PM2.5 constituent to intracellular ROS production, a fluorescence-based microplate and
flow cytometric approach were developed to determine the oxidative capabilities of each
constituent on alveolar macrophages (AM). The assays revealed a variety of findings.
ROS production induced by quinones in AM required concentrations 2-3 orders of
magnitude lower than that required to obtain a similar response with transition metals.
Upon further analysis, PM2.5 site-specific filters also revealed that Fe2+ and 9,10-PQ were
the compounds principally responsible for the majority of ROS production at each
collection site. Finally, between the two transition metals analyzed through flow
cytometry, iron produced the greater generation of ROS intracellularly.
David Flores May 2021


PARTICULATE MATTER COMPOSITION AS A DETERMINANT OF
ROS PRODUCTION IN ALVEOLAR MACROPHAGES: A
FLUORESCENCE-BASED MICROPLATE AND FLOW
CYTOMETRIC BASED STUDY
by
David Flores
A thesis
submitted in partial
fulfillment of the requirements for the degree of
Master of Science in Biology
in the College of Science and Mathematics
California State University, Fresno
May 2021

APPROVED
For the Department of Biology:
We, the undersigned, certify that the thesis of the following student meets the required standards of scholarship, format, and style of the university and the student's graduate degree program for the awarding of the master's degree. David Flores
Thesis Author
Laurent Dejean (Chair) Biology
Jason Bush Biology
Alam Hasson Chemistry
For the University Graduate Committee:
Dean, Division of Graduate Studies

AUTHORIZATION FOR REPRODUCTION
OF MASTER’S THESIS
X I grant permission for the reproduction of this thesis in part or in its
entirety without further authorization from me, on the condition that
the person or agency requesting reproduction absorbs the cost and
provides proper acknowledgment of authorship.
Permission to reproduce this thesis in part or in its entirety must be
obtained from me.
Signature of thesis author: David Flores

ACKNOWLEDGMENTS
There are many individuals that have contributed to the completion of this work.
First, I would like to thank my parents and family for always supporting me on any path I
decided to take in life, I love you guys. To Dr. Laurent Dejean, who has been my mentor
for the past three years. He has showed me not only skills needed to be a successful
scientist, but he has also taught me many skills to be successful in life. His patience and
guidance when problems arose were fundamental in my progression through this journey.
My committee members: Dr. Alam Hasson and Dr. Jason Bush have also served as
mentors and have helped me expand my knowledge in other fields of science. Their
influence on my professional career is incalculable. I would also like to thank Dr. Krish
Krishnan and Ms. Ronna Crews for their outstanding leadership and advice throughout
my graduate program as leaders of the NIH Bridges to Doctorate. In that same spirit I
thank the Bridges to Doctorate for accepting me as a member of the program, which
helps underrepresented students reach doctorate programs in STEM. The amount of
resources provided by the program allowed me to gain opportunities that I would
otherwise not have experienced, such as an internship within the UC system. To all the
members of my lab that had a hand on this project: Anthony Waterston, Kosha Raval,
and Micah Olivas thank you for helping with the completion of this project. And finally,
to the two best colleagues/confidants/and friends Devon Lee and Mandeep Kaur. They
have been the best support system anyone could ask for. Not only were they fundamental
in the completion of this project, but without them I am not sure my graduate program
would have been successful. They have given me immeasurable advice both
professionally and personally and I cannot thank them enough. And finally, to Fresno
State for being a great campus and providing me with the resources necessary to be
successful.

TABLE OF CONTENTS
Page
LIST OF TABLES ...................................................................................................... viii
LIST OF FIGURES ....................................................................................................... ix
INTRODUCTION ...........................................................................................................1
METHODS AND MATERIALS .....................................................................................9
Materials ..................................................................................................................9
Methods ................................................................................................................. 10
RESULTS AND DISCUSSION .................................................................................... 17
Dose-Response Assays as a Multi-Component Assessment of PM2.5 Toxicity ........ 17
Construction of Site-Specific Breakdown of PM2.5 Compound ROS Generation Contribution ............................................................................................... 21
Statistical Confirmation of Significance within Microplate Experiments ................ 24
Development of Flow Cytometry-based Assay to Detect ROS Generation in AM When Exposed to PM2.5 Constituents ................................................... 26
CONCLUSION ............................................................................................................. 32
REFERENCES .............................................................................................................. 36
APPENDIX: TUKEYS MULTIPLE COMPARISONS AMONG THE MEANS OF THE RANGES................................................................................................... 40

LIST OF TABLES
Page
Table 1. List of the PM2.5 filter samples collected from Claremont and Fresno .........6
Table 2. Concentration ranges used for the treatment of the cells ............................ 13
Table 3. The contribution of each component to the filter samples collected............ 23
Table 4. Linear regression statistics for the ranges of each component of PM2.5 ...... 24
Table 5. One-way ANOVA statistics for ranges of each component of PM2.5 ........... 26

LIST OF FIGURES
Page
Figure 1. Quinone redox chemistry...............................................................................3
Figure 2. Mass dependent PM2.5 filter treatments produce variable cell responses associated with ROS production ..................................................5
Figure 3. The global protocol of the microplate assay................................................ 13
Figure 4. Flow cytometry gating method .................................................................... 16
Figure 5. Cell response, (RFU) of the cells treated with the four compounds ........... 18
Figure 6. Comparisons of slopes within the orange highlighted regions from Figure 5 of the 4 testes PM2.5 components .................................................. 20
Figure 7A and 7B. Cell response to each PM2.5 component treatment from different filters collected of Claremont and Fresno regions ...................... 23
Figure 8. Iron (Fe2+) dose response in flow cytometry with DCF probe. ................... 27
Figure 9. Copper (Cu2+) dose response in flow cytometry with DCF probe. ............. 28
Figure 10. Flow cytometry treatment concentration vs. DCF mean detected for Iron treatments ............................................................................................ 29
Figure 11. Flow cytometry treatment concentration vs. DCF mean detected for Copper treatments ....................................................................................... 30

INTRODUCTION
Air pollution presents an incredibly pervasive issue to public health, particularly
in the Central Valley of California. According to State of the air report conducted by the
American lung association, the most polluted cities classified by annual particle
concentration were Fresno-Madera-Hanford, CA (reported as an aggregated group) and
Bakersfield,CA, along with other cities in the San Joaquin Valley (State of the Air 2020).
Previous studies have established a direct link between chronic particulate matter (PM)
exposure and adverse health effects such as asthma, chronic obstructive pulmonary
disease, lung cancer, heart disease, and increased mortality rates in the U.S. (Zanobetti
and Schwartz 2009). PM is classified into three main categories, coarse or PM10
(<10µm), fine or PM2.5 (< 2.5µm), and ultrafine (< 0.1µm) (Tao, Gonzalez-Flecha et al.
2003).
PM2.5 relates to a class of particulate matter 2.5 microns or less in diameter, and
refers to a complex mix of liquid and solid particles of varying composition dependent on
a multitude of factors such as combustion source, time, and location. Typically, however,
PM2.5 components include a variety of different transition metals, organic compounds,
combustion particles, and other pollution constituents (Aust, Ball et al. 2002). Among
some of the most nefarious components of PM2.5, however, are the transition metals and
organic quinones that may be responsible for the majority of PM2.5’s toxic qualities.
PM2.5 is believed to be more harmful to health compared to the larger, coarse
PM10 (Valavanidis, Fiotakis et al. 2008). PM10 due to its larger size becomes deposited
into the nasopharynx regions, where they will eventually become cleared by respiratory
defense mechanisms like nasal hairs, mucociliary clearance or swallowing (Tao,
Gonzalez-Flecha et al. 2003). The ability of PM2.5 to bypass these defenses of the
respiratory tract and penetrate deeply into the lower airways, eventually reaching the

2 2
distal ends of the alveoli where they can remain for longer periods make it especially
dangerous, particularly in high concentrations (Brauer, Avila-Casado et al. 2001,
Davidson, Phalen et al. 2005). Chronic exposure to air pollution has been linked to health
conditions such as cardiovascular disease, respiratory issues; and some studies have even
associated prolonged exposure to air pollution and the occurrence of certain types of
degenerative neurological diseases (Chen, Zhong et al. 2010).
While the exact pathophysiological mechanism behind PM2.5’s deleterious effects
on biological systems remains to be defined, it is understood that the generation of
reactive oxygen species (ROS) leads to the subsequent formation of oxidative stress, and
if occurring in severe enough quantities, can ultimately lead to cellular death and tissue
damage in mammalian cells (Sawyer, Mundandhara et al. 2009). Reactive oxygen species
are free radical structures and natural byproducts of oxidative metabolism; ROS generally
maintains a homeostatic relationship with antioxidants, however when the concentration
of ROS begins to exceed the capacity of the cell to contain and combat its formation,
oxidative damage begins to occur (Pizzino, Irrera et al. 2017).
This increase of ROS production due to exposure of PM2.5 has previously been
hypothesized to play a direct role in pulmonary inflammation and disturbing the natural
balance between antioxidants and reactive oxygen species within the lungs (Castro and
Freeman 2001, Landreman, Shafer et al. 2008). The imbalance between antioxidant and
ROS within the cell will eventually lead to oxidative stress of the cell causing DNA
damage and lipid peroxidation.
Transition metals such as iron can stimulate the production of H2O2 that can
eventually generate hydroxyl radicals through redox reactions like the Fenton reaction.
These reactions can then cause an oxidative burst within the cell that leads to oxidative
damage to macromolecules (Valavanidis, Salika et al. 2000). In a study conducted by
(Jung, Guo et al. 2006), they investigated the generation of hydroxyl ions from a few
3 3
ambient PM samples collected from Davis, CA. What they found was that transition
metals contributed to a significant portion of hydroxyl ions found in the ambient particles
(Paulson, Hasson et al. 2016). In another study conducted by (Vidrio, Phuah et al. 2009)
they also used PM2.5 particles collected in Davis, CA throughout the course of the year.
They also found that soluble Fe contributed the most to hydroxyl ions production
(Paulson, Hasson et al. 2016).
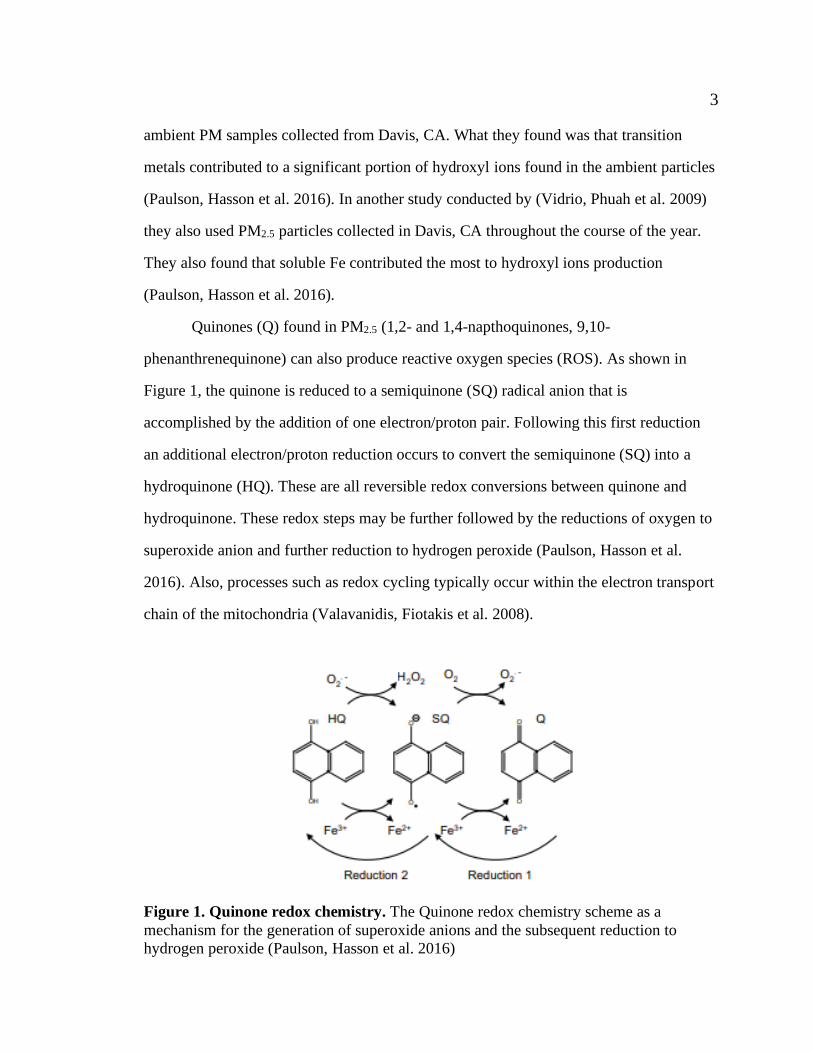
Quinones (Q) found in PM2.5 (1,2- and 1,4-napthoquinones, 9,10-
phenanthrenequinone) can also produce reactive oxygen species (ROS). As shown in
Figure 1, the quinone is reduced to a semiquinone (SQ) radical anion that is
accomplished by the addition of one electron/proton pair. Following this first reduction
an additional electron/proton reduction occurs to convert the semiquinone (SQ) into a
hydroquinone (HQ). These are all reversible redox conversions between quinone and
hydroquinone. These redox steps may be further followed by the reductions of oxygen to
superoxide anion and further reduction to hydrogen peroxide (Paulson, Hasson et al.
2016). Also, processes such as redox cycling typically occur within the electron transport
chain of the mitochondria (Valavanidis, Fiotakis et al. 2008).
Figure 1. Quinone redox chemistry. The Quinone redox chemistry scheme as a
mechanism for the generation of superoxide anions and the subsequent reduction to
hydrogen peroxide (Paulson, Hasson et al. 2016)
4 4
Mitochondria are a major source of intracellular ROS production, specifically as a
by-product of aerobic metabolism in the electron transport chain (Forman, Torres et al.
2002, Xiong, Ru et al. 2017). Recent studies suggest that exposure to different pollutants
such as PM can lead to mitochondrial dysfunction, which as a result contributes to
various health issues (Bhargava, Tamrakar et al. 2018). These pollutants may interact
directly or indirectly with the mitochondria, influencing mitochondrial ROS production
and ultimately leading to mitochondrial DNA damage. The mechanisms involved with
mitochondrial dysfunction caused by PM exposure are not yet fully understood, however
a possible mechanism is the interference of complex III in the electron transport chain by
pro-oxidative PM components such as quinones (Xia, Kovochich et al. 2007). This
mitochondrial dysregulation by exposure to PM is therefore a potential mechanism
leading to multiple human pathologies (Bhargava, Tamrakar et al. 2018).
The innate defense mechanism of the lungs responds to PM2.5 exposure by
recruiting alveolar macrophages into the lung and activating tissue resident macrophages
(Miyata, van Eeden et al. 2011). These alveolar macrophages (AM) proceed to
phagocytose the PM2.5 particles, producing ROS and therefore hydrogen peroxide as a
byproduct to clear the foreign particles from the alveolar space (Becker, Soukup et al.
1996, Goldsmith, Frevert et al. 1997, Geng, Meng et al. 2006). Due to the imperative role
of alveolar macrophages in acting as the primary defense mechanism of the lungs against
foreign pathogens, the cell line NR8383 corresponding to alveolar macrophages obtained
from rats, was chosen to act as the model organism for experimentation; the specific
ability of alveolar macrophages to withstand oxidative stress in far greater proportions
than other cells of the body, combined with the more predictable, less variable response
during ROS induction cause the line to be optimal for the assessment of ROS production
(Landreman, Shafer et al. 2008).

5 5
Previous work conducted by Landreman et. al 2008 helped establish a
fluorescence macrophage-based assay for intracellular ROS detection. Building upon the
protocol used by Landreman et al. 2008, research in our laboratory was focused on the
study of the mass dependence of PM2.5 samples collected from Fresno (Fr) and Claremont
(Cl) , CA during summer (Sum) and winter (Win) seasons on intracellular ROS
production as is shown in Figure 2. Alveolar macrophages were treated with the ambient
PM2.5 collected samples, which contained various defined quantities of PM2.5 mass shown
in Table 1.
Figure 2. Mass dependent PM2.5 filter treatments produce variable cell responses
associated with ROS production. The scatter plot represents the PM2.5 filter extracts
from both Claremont (Cl) and Fresno (Fr) collection sites during summer (Sum) and
winter (win). The filters were collected in 12 hour (12hr) and 6 hour (6hr) periods. The
data shows a variable cellular response based on the different filters which were used to
treat the AM, suggesting that PM2.5 mass is not the only variable for cytotoxicity
(Waterston 2019).

6 6
Table 1. List of the PM2.5 filter samples collected from Claremont and Fresno. The
collections took place on the rooftop sites at Harvey Mudd College, Claremont and
California State University, Fresno during summer and winter seasons. There were three
collection times a day, for approximately 6 or 12 hours. The times were from 7 AM – 1
PM, 1 PM - 7 PM, and 7 PM – 7 AM. Also shown are the PM2.5 mass loading in each of
the filters collected. (Paulson, Hasson et al. 2016) (Waterston 2019)
Filter ID Location Time PM2.5 mass
loading(μg/m3)
Cl-Sum-Ni-12hr-A Claremont Night 12.11
Cl-Sum-Ni-12hr-B Claremont Night 12.42
Cl-Sum-Ni-6hr Claremont Afternoon 14.18
Fr-Win-Ni-12-hr-A Fresno Night 15.15
Fr-Win-Ni-12-hr-B Fresno Night 24.97
Fr-Win-Ni-12-hr-C Fresno Night 15.87
Fr-Win-Ni-12-hr-D Fresno Night 17.77
Following the treatment, a comparison between Fr-Win-Ni-12hr-B and Cl-Sum-
Ni-12hr-A was made. These two samples were chosen due to the similarity in collection
time both being night and 12-hour collection times, however the Fresno sample was
during the winter and Claremont was during the summer (Waterston 2019). After
comparison of the mass-normalized cellular ROS response for both Claremont and
Fresno samples, there was a significant difference observed in the average slope of
cellular ROS response from Figure 2 between Fr-Win-Ni-12hr-B and Cl-Sum-Ni-12hr-A
which are shown in detail in (Waterston 2019). This analysis led us to suggest that the
absolute amount of PM2.5 in the sample was not the only determinant for intracellular
ROS production. It was then suggested that the chemical composition of the PM2.5 might
also be an important determinant of macrophages intracellular ROS production.
While it is generally recognized that PM2.5 induces cytotoxic responses in
mammalian cells, compound-specific studies relating individual components of PM2.5

7 7
pollution like transition metals (Cu2+ and Fe2+) and quinones (9,10-Phenanthroquinone
and 1,2-Naphthoquinone) to the formation of ROS have only briefly been investigated.
Imperative to improving our collective understanding of the stress dynamics of PM2.5
exposure is knowledge of the harmful components, and to what degree they pose threat to
cells. Therefore, a main question formulated for this work was to determine whether the
cells were triggered to generated ROS production when exposed to elements such as
transition metals (Fe2+ and Cu2+) and quinones (9,10-Phenanthroquinone and 1,2-
Naphthoquinone) that are found within the complex of PM2.5. And if these PM2.5
components are triggering the increase of ROS intracellularly, to what extent are
transition metals and quinones contributing to the overall increase of ROS intracellularly.
If transition metals (Cu2+ and Fe2+) and quinones (9,10-Phenanthroquinone and 1,2-
Naphthoquinone) are important factors in the increase of ROS intracellularly and in PM2.5
toxic effects, then we expect to see a strong correlation between these compounds present
in PM2.5 and the induced ROS response from the cells treated.
Microplate experimentation aims to provide an evaluation and multi-component
analysis of oxidative stress potentials among the primary constituents of PM2.5. This was
accomplished using a fluorescence-based approach utilizing the probe 2’,7’-
Dichlorofluorescin diacetate (DCF) to quantify the presence of ROS within cells,
producing relative fluorescent units (RFU) able to be related directly to the formation of
oxidative stress. Furthermore, by incorporating the data gleaned from previous iterations
of the study, we were able to construct balances for the site-specific samples collected.
Breakdowns of each sample filter for analysis of PM2.5’s chemical constituents’
contribution to the total fluorescent cell responses were developed. This allowed us to
gain better insight into what PM2.5 components present the most toxic combinations of
PM2.5 pollution and the extent of such. As described in paragraphs 6 and 7 of this
introduction, previous studies have observed transition metals such as iron and quinones

8 8
to be involved in the generation of ROS intracellularly. For these reasons we continued
our study, in conjunction with statistical confirmation and chemical analysis of the filter
data collected from (Paulson, Hasson et al. 2016) (Waterston 2019). This allowed for the
identification of correlations between particular concentrations of principal contributors
(Fe2+, Cu2+, 9,10-Phenanthroquinone, 1,2-Naphthoquinone), detrimental health effects,
and filter origins. With these findings, better strategies to abate pollution and combat the
adverse effects of PM2.5 exposure may be created.

METHODS AND MATERIALS
Materials
Chemicals
Cell Medium: Dulbecco’s Modified Eagle’s Medium/Ham’s Nutrient Mixture
F12 (GE Life Sciences, Lot #AC11256314), Fetal Bovine Serum (Sigma-Aldrich), 1%
Penicillin-Streptomycin (Corning, Lot # 30002298). Zymosan A from Saccharomyces
cerevisiae (Sigma-Aldrich, Lot # BCBL6140V). 2’,7’-Dichlorofluorescin diacetate
(Invitrogen, Lot #1987240). Ferrous Sulfate (FeSO4 7 H2O) (Sigma-Aldrich, Lot #
80K1350). Copper Sulfate (CuSO4) (Sigma-Aldrich, Lot # MKCB1335V). 9,10-
Phenanthroquinone (Sigma-Aldrich, Lot # MKBG9712V). 1,2-Naphthoquinone (Sigma-
Aldrich, Lot #1445576V). 1,4-Naphthoquinone (Sigma-Aldrich, Lot #BCBP9334V).
Dimethyl sulfoxide (DMSO) (Corning, Lot # 02218004). Accutase cell detachment
solution (Sigma-Aldrich). Phosphate buffer solution (Corning, Lot # 16816002). SYTOX
Blue Dead Cell Stain (Invitrogen, Lot # 1863956).
Instruments
Cell Incubator (Thermo Scientific) was used to maintain alveolar macrophages at
a constant 37°C and 5% CO2 levels. TC10 Automated Cell Counter (BioRad) was used
to check the amount present and also the viability of cultured cells before running
experiments. Synergy HT, fluorescence plate reader (Biotek) was used to determine the
levels of fluorescence present in our alveolar macrophage assay. Attune Flow Cytometry
with auto sampling of 96 well plates (Applied Biosystems) were used to run single cell
light diffusion and fluorescence measurements. Centrifuge 5810R (Eppendorf) was used
to separate our cells from cell media before the microplate assay.

10 10
Methods
Cell Culture
NR8383 cells in culture are found in both adherent and suspended sub-
populations. Cell cultures are maintained in Hams F12 medium containing 2 mM L-
glutamine supplemented with 15% heat inactivated fetal bovine serum and 1% penicillin
streptomycin per the ATCC recommendations. Cell passing occurs by transferring both
the suspended and attached cells to additional flasks. The floating population is
transferred with an automatic serological pipette by harvesting the media from the old
flask and placing it into a 50 mL centrifuge tube (Fisher scientific). This tube containing
the floating cells with the old media is spun down with Eppendorf centrifuge 5810R to
create a cell pellet (Instrument settings are 1500 RPM, 3 minutes, at 25°C). The
supernatant is discarded, and the cells are lifted with new media. The floating cells are
then transferred into a new flask that has fresh media. Adherent cells are harvested
through mechanical cell scraping. Once the attached cells have been lifted through
scrapping, they are transferred into a centrifuge tube and the process is repeated as
explained above for the floating population. Upon passaging, half of the cells in both
populations of NR8383 cells will re-attach to the flask creating a 50/50 ratio of adherent
and suspended sub-populations. The process of passing and media renewal occurs every
2 to 3 days of the week. The flask with cells is kept at 37°C in a humidified 5% CO2
incubator. An average cell concentration between 200K to 300K cells/mL of media is
maintained. NR8383 cells are harvested for experimentation by collecting both
suspended and adherent cells in the flask (Landreman, Shafer et al. 2008, Waterston
2019).

11 11
Microplate Dose-Response Assay Protocol
For the cell-based assays, both the adherent and suspended NR8383 cells are
harvested from the culture flask and centrifuged to remove the media supernatant as was
previously described. Before resuspending the cell pellet, 10X SGM (10X SGM, 500 mM
HEPES, 1M NaCl, 50 mM KCl, 20 mM CaCl2, 50mM dextrose, pH 7.2) is diluted 1:10
to produce 1X SGM with deionized water. As per Landreman et al. 2008, previous results
have shown that SGM maintained high cell viability and allows for chemical speciation
determination and accurate exposure assessment. The cell pellet is then carefully
resuspended in 4 to 5 mL of 1X Salt glucose medium. During the process of resuspending
the cell pellet, we avoid the introduction of bubbles to avoid any interference in the
measurement of cell viability with the automated cell counter. 10 µL of 0.4% Trypan
blue solution (cell stain that permeates dead cells due to compromised cell membranes) is
placed in a 96-clear well plate. 10 µL of homogenized cell suspension is gently mixed
with Trypan blue solution to a final volume of 20 µL. 10 µL of cells with trypan blue are
transferred to a cell counting chamber slide for use with the Bio-Rad TC10 Automated
Cell counter, which will discriminate between live and dead cells based on the trypan
blue detected. Experimentation only proceeds if the cell viability is greater than 85%.
Once the cells are counted, the concentration is brought to 1,000 cells/μL (1,000,000
cells/mL). 100 μL of the 1X SGM cell suspension is plated into each well as triplicates of
a 96-well microplate (100,000 cells per well), Once the last triplicate of cells is placed in
the wells, the 96-well plate is transferred to the incubator for 1-hour incubation at 37 °C.
During the incubation period, the PM2.5 component treatments are prepared between 1-10
mM of both transition metals (Cu2+, Fe2+) and 1-100 µM of the quinone samples (1,2-
and 1,4-napthoquinones, 9,10- phenanthrenequinone) as shown in Table 2. These
concentration ranges were defined based on the chemical analysis using mass
spectrometry of the PM2.5 samples used in the experiments shown in Figure 2 in

12 12
collaboration with Dr. Alam Hasson’s atmospheric chemistry lab. The concentration
ranges were also matching the ranges used in non-cellular assays to measure ROS
production from the same filter samples by Paulson, Hasson et al. 2016. Once these
ranges were determined, we chose ferrous sulfate (FeSO4) and copper sulfate (CuSO4) to
mimic the Fe2+/Fe3+ and Cu2+/Cu3+ contents that were found inside the samples. The
PM2.5 sample treatments are prepared through a 1:2 serial dilution using the Blank
solution (4 mL milliQ grade water and 10 µL 95% ethanol) as the diluent of choice. The
untreated controls, which will be the wells with only cells and DCFH-DA are prepared by
replacing the 1x SGM with the blank filter extraction. The positive control used is
Zymosan A from Saccharomyces cerevisiae, which generates an inflammatory response
by inducing a NOX-mediated increase of intracellular ROS and serves as a positive ROS
production in AM (Landreman, Shafer et al. 2008). The treatment with Zymosan ranges
from 2.5 µg to 12.5 µg per treatment. DCFH-DA will be the fluorescent probe used for
the macrophage-based assay. This probe is the most widely used technique to measure
the redox state of the cell. DCFH-DA permeates the cell, where it will be cleaved by
esterases becoming a non-fluorescent H2DCF. This molecule will accumulate in the cell
until subsequent oxidation which will ultimately produce the highly fluorescent DCF that
is proportional to the concentration of hydrogen peroxide in the cell. 5 to 10 minutes
before the incubation period is over the prepared treatments are supplemented with
DCFH-DA at a stock concentration of 15 μM. The stock solution is diluted with
deionized water to a working concentration of 1.5 μM. After the incubation period, the
1X SGM in the wells of the microplate is removed and replaced with 100 μL of cell
treatment. The fluorescence intensity in each well is determined (excitation: 450 ± 50 nm;
emission: 530 ± 25 nm) after a treatment time of one hour using a Synergy HT automated
fluorescence plate (Landreman, Shafer et al. 2008, Waterston 2016, Waterston 2019).
The global procedure is summarized in Figure 3.

13 13
Table 2. Concentration ranges used for the treatment of the cells. These are the
concentration ranges that were used for all the PM2.5 constituents in both the dose-
response microplate and flow cytometry assays and match the ranges used by (Paulson,
Hasson et al. 2016).
Item: Ferrous/Ferric
(Fe2+/Fe3+)
Cuprous/Cupric
(Cu+/Cu2+)
9,10 Phenanthrequinone
(PQ)
1,2 Napthoquinone
(NQ)
Atmospheric Ranges: Lower Bound (ng/mL) 39 39 0.0313 0.0625
Upper Bound (ng/mL) 156 156 1.00 1.00
Figure 3. The global protocol of the microplate assay. The initial two steps were
conducted by previous lab member Anthony Waterston, in collaboration with Dr. Alam
Hasson’s atmospheric chemistry lab (Waterston 2016). The microplate dose-response
assay was used to observe the effects of PM2.5 components on the generation of reactive
oxygen species intracellularly in alveolar macrophages. From the results of the
microplate assay, we calculated the contribution of each PM2.5 component to the overall
reactive oxygen species generation intracellular.

14 14
Statistics Analysis of Microplate Results and Relation to Filter Origins
To both establish a quantitative, definable relationship between increasing
concentrations of each constituent compound and DCF fluorescence, as well as confirm
the statistical significance of the data, linear regression analysis and an analysis of
variance (ANOVA) were performed. The statistical analysis was also performed to
determine if the data is significantly different from each other. This relationship was
identified using linear regression analysis. The goal of using this analysis method was to
adjust the model’s parameters to find the curve that fits the data obtained. The linear
regression statistics obtained the goodness of the fit between compound concentration
and DCF fluorescence, as well as assessing the degree to which each compound’s
response was or was not significantly different from zero. Following the discovery, or
lack thereof, of each compound’s relationship with ROS generation, an additional
assessment of significance regarding the attribution of differing ROS (RFU) values to
varying treatments was performed through a one-way analysis of variance (ANOVA)
test.
Prior to conduction of the ANOVA however, it was necessary to confirm that the
relevant data satisfied the statistical assumptions of the ANOVA. Brown-Forsythe tests
were thus administered to each data set to verify that the standard deviations within each
were not too significantly different (p < .05).
Flow Cytometry Assay
Immediately following the 1-hour incubation period with the representative PM2.5
constituents (1,2- and 1,4-naphthoquinones, 9,10- phenanthrenequinone, Cu2+, Fe2+) and
DCFH-DA as described in the microplate dose-response assay protocol section in
methods, Sytox blue is added to each of the wells before analyzing cell responses through
flow cytometry. Sytox blue has a final concentration of 1 µM for the assay. Sytox Blue is

15 15
a simple dead cell stain that penetrates compromised cell membranes and binds nucleic
acids (ThermoFisher, 2005). The incubation period for Sytox Blue is 5 minutes at room
temperature protected from light. After the incubation with Sytox blue, 100 µL of
Accutase is added to the wells and incubated for 5 minutes in concurrence with Sytox
blue incubation. Accutase (Dulbecco′s PBS containing 0.5 mM EDTA•4Na and 3 mg/L
Phenol Red) (Thermofisher, 2005) is a cell detachment solution utilized for dissociating
clumped cells suspension cultures and detaching the cells from the bottom of the wells.
After the 5-minute incubation at room temperature with accutase, the cells are transferred
into 1.5 mL Eppendorf tubes and read through the flow cytometer in tube mode. Flow
cytometry measurements are reported as mean fluorescence intensity.
Initial steps of flow cytometry require a gating scheme to distinguish cells of
interest in either heterogenous or homogenous populations. The gating scheme utilized is
shown in Figure 4. Forward and side scatter give an estimation of the size and granularity
of the cells respectively, although this can depend on several factors such as the sample;
the wavelength of the laser; the refractive index of the sample; and the sheath fluid. As
shown in Figure 4a, the first graph labeled All events contain the parameters of side
scatter (SSC) and forward scatter (FSC), which differentiate between cellular and non-
cellular debris. The first gate labeled R1 is concentrated within the dense population of
cells near the bottom/left most corner of the graph. Cells not within this first gate are
considered debris within our analysis. Following the initial graph, the next graph (Fig.4B)
labeled R1 parent graph contains the parameters of forward scatter-height (FSC-H) vs
forward scatter-width (FSC-W) and contains the second gate labeled R2 (Singlets). This
graph allows for the exclusion of doublets, which can mislead analysis and could lead to
inaccurate conclusions. The third graph (Fig.4C) labeled R2 has the parameters of FSC-A
vs Sytox Blue. This graph allows us to separate between our live and dead cell
populations, since SB is a live/dead cell indicator. As seen in Figure 4C, the two gates

16 16
utilized were the live and dead cell gates. The final graph is labeled (live cells) and has
FCS-A vs DCF as the parameters. This allowed us to measure the amount of ROS being
produced in the AM exposed to the isolated PM2.5 compounds though relative
fluorescence detected. The graph is split into four quadrants (R9, R10, R11, R12).
Quadrants R11 and R12 are of interest, as they measure the shift in DCF detection
directly correlated to the amount of ROS produced within the cells being exposed to
PM2.5 isolated compounds.
Figure 4. Flow cytometry gating method. Fig. 4a labeled All events is utilized to gate
the cells of interest (R1), which will be our Alveolar macrophages. Fig.4b are all the cells
within gate R1 of the previous graph, and they are further gated based on the two
parameters used (FSC-H vs. FSC-W) which will allow differentiation of doublets and
singlets. Fig.4c shows the separation of live and dead cell population based on the
amount of Sytox blue detected by the flow cytometer. Fig. 4d shows the amount of DCF
detected within the live cell population of our Alveolar macrophages. Cells detected
within the R12 quadrant in 4d are considered to be in oxidative stress state.

RESULTS AND DISCUSSION
Dose-Response Assays as a Multi-Component Assessment of PM2.5 Toxicity
Iron (Fe2+) and copper (Cu2+) were previously detected on PM2.5 filters collected
by (Waterston 2019) in the areas of Fresno and Claremont, CA. These two were the most
abundant metals on the filters and were selected due to their high redox activity in
chemical assays (Paulson, Hasson et al. 2016). These two metals ions were used to
identify relationships between the presence of transition metal in atmospheric pollution
and their potential generation of oxidative stress in alveolar macrophages. Microplate
experimentation measuring the degree of oxidative stress and the incorporation of dose-
response assays allowed for the identification of any existing correlation.
Figure 5 represents the dose-response graphs generated from exposing
independent alveolar macrophages sample populations to increasing concentrations of
each compound of interest. Most notably, the sections highlighted in orange represent the
regions of the assay found to match the ranges used by Paulson, Hasson et al. 2016 in
their non-cellular assays (DTT and surrogate lung fluid assays) from filter samples
collected. The results garnered strongly indicated stark contrasts in the relative ability to
generate ROS, or slopes, between each compound in their respective ranges shown in
Table 2, 1-10 mM of both transition metals (Cu2+, Fe2+ ) and 1-100 µM of the quinone
samples (1,2-naphthoquinone and 9,10- phenanthrenequinone).To gauge the relative
ROS-generating capabilities of each compound, a slope of concentration of compound
versus RFU generated was calculated for each and used to compare the toxicity of each
compared with one another. As shown in Figure 6, by comparing the slopes of both
transition metals we see a large variability in the cell response measured by the DCF
probe. The DCF probe measures the amount of H2O2 and oxidative stress intracellularly,

18 18
which is shown on the y-axis total cell response, relative fluorescence unit detected / ng
of each compound tested.
Figure 5. Cell response, (RFU) of the cells treated with the four compounds. Shown
in the y-axis is the total cell response (DCF) fluorescence in samples containing alveolar
macrophages each in RFU (+-Standard Deviation) of the respective four compounds used
to execute the scope of the study. Highlighted in orange are the regions of the assay
considered to comprise the concentration ranges from Paulson, Hasson et al. 2016 (1-10
mM of Cu2+, Fe2+ and 1-100 µM of 1,2-naphthoquinone and 9,10- phenanthrenequinone)
of each compound found in PM2.5 samples (n=3) as shown in Table 2. X-axis represented
in logarithmic scale.
Analysis of dose-response experiments revealed that all compounds were capable
of inducing ROS generation in a dose-dependent manner to some degree but varied in
intensity. For instance, Ferrous sulfate (Fe2+) was observed to possess a strong, positive
correlation with ROS production, estimated by a heightened cell response in RFU, in
increasing doses, evidenced by the comparatively greater slope than copper sulfate. This
19 19
large imbalance is even further observed by the low presence of Cu2+ in the site-specific
RFU contribution as shown in Figure 7.
In experiments conducted by Figliuzzi, Tironi et al. 2020, they tested cell toxicity
of PM produced from different brake pads which contained different concentrations of
Cu (0.018– 69.9µg/mL). In their experiments, they estimated cell toxicity through the
production of ROS through the DCF assay. What they reported was that copper increased
ROS production in a dose-dependent manner in A549 cells (human lung cells) (Figliuzzi,
Tironi et al. 2020). These results are similar to what is observed in Figure 5, where there
is dose-dependent ROS increase when the cells when treated with copper, however in this
present study iron has the strongest correlation to ROS increase compared to copper.
In a non-cellular dithiothreitol (DTT) assay, conducted by Charrier, Anastasio et
al. 2012, they measured the oxidative capacity of PM components by quantifying the rate
of loss of DTT. They observed that Cu (II) was the most reactive of the metals tested to
oxidize DTT, and that Fe (II) and Fe (III) were slow in oxidizing the DTT however due to
the relative abundance of iron in the atmosphere, it still produced an important DTT loss
(Charrier, Anastasio et al. 2012). Although the DTT assay is a chemical assay, it can be
used to infer the biological impacts that these transition metals have on live cells.
However, from the results obtained from our cellular dose-response assay shown in
Figure 5 and Figure 6 iron seems to have the biggest redox effect and increase ROS
intracellularly stronger than copper in alveolar macrophages.
These results are also consistent with previous studies conducted by Zhang,
Schauer et al. 2008 where they associated particulate matter sources with in vitro ROS
activities through a multivariate factor analysis source apportionment model. They
concluded that iron sources had the largest coefficients within their model, which
correlated to being the most active source for PM-associated ROS production (Zhang,
Schauer et al. 2008).
20 20
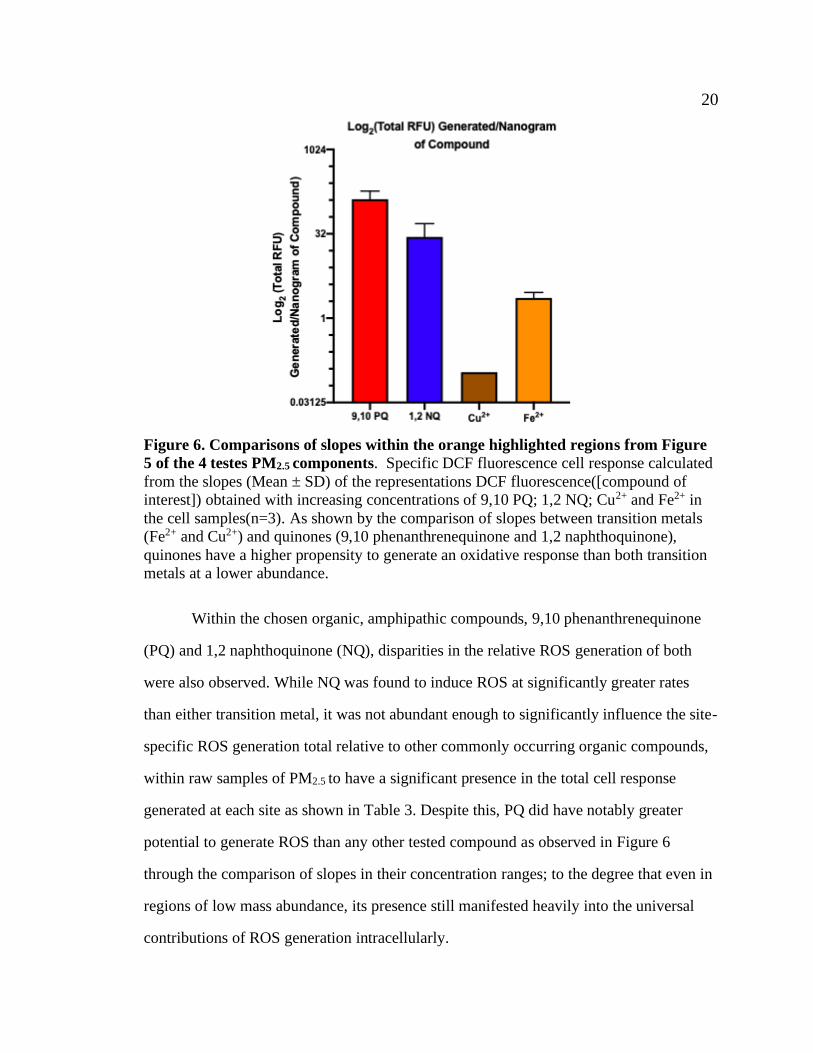
Figure 6. Comparisons of slopes within the orange highlighted regions from Figure
5 of the 4 testes PM2.5 components. Specific DCF fluorescence cell response calculated
from the slopes (Mean ± SD) of the representations DCF fluorescence([compound of
interest]) obtained with increasing concentrations of 9,10 PQ; 1,2 NQ; Cu2+ and Fe2+ in
the cell samples(n=3). As shown by the comparison of slopes between transition metals
(Fe2+ and Cu2+) and quinones (9,10 phenanthrenequinone and 1,2 naphthoquinone),
quinones have a higher propensity to generate an oxidative response than both transition
metals at a lower abundance.
Within the chosen organic, amphipathic compounds, 9,10 phenanthrenequinone
(PQ) and 1,2 naphthoquinone (NQ), disparities in the relative ROS generation of both
were also observed. While NQ was found to induce ROS at significantly greater rates
than either transition metal, it was not abundant enough to significantly influence the site-
specific ROS generation total relative to other commonly occurring organic compounds,
within raw samples of PM2.5 to have a significant presence in the total cell response
generated at each site as shown in Table 3. Despite this, PQ did have notably greater
potential to generate ROS than any other tested compound as observed in Figure 6
through the comparison of slopes in their concentration ranges; to the degree that even in
regions of low mass abundance, its presence still manifested heavily into the universal
contributions of ROS generation intracellularly.
21 21
The disparity in cell responses between each of the four compounds strongly
indicates significant differences in PM2.5 constituent compounds ROS-generating
capabilities. The contrast between compounds belonging to the transition metal class and
organic, quinone class are hypothesized to be largely attributable to the amphipathic
qualities of the organic compounds, more specifically their ability to permeate both the
cellular membrane and mitochondrial membrane (Fato, Bergamini et al. 2008). As
previously explained, the ROS generating nature of the quinones is largely caused by
both their ability to partake in redox cycles when present in aqueous environments, as
well as disrupt respiration at the mitochondrial level, a quality not afforded to the metals
due to their relatively larger size, and inability to permeate membranes but rather
requirement of traveling through ion channels.
Construction of Site-Specific Breakdown of PM2.5 Compound ROS Generation Contribution
Following the results from the microplate dose-response assay, we further
dissected the contribution of each compound to the total cell response, RFU generated
from filter samples collected at both collection sites of Fresno and Claremont, California
(there was 5 filters for Fresno and 5 filters for Claremont) by constructing balances
shown in Table 3. By calculating the amount of cell response, RFU contributed by each
compound to the total cell response, RFU generated by the PM2.5 filters we were able to
assign the percent contribution of ROS generation to each compound of the PM2.5 filters
examined. These calculations allowed for a better understanding of which compounds are
contributing most to the generation of ROS intracellularly.
Using previous microplate data that was focused on mass dependence of PM2.5
samples, obtained from previous studies conducted by former lab member Anthony
Waterston in collaboration with Dr. Alam Hasson, specifically assays where extracts
from raw, unanalyzed filter samples were exposed to cell populations, balances of each

22 22
site’s total cell response, RFU were constructed with a compound-specific breakdown
listing each compound of interests’ contribution to the response. To obtain these values,
the slope (cell response, RFU generated / ng of constituent compound) value for each
compound was used in conjunction with its site-specific concentration to measure the
proportion of the total ROS generated by each. As shown in Figure 7A and 7B, the
breakdown of each site is displayed detailing the proportional contribution of each
constituent compound, as well as the background cell response, RFU.
The background refers to a cellular ROS response over baseline from a chemical
species that was not identified from our analysis and cannot be explained by the
contribution of Cu, Fe, 9,10-PQ or 1,2-NQ. These background cell responses could be a
result of other influential redox active components of PM that were not measured through
chemical analysis. This background cell ROS response could also imply that two or more
components within PM’s composition could behave either synergistically or
antagonistically. In a study by Wei, Yu et al. 2018, they studied the complexation of iron
and copper with other compounds such as hydrophobic/hydrophilic organics and its
effect on the oxidative potential of PM2.5 (Wei, Yu et al. 2018). They observed that iron
complexed with Suwanee river fulvic acid showed a strong synergistic effect on the
production of hydroxy radical in surrogate lung fluid (Wei, Yu et al. 2018). These
observations suggest that these complexes may alter the redox potential of PM2.5
components and effect their ability to increase ROS.
These balances, expressed in both absolute totals and percentages, represented the
largest contributors to the generation of oxidative stress at each site, reaffirming the
observation that Iron and 9,10 PQ were the primary culprits in triggering intracellular
ROS formation in alveolar macrophages.

23 23
Table 3. The contribution of each component to the filter samples collected. The
table provides the specific contribution of each compound’s ROS generation (measured
in DCF, RFU) to each collection site chosen in the study for the 10 filters from both
Claremont and Fresno, California. Filter
Sample:
RFU
Ratio:
Fe2+
Contribution:
Cu2+
Contribution:
9,10-PQ
Contribution:
1,2-NQ
Contribution: Background:
C10 11.5 6.27 0.091 0 0.123 5.02
54.49% 0.79% 0.00% 1.07% 43.65%
C12 27.2 4.22 0.14 0.00 0.15 22.69
15.52% 0.51% 0.00% 0.54% 83.43%
C24 15.3
7.94 0.34 5.97 0.09 0.96
51.89% 2.24% 38.99% 0.57% 6.30%
C41 16.2
6.95 0.090 3.56 0.166 5.43
42.90% 0.56% 21.99% 1.02% 33.53%
F6 19.8
0 0.312 0.685 0 18.8
0.00% 1.61% 3.46% 0.00% 94.93%
F15 14.2
6.33 0.14 5.70 0.00 2.03
44.58% 0.96% 40.15% 0.00% 14.31%
F40 20.5
15.96 2.02 0 0 2.52
77.86% 9.85% 0.00% 0.00% 12.29%
F46 16.7
11.59 0.61 3.45 0.00 1.06
69.37% 3.64% 20.64% 0.00% 6.34%
Figure 7A and 7B. Cell response to each PM2.5 component treatment from different
filters collected of Claremont and Fresno regions. On the y-axis is the total cell
response (ROS generation), RFU generated at each site, separated according to individual
compound contributions. As pictured, Iron (Fe2+) represents the largest contribution to
the total ROS generated in each of the PM2.5 filters. Data present in Figure 7B instead
represented as percentages of a whole rather than absolute total. Observed again, 9,10 PQ
and Iron (Fe2+) comprising most of the cell response (ROS produced), RFU generated in
the PM2.5 filters collected.

24 24
Statistical Confirmation of Significance within Microplate Experiments
As previously mentioned, linear regression of each compound’s respective dose-
response curves were generated to gauge the degree of correlation between each
compound’s cell response which are shown in Table 4. To confirm the significance of
each compound, a multiple comparisons test of coefficient of determination values (R2)
belonging to each compound’s experiment (n=3) was additionally performed using a
Fischer’s R to Z transformation. The p-value in Table 4 corresponds to the linear fit of
the data; in this case is a measure of the probability of the regression coefficient being 0.
Therefore, considering copper and 1,2-Napthoquinone variable response, we see that the
p-value far exceeds our selected alpha (a < .05). The R2 in Table 4 indicates the strength
of fit, or how well our chosen model fits the data. We see that the relatively high R2 for
iron and 9,10-phenanthrequinone, in conjunction with the significant p-value indicate
both a well fitting linear model along with a low probability that the regression
coefficient (R2) is zero.
Table 4. Linear regression statistics for the ranges of each component of PM2.5. The
table provides a breakdown of relevant linear regression statistics obtained from analysis
of the concentration ranges for each component of PM2.5 tested. It shows the two
significant p-values calculated were Fe2+ and 9,10-phenanthraquinone.
Item:
Ferrous Sulfate
(Fe2+)
Copper Sulfate
(Cu2+)
9,10
Phenanthrequinone
(PQ)
1,2
Napthoquinone
(NQ)
Goodness of Fit:
R. Square 0.9988 0.3821 0.8292 0.4988
Sum of Squares 20.89 69.93 60.45 98.68
Sy.x 5.415 2.362 3.239 3.564
Regression Statistics:
F 589.7 4.281 17.73 2.496
DFn, DFd 1, 7 1, 16 1, 16 1, 13
P value <0.0001 0.0551 0.0007 0.1381 Deviation from zero? Significant
Not Significant Significant Not Significant

25 25
Following this, to confirm that a significant difference exists between each
treatment concentration of interest within our data set and controls, ANOVA tests were
performed for each curve as shown in Table 5. Treatment populations were compared
against a blank control within the ANOVA series. This was done to ensure that
detectable, significant differences existed between treatment and control groups. The p-
value for the ANOVA indicates whether the means of each population are in fact
identical or not. Considering we see that all of the p-values fell well within our allotted
range, we can conclude that there was a significant degree of difference between all of
the population means; this suggest that our treatments are indeed successful in producing
a statistical significant effect. The ANOVA was also performed as a verification of our
treatments and experimental methodology causing discernible change. To satisfy the
assumptions of the ANOVA however, a confirmation of normality of data and a Brown-
Forsythe test of standard deviations were additionally run to ensure that the prerequisites
of the ANOVA test were met. The analysis of variance revealed strong significance
amongst each data set, indicating that treatments provided a profound effect on the cell’s
inflammatory response. To expand on this ANOVA test, an additional Tukey’s multiple
comparisons test was also performed amongst all the means present in the relevant
ranges. This data is found in the appendix.
All statistical tests applied revealed strong levels of significance in the data set
when compared with zymosan and untreated controls, with stark deviations additionally
being found between the coefficients of determination for each dose-response curve and
large variation within the slopes for each compound.

26 26
Table 5. One-way ANOVA statistics for ranges of each component of PM2.5. Table
detailing relevant one-way ANOVA analysis statistics, and requisite Brown-Forsythe
results. Brown-Forsythe tests were performed to ensure that population variance values
fell were identical to satisfy assumptions of the ANOVA test.
Item:
Ferrous
Sulfate (Fe2+)
Copper
Sulfate
(Cu2+)
9,10
Phenanthrequinone
(PQ)
1,2
Napthoquinone
(NQ)
ANOVA Results:
F 401.7 221.3 17.5 15.93
P value <0.0001 <0.0001 <0.0001 <0.0001 Significant diff. among means (P < 0.05)? Yes Yes Yes Yes
R square 0.9934 0.9881 0.8824 0.8763
Brown-Forsythe Results:
F (DFn, DFd) 0.5684 (3, 8) 1.000 (3, 8) 0.1406 (8, 18) 0.5476 (6, 14)
P value 0.6512 0.4411 0.996 0.7641
P value summary ns ns ns ns Are SDs significantly different (P < 0.05)? No No No No
Development of Flow Cytometry-based Assay to Detect ROS Generation in AM When Exposed to PM2.5
Constituents
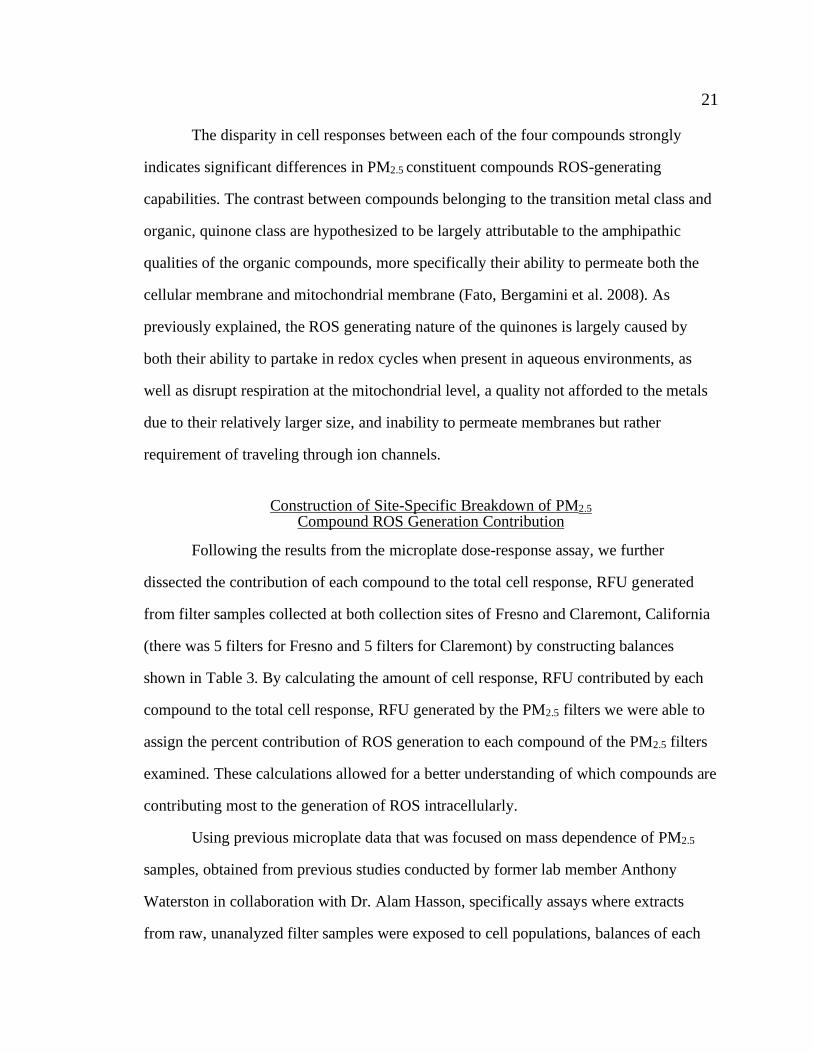
PM2.5 induced ROS generation in alveolar macrophages was measured by
observing the magnitude of difference among fluorescent (gate R11) and non-fluorescent
(gate R12) population means along the DCF-A detection scale (x-axis shown in Figures 8
and 9). As a result of the positive shift along the x-axis proceeding the production of
ROS, the magnitude of the distance along this axis between both populations serves as an
indicator of the degree of ROS production generated from each treatment. Shown in
Figure 8, a positive trend in shift magnitude is displayed amongst increasing
concentrations of Iron 39-156 ng/mL. This is additionally supported by the increase in
shift between control populations and the treatment populations, suggesting that a
positive correlation between treatment concentration and ROS generation exists. In
contrast, we see less definable, more ambiguous trends in the copper treatments already
stated to have low positive correlation with RFU generation, as is shown by Figure 9.
27 27
Figure 8. Iron (Fe2+) dose response in flow cytometry with DCF probe. The graphs
from left to right show an increasing shift on the x-axis labeled as DCF-A as there is an
increase in treatment concentration. The same increasing trend is observed with the
controls (CP vs. Z50 vs. Z100). Iron showed the greatest DCF mean shift on the X-axis
as the concentration increased shown in Figure 10.

28 28
Figure 9. Copper (Cu2+) dose response in flow cytometry with DCF probe. The three
concentrations of copper that were used to treat the cells (39,78, 156 ng/mL) showed no
significant shift within the x-axis representing the DCF detected within the cell.
29 29
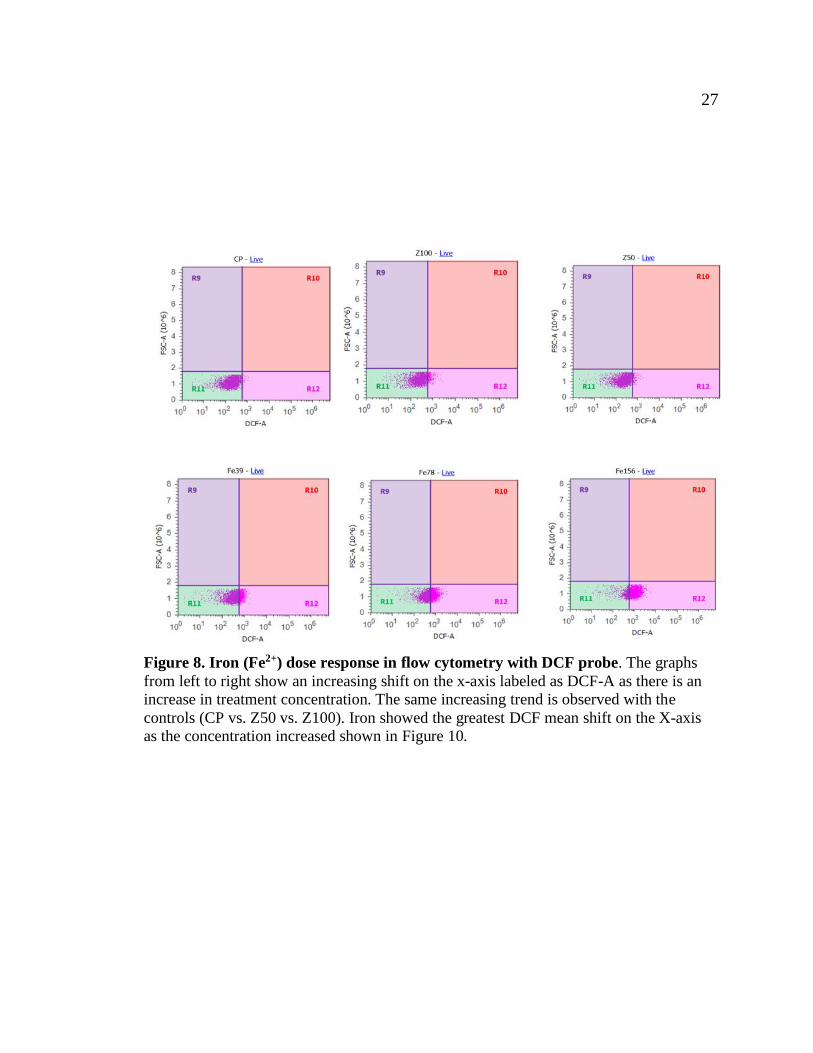
To demonstrate flow cytometry as a validation technique and reaffirm
relationships determined in microplate experimentation, Figures 10 and 11 show a trend
of DCF mean shift between both copper and Iron within their respective relevant
concentrations. Similarly, to the microplate results, Iron displays a clear, positive
correlation with RFU generation and subsequent DCF mean shift, whereas copper and its
weak correlation are unable to replicate or produce results similar to that of iron.
CP
Z100
ug/mL
Z50 u
g/mL
Fe 15
6 ng/m
L
Fe 78
ng/m
L
Fe 39
ng/m
L
0
500
1000
1500
DC
F-A
mean
Treatment concentration vs DCF mean
Figure 10. Flow cytometry treatment concentration vs. DCF mean detected for Iron
treatments. Shows the iron treatments having a positive trend in DCF detection between
the three concentrations (39,78, 156 ng/mL) and the control treatments. Fe 156 ng/mL is
observed to have the biggest impact on ROS increase based on the amount of DCF that is
being detected by the flow cytometer. Iron was observed to possess a clear, definitive
relationship between shift on the x-axis of Figure 8 and increasing concentrations.

30 30
CP
Z100
ug/mL
Z50 u
g/mL
Cu 1
56 n
g/mL
Cu 7
8 ng/m
L
Cu 3
9 ng/m
L
0
200
400
600
800
DC
F-A
mean
Treatment concentration vs DCF mean
Figure 11. Flow cytometry treatment concentration vs. DCF mean detected for
Copper treatments. Shows the copper treatments having a no substantial effect on the
amount of detected DCF mean through the increase of concentrations. The zymosan
positive controls are observed to produce the highest amount of DCF mean detection. The
copper treatments had a very similar level of DCF detection to the cells that were only
treated with DCF and Sytox blue probes. Copper was shown to possess a negligible effect
on cell response, RFU. This relationship is much consistent with previous microplate data
implying a weak or insignificant relationship with the effects of copper on ROS
generation.
Flow cytometry allows us to incorporate sytox blue into the assay for reliable
separation between oxidatively stressed and non-stressed cells (both categories being live
cells) from dead cells as shown by Figure 4. The sytox blue is able to permeate through
dead cells due to the cell membrane being compromised, on the other with live cell
membranes it is unable to permeate the cell. The ability of sytox blue to distinguish
between dead and live cells while detecting ROS generation produced via DCF, gives an
additional parameter to analyze the effects of oxidative damage produced by the PM2.5
constituents that can potentially lead to cell death in AM.

31 31
We can observe from Figures 10 and 11 that iron seems to have the biggest effect
on DCF detection compared to the copper effect. This is observation is similar to what we
observed for our microplate experiments. However it is opposite of what is reported in in
vitro assays such as the DTT assay. From this we observe that iron produced the highest
cell response associated with ROS generation through the measurement of DCF
intracellularly through both flow cytometry and microplate assay. This is contrary to
what is observed in the literature. In a study conducted by Charrier, McFall et al. 2014
they ran a cell-free surrogate lung fluid to quantify the formation of hydrogen peroxide
from different transition metals. They observed that copper produced the most hydrogen
peroxide from ambient PM and that iron suppresses hydrogen peroxide formation in
chemical solutions (Charrier, McFall et al. 2014). These results help provide a better
understanding of how these components are affecting the increase of intracellular ROS.
As was previously discussed in the introduction of this writing, Iron is hypothesized to be
a significant contributor to ROS generation through redox reactions such as the Fenton
reaction. This capability of iron to produce the response observed in alveolar
macrophages make it necessary to continue the study of iron contribution to ROS
generation intracellularly and localize where these reactions are taking place inside the
cell.

CONCLUSION
A macrophage-based ROS detection assay has been established in this study to
evaluate the potential of intracellular ROS production by PM2.5 constituents: 1,2-
naphthoquinone, 9,10- phenanthrenequinone, Cu2+ and Fe2+. The multi-component
analysis of the oxidative effects of PM2.5 constituents on alveolar macrophages revealed a
variety of findings related to the contribution of each component of PM2.5 to the cell
response, RFU and thus generation of intracellular ROS. Previous studies conducted by
former members of our research group determined that intracellular PM2.5- associated
ROS generation was not strictly dependent on mass exposure but could be more directly
correlated to the composition of the PM2.5 particles.
Expanding upon these initial findings, this study aimed to provide a clearer
understanding of the influence of PM2.5 composition on the overall propensity of AM to
generate ROS. Microplate experimentation revealed that composition was indeed a
significant factor in cell response (ROS generation), RFU and specifically identified the
compounds chiefly responsible. Both in regard to relative abundance and also ROS
generation potential, the compounds capable of producing the greatest responses were
iron and 9,10 PQ.
As reactive oxygen species are primarily responsible for the oxidative stress in
cells and tissues, both the microplate dose-response assay coupled with flow cytometry
were tailored to determine the ROS-generating capabilities of PM2.5 constituents, while
also monitoring the health of cells during the assay. These assays were ultimately
successful in allowing the identification of some primary contributors to the oxidative
stress observed in our alveolar macrophages. These assays also allowed us to narrow
down the possibility that iron and copper induced ROS generation is only due to the
potential cytotoxic effects of the treatments themselves.

33 33
The microplate dose-response assay found that quinones had a greater ability to
generate ROS intracellularly compared to transition metals. The quinones also showed
this oxidative potential at a much lower concentration range than both Fe2+ and Cu2+ as
was shown in Figure 6. Quinones have two ketone groups, which allow them to become
biologically active (Yang, Ahmed et al. 2018). 9,10-PQ was found to produce the highest
amount of ROS generated/ ng of compound compared to all other PM2.5 constituents
tested in this study. 9,10-PQ being a redox active quinone has been shown to generate
ROS through redox cycling leading to excessive ROS levels intracellularly and
eventually oxidative damage (Yang, Ahmed et al. 2018).
Further analysis of the PM2.5 site-specific filters revealed that Fe2+ and 9,10-PQ
were the compounds principally responsible for the majority of ROS production at each
collection site as shown in Figure 7. Table 3 shows the remarkably higher environmental
concentrations of each compound and their relatively higher toxicity, the two exhibited
the greatest capacity to generate ROS, especially when compared to their significantly
fewer toxic counterparts Cu2+ and 1,2-NQ.
In a study conducted by Xiong, Yu et al. 2017 using the DTT assay as a method
to measure the rate of ROS production, they found that Cu at a concentration of 2 μM
was the most important metal in DTT consumption (which correlates to higher oxidative
potential), however most of the DTT oxidation did not lead to ROS generation (Xiong,
Yu et al. 2017). Another finding from their study was that iron was inactive in the DTT
assay, however it contributed to the production of hydroxyl radical when in the presence
of other PM components such as quinones, highlighting the potential synergistic ability
of some transition metals to increase ROS (Xiong, Yu et al. 2017). These synergistic or
antagonistic interactions between PM components to potentially increase ROS
intracellularly could explain why copper is observed to be the highest contributor to

34 34
oxidative potential in cell-free assays but have limited contribution in ROS increase with
in vivo assays as was observed in our study.
Coupled with the microplate dose-response assay, flow cytometry served as a
validation for the ROS generation divergence between the copper and iron. Iron was
demonstrably higher in producing oxidative stress within the alveolar macrophages
compared to copper. The flow cytometry assay was successful in scrupulously identifying
cell death real time through detection of SYTOXTM Blue and monitoring health of cells.
The successful ability of flow cytometry to perform a multi-fluorescent probe assay for
ROS and cell death detection illustrates an effective, accurate method of assessing the
degree of ROS generation of air pollution relative to the location of collection.
The assays performed in this study were ultimately revealed to be effective modes
of gauging ROS at a compound-specific level, asserted by both the low levels of
experimental variance and ability to replicate results in a precise manner, the
fluorescence-based approach of gauging oxidative stress was observed to be an
appropriate simulation of cells in vivo.
Some of the limitations of this approach were revealed later in the conduction of
the experiments; many times, throughout the duration of the project experimentation was
delayed due to a variety of problems. Most notably, although alveolar macrophages
represent some of the most resilient cell lines, issues of viability were still often
encountered. To perform these experiments in optimal conditions, cell viability is ideally
above 97%. While cultures were relatively easy to maintain and growth was on occasion
too rapid, ensuring this viability threshold was met prior to experimentation many times
was a challenge.
Future aims of the study involve the identification of subcellular origins of ROS
within the cell. Spoken about previously, there are many hypotheses regarding the
mechanisms and locations of origin for stress signals at the intracellular level, but further

35 35
studies must be conducted to precisely identify them. The prevailing theory of iron-
mediated ROS inception states that Fenton reactions, occurring in the cytosol of the cell,
react iron cations with hydrogen peroxide (H2O2), producing the harmful free radicals as
a byproduct in addition to oxidizing the metal (Bystrom, Guzman et al. 2014). To
confirm this would require the use of MitoSOXTM Red, a probe used in the
identification of harmful agents that facilitate in the formation of mitochondrial stress and
produces a fluorescent signal in the presence of such. The use of flow cytometry in
conjunction with the aforementioned probe have been observed to be successful in
detecting superoxide anions within the mitochondria, allowing researchers to gain further
insight into compounds responsible for inducing such generation (Kauffman, Kauffman
et al. 2016).

REFERENCES

REFERENCES
Aust, A., et al. (2002). "Particle characteristics responsible for effects on human lung
epithelial cells." (110): 1-65; discussion 67-76.
Becker, S., et al. (1996). "Stimulation of human and rat alveolar macrophages by urban
air particulates: effects on oxidant radical generation and cytokine
production." 141(2): 637-648.
Bhargava, A., et al. (2018). "Ultrafine particulate matter impairs mitochondrial redox
homeostasis and activates phosphatidylinositol 3-kinase mediated DNA damage
responses in lymphocytes." 234: 406-419.
Brauer, M., et al. (2001). "Air pollution and retained particles in the lung." 109(10):
1039-1043.
Bystrom, L. M., et al. (2014). "Iron and reactive oxygen species: friends or foes of cancer
cells?" 20(12): 1917-1924.
Castro, L. and B. A. J. N. Freeman (2001). "Reactive oxygen species in human health and
disease." 2(17): 161-165.
Charrier, J., et al. (2012). "On dithiothreitol (DTT) as a measure of oxidative potential for
ambient particles: evidence for the importance of soluble transition metals." 12(5):
11317.
Charrier, J. G., et al. (2014). "Hydrogen peroxide formation in a surrogate lung fluid by
transition metals and quinones present in particulate matter." 48(12): 7010-7017.
Chen, X., et al. (2010). "2′, 7′-Dichlorodihydrofluorescein as a fluorescent probe for
reactive oxygen species measurement: forty years of application and
controversy." 44(6): 587-604.
Davidson, C. I., et al. (2005). "Airborne particulate matter and human health: a
review." 39(8): 737-749.
Fato, R., et al. (2008). "Mitochondrial production of reactive oxygen species: role of
complex I and quinone analogues." 32(1-4): 31-39.
Figliuzzi, M., et al. (2020). "Copper-dependent biological effects of particulate matter
produced by brake systems on lung alveolar cells." 94(9): 2965-2979.
Forman, H. J., et al. (2002). "Reactive oxygen species and cell signaling: respiratory burst
in macrophage signaling." 166(supplement_1): S4-S8.
Geng, H., et al. (2006). "In vitro responses of rat alveolar macrophages to particle
suspensions and water-soluble components of dust storm PM2. 5." 20(5): 575-584.

38 38
Goldsmith, C.-A., et al. (1997). "Alveolar macrophage interaction with air pollution
particulates." 105(suppl 5): 1191-1195.
Jung, H., et al. (2006). "Quantitative measurements of the generation of hydroxyl radicals
by soot particles in a surrogate lung fluid." 40(6): 1043-1052.
Kauffman, M. E., et al. (2016). "MitoSOX-based flow cytometry for detecting
mitochondrial ROS." 2(5): 361.
Landreman, A. P., et al. (2008). "A macrophage-based method for the assessment of the
reactive oxygen species (ROS) activity of atmospheric particulate matter (PM) and
application to routine (daily-24 h) aerosol monitoring studies." 42(11): 946-957.
Miyata, R., et al. (2011). "The innate and adaptive immune response induced by alveolar
macrophages exposed to ambient particulate matter." 257(2): 209-226.
Paulson, S., et al. (2016). "Probing the Intrinsic Ability of Particles to Generate Reactive
Oxygen Species and the Effect of Physiologically Relevant Solutes Part I: Results
from Field Campaigns."
Pizzino, G., et al. (2017). "Oxidative stress: harms and benefits for human health." 2017.
Sawyer, K., et al. (2009). "The effects of ambient particulate matter on human alveolar
macrophage oxidative and inflammatory responses." 73(1): 41-57.
Tao, F., et al. (2003). "Reactive oxygen species in pulmonary inflammation by ambient
particulates." 35(4): 327-340.
ThermoFisher Scientific. (2005). SYTOX™ Blue dead cell stain: manual. Waltham, MA:
Author
Valavanidis, A., et al. (2008). "Airborne particulate matter and human health:
toxicological assessment and importance of size and composition of particles for
oxidative damage and carcinogenic mechanisms." 26(4): 339-362.
Valavanidis, A., et al. (2000). "Generation of hydroxyl radicals by urban suspended
particulate air matter. The role of iron ions." 34(15): 2379-2386.
Vidrio, E., et al. (2009). "Generation of hydroxyl radicals from ambient fine particles in a
surrogate lung fluid solution." 43(3): 922-927.
Waterston, A. (2016). A method to detect the production of reactive oxygen species in
alveolar macrophages exposed to air particulate matter.
Waterston, A. (2019). A Biological Assessment of the Oxidative Potential of a Selection
of Ambient PM2. 5 Samples from Fresno and Claremont, California, California
State University, Fresno.

39 39
Wei, J., et al. (2018). "Complexation of iron and copper in ambient particulate matter and
its effect on the oxidative potential measured in a surrogate lung fluid." 53(3):
1661-1671.
Xia, T., et al. (2007). "Impairment of mitochondrial function by particulate matter (PM)
and their toxic components: implications for PM-induced cardiovascular and lung
disease." 12(1): 1238.
Xiong, Q., et al. (2017). "Mitochondrial dysfunction and inflammatory response in the
cytotoxicity of NR8383 macrophages induced by fine particulate matter." 55: 1-7.
Xiong, Q., et al. (2017). "Rethinking dithiothreitol-based particulate matter oxidative
potential: measuring dithiothreitol consumption versus reactive oxygen species
generation." 51(11): 6507-6514.
Yang, M., et al. (2018). "Cytotoxicity of air pollutant 9, 10-Phenanthrenequinone: role of
reactive oxygen species and redox signaling." 2018.
Zanobetti, A. and J. J. E. h. p. Schwartz (2009). "The effect of fine and coarse particulate
air pollution on mortality: a national analysis." 117(6): 898-903.
Zhang, Y., et al. (2008). "Source apportionment of in vitro reactive oxygen species
bioassay activity from atmospheric particulate matter." 42(19): 7502-7509.

APPENDIX: TUKEYS MULTIPLE COMPARISONS AMONG THE MEANS OF THE RANGES

41 41

42 42

43 43

Fresno State Non-exclusive Distribution License (Keep for your records) (to archive your thesis/dissertation electronically via Scholar Works)
By submitting this license, you (the author or copyright holder) grant to the California State University
(CSU) the non-exclusive right to reproduce, translate (as defined in the next paragraph), and/or distribute
your submission (including the abstract) worldwide in print and electronic format and in any medium,
including but not limited to audio or video.
You agree that the CSU may, without changing the content, translate the submission to any medium or
format for the purpose of preservation.
You also agree that the submission is your original work, and that you have the right to grant the rights contained in this license. You also represent that your submission does not, to the best of your knowledge,
infringe upon anyone’s copyright.
If the submission reproduces material for which you do not hold copyright and that would not be
considered fair use outside the copyright law, you represent that you have obtained the unrestricted
permission of the copyright owner to grant the CSU the rights required by this license, and that such third-
party material is clearly identified and acknowledged within the text or content of the submission.
If the submission is based upon work that has been sponsored or supported by an agency or organization
other than the CSU, you represent that you have fulfilled any right of review or other obligations required
by such contract or agreement.
The CSU will clearly identify your name as the author or owner of the submission and will not make any
alteration, other than as allowed by this license, to your submission. By typing your name and date in
the fields below, you indicate your agreement to the terms of this use. Publish/embargo options (type
X in one of the boxes).
Make my thesis or dissertation available to the Fresno State Digital Repository
immediately upon submission.
Embargo my thesis or dissertation for a period of 2 years from date of graduation. After 2 years, I understand that my work will automatically become part of the university’s public
institutional repository unless I choose to renew this embargo here:
Embargo my thesis or dissertation for a period of 5 years from date of graduation. After 5 years, I understand that my work will automatically become part of the university’s public
institutional repository unless I choose to renew this embargo here:
Type full name as it appears on submission
Date
David Flores
1/11/2021
X