Embed Size (px)
Citation preview

Impreglon (EntryAll, Industrial Goods & Services)
CO M M E N T Publ ished 29 .07 .2013 1
A n a l y s t
Malte Schaumann [email protected]
+49 40 309537-170
Value Indicators: EUR Share data: Description:
DCF: 11.20
FCF-Value Potential: 10.90
Bloomberg: I3M GR
Reuters: I3MG
ISIN: DE000A0BLCV5
Coating of surfaces for industrial customers
Market Snapshot: EUR m Shareholders: Risk Profile (WRe): 2013e
Buy
EUR 11.20
Price EUR 8.00
Upside 40.0 %
Market cap: 65.5
No. of shares (m): 8.2
EV: 101.2
Freefloat MC: 35.1
Ø Trad. Vol. (30d): 0.83 th
Freefloat 53.6 %
Claassen Holding 23.4 %
Müller & Sohn AG 23.0 %
Beta: 1.4
Price / Book: 1.2 x
Equity Ratio: 43 %
Net Fin. Debt / EBITDA: 2.0 x
Net Debt / EBITDA: 2.3 x
Q2 results show clear improvement
Stated Figures Q2/2013: Comment on Figures: FY End: 31.12. in EUR m
Q2 13
Q2 13e
Q2 12 yoy
6M 13
6M 13e
6M 12 yoy
Sales 29.3 29.2 20.2 45 % 58.0 58.0 41.0 42 %
EBITDA 4.0 3.8 3.0 33 % 7.2 7.0 6.9 5 %
Margin 13.6 % 13.1 % 14.8 % 12.4 % 12.1 % 16.7 %
EBIT 1.9 1.7 1.3 45 % 2.9 2.7 3.6 -20 %
Margin 6.5 % 5.9 % 6.5 % 5.0 % 4.7 % 8.9 %
EPS 0.13 0.09 0.08 63 % 0.17 0.13 0.25 -32 %
� Revenue growth as last year’s acquisitions are consolidated. � Clear improvement in Q2 result compared to weak Q1 figures.
Impreglon reported slightly better than expected results for the second quarter. The clear 45%-increase in revenue compared to the year-
earlier quarter resulted primarily from the consolidation of acquisitions made in 2012. Currently, these acquisitions are making hardly any
positive earnings contributions, which explain the below-average earnings development on the half-yearly level.
More important however is that the expected improvement has commenced. After rather disappointing results in Q4 2012 (EBIT EUR 0.3m)
and in Q1 2013 (EBIT EUR 1.0m), Impreglon achieved a higher EBIT margin again in Q2. In particular the larger acquisition of RUAG in Altdorf,
Switzerland (revenue contribution about EUR 20m p.a.) recently disappointed with negative results. The Q2 figures make it clear that
Impreglon has managed to improve the situation here again and has probably achieved at least a balanced result.
Overall, the Q2 earnings underline that Impreglon is well on its way to achieving its full-year targets. The expected clear revenue growth is
almost entirely explained by the consolidation of last year’s acquisitions. It is therefore expected that the EBITDA margin of just over 13% can
be kept stable. In Q3 Impreglon is expected to achieve a similar result to Q2. With somewhat higher revenues in Q4, the result could again be
increased slightly.
For the second half of the year, Impreglon plans 1-2 further acquisitions. In general, based on the weak margin situation in some of the
companies acquired in 2012 (RUAG, Switzerland; Coating Applicators, US; Finished Products, Australia), the focus on integrating these
acquisitions into the Impreglon group remains relevant. The Q2 earnings however indicate first successes. With an improvement in the
earnings profile of the recent takeovers, margins are expected to rise in the coming years.
The price target of EUR 11.20 and the Buy rating remain unchanged.
Rel. Performance vs EntryAll:
1 month: n/a
6 months: 0.1 %
Year to date: n/a
Trailing 12 months: -7.1 %
Company events:
FY End: 31.12. in EUR m
CAGR (12-15e) 2009 2010 2011 2012 2013e 2014e 2015e
Sales 12.6 % 37.2 55.2 75.5 91.1 119.2 124.5 130.1
Change Sales yoy -19.7 % 48.3 % 36.8 % 20.7 % 30.9 % 4.5 % 4.5 %
Gross profit margin 74.8 % 74.0 % 74.6 % 70.5 % 70.5 % 71.0 % 71.5 %
EBITDA 18.3 % 3.9 9.8 12.4 12.4 15.9 18.4 20.5
Margin 10.4 % 17.7 % 16.5 % 13.6 % 13.3 % 14.8 % 15.8 %
EBIT 27.8 % -1.0 4.6 6.0 5.6 7.3 9.6 11.7
Margin -2.6 % 8.3 % 8.0 % 6.1 % 6.1 % 7.7 % 9.0 %
Net income 106.7 % -3.0 2.0 3.3 0.7 3.3 4.9 6.3
EPS 104.5 % -0.57 0.33 0.43 0.09 0.40 0.59 0.77
EPS adj. 104.5 % -0.57 0.33 0.43 0.09 0.40 0.59 0.77
DPS - 0.00 0.12 0.20 0.00 0.15 0.15 0.15
Dividend Yield 0.0 % 1.5 % 2.2 % 0.0 % 1.9 % 1.9 % 1.9 %
FCFPS -0.03 -0.11 -0.50 -0.66 0.29 0.67 0.83
EV / Sales 1.7 x 1.2 x 1.2 x 1.2 x 0.8 x 0.8 x 0.7 x
EV / EBITDA 16.2 x 6.5 x 7.2 x 8.5 x 6.4 x 5.3 x 4.5 x
EV / EBIT n.a. 13.9 x 14.9 x 18.9 x 13.8 x 10.1 x 7.8 x
P / E n.a. 24.0 x 21.1 x 95.9 x 20.0 x 13.6 x 10.4 x
P / E adj. n.a. 24.0 x 21.1 x 95.9 x 20.0 x 13.6 x 10.4 x
FCF Yield Potential -0.3 % 8.0 % 8.0 % 6.3 % 8.8 % 10.6 % 12.3 %
Net Debt 18.3 15.6 20.5 36.2 35.8 31.5 25.9
ROE -10.5 % 5.4 % 7.0 % 1.4 % 6.0 % 8.3 % 10.0 %
ROCE (NOPAT) -2.4 % 5.3 % 6.7 % 2.9 % 5.6 % 7.3 % 8.9 % Guidance: 2013: revenues c. EUR 120m; EBITDA EUR 16m

Impreglon
CO M M E N T Publ ished 29 .07 .2013 2
Sales development in EUR m
Source: Warburg Research
Sales by regions 2012; in %
Source: Warburg Research
EBIT development in EUR m
Source: Warburg Research
Company Background
� Impreglon is focused on the coating of surfaces. The mostly metallic components are coated in different processes and with different
materials like carbide, ceramic, teflon or zinc.
� The coating provides the respective component with a required property such as traction, sliding or corrosion protection.
� The market for surface coating relevant for Impreglon grew at an average rate of ca. 6-7% in the past few years.
� This is because coated components often substitute heavier and more expensive components with inferior characteristics. Coating
can also substitute environmentally troublesome technologies.
� To strengthen the competitive position and geographic footprint Impreglon made several acquisitions in the last years, which were
well integrated and often value-enhancing.
Competitive Quality
� 90% of the company's revenues are generated with customer-specific coating solutions and are thus made outside the price-sensitive
volume business.
� The market for coating services is strongly fragmented and the competitive structure is therefore characterised by smaller companies.
� The moderate level of competition is mainly a result of Impreglon’s focus on its own coating systems outside the price-sensitive
volume business and of locally-influenced competitive structures.
� Impreglon differentiates itself from its usually smaller competitors with its superior competence based on a variety of coating
processes and with its financing power for technological and regional expansion.
� Established customer relationships are a major barrier to market entry. The coating quality determines the functional capability and
reliability of the cutomers' end products.
EBT development in EUR m
Source: Warburg Research
Sales by segments 2012; in %
Source: Warburg Research
Net income development in EUR m
Source: Warburg Research
Impreglon
CO M M E N T Publ ished 29 .07 .2013 3
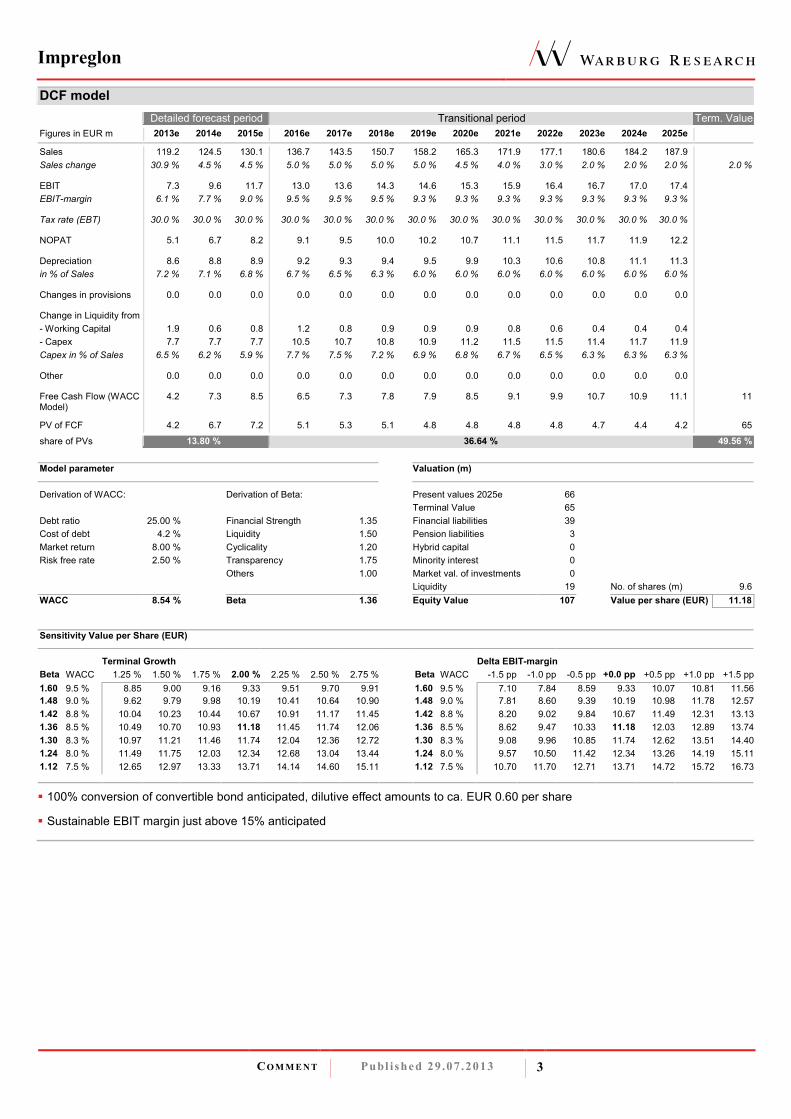
DCF model
Detailed forecast period Transitional period Term. Value
Figures in EUR m 2013e 2014e 2015e 2016e 2017e 2018e 2019e 2020e 2021e 2022e 2023e 2024e 2025e
Sales 119.2 124.5 130.1 136.7 143.5 150.7 158.2 165.3 171.9 177.1 180.6 184.2 187.9
Sales change 30.9 % 4.5 % 4.5 % 5.0 % 5.0 % 5.0 % 5.0 % 4.5 % 4.0 % 3.0 % 2.0 % 2.0 % 2.0 % 2.0 %
EBIT 7.3 9.6 11.7 13.0 13.6 14.3 14.6 15.3 15.9 16.4 16.7 17.0 17.4
EBIT-margin 6.1 % 7.7 % 9.0 % 9.5 % 9.5 % 9.5 % 9.3 % 9.3 % 9.3 % 9.3 % 9.3 % 9.3 % 9.3 %
Tax rate (EBT) 30.0 % 30.0 % 30.0 % 30.0 % 30.0 % 30.0 % 30.0 % 30.0 % 30.0 % 30.0 % 30.0 % 30.0 % 30.0 %
NOPAT 5.1 6.7 8.2 9.1 9.5 10.0 10.2 10.7 11.1 11.5 11.7 11.9 12.2
Depreciation 8.6 8.8 8.9 9.2 9.3 9.4 9.5 9.9 10.3 10.6 10.8 11.1 11.3
in % of Sales 7.2 % 7.1 % 6.8 % 6.7 % 6.5 % 6.3 % 6.0 % 6.0 % 6.0 % 6.0 % 6.0 % 6.0 % 6.0 %
Changes in provisions 0.0 0.0 0.0 0.0 0.0 0.0 0.0 0.0 0.0 0.0 0.0 0.0 0.0
Change in Liquidity from
- Working Capital 1.9 0.6 0.8 1.2 0.8 0.9 0.9 0.9 0.8 0.6 0.4 0.4 0.4
- Capex 7.7 7.7 7.7 10.5 10.7 10.8 10.9 11.2 11.5 11.5 11.4 11.7 11.9
Capex in % of Sales 6.5 % 6.2 % 5.9 % 7.7 % 7.5 % 7.2 % 6.9 % 6.8 % 6.7 % 6.5 % 6.3 % 6.3 % 6.3 %
Other 0.0 0.0 0.0 0.0 0.0 0.0 0.0 0.0 0.0 0.0 0.0 0.0 0.0
Free Cash Flow (WACC Model)
4.2 7.3 8.5 6.5 7.3 7.8 7.9 8.5 9.1 9.9 10.7 10.9 11.1 11
PV of FCF 4.2 6.7 7.2 5.1 5.3 5.1 4.8 4.8 4.8 4.8 4.7 4.4 4.2 65 share of PVs 13.80 % 36.64 % 49.56 %
Model parameter Valuation (m)
Derivation of WACC: Derivation of Beta: Present values 2025e 66
Terminal Value 65
Debt ratio 25.00 % Financial Strength 1.35 Financial liabilities 39
Cost of debt 4.2 % Liquidity 1.50 Pension liabilities 3
Market return 8.00 % Cyclicality 1.20 Hybrid capital 0
Risk free rate 2.50 % Transparency 1.75 Minority interest 0
Others 1.00 Market val. of investments 0
Liquidity 19 No. of shares (m) 9.6
WACC 8.54 % Beta 1.36 Equity Value 107 Value per share (EUR) 11.18
Sensitivity Value per Share (EUR)
Terminal Growth Delta EBIT-margin
Beta WACC 1.25 % 1.50 % 1.75 % 2.00 % 2.25 % 2.50 % 2.75 % Beta WACC -1.5 pp -1.0 pp -0.5 pp +0.0 pp +0.5 pp +1.0 pp +1.5 pp
1.60 9.5 % 8.85 9.00 9.16 9.33 9.51 9.70 9.91 1.60 9.5 % 7.10 7.84 8.59 9.33 10.07 10.81 11.56
1.48 9.0 % 9.62 9.79 9.98 10.19 10.41 10.64 10.90 1.48 9.0 % 7.81 8.60 9.39 10.19 10.98 11.78 12.57
1.42 8.8 % 10.04 10.23 10.44 10.67 10.91 11.17 11.45 1.42 8.8 % 8.20 9.02 9.84 10.67 11.49 12.31 13.13
1.36 8.5 % 10.49 10.70 10.93 11.18 11.45 11.74 12.06 1.36 8.5 % 8.62 9.47 10.33 11.18 12.03 12.89 13.74
1.30 8.3 % 10.97 11.21 11.46 11.74 12.04 12.36 12.72 1.30 8.3 % 9.08 9.96 10.85 11.74 12.62 13.51 14.40
1.24 8.0 % 11.49 11.75 12.03 12.34 12.68 13.04 13.44 1.24 8.0 % 9.57 10.50 11.42 12.34 13.26 14.19 15.11
1.12 7.5 % 12.65 12.97 13.33 13.71 14.14 14.60 15.11 1.12 7.5 % 10.70 11.70 12.71 13.71 14.72 15.72 16.73
� 100% conversion of convertible bond anticipated, dilutive effect amounts to ca. EUR 0.60 per share
� Sustainable EBIT margin just above 15% anticipated

Impreglon
CO M M E N T Publ ished 29 .07 .2013 4
Free Cash Flow Value Potential Warburg Research's valuation tool "FCF Value Potential" reflects the ability of the company to generate sustainable free cash flows. It is based on the "FCF potential" - a FCF "ex growth" figure - which assumes unchanged working capital and pure maintenance capex. A value indication is derived by discounting the “FCF potential” of a given year with the weighted costs of capital. The fluctuating value indications over time add a timing element to the DCF model (our preferred valuation tool). in EUR m 2009 2010 2011 2012 2013e 2014e 2015e
Net Income before minorities -3.0 1.9 3.3 0.8 3.4 5.0 6.4
+ Depreciation + Amortisation 4.8 5.2 6.4 6.8 8.6 8.8 8.9
- Net Interest Income -1.5 -1.4 -1.5 -3.8 -2.5 -2.5 -2.5
- Maintenance Capex 3.5 3.5 4.0 4.8 5.5 6.0 6.5
+ Other 0.0 0.0 0.0 0.0 0.0 0.0 0.0
= Free Cash Flow Potential -0.2 5.1 7.2 6.6 9.0 10.3 11.3
Free Cash Flow Yield Potential -0.3 % 8.0 % 8.0 % 6.3 % 8.8 % 10.6 % 12.3 %
WACC 8.54 % 8.54 % 8.54 % 8.54 % 8.54 % 8.54 % 8.54 %
= Enterprise Value (EV) 62.5 63.6 89.8 105.7 101.2 96.9 91.4 = Fair Enterprise Value n.a. 59.6 83.8 77.6 104.9 120.8 132.1
- Net Debt (Cash) 32.8 32.8 32.8 32.8 32.4 13.1 7.6
- Pension Liabilities 3.4 3.4 3.4 3.4 3.4 3.4 3.4
- Other 0.0 0.0 0.0 0.0 0.0 0.0 0.0
- Market value of minorities 0.0 0.0 0.0 0.0 0.0 0.0 0.0
+ Market value of investments 0.0 0.0 0.0 0.0 0.0 0.0 0.0
= Fair Market Capitalisation n.a. 23.4 47.6 41.4 69.1 104.3 121.1
No. of shares (total) (m) 8.2 8.2 8.2 8.2 8.2 8.2 8.2
= Fair value per share (EUR) n.a. 2.86 5.82 5.06 8.45 12.75 14.80
premium (-) / discount (+) in % 5.6 % 59.3 % 85.0 %
Sensitivity Fair value per Share (EUR)
11.54 % n.a. 0.97 3.16 2.59 5.11 7.59 9.04
10.54 % n.a. 1.48 3.87 3.26 6.01 8.47 10.00
9.53 % n.a. 2.10 4.74 4.07 7.10 9.54 11.17
WACC 8.54 % n.a. 2.86 5.82 5.06 8.45 10.86 12.61
7.54 % n.a. 3.83 7.18 6.32 10.15 12.53 14.44
6.53 % n.a. 5.09 8.95 7.96 12.37 14.71 16.82
5.53 % n.a. 6.81 11.37 10.20 15.40 17.68 20.07
� Significant future earnings growth leads to higher value indication for coming years
� 100% conversion of convertible bond anticipated

Impreglon
CO M M E N T Publ ished 29 .07 .2013 5
Valuation
2009 2010 2011 2012 2013e 2014e 2015e
Price / Book 1.5 x 1.1 x 1.4 x 1.3 x 1.2 x 1.1 x 1.0 x
Book value per share ex intangibles 3.36 5.30 4.88 4.53 4.92 5.41 6.09
EV / Sales 1.7 x 1.2 x 1.2 x 1.2 x 0.8 x 0.8 x 0.7 x
EV / EBITDA 16.2 x 6.5 x 7.2 x 8.5 x 6.4 x 5.3 x 4.5 x
EV / EBIT n.a. 13.9 x 14.9 x 18.9 x 13.8 x 10.1 x 7.8 x
EV / EBIT adj.* n.a. 13.9 x 14.9 x 18.9 x 13.8 x 10.1 x 7.8 x
P / FCF 35.3 x n.a. n.a. n.a. 32.0 x 13.9 x 11.3 x
P / E n.a. 24.0 x 21.1 x 95.9 x 20.0 x 13.6 x 10.4 x
P / E adj.* n.a. 24.0 x 21.1 x 95.9 x 20.0 x 13.6 x 10.4 x
Dividend Yield 0.0 % 1.5 % 2.2 % 0.0 % 1.9 % 1.9 % 1.9 %
Free Cash Flow Yield Potential -0.3 % 8.0 % 8.0 % 6.3 % 8.8 % 10.6 % 12.3 %
*Adjustments made for: -

Impreglon
CO M M E N T Publ ished 29 .07 .2013 6
Consolidated profit & loss
In EUR m 2009 2010 2011 2012 2013e 2014e 2015e
Sales 37.2 55.2 75.5 91.1 119.2 124.5 130.1
Change Sales yoy -19.7 % 48.3 % 36.8 % 20.7 % 30.9 % 4.5 % 4.5 %
Increase / decrease in inventory -0.3 0.0 0.4 -0.5 0.0 0.0 0.0
Own work capitalised 0.0 0.0 0.0 0.0 0.0 0.0 0.0
Total Sales 36.9 55.2 75.9 90.6 119.2 124.5 130.1
Material Expenses 9.1 14.4 19.6 26.3 35.2 36.1 37.1
Gross profit 37.2 55.2 75.5 91.1 119.2 124.5 130.1
Gross profit margin 74.8 % 74.0 % 74.6 % 70.5 % 70.5 % 71.0 % 71.5 %
Personnel expenses 14.4 20.1 28.9 35.2 45.3 46.1 47.6
Other operating income 0.5 1.2 1.0 2.2 1.0 1.0 1.0
Other operating expenses 10.0 12.1 16.0 18.7 23.8 24.9 25.9
Unfrequent items 0.0 0.0 0.0 0.0 0.0 0.0 0.0
EBITDA 3.9 9.8 12.4 12.4 15.9 18.4 20.5
Margin 10.4 % 17.7 % 16.5 % 13.6 % 13.3 % 14.8 % 15.8 %
Depreciation of fixed assets 3.7 4.0 5.1 5.8 8.0 8.3 8.3
EBITA 0.2 5.8 7.3 6.6 7.9 10.1 12.2
Amortisation of intangible assets 1.1 1.3 1.3 1.0 0.6 0.5 0.5
Goodwill amortization 0.0 0.0 0.0 0.0 0.0 0.0 0.0
EBIT -1.0 4.6 6.0 5.6 7.3 9.6 11.7
Margin -2.6 % 8.3 % 8.0 % 6.1 % 6.1 % 7.7 % 9.0 %
EBIT adj. -1.0 4.6 6.0 5.6 7.3 9.6 11.7
Interest income 0.2 0.1 0.1 0.1 0.0 0.0 0.0
Interest expenses 1.6 1.6 1.6 2.4 2.5 2.5 2.5
Other financial income (loss) 0.0 0.0 0.0 -1.5 0.0 0.0 0.0
EBT -2.5 3.1 4.5 1.8 4.8 7.1 9.2
Margin -6.7 % 5.7 % 6.0 % 2.0 % 4.0 % 5.7 % 7.0 %
Total taxes 0.5 1.2 1.3 1.0 1.4 2.1 2.8
Net income from continuing operations -3.0 1.9 3.3 0.8 3.4 5.0 6.4
Income from discontinued operations (net of tax) 0.0 0.0 0.0 0.0 0.0 0.0 0.0
Net income before minorities -3.0 1.9 3.3 0.8 3.4 5.0 6.4
Minority interest 0.0 0.0 0.0 0.0 0.1 0.1 0.1
Net income -3.0 2.0 3.3 0.7 3.3 4.9 6.3
Margin -8.2 % 3.6 % 4.3 % 0.8 % 2.7 % 3.9 % 4.9 %
Number of shares, average 5.4 6.1 7.7 8.1 8.2 8.2 8.2
EPS -0.57 0.33 0.43 0.09 0.40 0.59 0.77
EPS adj. -0.57 0.33 0.43 0.09 0.40 0.59 0.77
*Adjustments made for:
Guidance: 2013: revenues c. EUR 120m; EBITDA EUR 16m
Financial Ratios 2009 2010 2011 2012 2013e 2014e 2015e
Total Operating Costs / Sales 88.7 % 82.3 % 84.1 % 85.8 % 86.7 % 85.2 % 84.2 %
Operating Leverage n.a. n.a. 0.9 x -0.3 x 1.0 x 6.9 x 4.8 x
EBITDA / Interest expenses 2.3 x 6.2 x 7.6 x 5.1 x 6.4 x 7.4 x 8.2 x
Tax rate (EBT) -20.6 % 38.1 % 27.9 % 58.0 % 30.0 % 30.0 % 30.0 %
Dividend Payout Ratio 0.0 % 37.4 % 46.8 % 0.0 % 36.4 % 24.7 % 19.1 %
Sales per Employee 64,506 76,130 85,778 77,913 91,677 94,351 96,406
Sales, EBITDA in EUR m
Source: Warburg Research
Operating Performance in %
Source: Warburg Research
Performance per Share
Source: Warburg Research

Impreglon
CO M M E N T Publ ished 29 .07 .2013 7
Consolidated balance sheet In EUR m 2009 2010 2011 2012 2013e 2014e 2015e
Assets
Goodwill and other intangible assets 11.5 11.3 12.8 16.8 16.4 16.1 15.7
thereof other intangible assets 2.8 2.6 2.1 2.3 1.9 1.6 1.3
thereof Goodwill 8.7 8.7 10.7 14.4 14.4 14.4 14.4
Property, plant and equipment 35.5 43.0 56.2 67.6 69.2 68.3 67.5
Financial assets 0.1 0.2 0.7 0.7 0.7 0.7 0.7
Other long-term assets 0.0 0.0 0.0 0.0 0.0 0.0 0.0
Fixed assets 47.1 54.5 69.7 85.1 86.2 85.0 83.9
Inventories 3.3 3.7 5.1 6.7 7.9 8.3 8.7
Accounts receivable 4.7 6.4 8.3 11.3 13.1 13.6 14.3
Liquid assets 9.5 14.7 13.1 20.8 21.2 25.5 31.1
Other short-term assets 3.2 3.9 3.7 4.5 4.5 4.5 4.5
Current assets 20.7 28.7 30.1 43.3 46.7 51.9 58.5
Total Assets 67.8 83.2 99.8 128.4 132.9 136.9 142.4
Liabilities and shareholders' equity
Subscribed capital 6.1 6.1 7.8 8.2 8.2 8.2 8.2
Capital reserve 27.9 26.3 37.6 41.3 41.3 41.3 41.3
Retained earnings 0.8 2.9 5.4 4.6 7.9 11.5 16.6
Other equity components -5.3 8.1 -0.7 -0.8 -0.7 -0.6 -0.5
Shareholder's equity 29.5 43.4 50.1 53.2 56.6 60.4 65.5
Minority interest 0.0 0.0 0.0 0.3 0.3 0.3 0.3
Total equity 29.5 43.4 50.2 53.5 56.9 60.6 65.8
Provisions 0.5 0.5 0.6 4.4 4.4 4.4 4.4
thereof provisions for pensions and similar obligations 0.3 0.4 0.4 3.4 3.4 3.4 3.4
Financial liabilites (total) 27.5 29.9 33.1 53.6 53.6 53.6 53.6
thereof short-term financial liabilities 2.1 3.0 3.6 4.1 4.1 4.1 4.1
Accounts payable 5.3 3.1 4.8 6.1 7.2 7.5 7.8
Other liabilities 5.0 6.4 11.2 10.8 10.8 10.8 10.8
Liabilities 38.3 39.9 49.7 74.9 76.0 76.3 76.6
Total liabilities and shareholders' equity 67.8 83.2 99.8 128.4 132.9 136.9 142.4
Financial Ratios 2009 2010 2011 2012 2013e 2014e 2015e
Efficiency of Capital Employment
Operating Assets Turnover 1.0 x 1.1 x 1.2 x 1.1 x 1.4 x 1.5 x 1.6 x
Capital Employed Turnover 0.8 x 0.9 x 1.1 x 1.0 x 1.3 x 1.4 x 1.4 x
ROA -6.5 % 3.6 % 4.7 % 0.8 % 3.8 % 5.7 % 7.5 %
Return on Capital
ROCE (NOPAT) -2.4 % 5.3 % 6.7 % 2.9 % 5.6 % 7.3 % 8.9 %
ROE -10.5 % 5.4 % 7.0 % 1.4 % 6.0 % 8.3 % 10.0 %
Adj. ROE -10.5 % 5.4 % 7.0 % 1.4 % 6.0 % 8.3 % 10.0 %
Balance sheet quality
Net Debt 18.3 15.6 20.5 36.2 35.8 31.5 25.9
Net Financial Debt 18.0 15.2 20.0 32.8 32.4 28.1 22.6
Net Gearing 62.0 % 35.9 % 40.8 % 67.6 % 62.9 % 52.0 % 39.4 %
Net Fin. Debt / EBITDA 465.5 % 155.2 % 161.3 % 264.2 % 203.7 % 152.4 % 109.9 %
Book Value / Share 5.5 7.2 6.6 6.6 6.9 7.4 8.0
Book value per share ex intangibles 3.4 5.3 4.9 4.5 4.9 5.4 6.1
ROCE Development
Source: Warburg Research
Net debt in EUR m
Source: Warburg Research
Book Value per Share in EUR
Source: Warburg Research

Impreglon
CO M M E N T Publ ished 29 .07 .2013 8
Consolidated cash flow statement In EUR m 2009 2010 2011 2012 2013e 2014e 2015e
Net income -3.0 1.9 3.1 0.4 3.4 5.0 6.4
Depreciation of fixed assets 3.7 4.0 5.1 5.8 8.0 8.3 8.3
Amortisation of goodwill 0.0 0.0 0.0 0.0 0.0 0.0 0.0
Amortisation of intangible assets 1.1 1.3 1.3 1.0 0.6 0.5 0.5
Increase/decrease in long-term provisions 0.3 0.1 0.0 3.0 0.0 0.0 0.0
Other non-cash income and expenses 1.7 4.8 0.1 -2.0 0.0 0.0 0.0
Cash Flow 3.8 12.1 9.6 8.2 12.0 13.8 15.3
Increase / decrease in inventory 0.1 -0.4 -1.4 -1.7 -1.2 -0.4 -0.4
Increase / decrease in accounts receivable -0.5 -1.7 -1.9 -3.0 -1.8 -0.5 -0.7
Increase / decrease in accounts payable -1.0 -2.2 1.8 1.3 1.1 0.3 0.3
Increase / decrease in other working capital positions 0.0 0.0 2.7 0.9 0.0 0.0 0.0
Increase / decrease in working capital (total) -1.3 -4.3 1.1 -2.5 -1.9 -0.6 -0.8
Net cash provided by operating activities 2.5 7.7 10.7 5.7 10.1 13.2 14.5
Investments in intangible assets 0.0 -0.6 -0.1 -0.5 -0.2 -0.2 -0.2
Investments in property, plant and equipment -1.3 -7.9 -14.5 -10.5 -7.5 -7.5 -7.5
Payments for acquisitions -2.1 -4.3 -6.8 -9.5 -2.0 0.0 0.0
Financial investments 0.0 0.0 0.0 -2.0 0.0 0.0 0.0
Income from asset disposals 0.4 0.8 0.4 1.8 0.0 0.0 0.0
Net cash provided by investing activities -4.4 -11.9 -21.0 -20.7 -9.7 -7.7 -7.7
Change in financial liabilities 1.8 1.3 4.5 21.4 0.0 0.0 0.0
Dividends paid 0.0 0.0 -0.7 -1.6 0.0 -1.2 -1.2
Purchase of own shares 1.4 2.0 -0.2 0.0 0.0 0.0 0.0
Capital measures 2.3 8.4 4.8 3.6 0.0 0.0 0.0
Other 0.0 0.0 -0.1 -0.1 0.0 0.0 0.0
Net cash provided by financing activities 5.5 11.7 8.2 23.3 0.0 -1.2 -1.2
Change in liquid funds 3.6 7.6 -2.0 8.3 0.4 4.3 5.5
Effects of exchange-rate changes on cash 0.1 0.0 -0.4 -0.3 0.0 0.0 0.0
Cash and cash equivalent at end of period 7.0 14.7 11.7 19.7 20.2 24.5 30.0
Financial Ratios 2009 2010 2011 2012 2013e 2014e 2015e
Cash Flow
Free Cash Flow -0.2 -0.7 -3.8 -5.3 2.4 5.5 6.8
Free Cash Flow / Sales 3.4 % -1.2 % -5.1 % -5.8 % 2.0 % 4.4 % 5.2 %
Free Cash Flow Potential -0.2 5.1 7.2 6.6 9.0 10.3 11.3
Free Cash Flow / Sales 3.4 % -1.2 % -5.1 % -5.8 % 2.0 % 4.4 % 5.2 %
Free Cash Flow / Net Profit -41.2 % -34.7 % -117.7 % -738.1 % 73.4 % 113.2 % 107.1 %
Interest Received / Avg. Cash 2.0 % 1.2 % 1.0 % 0.6 % 0.0 % 0.0 % 0.0 %
Interest Paid / Avg. Debt 6.2 % 5.5 % 5.2 % 5.6 % 4.7 % 4.7 % 4.7 %
Management of Funds
Investment ratio 3.4 % 15.3 % 19.3 % 12.1 % 6.5 % 6.2 % 5.9 %
Maint. Capex / Sales 9.4 % 6.3 % 5.3 % 5.2 % 4.6 % 4.8 % 5.0 %
Capex / Dep 25.9 % 161.8 % 228.3 % 161.5 % 89.7 % 87.1 % 87.0 %
Avg. Working Capital / Sales 5.6 % 8.8 % 10.3 % 11.3 % 10.8 % 11.3 % 11.4 %
Trade Debtors / Trade Creditors 89.4 % 210.3 % 173.4 % 185.8 % 181.9 % 181.3 % 183.3 %
Inventory Turnover 2.8 x 3.9 x 3.9 x 3.9 x 4.5 x 4.4 x 4.3 x
Receivables collection period (days) 46 42 40 45 40 40 40
Payables payment period (days) 213 77 90 84 75 76 77
Cash conversion cycle (Days) -64 27 15 20 16 17 18
CAPEX and Cash Flow in EUR m
Source: Warburg Research
Free Cash Flow Generation
Source: Warburg Research
Working Capital
Source: Warburg Research

Impreglon
CO M M E N T Publ ished 29 .07 .2013 9
LEGAL DISCLAIMER
This research report was prepared by the Warburg Research GmbH, a subsidiary of the M.M.Warburg & CO KGaA and is passed on
by the M.M.Warburg & CO KGaA. It contains selected information and does not purport to be complete. The report is based on
publicly available information and data ("the information") believed to be accurate and complete. Warburg Research GmbH neither
does examine the information to be accurate and complete, nor guarantees its accuracy and completeness. Possible errors or
incompleteness of the information do not constitute grounds for liability of M.M.Warburg & CO KGaA or Warburg Research GmbH for
damages of any kind whatsoever, and M.M.Warburg & CO KGaA and Warburg Research GmbH are not liable for indirect and/or direct
and/or consequential damages. In particular, neither M.M.Warburg & CO KGaA nor Warburg Research GmbH are liable for the
statements, plans or other details contained in these analyses concerning the examined companies, their affiliated companies,
strategies, economic situations, market and competitive situations, regulatory environment, etc. Although due care has been taken in
compiling this research report, it cannot be excluded that it is incomplete or contains errors. M.M.Warburg & CO KGaA and Warburg
Research GmbH, their shareholders and employees are not liable for the accuracy and completeness of the statements, estimations
and the conclusions derived from the information contained in this document. Provided a research report is being transmitted in
connection with an existing contractual relationship, i.e. financial advisory or similar services, the liability of M.M.Warburg & CO KGaA
and Warburg Research GmbH shall be restricted to gross negligence and wilful misconduct. In case of failure in essential tasks,
M.M.Warburg & CO KGaA and Warburg Research GmbH are liable for normal negligence. In any case, the liability of M.M.Warburg &
CO KGaA and Warburg Research GmbH is limited to typical, expectable damages. This research report does not constitute an offer or
a solicitation of an offer for the purchase or sale of any security. Partners, directors or employees of M.M.Warburg & CO KGaA,
Warburg Research GmbH or affiliated companies may serve in a position of responsibility, i.e. on the board of directors of companies
mentioned in the report. Opinions expressed in this report are subject to change without notice. All rights reserved.
COPYRIGHT NOTICE
This work including all its parts is protected by copyright. Any use beyond the limits provided by copyright law without permission is
prohibited and punishable. This applies, in particular, to reproductions, translations, microfilming, and storage and processing on
electronic media of the entire content or parts thereof.
DISCLOSURE ACCORDING TO § 34B OF THE GERMAN SECURITIES TRADING ACT AND FINANV
The valuation underlying the rating of the company analysed in this report is based on generally accepted and widely used methods of
fundamental valuation, such as the DCF model, Free Cash Flow Value Potential, peer group comparison and – where applicable – a
sum-of-the-parts model.
M.M.Warburg & CO KGaA and Warburg Research GmbH have set up internal organisational and administrative arrangements to
prevent and avoid possible conflicts of interest and, where applicable, to disclose them.
Valuations, ratings and price targets for the companies analysed by Warburg Research GmbH are subject to constant reviews and
may therefore change, if any of the fundamental factors underlying these items do change.
All share prices given in this equity analysis are closing prices from the last trading day before the publication date stated, unless
another point in time is explicitly stated.
Neither Warburg Research GmbH’s analysts nor M.M.Warburg & CO KGaA’s analysts do receive any payments directly or indirectly
from any investment banking activity of M.M.Warburg Bank or an affiliated company.
M.M.Warburg & CO KGaA and Warburg Research GmbH are under supervision of the BaFin – German Federal Financial Supervisory
Authority.
SOURCES
All data and consensus estimates have been obtained from FactSet except where stated otherwise.
Impreglon
CO M M E N T Publ ished 29 .07 .2013 10
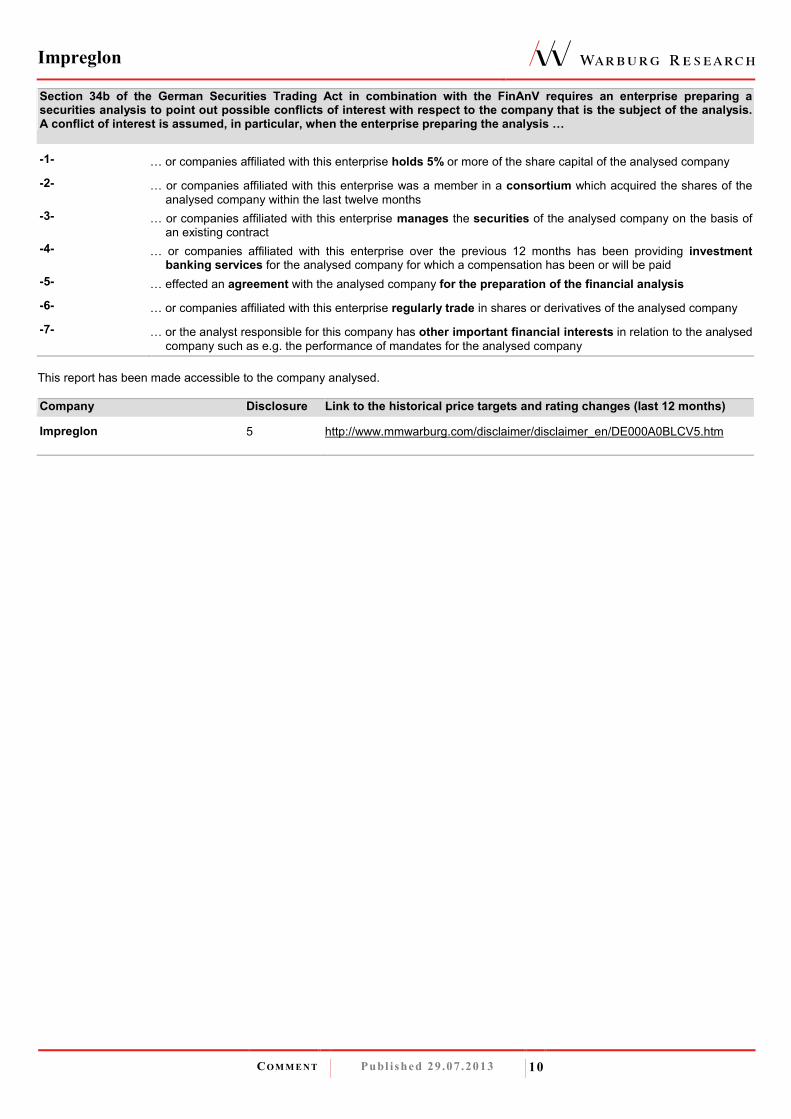
Section 34b of the German Securities Trading Act in combination with the FinAnV requires an enterprise preparing a securities analysis to point out possible conflicts of interest with respect to the company that is the subject of the analysis. A conflict of interest is assumed, in particular, when the enterprise preparing the analysis …
-1- … or companies affiliated with this enterprise holds 5% or more of the share capital of the analysed company
-2- … or companies affiliated with this enterprise was a member in a consortium which acquired the shares of the analysed company within the last twelve months
-3- … or companies affiliated with this enterprise manages the securities of the analysed company on the basis of an existing contract
-4- … or companies affiliated with this enterprise over the previous 12 months has been providing investment banking services for the analysed company for which a compensation has been or will be paid
-5- … effected an agreement with the analysed company for the preparation of the financial analysis
-6- … or companies affiliated with this enterprise regularly trade in shares or derivatives of the analysed company
-7- … or the analyst responsible for this company has other important financial interests in relation to the analysed company such as e.g. the performance of mandates for the analysed company
This report has been made accessible to the company analysed.
Company Disclosure Link to the historical price targets and rating changes (last 12 months)
Impreglon 5 http://www.mmwarburg.com/disclaimer/disclaimer_en/DE000A0BLCV5.htm
Impreglon
CO M M E N T Publ ished 29 .07 .2013 11
INVESTMENT RECOMMENDATION
Investment recommendation: expected direction of the share price development of the financial instrument up to the given price target
in the opinion of the analyst who covers this financial instrument.
-B- Buy: The price of the analysed financial instrument is expected to rise over the next 12 months.
-H- Hold: The price of the analysed financial instrument is expected to remain mostly flat over the
next 12 months.
-S- Sell: The price of the analysed financial instrument is expected to fall over the next 12 months.
“-“ Rating suspended: The available information currently does not permit an evaluation of the company.
WARBURG RESEARCH GMBH – RESEARCH UNIVERSE BY RATING
Rating Number of stocks % of Universe
Buy 105 53
Hold 80 40
Sell 9 5
Rating suspended 4 2
Total 198 100
WARBURG RESEARCH GMBH – ANALYSED RESEARCH UNIVERSE BY RATING …
… Looking only at companies for which a disclosure according to § 34b of the Germany Securities Trading Act and the
FinAnV has to be made.
Rating Number of stocks % of Universe
Buy 92 61
Hold 53 35
Sell 4 3
Rating suspended 3 2
Total 152 100
PRICE AND RATING HISTORY IMPREGLON AS OF 29.07.2013
The chart has markings if Warburg Research GmbH changed its rating in the last 12 months. Every marking represents the date and closing price on the day of the rating change.
Impreglon
CO M M E N T Publ ished 29 .07 .2013 12
RESEARCH Roland Rapelius +49 40 309537-220 Malte Räther +49 40 309537-185 Head of Research [email protected] Technology, Telco, Internet [email protected]
Henner Rüschmeier +49 40 309537-270 Jochen Reichert +49 40 309537-130 Head of Research hrueschmeier @warburg-research.com Telco, Internet, Media [email protected]
Christian Cohrs +49 40 309537-175 Christopher Rodler +49 40 309537-290 Engineering, Logistics [email protected] Utilities [email protected]
Felix Ellmann +49 40 309537-120 Malte Schaumann +49 40 309537-170 Software, IT [email protected] Technology [email protected]
Jörg Philipp Frey +49 40 309537-258 Susanne Schwartze +49 40 309537-155 Retail, Consumer Goods [email protected] Telco, Internet, Media [email protected]
Ulrich Huwald +49 40 309537-255 Oliver Schwarz +49 40 309537-250 Health Care, Pharma [email protected] Chemicals, Agriculture [email protected]
Thilo Kleibauer +49 40 309537-257 Marc-René Tonn +49 40 309537-259 Retail, Consumer Goods [email protected] Automobiles, Car Suppliers [email protected]
Torsten Klingner +49 40 309537-260 Björn Voss +49 40 309537-254 Real Estate [email protected] Steel, Car Suppliers [email protected]
Eggert Kuls +49 40 309537-256 Andreas Wolf +49 40 309537-140 Engineering [email protected] Software, IT [email protected]
Frank Laser +49 40 309537-235 Stephan Wulf +49 40 309537-150 Construction, Industrials [email protected] Utilities [email protected]
Andreas Pläsier +49 40 309537-246 Banks, Financial Services [email protected]
SALES SALES TRADING Holger Nass +49 40 3282-2669 Oliver Merckel +49 40 3282-2634 Head of Equity Sales, USA [email protected] Head of Sales Trading [email protected]
Klaus Schilling +49 40 3282-2664 Gudrun Bolsen +49 40 3282-2679 Dep. Head of Equity Sales, GER [email protected] Sales Trading [email protected]
Christian Alisch +49 40 3282-2667 Bastian Quast +49 40 3282-2701 Scandinavia, Spain [email protected] Sales Trading [email protected]
Tim Beckmann +49 40 3282-2665 Patrick Schepelmann +49 40 3282-2700 United Kingdom [email protected] Sales Trading [email protected]
Matthias Fritsch +49 40 3282-2696 Thekla Struve +49 40 3282-2668 United Kingdom [email protected] Sales Trading [email protected]
Marie-Therese Grübner +49 40 3282-2630 Jörg Treptow +49 40 3262-2658 France [email protected] Sales Trading [email protected]
Michael Kriszun +49 40 3282-2695 United Kingdom [email protected] Support Marc Niemann +49 40 3282-2660 Katharina Bruns +49 40 3282-2694 Germany [email protected] Roadshow/Marketing [email protected]
Dirk Rosenfelder +49 40 3282-2692 Austria, Switzerland [email protected]
Philipp Stumpfegger +49 40 3282-2635 Australia, United Kingdom [email protected]
MACRO RESEARCH
Carsten Klude +49 40 3282-2572 Macro Research [email protected]
Matthias Thiel +49 40 3282-2401 Macro Research [email protected]
Dr. Christian Jasperneite +49 40 3282-2439 Investment Strategy [email protected]
Our research can be found under: Warburg Research research.mmwarburg.com/en/index.html Thomson www.thomson.com Bloomberg MMWA GO Reuters www.knowledge.reuters.com FactSet www.factset.com Capital IQ www.capitaliq.com For access please contact:
Andrea Schaper +49 40 3282-2632 Kerstin Muthig +49 40 3282-2703 Sales Assistance [email protected] Sales Assistance [email protected]


![Analytical Formulation for Strength Prediction of ... · Vol. 9 [ Hrsg.] RUAG Schweiz AG RUAG Space. Composites World. [Article]. s.l., Germany : Gardner Business Media, 09 2015](https://img.pdfslide.us/doc/110x75/5eaa33c8d2e6714238217db9/analytical-formulation-for-strength-prediction-of-vol-9-hrsg-ruag-schweiz.jpg)