Embed Size (px)
Citation preview

Particle Sensor for Diesel Combustion Monitoring
David Kittelson,1 Hongbin Ma,1 Michael Rhodes,2 and Brian Krafthefer2
1University of MinnesotaCenter for Diesel ResearchDepartment of Mechanical Engineering111 Church St SEMPLS, MN 55455, USAE-mail: [email protected]
2Honeywell International ACS Advanced Technology Laboratories3660 Technology DriveMinneapolis, MN 55418
This program is supported under DOE Cooperative Agreement DE-FC04-02AL67636Honeywell, prime contractor, University of Minnesota, subcontractor.
PM Sensor Program PhilosophyGoal: To develop a particulate matter sensor for use in diesel engine
applications that is low cost, robust to harsh environments, and manufacturable in high volume.
Application: The sensor would be used for engine monitoring and control applications as opposed to highly accurate laboratory measurements.
Approach: IMAGE CHARGE Monitoring
Teaming: DOE funded contract with Honeywell Laboratories in collaborationwith the University of Minnesota Diesel Engines Laboratory.
Instrument Grade PM Sensing System PM Sensor
Use Measurements of particle count and size distribution
Act as a control signal to an ECU
Accuracy High Low
Environmental Lab use only High Temp / High Vibration / Very Dirty Environment
Manufacturability Low Volume High VolumeCost Thousands of Dollars Low Cost

Technical Approach and Rational• IMAGE CHARGE MONITORING has been our
primary focus for reasons of– expected probe (electrode) simplicity.– expected probe ruggedness.– electronics simplicity.– expected speed of response.– expected background effects.
• It has demonstrated a very good response– well defined signals.– very fast response.– reproducible (much more so than the
engine itself).– applicable across multiple engine sizes
and types.
• The probe has demonstrated very good life in harsh, high temperature, particulate-filled environments.
Probe
Interface Electronics

Basic sensor response characteristics
• We see large signal pulses from each cylinder• Large cycle to cycle and cylinder to cylinder differences
– Are they related to actual particle concentrations?– Correlation with fast optical scattering

Sensor resolves soot pulses from each cylinderOlder Deere 4045T engine, rotary pump, cylinder to cylinder, cycle to cycle differences.Are these signals soot related or a measurement artifact?
Correlation to Optical Scattering
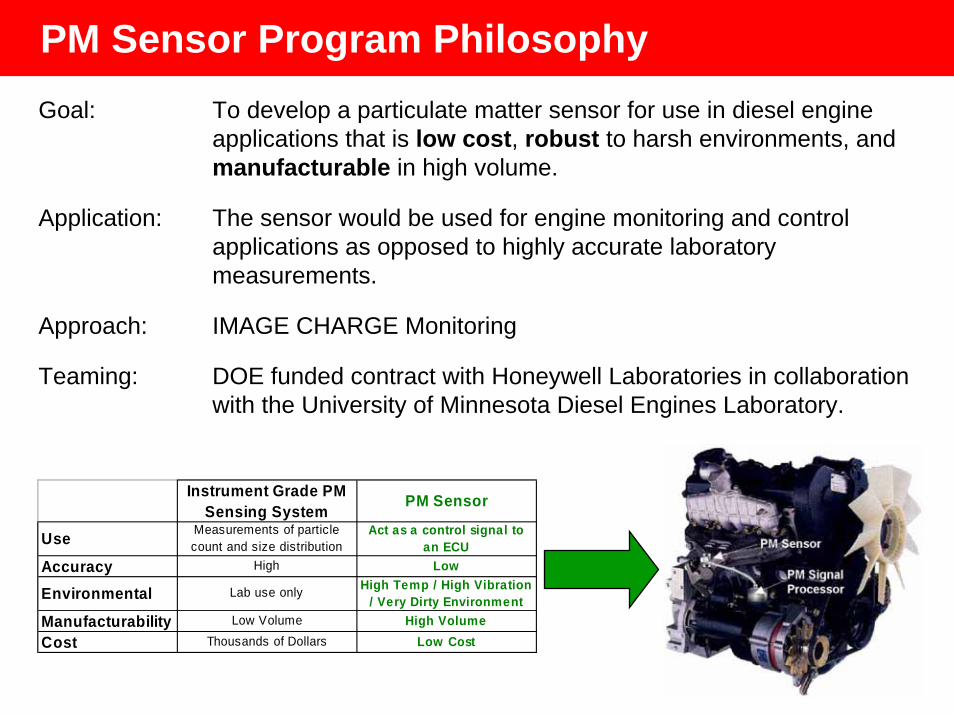
• The sensor detects pulses from each exhaust stroke – an optical system was built to see if they were particle related.
• A rapid optical scattering device was fabricated to relate instantaneous particle concentration to our sensor signal.
• Source and receiver electronics and mechanics were designed and fabricated in Honeywell Labs.
• Source and receiver were mounted orthogonal to one another with the scattering volume centered on the pipe.
• The sensor probe was placed directly in the scattering volume.
• Quartz rods were used as light pipes to bring the light into and out of the exhaust.
• The rods also acted as thermal isolations between the hot exhaust pipe and the emitter and detector electronics.

Correlation to Optical Scattering
Data was taken on a John Deere 4045T Engine at 1400 rpm and 90% load.
• No attempts we made to keep the rods clean over the duration of the tests.
• Approximately 10 seconds of data could be collected before fouling of the optical windows caused a significant baseline shift in the optical signal.
• The optical signal shows a very strong correlation to the charge-based particulate signal, with a correlation R2 = 0.6902.
• Similar experiments correlating the charge-based particulate sensor to a Kistler piezoelectric pressure sensor placed in the same location showed no discernable correlation.
Relating sensor response to other instruments
• Signal processing• Response to accumulation mode or soot mode• Soot mode and aethalometer response – black carbon• Sensor response vs. black carbon• Transient sensor and black carbon response
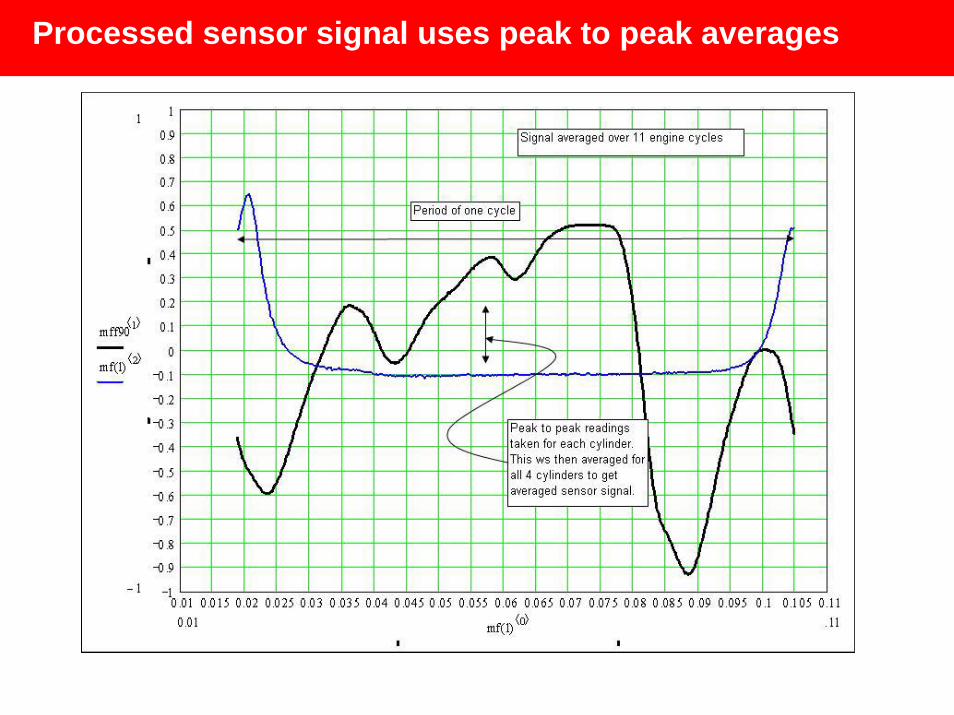
Processed sensor signal uses peak to peak averages

Typical size distributions – the sensor responds to the accumulation (or soot) mode
1.0E+05
1.0E+06
1.0E+07
1.0E+08
1.0E+09
1 10 100 1000Diameter (nm)
dN/d
log(
Dp)
(par
t./cm
3 )
Nuclei modes
Accumulation modes10% load
50% load
75% load
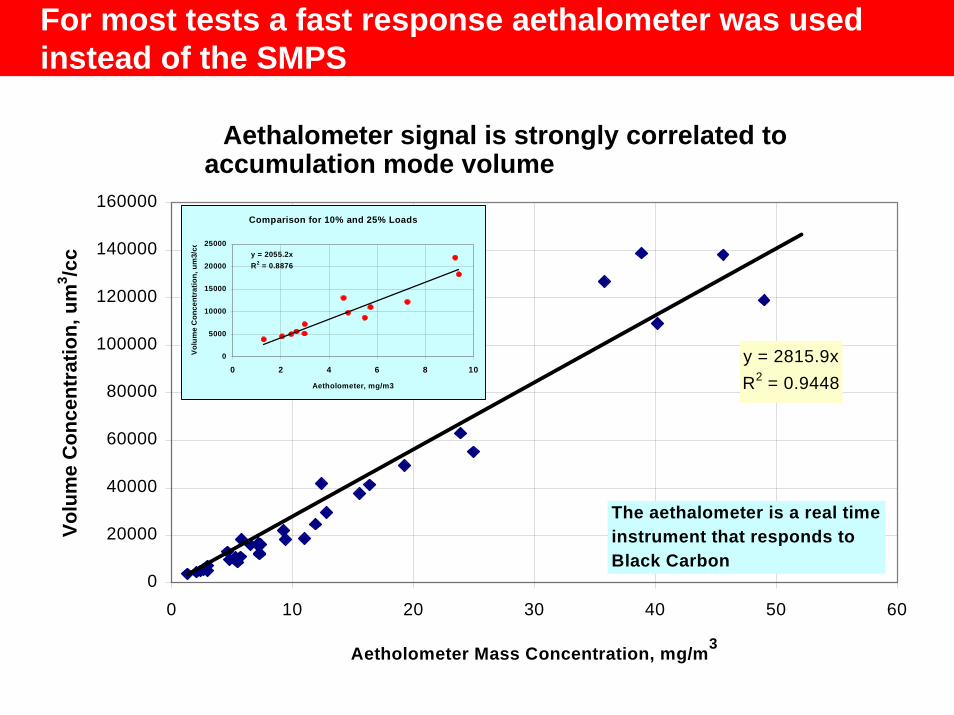
For most tests a fast response aethalometer was used instead of the SMPS
Comparison of Aetholometer and SMPS
y = 2815.9xR2 = 0.9448
0
20000
40000
60000
80000
100000
120000
140000
160000
0 10 20 30 40 50 60
Aetholometer Mass Concentration, mg/m3
Volu
me
Con
cent
ratio
n, u
m3 /c
c
The aethalometer is a real time instrument that responds to Black Carbon
Comparison for 10% and 25% Loads
y = 2055.2xR2 = 0.8876
0
5000
10000
15000
20000
25000
0 2 4 6 8 10
Aetholometer, mg/m3
Volu
me
Con
cent
ratio
n, u
m3/
cc
Aethalometer signal is strongly correlated to accumulation mode volume
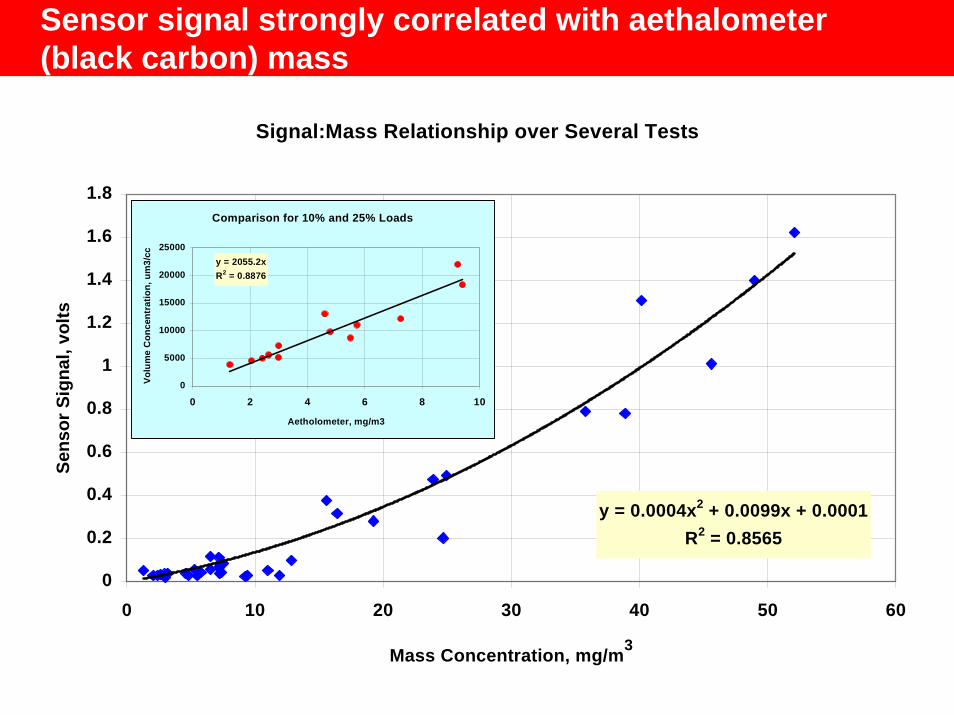
Sensor signal strongly correlated with aethalometer (black carbon) mass
Signal:Mass Relationship over Several Tests
y = 0.0004x2 + 0.0099x + 0.0001R2 = 0.8565
0
0.2
0.4
0.6
0.8
1
1.2
1.4
1.6
1.8
0 10 20 30 40 50 60
Mass Concentration, mg/m3
Sens
or S
igna
l, vo
lts
Comparison for 10% and 25% Loads
y = 2055.2xR2 = 0.8876
0
5000
10000
15000
20000
25000
0 2 4 6 8 10
Aetholometer, mg/m3
Volu
me
Con
cent
ratio
n, u
m3/
cc

Raw sensor response to step change in load

Sensor and aethalometer response to step change in load – and soot emissions
Sensor signal drops nearly instantaneously as load drops –aethalometer lags behind but eventually tracks sensor

Response to modern engines
• Euro IV VW TDI – Influence of load (EGR) on cylinder to cylinder soot differences
• Euro IV VW TDI – Sensor response up and downstream of catalytic converter
• Caterpillar C12 – Sensor response upstream and downstream of CRT

Sensor shows poor cylinder to cylinder distribution due to (EGR) – Euro IV VW TDI
50% load high EGR one cylindershows much higher soot90% load low EGR all four
cylinders produce equal soot
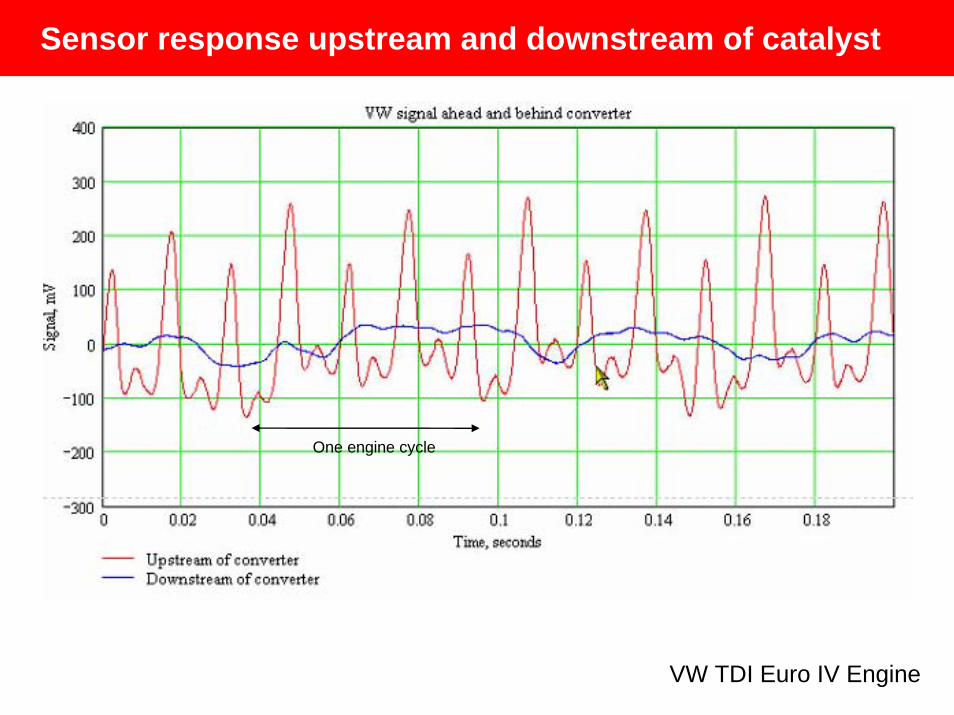
Sensor response upstream and downstream of catalyst
One engine cycle
VW TDI Euro IV Engine
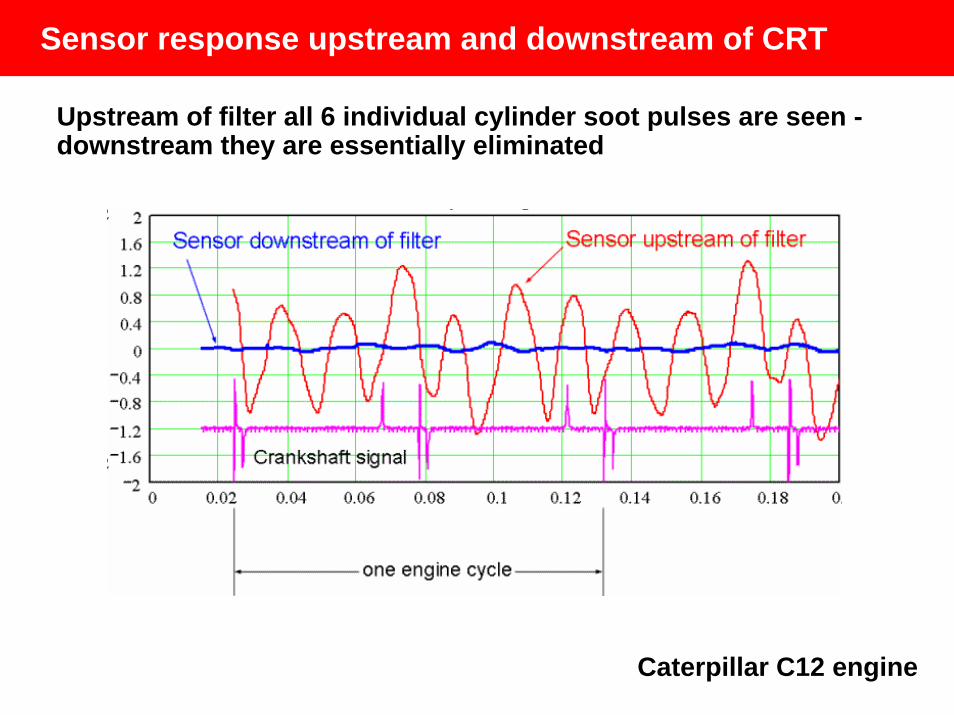
Sensor response upstream and downstream of CRT
Upstream of filter all 6 individual cylinder soot pulses are seen -downstream they are essentially eliminated
Caterpillar C12 engine
Conclusions
• A low cost Diesel particle sensor has been developed• Its response is strongly correlated to instantaneous black carbon
(BC) mass concentration in the exhaust• Its response time is adequate to detect BC from individual
cylinders– The sensor can detect imbalanced injection– It can also detect EGR maldistribution
• Using a very simple signal processing approach its sensitivity is better than 1 mg m-3
– This is more than sufficient to monitor engine out emissions from modern low emission engines like a Cat C12 and a Euro IV VW TDI
– No signal is detected downstream of a CRT on a Cat C12• Sensors have been operated for several hundred hours with little
signal loss