Embed Size (px)
Citation preview
Particle Number Counter Calibration Procedures
Report to the Department for Transport Restricted Commercial ED47382004/PNC Issue Number Issue 5 December 2007

Restricted – Commercial PNC Calibration Procedures AEA/ED47382004/PNC/Issue 5 Title Particle Number Counter Calibration Procedures
Customer Department for Transport Customer reference Contract No. PRO 4/9/4 Confidentiality, copyright and reproduction
This report is the Copyright of Department of Transport and has been prepared by AEA Technology plc under contract to Department for Transport dated 7 August 2006. The contents of this report may not be reproduced in whole or in part, nor passed to any organisation or person without the specific prior written permission of Department for Transport. AEA Technology plc accepts no liability whatsoever to any third party for any loss or damage arising from any interpretation or use of the information contained in this report, or reliance on any views expressed therein
Reference number ED47382004/PNC- Issue 5 AEA Energy & Environment
Building 551.11 Harwell International Business Centre Didcot OX11 0QJ t: +44 (0)870 190 6526 f: +44 (0)870 190 6608 AEA Energy & Environment is a business name of AEA Technology plc AEA Energy & Environment is certificated to ISO9001
and ISO14001 Author Name Ian Marshall Approved by Name Emma Sandbach Signature Date December 2007
AEA Energy & Environment iii

PNC Calibration Procedures Restricted – Commercial AEA/ED47382004/PNC/Issue 5
iv AEA Energy & Environment
Restricted – Commercial PNC Calibration Procedures AEA/ED47382004/PNC/Issue 5
Table of contents
1 Introduction 1
2 Principle of Operation 2
3 Draft Regulation No. 83 Requirements 3 3.1 PNC 3 3.2 PNC Calibration 3
4 Calibration Methods 5 4.1 Primary Method 6 4.2 Secondary Method 13 4.3 Lower Cut-Off Diameter Performance Check 16 4.4 Equipment Summary 17
5 References 19
6 Annex 1 21 6.1 Emery Oil Specification 21
7 Annex 2 22 7.1 Secondary Calibration Method Example 22
AEA Energy & Environment v

PNC Calibration Procedures Restricted – Commercial AEA/ED47382004/PNC/Issue 5
vi AEA Energy & Environment
Restricted – Commercial PNC Calibration Procedures AEA/ED47382004/PNC/Issue 5
1 Introduction Condensation of supersaturated vapors has been used for more than a century to grow small aerosol
particles to sizes that can be detected optically. Instruments that use condensation to detect particles
can be divided into two categories:
• Expansion-type instruments (including the “Aitken” dust counters and the “Pollak”
photoelectric nucleus counters).
• Steady-flow condensation particle number counters (PNC).
The second category of instruments can be further subdivided according to the approach used to
produce the saturated vapour:
• Forced convection heat transfer
• Mixing warm and cool vapour streams, or mixing two vapours that subsequently undergo
multi-component condensation
• Segmented thermal diffusion
The majority of modern condensation PNCs are of the forced convection heat transfer type and only
this type of PNC will be considered here. Further information on the historical development and
performance of all types of condensation PNC can be found in the review produced by McMurry
(2000)1.
AEA Energy & Environment 1

PNC Calibration Procedures Restricted – Commercial AEA/ED47382004/PNC/Issue 5
2 Principle of Operation On entering the condensation PNC, particles pass through a saturator where the working fluid
evaporates into the gas stream. The flow becomes saturated with vapour of the working fluid before
passing into a condenser where supersaturation of the vapour occurs. Under this condition the vapour
condenses onto the particles to form droplets larger in diameter than the original particles. The
droplets pass through a laser on leaving the condenser, and light scattered by the droplets is collected
and focused onto a photodetector. The photodetector converts the light signal to an electrical pulse
that is recorded as a particle count.
The optimal working fluid for an instrument of this type requires a vapour pressure at typical ambient
temperature (25 – 30°C) that is large enough to grow particles in the condenser to a size that can
easily be detected optically (0.5 – 15 µm), yet not so large that particles would be lost by
sedimentation or impaction. Vapour diffusivity, which determines the rate of vapour depletion to the
condenser walls, is also an important consideration. It is desirable to choose a working fluid having a
small diffusivity in air, thereby ensuring that particles are exposed to elevated supersaturation as long
as possible during flow through the condenser.
The first commercially produced forced convection heat transfer PNC was developed by Agarwal and
Sem (1980)2. This instrument operated in two modes: single-particle counting mode for
concentrations below ~1000 cm-3 and “photometric” mode for concentrations higher than this. The
single particle counting mode involved the detection of forward-scattered white light from a halogen
lamp. The photometric mode involved measurement of the d.c. level of light scattered by the aerosol
cloud at the exit of the condenser. While the single-particle count mode was considered to provide an
absolute measurement of concentration, the photometric mode required an empirical calibration.
Butanol was selected as the working fluid because it was found to absorb water more slowly than
isopropanol, which was used initially. Absorbed water led to a decrease in the amount of alcohol
vapor added to the aerosol, and therefore affected the instrument response.
A number of refinements in the design of continuous flow condensation PNCs have been reported
since (e.g. Wilson et al. (1983a3, 1983b4), Stolzenburg and McMurry (1991)5).
2 AEA Energy & Environment
Restricted – Commercial PNC Calibration Procedures AEA/ED47382004/PNC/Issue 5
3 Draft Regulation No. 83 Requirements
3.1 PNC The specific requirements for the particle number measurement device (PNC) are listed in Section
1.3.4 of ‘Proposal for draft supplement 7 to the 05 series of amendments to Regulation No.83’6, and
are reproduced here:
1.3.4. The PNC shall: 1.3.4.1. Operate under full flow operating conditions. 1.3.4.2. Have a counting accuracy of +/- 10 per cent across the range 1 cm-3 to the upper
threshold of the single particle count mode of the PNC against a traceable standard. At concentrations below 100cm-3 measurements averaged over extended sampling periods may be required to demonstrate the accuracy of the PNC with a high degree of statistical confidence.
1.3.4.3. Have a readability of at least 0.1 particles cm-3 at concentrations below 100cm-3. 1.3.4.4. Have a linear response to particle concentrations over the full measurement range in
single particle count mode. 1.3.4.5. Have a data reporting frequency equal to or greater than 0.5 Hz. 1.3.4.6. Have a T90 response time over the measured concentration range of less than 5 s. 1.3.4.7. Incorporate a coincidence correction function up to a maximum 10 per cent
correction, and may make use of an internal calibration factor as determined in paragraph 2.1.3, but shall not make use of any other algorithm to correct for or define the counting efficiency.
1.3.4.8. Have counting efficiencies at particle sizes of 23nm (+/-1nm) and 41nm (+/-1nm)
electrical mobility diameter of 50% (+/-12%) and >90% respectively. These counting efficiencies may be achieved by internal (for example; control of instrument design) or external (for example; size pre-classification) means.
1.3.4.9. If the PNC makes use of a working liquid, it shall be replaced at the frequency
specified by the instrument manufacturer. 1.3.5 The sum of the residence time of the PTS, VPR and OT plus the T90 response time
of the PNC shall be no greater than 20 s.
3.2 PNC Calibration The specific requirements for the calibration of the particle number measurement device (PNC) are
listed in Section 2.1 of ‘Proposal for draft supplement 7 to the 05 series of amendments to Regulation
No.83’6, and are reproduced here:
AEA Energy & Environment 3
PNC Calibration Procedures Restricted – Commercial AEA/ED47382004/PNC/Issue 5
2.1. Calibration of the Particle Number Counter 2.1.1. The Technical Service shall ensure the existence of a calibration certificate for the PNC
demonstrating compliance with a traceable standard within a 12 month period prior to the emissions test.
2.1.2 The PNC shall also be recalibrated and a new calibration certificate issued
following any major maintenance. 2.1.3. Calibration shall be traceable to a standard calibration method: (i) by comparison of the response of the PNC under calibration with that of a
calibrated aerosol electrometer when simultaneously sampling electrostatically classified calibration particles, or
(ii) by comparison of the response of the PNC under calibration with that of a second PNC which has been directly calibrated by the above method.
In the electrometer case, calibration shall be undertaken using at least six standard concentrations spaced as uniformly as possible across the PNC’s measurement range. These points will include a nominal zero concentration point produced by attaching HEPA filters of at least class H13 of EN 1822:1998 to the inlet of each instrument. With no calibration factor applied to the PNC under calibration, measured concentrations shall be within ± 10 per cent of the standard concentration for each concentration used, with the exception of the zero point, otherwise the PNC under calibration shall be rejected. The gradient from a linear regression of the two data sets shall be calculated and recorded. A calibration factor equal to the reciprocal of the gradient shall be applied to the PNC under calibration. Linearity of response is calculated as the square of the Pearson product moment correlation coefficient (R2) of the two data sets and shall be equal to or greater than 0.97. In calculating both the gradient and R2 the linear regression shall be forced through the origin (zero concentration on both instruments).
In the reference PNC case, calibration shall be undertaken using at least six standard concentrations across the PNC’s measurement range. At least 3 points shall be at concentrations below 1000cm-3 , the remaining concentrations shall be linearly spaced between 1000cm-3 and the maximum of the PNC’s range in single particle count mode. These points will include a nominal zero concentration point produced by attaching HEPA filters of at least class H13 of EN 1822:1998 to the inlet of each instrument. With no calibration factor applied to the PNC under calibration, measured concentrations shall be within ± 10 per cent of the standard concentration for each concentration, with the exception of the zero point, otherwise the PNC under calibration shall be rejected. The gradient from a linear regression of the two data sets shall be calculated and recorded. A calibration factor equal to the reciprocal of the gradient shall be applied to the PNC under calibration. Linearity of response is calculated as the square of the Pearson product moment correlation coefficient (R2) of the two data sets and shall be equal to or greater than 0.97. In calculating both the gradient and R2 the linear regression shall be forced through the origin (zero concentration on both instruments).
2.1.4 Calibration shall also include a check, against the requirements in section 1.3.4.8,
on the PNC’s detection efficiency with particles of 23nm electrical mobility diameter. A check of the counting efficiency with 41nm particles is not required.
4 AEA Energy & Environment
Restricted – Commercial PNC Calibration Procedures AEA/ED47382004/PNC/Issue 5
4 Calibration Methods The following general points are brought to the attention of the reader:
1. Any PNC used as the reference PNC in the secondary method will have been calibrated by
the primary method, i.e. a calibration factor will have been derived from the aerosol
electrometer comparison and applied to subsequent data measured by the reference PNC.
2. Principles of good laboratory practice should be adopted when using any of the methods
described below. In particular, users should ensure that any piece of ancillary equipment that
is critical to the calibration is itself appropriately calibrated before use.
3. The calibration of the electrostatic classifier and the aerosol electrometer are of particular
relevance to these methods. Electrostatic classifier calibration is specified in the forthcoming
international standard “Determination of particle size distribution — differential electrical
mobility analysis for aerosol particles”. This document, ISO/159007, has been approved for
registration as a Draft International Standard with a target publication date of August 2008.
Copies of this Draft for Public Comment can be purchased from national standard
organizations. Aerosol electrometer calibration is also partially covered within this document
under an Informative Annex: “Particle detectors”. However, a new ISO work item “Validation
and Calibration of Aerosol Particle Number Counters” is underway which will separately
specify calibration requirements for aerosol particle number counters (see Section 4.1.3). In
the absence of either of these documents being formally available, the approach adopted by
Liu et al. (2005)8 provides an excellent model to follow.
4. The methods rely upon comparing the response of two pieces of aerosol measurement
instrumentation to a common test aerosol. One piece of equipment acts as the reference,
while the other is the instrument under calibration. The user must ensure that the test aerosol
pathway to each instrument is configured so that any particle deposition that may occur
between particle source and instrument is comparable for both instruments. This is usually
achieved by ensuring residence time is comparable in both pathways. Residence time must
be adjusted by varying the length rather than diameter of the pathway, as diffusional
deposition is independent of tube diameter for a given volumetric flow rate. In addition, the
pathways should be as short as reasonably practicable in order to minimize agglomeration at
high concentrations. The equivalence of both pathways should be checked when using PNCs
of equivalent inlet flow rate by exchanging the pathways between the PNCs while sampling a
stable aerosol source of concentration in excess of 1,000 cm-3. The pathways are considered
equivalent if the change in measured concentration is ≤ 3 %.
AEA Energy & Environment 5
PNC Calibration Procedures Restricted – Commercial AEA/ED47382004/PNC/Issue 5
5. Conductive tubing should be used for all pathways carrying particles. A flow splitter installed
where the test aerosol is divided for delivery to each instrument would also be beneficial.
6. The PMP specification for the particle number counter excludes those with automatic data
manipulation functions other than internal application of calibration factors determined
according to the procedures in this document. However, “coincidence correction” is required
and should be applied to all PNC-measured data using the formula specified by the PNC
manufacturer, subject to a maximum permissible correction of 10%.
7. References to particle diameters throughout the remainder of the document are electrical
mobility diameters unless otherwise stated.
4.1 Primary Method
4.1.1 Background
The current calibration method for condensation PNCs is based on the method developed by Liu and
Pui (1974)9. An electrostatic classifier is used to deliver singly charged, monodisperse test aerosols of
known size and composition. An aerosol electrometer and the PNC under test sample this aerosol in
parallel downstream of the classifier. The concentration is obtained from the aerosol electrometer
current.
This approach has been adopted as standard in many laboratories (e.g. Liu et al. (1975)10, Liu and
Kim (1977)11, Agarwal and Sem (1980)2, Marshall and Dickens (2000)12) and in numerous
intercomparison workshops (e.g., Liu et al. (1982)13, Bartz et al. (1985)14, Wiedensohler et al.
(1997)15).
This is the method used by most condensation PNC manufacturers to determine PNC performance,
including lower size detection limit, counting efficiency and linearity of response.
Two potential complications with this method have been mooted:
• multiply charged particles having the same mobility as the desired singly charged particles
may be included within the aerosol leaving the electrostatic classifier, leading to a more
complicated relationship between current and concentration, and
• the detection limit of the aerosol electrometer limits the concentrations at which the calibration
can be performed to those greater than ~103 particles cm-3.
6 AEA Energy & Environment

Restricted – Commercial PNC Calibration Procedures AEA/ED47382004/PNC/Issue 5
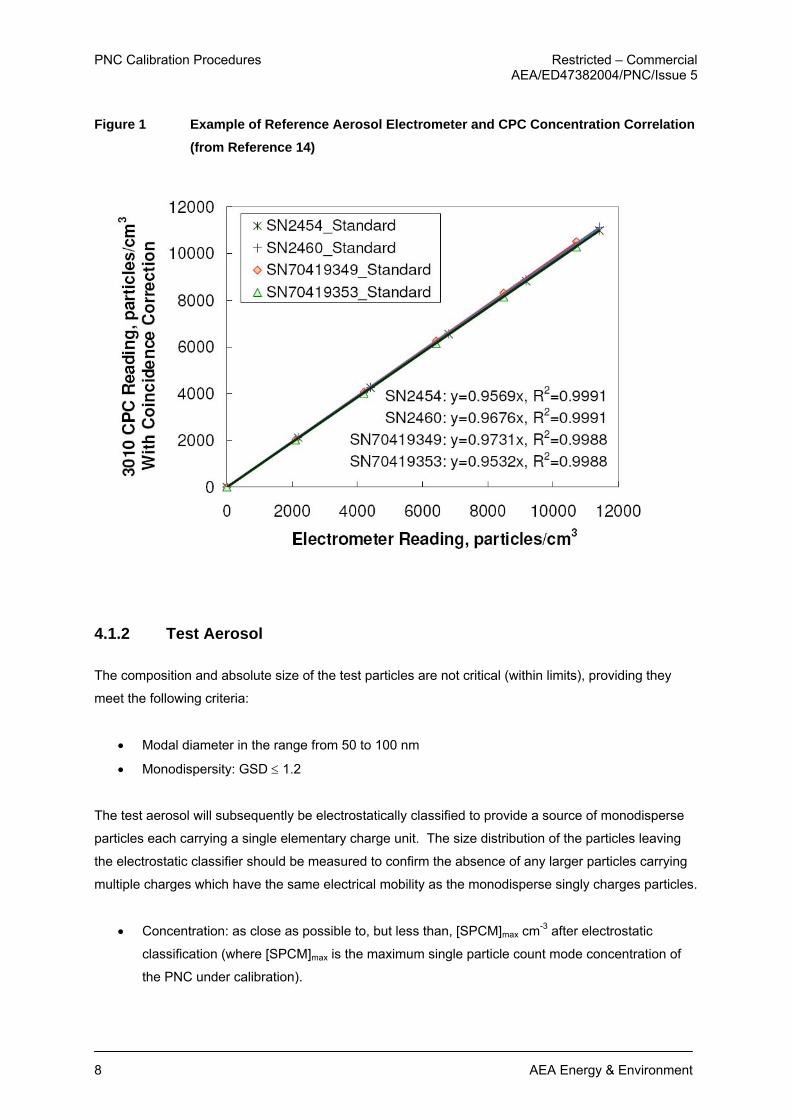
These issues have been addressed by Liu et al. (2005)8. They generated a quasi-monodisperse test
aerosol by electrospraying emery oil and measured the size distribution after electrostatic classification
to confirm the absence of any larger multiply charged particles. Emery oil (Emery 3004 or PAO 4 cSt)
is a highly branched isoparaffinic polyalphaolefin (1-decene (tetramer) mixed with 1-decene (trimer),
hydrogenated), see Annex 1. It provides a source of quasi-monodisperse spherical particles of
chemical composition representative of synthetic lube oil particles. Thereafter they compared four TSI
Model 3010 PNCs against a reference aerosol electrometer over a concentration range from 2,000 to
11,000 particles cm-3. A further data point was recorded for each comparison at a particle
concentration of zero. Excellent agreement was achieved between concentrations measured by the
PNCs and the aerosol electrometer, with correlation plots yielding gradients in the range from 0.953 to
0.973 and correlation coefficients greater than 0.998. Figure 1 is an example of such a correlation
plot. Thus, with correlation plot gradients close to unity, correlation coefficients greater than 0.998 and
good agreement at zero particle concentration, it is unnecessary to undertake comparison
measurements at particle concentrations less than ~1,000 particle cm-3, below the detection limit of the
reference aerosol electrometer. There is no plausible reason why PNC performance should be any
different between zero and ~ 1,000 cm-3 than it is above 1,000 cm-3. Liu et al. also undertook an
analysis of the traceability of critical parameters affecting the performance of the reference aerosol
electrometer, viz. flow rate, charge per particle and electrometer current.
Sakurai et al. (2005)16 describe the adoption of a very similar method using a reference aerosol
electrometer as the national Japanese standard against which PNCs are compared.
AEA Energy & Environment 7
PNC Calibration Procedures Restricted – Commercial AEA/ED47382004/PNC/Issue 5
Figure 1 Example of Reference Aerosol Electrometer and CPC Concentration Correlation (from Reference 14)
4.1.2 Test Aerosol
The composition and absolute size of the test particles are not critical (within limits), providing they
meet the following criteria:
• Modal diameter in the range from 50 to 100 nm
• Monodispersity: GSD ≤ 1.2
The test aerosol will subsequently be electrostatically classified to provide a source of monodisperse
particles each carrying a single elementary charge unit. The size distribution of the particles leaving
the electrostatic classifier should be measured to confirm the absence of any larger particles carrying
multiple charges which have the same electrical mobility as the monodisperse singly charges particles.
• Concentration: as close as possible to, but less than, [SPCM]max cm-3 after electrostatic
classification (where [SPCM]max is the maximum single particle count mode concentration of
the PNC under calibration).
8 AEA Energy & Environment

Restricted – Commercial PNC Calibration Procedures AEA/ED47382004/PNC/Issue 5
4.1.3 Procedure
The procedure for performing a PNC calibration against an aerosol electrometer according to the
primary calibration method is described below.
Prepare the PNCs for use:
• Position the PNC as illustrated in Figure 2, but do not connect it to the remainder of the
apparatus
• Switch on, fill with working fluid to the specified level (observe manufacturer’s precautions
regarding moving the unit when full) and allow the saturator and condenser to reach their
specified temperatures
• Apply an external vacuum source if the PNC is not fitted with an internal pump
• Do not proceed unless all indicators show correct instrument status (e.g. temperature, liquid
level, temperature, laser intensity etc.).
• Check the inlet flow rate with an appropriate calibrated flow meter (low pressure drop variety
recommended, e.g. bubble flow meter). The measured flow should be within ± 5 % of the
nominal value for the model of PNC under test.
• Check that zero concentration is reported when a HEPA filter is attached to the inlet. If
concentrations higher than 0.2 cm-3 are reported check for, and correct, any leaks in the
connection between the HEPA filter and PNC. The PNC requires attention from the
manufacturer if concentrations greater than 0.2 cm-3 are reported after any leaks are
eliminated.
Prepare the aerosol electrometer for use:
• Position the aerosol electrometer as illustrated in Figure 2, but do not connect to the
remainder of the apparatus
• Switch on and allow to warm up for the period recommended by the manufacturer
• Apply an external vacuum source if the aerosol electrometer is not fitted with an internal pump
• Configure the aerosol electrometer as appropriate (e.g. set inlet flow rate, average charge per
particle and data average time)
• Check the inlet flow rate with an appropriate calibrated flow meter (low pressure drop variety
recommended, e.g. bubble flow meter). The measured flow should be within ± 5 % of the
nominal value for the model of PNC under test
• Reset zero offset (background current) with a HEPA filter connected to the inlet
AEA Energy & Environment 9
PNC Calibration Procedures Restricted – Commercial AEA/ED47382004/PNC/Issue 5
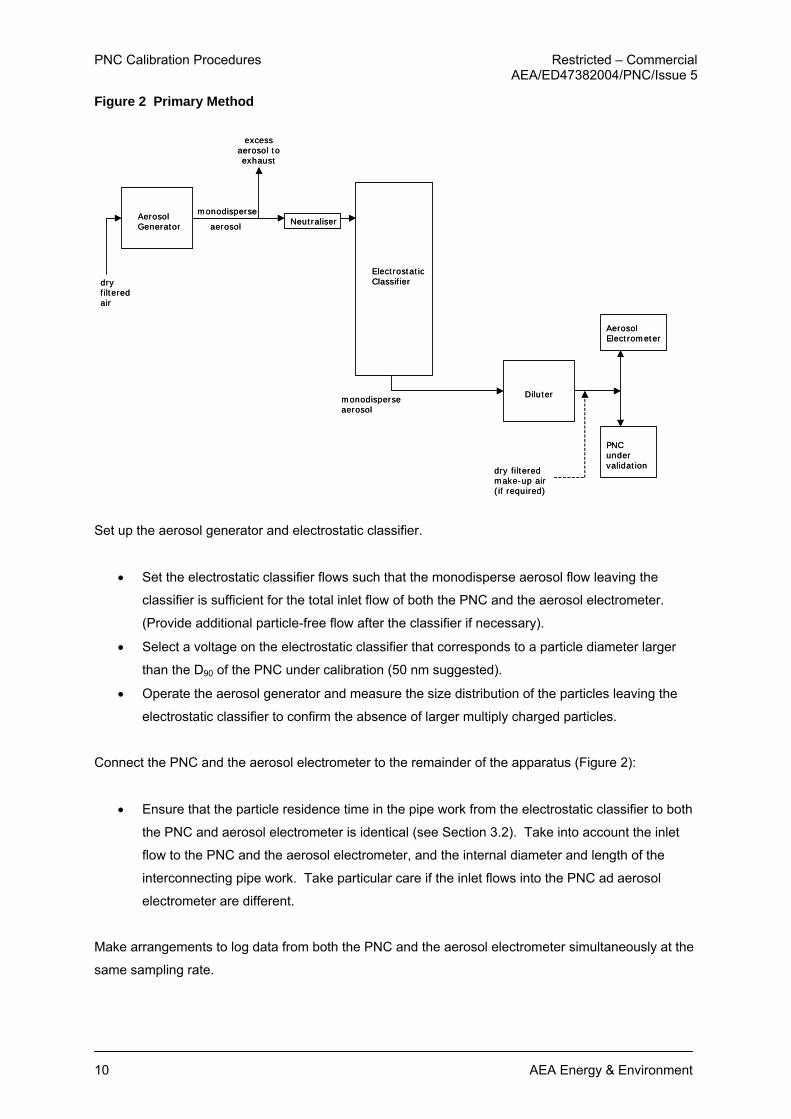
Figure 2 Primary Method
ElectrostaticClassifier
monodisperse
aerosol
excess aerosol to exhaust
Neutraliser
Diluter
AerosolGenerator
AerosolElectrometer
PNCundervalidation
dry filteredmake-up air(if required)
monodisperseaerosol
dryfilteredair
ElectrostaticClassifier
monodisperse
aerosol
excess aerosol to exhaust
Neutraliser
Diluter
AerosolGenerator
AerosolElectrometer
PNCundervalidation
dry filteredmake-up air(if required)
monodisperseaerosol
dryfilteredair
Set up the aerosol generator and electrostatic classifier.
• Set the electrostatic classifier flows such that the monodisperse aerosol flow leaving the
classifier is sufficient for the total inlet flow of both the PNC and the aerosol electrometer.
(Provide additional particle-free flow after the classifier if necessary).
• Select a voltage on the electrostatic classifier that corresponds to a particle diameter larger
than the D90 of the PNC under calibration (50 nm suggested).
• Operate the aerosol generator and measure the size distribution of the particles leaving the
electrostatic classifier to confirm the absence of larger multiply charged particles.
Connect the PNC and the aerosol electrometer to the remainder of the apparatus (Figure 2):
• Ensure that the particle residence time in the pipe work from the electrostatic classifier to both
the PNC and aerosol electrometer is identical (see Section 3.2). Take into account the inlet
flow to the PNC and the aerosol electrometer, and the internal diameter and length of the
interconnecting pipe work. Take particular care if the inlet flows into the PNC ad aerosol
electrometer are different.
Make arrangements to log data from both the PNC and the aerosol electrometer simultaneously at the
same sampling rate.
10 AEA Energy & Environment
Restricted – Commercial PNC Calibration Procedures AEA/ED47382004/PNC/Issue 5
Set the electrostatic classifier voltage to zero volts and begin logging data. Both the PNC and aerosol
electrometer should report “zero” particle concentrations (≤ 0.2 cm-3), having already been checked
with a HEPA-filtered inlet. If either the PNC or aerosol electrometer reports a non-zero concentration,
check the apparatus for leaks. It is important that leaks are eliminated. Any particles leaking into the
system downstream of the classifier may be of a size smaller than the D90 of the PNC under
calibration, which will invalidate the comparison.
Generate the test aerosol and select the voltage on the electrostatic classifier corresponding to the
particle diameter of interest, ensuring that it is larger than the D90 of the PNC under calibration (50 nm
suggested). Continue logging data and ensure that the PNC is not reporting a concentration above its
maximum single particle count mode concentration limit. Otherwise adjust the diluter until the reported
concentration is below the maximum concentration limit. Thereafter, adjust the diluter to vary the
concentration delivered to the PNC and aerosol electrometer. Five approximately equally spaced
concentrations between 2,000 and [SPCM]max cm-3 are suggested (where [SPCM]max is the maximum
single particle count mode concentration of the PNC under calibration). Allow the reported
concentration to stabilise at each dilution setting. Repeat the procedure at electrostatic classifier
voltages corresponding to other diameters of interest if necessary.
Analyse the resulting data, including the zero concentration point in the dataset, in terms of the
correlation between the reported concentrations from the PNC (y axis) and the aerosol electrometer (x
axis) to establish the gradient and the linearity (R2 the square of the Pearson product moment
correlation coefficient).
The linearity of response in terms of the R2 coefficient (from a linear least squares fit) must be greater
than 0.97, else the PNC under calibration does not respond linearly over the measured concentration
range. The gradient of the correlation plot must be within the range from 0.90 to 1.10 (unity signifies
complete agreement between the PNC and the aerosol electrometer).
4.1.4 Proposed ISO Method
ISO Technical Committee 24 Sub-Committee 4 has recently proposed a new work item: “Validation
and Calibration of Aerosol Particle Number Counters”. This will provide a procedure for the derivation
and quantification of measurement uncertainty with the aim of realizing internationally recognized
primary particle counters. The accompanying calibration procedure will specify the comparison of a
particle counter with a particle counter that is traceable to a primary particle counter.
The primary particle counter concept was proposed because different counting methods are used to
measure number concentrations (e.g. aerosol electrometer, condensation particle counter, optical
particle counter). The results of the counting methods should agree within the specified uncertainties
AEA Energy & Environment 11

PNC Calibration Procedures Restricted – Commercial AEA/ED47382004/PNC/Issue 5
of the measurements by each method. Each counting method is best suited to specific particle
characteristics as different methods have smaller uncertainties for different particle characteristics.
Each method has its advantages but no single method can be designated as superior. All the
methods must be validated to be established as primary methods in metrological terms. By comparing
each with the other, their uncertainties can be justified and each method can be acknowledged as a
primary method.
The concept is illustrated in Figure 3.
Figure 3 Concept of Particle Number Concentration Standard
Condensation Particle Counter
Optical Particle Counter
10 nm 100 nm 1000 nm
AerosolElectrometer
1 cm-3
10 cm-3
100 cm-3
1000 cm-3
10000 cm-3
1 nm
Part
icle
Con
cent
ratio
n
Particle Size
Condensation Particle Counter
Optical Particle Counter
10 nm 100 nm 1000 nm
AerosolElectrometer
1 cm-3
10 cm-3
100 cm-3
1000 cm-3
10000 cm-3
1 nm
Part
icle
Con
cent
ratio
n
Particle Size
Taking the condensation particle number counter as an example, validation at modest concentrations
is achieved by comparison with the aerosol electrometer, whereas validation at low concentrations is
achieved by comparison with the optical particle counter using larger particles. Validation is achieved
across the whole concentration range by utilizing the method with the better measurement uncertainty
in combination with appropriately sized calibration particles.
ISO members have adopted the proposal as a New Work Item “Validation and calibration of aerosol
particle number counters”. However, at the meeting of ISO/TC24/SC4 in October 2007 it was decided
that there was a more pressing need for a work item solely on the calibration of PNCs against Aerosol
Electrometers. The working group will produce a draft standard in advance of the next meeting in
March 2008 under the title “Calibration of aerosol particle number concentration measuring
instruments: Calibration of condensation particle counters with aerosol Faraday cup electrometers”
with the intention of developing the document to full international standard status in as short a time as
possible.
12 AEA Energy & Environment

Restricted – Commercial PNC Calibration Procedures AEA/ED47382004/PNC/Issue 5
4.2 Secondary Method Any PNC calibrated by the primary method described in Section 4.1 can be utilised as a reference
against which the performance of other PNCs can be compared. It is recommended that the transfer
standard PNC should be of the same make and model as the PNC under calibration. However, any
PNC can be used as long as due regard is given to the D50 and D90 diameters of the respective
models (Dx is the diameter at which the PNC detection efficiency is x %) and to any differences in
maximum single particle count mode concentrations of the respective models.
This approach has been adopted to validate the Golden PNC used in the PMP Light-Duty
Interlaboratory Comparison Exercise. A TSI Model 3010 PNC (S/N: 2005) calibrated by TSI according
to the primary method was used as the reference PNC. This has been included by way of an example
in Annex 2.
4.2.1 Test Aerosol
There are a number of aerosol generation techniques that are capable of producing particles in the
size range between 50 and 100nm diameter including condensation generators, combustion aerosol
generators, electrosprays, nebulisation and hot wires. Examples of these techniques are shown in
References 17 to 20. Any of these methods are suitable for producing test aerosols for this
procedure. The size distribution required depends on which of the secondary methods is employed:
Method A a size distribution in the diameter range from 50 to 100 nm from which monodisperse fractions having
concentrations from 100 to [SPCM]max cm-3 can be delivered after electrostatic classification (where
[SPCM]max is the maximum single particle count mode concentration of the PNC under calibration)
Method B a size distribution from which a monodisperse 50 nm fraction having a minimum concentration of
[SPCM]max cm-3 can be delivered after electrostatic classification (where [SPCM]max is the maximum
single particle count mode concentration of the PNC under calibration).
4.2.2 Procedure
The procedure for performing a PNC calibration against a reference PNC according to the secondary
calibration method is described below.
AEA Energy & Environment 13
PNC Calibration Procedures Restricted – Commercial AEA/ED47382004/PNC/Issue 5
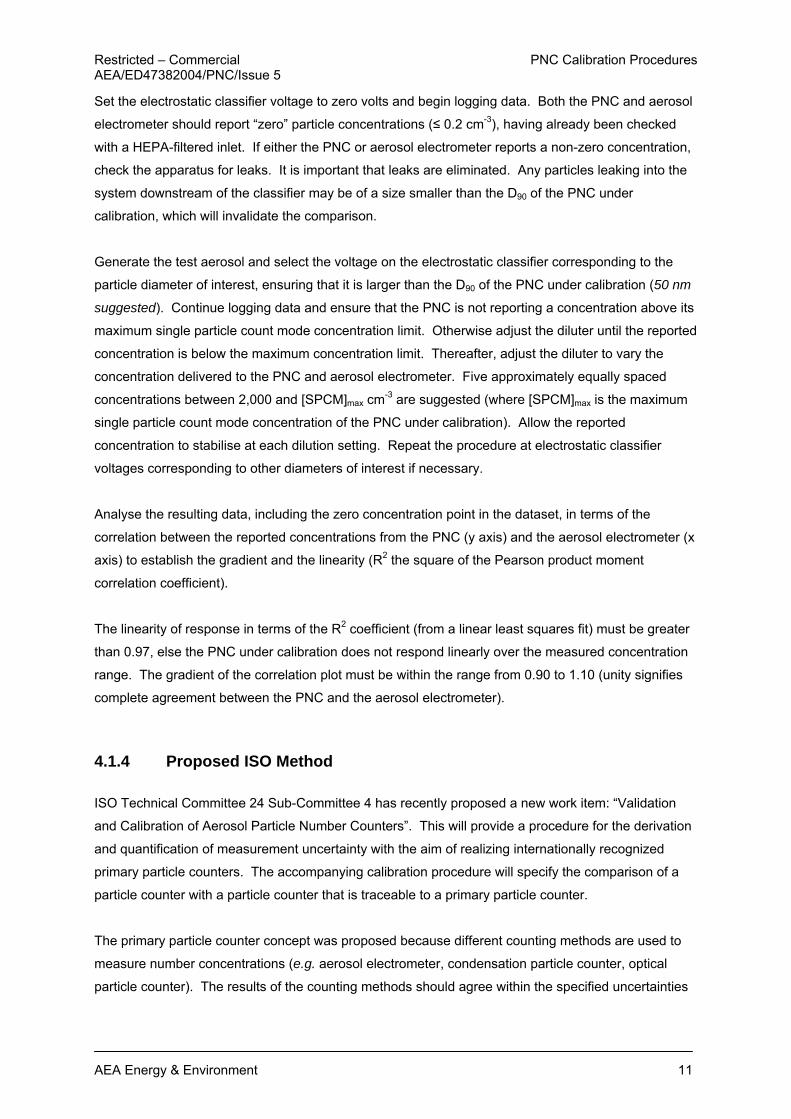
Prepare both PNCs for use:
• Position the PNCs as illustrated in Figure 4, but do not connect them to the electrostatic
classifier.
• Switch on, fill with working fluid to the specified level (observe manufacturer’s precautions
regarding moving the unit when full) and allow the saturator and condenser to reach their
specified temperatures
• Apply an external vacuum source if the PNC is not fitted with an internal pump
• Do not proceed unless all indicators show correct instrument status (e.g. temperature, liquid
level, temperature, laser intensity etc.).
• Check the inlet flow rate with an appropriate calibrated flow meter (low pressure drop variety
recommended, e.g. bubble flow meter). The measured flow should be within ± 5 % of the
nominal value for the model of PNC under test.
• Check that zero concentration is reported when a HEPA filter is attached to the inlet. If
concentrations higher than 0.2 cm-3 are reported check for, and correct, any leaks in the
connection between the HEPA filter and PNC. The PNC requires attention from the
manufacturer if concentrations greater than 0.2 cm-3 are reported after any leaks are
eliminated.
Figure 4 Secondary Method
ElectrostaticClassifier
polydisperse
aerosol
excess aerosol to exhaust
Neutraliser
Diluter(if required)
AerosolGenerator
ReferencePNC
PNCundervalidationdry filtered
make-up air(if required)
monodisperseaerosol
dryfilteredair
ElectrostaticClassifier
polydisperse
aerosol
excess aerosol to exhaust
Neutraliser
Diluter(if required)
AerosolGenerator
ReferencePNC
PNCundervalidationdry filtered
make-up air(if required)
monodisperseaerosol
dryfilteredair
Connect the PNCs to the remainder of the apparatus (Figure 4):
14 AEA Energy & Environment
Restricted – Commercial PNC Calibration Procedures AEA/ED47382004/PNC/Issue 5
• Ensure that the particle residence time in the pipe work from the electrostatic classifier to both
PNCs is identical (see Section 3.2). Take into account the inlet flow to each PNC and the
internal diameter and length of the interconnecting pipe work. Take particular care if the inlet
flows into each PNC are different.
• Set the electrostatic classifier flows such that the monodisperse aerosol flow leaving the
classifier is sufficient for the total inlet flow of both PNCs. (Provide additional particle-free flow
after the classifier if necessary).
Make arrangements to log data from both PNCs simultaneously at the same sampling rate.
Set the electrostatic classifier voltage to zero volts and begin logging PNC data. Both PNCs should
report “zero” particle concentration (≤ 0.2 cm-3), having already been checked with a HEPA-filtered
inlet. If either PNC reports non-zero concentrations, check the apparatus for leaks. It is important that
leaks are eliminated. Any particles leaking into the system downstream of the classifier may be of a
size smaller than the D90 of the PNC under calibration, which will invalidate the comparison.
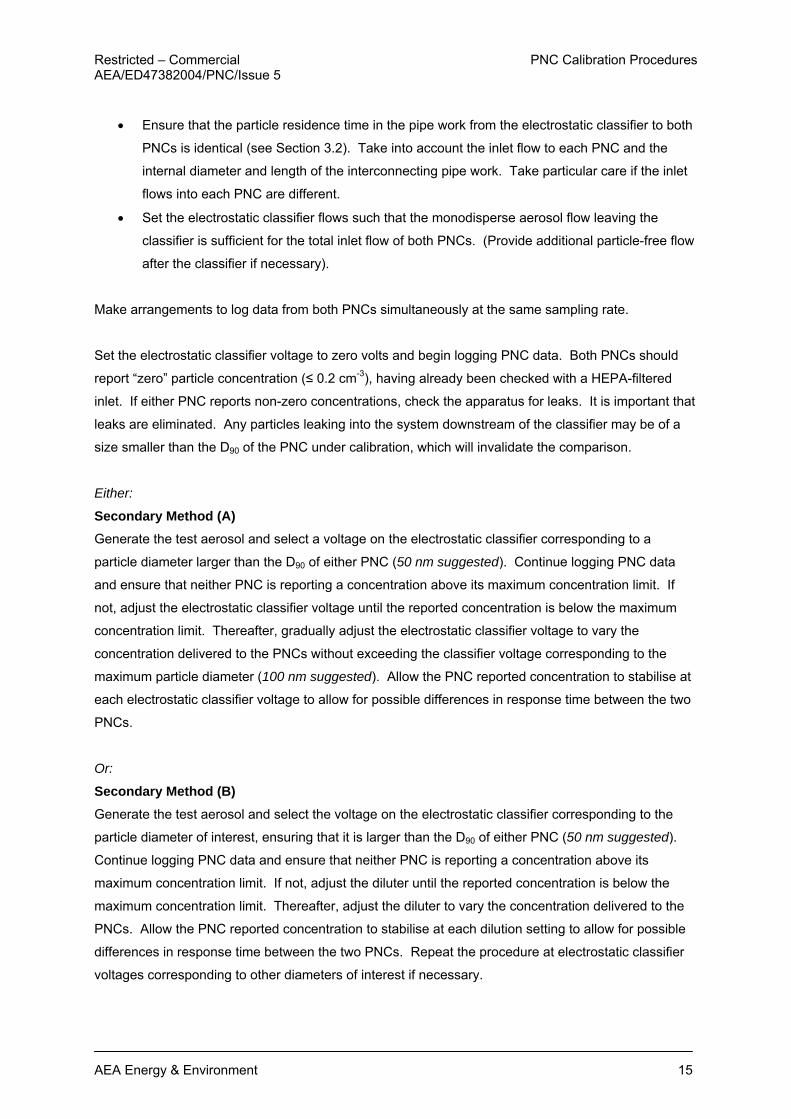
Either:
Secondary Method (A) Generate the test aerosol and select a voltage on the electrostatic classifier corresponding to a
particle diameter larger than the D90 of either PNC (50 nm suggested). Continue logging PNC data
and ensure that neither PNC is reporting a concentration above its maximum concentration limit. If
not, adjust the electrostatic classifier voltage until the reported concentration is below the maximum
concentration limit. Thereafter, gradually adjust the electrostatic classifier voltage to vary the
concentration delivered to the PNCs without exceeding the classifier voltage corresponding to the
maximum particle diameter (100 nm suggested). Allow the PNC reported concentration to stabilise at
each electrostatic classifier voltage to allow for possible differences in response time between the two
PNCs.
Or:
Secondary Method (B) Generate the test aerosol and select the voltage on the electrostatic classifier corresponding to the
particle diameter of interest, ensuring that it is larger than the D90 of either PNC (50 nm suggested).
Continue logging PNC data and ensure that neither PNC is reporting a concentration above its
maximum concentration limit. If not, adjust the diluter until the reported concentration is below the
maximum concentration limit. Thereafter, adjust the diluter to vary the concentration delivered to the
PNCs. Allow the PNC reported concentration to stabilise at each dilution setting to allow for possible
differences in response time between the two PNCs. Repeat the procedure at electrostatic classifier
voltages corresponding to other diameters of interest if necessary.
AEA Energy & Environment 15

PNC Calibration Procedures Restricted – Commercial AEA/ED47382004/PNC/Issue 5
Analyse the resulting data, including the zero concentration point in the dataset, in terms of the
correlation between the reported concentrations from both PNCs with the reference PNC on the x axis
and the PNC under calibration on the y axis, to establish the gradient and the linearity (R2 coefficient).
The linearity of response in terms of the R2 coefficient must be greater than 0.97, else the PNC under
calibration does not respond linearly over the measured concentration range. The gradient of the
correlation plot must be within the range from 0.90 to 1.10 (unity signifies complete agreement
between the two PNCs).
4.3 Lower Cut-Off Diameter Performance Check The PNC is required to detect 23 nm particles with an efficiency of 50 ± 12 % (see Section 3.1 and
References 6 &7). This performance is achieved in the majority of PNCs by controlling the respective
temperatures of the saturator and condenser. The secondary calibration method should be used to
check its detection efficiency at 23 nm. The procedure is identical to that described in Section 4.2.1
except that only a single concentration and diameter are required. This is achieved by setting the
electrostatic classifier voltage to the value corresponding to a diameter of 23 ± 1 nm (GSD ≤ 1.1). The
aerosol used must be emery oil or CAST-generated soot particles (although other materials are
permissible subject to it being demonstrated that they produce similar results). PNC detection
efficiency is calculated by comparing the concentrations reported by each of the PNCs taking due
regard of the detection efficiency of the transfer standard PNC at 23 nm diameter:
[ ]
[ ]100.(%)
100⎟⎟⎠
⎞⎜⎜⎝
⎛=std
std
cal
DEPNC
PNCDE
where DE is the detection efficiency of the PNC under test (%), [PNCcal] is the particle concentration
measured by the PNC under test (cm-3), [PNCstd] is the particle concentration measured by the transfer
standard PNC (cm-3) and DEstd is the detection efficiency of the transfer standard PNC at 23 nm
diameter (%). Note that the detection efficiency of the transfer standard PNC for 23 nm particles must
be known. This will have been established using the primary calibration method.
The DE of the PNC under test must lie within the range 38-62%.
16 AEA Energy & Environment

Restricted – Commercial PNC Calibration Procedures AEA/ED47382004/PNC/Issue 5
4.4 Equipment Summary The following equipment is required to validate a PNC using the primary method.
Table 1: Equipment required to validate the PNC (primary method)
Equipment Purpose
Flow meter, low pressure drop, calibrated (e.g.
bubble flow meter) Measurement of inlet flow
HEPA filter (class H13 of EN1822-1: 1998 or
better filtration efficiency) Zero concentration checks
Aerosol generator Production of test particles
Electrostatic Classifier, calibrated Selection of monodisperse particle fraction from
aerosol generator output
Neutraliser Electrostatic equilibration of particles before
electrostatic classifier
SMPS Check size distribution of test particles leaving the
electrostatic classifier
Source of compressed air, dry, filtered
To supply the;
1. Aerosol generator
2. Diluter
3. Make up air (optional)
Diluter Vary concentration of test aerosol
Reference aerosol electrometer Comparison of measured concentrations
AEA Energy & Environment 17

PNC Calibration Procedures Restricted – Commercial AEA/ED47382004/PNC/Issue 5
The following equipment is required to validate a PNC using the secondary method.
Table 2: Equipment required to validate the PNC (secondary method)
Equipment Purpose
Flow meter, low pressure drop, calibrated (e.g.
bubble flow meter) Measurement of PNC inlet flow
HEPA filter (class H13 of EN1822-1: 1998 or
better filtration efficiency) Zero concentration checks of PNC
Aerosol generator Production of test particles
Electrostatic Classifier, calibrated Selection of monodisperse particle fraction from
aerosol generator output
Neutraliser Electrostatic equilibration of particles before
electrostatic classifier
Source of compressed air, dry, filtered
To supply the;
4. Aerosol generator
5. Diluter (optional)
6. Make up air (optional)
Diluter (optional) Vary concentration of test aerosol
Reference PNC calibrated by primary method Comparison of measured concentrations
18 AEA Energy & Environment
Restricted – Commercial PNC Calibration Procedures AEA/ED47382004/PNC/Issue 5
5 References 1. McMurry, P. H. (2000). The History of Condensation Nucleus Counters, Aerosol Sci. Technol., 33, 297. 2. Agarwal, J. K., and Sem, G. J. (1980). Continuous Flow, Single-Particle-Counting Condensation Nucleus Counter, J. Aerosol Sci., 11, 343. 3. Wilson, J. C., Blackshear, E. D., and Hyun, J. H. (1983a). An Improved Continuous-Flow Condensation Nucleus Counter for Use in the Stratosphere, J. Aerosol Sci., 14, 387. 4. Wilson, J. C., Hyun, J. H., and Blackshear, E. D. (1983b). The Function and Response of an Improved Stratospheric Condensation Nucleus Counter, Journal of Geophysical Research, 88, 6781. 5. Stolzenburg, M. R., and McMurry, P. H. (1991). An Ultrafine Aerosol Condensation Nucleus Counter, Aerosol Sci. Technol., 14, 48. 6. Amendments to UNECE Regulations, Regulation No. 83, Proposal for draft supplement 7 to
the 05 series of amendments to Regulation No.83, ECE/TRANS/WP.29/GRPE/2007/8/Rev.1,
http://www.unece.org/trans/doc/2007/wp29grpe/ECE-TRANS-WP29-GRPE-2007-08r1e.pdf
7. ISO/15900 (2007) “Determination of particle size distribution — differential electrical mobility analysis for aerosol particles”. 8. Liu, W., Osmondson, B. L., Bischof, O. F. and Sem, G. J. (2005). Calibration of Condensation Particle Counters, Paper No. 2005-01-0189, Emissions Measurement and Testing 2005, Society of Automotive Engineers (SAE) Book No. SP-1941. 9. Liu, B. Y. H., and Pui, D. Y. H. (1974). A Submicron Aerosol Standard and the Primary, Absolute Calibration of the Condensation Nuclei Counter, J. Colloid Interface Sci., 47, 155. 10. Liu, B. Y. H., Pui, D. Y. H., Hogan, A. W., and Rich, T. A. (1975). Calibration of the Pollak Counter with Monodisperse Aerosols, Journal of Applied Meteorology, 14, 46. 11. Liu, B. Y. H., and Kim, C. S. (1977). On the Counting Efficiency of Condensation Nuclei Counters, Atmospheric Environment, 11, 1097. 12. Marshall, I. A. and Dickens, C. J. (2000). Calibration Service for Ultrafine Particle Counters, AEA Technology Report AEAT/R/ENV/0391 for the UK Department of Trade and Industry Valid Analytical Measurement Programme. 13. Liu, B.Y. H., Pui, D.Y. H.,McKenzie, R. L., Agarwal, J. K., Jaenicke, R., Pohl, F. G., Preining, O., Reischl, G., Szymanski, W., and Wagner, P. E. (1982). Intercomparison, of Different “Absolute” Instruments for Measurement of Aerosol Number Concentration, J. Aerosol Sci., 13, 429. 14. Bartz, H., Fissan, H., Helsper, C., Kousaka, Y., Okuyama, K., Fukushima, N., Keady, P., Fruin, S., McMurry, P. H., Pui, D. Y. H., and Stolzenburg, M. R. (1985). Response Characteristics for Four Condensation Nucleus Counters to Particles in 3 to 50 nm Diameter Range, J. Aerosol Sci., 16, 443. 15. Wiedensohler, A., Orsini, D., Covert, D. S., Coffmann, D., Cantrell, W., Havlicek, M., Brechtel, F. J., Russell, L. M., Weber, R. J., Gras, J., Hudson, J. G., and Litchy, M. (1997). Intercomparison Study of the Size-Dependent Counting Efficiency of 26 Condensation Particle Counters, Aerosol Sci. Technol., 27, 224. 16. Sakurai, H., Ehara, E., Tajima, N. and Fukushima, N. (2005). Development of a Primary Calibration Standard for Aerosol Particle Number Concentration Using the Electrometer Method, Proc.
AEA Energy & Environment 19

PNC Calibration Procedures Restricted – Commercial AEA/ED47382004/PNC/Issue 5
9th ETH Conference on Combustion Generated Nanoparticles, Swiss Federal Institute of Technology, Zürich. 17. Fletcher, R et al Verification of a gas mask calibrant, NISTIR 7424 (Aerosol generation using
the electrospray).
18. Jing, L Standard Combustion Aerosol Generator (SCAG) for Calibration purposes, 3rd ETH Workshop, 9-10 August 1999, http://www.sootgenerator.com/documents/Pub-ETH-Workshop1999_Ji.pdf
19. Mitchell, JP Aerosol Generation for Instrument Calibration, UKAEA, AEEW – R-2092
20. Schlatter, J Application of CAST for comparison of instruments, METAS,
http://www.sootgenerator.com/documents/Schlatter%202.pdf
21. VDI Guideline 3491 Parts1 to 16, The Association of German Engineers,"Particulate matter measurement; production methods of test aerosols". http://www.vdi.de/en/7636.0.html. (Generation of ultrafine particles: Parts 2 (foundations and synoptics), Part 3 (Generation of Latex aerosols using nozzle atomizers), Part 6 (Platinum oxide generator) and Part 16 (Generation of carbon aerosols using a spark aerosol generator)).
20 AEA Energy & Environment

6 Annex 1
6.1 Emery Oil Specification
AEA Energy & Environment 21

7 Annex 2
7.1 Secondary Calibration Method Example Any PNC calibrated by the primary method described in Section 4.1 can be utilised as a reference
against which the performance of other PNCs can be compared. This approach has been adopted to
validate the Golden PNC used in the PMP Light Duty Interlaboratory Comparison Exercise and is
described here as an example of using the secondary method. A TSI Model 3010 PNC (S/N: 2005)
calibrated by TSI according to the primary method was used as the reference PNC.
The aerosol generator consisted of a ceramic crucible heated via an electric Bunsen (Figures 5). The
bulk material (sodium chloride) was placed in the ceramic crucible and heated to near its boiling point.
A small flow was introduced into the crucible to displace vapour from the surface of the bulk material
to a cooler region of the generator where condensation occurred. Particle diameters could be varied
by controlling the rate of vapour transport from the crucible (via the crucible air flow) and/or the
subsequent cooling rate of the vapour (via the carrier air flow). A typical size distribution of a
generated aerosol is presented in Figure 6.
Note: This aerosol generation method is reported purely as an example. Alternative methods that
generate similarly sized particles and concentrations are equally appropriate.
Figure 5a Condensation Aerosol Generator
T
Aerosol
Outlet
Filtered
Carrier
Air
Va
po
ur
Crucible
Air Flow
Va
po
ur
Condensation
T
Aerosol
Outlet
Filtered
Carrier
Air
Va
po
ur
Crucible
Air Flow
Va
po
ur
Condensation
22 AEA Energy & Environment
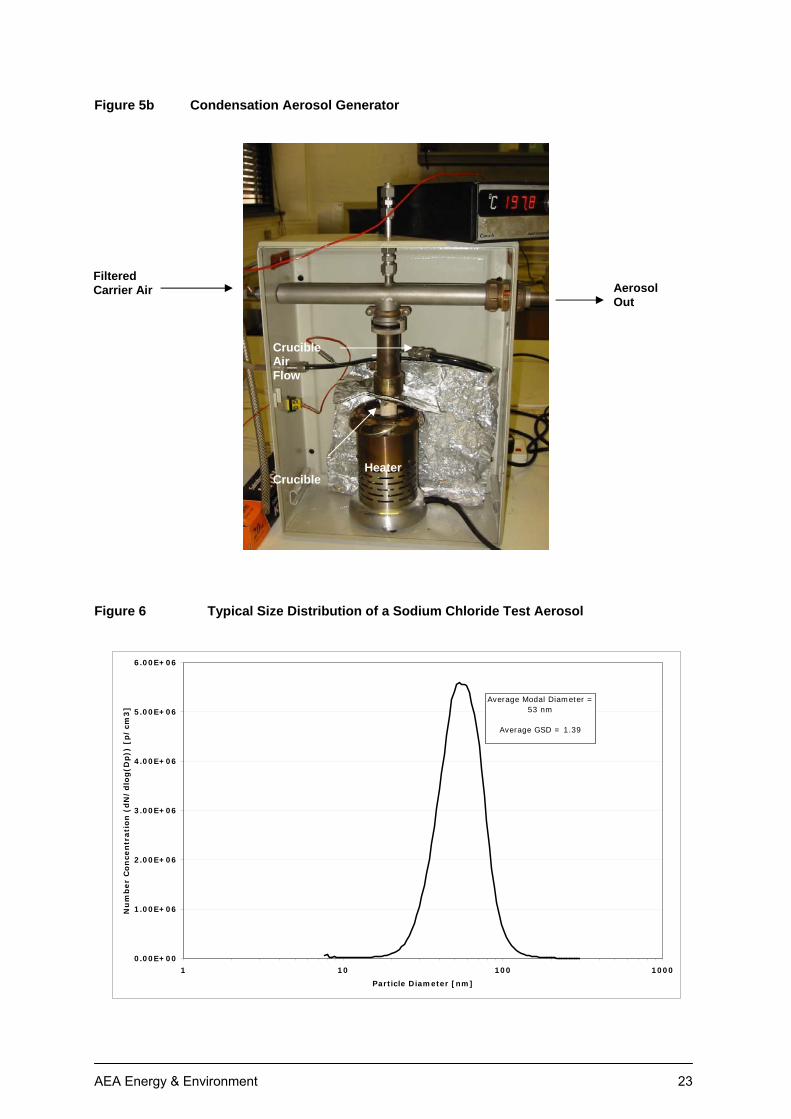
Figure 5b Condensation Aerosol Generator
Filtered Carrier Air Aerosol
Out
Crucible Air Flow
HeaterCrucible
Figure 6 Typical Size Distribution of a Sodium Chloride Test Aerosol
0.00E+00
1.00E+06
2.00E+06
3.00E+06
4.00E+06
5.00E+06
6.00E+06
1 10 100
Particle Diameter [nm]
Nu
mb
er
Co
nce
ntr
ati
on
(d
N/
dlo
g(D
p))
[p
/cm
3]
1000
Average Modal Diameter = 53 nm
Average GSD = 1.39
AEA Energy & Environment 23

The electrostatic classifier was used to select monodisperse fractions of the polydisperse sodium
chloride test aerosol and deliver concentrations in the range from zero to 10,000 particles cm-3 to the
PNCs, while simultaneously logging the concentrations reported by both PNCs. The electrostatic
classifier was simply used to vary the concentration of particles reaching the PNCs, in contrast to the
primary method where the electrostatic classification delivers singly charged particles to allow
measurement with the reference aerosol electrometer. The range of diameters delivered by the
classifier depended upon the unclassified aerosol mode and monodispersity, and the voltages chosen.
Care was taken to ensure that the voltages selected on the classifier were such that the particles
delivered to the PNCs were significantly bigger than the lower size detection limit of either PNC. This
was particularly important in this example as the PMP Golden PNC had been modified to provide
lower size detection limits of 23 ± 3 and 37 ± 4 nm for 50 % detection efficiency (D50) and 90 %
detection efficiency (D90) respectively. The reference PNC was unmodified having a D50 of
9.5 ± 0.5 nm and D90 of 13.5 ± 0.5 nm. Thus significant differences between the concentrations
reported by both PNCs would be expected if the test particles were smaller than ~40 nm. Identical
flow paths were used to deliver the test particles from the electrostatic classifier to both PNCs, thus
ensuring any losses within the pipe work were the same for both units. The maximum diameter
delivered to the PNCs was limited to 100 nm.
Note: This method provides a quick and easy demonstration that the PNC under calibration responds
in the same way as the reference PNC to a variety of particle diameters and concentrations. The
range of available concentrations is dependant on the characteristics of the unclassified aerosol.
An example of the results of two such comparisons is shown in Figure 7.
An alternative approach can be adopted where the output from the classifier is held at a single voltage
and therefore delivers a single particle diameter, but particle concentration is varied using a
controllable diluter installed after the classifier but before the point at which the test aerosol is divided
for delivery to each PNC. Investigation of the effect of particle diameter would have consequences for
the aerosol generation method, which would have to be capable of generating the maximum required
concentration at each of the diameters of interest for subsequent dilution. Monodispersity is not a
requirement.
24 AEA Energy & Environment

Figure 7 PMP Golden PNC Calibration by the Secondary Method
y = 0.9832xR2 = 0.9985
y = 0.9624xR2 = 0.9955
0
2000
4000
6000
8000
10000
12000
0 2000 4000 6000 8000 10000 12000
AEA Reference PNC S/N 2005 (p cm-3)
Gold
en P
NC (
p c
m-3
)
Jul-05Jan-05
AEA Energy & Environment 25


![Calibration of the HML’s portable whole body counter as a …irpa11.irpa.net/pdfs/3a21.pdf · phantom family [4]. The use of Monte Carlo simulations to establish calibration data](https://img.pdfslide.us/doc/110x75/5e28917af6fc2a7adc49e0b1/calibration-of-the-hmlas-portable-whole-body-counter-as-a-phantom-family-4.jpg)