Embed Size (px)
Citation preview

Synoptic visualizations give viewers a syn-opsis of all flow features simultaneously.
Good examples of 2D synoptic visualizations are weath-er maps from both TV news reports and online Web
pages. The human visual systemis adept at finding patterns with-in larger contexts, and wehypothesize that synoptic visu-alization methods will help usersfind unexpected features morequickly and thus speed theunderstanding of complex 3Dtime-varying flows.
Particle Flurries (PF) is oureffort toward a synoptic visual-ization of complex pulsatile 3Dflow. Our group’s ongoing studyof the correlation between arte-rial blood flow and lesions as
well as our research into the mechanics, dynamics, andevolution of animal flight (described in the “Visual-ization in Biomedical Research” sidebar) motivatedthis work. Our approach was inspired by videos of par-ticles animating through a vessel. The video’s flat viewraised questions about the precise behavior of the com-plex 3D flow, such as how particles move in the thirddimension and what their movement is relative to thevessel wall. An immersive viewing environmentpromised to more effectively display complex 3D struc-tures, thus our primary challenge was to design aneffective 3D visualization based on the motivational2D visualization style.
PF tries to satisfy four goals:
■ represent all flow features,■ depict flow at artery surfaces,■ interact with users, and■ avoid visually overwhelming the viewer.
Feature Article
Particle Flurries is an
interactive approach to 3D
flow visualization. The
approach produces a
“synoptic visualization” and
is used to examine both
internal and external flows.
Jason S. Sobel, Andrew S. Forsberg, David H. Laidlaw, Robert C. Zeleznik, Daniel F. Keefe, Igor Pivkin, George E. Karniadakis,and Peter RichardsonBrown University
Particle FlurriesSynoptic 3D Pulsatile Flow Visualization
2 March/April 2004 Published by the IEEE Computer Society 0272-1716/04/$20.00 © 2004 IEEE
Visualization in Biomedical ResearchOur research group comprises cardiologists,
bioengineers, and computer scientists workingtogether to test the hypothesis that the location ofatherosclerotic disease is correlated with thearterial blood flow characteristics. Pathologicalstudy has shown that plaque formation is notrandom; thus biomedical engineers areinvestigating whether it’s related to the localdetails of blood flow.1,2 Blood flow interaction,both with substances carried in the flow andpresent or generated in the vessel wall, canaccelerate or decelerate atherosclerosis’ localprogress. Understanding the interaction betweenthe flow and the surface can help us understandthe cause of detrimental medical conditions, aswell as their prevention and treatment.
Computational approaches to understandingarterial flow promise to be extremely valuabletools, but are currently primitive. Real-worldproblem specifications and simulation models can’t
account for all physical components of a real flow.Furthermore, the data’s scale and complexity makeit difficult to understand the simulations produced.
Another interest for our group is the mechanics,dynamics, and evolution of animal flight. Our goalis to better understand how flight works indifferent species and how flight techniquesevolved. The broader impact of our work includesthe design of better flying machines. We focus onbats, which offer tremendous genetic diversity viaa thousand different species. Bats are much moreagile, complex, and varied than birds and fly at agreater range of speeds.
References1. N. Woolf, Pathology: Basic and Systemic, W.B. Saunders
Co., 1998.2. W.E. Stehbens and J.T. Lie, Vascular Pathology, Chap-
man and Hall Medical, 1995.

This article describes the overall design of PF and dis-cusses the system we constructed to test PF and its asso-ciated tools. We demonstrate our techniques withsimulations of blood flow through an artery (an internalflow) and air flow around a bat flapping its wings (anexternal flow). Many other published flow visualizationapproaches exist (see the “Related Work” sidebar) andcould be complementary to PF for some data sets.
Interestingly, the choices we made in developing aneffective virtual design for PF (for example, immersiveviewing, the vessel wall texture, rendering thousands ofhaloed motion-blurred particles) are inappropriate forpaper and video viewing of PF. Adapting a 2D conceptto 3D or vice versa can introduce problems. To illustrate,the static monoscopic images in this article can’t recreatethe immersive experience of PF. A more surprising exam-ple is that if we disabled only stereo viewing in PF, view-ers couldn’t make sense of the visualization.
Our approach The goal and requirements of synoptic visualization
of 3D pulsatile flow helped guide our work. Our spe-
cific approach was primarily inspired by 2D animationsof particles produced by hydrogen-bubble devices andanalogous physical and computer visualizations.Although these animations met a number of ourrequirements, they mask the flow’s depth component.We thus wanted to extend this visualization style to3D. At a high level, this involves computing particlepaths and rendering them in a 3D viewing environ-ment. This strategy requires interactive display rates,representation of all flow features, and an effectivevisualization.
Precomputing particle paths as pathlinesAdvecting thousands of particles is computationally
intensive and impossible to accomplish interactivelywith current resources. Precomputing particle paths letsus animate them quickly at runtime. A path has a simu-lation start time and a list of points. Synchronizingadvection of many particle paths at runtime is simplebecause the time difference between stored points inour implementation is constant and requires only incre-menting an index into the array of path points.
IEEE Computer Graphics and Applications 3
Related Work in 3D Flow VisualizationParticle Flurries (PF) integrates results on visual
representation from many scientific visualization sources.
Representation Illuminated streamlines improves perception of
streamlines by shading them as a function of light sourcesand helped motivate the particle representation andseeding in PF.1 Fuhrmann et al. describe a similar virtual-reality system.2 Unlike these two approaches, we displayunsteady flow, only allowing pathlines to begin or endmidflow, and cycle among a much larger set of pathlines,creating a more complex flow.
Analogous to Zhang et al., who carefully chooserepresentative paths to display tensor-valued volume data,3
we carefully choose particles for displaying 3D flow. Turkand Bank’s 2D work4 is similarly related. Like line integralconvolution (LIC),5,6 our approach aspires to show theflow’s global and local behavior, but, unlike LIC, it usestime, 3D sponges, and stereo viewing.
Steinman et al.7 produced motivational movies of carotidblood flow with 3D particle traces, but their viewpoint isoutside the flow volume looking in and is a monoscopicview. In our system, the viewer can interactively navigateinside the flow for a close-up look at flow features.
A single pathline, streamline, or streakline shows a pieceof the puzzle, useful for detailed analysis. However, it’simpractical for a user to interactively interactively create andposition enough streamlines and streaklines to achieve asynoptic visualization comparable to PF.
ExtractionBryson et al.8 point out that extracting a data set
algorithmically using a precise feature description is moreeffective than exploring the data set interactively. Toincrease efficiency, PF can work with techniques that
automatically extract higher-level features such as vortexcores, shocks, and recirculation.
Automatic extraction techniques don’t exist for all flowfeatures, and others are still in early development, sohuman-in-the-loop exploration is still needed. In somecases, the low-level particle paths can help explainparticular phenomena.
Exploring flowSeveral systems for exploring 3D flow exist. One of the
most widely used is Tecplot (http://www.amtec.com/), acommercial desktop application. Unlike Tecplot, whichruns at a conventional desktop, our approach relies onstereo, head tracking, and immersive 3D graphics todisplay flow data.
Bryson’s virtual wind tunnel9 is a clear antecedent to ourwork but requires users to manipulate widgets to generatethe visualization. PF provides a complete view quickly; theuser need not do more than navigate the data set.
Kuester10 implements a virtual wind tunnel in a virtualenvironment, rendering up to 60,000 particles at 60 framesper second. Whereas Kuester sought to enable visualizationof arbitrarily large scientific data sets on commodityhardware with high graphics performance, our goal was toachieve a synoptic visualization of 3D pulsatile flow.
Crawfis et al. developed hairs, a technique for visualizingflow near a surface.11 Hairs are similar to our kelp, but weuse different visual anchors and line calculations, and don’tallow data-driven control over colors and lengths.
Particle seedingLike Stalling and Hege,12 Bauer et al.13 we use
quasirandom particle seeding to avoid patterns andclusters. Their approach distributes the seed points forcalculating pathlines, but because it doesn’t account for the
continued on p. 4

Choosing a representative subset of pathsA key issue in synoptic visualization of 3D pulsatile
flow is determining which particle paths to display. Torepresent all flow features, we need a set of pathlinesthat particles will follow. At a high level, we find this setby choosing a finite set of 4D seeds (that is, points inspacetime). For each seed, we compute a pathline thatadvects forward and backward until it exits the data setand then store it as a single pathline combining the twosegments. For practical reasons, we also terminate path-lines that reach a maximum number of points. At run-time, we draw a particle first at the most upstream pointof the pathline (not the seed position) and animate ituntil it reaches the end of the pathline.
Our goal that all features be represented requires thatsome particles pass through every possible feature.Because computer simulation requires a discretedescription of the flow problem , a constant (possiblyanisotropic) distance, D, exists below which no addi-tional features can exist. In our arterial blood flow dataset, which we computed using 1 flow codes,D is a function of the polynomial order of ’s spectral elements and the element density within thevolume. Because particles follow pathlines, we’ll meetour goal if we can compute a set of pathlines such thatevery point on one pathline is no further than D from apoint on any other pathline.
We can meet this condition by adding seeds to fill gaps,
sometimes at the cost of some redundancy in particlepath coverage. We could use a simple seeding imple-mentation that places seeds at fixed intervals of D on aregular grid, but this approach typically produces manysimilar pathlines. Instead, we used a Poisson-disk-basedstrategy for seeding. Figure 1 illustrates the technique,and Figure 2 shows pseudocode for the algorithm.
Specifically, a sweep plane steps in increments of Dalong the coordinate system axis that is most closelyaligned with the primary flow direction. At each step, a2D Poisson-disk seeding algorithm with radius D addsseeds to the plane approximately normal to the flowdirection. (The plane already has seeds at each pointwhere an already calculated pathline intersects theplane.) Each new plane might therefore need only a fewadditional seed points. We compute a pathline extendingforward and backward for each new seed and then storeit on disk as a list of points. Note that it’s easy to use thestored data to compute the position and time of any pointalong the path because we record the constant integra-tion step used and the start time of a path. This algorithmrepeats until the plane reaches the end of the flow.
The implementation’s data structure represents allsweep plane positions in space and time. Thus, for eachplane in space, multiple instances exist that differ in theinstant in time the plane represents and consequentlythe set of pathlines passing through it. This is importantbecause different pathlines can pass through a particu-
Feature Article
4 March/April 2004
pathlines when choosing seed points, it would generatemany more pathlines than our method.
VisualizationVis5D (http://www.ssec.wisc.edu/~billh/vis5d.html), Pv3
(http://raphael.mit.edu/pv3/pv3.html), CAVE5D (http://www.ccpo.odu.edu/~cave5d/homepage.html), AVS(http://www.avs.com), and SCIRun (http://software.sci.utah.edu/scirun.html) all provide visualizationfunctionality, but visualizations like PF haven’t beenproduced with them and none of the systems automaticallyprovides a synoptic initial visualization.
Forsberg et al.14 also constructs flow visualizations, butthrough user-controlled widgets; our approach generatesthe visualization automatically.
References 1. M. Zockler, D. Stalling, and H Hege, “Interactive Visualizations of
3D-Vector Fields using Illuminated Streamlines,” Proc. IEEE Visu-alization, IEEE CS Press, 1996, pp. 107-113.
2. A.L. Fuhrmann and E. Groller, “Real-Time Techniques for 3DFlow Visualization,” Proc. IEEE Visualization, ACM Press, 1998,pp. 305-312.
3. S. Zhang et al., “An Immersive Virtual Environment for DT-MRIVolume Visualization Applications: A Case Study,” Proc. of IEEEVisualization, IEEE CS Press, 2001, pp. 437-440.
4. G. Turk and D. Banks, “Image-Guided Streamline Placement,”
Proc. Siggraph, Addison Wesley, 1996, pp. 453-460.5. B. Cabral and L. Leedom, “Imaging Vector Fields using Line Inte-
gral Convolution,” Proc. Siggraph, ACM Press, 1993, pp. 263-270.6. V. Interrante and C. Grosch, “Strategies for Effectively Visualizing
3D Flow with Volume Lic,” Proc. IEEE Visualization, ACM Press,1997, pp. 421-424.
7. D.A. Steinman et al., “Reconstruction of Carotid BifurcationHemodynamics and Wall Thickness using Computational FluidDynamics and MRI,” Magnetic Resonance in Medicine, vol. 47, no.1, Jan 2002, pp. 149-159.
8. S. Bryson et al., “Visually Exploring Gigabyte Data Sets in RealTime,” Comm. ACM, vol. 42, no. 8, 1999, pp. 82-90.
9. S. Bryson and C. Levitt, “The Virtual Windtunnel: An Environmentfor the Exploration of Three-Dimensional Unsteady Flows,” Proc.Visualization, IEEE CS Press, 1991, pp. 17-24.
10. F. Kuester et al., “Visualization of Particle Traces in Virtual Envi-ronments,” Proc. Symp. Virtual Reality Software and Technology,ACM Press, 2001, pp. 151-157.
11. N. Max, R. Crawfis, and C. Grant, “Visualizing 3D Velocity Fieldsnear Contour Surfaces,” Proc. IEEE Visualization, IEEE CS Press,1994, pp. 248-255.
12. D. Stalling and H.-C. Hege, “Fast and Resolution-IndependentLine Integral Convolution,” Proc. Siggraph, Addison Wesley, 1995,pp. 249_256.
13. D. Bauer et al., “A Case Study in Selective Visualization of Unsteady3D Flow,” Proc. IEEE Visualization, IEEE CS Press, 2002, pp.525_528.
14. A.S Forsberg et al. “Immersive Virtual Reality for Visualizing FlowThrough an Artery,” Proc. Visualization, IEEE CS Press, 2000.
continued from p. 3
lar plane at different times and the algorithm must knowwhere to add seeds to ensure completeness.
To meet a targeted distribution goal, standard Pois-son-disk seeding fills a space with points by consideringthe placement of previous points. Our algorithm fills a4D space with lines (or pathlines) by considering whereprevious lines were placed. The overhead of the path-line-set data structure and intersection and distance test-ing can make the Poisson-disk method slower than thefixed-interval method. However, for our artery data setand D equal to 1 unit (the artery diameter is 8 units),the fixed-interval approach produces 62,880 seeds over16 time steps and the Poisson-disk approach produced4,041 seeds—a 93-percent reduction.
Visual designVisualizing time-varying fluid flow with animated
particles requires designing a representation for parti-cles, choosing a path for them to follow, and decidingother particle-animation details.
Representation. A particle always follows a pre-computed pathline from the inflow to the outflow. Werepresent a particle as a motion-blurred OpenGL line-
strip surrounded by a black halo, as Figure 3 shows. Wecreate the black halo by enabling z-buffering, setting theGL line width to a thicker value (we use three pixels)turning on antialiasing, and drawing the particle linesbefore any other geometry. Other techniques could pro-duce a similar effect, such as 2D texture mapping, ordrawing two lines—first, a colored line with gradualalpha blending at its edges, and then a thicker black lineslightly behind it.
The points defining the OpenGL line-strip are a five-vertex window on a precomputed pathline, with the ver-tices equally spaced in time. The center vertex has100-percent opacity, the end points have 0-percent opac-ity, and the other points are interpolated between theseextremes. The window advances in sync with a globaltimer, giving the appearance of an animated particle.We find this representation to be more effective thanusing a 3D geometry to represent particles because it
■ reduces occlusion of distant particles,
IEEE Computer Graphics and Applications 5
1 Simplified illustration of the Poisson-disk seedingalgorithm without the time dimension. A plane sweepsfrom the inflow to the outflow. At each step, the algo-rithm adds seeds to fill gaps: (a) the three initial seeds,(b) one seed is added to fill a gap, and (c) another seedis added.
(a)
(b)
(c)
(1) for each slice (s) (2) for each timestep (t) (3) create seeds for (s, t) using a Poisson-disk
distribution considering existing seedsmarked “old’’
(4) mark each of these seeds as “new’’(5) end
(6) for each timestep (t) (7) calculate a pathline forward and backward
for each seed in (s, t) marked as “new’’
(8) for each pathline created (p) (9) for each slice (s1) (10) determine the point of intersection (i)
where p intersects s1 (11) determine the timestep (t1) at i (12) add i as a seed in (s1, t1) (13) mark this seed as “old’’(14) end (15) end (16) end (17) end
2 Pseudocode for one of our pathline calculationalgorithms.
3 Close-up of the rendering of several haloed motion-blurred particles.This representation for particles reduced occlusion of distant particles,animated more smoothly, reinforced the front-to-back ordering of parti-cles, and provided good visual cues for stereo convergence.

■ reinforces front-to-back particle ordering, ■ provides good visual cues for stereo convergence, and ■ provides a smooth motion-blur rendering style.
We assign bright colors randomly to help differentiateindividual particles.
Particle release and advection. PF maintainsa set of active particles. At a user-controlled rate, par-ticles move one step along its path. To keep the visual-ization synchronized, we select new particles for theset based on their initial position and start time. Toaddress our interactive and complexity requirements,we release a user-controllable variable number of par-
ticles each frame. Fifteen addition-al particles per time-step workswell with our artery data set. Dif-ferent viewers have different needs,however, so these parameters canbe modified interactively. In addi-tion, particle attributes can influ-ence particle release behavior. Forexample, the viewer can releaseparticles with equal probability ortune the visualization by increasingthe probability of releasing parti-cles with low average speed or lowminimum velocity. Particle colorcould be mapped to other flow dataquantities, but this design decisionmay impact the clarity of particlemovement.
Tuning particle release.When we turn particle release bias-ing on the release algorithm com-putes a normalized scalar value mranging from 0 to 1 for each path-
line. We can use several metrics—for example, we com-pute average velocity as m = v/Vmax, where v is aparticle’s average velocity and Vmax is the maximuminflow velocity. Until the algorithm has released the tar-get number of particles for a given frame, it selects andreleases a random particle if r < (s ∗ m)p where r is a ran-dom number between 0 and 1 and s and p are interac-tively controlled by the user. The variable s controls therange of values between 0 and 1, and p shifts how theparticles chosen are emphasized: for p < 1, low valuesare more often chosen, for p > 1, high values are moreoften chosen.
Visualizing the boundary surface. To clearlyrepresent the curving boundary surface and let userssee flow on the other side of a vessel wall, we render thegeometry with a chicken-wire style texture, as Figure 4shows. The chicken wire is composed of a thinly woven,fully opaque pattern interpolated with fully transpar-ent sections, revealing structure without totally obscur-ing the flurries. Interrante’s work,2 which showed thatopaque textures are more effective than semitranspar-ent textures in conveying surface shape and interior fea-tures, inspired our choice of texture.
Flow near geometries. Flow behavior near theboundary surface geometry is interesting because it’swhere the flow and the surface interact. We draw kelp atthe surface to highlight flow behavior near surfaces, asFigure 5 shows. Kelp consists of an oriented glyph at asurface anchor point and a streamline that uses a pointin the flow just normal to the anchor point as its seed. Astreamline is an integral path through the instantaneousflow field at a point in time, and so changes as the flowchanges. We color the glyph with scalar flow data, suchas pressure, and draw a streamline with length propor-tional to the flow’s speed just normal to the anchor point(the flow at the anchor point is always zero and there-
Feature Article
6 March/April 2004
4 Artist-enhanced illustration of a fully immersed user in an artery just upstream of a bifurca-tion. The vessel wall geometry is rendered as a chicken-wire mesh to reveal its structure andthe objects behind it, and to give the user a spatial reference without obscuring the pathlines.
5 Kelp in the artery shows flow information near the vessel walls. Althoughnot animated in this illustration, the kelp near the bifurcation ebb and flowin response to the simulated heart beat.

fore not useful to show). At runtime pulsatile flows causethe kelp to ebb and flow, helping to identify regions ofinterest—for example, locations of flow reversal or highor low shear stress. Finally, as with particle paths, weprecompute the kelp seed points and streamlines toachieve runtime interactivity.
User interactionScientists can modify particle color and release behav-
ior by creating virtual paint strokes, or sponges, directlyin the data volume using the cavepainting3 metaphor.Before creating a sponge, a user can select a color fromthe hue saturation value (HSV) color space using a colorselector widget. Particles passing through a spongeaccrue the sponge’s color.
Red, white, and blue sponges have special behaviors:
■ A red sponge deletes particles that pass through it. ■ A white sponge acts as a particle emitter, releasing
particle in to the flow. ■ A blue sponge prevents a particle
from being released into the flowunless it will eventually passthrough the sponge.
This functionality runs at interac-tive rates because we use a 3Dlookup table the size of the data set’sbounding box with a sample spacingof about 1/15th the diameter of theartery. Even this somewhat coarsesampling rate worked well. Therelease algorithm could quicklyquery the table for pointers to the setof paths that passed through thevoxel containing a particular point.Deleting sponges restores deletedpathlines and resets the particles’random colors that changed viasponges. The user navigates by phys-ically walking around the space (thehead-tracked view reflects thechanging viewing position), doubleclicking the wand button to auto-matically fly between stored view-points, using the wand to point andfly in a particular direction, or grab-bing the world with a wand buttonpress and subsequently translatingand rotating the world with handmovements.
Test resultsWe’ve applied our system to four flow data sets. Three
were arterial blood flow data sets with varying peakinflow rates, and one was a time-varying simulation ofairflow past a bat’s flapping wings. We derived the arte-rial flow data from a prescribed idealized artery geom-etry and simulated it computationally.
We derived the bat flow data by motion capturing thegeometry of a bat flying in a wind tunnel. We meshed avolume around the captured geometry and calculated
flow velocities within that volume. Figure 6 shows howwe compute data sets of simulated 3D airflow. Figure 7shows a time series of the bat model flying as particleflurries flow around it.
We implemented PF using an SGI Onyx2 driving afour-wall Cave. We achieved an average frame rate of 10frames per second. We expect to achieve just under a 10-times speedup on commodity graphics hardware suchas 3Dlabs Wildcat 6210s. Precomputation of the arterydata set’s pathlines and kelp required several hours and265 Mbytes of uncompressed disk space for 50 timesteps.
Domain specialists have logged tens of hours in the
IEEE Computer Graphics and Applications 7
6 Snapshot of a bat flying in a wind tunnel with smallreflective markers on its body. Motion capture tech-niques helped create a 3D bat model for use in comput-ing data sets of simulated 3D airflow past the bat’sflapping wings.
7 A time series of the bat model flying and particle flurries visualizing simulated 3D flowaround it. The bat model is facing roughly toward the camera, and the primary direction of airflow is away from the camera into the distance.
artery data set and are eager to spend more time explor-ing the flow. All viewers have appreciated the flow justby looking at and navigating through the particle flur-ries. Some use sponges to annotate or modify the flowto highlight specific features.
In the artery, one fluids researcher used sponges todelete flow through the center of the artery because itwas less interesting; to assign different colors to sidebranch flow and main branch flow; to color an area ofrecirculation near the side branch and subsequently dis-cover where it flowed from; to carefully study a subsetof flow near the floor of the main branch; to increase theframe rate even more by releasing particles from mid-way down the main branch; to color two columns of flownear the end of the artery with contrasting colors toemphasize swirling flow; and to create a yellow spongein the side branch to discover the shape of the area at theinflow that eventually passed through the side branch.
At certain times in the periodic flow, fluidsresearchers saw examples of expected flow featuressuch as backflow in the side branch, particles reenter-ing the main branch’s flow after initially moving downthe side branch, and counter-rotating vortices in theartery’s curved main branch. They also found unex-pected flow patterns such as a volume of space justdownstream from the bifurcation in the main branchthat few particles could enter at certain times of theflow, and particles that moved diagonally along themain branch wall downstream of the bifurcation whenit was expected that they wouldn’t have a vertical com-ponent. Finally, we found problems with the simula-tion parameters, such as an inadequate amount of flowmoving into the side branch in an early run.
Most of our results came from the arterial blood flowdata set, but we also found useful results in our air flowpast a bat data set. Figure 8 shows visualizations for bothdata sets. From this data we’ve calculated a set of path-lines. Viewing them in the Cave has revealed some bugsin both the data and the simulations. Some were in sur-prising places, which PF revealed almost immediatelybut probably would have been hard to find using a prob-ing or cross-section method.
Our evolutionary biologist collaborator is enthusias-tic about using these tools to continue developing themotion-capture methodology, to develop and test thenumerical methods for creating the data, and ultimate-ly, to understand and characterize wake and vortex
structures, which will help us understand how differentspecies of bats fly.
Design processDesign of PF involved a number of progressions in
pathline computation, rendering, and particle distrib-ution in the visualization. Other considerations includ-ed usability, monoscopic versus stereo viewing, andworld scale. At the highest level, PF is an intuitive wayto explore complex pulsatile 3D flow. It isn’t, however,a stand-alone tool to reveal everything a viewer maywant to see within a data set.. We can combine it with acomplementary visualization tool such as streaklines,for example. Ideally, a full-featured 3D flow visualiza-tion system will include PF and many other tools.
Pathline computationAlthough a fixed-interval seeding algorithm for path-
line computation executes faster and is easier to imple-ment than the Poisson-disk method, it often calculatesredundant pathlines because pathlines created fromseeds up- and downflow from each other can result innearly indistinguishable paths. It can also generate manymore seeds than are necessary. Our Poisson seed-spacingalgorithm has reduced seed counts by 93 percent overcomparable fixed-interval seeding strategies. In the algo-rithm’s current form, the upstream slices can be over-sampled because downstream seeds are integratedbackward. Viewers’ reports don’t suggest that this is aproblem, but future work might address this point.
Pathline renderingChoosing a particle animation led to surprising results.
Our particle representation (see Figure 3) evolved to helpclearly represent the flow in an immersive viewing envi-ronment without overwhelming the viewer. The particleused to animate a pathline didn’t start as a motion-blurred, haloed, GL line, however. Initially the user couldchoose between a coarsely tessellated sphere, a flow-ori-ented triangle, or a flow-oriented textured triangle. Themain problem with these geometric representations wastheir size, which introduced occlusion and distractionwhen swept near users’ eyes. Also, when animated, theyintroduced aliasing. Although approaches to motion-blurring geometric objects exist, viewer feedback favoreda line representation for particles. Although it was ini-tially a user-controlled variable, we found most viewersfavored a five-vertex window for particle representationsover longer or shorter representations.
We noticed in one of the videos that inspired our workthat shutter speed caused motion blur in particle move-ment. This led us to come up with a better line-basedparticle representation. Because points on a path arewritten out in a constant time interval, slower path seg-ments will have many points spaced close together, andfast segments will have fewer points spread furtherapart. Because each particle connects the same numberof points, fast particles will be longer than slow ones,letting users make relative comparisons. Unfortunate-ly, slow-moving particles can nearly disappear becausethe points become collocated. To fix this, we couldalways draw a particle’s line representation some min-
Feature Article
8 March/April 2004
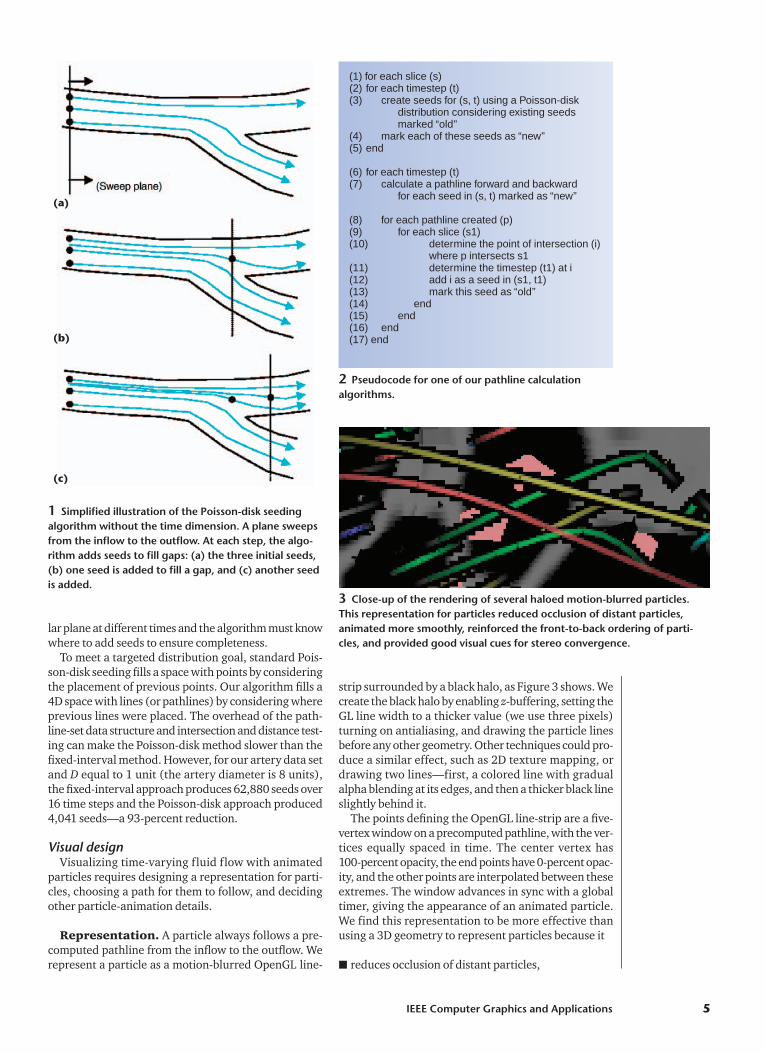
(a) (b)
8 Particle flurries (a) inside an artery and (b) around a bat. Over a shorttime the particle animation gives a synoptic visualization of the flow fea-tures. The kelp are the blue and pink lines attached to the artery walls. Thered lines trailing off the bat help show pressure and velocity informationnear the geometries.

imal length tangent to its pathline. We also consideredinverting the effect such that slow and fast moving flowwere drawn, respectively, with long and short lines.Halos enhance depth perception,4 although we imple-ment the halos with real-time antialiasing, blending,and apply it to pulsatile flow visualization.
Particle distributionDepending on the user’s goals, particle visualization
of flow data can achieve many synoptic visualizations.Initially, we released randomly colored particles into theflow with equal coverage throughout the volume. How-ever, we extended the system to address users’ desire tocontrol particle color and release strategies as well asclearly see near-wall flow.
Sponges. Particles are immediately released through-
out the vessel without any initial interaction. Users con-trol how many particles to release at each step and thetime between steps, but this only controls particles’ glob-al density. Sponges, as Figure 9 shows, let users modifyparticle color, release, and presence using paint strokes.
Emphasis. Emphasis controls let scientists focus ona type of pathline—for example, all slow paths—ratherthan all pathlines in a certain area. In practice, empha-sizing slow flow has let us focus on flow running nearthe artery walls or entering the side branch. Emphasisalso lets us focus on particles passing near the bat, whichare far more interesting than the others. We can easilybase emphasis on other metrics—radius of curvature,proximity to some location, or streamwise recirculation,for example. Figure 10 illustrates emphasis techniques.
User-settable parameters and commandsOur implementation has several user-settable para-
meters including release rate, simulation speed scalar,emphasis type, and two emphasis-related scalar values (ascaling coefficient and a power). Other commandsinclude particles clearing and sponge deletion. Current-
ly, users access these parameters and commands using aconventional keyboard on a table just inside our Cave.This approach won’t scale much further, and we’ve con-sidered using a command-line interpreter or a gestural ormore graphical user interface technique in the future.
Particle animation only shows velocity information,ignoring other flow quantities. To show more informa-tion near the reference geometry, we initially usedsplotches, circular geometries anchored to the referencegeometry and colored to reflect residence times andpressure gradients, as Figure 11 (next page) shows. Wealso use kelp to more directly visualize flow near the ves-sel wall. Some users prefer viewing the particle anima-tion and kelp together; others prefer to view one visualelement at a time, but quickly toggle between the two.
Stereo viewingUsers can toggle between stereoscopic and mono-
scopic viewing on the fly. In our tests, we typically start-ed users viewing in stereo; when we toggled them tomonoscopic viewing, they reported difficulty resolvingthe depth component of the flow and boundary geom-etry. When we restored stereo viewing they could easi-
IEEE Computer Graphics and Applications 9
9 Sponges in the artery. The red sponge on the left hasdeleted all flow that doesn’t go through the sidebranch, while the yellow sponge on the right has col-ored all flow entering the side branch.
(a) (b) (c)
10 Comparison of emphasis techniques in the artery. A user can focus on pathlines that share a specific quality using emphasis. (a)The user emphasizes paths with low minimum velocity and is more likely to release particles that go through the side branch or nearthe walls. (b) The user emphasizes no paths and is equally likely to release all particles. (c) The user emphasizes slow paths, releasingparticles near the walls more frequently.

ly determine the relative depth of particles and theirpositions within the boundary geometry. Texturing thevessel wall with the chicken-wire-like texture also makesthe wall much easier to see when viewed in stereo. Thetexture’s hard edges provide excellent visual cues forstereo convergence whereas a smooth-shaded modelappears cloudy. Making spatial judgments, such as thedistance between a particle and the vessel wall, is mucheasier with the textured model than with a nontexturedmodel. The texture also shows internal flow details fromexternal viewpoints.
Dynamic world scaleWe can dynamically change the scale of the world seen
in PF. This can be a useful control for both internal andexternal flows. For external flows, it lets us scale downthe data to produce an overview, or up to study a specif-ic region. For internal flows, we scale up the data to moveinside a space and comfortably view the data. For theartery data set, we generally scale the world so the arterywalls appear to be 8 feet apart, letting the viewer physi-cally move around inside it and minimizing the need forflying. Smaller diameters all but remove the need to nav-igate except by head movements and walking, but fus-ing stereo images when the user moves inside the arteryvessel is difficult. Moreover, the small size makes it hardfor users to appreciate the particle animation details.Larger scales, such as a 30-foot vessel diameter, decreaseparticles’ apparent density, but also dramatically increasethe amount of navigation required to see all the flow.
ConclusionWe believe PF creates an effective synoptic visualiza-
tion for pulsatile fluid flow. In general, we recommendvisualization designers first consider whether a synop-tic visualization approach might help solve their prob-lem better than an approach requiring more userinteraction to reveal the same amount of information.
Our future work is aimed at developing a method forcharacterizing fluid flow visualization techniquesincluding PF. We envision a framework in which userstudies, including experts in the scientific domain andvisual designers with an artistic background, would helpevaluate which flow structures a particular visualiza-tion technique helps viewers see and allow comparisonsbetween visualization techniques. ■
AcknowledgmentsThis work was supported in part by the US National Sci-
ence Foundation through grant CCR-0086065, andLawrence Livermore National Laboratory Research sub-contract No. B506432. This work used the Virtual Reali-ty Peripheral Network (VRPN) library, which is supportedby the US National Institutes of Health National ResearchResource in Molecular Graphics and Microscopy at theUniversity of North Carolina at Chapel Hill.
References1. T. Warburton, Spectral/hp Methods on Polymorphic Multi-
domains: Algorithms and Applications, tech. report, BrownUniv., 1999.
2. V. Interrante, H. Fuchs, and S.M. Pizer, “Conveying the 3DShape of Smoothly Curving Transparent Surfaces via Tex-ture,” IEEE Trans. Visualization and Computer Graphics, vol.3, no. 2, Apr._June 1997, pp. 98-117.
3. D. Keefe et al., “Cavepainting: A Fully Immersive 3D Artis-tic Medium and Interactive Experience,” Proc. ACM Symp.Interactive 3D Graphics, 2001, pp. 85-93.
4. V. Interrante and C. Grosch, “Strategies for Effectively Visu-alizing 3D Flow with Volume LIC,” Proc. IEEE Visualization,IEEE CS Press, 1997, pp. 421-424.
Jason S. Sobel is a technical assis-tant at Industrial Light and Magicin San Rafael, California. Hisresearch interests include scientificvisualization, mobile networks, anddistributed systems. Sobel has anMS in computer science from Brown
University.
Andrew S. Forsberg is a researchstaff member in the Brown Universi-ty Graphics Group. His researchinterests include developing 2D and3D user interfaces and virtual reali-ty applications. Forsberg has an MSin computer science from Brown.
David H. Laidlaw is an associateprofessor in the computer sciencedepartment at Brown University. Hisresearch interests include applica-tions of visualization, modeling,computer graphics, and computerscience to other scientific disciplines.
Laidlaw has a PhD in computer science from the CaliforniaInstitute of Technology.
Feature Article
10 March/April 2004
11 Wall splotches anchored on the artery walls. Colors along a spectrumfrom red to blue indicate high and low pressure. The standard technique ofmapping surfaces with scalar data helps guide the viewer to potentiallyinteresting regions to explore with PF.

Robert C. Zeleznik is Director ofUser Interface Research for BrownUniversity’s Computer GraphicsGroup. His research interests includepost-WIMP, gestural user interactionand design of 3D graphics applica-tion infrastructures. Zeleznik has an
MS in computer science from Brown.
Daniel F. Keefe is a PhD student incomputer science at Brown Universi-ty. His research interests includeartistic applications of virtual reali-ty, 3D user interfaces, and scientificvisualization. Keefe has a ScM incomputer science from Brown.
Igor Pivkin is a PhD student in theDivision of Applied Mathematics atBrown University. His research inter-ests include computational modelingof biomedical fluid dynamics, fluid-structure interaction in blood flows,and platelet aggregation. Pivkin has
an MS in mathematics from Novosibirsk State University.
George Em Karniadakis is aprofessor in the Division of AppliedMathematics at Brown Universityand a visiting professor at the Mass-achusetts Institute of Technology. Hisresearch interests include funda-mental numerical and theoretical
research in turbulence and fluid mechanics, as well as otheraspects of computational mechanics and scientific com-puting, in particular stochastic CFD. He has a PhD inmechanical engineering from MIT.
Peter Richardson is a professor ofengineering and physiology atBrown University. His research inter-ests include physiological biome-chanics, including flows in bloodvessels and graphic analysis fromintravascular ultrasound of struc-
ture and motion in blood vessel walls. He has a PhD in engi-neering and a DSc in physiology from the Imperial Collegeof Science, Technology, and Medicine of the University ofLondon. Richardson is also a Fellow of the Royal Society ofLondon and of the City & Guilds of London Institute, anda founding Fellow of the American Institute for Medicaland Biological Engineering.
Readers may contact Andrew S. Forsberg at Brown Uni-versity, Dept. of Computer, Science, Box 1910, Providence,RI 02912; [email protected].
IEEE Computer Graphics and Applications 11


![E from Liquid Suspensions in Channel Flowbeen made towards understanding the e ect of random or designed surface roughness on particle deposition from gas flows [4], particle interactions](https://img.pdfslide.us/doc/110x75/6010fa14b97eda7e264e0d24/e-from-liquid-suspensions-in-channel-flow-been-made-towards-understanding-the-e.jpg)