Embed Size (px)
Citation preview

KTH Chemical Engineering and Technology
Royal Institute of Technology School of Chemical Science and Engineering
Department of Chemical Engineering and Technology Division of Transport Phenomena
Particle Engineering by Spherical Crystallization: Mechanisms and Influence of Process Conditions
Jyothi Thati
Doctoral Thesis
Akademisk avhandling som med tillstånd av Kungliga Tekniska Högskolan i Stockholm framlägges till offentlig granskning för avläggande av teknologie doktorsexamen den 9 May 2011, kl. 10:00 i Lindstedtsvägen 3, Entrepl (E1), KTH, Stockholm. Avhandlingen försvaras på engelska.
i

Cover picture: Spherical agglomerates produced from the system water-ethanol-heptane by the spherical crystallization technique.
Particle Engineering by Spherical Crystallization: Mechanisms and Influence of Process Conditions Doctoral Thesis © Jyothi Thati, 2011 TRITA-CHE-REPORT 2011:30 ISSN 1654-1081 ISBN 978-91-7415-953-0
Royal Institute of Technology, KTH School of Chemical Science and Engineering Department of Chemical Engineering and Technology Division of Transport Phenomena SE-100 44 Stockholm Sweden
ii

ABSTRACT Spherical agglomerates of benzoic acid crystals have been successfully prepared by drowning-out crystallization in three solvent partial miscible mixtures. Benzoic acid is dissolved in ethanol, bridging liquid is added and this mixture is fed to the agitated crystallizer containing water as the anti-solvent. Small crystals are produced by crystallization of the substance, and the crystals are agglomerated through the action of the bridging liquid. Different solvents: chloroform, toluene, heptane, pentane, cyclohexane, ethyl acetate and diethyl ether are chosen as bridging liquids, all being low soluble in water and showing good wettability for benzoic acid crystals. The influence of process conditions such as concentration of solute, agitation rate, feeding rate, amount of bridging liquid and temperature on the properties of benzoic acid spherical agglomerates, are investigated. Different sets of experiments were accomplished to track how the properties of the particles gradually change during the normal spherical crystallization experiment. Other sets of experiments were performed to examine the influence of agitation and process time for agglomeration. The product properties such as particle size distribution, morphology and mechanical strength have been evaluated. The mechanical strength of single agglomerates has been determined by compression in a materials testing machine, using a 10 N load cell. Compression characteristics for single agglomerates are compared with the data on bed compression. The present study shows that the bridging liquid has significant influence on the product properties, using diethyl ether and ethyl acetate no agglomerates are formed. Using any of the other five solvents (chloroform, toluene, heptane, pentane, and cyclohexane) spherical agglomerates are formed, as long as a sufficient amount of the bridging liquid is used. Using cyclohexane as bridging liquid at 5°C and toluene at 20°C the particles are larger compared to particles formed at other conditions. The highest particle fracture stress is obtained by using toluene as the bridging liquid at 5 and 20°C. Particle morphology depends on the bridging liquid used and the particles are completely spherical when toluene and pentane are used as bridging liquids. Different process parameters are found to have a significant influence on the physico-mechanical properties of the product. The range of operation for spherical agglomeration is relatively narrow and only at certain conditions spherical agglomerates are produced. With increasing amount of bridging liquid the particle size and strength increase and the morphology improves. Particle size decreases and the fracture force increases with increasing feeding rate, but the morphology remains unchanged. For all the solvents, the particle size and the fracture stress increase with decreasing temperature. For four of the solvents the morphology improves with decreasing temperature. For cyclohexane the
iii

result is the opposite, in that the particles are spherical at 20°C and irregular at 5°C. Spherical agglomerates of benzoic acid, both as single particles as well as in the form of a bed, have a high compressibility and low elastic recovery, properties that are favorable for direct tabletting. As the feed solution is supplied to the crystallizer the amount of benzoic acid that can crystallize actually does crystallize fairly rapidly. Hydrodynamics are responsible for bringing particles together for the agglomeration. Experiments reveal that during the gradual addition of the feed to the agitated aqueous solution, both particle size and particle number increases. It is clear from the experiments that not only further addition of feed solution leads to larger product particles but also continued agitation. Along the course of the process the properties of the particles change gradually but substantially. By continued agitation, the particle porosity decreases, density, strength gradually increases and also the spherical shape develops gradually. Key words: Spherical agglomeration; Benzoic acid; Solubility; Phase diagram; Physico- mechanical properties (size distribution, particle morphology and crushing strength, elastic recovery, compressibility).
iv

LIST OF PAPERS This thesis is based on the following papers I. Katta, J., Rasmuson, Å. C., 2008. Spherical crystallization of benzoic acid. International Journal of Pharmaceutics. 348, 61-69. II. Thati, J., Rasmuson, Å. C., 2011. On the mechanisms of formation of spherical agglomerates. European Journal of Pharmaceutical Sciences. 42, 365-379. III. Thati, J., Rasmuson, Å. C., Particle engineering by spherical agglomeration of benzoic acid (Manuscript in preparation). IV. Thati, J., Nordstrom, F. L., Rasmuson, Å. C., 2010. Solubility of benzoic acid in pure solvents and binary mixtures. Journal of Chemical and Engineering Data. 55, 5124–5127. Additional Conference Contributions V. Katta, J*., Rasmuson, Å. C., 2006, Spherical Crystallization of benzoic acid, The 7th International Workshop on the Crystal Growth of Organic Materials, CGOM-7, University of Rouen, France (Poster presentation). VI. Thati, J*., Rasmuson, Å. C., 2008, Evaluation of bridging liquid on spherical crystallization of benzoic acid, The 7th International Workshop on the Crystal Growth of Organic Materials, CGOM-8 and Proc. 17th International Symposium on Industrial Crystallization, ed. J. P. Jansens and J. Ulrich, 369-376 (Poster and oral presentation). VII. Thati, J., Rasmuson, Å. C*., 2009, On the mechanisms of formation of spherical agglomerates, British Association for Crystal Growth (BACG), Bristol, UK (Oral presentation). VIII. Thati, J*., Rasmuson, Å. C., 2010, Influence of solvent in the spherical crystallization of benzoic acid, The 9th International Workshop on the Crystal Growth of Organic Materials, CGOM-9, Nanyang Technological University (NTU), Singapore (Oral presentation). * Presenter Additional publications not included IX. Yang, H., Thati, J., Rasmuson, Å. C., Solubility thermodynamics of molecular solids in organic solvents (Manuscript)
v

vi

NOTATIONS
Ts Tensile strength Pa
a,b Constants in Kuno and Kawakita’s eqns
BSR solid of volume
liquid bridging of volume
Cp Heat capacity J/ (mol.K)
Cs Concentration of solid g/ml
d Diameter m
dv Volume averaged diameter m
D Thickness of the tablet m
ER Elastic recovery ratio %
F Force N
H Height of the bed m
He Recovered size m
Hc Minimum size m
Hi Initial size m
k1 Heat capacity coefficient J/ (mol.K2)
k2 Heat capacity coefficient J/ (mol.K)
K Constants in Kuno and Kawakita’s eqns
Kv Shape factor
l Displacement m
L Length of the tablet m
M Mass kg
n Number of tappings
Np Number of particles
N Stirring speed rpm
p porosity
qt True density of the powder bed kg/m3
q0 Density of powder bed at the initial stage kg/m3
vii

s Saturation
T Temperature
Tm Melting temperature K
V Volume m3
Vn Volume of the powder bed after nth tapping m3
V0 Initial volume of the powder bed m3
∆Hf (Tm) Enthalpy at melting temperature J/mol
∆Sf (Tm) Entropy at melting temperature J/ (mol.K)
ρ Density of benzoic acid kg/m3
σ Stress MPa
ε Strain -
ρp Bed bulk density at maximum compression kg/m3
ρo Bed bulk density of the original powder bed kg/m3 ρv Density of spherical agglomerates kg/m3
viii

TABLE OF CONTENTS 1. INTRODUCTION ................................................................................................... 1
1.1. Scope............................................................................................................... 2 1.2. Objective ......................................................................................................... 3
2. LITERATURE REVIEW ....................................................................................... 5 2.1. Spherical Crystallization................................................................................. 5
2.1.1. General Description .................................................................................... 5 2.1.2. Influence of Process Parameters ................................................................. 8 2.1.3. Characterization Methods ......................................................................... 10
3. EXPERIMENTAL WORK.................................................................................. 13 3.1. Materials ....................................................................................................... 13
3.1.1. Benzoic acid.............................................................................................. 13 3.1.2. Solvents..................................................................................................... 14
3.2. Solubility, Phase Behaviour and Thermal Analysis ..................................... 14 3.2.1. Determination of Solubility in Individual and Mixed (2) Solvents .......... 14 3.2.2. Liquid-Liquid Phase Separation ............................................................... 15 3.2.3. Thermal Analysis ...................................................................................... 15
3.3. Spherical Crystallization............................................................................... 16 3.3.1. Apparatus .................................................................................................. 16 3.3.2. Procedure .................................................................................................. 16 3.3.3. Process Conditions.................................................................................... 17
3.4. Methods of Characterization......................................................................... 18 3.4.1. Size Distribution ....................................................................................... 18 3.4.2. Particle Morphology ................................................................................. 18 3.4.3. Strength Analysis ...................................................................................... 18 3.4.4. PXRD & GC ............................................................................................. 22 3.4.5. Contact angle measurement ...................................................................... 23
4. RESULTS AND ANALYSIS............................................................................... 25 4.1. Solubility, Phase Behaviour and Thermal Analysis ..................................... 25
4.1.1. Solubility................................................................................................... 25 4.1.2. Phase Behaviour........................................................................................ 26 4.1.3. Thermal Analysis ...................................................................................... 27
4.2. Mechanisms of Particle Formation ............................................................... 29 4.3. Influence of Process Parameters ................................................................... 36
4.3.1. Amount of Bridging liquid (BSR) ............................................................ 37 4.3.2. Feeding rate............................................................................................... 41 4.3.3. Temperature .............................................................................................. 44
4.4. Influence of Bridging liquid.......................................................................... 47 5. DISCUSSION....................................................................................................... 59 6. CONCLUSIONS................................................................................................... 65 7. REFERENCES ..................................................................................................... 67 8. ACKNOWLEDGMENTS .................................................................................... 75
ix

x
1. INTRODUCTION
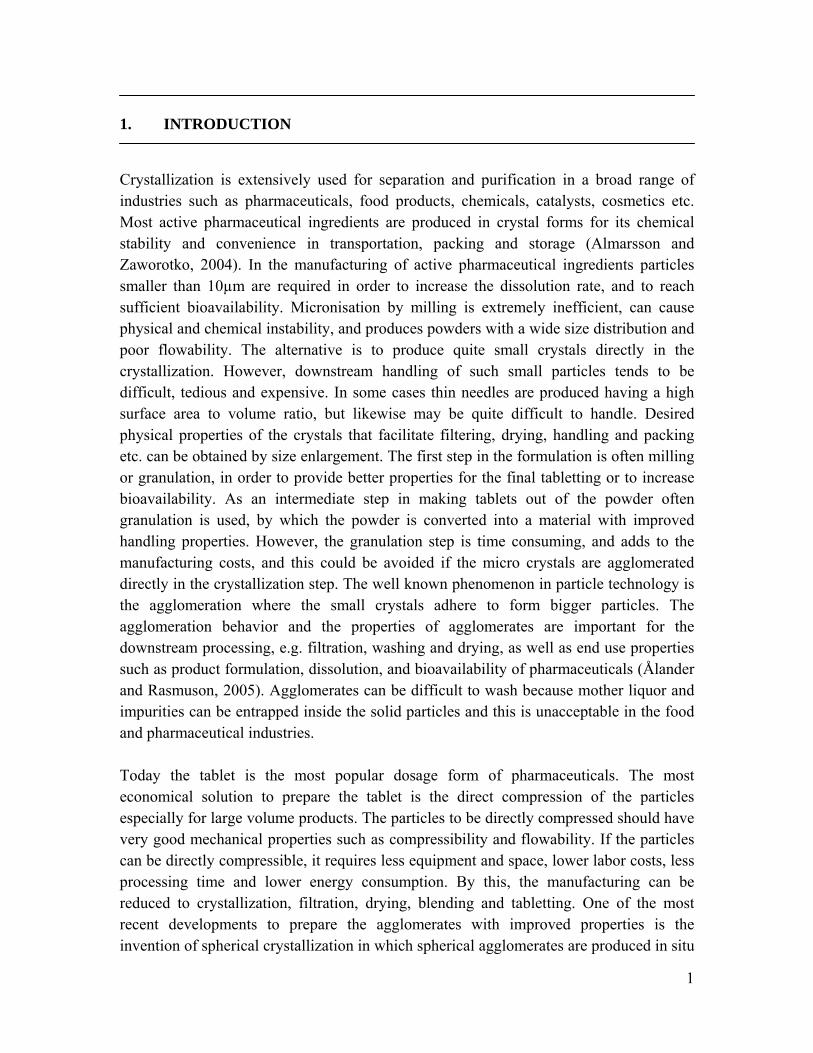
Crystallization is extensively used for separation and purification in a broad range of industries such as pharmaceuticals, food products, chemicals, catalysts, cosmetics etc. Most active pharmaceutical ingredients are produced in crystal forms for its chemical stability and convenience in transportation, packing and storage (Almarsson and Zaworotko, 2004). In the manufacturing of active pharmaceutical ingredients particles smaller than 10µm are required in order to increase the dissolution rate, and to reach sufficient bioavailability. Micronisation by milling is extremely inefficient, can cause physical and chemical instability, and produces powders with a wide size distribution and poor flowability. The alternative is to produce quite small crystals directly in the crystallization. However, downstream handling of such small particles tends to be difficult, tedious and expensive. In some cases thin needles are produced having a high surface area to volume ratio, but likewise may be quite difficult to handle. Desired physical properties of the crystals that facilitate filtering, drying, handling and packing etc. can be obtained by size enlargement. The first step in the formulation is often milling or granulation, in order to provide better properties for the final tabletting or to increase bioavailability. As an intermediate step in making tablets out of the powder often granulation is used, by which the powder is converted into a material with improved handling properties. However, the granulation step is time consuming, and adds to the manufacturing costs, and this could be avoided if the micro crystals are agglomerated directly in the crystallization step. The well known phenomenon in particle technology is the agglomeration where the small crystals adhere to form bigger particles. The agglomeration behavior and the properties of agglomerates are important for the downstream processing, e.g. filtration, washing and drying, as well as end use properties such as product formulation, dissolution, and bioavailability of pharmaceuticals (Ålander and Rasmuson, 2005). Agglomerates can be difficult to wash because mother liquor and impurities can be entrapped inside the solid particles and this is unacceptable in the food and pharmaceutical industries. Today the tablet is the most popular dosage form of pharmaceuticals. The most economical solution to prepare the tablet is the direct compression of the particles especially for large volume products. The particles to be directly compressed should have very good mechanical properties such as compressibility and flowability. If the particles can be directly compressible, it requires less equipment and space, lower labor costs, less processing time and lower energy consumption. By this, the manufacturing can be reduced to crystallization, filtration, drying, blending and tabletting. One of the most recent developments to prepare the agglomerates with improved properties is the invention of spherical crystallization in which spherical agglomerates are produced in situ
1

by the agglomeration of the small crystals during crystallization. Spherical crystallization combines several processes into one step, including synthesis, crystallization, separation and agglomeration (Lasagabaster et al., 1994; Kawashima, 1984). Among the advantages of the spherical agglomerates are good physico-chemical properties like compressibility, packability and flowability that improve mixing, filling and tabletting (Kawashima et al., 1995). The compressibility and tablettability of the spherical agglomerates of salicylic acid were improved due to their increased plastic property and reduced adhesive property compared to the original crystals (Kawashima et al., 1995). The micromeritic properties (size, roundness etc.) of agglomerated crystals and the mechanical properties such as flowability, packability, compactability were dramatically improved, resulting in successful tabletting. In pharmaceutical production improved flowability and compaction reduces the number of formulation components and processing operations. These agglomerates are also desirable for drug delivery since they are comprised of small crystals and contain a large surface area to volume ratio. Once these agglomerates are broken down to their constitutive crystals high dissolution rate as well as bioavailability is retained by these particles. Like other crystallization processes spherical crystallization is influenced by many process conditions. Currently no guidelines exist for the optimal selection of the parameters for the spherical crystallization of a particular drug. Spherical crystallization is affected mainly by solvent composition, amount of bridging liquid, agitation rate, temperature, feeding rate and concentration of solute. These parameters influence not only the productivity but also particle size distribution, morphology and strength of the product. The influence of the above parameters has been explored by several people earlier using, however, different materials as model compounds. Thus, a complete picture how these parameters influence the process can not be given.
1.1. Scope
In the present work benzoic acid has been chosen as a model compound. Benzoic acid normally crystallizes as needles or flakes that can be difficult to handle in downstream processing and are unsuitable for direct compression into tablets. The study includes evaluation of different experimental procedures and to elucidate the effects of various process conditions on the physico-mechanical properties of the product particles like size, shape and mechanical strength. Experimental procedure includes in particular different sequences for mixing the involved solvents whereas process conditions include solvent composition, amount of bridging liquid, concentration of solute, feeding rate, agitation rate, temperature and total experiment time. The solubility of benzoic acid in single and mixed solvents has been determined to see if we can draw any relation to the solubility and the properties of spherical agglomerates. This work also includes series of
2

experiments (Series B1, B2 and B3) for obtaining better understanding of the mechanisms behind the particle formation along the process. In series B1, the purpose is to be able to track how the properties of the particles gradually change during the corresponding spherical crystallization experiment. Because of that the experiment is entirely terminated when the desired amount of feed has been added, and the product is isolated and analyzed. In series B2, the difference to series B1 is that the agitation is continued for up to a total time of 1 hour after having fed the desired amount of feed solution. In the series B3, experiments were done at the conditions corresponds to B1 and B2 series experiments but the time for continued agitation varies and the feed amount is kept constant. The analysis of the product includes particle morphology, number of particles, particle size distribution, fracture stress, compressibility, elastic recovery, density, porosity, yield and contact angle of the solvents with the benzoic acid powder compacts. The spherical agglomeration has been done in different ways and one valid and most favorable method was selected for further studies (Paper 1). Different operating conditions have been explored for only one compound to get a complete picture of influence of parameters on the process. The trends in the properties of the spherical agglomerates with the physical properties of the bridging liquid have allowed the understanding of spherical crystallization and provided insight into the selection of the solvents. A crucial aspect of spherical crystallization is to specify the mechanism behind the formation of the particles and also to give an explanation for the obtained spherical shape. From the analysis of the experiments, in particular series B1, B2 and B3 the mechanisms have been proposed and discussed. The spherical agglomerates prepared using this method possesses good physico-mechanical properties like spherical shape, mechanical strength, compressibility and low elastic recovery that allows the particle to compress directly into tablet. An understanding of the influence of process conditions and the mechanism of spherical crystallization can significantly give benefits for the scale-up and control of the process.
1.2. Objective
The aim of the present research is to advance the engineering of pharmaceutical agglomerates, for the purpose of tailoring the properties by modulation of processing conditions and to understand the mechanisms of the spherical crystallization.
3

4

2. LITERATURE REVIEW
This review is divided into three main sections. First, a general description of the spherical crystallization is presented. In the second section, a review of previous research on the influence of process parameters on the spherical crystallization is given. In the third section, previous work on the development of characterization methods for spherical crystal agglomerates is described.
2.1. Spherical Crystallization
2.1.1. General Description
Spherical crystallization is a process in which spherical agglomerates are produced in situ during crystallization by the agglomeration of the small crystals into a spherical form. Spherical crystallization can be achieved by using four methods: 1. Spherical Agglomeration (SA) 2. Quasi Emulsion Solvent Diffusion (QESD) 3. Ammonia Diffusion system (ADS) 4. Neutralization (NT) Spherical agglomeration is used for the rapid separation of dispersed solids from liquids for wide range of applications (Capes et al., 1977). In the beginning Farnand et al., (1961), Sutherland (1962), discovered that adding barium sulfate in a mixture of benzene and small amounts of water would cause barium sulfate to form spherical clusters. A deeper study of spherical agglomeration was done in the 1960’s and 1970’s at the Canadian National Research Council (Farnand et al., 1961; Sutherland, 1962; Sirianni et al., 1969; Kawashima and Capes., 1974 and 1976). Their main interest of study was selective agglomeration of coal, but they also studied several other compounds (silica sand, glass and calcium carbonate). They studied the mechanisms, kinetics of spherical agglomeration, and the effect of process variables on the agglomerates.
Kawashima et al., (1982) gave a second boost to spherical crystallization by introducing this technique into pharmaceutical manufacturing in the early 1980’s and inspired research in other fields. The technique also was exploited in the preparation of food colorants (Lasagabaster et al., 1994), and new studies on selective recovery of fine mineral particles were conducted by Sadowski, (1995). Bausch and Leuenberger, (1994) have used it for protein crystallization as well. Spherical agglomeration provided a significant improvement to the production of pharmaceuticals with bioactive proteins.
5

They agglomerated hydrophilic proteins from organic solvents using water as bridging liquid which wets the particles and causes them to agglomerate spherically. The used spherical agglomeration has been extended to the agglomeration of several other pharmaceutical drugs. For example, acetylsalicylic acid, Goczo et al., (2000), fenbufen, Martino et al., (1999), aminophylline, Kawashima et al., (1982). In the spherical crystallization process, crystal formation, growth and agglomeration occur simultaneously within the same system. In this method, a third solvent called the bridging liquid is added in a smaller amount to purposely induce and promote the formation of agglomerates (Kawashima et al., 1994). Crystals are agglomerated during the crystallization process and large spherical agglomerates are produced. A near saturated solution of the drug in a good solvent is poured into a poor solvent. The poor and good solvents are freely miscible and the “affinity” between the solvents is stronger than the affinity between drug and good solvent, leading to precipitation of crystals immediately. Under agitation, the bridging liquid (the wetting agent) is added, which is immiscible with the poor solvent and preferentially wet the precipitated crystals. As a result of interfacial tension effects and capillary forces, the bridging liquid acts to adhere the crystals to one another and facilitates them to agglomerate (Kawashima et al., 1984). Many authors (Subero et al., 2006, Farnand et al., 1961, Kazuhiko et al., 2002, Kawashima et al., 1995 and 2002) have discussed the mechanism of spherical agglomeration. Chow and Leung (1996) and Farnand et al., 1961 suggested that when two immiscible solvents are present and one of the solvents preferentially wets the solid surface, a collision between two wetted particles forms a liquid bridge between the particles. This liquid bridge holds the particles together and further collisions cause formation of larger spherical agglomerates. This behavior is similar to liquid bridge formation in granulation, except the continuous medium is a liquid instead of a gas. Blandin et al., (2005), developed a phenomenological model based on the experimental observations on the system (salicylic acid-water-chloroform) and on analogy with the granulation process; it is assumed that the agglomeration mechanisms during the growth period are governed by the agglomerate deformability. After a brief period of wetting of the particles by the bridging liquid, the agglomerates grow by coalescence like process until they reach a maximum size and then agglomerates get compacted. Subero et al., (2006) and Muller and Loffler (1996) proposed two possible mechanisms based on the relative size of the droplets and the particles and on the physico-chemical properties of the system. In the first case, the average diameter of the droplets is smaller then the small binding liquid droplets coat the solid particles and enable them to agglomerate as irregular flocs. In the second case the average diameter of the droplets is larger than the primary crystals, and the droplets act as collectors and are covered by solid particles, which then penetrate and fill the interior of the droplets.
6

Generally, for the spherical crystallization, a mixture of miscible or partially miscible liquids is employed as the solvent system (Kawashima, 1984). Kawashima et al., (2003) found that depending on the miscibility of the solvent mixture spherical crystallization may occur via two different mechanisms i.e. quasi emulsion solvent diffusion (QESD) and spherical agglomeration (SA). Kawashima et al., (1995) described the spherical crystallization behavior in the miscible region of the three-solvent system in terms of the solubility phase diagram. Spherical agglomeration has got more importance than other methods because it is easy to operate and the selection of the solvents is easier than in the other methods. Quasi emulsion solvent diffusion method has the second importance, below all the methods are explained briefly. Quasi emulsion solvent diffusion is also known as transient emulsion method. In this method only two solvents are required (Kawashima et al., 1994), a solvent that readily dissolves the compound to be crystallized (good solvent), and a solvent that acts as an antisolvent generating the required supersaturation (poor solvent). In the ESD method (Sano et al., 1990, 1992) the “affinity” between the drug and the good solvent is stronger than that of good solvent and poor solvent. Because of the increased interfacial tension between the two solvents, the solution is dispersed into the poor solvent producing emulsion (quasi) droplets, even though the pure solvents are miscible. The good solvent diffuses gradually out of the emulsion droplets into the surrounding poor solvent phase, and the poor solvent diffuses into the droplets by which the drug crystallizes inside the droplets. The method is considered to be simpler than the SA method, but it can be difficult to find a suitable additive to keep the system emulsified and to improve the diffusion of the poor solute into the dispersed phase. Especially hydrophilic/hydrophobic additives are used to improve the diffusion remarkably (Ribardiere et al., 1996). In this method the shape and the structure of the agglomerate depend strongly on the good solvent to poor solvent ratio and the temperature difference between the two solvents (Espitailer et al., 1993). Using QESD method, Kawashima et al., (1989), directly agglomerated the fine crystals of antibacterial drug crystals without using any bridging liquid. Poorly compressible crystals of acebutolol hydrochloride were agglomerated by the QESD with a two-solvent system to improve the compressibility for direct tabletting (Kawashima et al., 1994 and 1995). Ueda et al., (1990) modified the spherical crystallization technique and developed a new agglomeration system i.e. ammonia diffusion system (ADS) which is applicable to amphoteric drug substances like enoxacin. In this method, ammonia water acts as bridging liquid and collects the fine crystals and transforms them into spherical agglomerates. Puechagut et al., (1998) and Gohel et al., (2003) have prepared
7

agglomerated crystals of norfloxacin and ampicillin trihydrate, respectively, by using ADS. Sano et al., (1992), reported spherical crystallization of anti-diabetic drug tolbutamide (TBM) by neutralization method. The drug was dissolved in a sodium hydroxide solution and in a hydroxypropylmethylcellulose aqueous solution. Hydrochloric acid was added to neutralize the sodium hydroxide solution and to crystallize out tolbutamide. The bridging liquid was added drop wise followed by agglomeration of the tolbutamide crystals.
2.1.2. Influence of Process Parameters
Important operating parameters in spherical agglomeration are the selection of the solvent system and amount of the bridging liquid, the agitation rate, concentration of the solid, temperature, poor solvent to feed ratio (drowning ratio) and feeding rate. Table 1: Suggested solvents and agglomeration methods for spherical agglomeration of various types of solids (Chow and Leung, 1996). SA= Spherical agglomeration, QESD = Quasi emulsion solvent diffusion. Compound Continuous phase Bridging liquid Method Soluble in water Water-immiscible
Organic solvent 20% calcium chloride solution
SA
Soluble in organic solvents
Water Water-immiscible organic solvent
SA
Soluble in water- miscible organic solvents
Saturated aqueous solution
Organic solvent mixture
QESD
Soluble in water or any organic solvent
Water-immiscible organic solvent
20% calcium chloride solution+ binding agent
SA
Spherical crystallization can only be possible through the particular combinations of solvents. The solvent system and composition is usually selected by trial and error. Very limited work has been done on the systematic selection of the solvent system for spherical crystallization. Most articles do not address the reasoning behind their solvent selection; Chow and Leung (1996) have found some general rules to use as a starting point. There are a few guidelines given in Table 1 to select solvents and to proceed further using different methods. Concerning the solvent composition, the first importance goes to the amount of bridging liquid required for the spherical agglomerates formation. Studies have been done to
8

optimize the amount of bridging liquid to be added to the system (Bausch and Leuenberger, 1994, Gonzalez and Biscans, 2002, Blandin et al., 2005). Depending upon the amount of bridging liquid the particles can either form loose flocs or compact pellets. It was found that below the optimum amount of bridging liquid plenty of fine particles were produced whereas above the optimum amount very large agglomerates were formed. In general, increasing amount of the bridging liquid leads to an increase in agglomerate size (Kawashima et al., 1981). Subero et al., (2006) developed the visualization cell to enable the observation of solids capturing by individual droplet. These experiments in the cell were also used to compare the saturation (ratio of the pore volume occupied by the bridging liquid on the total pore volume) of the bridging liquid in the agglomeration process. This could also be used as a first step in the design of the agglomeration process to select the bridging liquid and test different BSR values. The second process parameter that affects spherical crystallization is the hydrodynamics in the crystallizer. Various studies have reported effects of the agitation speed in the system and it is one of the main parameters determining the average diameter of agglomerated crystals. With increasing agitation speed of the system, the shear force applied increases lead to more consolidated agglomerates. The agglomeration process is less efficient above the optimum stirring rate because with increasing stirring rate the disruptive forces increases (Bos and Zuiderweg, 1987; Tambo and Watanabe, 1979). Blandin et al., (2003) found that at a higher stirring rate the final agglomerates tend to be less porous and more resistant. Capes and Sutherland (1967) showed that the final agglomerate size varied directly with the ratio of the interfacial tension to the initial solid particle size. Kawashima and Capes (1976) found that the initial solid particle size had a strong influence on the agglomeration process. Very fine particles required less amount of bridging liquid but the agglomerate size distribution was wider with decreasing particle size. Kawashima et al., (1981) found the agglomerate size increased with decreasing the size of the initial solid particles in the case of lactose. Kawashima et al., (1984), studied the temperature effect for spherical agglomeration of salicylic acid in (water-ethanol-chloroform) system. With increasing temperature the recovery of the crystals decreased because of the increased solubility of the compound. At low temperature the recovery of the crystals increased, where as the constituent crystal size and the solubility of chloroform in the solvent mixture decreased. The bulk density of the agglomerates decreased with increasing crystallization temperature. The large agglomerates produced at higher temperatures were bulky, less spherical and loosely compacted in a container leading to low bulk density. Temperature also affects the crystallization steps such as nucleation, crystallization and agglomeration of crystals. In
9

the kinetic studies, Kawashima and Capes (1984) confirmed that spherical agglomeration follows first order kinetics with respect to increasing number of agglomerates with time.
2.1.3. Characterization Methods
A wide range of methods has been applied to characterize spherical agglomerates. The physico-mechanical properties of the spherical agglomerates affecting the quality of tablets and capsules have been discussed in the literature. The methods have been developed mainly to characterize the particles for size distribution, morphology and mechanical properties such as compressibility, tensile strength, mechanical strength and elasticity. At first, the method to measure the particle size distribution (PSD) and shape of the spherical agglomerates is important as this influence other properties. The PSD is usually examined with sieve analysis (Kawashima et al., 1983, Kachrimanis et al., 1998, Morishima et al., 1993). Unfortunately, sieving may be destructive to the spherical agglomerates and can introduce errors into the size distribution measurement if the particles are not strong enough. There are some other sizing techniques such as image analysis by optical microscopy (Kawashima et al., 1985, Subero et al., 2006) or particle size analysis by a photographic counting method using a particle size frequency analyzer (Ueda et al., 1991). Different techniques are also used e.g. Chang et al., (2006), Re and Biscans (1999) used a Malvern master sizer to measure the PSD, Revesz et al., (2002) determined the particle size using Laborlux S light microscope and a quantimet 500MC image processing and analysis system and Kumar et al., (2008) used a precalibrated stage micrometer. Nayak et al., (2008) used Ankersmid CIS-50 particle size analyzer to determine the average particle size. The morphology and surface topography of the spherical agglomerates has been determined by using optical microscopy (Re and Biscans, 1999, Ettabia et al., 1997) and scanning electron microscopy (SEM) (Kawashima et al., 1995, Morishima et al., 1994, Revesz et al., 2002 and Machiya et al., 2008). Even though the optical microscope magnification is less compared to electron microscopes, it is advantageous to have an easy sample preparation and the operating is very convenient. The samples can also be collected after the analysis. SEM can provide high resolution and magnification images. SEM images of spherical agglomerates were used to examine the different mechanisms of spherical crystallization (Sano et al., 1992). The external and internal morphology of the spherical agglomerates, as well as the cross sections were examined by SEM. Puechagut et al., (1998) used polarized light microscopy to observe the morphology of the particles.
10

Porosity and density of spherical agglomerates are important factors in pharmaceutical applications since they directly influence the dissolution rate due to surface area effects. Agglomerate density is determined by comparing the agglomerate true density with its apparent density. The apparent density is determined using particle size and the weight of the sampled agglomerates (Morishima et al., 1993). Agglomerate true density can be found by pycnometry (Kawashima et al., 1981). Agglomerate bulk density is a loosest packing density of spherical crystals in a specified volume (Kawashima et al., 1984; Kawashima et al., 1994). Generally, larger spherical agglomerates were found to be less compact and therefore were more porous than small spherical particles. Mechanical properties such as compressibility, mechanical strength, elastic recovery, packability and flowability of spherical agglomerates are very important for the handling and bioavailability of the particles. Elastic recovery of spherical agglomerates can be evaluated by repeated cycles of compression. From the comparison of stress relaxations and elastic recovery the compressibility of the spherical and single crystals was estimated (Kawashima et al., 1995a). From the analysis it was found that the spherical agglomerates were more compressible and suitable for dosage than conventional crystals. Several studies were done to reveal the tensile strength (the resistance of the tablet to crushing) of the tablets prepared from spherical agglomerates (Morishima et al., 1993, Kawashima et al., 1991, 1994, Sano et al., 1992). Tensile strength is calculated by using the below equation
DLFTs π
2=
F is the compression force required to fracture the tablet, D and L are the diameter and the thickness of the tablet, respectively. Several authors have studied flowability, packability and compaction of the spherical agglomerates (Niwa et al., 1994, Nokhodchi et al., 2007, Kawashima et al., 1994 and 2003). The flowability is measured by the determination of angle of repose and Carr’s index (CI). Angle of repose was determined by fixed funnel method (Podczeck and Jones 2004). In this method powder flows out of a funnel to form a powder heap, from which the angle of repose can be determined by simple geometrical means. Carr’s index was calculated from the poured and tapped densities. Tapped density was determined using a tapping machine by tapping the samples into a 2.5 ml measuring cylinder. Low angle of repose and Carr’s index represents higher flowability.
11

⎥⎦
⎤⎢⎣
⎡×
−= 100
density Tappeddensitybulk density TappedCI
The packability of the particles was investigated by measuring the tapped density. According to Kawakita and Kuno’s equations (Nokhodchi et al., 2007) packability can be estimated from the volume and density of the packed particles as a function of tappings. Kawakita Eqn :
0
0
)(1
VVV
whereCan
abCn n−
=+=
Kuno Eqn:
)ln()ln( 0qqKnqq tnt +−=− −
Here n is the number of tappings, C is the volume reduction, V0 and Vn are the initial volume of the powder bed before tapping and after the nth tapping, respectively. The true density is qt,, the density of the powder bed at the initial stage is q0 and at the nth tapping is qn. The constants a, b, and K represent, packability of the powder under mechanical force (1/a represents compactability and 1/b is cohesivity). The smaller value of parameter ‘a’ indicates higher packability, the larger value of ‘b’ indicates higher packing velocity by tapping and higher K indicates the higher rate of packing.
12

3. EXPERIMENTAL WORK
3.1. Materials
3.1.1. Benzoic acid
Benzoic acid, also called benzene carboxylic acid and phenyl carboxylic acid is a colorless crystalline solid and has the molecular formula C6H5COOH and is shown in Figure 1. It has a molar mass of 122.123 g/mol, a density of 1316 kg/m3, a melting point of 122.4°C and a boiling point of 249.2°C. The solubility of benzoic acid in pure water is 0.0034 g of benzoic acid /g of solution and in ethanol 0.584 g of benzoic acid /g of solution at 25°C (Othmer, 1992). Benzoic acid and its salts are used mainly as food preservative against yeast and mould. It is used to make a large number of chemicals such as phenol and benzoate plasticizers. Benzoic acid is also used as bacteriostatic and bactericidal agent and acts as antiseptic stimulant and also an ingredient in Whitfield’s ointment in treatment of ringworm. It is also used in cosmetics, resin preparation and plasticizers etc. Benzoic acid has been chosen for this study as a test substance because it gives needle like crystals which are difficult to handle and have poor tabletting properties (Figure 1). The solubility of benzoic acid in different solvents, the crystal growth and habit, solvent effects and also influence of process conditions on crystallization have been explored in previous studies (Davey, 1978, Mersmann, 2001, Åslund and Rasmuson, 1992, Holmbäck and Rasmuson, 2002). In the present study an attempt was made to improve the particle properties of solid benzoic acid by using spherical agglomeration method.
C
O
OH
Figure1. Benzoic acid (C6H5COOH); Needle like benzoic acid crystals
13

3.1.2. Solvents
Solvents used in this work were chosen based on the principle of spherical crystallization and are given in the Table 2. As for simple spherical agglomeration the first solvent (ethanol) should have a good solubility with benzoic acid. The second solvent (water) is an anti solvent which is used to crystallize the benzoic acid from the feed solution. The third solvent which acts as a bridging liquid and which was varied in the present work will be immiscible with the second solvent. Many solvents were considered to use as bridging liquids based on the immiscibility with water. Those included are carbon tetrachloride, chloroform, cyclohexane, 1,2-dichloroethane, diethyl ether, dimethylformamide, dichloromethane, ethyl acetate, heptane, hexane, methyl tertiary-butyl ether, pentane, toluene, methylene chloride and 2,2,4-trimethylpentane. Except chloroform, the most suitable solvents for industrial use were selected for spherical agglomeration. Table 2: Solvents used as bridging liquids (Murov, 1997) Solvents Boiling
point (°C) Solubility in water g/100g of water at 20°C
Chloroform 61.2 0.8 Toluene 110.6 0.05 Heptane 98.4 0.01 Cyclohexane 80.7 <0.1 Pentane 36 0.04 Diethyl ether 34.6 6.9 Ethyl acetate 77.1 8.3
3.2. Solubility, Phase Behaviour and Thermal Analysis
3.2.1. Determination of Solubility in Individual and Mixed (2) Solvents
The solubility of benzoic acid was determined by the gravimetric method (Nordstrom and Rasmuson, 2006) in pure ethanol, heptane, toluene, cyclohexane, pentane and chloroform, in a temperature range of (5 to 50) °C. The solubility was also determined in the binary mixtures in the range of 10 to 50 % of heptane or toluene in ethanol. For example, to prepare a 10% solution 10 g of heptane or toluene and 90 g of ethanol are taken in a 250 ml bottle to which a certain amount of benzoic acid was added. Saturation was reached by dissolution from a surplus of solid benzoic acid added to the solution. The attaining of equilibrium was verified by continuous concentration measurements over time and when there is no change in concentration that time is considered as the time
14

to reach equilibrium. The temperature was controlled by thermostated baths, and the true temperature was validated by using a calibration mercury thermometer (Thermo-Schneider, Wertheim, Germany, uncertainty of + 0.01). The solubility is determined in temperature steps starting at 5oC. The bottle with solvent or solvent mixture is initially cooled to 5oC to which an amount of benzoic acid is added. The solution is stirred by magnetic stirrer for 2 hours, and is then turned off to allow suspended solid phase to settle down for 30 min. Syringes (10 ml) with needles were used to sample (2 to 5 ml) of the solution from the bottles. Then a filter (PTFE 0.2µm) is mounted on the syringe through which the solution was transferred into pre-weighed glass vials. After taking the sample from the saturated solution at 5oC the same solution was heated to 10oC then to 20oC and so on up to 50oC for further measurements, there by assuring that solid benzoic acid is still present at equilibrium. For sampling of the solution at high temperatures (30 to 50) oC, preheated syringes were used to avoid the crystallization in the syringes. The weight of the vials with the saturated solution was recorded. The samples were dried in ventilated laboratory hoods at room temperature (20 oC). The solid sample mass was recorded repeatedly throughout the drying process to establish the point where the weight remained constant. The weight of the final dry sample is then used for calculation of the solubility. The balance used during the experiment work had a resolution of + 0.0001 g. For each data point the average of four measurements were reported, 2 samples each of 2 equal experimental solutions.
3.2.2. Liquid-Liquid Phase Separation
The phase diagram of the three solvents (water-ethanol-toluene) at the temperature of 20°C has been investigated. Different ratios of poor solvent (water) and good solvent (ethanol) were mixed in conical flasks and a small quantity of iodine was added to enable observation of the phase separation point. Toluene was added carefully with a syringe and the mixture was shaken vigorously by hand. When phase separation occurred, a small violet droplet was clearly observed. Only the solvent system (water-ethanol-toluene) has been investigated.
3.2.3. Thermal Analysis
Melting points, enthalpy of fusion at the fusion temperature and specific heat capacity of benzoic acid were determined by using differential scanning calorimeter (DSC), TA Instruments, DSC 2920. The calorimeter was calibrated against the melting properties of indium. To gain the melting data samples (2 to 3 mg) were heated at the heating rate of 5 °C/min, from (20 to 200) °C in hermetically sealed aluminum pans and purged with nitrogen at a rate of 50 ml.min-1. The specific heat capacity of the benzoic acid was determined with modulated DSC, using the same instrument. A modulation period of
15

100s and amplitude of 1°C were used; together with a constant heating rate of 3°C/min proceeded by an initial isothermal period of 10 min. The samples were heated from 20 to 150°C in hermetically sealed aluminum pans. Pans were selected so that the difference in weight between sample pan and reference pan was +0.10 mg. To determine the heat capacity of the melt at first the samples were heated up to 200°C. But the sample was evaporating at higher temperatures, this can be observed from the slope of the heat capacity curve and also it was confirmed by weighing the sample after the run. Half of the sample was evaporated if the heating is continued to 200°C. So the sample was only heated up to 150°C. The sample was weighed and found that there is no sublimation if it is heated up to 150°C. In different scans the same sample was heated and cooled two times, to observe if there is any deviation between two runs. There was no significant difference found in same sample heating or cooling curves. But there was 5% deviation between different scans, which strongly depends on the contact between the sample pan and the DSC cell. It may also be because of the sample packing inside the pan and weight differences of the samples, purity might also play a role. The instrument was calibrated according to the standard procedure against the melting properties of indium, and the heat capacity signal was calibrated with three runs of a sapphire sample in the relevant temperature interval. A linear calibration curve rather than a calibration constant was used, based on the average of the six sapphire sample runs.
3.3. Spherical Crystallization
3.3.1. Apparatus
A 250 ml (6 cm in diameter) flat bottom jacketed crystallizer, was used for spherical agglomeration, equipped with a three-blade marine propeller (2.5 cm in diameter), feeding pump (Yale Apparatus, syringe pump YA-12), and heat & refrigerated circulation unit (Julabo, FP50-HP).
3.3.2. Procedure
Benzoic acid is dissolved in ethanol at 40°C to prepare an under-saturated solution for ensuring that everything is dissolved. The obtained solution is cooled to 20°C and the required amount of bridging liquid is added. This mixture is fed by a syringe pump (syringe pump YA-12), at the selected feeding rate, onto the surface of 76 ml of water agitated with a three-blade marine propeller (2.5 cm in diameter) at certain stirring speed in a 250 ml jacketed crystallizer (6 cm in diameter). The agitator was centrally located at fixed distance (1 cm) from the bottom of the crystallizer. The temperature was adjusted via a heat and refrigeration circulation unit (Julabo, FP50-HP) to a required temperature. After some time the experiment is terminated and the agglomerates are filtered, washed with water and dried at room temperature. All the experiments in this thesis are done by
16

using this procedure if not mentioned. Except series B1 and B2 experiments, the feed amount (ethanol + bridging liquid + benzoic acid) used in all other experiments is 23ml.
3.3.3. Process Conditions
Chloroform, toluene, heptane, cyclohexane, pentane, diethyl ether and ethyl acetate were used as bridging liquids in the present work. Different amounts of bridging liquid (BSR), stirring rate and initial concentration of solid using chloroform as a bridging liquid are studied by using process A (Paper 1). BSR is defined as ratio of volume of bridging liquid to volume of solid originally dissolved. The volume of solid is determined as the weight of solid originally dissolved divided by the density of Benzoic acid (1316 kg/m3, Othmer, 1992). All other experiments were done by using the process given in the present thesis. Amount of bridging liquid (BSR), feeding rate, different feed amounts, agitation time are studied using toluene as bridging liquid (Paper 2). Temperature, BSR and agitation time are studied by heptane as bridging liquid and the influence of different solvents are also explored (Paper 3). Several experiments were done by using toluene as bridging liquid, with different amounts of feed and at different agitation times. These experiments were divided into three series B1, B2 and B3. In series B1 and B2, different amounts of feed solution are fed into the crystallizer (series B1: 1, 2.5, 5, 7.5, 10, 15, 20 and 23 ml; series B2: 1, 2.5, 5, 7.5, 10, 15, 20, 23, 30 and 35 ml). In series B1, the purpose is to be able to track how the properties of the particles gradually change during the corresponding normal experiments. Because of that the experiment is entirely terminated when the desired amount has been added, and the product is isolated and analyzed. In series B2, the difference to series B1 is that the agitation is continued for up to a total time of 1 hour in each experiment, regardless of when the feeding has been terminated. In the series B3, the time for continued agitation varies 30, 45, 60, 90 and 150 min of total processing time. Different amounts of bridging liquid (BSR): 0.47, 0.58, 0.7, 0.8, 0.93, 1.05, 1.16 and 1.28, different feeding rates 1.7, 2.7, 3.7, 4.7, and 9.7; (ml/min), were also evaluated. If not mentioned all these experiments were done at these conditions; at 20°C, benzoic acid concentration in ethanol used is 0.375 g/ml, stirring rate is 600 rpm, feeding rate is 1.73 ml/min, the feed amount used is 23 ml, BSR 0.93, and agitation is continued up to a total processing time of 1 hour. Experiments using heptane as bridging liquid were performed at 5°C exploring different BSR (0.72, 0.82, 0.92, 1.02, 1.12 and 1.23). Experiments were done with the different experiment times (30, 60, 90, 150 min) were studied using BSR of 1.02. Experiments were also performed at different temperatures (5, 10, 20 and 30°C) to describe the effect of temperature on spherical agglomeration. Some solvents (chloroform, toluene, cyclohexane, pentane, heptane, diethyl ether and ethyl acetate) were used as bridging
17

liquids at 5 and 20°C and at different BSR. For all these solvents some experiments are performed using different amounts of bridging liquid to find the optimum BSR. All these experiments were done at the feeding rate of 1.73 ml/min, benzoic acid concentration in ethanol used is 0.375 g/ml, stirring rate 600 rpm, the feed amount used is 23 ml and agitation is continued up to a total processing time of 1 hour.
3.4. Methods of Characterization
The influence of the processing parameters on particle size distribution, morphology and compression strength has been evaluated. Number of particles, porosity and density of the spherical agglomerates are also evaluated. Particles are also examined for polymorph screening and to detect the entrapped solvent in the agglomerates. Finally the contact angle measurements were made on benzoic acid compacts.
3.4.1. Size Distribution
For the determination of the particle size distribution the dried spherical agglomerates were sieved with woven wire test sieves of DIN 4188 standard. The sieve stack was shaken for 10 min after which the fractions were weighed. The sieving was carried out in 10 min intervals until the weight of the different fractions remained constant. The particle size distribution is obtained from measuring the weight of the sieve fractions and are presented as cumulative over size mass distributions.
3.4.2. Particle Morphology
The morphology of the agglomerates from each sieve fraction was examined by optical microscopy (Olympus SZX12). Particles are also examined using Scanning electron microscope (SEM JEOL Carry Scope JCM 5700). Agglomerates were also gently crushed using a spatula for microscopic examination. The surface morphology of the spherical agglomerates, as well as the cross sections was examined by SEM.
3.4.3. Strength Analysis
The mechanical strength of single agglomerates was determined by compression in materials – testing machine (Zwick Z2.5/TSIS), which has a 10 N load cell. For single particle compression the maximum force used is 1 N, which corresponds to a maximum stress of 0.8 MPa based on the particle cross sectional area. For a bed of particles the maximum force used is 10 N, which corresponds to a maximum stress of 0.19 MPa based on total bed cross sectional area. As shown in Figure 2, single agglomerate was placed on a flat and horizontal surface. A gradually increasing load was applied to the agglomerate by a constant movement of the upper plane towards the lower plane with a speed of 0.5
18

mm/min. To define the starting point of the compression, a force threshold of 10 mN is used to record the moment when the punch gets in contact with the agglomerate. An extensometer is used to identify the corresponding distance between the upper and lower surfaces of the equipment. This distance is then used to define the initial diameter (d) of each agglomerate. The measured force was plotted versus displacement. The force increases linearly until the first breakage of the particle (Figure 3a). There is a sudden drop in the force after the first breakage and then the force increases rapidly because of the densification. The several small peaks represent the breakage of crystalline bridges during the compression. The agglomerate strength was determined as the force required for the first breakage of the spherical agglomerate. To determine the compressibility and elastic recovery of particles, about 100 to 150 mg of agglomerates were poured into a cylindrical steel cup (8.2 mm in diameter) and the powder bed was compressed. The accuracy of the instrument is +0.5 % of the measured force value. The force displacement curve from the compression of the bed of the particles is linear without any peaks (Figure 3b).
Figure 2. Compression of the spherical agglomerates. The measured force (F) - displacement (l) curve (3a) is recalculated into a stress (σ) - strain (ε) curve by Eqns 1 and 2, using the diameter d measured for each particle. The force is increasing linearly with the displacement.
⎟⎟⎠
⎞⎜⎜⎝
⎛=
4
2dFπ
σ (1)
dl
=ε (2)
19

(a) Single particle 1st breakage
(b) Bed of the
particles
Figure 3. Force vs. displacement plot for determination of the strength a) single spherical agglomerates, b) bed of the agglomerates, bridging liquid= toluene, sieve size 1600-2000 µm For few agglomerates repeated compression – release cycles were conducted at a movement speed of 0.5 mm/min to evaluate the elasticity of the single agglomerates. The first compression to a maximum force of 1 N was maintained for about 100 sec and repeated cycles of compression took 7 to 10 sec each time. Initial size (Hi) and minimum size (Hc) of the agglomerate at maximum compression were determined, as well as the size of the particle after releasing the load (He) to determine the elastic recovery (ER). The elastic recovery for each compression was calculated by Eqn. (3) (Fichtner et al., 2007).
Elastic Recovery = ⎥⎦
⎤⎢⎣
⎡−−
ci
ce
HHHH (3)
20

As a complement, also the corresponding compression characteristics have been determined for a bed of particles. About 100 to 150 mg of agglomerates were poured into a cylindrical steel cup (8.2 mm in diameter) and the bed was compressed in the same way as the single agglomerates, however up to a maximum load of 10 N. First compression was maintained for 200 to 300 sec and repeated cycles of compression took about 70 sec each time. The compressibility index of the powder bed is determined as
Compressibility Index = i
ci
p
p
HHH −
=−
ρρρ 0 (4)
where pρ is the bed bulk density at maximum compression and 0ρ is the bed bulk density of the original powder bed (Fichtner et al., 2007). The compression data of the 30 particles from each sample have been exported to Excel (Microsoft Office Excel 2003) and then to Origin (Origin 6.1) for determination of an average stress-strain curve. The stress - strain curve for a single particle contains roughly 3000 values. For each strain value an average stress value is calculated from the 30 curves by using the Origin module: “Averaging multiple curves, version 6”. When required the program interpolates or extrapolates data while calculating the average Y value. Number of particles have been determined by actually counting all the particles on each sieve fraction of the relevant experiments. The particle density is determined by using Eqn 5 (Lee et al., 2010) for different sieve (1000-2000 µm) fractions and the average is reported.
13 KdK
NM
vvvp
== ρ (5)
where M is the cumulative mass and Np is the cumulative number, ρv is the particle density, Kv is shape factor, dv is the volume averaged diameter of the upper and the lower
sieve aperture of the sieve fraction: 3 32
31 )(
21 dddv += (d1 and d2 are lower and upper
sizes of the specific sieve fraction), and K1 is the slope when plotting M vs. N. For this calculation the particles are assumed to be spherical by which 6
π=vK . Particle porosity
(p) is calculated by Eqn 6 (Fichtner et al., 2007):
21

ρvpPorosity =)( (6)
ρρ −
where ρ density of the benzoic acid and ρv is density of the spherical agglomerates. Agglomerate saturation with bridging liquid (s) is defined as the ratio of the pore volume ccupied b
y the binding liquid on the total pore volume. Using BSR and the mean gglomerate porosity (p), the saturation (S) can be evaluated from the Eqn 7 (Blandin et
al., 2005).
oa
( )p
pBSRs −=
1 (7)
d Randaccio, 1980) has een found. PXRD data is obtained for the spherical agglomerates prepared using
t steadily ecreases by about 0.2%/day even after 5 days because of the benzoic acid sublimation, ut Gas chromatography could not detect any toluene after this time of drying.
3.4.4. PXRD & GC
A powder X-ray diffraction study was carried out to exclude any polymorphic transition during the benzoic acid crystallization. No polymorphic phenomenon is detected using X-ray diffraction. Only the normal crystallographic form (Bruno anbchloroform, toluene as bridging liquids and is shown in Figure 4. Spherical agglomerates have been dried for 5 days at room temperature in open air in the fume hood and after that in a vacuum dryer at 25°C and for 3 hrs. The weighdb
22

Figure 4. X-ray diffraction of the spherical agglomerates
3.4.5. Contact angle measurement
To determine the wetting ability of different solvents with benzoic acid contact angle measurements were done using a Goniometer (CAM200, KVS Instruments Ltd). Contact angle measurements using selected solvents are employed on compacts of benzoic acid by the sessile drop method. About 200 mg of benzoic acid particles with a size of 200-300 µm was compressed into discs (10 mm diameter and 2 mm thick) using a hydraulic press. Different forces (20 and 50 kN) were used to compress the powder into discs. The powder was loaded into the die using a funnel and the die assembly was kept in the hydraulic press. The load was applied for 1 min and then the disks removed carefully from the die set. Equilibrium contact angles of pure water, cyclohexane, heptane, pentane, toluene, chloroform, ethyl acetate and diethyl ether were determined with a Goniometer attached
23

to a microscope. Each drop (5 to 6 µl) was placed on the surface of the compact. The contact angles were measured on two sides of each drop. The difference between each drop ranged from 0 to 2°. At least 3 measurements were done for each liquid. All the organic solvents specified above have spread immediately on the benzoic acid compact i.e., the contact angle is 0°, but with water droplet the surface of the compact has a contact angle of 43°. Muster and Prestidge (2002) measured contact angles on powder compacts and single crystals and found the similar results, so in the present work the contact angles were measured on the disks.
24

4. RESULTS AND ANALYSIS
4.1. Solubility, Phase Behaviour and Thermal Analysis
4.1.1. Solubility
The mole fraction solubility of benzoic acid in pure solvents (ethanol, toluene, heptane, cyclohexane, pentane and chloroform) is shown in Figure 5. The solubility of benzoic acid in the binary solvent mixtures (ethanol + toluene) is shown in Figure 6. Other results regarding solubility can be found in paper 4. In Figure 6 the solubility is given as weight fraction (g of benzoic acid / g of solution on solute free basis) for binary solvent mixtures. Since the melting temperature of cyclohexane is 6°C and the boiling point of pentane is 36°C, the data for these solvents do not cover the entire temperature range. Solubility of benzoic acid in all pure solvents is low, only in ethanol, benzoic acid is highly soluble. The solubility decreases in the order of ethanol, chloroform, toluene, cyclohexane, heptane and pentane. With increasing temperature the solubility of benzoic acid for all solvent mixtures as well as in pure solvents increased. The solubility of benzoic acid is decreasing with increasing the toluene or heptane (paper 4) concentration in ethanol.
-6
-5
-4
-3
-2
-1
3 3.2 3.4 3.6
103 K/T
ln (X
eq)
Figure 5. Solubility, of benzoic acid in pure solvents at (5 to 50) oC given in mole fraction (average of four samples) ♦, Ethanol; ■, Chloroform; ▲, Toluene; ∆, Cyclohexane; ●, Heptane; o, Pentane.
25
0
0.2
0.4
0.6
0.8
1
1.2
0 0.1 0.2 0.3 0.4 0.5
% of Toluene
Solu
bilit
y (g
/g) 5C
10C20C30C40C50C
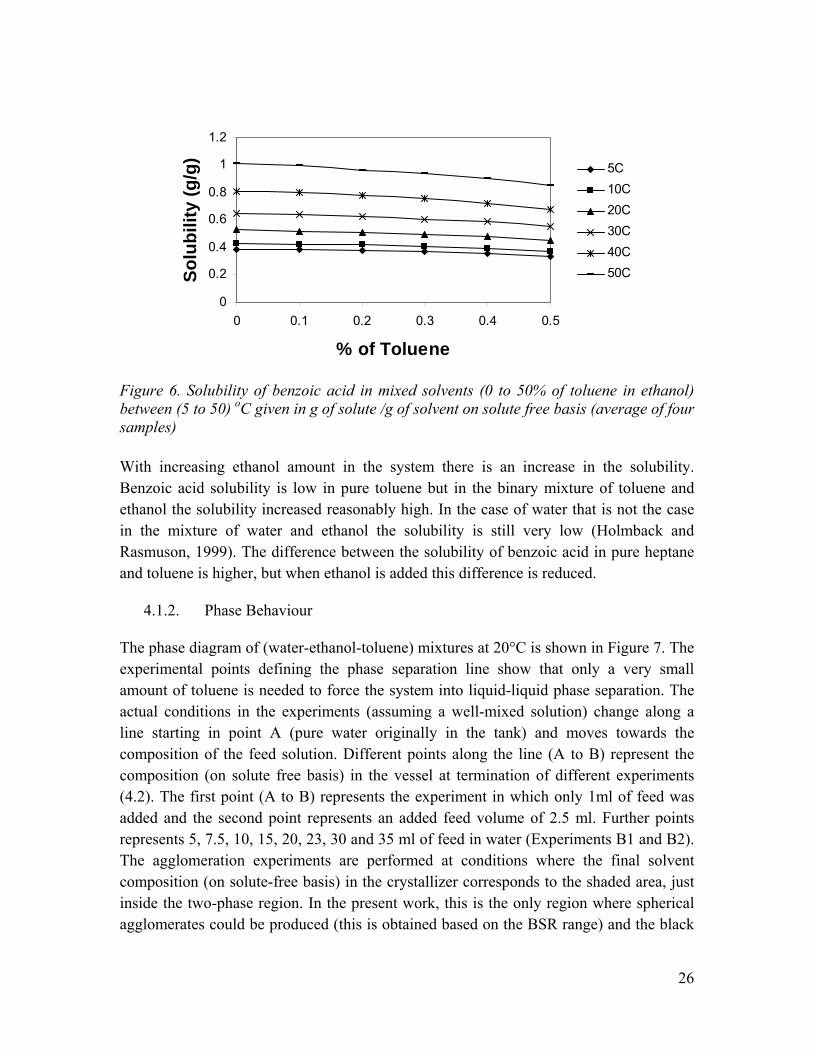
Figure 6. Solubility of benzoic acid in mixed solvents (0 to 50% of toluene in ethanol) between (5 to 50) oC given in g of solute /g of solvent on solute free basis (average of four samples) With increasing ethanol amount in the system there is an increase in the solubility. Benzoic acid solubility is low in pure toluene but in the binary mixture of toluene and ethanol the solubility increased reasonably high. In the case of water that is not the case in the mixture of water and ethanol the solubility is still very low (Holmback and Rasmuson, 1999). The difference between the solubility of benzoic acid in pure heptane and toluene is higher, but when ethanol is added this difference is reduced.
4.1.2. Phase Behaviour
The phase diagram of (water-ethanol-toluene) mixtures at 20°C is shown in Figure 7. The experimental points defining the phase separation line show that only a very small amount of toluene is needed to force the system into liquid-liquid phase separation. The actual conditions in the experiments (assuming a well-mixed solution) change along a line starting in point A (pure water originally in the tank) and moves towards the composition of the feed solution. Different points along the line (A to B) represent the composition (on solute free basis) in the vessel at termination of different experiments (4.2). The first point (A to B) represents the experiment in which only 1ml of feed was added and the second point represents an added feed volume of 2.5 ml. Further points represents 5, 7.5, 10, 15, 20, 23, 30 and 35 ml of feed in water (Experiments B1 and B2). The agglomeration experiments are performed at conditions where the final solvent composition (on solute-free basis) in the crystallizer corresponds to the shaded area, just inside the two-phase region. In the present work, this is the only region where spherical agglomerates could be produced (this is obtained based on the BSR range) and the black
26

(circled) region represents the solvent composition for the experiments where the influence of BSR has been studied with toluene as bridging liquid (4.3.1).
Figure 7. Solvent phase diagram for the system (ethanol-water-toluene) given in mass %; T=20°C, ■ phase separation line, (●) A to B feed points (experiments B1 and B2); bold black shaded region= solvent composition inside the crystallizer (Section 4.3.1 experiments).
4.1.3. Thermal Analysis
The average melting enthalpy of benzoic acid is given in Table 3 and it was found to be 16.82 kJ.mol-1 (9 scans, standard deviation 0.58 kJ.mol-1). Average peak fusion temperature was determined to 122.6 oC (9 scans, standard deviation of 0.08 oC) and the
27

corresponding average onset fusion temperature is 121.8 oC (9 scans, standard deviation of 0.06 oC). The enthalpy of fusion has also been reported by Roberts and Jeanette, (1985) as 17.3 kJ.mol-1 at the melting temperature of 122.5 oC and by Othmer (1992) to 17.9 kJ.mol-1. The melting enthalpy value of the present study is in good agreement with the literature given by Budavari et al., (1996), Oliveira et al., (2007) and Robert and Jeanette, (1985) (15.9 < ∆Hf < 17.4 kJ.mol-1). Table 3. Enthalpy of fusion at the melting temperature and the melting temperatures (peak and onset) of benzoic acid from DSC at 5°C/min.
Scans
∆Hf(Tm)/ kJ.mol-1
∆Sf(Tm)/ J. K-1. mol-1
Peak TmoC Extrapolated
onset TmoC
9 16.82 + 0.58 42.59 122.6 + 0.08 121.8 + 0.06 9 scans for the heat capacity of the solid and 7 scans for melt were taken and the average was determined by using the Origin module: “Averaging multiple curves, version 6”. When required the program interpolates or extrapolates data while calculating the average Y value. This curve is fitted into a regression model and shown in Figure 8.
21 kTkC p += (7) The heat capacity coefficients are summarized in Table 4. Table 4. Heat capacity coefficients of Eqn. 7 Scans Temperature/oC k1/J.K-2.mol-1 k2/J.K-1.mol-1 Solid 9 20 to 110 0.4539 53.646 Melt 7 88 to 150 0.6499 22.646
28

Cp (solid) = 0.4539x + 53.646
Cp (melt) = 0.6499x + 22.646
100
150
200
250
300
350
250 270 290 310 330 350 370 390 410 430
T (K)
Cp
(J/m
ol,K
)
Figure 8. Heat capacity of the benzoic acid (solid and melt)
4.2. Mechanisms of Particle Formation
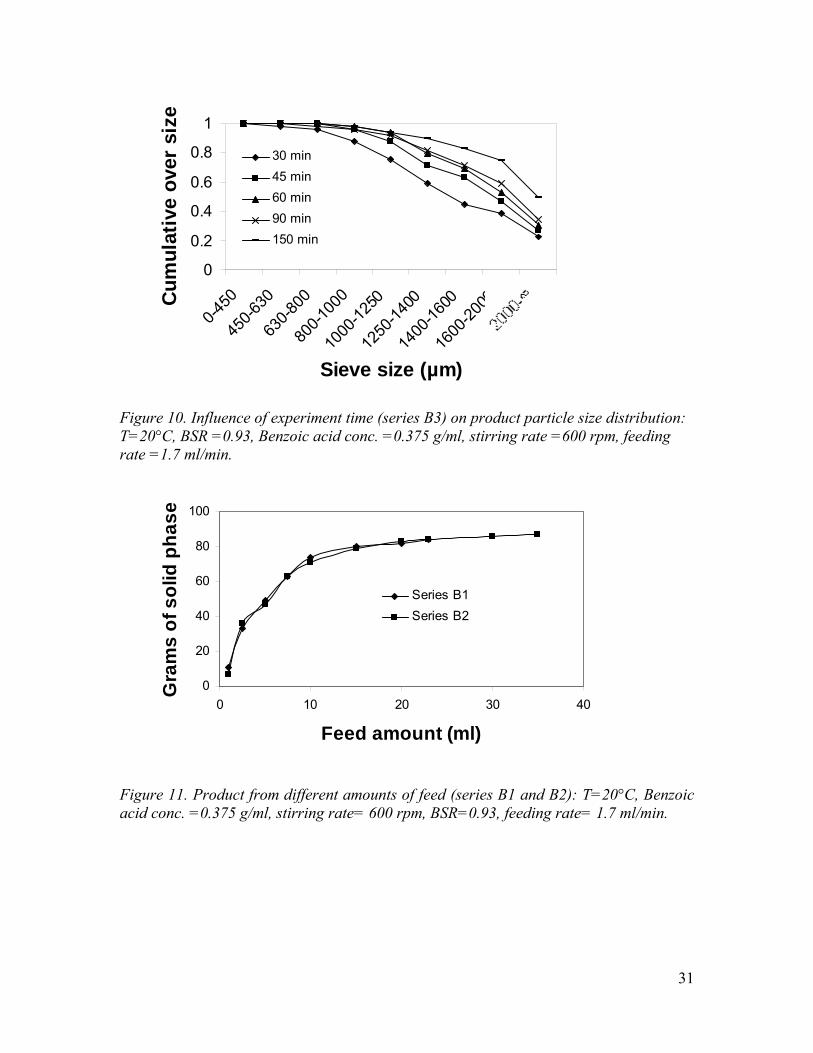
In series B1 the experiment is entirely terminated when the desired amount of feed has been added, and the product is isolated and analyzed. In series B2, the difference to series B1 is that the agitation is continued for up to a total time of 1 hour after having fed the desired amount of feed solution. In series B3, experiments were done at the same conditions as B1 and B2 but the time for continued agitation varies where as a constant feed amount is used. Particle size distributions for experiments of series B1 and B2 are shown in Figure 9. In both series B1 and B2 the particle size is increasing with increasing feed volume. The particle size distribution has shown for 1 to 35 ml feed volume for series B2 experiments. Above 35 ml, agglomerates larger than 3 mm are observed, and already at 35 ml feed more than 40% of the particles are larger than 2000 µm in size. In Figure 10 is shown the product particle size distributions of the experiments of series B3. Obviously, continued agitation of the slurry after the feed of 23 ml has been terminated, leads to a gradually increasing size. Figure 11 presents the amount of solid phase produced in the experiments of series B1 and B2. Obviously, there is very little difference between the two series of experiments which shows that the supersaturation is rapidly consumed. As the feed solution is supplied to the crystallizer the amount of benzoic acid that can crystallize
lly increasing size. Figure 11 presents the amount of solid phase produced in the experiments of series B1 and B2. Obviously, there is very little difference between the two series of experiments which shows that the supersaturation is rapidly consumed. As the feed solution is supplied to the crystallizer the amount of benzoic acid that can crystallize
29

actually does crystallize fairly rapidly. The convex shape of the curves suggests that there is a gradually increasing solubility of benzoic acid in the crystallizer mixture due to the changing liquid phase composition. By a mass balance the solubility can be estimated from the data of the total mass of crystals and the total mass of benzoic acid fed to the crystallizer (Table 5).
0
0.2
0.4
0.6
0.8
1
0-450 450-630
630-800
800-1000
1000-1250
1250-1400
1400-1600
1600-2000
2000-∞
Sieve size (µm)
Cum
ulat
ive
over
siz
e
10ml-B110ml-B215ml-B115ml-B220ml-B120ml-B223ml-B123ml-B2
Figure 9. Comparison of product particle size distribution for series B1 and B2 experiments: T=20°C, BSR =0.93, Benzoic acid conc. =0.375 g/ml, stirring rate =600 rpm, feeding rate =1.7 ml/min, experiment time = 1 hr. The number of particles increases in the experiments of series B1 and B2 with increasing amount of feed (Table 6 and Figure 12). At low feed volume (1ml) the particles are poorly agglomerated. By further addition of the feed, the total number first decreases presumably because of agglomeration. After that there is a significant steady increase in the number of particles with increasing amount of feed. With increasing amount of feed both the average size as well as total number of particles increases. The further agitation, of series B2 experiments lead to a slight decrease in number, which agrees with the fact that further agitation, also increases the size and the particle density (Table 6).
30
0
0.2
0.4
0.6
0.8
1
0-450
450-6
30
630-8
00
800-1
000
1000
-1250
1250
-1400
1400
-1600
1600
-2000
Sieve size (µm)
Cum
ulat
ive
over
siz
e30 min45 min60 min90 min150 min
Figure 10. Influence of experiment time (series B3) on product particle size distribution: T=20°C, BSR =0.93, Benzoic acid conc. =0.375 g/ml, stirring rate =600 rpm, feeding rate =1.7 ml/min.
0
20
40
60
80
100
0 10 20 30 4
Feed amount (ml)
Gra
ms
of s
olid
pha
se
0
Series B1Series B2
Figure 11. Product from different amounts of feed (series B1 and B2): T=20°C, Benzoic acid conc. =0.375 g/ml, stirring rate= 600 rpm, BSR=0.93, feeding rate= 1.7 ml/min.
31

0
2000
4000
6000
0 10 20 30 40
Feed amount (ml)
Num
ber o
f par
ticle
s
Series B1
Series B2
Figure 12. Number of particles for the experiments series B1 and B2: T=20°C, Benzoic acid conc. =0.375 g/ml, stirring rate= 600 rpm, BSR=0.93, feeding rate= 1.7 ml/min Table 5. Solubility of final solution (on solute free basis), saturation and effective BSR (Volume of bridging liquid / volume of crystallized benzoic acid) from series B2 experiments: T=20°C, Benzoic acid conc. =0.375 g/ml, Stirring rate= 600 rpm, BSR =0.93, Feeding rate= 1.7 ml/min, experiment time= 1 hr, solvent composition is given in weight fraction on solute free basis.
Feed (ml) Ethanol Toluene Water Solubility (g/g)
Effective BSR (Vol of BL / Vol of crystallized BA)
Saturation (S)
0.36 0 0 1 0.0013 1 0.0067 0.0019 0.9914 0.0029 13.11 2.5 0.0261 0.0062 0.9677 0.0050 2.55 5 0.0322 0.0093 0.9585 0.0081 1.95 7.5 0.0322 0.0137 0.9585 0.0083 1.45 10 0.0473 0.0137 0.9391 0.0085 1.29 1.05 15 0.0768 0.0202 0.9030 0.0089 1.16 0.98 20 0.1145 0.0331 0.8525 0.0092 1.1 1 23 0.1288 0.0372 0.8851 0.0098 1.09 1.1 30 0.1599 0.0462 0.7939 0.0106 1.06 1.1 35 0.1803 0.0521 0.7675 0.0112 1.05 1
32

In Table 6 is presented the density and porosity of the particles. The density of the particles from experiments of series B2 is always higher than the density of the particles of the corresponding series B1 experiments. Obviously, longer agitation leads to a densification of the particles. In series B2, there is also a fairly clear increase in density with increasing amount of feed. The density increase in series B1 is much weaker. The strength of 1600-2000µm particles from the experiments of series B2 is shown in Table 6. The strength obviously increases with increasing amount of feed, and there is a clear correlation to the particle density. There is even a correspondence in the slight decrease in strength and density when the feed increases from 30 ml to 35 ml. The strength values of the particles 1600-2000µm from series B3 (Table 6) further supports the finding that agitation increases the strength of the particles. Also in series B3, there is a clear correlation between density and strength. Up to 90 minutes there is an increase in both properties and then there is a decrease in both the density and the strength when the time increases to 150 minutes. Table 6. Particle properties from series B1, B2, B3 experiments: sieve size =1600-2000 µm, T=20°C, Benzoic acid conc. =0.375 g/ml, Stirring rate= 600 rpm, BSR =0.93, Feeding rate= 1.7 ml/min. Series Feed
amount (ml)
Exp time (min)
No of particles
Density (kg/m3)
Porosity Fracture force (N)
Fracture stress (MPa)
B1 1, 2.5, 5, 7.5
Feed time
525, 212, 570, 860
10 Feed time
1907 570.23 0.56
15 Feed time
2546 574.77 0.56
20 Feed time
3198 579.39 0.55
23 Feed time
3700 595.16 0.54
B2 10 60 1800 580.12 0.55 0.35 0.17 15 60 2376 597.71 0.54 0.4 0.19 20 60 2943 623.35 0.52 0.42 0.2 23 60 3559 653.45 0.50 0.48 0.21 30 60 3869 667.34 0.49 0.51 0.26 35 60 4100 634.37 0.51 0.49 0.25 B3 23 30 4793 618.35 0.53 0.35 0.15 23 45 4088 629.91 0.52 0.44 0.17 23 60 3559 683.45 0.48 0.48 0.21 23 90 2875 728.53 0.44 0.47 0.22 23 150 2591 691.11 0.47 0.45 0.2
33

(a) 2.5 ml (b) 2.5 ml
(a)10 ml (b) 10 ml
(a)15 ml (b)15 ml
(a) 23 ml (b) 23 ml Figure 13. Particles from different feed amount experiments: 1600-2000 µm, T=20°C, Benzoic acid conc. = 0.375 g/ml, stirring rate= 600 rpm, feeding rate =1.7 ml/min, BSR = 0.93, a) particles from series B1; b) particles from series B2
34

(a)10 ml (b)10 ml
(a) 23 ml (b) 23 ml
Figure 14. Crushed particles from different feed amount experiments: 1600-2000 µm, T=20°C, Benzoic acid conc. = 0.375 g/ml, stirring rate= 600 rpm, feeding rate =1.7 ml/min, BSR = 0.93, a) particles from series B1; b) particles from series B2 The early formed agglomerates of benzoic acid are quite porous and irregular and associate with other agglomerates into larger entities having an irregular shape and a quite open internal structure as illustrated in first two rows of Figure 13 for agglomerates collected after having fed 2.5 and 10 ml respectively. This can be clearly seen in Figure 14 where the particles are gently crushed by the application of mechanical force of a spatula. At 10 ml both particles appear to contain a greater irregular cavity inside (First row of Figure 14). Up to 10 ml in both series the particles are irregular but for series B2, from 15 ml feed amount the particles become spherical (Third and fourth row in Figure 13). The particles at 23 ml from series B2 appear to be almost spherical (Panel b in Figure 13), but also the surface seems to be much smoother than in series B1 (Panel a in Figure 13). At 23 ml it appears as if cavities have essentially disappeared in the particle from the B2 series while it partly remains in the particle from the B1 series (second row in Figure 14). In the corresponding particle from the B1 series individual crystals are
35

much more clearly observed. The particle morphology improved not only with the total feed amount and also the processing time.
In Figure 15 the outer surface of the spherical agglomerates from series B1 (Figure 15a) and B2 (Figure 15b) are compared. As shown the surface of the particles from series B2 is made up of quite thin “layers” of crystalline material which is the reason why the surface appears very smooth in Figure 13. As the constitute crystals are very thin and tiny these agglomerates possesses high dissolution rate as well as bioavailability. The surface of particles from series B1 experiments is clearly rougher than B2 experiments.
(a) 15 ml, 1600-2000 µm (b) 15 ml, 1400-1600 µm
Figure 15. Surface of the particles from different feed amount experiments: T=20°C, Benzoic acid conc. = 0.375 g/ml, stirring rate= 600 rpm, feeding rate =1.7 ml/min, BSR = 0.93, a) particles from series B1; b) particles from series B2.
4.3. Influence of Process Parameters
A first set of operating parameters, i.e., stirring rate, BSR, initial concentration of solute, are studied with the process A using chloroform as a bridging liquid (Paper 1). All other operating parameters i.e., amount of bridging liquid, feeding rate (toluene as bridging liquid); temperature, BSR, total experiment time (heptane as bridging liquid); and influence of different bridging liquids are studied for process described in this thesis. Physico-mechanical properties i.e., particle size, morphology and strength were explored. Some of the results are described in this chapter; further could be found in papers listed in appendix.
36

4.3.1. Amount of Bridging liquid (BSR)
The influence of BSR on different properties of spherical agglomerates was studied using chloroform, toluene and heptane as bridging liquid and are described in papers 1, 2, and 3 given in the appendix. A critical range of BSR outside of which spherical agglomerates are not formed has been found. For the system (water-ethanol-toluene) the critical range of BSR was found to be 0.47 - 1.16 whereas using heptane as bridging liquid at 5°C the BSR range is 0.72 - 1.23. For both systems, above BSRmax the material remained either as a paste or particles are very big in size (more than 3 mm). Below BSRmin the crystals are not agglomerated completely and the agglomerates are very small in size and irregular in shape. For lobenzarit disodium using hexane as bridging liquid, Gonzalez and Biscans (2002) found that in order to produce spherical agglomerates, the BSR should be in the range of 1.08 to 1.43. Hereafter, and if not stated otherwise, results are shown for toluene as bridging liquid; for heptane the results could be found in paper 3.
0
0.2
0.4
0.6
0.8
1
0 500 1000 1500 2000
Particle Size (µm)
Cum
ulat
ive
over
siz
e 0.470.580.70.80.93
Figure 16. Influence of BSR on product particle size distribution: T=20°C, Benzoic acid conc. = 0.375 g/ml, stirring rate= 600 rpm, feeding rate=1.7 ml/min, experiment time=1 hr
37

The influence of the amount of bridging liquid on the product particle size distribution and the mean size is shown in Figure 16 and 17. There is a significant increase in the size with increasing volume of bridging liquid. The maximum size of agglomerates was found at BSR=1.16. However, the mean size of the particles from the experiments with BSR equal to 1.05 and 1.16, are in the range of 2 to 5 mm, which is too large to be properly characterized by the sieving set used. Subero et al., (2006) found the agglomerate mean size to increase with BSR squared, and this dependence can also correlate the mean size data shown in Figure 17.
0
500
1000
1500
2000
0.35 0.55 0.75 0.95 1.15
BSR
Agg
lom
erat
e m
ean
size
(µm
)
Figure 17. Influence of BSR on product particle mean size: T=20°C, Benzoic acid conc. = 0.375 g/ml, stirring rate= 600 rpm, feeding rate=1.7 ml/min, experiment time=1 hr As shown in Figure 18, the product obtained at low BSR (0.47) is dominated by irregularly shaped agglomerates throughout the entire sieve range. The morphology of the particles from experiments with BSR = 0.58, 0.7, 0.8 and 0.93 is shown in the Figure 19 and 20. Figure 19 combined with Figure 20e shows that there appears to be a gradual improvement of the shape of the particles of the dominating sieve fraction with increasing BSR. Figure 20 shows that all the particles in the 6 upper sieve fractions from the experiment where BSR equals to 0.93 are completely spherical. The mass of lower sieve fractions is essentially insignificant. From the experiments where BSR is below 0.93, the smaller particles (low sieve fraction) are either thin, irregularly shaped agglomerates or fragments from larger agglomerates. Increasing BSR leads to improved particle morphology. There is a significant change in the particle morphology with BSR
38

for toluene as the bridging liquid, but with heptane the morphology did not change with BSR (Paper 3). a b c d e f Figure 18. Particle morphology of different sieve fractions: a. 0-180 µm.40x, b. 180-315 µm.32x, c. 315-450 µm.32x, d. 450-630 µm.25x, e. 630-800 µm.25x, f. 800-1000 µm.25x; T=20°C, benzoic acid conc. = 0.375 g/ml, stirring rate=600 rpm, BSR = 0.47, feeding rate =1.7 ml/min, experiment time=1 hr.
39

a b c Figure 19. Influence of BSR on particle morphology of dominating sieve fraction: a. BSR = 0.58, 800-1000 µm, b. BSR = 0.7, 1000-1250 µm, c. BSR = 0.8, 1000-1250 µm; 20x, T=20°C, benzoic acid conc. = 0.375 g/ml, stirring rate=600 rpm, feeding rate =1.7 ml/min, experiment time=1 hr.
a b c
40
d e f
Figure 20. Particle morphology of different sieve fractions: a. 450-800µm.25x, b. 800-1000 µm.25x, c.1000-1250 µm.20x, d. 1250-1400 µm.20x, e. 1400-1600 µm.20x, f. 1600-2000 µm.16x: T=20°C, benzoic acid conc. = 0.375 g/ml, stirring rate=600 rpm, BSR = 0.93, feeding rate =1.7 ml/min, experiment time=1 hr. Average fracture force and fracture stress of the 30 particles, from different experiments and different sieve fractions are shown in Table 7. The fracture stress is increased with increasing BSR. Compared to similar measurements done for bucillamine spherical agglomerates under similar conditions (0.93 BSR, agitation time 60 min and agglomerate size 1000 µm) the particles in this work are marginally stronger, i.e., fracture force is 0.26N compared to 0.2N found by Morishima and Kawashima (1993). As expected, among the particles from the same experiment the fracture force increases with increasing particle size, and this is in agreement with the findings of Antonyuk et al., (2005). However, the corresponding fracture stress decreases with increasing product particle size.
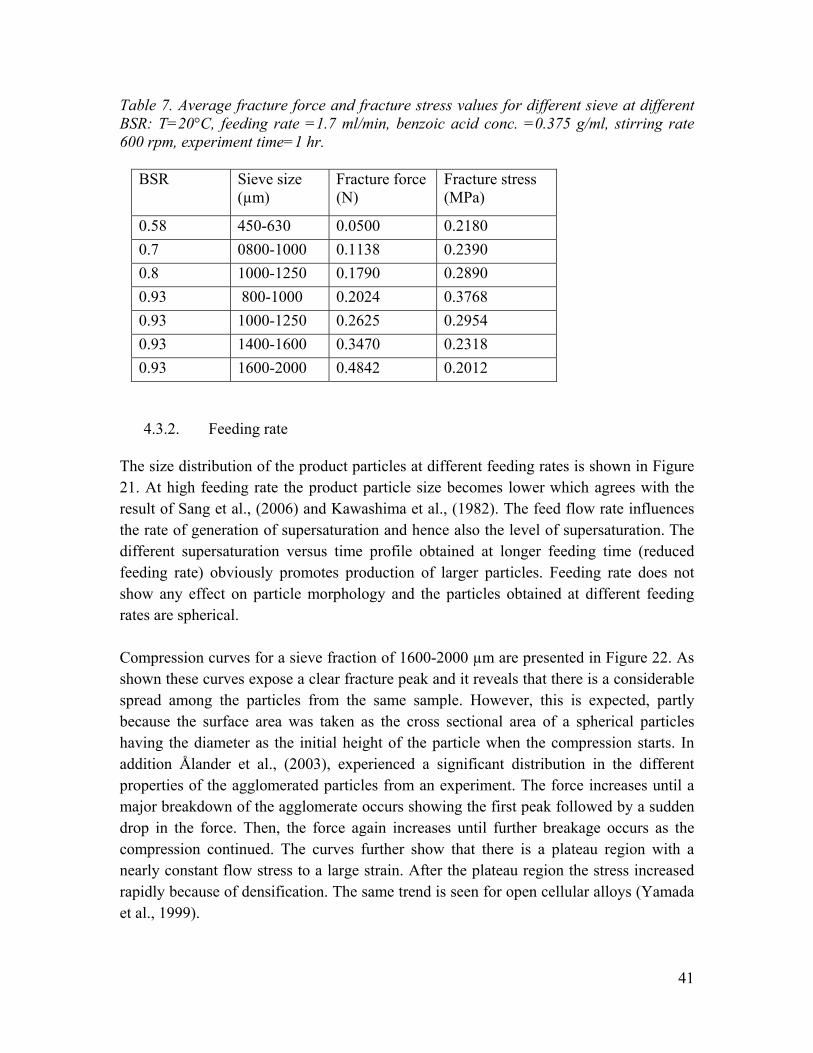
Table 7. Average fracture force and fracture stress values for different sieve at different BSR: T=20°C, feeding rate =1.7 ml/min, benzoic acid conc. =0.375 g/ml, stirring rate 600 rpm, experiment time=1 hr.
BSR Sieve size (µm)
Fracture force (N)
Fracture stress (MPa)
0.58 450-630 0.0500 0.2180 0.7 0800-1000 0.1138 0.2390 0.8 1000-1250 0.1790 0.2890 0.93 800-1000 0.2024 0.3768 0.93 1000-1250 0.2625 0.2954 0.93 1400-1600 0.3470 0.2318 0.93 1600-2000 0.4842 0.2012
4.3.2. Feeding rate
The size distribution of the product particles at different feeding rates is shown in Figure 21. At high feeding rate the product particle size becomes lower which agrees with the result of Sang et al., (2006) and Kawashima et al., (1982). The feed flow rate influences the rate of generation of supersaturation and hence also the level of supersaturation. The different supersaturation versus time profile obtained at longer feeding time (reduced feeding rate) obviously promotes production of larger particles. Feeding rate does not show any effect on particle morphology and the particles obtained at different feeding rates are spherical. Compression curves for a sieve fraction of 1600-2000 µm are presented in Figure 22. As shown these curves expose a clear fracture peak and it reveals that there is a considerable spread among the particles from the same sample. However, this is expected, partly because the surface area was taken as the cross sectional area of a spherical particles having the diameter as the initial height of the particle when the compression starts. In addition Ålander et al., (2003), experienced a significant distribution in the different properties of the agglomerated particles from an experiment. The force increases until a major breakdown of the agglomerate occurs showing the first peak followed by a sudden drop in the force. Then, the force again increases until further breakage occurs as the compression continued. The curves further show that there is a plateau region with a nearly constant flow stress to a large strain. After the plateau region the stress increased rapidly because of densification. The same trend is seen for open cellular alloys (Yamada et al., 1999).
41

0
0.2
0.4
0.6
0.8
1
0-450
450-6
30
630-8
00
800-1
000
1000
-1250
1250
-1400
1400
-1600
1600
-2000
2000
Sieve size (µm)
Cum
ulat
ive
over
siz
e1.72.73.74.79.7
Figure 21. Influence of feeding rate (ml/min) on product particle size distribution: T=20°C, Benzoic acid conc. = 0.375 g/ml, BSR= 0.93, stirring rate= 600 rpm, experiment time=1 hr. Table 8. Average fracture force and fracture stress values for different sieve fraction and at different feeding rates: T=20°C, BSR= 0.93, benzoic acid conc. =0.375 g/ml, stirring rate 600 rpm, experiment time=1 hr.
Feeding rate (ml/min)
Sieve size (µm)
Fracture Force (N)
Fracture stress (MPa)
1.7 1000-1250 0.2625 0.2954 4.7 1000-1250 0.3114 0.29 9.7 1000-1250 0.3354 0.3779 1.7 1400-1600 0.3470 0.2318 4.7 1400-1600 0.3873 0.2583
42

0.0 0.2 0.4 0.6 0.80.00
0.25
0.50St
ress
(MPa
)
Strain
Figure 22. Stress vs. strain curves for individual particles from sieve fraction 1600-2000 µm: T=20°C, Benzoic acid conc. = 0.375 g/ml, N=600 rpm, BSR = 0.93, Feeding rate=1.7 ml/min, experiment time=1 hr.
0
0.4
0.8
1.2
1.6
0 0.2 0.4 0.6 0.8 1
Strain
Stre
ss (M
Pa) 1.7
4.79.7
Figure 23. Influence of feeding rate (ml/min) on average stress – strain curve for 1000-1250µm sieve fraction: T=20°C, Benzoic acid conc. =0.375 g/ml, N= 600 rpm, BSR=0.93, Experiment time=1 hr.
43

The stress - strain curve for a single particle contains roughly 3000 values and for each sample an average curve is determined based on the data over the 30 particles. The average of curves determined for different feeding rates are shown in Figure 23. In these measurements the size fraction (1000-1250 µm) was used which is the dominating fraction in the experiment with a feeding rate of 9.7 ml/min, while it is the second most dominating in the other two experiments. Average fracture force and stress averaged over 30 particles are shown in Table 8. The average fracture force of the particles increases with increasing feeding rate, while the fracture stress is unchanged until the feeding rate is so high that the mean size decreases. As the feeding rate increases the agglomerates on the average tend to become smaller and stronger.
4.3.3. Temperature
As shown in Figure 24 the size of the particles decreases with increasing temperature. In these experiments heptane was used as bridging liquid. At low temperature (5°C) the dominating particle size (1125 µm) is higher than at higher temperature (30°C) i.e., 350µm. With decreasing temperature the yield (amount of agglomerated product / amount of solute actually dissolved) was increased as shown in Table 9. The ratio of anti solvent to good solvent (water/ethanol) used is same at all the temperatures. Because at lower temperatures the solubility of benzoic acid in anti solvent is lower (Table 9), the amount that crystallized is higher at low temperatures thus leading to more yield. Unfortunately, solubility data in the actual solvent mixtures are not available over the temperature range, but in pure water (the dominating component) the solubility of benzoic acid is 0.0017 g/g at 5°C and 0.0042 g/g at 30°C. The temperature does not show much influence on the particle morphology for this system and more about the temperature influence with different bridging liquids can be found in section 4.4 which is devoted to explain the influence of bridging liquid. Particle surface and the interior of the particles at different temperatures are shown in Figure 25. The particles have been gently crushed by the application of mechanical force of a spatula. From the micrographs, the crystal size is increasing with increasing temperature (Table 9). Here the optimum BSR is selected for different temperatures and because of the increasing amount of crystallized benzoic acid the used amount of bridging liquid (BSR) increases. At low temperature, because of high supersaturation, the constituent crystals are smaller than at high temperatures. Assuming all benzoic acid is dissolved in the (ethanol-water-heptane) mixture the relative supersaturation equals to 48 at 5°C and to 19 at 30°C (S=(c-c*)/c*; c= total concentration of solute, c*= solubility). As shown in Table 9, temperature has significant effect on the strength of the particles. With increasing temperature the fracture stress decreases and at low temperature the particles are stronger than at high temperature. Smaller size of the constitute crystals at
44

low temperatures causes a higher volume density of interparticle contacts and accordingly to more friction among the crystal particles.
0
0.2
0.4
0.6
0.8
1
0-250
250-4
50
450-6
30
630-8
00
800-1
000
1000
-1250
1250
-1400
1400
-1600
1600
-2000
2000
Sieve size (µm)
Cum
ulat
ive
unde
r siz
e
30C 20C 10C 5C
Figure 24. Influence of temperature on product particle size distribution using heptane as bridging liquid: Benzoic acid conc. = 0.375 g/ml, N= 600 rpm, feeding rate=1.7 ml/min, at 5°C: BSR = 1.02, 10°C, 20°C: BSR =0.93 & 30°C: BSR = 0.86, experiment time = 1hr. Table 9. Influence of temperature on the yield and fracture stress using heptane as bridging liquid: size 1000-1250 µm, Benzoic acid conc. =0.375 g/ml, N= 600 rpm, Feeding rate= 1.7ml/min, experiment time=1 hr.
Crystal size
(µm)
Temperature (°C)
width length
Solubility of Benzoic acid in water (g/g)
BSR (vol of BL / vol of
solute)
Yield (%) Fracture stress (Mpa)
5 7-70 35-100
0.0017 1.02 84 0.23
10 10-70 35-100
0.0022 0.93 81 0.18
20 10-70 40-140
0.0032 0.93 78 0.14
30 20-75 35-150
0.0042 0.86 74
45

Surface Interior of the particle 5°C, 1000-1250 µm
Surface Inside of the particle 10°C, 1000-1250 µm
Surface Inside of the particle
20°C, 1000-1250 µm
Surface Inside of the particle
30°C, 1000-1250 µm
Figure 25. Influence of temperature on product particle morphology heptane as bridging liquid: Benzoic acid conc. = 0.375 g/ml, N= 600 rpm, feeding rate=1.7 ml/min, experiment time =1hr at 5°C: BSR = 1.02, 10°C, 20°C: BSR =0.93 & 30°C: BSR = 0.86.
46

4.4. Influence of Bridging liquid
Among the solvents used as bridging liquid toluene, chloroform, cyclohexane, heptane and pentane lead to spherical agglomerates under properly tuned process conditions. Diethyl ether and ethyl acetate could not produce any spherical agglomerates but the crystals formed into very loose flocs. In Figure 26 is presented the size distribution of the product agglomerates depending on the bridging liquid used for experiments at 20oC and BSR 0.93. Clearly larger particles are obtained using chloroform and toluene. In Figure 27 is shown the corresponding comparison at 5oC BSR used for heptane, toluene and chloroform as bridging liquid is 1.02 and pentane 1.4. The amount crystallized is higher at 5°C than at 20°C, so, the amount of bridging liquid required is higher at 5°C. At 5°C pentane as bridging liquid required BSR is higher it might be because of the low boiling point of pentane, evaporation may occur during mixing and feeding. Pentane is the most volatile alkane having the low boiling point (36°C) and as the used amount of bridging liquid is low, so, the loss of small amount is very substantial which causes the variation in BSR. At 20°C there is a significant variation in particle size distribution among the bridging liquids used where as at 5°C the difference is lowered. Compared to other solvents larger agglomerates were produced when toluene is used as bridging liquid at 20°C.
0
0.2
0.4
0.6
0.8
1
0-250
250-4
50
450-6
30
630-8
00
800-1
000
1000
-1250
1250
-1400
1400
-1600
1600
-2000
2000
Sieve size (µm)
Cum
ulat
ive
unde
r siz
e
ChloroformTolueneCyclohexaneHeptane
Figure 26. Influence of bridging liquid on product particle size distribution at 20°C: Benzoic acid conc. = 0.375 g/ml, N= 600 rpm, feeding rate=1.7 ml/min, experiment time =1 hr, BSR= 0.93.
47

0
0.2
0.4
0.6
0.8
1
0-450
450-6
30
630-8
00
800-1
000
1000
-1250
1250
-1400
1400
-1600
1600
-2000
2000
Sieve size (µm)
Cum
ulat
ive
unde
r siz
e
PentaneTolueneHeptaneCyclo hexane
Figure 27. Influence of bridging liquid on product particle size distribution at 5°C: Benzoic acid conc. = 0.375 g/ml, N= 600 rpm, feeding rate=1.7 ml/min, experiment time =1 hr, BSR= (pentane 1.4, toluene, heptane and cyclohexane 1.02).
Hereafter, the particle morphology is shown for different bridging liquids and at two different temperatures. Figure 28a show the particles prepared from cyclohexane as bridging liquid and at 20°C. The particles from the lower sieve fraction are not spherical. And the shape however improves with increasing size. At 5°C the particles were not very spherical (Figure 28b) and they also have pore openings as shown in Figure 28c. The pictures indicate a state where primary agglomerates have merged together into larger secondary agglomerates but the consolidation is rather premature. The particles have not been given sufficient time to age under influence of the agitation into a more spherical and dense form. At 20°C, using heptane as bridging liquid in Figure 29a, in the low sieve fraction (0-250 µm) some particles are single, needle like crystals, but the amount is less than 1% of the total amount of particles. Only particles greater than 250 µm are spherical, whereas particles prepared at 5°C are completely spherical (Figure 29b). At 5°C, using pentane as bridging liquid there are no single or irregular particles (Figure 30). At 5°C, when toluene is used as bridging liquid the particles are spherical (Figure 31) and also have the same behavior as found at 20°C (given in section 4.3.1). Using chloroform as bridging liquid at 20°C, particles change from thin and irregularly shaped agglomerates to more spherical agglomerates and only particles >630 µm are spherical (Figure 32). From the SEM micrographs given, it is clear that the particles are formed with crystals of different sizes. Using pentane as bridging liquid the surface of the agglomerate appears very smooth. This might be because the constitute crystal size is very small compare to the particles obtained from other bridging liquids. From these results it is observable that
48

the bridging liquid has a distinct influence on product particle morphology. Completely spherical particles were found using toluene at 5 and 20°C, and using pentane at 5°C as bridging liquid.
a) 280-450µm.32x b) 800-1000µm.20x c) 1400-1600µm.16x Figure 28a. Particle morphology of different sieve fractions at 20°C: BSR (cyclohexane) = 0.93, Benzoic acid conc. = 0.375 g/ml, N=600 rpm, feeding rate =1.7 ml/min, experiment time=1 hr.
a) 0-450µm.25x b) 1000-1250µm.25x c)1600-2000µm.16x Figure 28b. Particle morphology of different sieve fractions at 5°C: BSR (cyclohexane) = 1.02, Benzoic acid conc. = 0.375 g/ml, N=600 rpm, feeding rate =1.7 ml/min, experiment time=1 hr.
Figure 28c. Particle morphology at 5°C: BSR (cyclohexane) = 1.02, 1000-1250 µm, Benzoic acid conc. = 0.375 g/ml, N=600 rpm, feeding rate =1.7 ml/min, experiment time=1 hr.
49

a) 0-250µm.40x b) 630-800µm.25x c) 1250-1400µm.20x Figure 29a. Particle morphology of different sieve fractions at 20°C: BSR (heptane) = 0.93, Benzoic acid conc. = 0.375 g/ml, N=600 rpm, feeding rate =1.7 ml/min, experiment time=1 hr.
a) 250-630µm.32x b) 800-1000µm.20x c) 1600-2000µm.16x Figure 29b. Particle morphology of different sieve fractions at 5°C: BSR (Heptane) = 1.02, Benzoic acid conc. = 0.375 g/ml, N=600 rpm, feeding rate =1.7 ml/min, experiment time=1 hr.
a) 0-450µm.32x b) 1000-1250µm.25x c) 1000-1250µm Figure 30. Particle morphology of different sieve fractions at 5°C: BSR (Pentane) = 1.4, Benzoic acid conc. = 0.375 g/ml, N=600 rpm, feeding rate =1.7 ml/min, experiment time=1 hr.
50

a) 0-450µm.25x b) 800-1000µm.25x c) 1000-1250µm Figure 31. Particle morphology of different sieve fractions at 5°C: BSR (Toluene) = 1.02, Benzoic acid conc. = 0.375 g/ml, N=600 rpm, feeding rate =1.7 ml/min, experiment time=1 hr.
a) 0-280 µm (32x) b) 0280-450 µm (25x) c) 450-630 µm (25x)
d)630-800 µm (25x) e) 800-1000 µm (20x) Inside surface Figure 32. Particle morphology of different sieve fractions at 20°C: BSR = 0.93 (chloroform), Benzoic acid conc. = 0.375 g/ml, N=600 rpm, feeding rate =1.7 ml/min, experiment time= 1 hr.
51
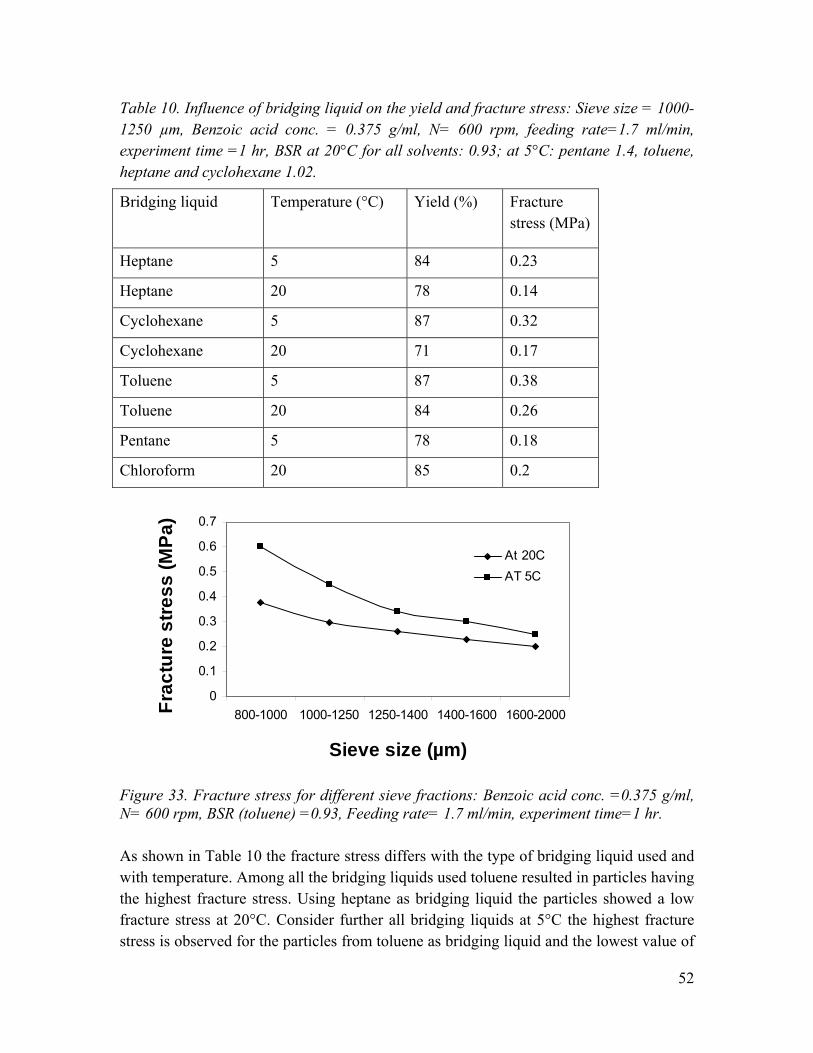
Table 10. Influence of bridging liquid on the yield and fracture stress: Sieve size = 1000-1250 µm, Benzoic acid conc. = 0.375 g/ml, N= 600 rpm, feeding rate=1.7 ml/min,
=1 hr, ll s 3; ntane 1.4, toluene,
Temperature (°C) Yield (%) Fracture (MPa)
experiment time heptane and cyclohexan
BSR at 20°C for ae 1.02.
olvents: 0.9 at 5°C: pe
Bridging liquid
stress
Heptane 5 84 0.23
Heptane 20 78 0.14
Cyclohexane 5 87 0.32
Cyclohexane 20 71 0.17
Toluene 5 87 0.38
Toluene 20 84 0.26
Pentane 5 78 0.18
Chloroform 20 85 0.2
0
0.1
0.2
0.3
0.4
0.5
0.6
0.7
800-1000 1000-1250 1250-1400 1400-1600 1600-2000Frac
ture
stre
ss (M
Pa)
At 20CAT 5C
Sieve size (µm)
Figure 33. Fracture stress for different sieve fractions: Benzoic acid conc. =0.375 g/ml, N= 600 rpm, BSR (toluene) =0.93, Feeding rate= 1.7 ml/min, experiment time=1 hr. As shown in Table 10 the fracture stress differs with the type of bridging liquid used and with temperature. Among all the bridging liquids used toluene resulted in particles having the highest fracture stress. Using heptane as bridging liquid the particles showed a low fracture stress at 20°C. Consider further all bridging liquids at 5°C the highest fracture stress is observed for the particles from toluene as bridging liquid and the lowest value of
52

fracture stress is found for the particles from pentane as bridging liquid. As pentane has a very low boiling point the experiments were conducted only at 5°C for this bridging liquid. Figure 33 shows that the particle fracture stress decreases with increasing particle size at both 20 and 5°C. From Tables 10 and 12 it can be observed that the fracture stress is increasing with increasing solubility of benzoic acid in the bridging liquid at 5°C. At 20°C other than chloroform the trend is still maintained. The resulted strength of the particles comes from the solid bridges formed by the solute dissolved in bridging liquid after the wet agglomerates are dried (Rhodes, 2008). The obtained amount of product at 5°C is highest for the cyclohexane as bridging liquid whereas at 20°C, it is highest for chloroform as bridging liquid (Table 10). Generally higher yield is found at 5°C due to the lower solubility of benzoic acid at this temperature, causing more solute to crystallize.
Benzoic acid conc. = 0.375 g/ml, N= 600 rpm, feeding te=1.7 ml/min, experiment time =1 hr, all the solvents are at 20°C and BSR 0.93,
pe °C nd BSR 1
Sample
He=Recovered
) (%)
pre
Table 11. Compression of the agglomerates prepared using different bridging liquids: Sieve size = 1000-1250 µm,ra
ntane at 5 a .4.
Hi = InitialSize (µm)
Hc= Final Size (µm)
Size (µmElastic Recovery ratio
Comssibility (%)
Single 1244 276 308 03 71.2 Chloroform
Bed 4842 2583 3066 21 46.6
Single 1216 349 391 04 77.8 Toluene Bed 4856 3230 3690 28 33.5
Single 1089 412 425 02 62.2 Cyclo hexane Bed 6787 4185 4608 16 38.4
Single 1081 260 280 03 75.9 Heptane Bed 7204 4076 4928 27 43.4
Single 1314 486 522 04 62.9 Pentane
Bed 5914 3965 4594 32 32.9
In Table 11, the compression characteristics of single agglomerates and beds of agglomerates are presented and compared. For single particles the initial elastic recovery is below 4% and for beds it is 15 - 30%. This result suggests that the particles are clearly plastic in their compression. It is generally believed that to create strong compacts, either
53

a plastic deformation or an extensive fragmentation of the particles must occur (Sandell et al., 1993).
As shown in Table 11 the compressibility for single particles is 60-80% and for bed of particles is in the range of 30-50%. When chloroform is used as bridging liquid, the particles showed high compressibility. A weak and easily compressed bed is signified by a high value of the compressibility index. Even though the load used for bed compression s very low the particles have shown a significant compressibility. Usually for thi e tablet
mpression of the particles into tablets.
. Prop f u id qui r d h allwoo L 19
hloro e e
e
5 12
4 10
4 8 2
compressions the load used is 20kN. The low elastic recovery and high compressibility of the particles are favorable for the direct co Table 122004, Sm
erties o,
solvents u
sed as br ging li d (by Bah amian an Danesd 1996 i and F 92).
Solvent Cform CHCl3
ToluenC7H8
HeptanC7H16
Cyclo hexane C6H12
PentanH C
Diethyl ether C H O
Ethyl acetateC H O
5°C 0.701 7 0.488 1.27 0.219 Viscosity (mPaS)
20°C
0.573 0.596 0.425 0.9845 0.235 0.448
5°C 0.4 37.3 50.6 51 5 Interfacial tension solvent/water dyn/cm
20°C
31.6 36.1 50.2 50.2 11 6.8
Solubiliwater (g/100g
ty25
.0055 .9 .3 in °C)
0.8 0.052 0.01 0 0.004 6 8
5°C 0.0817 0.0482 0.006 0.0061 Solubility of BA at g solid
20°C
7 77 23 35 19
0.131 0.08 0.01 0.01 0.01/gsolvent Polarity 25.9 9.9 1.2 0.6 0.9 11.7 23 The properties of the solvents used as bridging liquid are given in Table 12. Spherical agglomeration shows similarities with granulation for which Alderborn and Nyström (1996) stated that good wettability (small angle of contact) of the drug by the bridging liquid is a precondition for agglomeration based on capillary forces and it will influence the formation of bridges between the drug crystals as well as agglomerate formation. All the organic solvents (ethanol, toluene, pentane, heptane, chloroform, cyclohexane, ethyl acetate and diethyl ether) used in the present work have spread immediately on the
54

surface of benzoic acid compact, i.e., contact angle is 0°. This indicates that all of these solvents have good wetting ability with the benzoic acid, and there is no difference in
etting the particles.
nce of viscosity is likely to be due to that the viscosity range covered is very arrow.
0.375 g/ml, N= 600rpm, feeding rate= 1.7ml/min, experiment time=60min, BSR= 0.93.
w The particle mean size and fracture stress vs. bridging liquid viscosity is shown in Figure 34 and 35, respectively. As shown there is no clear trend between either with the particle size or fracture stress with bridging liquid viscosity. Viscosity can be of importance because at lower bridging liquid viscosity, the deformation is high and agglomerate growth is retarded by breakage (Johansen and Schaefer 2001). On the other hand at high solvent viscosity, the deformability is insufficient, which counteracts agglomerate growth by coalescence. Moreover, high viscosity of the bridging liquid reduces its ability to migrate through the capillaries formed between particles. But in the present work the lack of influen
0
200
400
600
800
1000
1200
1400
0 0.5 1 1.5
Viscosity (CP)
Mea
n si
ze (µ
m)
5C20C
Figure 34. Mean size of the particles vs. viscosity: at 5 and 20°C, benzoic acid conc.=
55

0
0.1
0.2
0.3
0.4
0 0.2 0.4 0.6 0.8 1 1.2 1.4
Viscosity (CP)
Frac
ture
stre
ss (M
Pa)
5C
20C
Figure 35. Fracture stress of the particles with viscosity: 1000-1250µm, Benzoic acid conc. =0.375 g/ml, N= 600rpm, feeding rate= 1.7ml/min, experiment time=60min, BSR= 0.93. Figure 36 shows the mean size of the particles prepared from different bridging liquids vs. interfacial tension of water/bridging liquid at 5 and 20°C. The fracture stress vs. interfacial tension and polarity at 5 and 20°C is shown in Figure 37 and 38 respectively. At low interfacial tension of the solvent the mean size and fracture stress are low and there are even no spherical agglomerates in the case of diethyl ether and ethyl acetate which have very low interfacial tension (11, 6.8 dyn/cm respectively). There is no clear correlation between mean size and fracture stress with the interfacial tension and polarity. Note that the polarity is given at 20°C whereas the fracture stress is at two different temperatures. The polarity defined is a normalized empirical parameter and can be interpreted as a measure of the hydrogen bonding ability of the solvent (Reichardt, 2003) and the polarity of the solvent is inversely proportional to the interfacial tension. Hasan (2001) found that at too high interfacial tension (of bridging liquid/water) the effectiveness of the bridging liquid is low and there is no clear picture (correlation) about polarity. It should be noted that the BSR range used is 0.3 to 0.87 by Hasan (2001), and in the present work it is 0.43 to 1.23. This is may be because of the fact that very high interfacial tension generates large droplets and facilitates their coalescence which is not favorable in spherical crystallization (Teychene et al., 2010, Hasan, 2001). The larger bridging liquid drops are less effective at forming liquid bridges between the crystals.
56

0
200
400
600
800
1000
1200
1400
0 10 20 30 40 50 60
Interfacial tension (dyn/cm)
Mea
n si
ze (µ
m)
5C
20C
Figure 36. Mean size of the particles vs. interfacial tension: at 20°C Benzoic acid conc. =0.375 g/ml, N= 600rpm, feeding rate= 1.7ml/min, experiment time=60min, BSR= 0.93.
0.1
0.15
0.2
0.25
0.3
0.35
0.4
20 25 30 35 40 45 50 55
Interfacial Tension (dyn/cm)
Frac
ture
stre
ss (M
Pa)
5C
20C
Figure 37. Fracture stress of the particles vs. interfacial tension: 1000-1250µm, Benzoic acid conc. =0.375 g/ml, N= 600rpm, feeding rate= 1.7ml/min, experiment time=60min, BSR= 0.93.
57

0
0.05
0.1
0.15
0.2
0.25
0.3
0.35
0.4
0 5 10 15 20 25 30
Polarity
Frac
ture
stre
ss (M
Pa)
5C
20C
Figure 38. Fracture stress of the particles vs. polarity of the solvents (polarity is given at 20°C): 1000-1250µm, Benzoic acid conc. =0.375 g/ml, N= 600rpm, feeding rate= 1.7ml/min, experiment time=60min, BSR= 0.93.
58

5. DISCUSSION
In this thesis the spherical crystallization of benzoic acid was studied under various process conditions using different solvents as bridging liquid. In all experiments discussed here, the feed solution containing benzoic acid and bridging liquid dissolved in ethanol was supplied to the crystallizer containing water. It occurred that after the feed solution is supplied to the crystallizer the amount of benzoic acid that can crystallize actually does crystallize fairly rapidly. However, these early crystals become invisible when they are dispersed out in the entire volume. When about approximately 0.36 ml has been fed into the tank crystals can be observed also in the agitated volume. Table 5 shows the effective BSR (volume of bridging liquid / volume of crystallized benzoic acid) values which are corrected for the solubility of benzoic acid in the solution, i.e. accounting for the fact that not all benzoic acid appear as a solid phase. This more relevant BSR definition shows that the favorable conditions are found when the volume of bridging liquid somewhat exceeds the volume of solid phase. Benzoic acid is well soluble in ethanol but poorly soluble in water. Since ethanol is entirely soluble in water, it will diffuse out of any droplets/feed solution liquid phase, and mix with the surrounding water. This would lead to an increase of the benzoic acid concentration in the feed solution phase and accordingly, the solution becomes supersaturated with respect to benzoic acid and crystallization starts. Small amount of bridging liquid is needed to force the system into liquid-liquid phase separation and the bridging liquid phase in the system serves to collect multiple crystals by capillary forces into an agglomerate structure by forming liquid bridges between the crystals. Among the solvents used as bridging liquid, toluene, chloroform, cyclohexane, heptane and pentane lead to spherical agglomerates under properly tuned process conditions. Diethyl ether and ethyl acetate could not produce any spherical agglomerates despite the fact that the wetting ability of these solvents is good (the contact angle of ethyl acetate and diethyl ether with benzoic acid is 0°). Using these solvents, only very loose flocs were formed. Gonzalez and Biscans (2002) chose the bridging liquid based on the low contact angle between bridging liquid and the solid. Biscans measured the contact angle of bridging liquid with the solid using the washburn method and solvents having low and high contact angles were used for the spherical agglomeration experiments. However, the present work reveals that this is not the only property which describes the effectiveness of the bridging liquid.
From a mechanistic viewpoint, in spherical crystallization the crystals are initially clustered together as a result of surface tension and capillary forces associated with the
59

liquid-liquid interface between the water-rich bulk solution and the bridging liquid rich solution in the aggregates. Thus, interfacial tension is a relevant property for spherical crystallization (Kawashima et al., 1984). Figure 39 shows a schematic over the situation of two spherical particles kept together by interfacial and capillary forces.
Figure 39. Meniscus of a liquid phase B in a liquid phase A between two particle surfaces (Butt and Kappl 2009).
Liquid B is the bridging liquid rich solution, and liquid A is the water rich bulk solution. If the bridging liquid efficiently wets the particle surfaces the contact angle )( ABΘ
becomes less than 90 degrees resulting in a curved interface according to the figure. As a result of this curved surface, the pressure on the B - liquid side is less than the pressure on the A-liquid side. This pressure difference leads to a pressure force (capillary forces) on the particles pushing them together. If the bridging liquid is more attracted to the surface of the solid then the contact angle is lower between solid and the liquid which facilitates the penetration through the capillaries. A concave meniscus occurs when the molecules of the liquid attract those of the solid surface than the molecules of liquid itself. Capillary action acts on concave meniscuses to pull the liquid up in to the capillaries, increasing the amount of energetically favorable contact area between liquid and solid surfaces. In addition, the direct action of the interfacial tension of the liquid around the periphery of the meniscus contributes to pull the particles together (Butt and Kappl, 2009). Therefore, interfacial tension of the bridging liquid and the crystallization solvent is at least as important as the wettability of the solid material with the bridging liquid, and moreover, a too low interfacial tension does not lead to spherical agglomeration even if the wettability is good (Kawashima et al., 1984). Also the relation between pressure difference, interfacial tension and contact angle given by Eqn 8 (Gonzalez and Biscans 2002) shows that the capillary pressure increases with increasing γ and cos Θ:
60

Θ−
=Δ cos11 Dp
pCP γ (8)
Where C1 is a constant depending on the specific surface area of the particles, p is the porosity of the agglomerate, D is the mean diameter of the agglomerate, γ is the interfacial tension between the liquids (water and bridging liquid) and Θ is the contact angle. Blandin et al., (2005) Blandin et al., (2005) adapted an equation from granulation for the compressive strength in the capillary state (saturation =1) to characterize the strength of the spherical agglomerate in the solution:
( )p
cap Lpp γ
σ −=
18 (9)
Where σcap is the compressive strength at the capillary state, γ is interfacial tension of the suspension liquid/bridging liquid, p is the porosity and Lp is the size of primary crystals. According to this model the compressive strength is proportional to the interfacial tension when the agglomerate still contains liquid (i.e., in the wet state).
Different bridging liquids which produced spherical agglomerates gave different properties to the particles. From the SEM micrographs of particles made with different bridging liquids it can be observed that the particle size is different, and is varying from (20 to 170) µm in length and from (6 to 70) µm in width. All the particles contain a combination of small and big crystals that are varying from needle to plate-like shape. Having crystals with different shape appears reasonable when noting that the level of supersaturation under which crystals were formed was changing gradually during the addition of the feed solution. Also the solubility of benzoic acid in the binding liquid will reflect to some extent differences in wettability, but may also influence the supersaturation under which the crystals are produce. Higher supersaturation will lead to faster nucleation and smaller crystals. As mentioned above the SEM pictures reveals that e.g. the crystals are much smaller when using pentane having a low solubility for benzoic acid, than using toluene that has a clearly higher solubility for the solute. As the crystal size and shape influences the capillary formation between crystals, thus, this may also be one of the reasons for different properties of the agglomerates using different bridging liquids.
All the three alkanes compared to toluene and chloroform has higher interfacial tension and lower solubility of benzoic acid and lower solubility in water. The solubility of the
61

bridging liquid in water will influence on the amount of binding liquid being available for binding crystals into agglomerate, and do reasonably correlate with the interfacial tension between the bridging liquid and water. Toluene and chloroform as bridging liquid particles are stronger and more spherical than alkanes as bridging liquid. Using toluene as bridging liquid the particles result in best properties such as size, shape and strength compared to other solvents used as bridging liquid. At both temperatures (5 and 20°C) using toluene as bridging liquid particles are larger, spherical at the tuned conditions and are having high mechanical strength.
The range of operation for spherical agglomeration was found to be relatively narrow. It depends mostly on the amount of bridging liquid (BSR), but mixing, particle size and wetting properties are claimed to be also important. In this work the amount of bridging liquid that leads to optimal agglomeration in terms of size, mechanical strength and sphericity has been determined, but the range is varying with the solvent system and when compared with literature data it is also different for different compounds. Nevertheless, the experimental results suggest that a BSR around unity leads to improved mechanical properties of the particles for essentially all bridging liquids that produced spherical agglomerates. The amount of bridging liquid might depend on the relation between properties of solid surface and bridging liquid. It can influence the formation of curvature between particles with bridging liquid which increases with increasing BSR. According to Kawashima et al., (1982), the probability of cohesion of the particles is proportional to concentration of the bridging liquid in the system. So, increasing BSR leads to larger agglomerates. Also increasing the amount of bridging liquid induces a higher deformability of the agglomerates which lead to more energy dissipation during collisions (Blandin et al., 2005). Accordingly, bouncing of colliding particles is reduced and agglomeration becomes more likely, leading to bigger agglomerates. Comparing the results of this work with literature data suggest that there is a relation between BSR, saturation of the agglomerate with bridging liquid, and constitute crystal size. At small crystal size the particles need low BSR and the saturation with bridging liquid is low. When toluene is used as bridging liquid (this work), the constitute crystal size ranged from 7 to 20µm in width and from 20 to 140µm in length; the BSR range is found to be 0.47 to 0.93; heptane (at BSR 0.93) used as bridging liquid the crystals ranges from 10 to 70µm in width and from 20 to 140µm in length. In the present work the crystal size is in the same range and the amount of bridging liquid is also equal for all the solvents (except pentane), thus the results are not comparable within these results. For salicylic acid and using chloroform as bridging liquid, Blandin et al., (2005) found that in order to produce spherical agglomerates (average constitute crystals size is 5µm), the BSR is in the range of 0.35 to 0.5. For lobenzarit disodium using hexane as bridging
62

liquid, Gonzalez and Biscans (2002) found the BSR is ranging from 1.08 to 1.43, but not mentioned the crystal size. For the present work the saturation (ratio of the pore volume occupied by the binding liquid on the total pore volume) of the agglomerates with bridging liquid is found to be unity at 0.93 BSR whereas for Blandin et al., (2005) the saturation is varying from 0.35 to 1, estimated based on the BSR (0.35 to 0.5) and porosity of the agglomerates. Subero et al., (2006) mentioned that if the initial crystal size is large the agglomeration process is less efficient. Indeed, particles prepared from the small crystals (5µm) have a higher strength (0.6 MPa) and a low porosity (Blandin et al., 2005) compared to the agglomerates prepared in this work (strength is 0.4 MPa). Blandin et al., (2005) found the adhesion force between fine particles and the bridging liquid to be stronger than that of coarse particles, thus leading to higher agglomerate size and strength. Zhang et al., (2010), found that the fine crystals were more closely compacted during agglomeration, than coarser particles. Kawashima and Capes, (1976) stated that initial crystal size had a strong influence on the spherical agglomeration process and fine particles require less amount of bridging liquid for the agglomeration and produce larger and denser agglomerates, than coarser crystals.
The temperature has a significant influence on the product properties, in that a lower temperature usually leads to larger and stronger agglomerates. Temperature influences many of the important conditions for spherical crystallization, like: viscosity, interfacial tension between bridging liquid and water, solubility of benzoic acid and liquid-liquid solubility. The solubility of the bridging liquid and the solute in the system decreases with decreasing temperature. Vice versa viscosity, interfacial tension and supersaturation of the solution increase with decreasing temperature. In the present work the viscosity of the solvents increases with decreasing temperature. However, at constant temperature there is not a clear correlation to viscosity when different solvents are used – not for the mean size and neither for the fracture stress. The interfacial tension between the bridging liquid and water do not change much with temperature over the range of this study and hence cannot explain the influence of temperature. Supersaturation increases because of the decreasing solubility and temperature which leads to produce smaller crystals. The influence of agitation is of great importance for the creation of the spherical shape. When the feed amount is increased in B1 and B2 experiments, the newly added material is not only used to produce new particles but is also partly used to increase the size of those already present. It is clear that not only further addition of feed solution leads to larger product particles but also continued agitation, which also corresponds to the findings of Morishima et al., (1993). By comparison with a granulation process we can envisage how a bridging liquid rich phase collects and binds the particles together by capillary forces. Agitation leads to a gradual consolidation of the agglomerates, reducing their size and porosity. This leads to that the liquid pore saturation of the bridging liquid
63

rich solution increases, i.e. this solution is squeezed out to the particle surface and may contribute to further growth by coalescence with other agglomerates. Hydrodynamics are responsible for bringing particles together for the agglomeration. However, the shear forces of the agitated liquid and collisions with equipment surfaces and other particles are squeezing and moulding the irregular agglomerates into an almost perfect spherical shape. We may note that this action not only creates the spherical shape but also leads to an increased density and mechanical strength of the particles, and in the reduction of larger internal voids. Along the course of the process particles shape develops gradually from small crystals into small agglomerates and these small agglomerates attach with each other and transform to big agglomerates then into a spherical shape. It is clear that the spherical shape of the agglomerates is not the result of the agglomerates being formed in spherical droplets of a dispersed liquid phase. The spherical shape is due to the mechanical forces of the agitation exerted on the particles over a longer period of time, similar to a granulation process. Also from SEM micrographs we have not observed that the crystals have an overall preferred orientation in the agglomerates (in example indicating spherulitic growth (Beck and Andreassen 2010)), besides the fact that at the surface they seem to orient along the surface, which we interpret as being due to the action of the agitation. Feeding rate is the velocity at which the feed is pumped and it gives the feeding time to fill the reactor with required amount of feed. With increasing feeding rate the feed time decreases and increases the scale of segregation in the feed zone. An increase of supersaturation in the bulk becomes faster. Increasing the supersaturation level increases nucleation and decreases the time for the agglomerate growth. Finally after the completion of the experiment the final solution is always a mixture of 2 or 3 solvents which can be collected and reuse after separation. It has not been measured the final concentration of solvents in this work. But we expect that the bridging liquid dissolved in the final bulk is about equal to the solubility of bridging liquid in the bulk solution (less than 2% of total volume of water and ethanol). The obtained yield of benzoic acid is up to 87%, but the productivity [product / (water + ethanol + bridging liquid)] is found to be relatively low about 50 kg/l to 100 kg/l. The present work has been able to identify the mechanisms behind the spherical agglomerates formation and also some possible contributions of fundamental physical properties of the bridging liquid, including interfacial tension with water, polarity and viscosity. So these results may offer a useful starting point to guide the selection of solvent systems for spherical agglomeration.
64

6. CONCLUSIONS
Spherical agglomerates of benzoic acid have been successfully prepared by semi-batch, agitated vessel, drowning-out crystallization in (water-ethanol-bridging liquid) mixtures using the spherical crystallization technique. Different solvents (chloroform, toluene, cyclohexane, pentane, heptane, diethyl ether and ethyl acetate) are used as the bridging liquid. With ethyl acetate and diethyl ether no spherical agglomerates are formed. Results suggest that good wettability and low solubility with anti solvent are not sufficient criteria for a solvent to work as bridging liquid in spherical crystallization. It appears that the interfacial tension between the anti solvent/bridging liquid is an important parameter. For diethyl ether and ethyl acetate the interfacial tension with water is clearly lower than for the other five solvents, and this may lead to that the interfacial tension forces and the capillary forces are not strong enough, and hence explain why these solvents do not lead to agglomeration.
The results show that the amount of bridging liquid is critical for the formation of agglomerates and the spherical agglomerates can only be obtained in a certain range of BSR (volume of bridging liquid/volume of solute). For the water-ethanol-toluene system at 20°C the BSR range is found to be 0.47 to 1.16 and for heptane as bridging liquid at 5°C the range is 0.73 to 1.23. Below this range the agglomeration is incomplete and above a paste is formed. With increasing BSR the particle size increases significantly. The particle size increases with increasing initial solute concentration and increasing agitation rate up to a certain level. It was found that the particle size significantly decreased with increasing feeding rate and temperature. The particle size depends on the bridging liquid and the largest agglomerates are produced when using either cyclohexane and operating at 5°C, or using toluene at 20°C. Particle morphology at 20°C is improved with increasing BSR when toluene is used as the bridging liquid, whereas there is no difference at 5°C for heptane as the bridging liquid. Morphology of the particles remains unchanged with changing in feeding rate. With increasing temperature the constitute crystal size increased but the morphology of the agglomerates is unchanged when heptane is used as bridging liquid. Particles are completely spherical using toluene and pentane as bridging liquid when sufficient amount of bridging liquid is added. The choice of the bridging liquid, amount of bridging liquid, feeding rate and the temperature has a significant influence on the mechanical strength of the particles. Fracture stress is increasing with increasing amount of bridging liquid and feeding rate. For the same conditions, the fracture force of the particles is increases with the increase
65

in particle size. At 5 and 20°C using toluene as bridging liquid the particles show higher fracture stress compared to other bridging liquids. Low elastic recovery and high compressibility of the single particles and of a bed of particles reveals that the spherical agglomerates prepared in this work are expected to be favorable for direct tabletting. Spherical agglomerates are formed by the association of a number of smaller crystals, so these particles are expected to have high dissolution rate and bioavailability. Experiments reveal that during the gradual addition of the feed to the agitated aqueous solution, both particle size and particle number increases. Benzoic acid that crystallizes in the spherical crystallization experiments does crystallize very rapidly. These crystals are initially clustered together as a result of interfacial tension and capillary forces associated with the liquid-liquid interface between the water and the bridging liquid rich solutions in the aggregates. Agitation appears to play a key role in the generation of the spherical shape. By continued agitation the shape gradually becomes more spherical, and also there is a gradual increase in the particle density and the strength.
66
7. REFERENCES
Ålander EM, Uusi-Pentillä MS, Rasmuson ÅC. Characterization of paracetamol agglomerates by image analysis and strength measurement. Powder Technol. 2003; 130, 298-306. Ålander EM, Rasmuson ÅC. On the mechanisms of crystal agglomeration of paracetamol in acetone-water mixtures. Ind Eng Chem Res. 2005; 44, 5788-5794. Alderborn G, Nyström C. (1996), Pharmaceutical powder compaction technology, Uppsala University, Uppsala, Sweden. Almarsson O, Zaworotko MJ. Crystal engineering of the composition of pharmaceutical phases. Do pharmaceutical co-crystals represent a new path to improved medicines? Chem. Commun. (Camb). 2004; 17, 1889-1896. Antonyuk S, Tomas J, Heinrich S, Mörl L. Micro-Macro Breakage Behavior of Elastic-Plastic Granulates by Compression. Chem. Eng. Technol. 2005; 28, 623-9. Åslund B, Rasmuson ÅC. Semi batch Reaction Crystallization of Benzoic acid. AIChE J. 1992; 38, 328-342. AvAgba S, Hounslow M, Seville, J. (2007), Granulation. Volume 11, Elsevier, ISBN 13: 978-0-444-51871-2. Bahramian A, Danesh A. Prediction of liquid-liquid interfacial tension in multi-component system. Fluid phase equilibr. 2004; 221, 197-205. Bausch A, Leuenberger H. Wet spherical agglomeration of proteins as a new method to prepare parenteral fast soluble dosage forms. Int. J. Pharm. 1994; 101, 63-70. Beck R, Andreassen J. Spherulitic growth of calcium carbonate. Cryst.Growth Des., 2010; 10, 2934-2947. Blandin AF, Mangin D, Rivoire A, Klein JP, Bossoutrot JM. Agglomeration in suspension of salicylic acid fine particles: influence of some process parameters on kinetics and agglomerate final size. Powder Technol. 2003; 130, 316-323. Blandin AF, Mangin D, Rivoire A, Klein JP, Bossoutrot JM. Modeling of agglomeration in suspension: Application to salicylic acid microparticles. Powder Technol. 2005; 156, 19-33. Bos AS, Zuiderweg FJ, Size of agglomerates in batch wise suspension agglomeration. Chem. Eng.Res.Des. 1987; 65, 187.
67

Bruno G, Randaccio L. A refinement of the benzoic acid structure at room temperature. Acta. Cryst. 1980(B36):1711-1712. Budavari S, ED. The Merck Index: An Encyclopedia of Chemicals Drugs and Biologicals, 12th ed.; Merck Co. Inc.: Whitehouse station, NJ, 1996. Butt H, Kappl M. Normal capillary forces. Adv. Colloid Interface Sci. 2009; 146, 48-60. Capes CE, Sutherland JP. Formation of spheres from finely divided solids in liquid suspension. I&EC Proceed Des. Dev. 1967; 6, 146-154. Chow AHL, Leung MWM. A study of the mechanisms of wet spherical agglomeration of pharmaceutical powders. Drug Dev Ind Pharma. 1996; 4, 357-371. Coulson JM, Rishardson JF, Backhurst JR, Harker JH. (2002), Particle Technology and separation processes. Chemical Engineering - Fifth edition. Davey RJ, 7th International symposium on Industrial crystallization, edited by E.J.de Jong and S.J. Jancie, North Holland publishing company, 1978;169. Espitalier F, Biscans B, Laguerie C, Authelin JR, Deleuil M. Crystallization of an active substance from emulsion droplets. Interactions between usage properties and process. Industrial Crystallization. 1993; 1(9):3-025-3-30. Ettabia A. Preparation of a pure paracetamol for direct compression by spherical agglomeration. Pharmazeutische Industrie. 1997; 7(59), 625-631. Farnand JR, Smith HM, Puddington IE. Spherical agglomeration of solids in liquid suspension. Can. J. Chem. Eng. 1961; 39, 94-7. Fichtner F, Rasmuson Å, Ålander. E, Alderborn G. Effect of preparation method on compactability of paracetamol granules and agglomerates. Int. J. Pharm. 2007; 336, 148-58. Goczo H, Szabo-Revesz P, Farkas B, Hasznos-Nezdei M, Serwanis SF, Pintye-Hodi AK, et al. Development of spherical crystals of acetylsalicylic acid for direct tablet-making. Chem. Pharm. Bull. 2000; 48, 1877-81. Goebel A, Lunkenheimer K. Interfacial tension of the water/n-alkane interface. Langmuir. 1997; 13, 369-372. Gohel MC, Parikh RK, Shah H, Dubey RR. Improvement in flowability and compressibility of ampicillin trihydrate by spherical crystallization. Ind. J. Pharm Sci. 2003; 65, 634-637.
68

Gonzalez DA, Biscans B. Spherical agglomeration during crystallization of an active pharmaceutical ingredient. Powder Technol. 2002; 128, 188-194. Hasan, OS., (2001), Effect of solvent composition on the spherical crystallization of salicylic acid, UMI, USA Holmbäck X, Rasmuson ÅC. Size and morphology of benzoic acid crystals produced by drowning-out crystallization. J.Crystal Growth. 1999; 198-199, 780-788. Holmbäck X, Rasmuson ÅC. Examination of the effect of solvent on crystal growth, 15th ISIC, edited by A.Chianese, 2002; 11, 779-784. Iveson SI, Litster JD. Fundamental studies of granulation consolidation Part 2: quantifying the effects of particle and binder properties. Powder Technol. 1998; 99, 243-250. Iveson SI, Litster JD, Hapgood K, Ennis B, J. Nucleation, growth and breakage phenomena in agitated wet granulation processes: a review. Powder Technol. 2001; 117, 3-39. Johansen A, Schaefer T. Effects of interactions between powder particle size and binder viscosity on agglomerate growth mechanisms in a high shear mixer. Eur. J. Pharm. Sci. 2001; 12, 297-309. Kachrimanis K, Ktistis G, Malamataris S. Crystallization conditions and physicomechanical properties of ibuprofen-Eudragit S100 spherical crystal agglomerates prepared by the solvent-change technique. Int. J. Pharm. 1998; 173, 61-74. Kawashima Y, Aoki S, Takenaka H. Spherical agglomeration of aminophylline crystals during reaction in liquid by the spherical crystallization technique. Chem. Pharm. Bull. 1982; 30, 1900-2. Kawashima Y, Capes CE. Experimental study of the kinetics of spherical agglomeration in as stirred vessel. Powder Technol. 1974; 10, 85-92. Kawashima Y, Capes CE. Further studies of the kinetics of spherical agglomeration in a stirred vessel. Powder Technol. 1976; 13, 279-288. Kawashima Y, Cui F, Takeuchi H, Niwa T, Hino T, Kiuchi K. Improvements in flowability and compressibility of pharmaceutical crystals for direct tabletting by spherical crystallization with a 2 solvent system. Powder Technol. 1994; 78, 151-157. Kawashima Y, Cui F, Takeuchi H, Niwa T, Hino T, Kiuchi K. Improved static compression behaviors and tablettabilities of spherically agglomerated crystals produced by the spherical crystallization technique with a two-solvent system. Pharma. Res. 1995; 12, 1040-4.
69

Kawashima Y, Cui F, Takeuchi H, Niwa T, Hino T, Kiuchi K. Parameters determining the agglomeration behavior and the micromeritic properties of spherically agglomerated crystals prepared by the spherical crystallization technique with miscible solvent systems. Int. J. Pharm. 1995; 119, 139-47. Kawashima Y, Furukawa K, Takenaka H. The physicochemical parameters determining the size of agglomerate prepared by the wet spherical agglomeration technique. Powder Technol. 1981; 30, 211-16. Kawashima Y, Imai M, Takeuchi H, Yamamoto H, Kamiya K, Hino T. Improved flowability and compactibility of spherically agglomerated crystals of ascorbic acid for direct tabletting designed by spherical crystallization process. Powder Technol. 2003; 130, 283-289. Kawashima Y, Imai M, Takeuchi H, Yamamoto H, and Kamiya, K, Development of Agglomerated Crystals of Ascorbic acid by the Spherical Crystallization Technique for Direct Tabletting, and Evaluation of their Compactibilities, Kona. 2002; 20, 251-261. Kawashima Y, Lin SY, Ogawa M, Handa T, Takenaka H. Preparations of agglomerated crystals of polymorphic mixtures and a new complex of indomethacin-epirizole by the spherical crystallization technique. J. Pharm. Sci. 1985; 74, 1152-6. Kawashima Y, Morishima K, Takeuchi H, Niwa T, Hino T, Kawashima Y. Crystal design for direct tabletting and coating by the spherical crystallization technique. AIChE Symposium Series. 1991; 284, 26-32. Kawashima Y, Naito M, Lin SY, Takenaka H. An experimental study of the kinetics of the spherical crystallization of sodium theophylline monohydrate. Powder Technol. 1983; 34, 255-60. Kawashima Y, Okumura M, Takenaka H. Spherical crystallization: direct spherical agglomeration of salicylic acid crystals during crystallization. Science. 1982; 4550(216), 1127-8. Kawashima Y, Okumura M, Takenaka H. The effects of temperature on the spherical crystallization of salicylic acid. Powder Technol. 1984; 39, 41-47. Kawashima Y, Takeuchi H, Niwa T, Hino T, Yamakoshi M, Kihara K. Preparation of spherically agglomerated crystals of an antibacterial drug for direct tabletting by a novel spherical crystallization technique. Congr. Int. Technol. Pharm. 1989; 5, 228-34. Kazuhiko I, Kawashima Y, Takeuchi H, Yamamoto H, Isshiki N, Momose D. Primary crystal growth during spherical agglomeration in liquid: designing an ideal dry powder inhalation system. Powder Technol. 2002; 126, 266-274.
70

Kenningley ST, Knight PC, Marson AD. An investigation into the effects of binder viscosity on agglomeration behavior, Powder Technol. 1997; 91, 95-103. Kumar S, Chawla G, Bansal AK. Spherical crystallization of mebendazole to improve processability. Pharm. Dev. Technol. 2008; 13, 559-568. Lasagabaster A, Martin C, Goni MM. Preparation of spherically agglomerated crystals of the 3,5-diglucoside of cyaniding (cyanin). J. Chem. Tech. Biotechnol. 1994; 60, 397-403. Li B, Fu J. Interfacial tensions of two liquid phase ternary systems. J. Chem. Eng. Data.1992; 37, 172-174 Machiya K, Koga K, Mukuta T, Moriki S, Kagara K, Ooshima H. Production of Spherical Agglomerates of Cephalosporin Antibiotic Crystal. J. Chem. Eng. Japan. 2008; 41, 1017-1023. Martino PD, Barthelemy C, Piva F, Joiris E, Palmieri GF, Martelli S. Improved dissolution behavior of fenbufen by spherical crystallization. Drug Dev Ind Pharm. 1999; 25, 1073-1081. Mersmann A, (2001), Crystallization Technology Handbook., A. Mersmann ed, Germany Morishima K, Kawashima Y, Kawashima H, Takeuchi H, Niwa T, Hino T. Micromeritic characteristics and agglomeration mechanisms in the spherical crystallization of bucillamine by the spherical agglomeration and the emulsion solvent diffusion methods. Powder Technol. 1993; 76, 57-64. Morishima K, Kawashima Y, Kawashima H, Takeuchi H, Niwa T, Hino T. Tabletting properties of bucillamine agglomerates prepared by the spherical crystallization technique. Int. J. Phar. 1994; 105, 11-18. Muller M, Loffler F. Development of agglomerate size and structure during spherical agglomeration suspension. Part. Part. Syst. Charact. 1996; 13, 322-326. Murov S, (1997), MSDS compilations (Section II-B-4 of the Chemistry Webercises Directory) or the ChemFinder Web Server. http://virtual.yosemite.cc.ca.us/smurov/orgsoltab.html Muster HT, Prestidge AC. Application of time dependent sessile drop contact angles on compacts to characterize the surface energetics of sulfathiazole crystals. Int. J. Pharm. 2002; 234, 43-54. Nayak U A, Mutalik S, Meka S R, Averineni R K, Pralhad K, Nayanabhirama U. Preparation and, in vitro, preclinical and clinical studies of aceclofenac spehrical agglomerates. Eur. J. Pharm. Sci. 2008; 70, 674-683.
71

Niwa T, Takeuchi H, Hino T, Itoh A, Kawashima Y, Kiuchi K. Preparation of agglomerated crystals for direct tabletting and microencapsulation by the spherical crystallization technique with a continuous system. Pharm. Res. 1994; 11, 478-484. Nokhodchi A, Maghsoodi Z, Davood H, Mohammad J. Preparation of agglomerated crystals for improving flowability and compactability of poorly flowable and compactible drugs and excipients. Powder Technol. 2007; 175, 73-81. Nordström FL, Rasmuson ÅC. Solubility and melting properties of salicylamide. J. Chem. Eng. Data. 2006; 51, 1775-1777. Othmer K, (1992), Kroschwitz, J.I., Howe – Grant, M., (EDS.), Encyclopedia of chemical Technology, 4th edition. John Wiley & Sons, New York. Oliveira CA, Coelho GM, Pires FR, Franco JR, Solubility of benzoic acid in mixed solvents. J. Chem. Eng. Data. 2007; 52, 298-300. Pawar A, Paradkar A, Kadam S, Mahadik K. Agglomeration of Ibuprofen With Talc by Novel Crystallo-Co-Agglomeration Technique. AAPS PharmSciTech. 2004; 5, 30-35. Podczeck F, Jones B, (2004), Pharmaceutical capsules 2nd edition. Puechagut HG, Bianchotti J, Chiale CA. Preparation of norfloxacin spherical agglomerates using the ammonia diffusion system. J. Pharm. Sci. 1998; 87, 519-23. Re M, Biscans B. Preparation of miscrospheres of ketoprofen with acrylic polymers by a quasi-emulsion solvent diffusion method. Powder Technol. 1999; 101, 120-133. Reichardt, C., (2003), Solvents and solvent effects in organic chemistry, VCH publishers, ISBN 10 3527306188
Revesz PS, Nezdei MH, Farkas B, H G, Hodi K, P, Eros I. Crystal growth of drug materials by spherical crystallization. J. Cryst. Growth. 2002; 237-239, 2240-2245. Ribardiere TP, Couarraze G, Puisieux F. Modification of ketoprofen bead structure produced by the spherical crystallization technique with a two-solvent system. Int. J. Pharm. 1996; 144, 195-207. Robert CW, Jeanette, GG. (1985). Handbook of data on organic compounds, 2nd ed, CRC Press: Boca Raton, FL, Vol 2. Sandell E, (1993), Industrial Aspects of Pharmaceutics. Swedish pharmaceutical press, Stockholm, Sweden. Sadowski Z. Selective spherical agglomeration of fine salt type mineral particles in aqueous solution. Colloids Surfaces A: Physicochem. Eng. Aspects. 1995; 96, 277-285.
72

Sang MC, Kim J-M, Kim I-H, Shin D-M, Kim W-S. Agglomeration Control of L-Ornithine Aspartate crystals by operating variables in Drowning –out crystallization. Ind. Eng. Chem. Res. 2006; 45, 1631-1635. Sano A, Kuriki T, Kawashima Y, Takeuchi H, Hino T, Niwa T. Particle design of tolbutamide by the spherical crystallization technique. III. Micromeritic properties and dissolution rate of tolbutamide spherical agglomerates prepared by the quasi-emulsion solvent diffusion method and the solvent change method. Chem. Pharm. Bull. 1990; 38, 733-739. Sano A, Kuriki T, Kawashima Y, Takeuchi H, Hino T, Niwa T. Particle design of tolbutamide by spherical crystallization technique. V. Improvement of dissolution and bioavailability of direct compressed tablets prepared using tolbutamide agglomerated crystals. Chem. Pharm. Bull. 1992; 40, 3030-3035. Sirianni AF, Capes CE, Puddington IE. Recent experience with the spherical agglomeration process. Can. J. Chem. Eng. 1969; 47, 166-170. Small wood IM, (1996), Handbook of Organic Solvent Properties, Elsevier, ISBN 978-0-340-64578-9 Electronic ISBN 978-0-0805-2378-1 Subero CC, Mangin D, Rivoire A, Blandin AF, Klein JP. Agglomeration in suspension of salicylic acid fine particles: Analysis of the wetting period and effect of the binder injection mode on the final agglomerate size. Powder Technol. 2006; 161, 98-109. Sutherland JP. The agglomeration of aqueous suspensions of graphite. Can. J. Chem. Eng. 1962; 40, 268-272. Tambo N, Watanabe Y. Physical aspect of flocculation process. I. Fundamental treatise. Water Res. 1979; 13, 429-39. Teychene S, Sicre N, Biscans B, Is spherical crystallization without additives possible? Chem. Eng. Res. Des. 2010; 88, 1631-1638. Ueda M, Nakamura Y, Makita H, Imasato Y, Kawashima Y. Particle design of enoxacin by spherical crystallization technique. I. Principle of ammonia diffusion system (ADS). Chem. Pharm. Bull. 1990; 38, 2537-41. Ueda M, Nakamura Y, Makita H, Imasato Y, Kawashima Y. Particle design of enoxacin by spherical crystallization technique. II. Characteristics of agglomerated crystals. Chem. Pharm. Bull. 1991; 39, 1277-1281. Yamada Y, Shimojima K, Sakaguchi Y, Mabuchi M, Nakamura M, Asahina T, et al. Compressive properties of open – cellular SG91AA1 and AZ91 Mg. Mat. Sci. Eng. 1999; A272, 455-8.
73

74

8. ACKNOWLEDGMENTS
This work has been carried out at the Division of Transport Phenomena, Institute of Chemical Engineering and Technology, School of Chemical Science and Engineering, Royal Institute of Technology (KTH), Stockholm, Sweden. IKF is greatly acknowledged for the financial support. I am very thankful to, My supervisor, Professor Åke Rasmuson, for the support, encouragement and excellent guidance throughout this work. Materials and Surface Science Institute, University of Limerick, Ireland for kindly allowing me to do part of my work at the Department of Chemical and Environmental Science. Anna Piterina of the Materials and Surface Science, Institute of the University of Limerick, Ireland for analyses by Scanning Confocal Microscopy and XRD, and for assistance with Scanning Electron Microscopy. Dr. Denise Croker, Peigao Zhong, Anthony Maher, Marcus O´Mahony for the assistance and help during my work in the department, Materials and Surface Science Institute, University of Limerick, Ireland. Dr. Matthäus Bäbler (Department of Chemical Engineering and Technology) at KTH for the corrections and helping with the grammar in this thesis. Andreas Fischer (Department of Chemistry, Inorganic Chemistry, KTH) for helping me with the X-ray diffraction analysis. Jonas Bonn (Department of Analytical Chemistry) and Massoud Pirjamali (Department of Chemical Technology) at KTH for their help with GC. Jan Appelqvist (Department of Chemical Engineering and Technology) for all the help during my work at the department. All current and former and other colleagues at the institute (Ziyun Zu, Sandra Gracin, Marie Ståhl, Eva Ålander, Fredrik Nordström, Kerstin Forsberg, Michael Svärd, Shuo Zhang, Huaiyu Yang, Liu Jin and Joaquin Martinez) for their help and suggestions, especially Michael for helping me with the DSC and the computer issues all the time.
75

76
My parents and in-laws, especially Katta, Kota, Thati and Valki families for their love and encouragement. All my School, College and University friends especially Raji, Rama, Vijaya sree, Aruna, Kiran and Praveen for their friendship and love. Lappis friends for all the get togethers and parties specially Srinivas R.S. for helping me with the cover page. Friends from the Church in Stockholm for loving and made me to feel like their family member especially Donna and Linda. Finally my husband Kranthi Kumar Thati for his continuous support, love and encouragement throughout these years.