Embed Size (px)
Citation preview
KTH Industrial Engineering And Management
Particle emissions from car brakes: the influence of contact conditions on the pad-to-rotor interface
Mattia Alemani
Doctoral thesis in Machine Design Stockholm, Sweden, 2017

TRITA-MMK 2017:03 ISSN 1400-1179 ISRN/KTH/MMK/R-17/03-SE ISBN: 978-91-7729-462-7 Akademisk avhandling som med tillstånd av KTH i Stockholm framlägges till offentlig granskning för avläggande av teknisk doktorsexamen fredagen den 29 september kl. 10:00 i sal Gladan, KTH, Brinnelvägen 83, Stockholm.

A LorenzΩ e Nunciatα

Abstract Due to their adverse health effects emissions have been regulated for over three
decades. Brake wear particulate matter is the most important non-exhaust source,
however current knowledge is mainly limited to observational studies. This thesis
aims to investigate relations between the brake system contact conditions and the
related emissions on a model scale; validate the results on a component level; and
understand to what extent they are significant on a full-scale.
Paper A investigates the influence of nominal contact pressure on a model scale.
Results show that higher pressure corresponds to higher emissions
Paper B investigates the influence of the nominal contact pressure, for different
friction materials, on a model scale. A temperature threshold, responsible for a
relevant emission increase, is identified.
Paper C investigates particle characteristics and wear mechanisms for different
nominal contact pressures, on a model scale. Results show an enhanced tribo-layer
at higher pressure levels.
Paper D investigates the influence of brake system conditions on emissions, on a
model scale. Results show that frictional power is the most important parameter. A
transition temperature independent of the contact condition is identified.
Paper E investigates similarities occurring on a component scale and a model scale
in terms of emissions. Results show a promising correlation, and the possibility of
using a pin-on-disc tribometer for R&D activities.
Paper F investigates analogies occurring on a component scale and a model scale,
in terms of friction performance, fictional surface and chemical composition.
Results show similar phenomena occurring for the two test stands.
Paper G analyses real brake system working conditions in a urban environment
defining, by means of an inertia dyno bench, the related emissions. Results reveal
emission factors compliant to EURO6 and EURO2 regulations, in terms of number
and mass, respectively.
Keywords:
Car brakes emissions, transition temperature, working conditions, environmental
design, pin-on-disc

Sammanfattning På grund av deras negativa hälsoeffekter har partikel emissioner reglerats i över tre
årtionden. Bromsslitagepartiklar är den viktigaste icke-avgaskällan, men
nuvarande kunskaper är huvudsakligen begränsade till observationsstudier.
Avhandlingen syftar till att undersöka förhållandena mellan bromssystemets
kontaktförhållanden och de relaterade utsläppen på modellskala. Validera
resultaten på komponentnivå och förstå i vilken utsträckning de är betydande i full
skala.
Papper A undersöker påverkan av nominellt kontakttryck i en modellskala.
Resultat visar att högre tryck motsvarar högre utsläpp.
Papper B undersöker påverkan av det nominella kontakttrycket, för olika
friktionsmaterial, i modellskala. En temperaturtröskel, för en emissionsökning
identifieras.
Papper C undersöker partikelegenskaper och slitagemekanismer för olika
nominella kontakttryck, i en modellskala. Resultat visar ett förbättrat triboskikt vid
högre trycknivåer.
Papper D undersöker påverkan av bromssystemets förhållanden på utsläpp i en
modellskala. Resultat visar att friktionskraften är den viktigaste parametern. En
övergångstemperatur oberoende av kontaktförhållandet identifieras.
Papper E undersöker likheter som uppträder på komponentskala och modellskala
när det gäller emissioner. Resultatet visar en lovande korrelation, och möjligheten
att använda en pinne-på-skiva-tribometer för FoU-aktiviteter.
Papper F undersöker analogier som förekommer på en komponentskala och en
modellskala, vad gäller friktionsprestanda, friktionsyta och kemisk
sammansättning. Resultat visar liknande fenomen som förekommer för de två
testskalorna.
Papper G analyserar verkliga bromssystem arbetsförhållanden i en stadsmiljö som
definierar, med hjälp av en tröghetsdyno bänk, de relaterade utsläppen. Resultatet
visar utsläppsfaktorer som är förenliga med EURO6 och EURO2-reglerna, i fråga
om antal respektive massa.
Nyckelord:
Bilbromsutsläpp, övergångstemperatur, arbetsförhållanden, miljödesign, pinne-på-skiva


Acknowledgments The research leading to these thesis has achieved funding from the European Union
Seventh Framework Programme (FP-PEOPLE-2012-IAPP) under the Rebrake
Project (G.A. 324385).
Most of the presented work has been conducted at the Department of Machine
Design at KTH, Royal Institute of Technology, in collaboration with Brembo S.p.A.
and the University of Trento.
I would like to thank my supervisors Prof. Ulf Olofsson, Ass. Prof. Jens Wahlström
and Ass. Prof. Anders Söderberg; Brembo Advanced R&D – Materials responsible,
Ing. Guido Perricone, and Brembo Advanced R&D head of department Ing.
Alessandro Ciotti.
I would also like to thank the Rebrake Team and my brilliant co-authors: Dr.
Vlastimil Matějka, Dr. Ibrahim Metinöz, Mr. Gabriele Riva, Dr. Oleksii Nosko, Prof.
Giovanni Straffelini, Prof. Stefano Gialanella, Dr. Rodica Ciudin.
Thanks to Francesco Riccobono and Theodoros Grigoratos, from JRC, for the
fruitful cooperation and their continuous support.
Thanks to Pierfausto Rota, Mario Tironi, Peter Carlsson and Staffan Qvarnström
for their essential help and all the interesting conversations we had.
A special thank is deserved for the people who made the past 4 years so great.
Starting from my first Stockholm friends, Patrick and Abbos. I can only say “Poppy
said that malt is multifunzione”; Federico, Claudia and Bianca, one of the best
Italian couples I’ve ever met, a Sacher Torte will be always ready for you. About
Sacher Torte I take the chance to thank our manager David, supporting us in the
Swedish classic with fundamental beers and tips; The amazing “Whatever
Whenever Club”, with Pouyone, Gregorione, Bertrand, Chris, Claudio and Nicola,
Amazing people for an amazing… whatever; my incredible dinner mates Daniel and
Kata, YinYin and Hailong, Mario, Martin and Kenneth.
I cannot avoid to thank my Italian friends Niko, Bigno & Co.; Attila & Co; Mirko,
Giorgia, Riky, Vale e Filo & Co.; Davide, Eli & Co….always forgetting when I was
abroad and where I was. It has been so cool to be invited to go out also when I was
1800km “Away from Home”.
Finally a special thank goes to my Family supporting me always, no matter how
smart or crazy are the choices I make.
Mattia Alemani
Stockholm, September 2017


List of appended publications Paper A
Mattia Alemani, Ulf Olofsson, Guido Perricone, Anders Söderberg, Jens
Wahlström, Alessandro Ciotti. “A Study on the load level influence on particulate
matter emissions from the sliding contact between a low steel friction material
and cast iron”. Eurobrake 2015 Conference Proceedings, EB2015-FMC-004,
Dresden, Germany, 4-6 May
Mattia Alemani planned and carried out the experimental work, did most of the
writing and the results evaluation.
Paper B
Mattia Alemani, Oleksii Nosko, Ibrahim Metinöz, Ulf Olofsson. “A study on
emissions of airborne wear particles from car brake friction pairs”. SAE Int. J.
Mater. Manf. 9(1):2016, doi:10.4271/2015-01-2665
Mattia Alemani planned and carried out the experimental work, contributed to the
writing and the results evaluation.
Paper C
Mattia Alemani, Stefano Gialanella, Giovanni Straffelini, Rodica Ciudin, Ulf
Olofsson, Guido Perricone, Ibrahim Metinöz. “Dry sliding of a low steel friction
material against cast iron at different loads: characterization of the friction layer
and wear debris”. Wear, 376-377 (2017) 1450-1459, doi:
10.1016/j.wear.2017.01.040
Mattia Alemani did most of the planning and carried out the experimental work,
contributed to the writing and the results evaluation.
Paper D
Mattia Alemani, Jens Wahlström, Ulf Olofsson. “On the influence of car brake
system parameters on particulate matter emissions”. Submitted to Wear
Mattia Alemani formulated the research questions and developed the methodology
to answer them, planned and carried out the experimental work, and did most of
the writing and the results evaluation.

Paper E
Mattia Alemani, Jens Wahsltröm, Vlastimil Matějka, Ibrahim Metinöz, Anders
Söderberg, Perricone Guido, Ulf Olofsson. “On the scaling effect of measuring disc
brake airborne particulate matter emissions – a comparison of a pin-on-disc
tribometer and an inertia dynamometer bench under dragging conditions”.
Submitted to IMechJ: Journal of Tribology
Mattia Alemani formulated the research questions and developed the methodology
to answer them, planned and carried out the experimental work, did most of the
writing and the evaluation.
Paper F
Ibrahim Metinöz, Vlastimil Matějka, Mattia Alemani, Jens Wahsltröm, Guido
Perricone “Could pin-on-disc tribometer be used to study the friction/wear
performance of disc brake materials?”. Eurobrake 2016 Conference Proceedings,
EB2016-MDS-010 ,Milan, Italy, 13-15 June
Mattia Alemani planned and carried out the experimental work to answer the
research questions, contributed to the writing and the results evaluation.
Paper G
Guido Perricone, Mattia Alemani, Jens Wahlström, Ulf Olofsson. “ A test stand
investigation on a real driving cycle emission factor for car brakes”. To be
submitted to IMechE: Journal of Automobile Engineering
Mattia Alemani planned and carried out the experimental work to answer the
research questions, contributed to the writing and the results evaluation.

List of non-appended publications
Mattia Alemani, Perricone Guido, Ulf Olofsson, Anders Söderberg, Jens
Wahlström, Alessandro Ciotti. “A proposed dyno bench test cycle to study particle
emissions from disc brakes”. Eurobrake 2014 Conference Proceedings, EB2014-
SE-001 ,Lille, France, 13-15 May
Oleksii Nosko, Mattia Alemani, Ulf Olofsson. “Temperature effect on emission of
airborne wear particles from car brakes”. Eurobrake 2014 Conference
Proceedings, EB2015-TEF-014 ,Dresden, Germany, 4-6 May
Guido Perricone, Jens Wahsltröm, Mattia Alemani, Ulf Olofsson, Ciotti Alessandro.
“A novel dyno bench design focussing on measurements in controlled air of
particle emission from brakes”. Eurobrake 2015 Conference Proceedings, EB2015-
EFP-005 ,Dresden, Germany, 4-6 May
Piyush Chandra Verma, Mattia Alemani, Stefano Gialanella, Luca Lutterotti, Ulf
Olofsson, Giovanni Straffelini. “Wear debris from brake system materials: A
multi-analytical characterization approach”. Trib. Int, 97(2016) 510-511
Guido Perricone, Mattia Alemani, Ibrahim Metinöz, Vlastimil Matějka, Jens
Wahlström, Ulf Olofsson. “Towards the ranking of airborne article emissions
from car brakes – a system approach”. Proc IMechE Part D: J Automobile
Engineering 1-17 (2016)
Vlastimil Matějka, Ibrahim Metinöz, Mattia Alemani, Jens Wahsltröm, Andrea
Bonfanti, Ulf Olofsson, Guido Perricone “Dependency of PM10 particle emission
on stability of friction coefficient and character of friction surface”. Eurobrake
2016 Conference Proceedings, EB2016-MDS-010 ,Milan, Italy, 13-15 June


CONTENTS
1. Introduction …………………...…………………………….......... 17
1.1 Background …………………………………………………… 17 1.2 The car brake system ………………………………………... 19 1.3 Airborne particulate matter ………………………………….. 22 1.4 Challenges for brake emissions …………………………….. 24 1.5 Objectives ……………………………………………………... 26
2. Methodology ……………………………………………………… 27
2.1 Car brake system parameters ………………………............ 28 2.2 The pin-on-disc tribometer: a model scale ………………… 29 2.3 Results validation: component and full scale .…………….. 33 2.4 Particle measurement ……………………………………….. 35
3. Summary of the appended papers …………………... 37 4. Discussion and future work ……………………………… 41 5. Conclusions ………………………………………………………. 47
References …………………………………………………………………… 49
I Appended papers


INTRODUCTION | 17
Chapter 1
Introduction
“Corpus omne perseverare in statu suo quiescendi vel movendi uniformiter in
directum, nisi quatenus illud a viribus impressis cogitur statum suum mutare”.
In his book “Principia Mathematica”, Sir Isaac Newton taught us that to stop a body
in motion, a force acting upon it is needed. This is the basic working principle for
brake systems.
From the first steam-driven wheeled vehicle crash, in 1769, the transport sector
made this principle a concealed masterpiece of engineering. This especially after
the introduction of the combustion engine in the late 19th century. Indeed, the brake
system's most famous and familiar application, the car brake, is able to dissipate
three times the engine power promoting safety for the 907 million vehicles
circulating on roads worldwide.
Safety and progress, however, are not free of charge. While braking, the system
components are worn. This generates debris that can become airborne particulate
matter, well known for its adverse health effects and its contribution to global
warming.
For over 30 years, the European Union and the World Health Organization, have
been working to reduce air pollution from different sources. The high quality
research done on engine emissions - also called “exhaust” emissions - has led to a
significant reduction, enough to make brake systems, tyres and road wear
emissions - the “Non-Exhaust” emissions – equal to almost half of the total road
vehicle contribution. Brake emissions are the most significant non-exhaust
emissions of road vehicles.
1.1 Background
Air pollution is one of the biggest challenges of the 21stcentury. Indeed, it is the
main environmental cause of premature death in Europe [1], and has negative
effects on both the ecosystem and the climate [2]. In addition, the Organization for
Economic Co-operation and Development (OECD) estimates that pollution-related
costs will reach 2% of the European Gross Domestic Product (GDP) by 2060 [3].

18 | INTRODUCTION
The European Union (EU) and the World Health Organization (WHO) have been
developing guidelines and legislation [4,5] for decades, resulting in a clear
reduction in pollutants in the EU-28 countries [2]; however, the WHO has
estimated that more than 400 000 European citizens died prematurely in 2012
because of air pollution [6].
Among the addressed pollutants, particulate matter (PM) is one of the less affected
by the adopted countermeasures [2], but the one that induces the most severe [7]
health effects [8–10] such as cardiovascular and respiratory diseases [11,12], and
cancer [13]. Consequently, the mean life expectancy in European urban areas is
reduced by 0.63 years per person, with peaks of 1.2 YLL [14,15], due to particulate
matter air pollution.
In the aforementioned areas, one of the major contributors to particulate matter
emissions is the road transport sector, accounting for up to 64% [16,17]. In this
sector, emissions are divided into exhaust and non-exhaust ones, indicating
respectively: particles generated by vehicle engine combustion processes and
particles generated by brakes, tyre and road wear, and dust resuspension.
Over the past decades, significant efforts have been made by the EU to regulate
exhaust emissions (see Fig. 1). This has led to a comprehensive knowledge of the
related phenomena and to specific regulations, the so called “euro emissions
standards” which have forced car manufacturers to produce less and less emissive
vehicles [18].
Fig. 1: Euro emission standards limits
Continuous improvements in exhaust technologies have meant that non-exhaust
emissions now equal exhaust ones [19]. In addition, recent studies indicate that,
even without tail-pipe emissions, traffic will continue to contribute to fine and
ultrafine emissions [20,21], forecasting that 90% of the total road traffic emissions
by 2020 [22] will come from non-exhaust sources.
As far as non-exhaust sources are concerned, particles generated by the braking
systems are a primary emission source, contributing by 55% for PM10 and 21%
PM2.5 [19].

INTRODUCTION | 19
According to the aforementioned values, it can be estimated that brake particulate
matter in Europe is responsible for 0.043 YLL per person on average ( i.e. 16 days
of life lost), with peak values up to 0.08 ( i.e. 27 days of life lost), as shown by Fig.2.
Nonetheless, no regulations are available yet. This is especially because still little is
known about brake system contact conditions and their relations with particle
emissions.
Fig. 2: Years of Life Lost (YLL) in european urban areas due to different PM sources
1.2 The car brake system
The aim of a car brake system is to slow down or stop the vehicle, according to the
driver's will, by dissipating its kinetic energy and transforming it into frictional
heat. On modern passenger cars, two different kinds of brake systems can be used
[23]: disc brake systems or drum brake systems. The latter, still in use on modern
cars, consists of a spread mechanism that pushes two brake shoes against the inner
surface of a cast iron or steel brake drum, connected to the wheel. Nowadays, this
system is mainly used in rear car brake systems whereas the front one usually
consists of a disc brake system (see fig.3) which is also the subject of this research.
A disc brake system consists of three main parts: the calliper, pads and the rotor.
Fig. 3: A detailed view of the disc brake system assembly
Calliper
Pad Disc
Piston

20 | INTRODUCTION
1.2.1 The calliper
To allow a braking action to take place, the driver pushes a pedal generating a force
that is multiplied and transformed into pressure. This is carried through the system
hydraulics, by means of the brake fluid, to the calliper; the static component in the
system. This is mounted on the car knuckles and is responsible for generating the
forces required to stop the vehicle and absorb the related counterforces. From a
purely machine design perspective, the calliper body can be seen as a ground
constraint.
There are two main calliper families: fixed and sliding. The latter is characterized
by having a single active piston and a sliding passive part (Fig. 4a). Conversely, the
former (Fig. 4b) is made by a rigid body where two to eight pistons are evenly
distributed on both sides of the calliper. This thesis will deal with a fixed calliper.
When the brake fluid crosses the calliper, it eventually comes to the pistons where
the fluid pressure is transformed into a force acting on the pads. This force is
dependent on the calliper design and, more specifically, on the ratio between the
pistons and the pad area.
Fig. 4: Cross section of a sliding (a) and a fixed (b) calliper
1.2.2 The pads
Two pads are placed inside the calliper. Pads consist of: an iron back-plate, as a
solid base for the piston contact which can be equipped with a shim, a thin metallic
sheet, for noise reduction; an under-layer, mainly responsible for thermal
insulation and dumping, which is a mixture of organic materials; the friction
material, made from about twenty different materials and finely tuned to obtained
a desired friction coefficient. The different friction material families are listed and
explained in Table 1.
Pads represents one of the two main actors in the brake system sliding contact.
Depending on the composition of the friction material, different pad families [24]
can also be defined, as shown in Table 2.
Calliper
Pistons
Pads
a) b)

INTRODUCTION | 21
Table 1. Friction materials families and their function
Function Material examples
Binders Guarantee mechanical properties and pad integrity throughout pad life
Organic fibres, phenolic resin, friction powders
Abrasives Tune the friction coefficient and avoid material deposits during the braking action
Oxides powders and metal powders
Lubricants Reduce wear and stabilize the friction coefficient
Graphite, coke, Antimony, Molybdenum sulphide and other metals
Metals Absorb the vehicle energy as heat, and avoid overheating of the sliding surfaces
Steel, copper, Zinc, Tin fibres
Table 2. Pad families according to the friction material composition
Composition Characteristics
NAO Up to 10% wt. Cu and Cu alloys
Common in USA and Japan Market. Low COF (0.3-0.4), low wear and noise
Low-Steel
10-50% wt. Fe, Steel, Cu and Cu alloys
Common in Europe. High COF (0.35-0.5), stable for high speeds and temperatures. Higher wear than NAO
Semi-metallic
Ferrous metal content up to 40% wt.
Low COF (0.25-0.35), high wear but improved performance at high temperatures
1.2.3 The rotor
The pads act directly on the rotating part of the system: the rotor. This is connected
to the wheel axle, thereby having the same rotational speed, by a rigid joint through
the rotor bell. The bell is then connected to the braking surfaces in different ways
which are also typical features of different rotors families: when the full rotor is a
unique casted part of the same material, it is called integral; when the braking
surface and the bell materials differ, but the connection is due to a casting process,
it is called a co-casted rotor; when the connection is obtained by bolts or rivets, it
is called a floating rotor. In addition, the two braking surfaces can be a solid part or
can have ventilation channels to improve heat exchange with the ambient air. In
the latter case, the rotor is called ventilated (see Fig. 5).
The most common brake rotor material used is grey cast iron which has good
thermal conductivity, mechanical strength and damping capacity (up to 100 times
more than iron, and 800 times more than aluminium) [25]. In addition, it is a very
cheap and easy to cast material. These features mean that cast iron dominates the
rotor market, irrespective of its considerable weight.
Carbon-ceramic disc brakes are also available on the market. However, even
though their weight is one third of the cast iron ones and performance is better,
their costs are prohibitive for most Europeans.

22 | INTRODUCTION
Fig. 5: Cross section of a ventilated rotor
1.3 Airborne particulate matter
Airborne particulate matter, also referred to as aerosols, is defined in its simplest
form as a collection of solid or liquid particles suspended in a gas [26]. These
particles are usually stable for a variable time period ranging from a few seconds to
years.
It is possible to distinguish between primary and secondary aerosols depending on
whether particles are introduced directly into the atmosphere or are formed in the
atmosphere by the chemical reaction of gaseous components, also known as
precursor gases. Among them, the most important are SO2,NOx,NH3 and VOCs
(Volatile Organic Compounds) [27].
In addition, they can be monodispersed or poly-dispersed depending on whether
the particle size is unique for the whole aerosol or different sizes coexist. The former
is usually artificially generated for particle instrument calibration[28].
This thesis will deal with primary poly-dispersed aerosols since brake wear
particles are directly introduced into the air, and cover a wide size range.
1.3.1 Particle Size
To characterize particles, the most important parameter is the particle size [26].
However, since particles have different shapes which can also differ substantially
from spheres, it is seldom possible to characterize them by a real diameter.
Therefore equivalent diameters have been defined as the diameter of the sphere
that has the same value of a particular physical property as that of an irregular
particle [26]. This thesis will deal with the following equivalent diameters:
Aerodynamic diameter: defined as the diameter of a spherical particle
with a density of 1000 kg/m3 and the same settling velocity as the
considered particle [26,28]. This is one of the most used in aerosol science
as well as in this thesis.
Note that the settling velocity is the velocity a particle under gravitational
forces reaches when the latter forces are in equilibrium with the drag
forces. For further details on how to calculate the settling velocity,
appropriate literature is recommended [26,28].
Braking surface
Ventilation channels
Disc Bell
INTRODUCTION | 23
Mobility diameter: this is defined as the diameter of a spherical particle
that has the same mobility, defined as the particle velocity produced by a
unit external force, as the considered particle [26]. In this work, we
measure the electrical mobility, therefore motion of particles is induced
by an electrical force.
Optical diameter: this is the diameter of a spherical particle that has
similar optical properties to the considered particle; this is measured in
this thesis by an optical particle counter, therefore light scattering
detected by a photometer is considered [26,28].
Particles can be classified in different ways according to their diameter. The most
widespread method, generally used in regulations and guidelines, is to classify
particles by their aerodynamic diameter:
PM10: indicates all the particles with a diameter of less than 10 µm
PM2.5: indicates all the particles with a diameter of less than 2.5 µm
PM0.1: indicates all the particles with a diameter of less than 0.1 µm
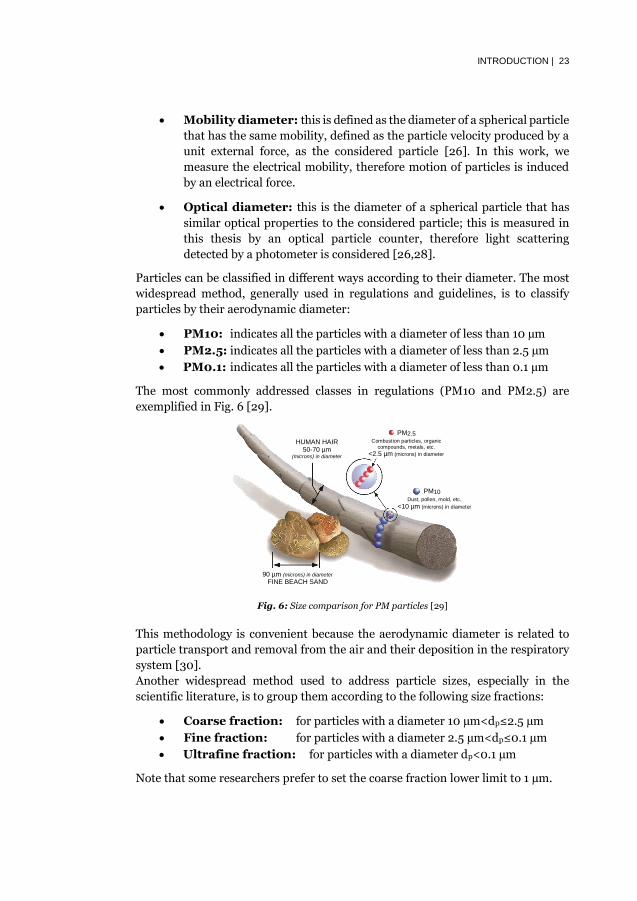
The most commonly addressed classes in regulations (PM10 and PM2.5) are
exemplified in Fig. 6 [29].
Fig. 6: Size comparison for PM particles [29]
This methodology is convenient because the aerodynamic diameter is related to
particle transport and removal from the air and their deposition in the respiratory
system [30].
Another widespread method used to address particle sizes, especially in the
scientific literature, is to group them according to the following size fractions:
Coarse fraction: for particles with a diameter 10 µm<dp≤2.5 µm
Fine fraction: for particles with a diameter 2.5 µm<dp≤0.1 µm
Ultrafine fraction: for particles with a diameter dp<0.1 µm
Note that some researchers prefer to set the coarse fraction lower limit to 1 µm.
90 µm (microns) in diameter
FINE BEACH SAND
PM2.5 Combustion particles, organic
compounds, metals, etc.
<2.5 µm (microns) in diameter
PM10 Dust, pollen, mold, etc.
<10 µm (microns) in diameter
HUMAN HAIR 50-70 µm
(microns) in diameter

24 | INTRODUCTION
1.3.2 Particle concentration and size distribution
When assessing airborne particulate matter, another important factor is the
particle concentration. Two standard methods are used to measure concentration:
by mass and by number.
Mass concentration is obtained by measuring the mass of the particulate matter in
a unit volume of aerosol. It is commonly expressed in g/m3, mg/m3, or µg/ m3 and
measured by weighing the samples collected on properly made filters using scales,
or by specially made instruments. Another possibility is to calculate it by estimating
or knowing the particle density.
Number concentration, on the other hand, is the number of particles per aerosol
unit, commonly expressed in #/cm3. It is generally measured by instruments that
can make use of electrical charges or optical features to detect particles and count
them.
When investigating poly-dispersed aerosols, particle size distribution is also a
parameter that should be taken into account. This represents the occurrence of a
specific aerosol property (number, mass, etc.) over the particle size range of interest
[28]. Since it is strongly dependent on the measurement instrument design, and
more specifically its resolution, a common practice is to normalize the investigated
parameter by each sub-size range. This allows size distributions obtained by
different instruments to be compared.
1.4 Challenges for brake emissions
A small part of the brake system community has been assessing brake emissions
for more than 20 years. Since, in the past, exhaust emissions were more important
than non-exhaust ones, there has been no attempts for examine the latter topic.
Indeed, an Environmental Protection Agency report [31] assessing brake wear
particulate matter emissions shows how little research has been performed on it.
One of the earliest works was done in 1983 by Cha et al. [32], who assessed asbestos
brake pads, nowadays forbidden by regulations. Following this, Garg et al. [33]
were the first to assess non-asbestos brake pads from the current market using an
inertia dyno bench. Over time, other studies [34,35] have helped to deepen
knowledge of the topic, due to an increasing interest in brake emissions. This is
especially due to the aforementioned improvements in exhaust emissions.
However, since there was no need for regulations, most of the scientific studies
consist of observational studies, focused on characterizing the typical size
distributions of particles in order to assess the harmfulness of different brake
system couples.
In addition, industry has always been more interested in brake contact phenomena
to reduce wear and better govern the friction coefficient than environmental
aspects. This led the scientific community to focus on how contact conditions
affected performances, starting to model the pad-to-rotor interface [36], and

INTRODUCTION | 25
introduce simulation routines to predict friction coefficient performances [37].
Nevertheless, some researchers have attempted to better explain phenomena
occurring on the pad-to-rotor interface by simulating the contact on a mesoscopic
scale [38]. However, the output is generally limited to the wear volume. How this
volume becomes airborne and to what extent is still unknown, and generally
addressed by the particle size distribution and that a fraction becomes airborne,
usually defined on laboratory tests [38].
To do so, a system simplification developed in pin-on-disc tribometers has been
extensively used in recent years [39,40]. This has helped to better and more easily
assess particle emissions from brake systems. However, most of the studies are still
focused on distribution characterization. In addition, few studies try to assess the
comparability between different test set-ups [41].
We can see that the field of brake emissions is rather new and unexplored. In
particular, while there is rather good knowledge concerning size distributions and
related health effects, not much is known about the basic relationships between
brake systems contact conditions and particle emissions. Moreover, while different
authors [33,35,42] make use of their available set-up, providing knowledge on
different scales, it is still not clear whether all the provided information can be
considered reliable or whether substantial differences occur.
When aiming to face future regulations, such knowledge is important, especially
since with regulations, it will be necessary to include environmental aspects directly
in the design phase of the brake system.

26 | INTRODUCTION
1.5 Objectives
With this background in mind, as well as the challenges the brake emission field
will have to face in the future, the present work aims to investigate the relationships
between brake wear particle emissions and the contact conditions on the pad-to-
rotor interface. Its intention is to lay the basis, on a model scale, for the introduction
of environmental aspects in the brake system design phase.
Since the pin-on-disc tribometer simplifies the real system, result validation is also
important when trying to understand to what extent acquired knowledge would be
meaningful for industrial applications. Therefore, this work also aims to validate
the obtained results by analysing and comparing different test set-ups: the pin-on-
disc tribometer representing a model scale; the inertia dyno bench representing the
component scale; and the real vehicle, representing the full scale.
To address these objectives, two research questions have been formulated as
following:
- How do airborne particle emissions respond to changes in contact
conditions on the pad to rotor interface?
- Can the model scale be representative of component and full scale?

METHODOLOGY | 27
Chapter 2
Methodology
As suggested in the previous chapter, even though the brake system has a unique
and very simple aim, along an apparently simple design, the phenomena that lead
to good performance are complex and involve different engineering aspects from
material science to thermal-fluid dynamics.
In addition, the main objective of this work, wear particle emissions, is an even less
known and more complex science, especially when it comes to measurements.
It is therefore important to set up a proper methodology (see Fig. 7), to investigate
this topic, which tries to reduce uncertainties as far as possible. A good way to
proceed is to develop a simplified model of the real system which can then be
validated. This by comparing particle and contact surface properties obtained
under similar working conditions for the model and the component scales. In
addition, brake parameters obtained on a full scale under urban driving conditions
are analysed, to understand which are the most significant contact conditions.
Fig. 7: Methodology overview

28 | METHODOLOGY
2.1 Car brake system parameters
The brake system as a whole has been described in Section 1.2. From its working
principle it is clear how important the sliding contact generated on the pad-to-rotor
interface is. The brake system behaviour is partially influenced by its design and
mostly by the driver's attitude.
The main parameters characterizing it are: nominal contact pressure, sliding speed
and friction coefficient.
Nominal contact pressure results from the will of the driver to stop in a defined
space or slow down the vehicle. Irrespective of the calliper and pad design, when
the driver presses the pedal, the pads are pressed on the sliding rotor. The
developed force per pad can be therefore calculated as:
4
2piston
pistonsfluidpad
dnpF
Eq.(1)
Where pfluid is the brake fluid pressure, npistons is the number of calliper pistons
acting on a single pad, and dpiston their diameter. This force, divided by the pad area
(Apad) provides the nominal contact pressure (p).
pad
pad
A
Fp Eq.(2)
This pressure is therefore the one generated on the sliding contact surface,
assuming perfectly smooth surfaces both on the pads and the rotor.
Another important parameter, once again imposed by the driver, is the sliding
speed (vsl) at the contact surface. This is directly related to the vehicle speed
(vvechicle) through the wheel. The sliding speed in this work is calculated at the
effective radius (Reff) of the rotor [43].
Since the rotor and the wheel rotate at the same angular speed (ω) it is possible to
write as follows:
eff
sl
R
v Eq.(3)
wheel
vehicle
R
v Eq.(4)
where Rwheel is the wheel radius. Combining eq.(3) and eq.(4) the vehicle speed
can be related directly to the sliding speed, as in eq. (5):
vehiclewheel
effsl v
R
Rv Eq.(5)
METHODOLOGY | 29
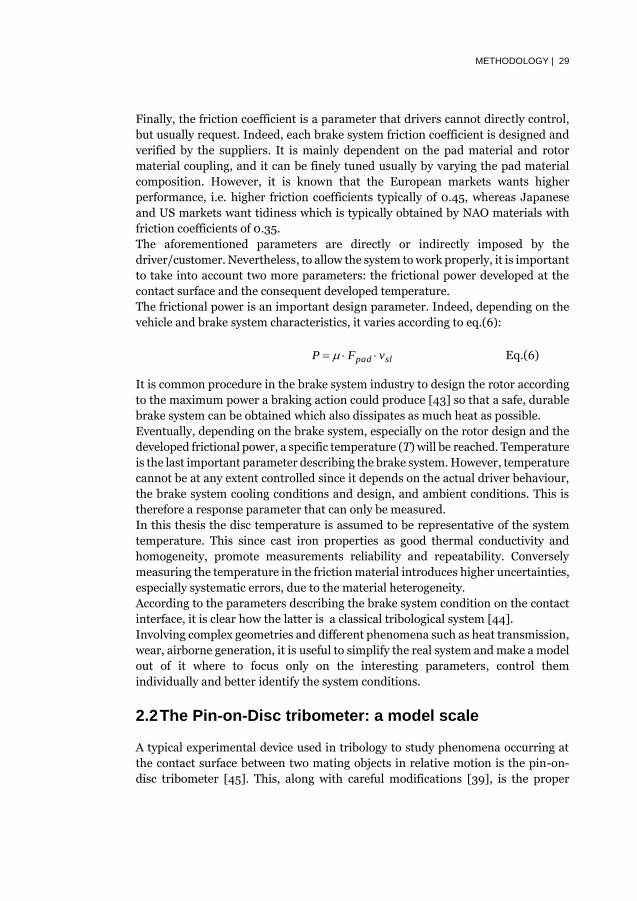
Finally, the friction coefficient is a parameter that drivers cannot directly control,
but usually request. Indeed, each brake system friction coefficient is designed and
verified by the suppliers. It is mainly dependent on the pad material and rotor
material coupling, and it can be finely tuned usually by varying the pad material
composition. However, it is known that the European markets wants higher
performance, i.e. higher friction coefficients typically of 0.45, whereas Japanese
and US markets want tidiness which is typically obtained by NAO materials with
friction coefficients of 0.35.
The aforementioned parameters are directly or indirectly imposed by the
driver/customer. Nevertheless, to allow the system to work properly, it is important
to take into account two more parameters: the frictional power developed at the
contact surface and the consequent developed temperature.
The frictional power is an important design parameter. Indeed, depending on the
vehicle and brake system characteristics, it varies according to eq.(6):
slpad vFP Eq.(6)
It is common procedure in the brake system industry to design the rotor according
to the maximum power a braking action could produce [43] so that a safe, durable
brake system can be obtained which also dissipates as much heat as possible.
Eventually, depending on the brake system, especially on the rotor design and the
developed frictional power, a specific temperature (T) will be reached. Temperature
is the last important parameter describing the brake system. However, temperature
cannot be at any extent controlled since it depends on the actual driver behaviour,
the brake system cooling conditions and design, and ambient conditions. This is
therefore a response parameter that can only be measured.
In this thesis the disc temperature is assumed to be representative of the system
temperature. This since cast iron properties as good thermal conductivity and
homogeneity, promote measurements reliability and repeatability. Conversely
measuring the temperature in the friction material introduces higher uncertainties,
especially systematic errors, due to the material heterogeneity.
According to the parameters describing the brake system condition on the contact
interface, it is clear how the latter is a classical tribological system [44].
Involving complex geometries and different phenomena such as heat transmission,
wear, airborne generation, it is useful to simplify the real system and make a model
out of it where to focus only on the interesting parameters, control them
individually and better identify the system conditions.
2.2 The Pin-on-Disc tribometer: a model scale
A typical experimental device used in tribology to study phenomena occurring at
the contact surface between two mating objects in relative motion is the pin-on-
disc tribometer [45]. This, along with careful modifications [39], is the proper

30 | METHODOLOGY
device to correlate the system conditions occurring on a modelled pad-to-rotor
interface with the generated airborne wear particles.
2.2.1 Experimental set-up
Most of this thesis was performed using a pin-on-disc tribometer with a horizontal rotating disc and a dead weight loaded pin. Fig. 8 shows a scheme of the experimental set-up used.
Fig. 8: Pin-on-disc tribometer scheme[39]. (A) Room air; (B) Fan; (C) HEPA filter; (D) Flexible tube; (E) Clean air inlet;(F) closed box; (G) Pin-on-disc machine; (H) sampled air volume; (I) Rotating disc sample; (J) Air outlet/sampling point;(K) Pin sample; (L) Dead weight; (M) Rotating base
Ambient air (A), is forced by a pump (B), set to a flow-rate of 7.7 m3/h, through a
HEPA filter (C). The latter removes particles with a collection efficiency of 99.95%,
at the Maximum Penetrating Particle Size (Class H13 according to standard EN
1822). The now clean air enters the sealed test chamber (F) through the inlet (E).
Here, the air-flow is continuously controlled by a hot-wire anemometer. The pin-
on-disc tribometer lies inside the chamber. The approximate volumes are 0.035 m3
and 0.135 m3 respectively for the pin-on-disc and the chamber, giving an air-
volume exchange rate of about 77 exchanges/h.
A thermal insulating ROBURIT® back-plate is fixed on the rotating base (M) and
the disc sample (I) is screwed on top of that. The latter can rotate up to 3000 rpm
thanks to a synchronous servo motor. Conversely, the pin (K) is mounted in a
stationary pin-holder that is fixed on an arm (G) at the end of which a dead weight
(L) is positioned. The ratio between the arm hinge, the pin position, and the dead-
weight is fixed, intensifies the normal force by 2.1 times (e.g. a normal force of 30N
at the tip of the arm provides 63N on the pin). The tangential force, on the other
hand, is measured by a beam load cell with a nominal load of 100 N and a nominal
sensitivity of 2 mV/V.
When the system is loaded and the disc is rotating, the generated airborne fraction
is well mixed to the clean air volume (H). This is because of the complicated internal
geometries. The air flux finally passes through the chamber outlet (J) where it is
sampled by the particle instruments (see Section 2.4).

METHODOLOGY | 31
Temperatures from the disc and the pin were sampled using k-type thermocouples,
positioned 3 mm from the contact surface in both specimens. In addition, a
thermocouple was also placed at 6 mm from the pin surface in order to better
understand the thermal gradient in the pin material. All the thermocouples were
located at the mean point of the contact area, i.e. on the pin diameter as well as 25
mm from the disc centre.
2.2.2 Specimens and materials
In order to be as close as possible to the real system, pins and discs used in this
work were directly machined from real pads and rotors. This was done according
to the same guidelines as in Fig. 9-10, for the pins and the discs respectively.
Fig. 9: Machining guidelines for the reference system pad (left) and for pin design (right)
The pins were cylindrical in shape with a 10 mm diameter. Their height was equal
to 14 mm, including the friction material, under-layer and back-plate. The shim was
removed due to difficulties in the machining process. Two 1.3 mm holes were
drilled in order to allow temperature measurements 3 mm and 6 mm away from
the surface, along the pin diameter.
The chemical composition of the pins varied according to the tested material. Up
to six different mixtures were tested, including both Low-steel materials and very-
low-steel/NAO. Such materials were code-named Mx, where M stands for material
and x is a progressive number from 1 to 6, given by the testing order. However, M1
is the most used in this work whereas M3 is the material belonging to the reference
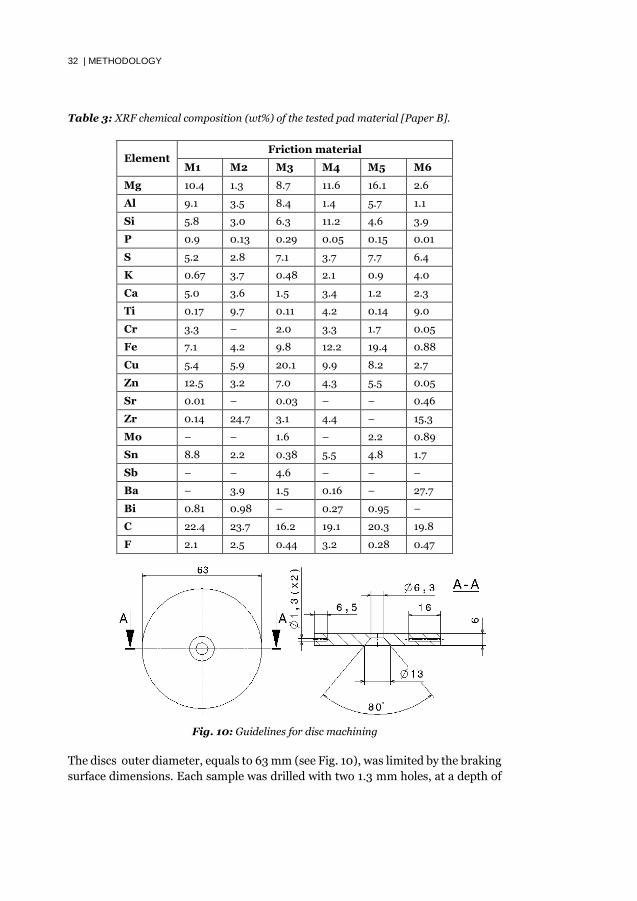
vehicle. Table 3 shows the X-Ray Fluorescence (XRF) analysis for all the pad
compositions [Paper B].
32 | METHODOLOGY
Table 3: XRF chemical composition (wt%) of the tested pad material [Paper B].
Element Friction material
M1 M2 M3 M4 M5 M6
Mg 10.4 1.3 8.7 11.6 16.1 2.6
Al 9.1 3.5 8.4 1.4 5.7 1.1
Si 5.8 3.0 6.3 11.2 4.6 3.9
P 0.9 0.13 0.29 0.05 0.15 0.01
S 5.2 2.8 7.1 3.7 7.7 6.4
K 0.67 3.7 0.48 2.1 0.9 4.0
Ca 5.0 3.6 1.5 3.4 1.2 2.3
Ti 0.17 9.7 0.11 4.2 0.14 9.0
Cr 3.3 – 2.0 3.3 1.7 0.05
Fe 7.1 4.2 9.8 12.2 19.4 0.88
Cu 5.4 5.9 20.1 9.9 8.2 2.7
Zn 12.5 3.2 7.0 4.3 5.5 0.05
Sr 0.01 – 0.03 – – 0.46
Zr 0.14 24.7 3.1 4.4 – 15.3
Mo – – 1.6 – 2.2 0.89
Sn 8.8 2.2 0.38 5.5 4.8 1.7
Sb – – 4.6 – – –
Ba – 3.9 1.5 0.16 – 27.7
Bi 0.81 0.98 – 0.27 0.95 –
C 22.4 23.7 16.2 19.1 20.3 19.8
F 2.1 2.5 0.44 3.2 0.28 0.47
Fig. 10: Guidelines for disc machining
The discs outer diameter, equals to 63 mm (see Fig. 10), was limited by the braking
surface dimensions. Each sample was drilled with two 1.3 mm holes, at a depth of

METHODOLOGY | 33
3 mm below the contact surface. One of those was 6.5 mm deep in the radial
direction from the outer disc diameter. This measure point corresponded to the
mean radius at the sliding contact, i.e. 25 mm from the disc centre. The second hole
was drilled 16 mm in the radial direction from the outer disc diameter, therefore
out of the contact area. The aim of this second hole was to measure the temperature
gradient. However, due to equipment limitations, this second measurement point
was never used.
All the tested disc samples had the same chemical composition, shown by the XRF
analysis in Table 4.
Table 4: XRF chemical composition (wt%) of the disc sample [Paper D]
C Si Mn P S Cu Cr Fe 3.40 1.70 0.57 0.03 0.26 0.24 0.20 93.6
2.3 Results validation: component and full scale
In order to address to what extent results obtained on a model scale can be
significant for the real brake system, they need to be properly validated. To do this,
an inertia dynamic bench, typically used for industrial applications, was designed
for particle measurement [46], as shown in Fig. 11.
Moreover, to analyse which brake system conditions are significant for real urban
driving conditions, a full vehicle was set up to measure the different brake system
parameters.
2.3.1 Component scale experimental set-up
Fig. 11: Schematic diagram of the modified inertia dynamic bench [46]
OR
B-1
BB
T O1 V
A C
F
SO B-2
E
Cy

34 | METHODOLOGY
Similarly to the pin-on disc set-up, ambient air taken from the outdoor room (OR)
is filtered through a HEPA filter (F) with 99.95% efficiency (Class H13). The now
clean air enters the chamber (C), having a volume of 0.817 m3, through the inlet
(A). The flow rate at the inlet can be adjusted between 500 m3/h to 2500 m3/h by
software to obtained a desired exchange rate in the box, i.e. different dilution
factors. Inside the chamber lies the reference brake system, as defined in Section
1.2, consisting of a cast iron rotor, a four piston monolithic calliper and two pads
with a surface area of 77 cm2. Additional information on the reference system can
be found in Table 5 [Paper E]. The produced airborne wear particles are well mixed
with the incoming air flow, thanks to the complex internal geometry. The obtained
aerosol is then forced to leave the system through two different outlets positioned
at the top of the chamber. The bigger outlet (O1) section can be tuned using a
shutter device. This is to regulate the air flow passing through the smaller outlet
(SO). Indeed, only the aerosol from SO is sampled. This pass by a circular straight
section (T) before encountering a 180°C bend (B-1). Finally, a straight section (A),
starting with a venturi tube (V), in order to regulate the flow speed, ensure the right
conditions for isokinetic sampling: a sample speed equal to the sampling speed and
a well-developed speed profile [26]. Before being sampled, the aerosol is forced
through a cyclone (Cy) in order to remove particles that are bigger than 10 µm. This
is then connected to the particles instrument (E) by a 90°C bended tube (B-2). The
full system in embedded in a safety chamber (BB).
Since the inertia dynamic bench is industrial equipment, its functioning principles
are designed by the suppliers. More specifically, the test rig requires the vehicle
speed, before and after the braking action, the initial braking temperature and the
deceleration as input parameters. As output, it provides the measured speed, fluid
pressure, and friction coefficient. The latter derives from torque measurements,
combined with the fluid pressure (i.e. tangential and normal force acting on the
braking surface). Temperature is measured as well by adding k-type
thermocouples. Although pad temperatures are measured using standard
thermocouples, embedded 3 mm from the braking surface, to improve
comparability with the pin-on-disc tribometer, the rotor temperature is measured
using copper nuts. These are copper cylinders, with a thin hole in the middle where
the two thermocouple wires are placed. When the copper nut is pushed into a hole
in the braking surface, smaller than the nut dimension, the hole is closed and the
thermocouple joint is formed. All the parameters were measured with a sampling
frequency of 50 Hz, as standard for rig applications.
2.3.2 Full scale experimental set-up
The reference vehicle was selected according to specifications related to a typical
medium size European passenger car [47] and availability. Specifically, an Alfa
Romeo 159, 1.9 JTDM, with a 1910 m3 gasoline engine, was selected.

METHODOLOGY | 35
Table 5 shows the essential design parameters for the vehicle and the related brake
system [Paper E].
Table 5: Alfa Romeo 159, 1.9 JTDm - vehicle and brake system parameters
The front left wheel corner was equipped with four k-type thermocouples: two
copper nuts sunk into both rotor braking surfaces, and two standard
thermocouples embedded in each pad 3 mm from the braking surface. In addition,
the brake fluid pressure was measured.
The vehicle speed was registered by means of a rotating encoder, positioned on the
right rear wheel, and a GPS which also provided the vehicle coordinates.
The sampling rate was set at 5 Hz during normal driving conditions and increased
to 10 Hz, during the braking actions. A fluid pressure value of 3 bar constituted a
trigger for sampling rate switch.
This set-up did not include particle measurements due to the difficulties in avoiding
and distinguishing emission sources that are not the brake system [Paper G].
2.4 Particle measurement
Particle measurement can be performed by means of different instruments, each
making use of a specific working principle depending on the equivalent diameter of
interest. In this thesis, the following particle instruments were used:
Electrical Low Pressure Impactor (Dekati ELPI+) [48,49]: this
measures real-time particle distribution and concentration according to
aerodynamic diameter. This is in the size range of 6 nm – 10 μm with up
to 10 Hz sampling rate on 14 size fractions. Particles are first charged to a
known charge level in a corona charger. Particles are then classified in a
low-pressure cascade impactor according to their inertial forces. The
particles collected in a specific impactor stage produce an electrical
current, recorded by the respective electrometer channel which is
General vehicle parameters – only driver Total weight [kg] 1702 Front axle [kg] 1068 Rear axle [kg] 634 Centre of gravity height [mm] 520 Wheelbase [mm] 2675 Max speed [Km/h] 226 Wheel radius [mm] 295 Rotor parameters – front axle Rotor external diameter [mm] 330 Rotor internal diameter [mm] 208 Effective radius [mm] 134.5 Pad parameters Area [cm2] 77

36 | METHODOLOGY
proportional to the number concentration. The 13 impactor stages
operating in the 17 nm- 10 µm range collect the samples on filters so that
chemical analysis can subsequently be performed. The final stage, in the
6nm – 17nm range, is a back-up filter stage.
Optical Particle Sizer (TSI OPS): this measures particle concentration
and their size distribution in the range 0,3 µm - 10 µm, divided into 16
channels, according to their optical diameter. The optical particles sizer
uses optics with 120° light collection, with a single count technology. A
sheath flow surrounds the aerosol inlet, focusing the latter to enhance size
resolution. The aerosol crosses a laser beam, creating a light pulse. The
intensity of the flash is used to count and size the particles.
Fast Mobility Particle Sizer spectrometer (TSI FMPS) : this
measures particles in the range from 5.6 to 560 nm, with 32 channels of
resolution, according to their mobility diameter. Particles are positively
charged using a corona charger and transported down a high voltage
electrode column via a HEPA-filtered air sheet. The electric field created
repels particles according to their electrical mobility. Multiple, low-noise
electrometers detect particles when stroked.
Results are mainly presented in terms of aerodynamic diameter, by means of the
Dekati ELPI+. However Paper B makes use of the TSI FMPS and OPS because of
the higher resolution provided by the aforementioned instrument which best fitted
the aim of the paper. Nevertheless, it should be mentioned that during the entire
PoD experimental work, TSI FMPS and OPS were used as control instruments. This
is to verify the reliability of the observed phenomena. Indeed, similar size
distributions and total concentration were given by the different instruments
according to their working size range.

SUMMARY OF THE APPENDED PAPERS | 37
Chapter 3
Summary of the appended papers
Paper A: A Study on the load level influence on particulate matter emissions from
the sliding contact between a low steel friction material and cast iron
The aim of this paper is to investigate how different nominal contact pressures, i.e.
load levels affect emissions from a low-steel pad material (M1) sliding against a cast
iron disc in terms of particle number concentration and size distribution, and their
relation with the system temperature.
Tests were conducted in a pin-on-disc machine specially designed for airborne
particulate research. A clean chamber technique was used to ensure that measured
airborne particulates were only generated by the sliding contact. A thermal
insulating plate, placed between the disc and the rotating base allowed the system
to reach up to 350°C with only frictional heating. A constant sliding speed of 1.3
m/s and a time length of 3 hours were imposed, ensuring the same sliding distance
for all tests. The time was chosen to ensure a long steady state regime. The applied
loads varied from 1 kg to 7 kg, resulting in an average contact pressure range of 0.29
MPa - 1.95 MPa. The number concentration and the size distribution were
measured using an Electrical Low Pressure Impactor (Dekati ®ELPI+).
Results show a clear emission dependence on the nominal contact pressure.
Specifically, low pressures up to 0.83 MPa generate low and stable emissions,
clearly involving ultrafine, fine and coarse particles; Pressures of between 0.97 MPa
and 1.11 MPa show transient behaviour, with unstable emissions and a distribution
shift towards ultrafine particles; high pressures of over 1.39 MPa produce a
significant emission increase, showing a strong predominance of the ultrafine
fraction. It is argued that a temperature threshold responsible for a change in
particle emissions can be identified. Above this temperature, corresponding to
approximately 200°C in the disc, a sharp increase in the total number
concentration can be detected.
Paper B: A study on emissions of airborne wear particles from car brake friction
pairs
The main objective of this paper is to understand how emissions from different pad
materials can be influenced by nominal contact pressure variation and identify
38 | SUMMARY OF THE APPENDED PAPERS
possible differences between them. It extends the studies in paper A and tries to
confirm or discredit its results.
The emission of airborne wear particles from friction material / cast iron pairs used
in car brakes was investigated, paying special attention to the influence of
temperature. Five low-metallic materials and one non-asbestos organic material
were tested using a pin-on-disc machine. The latter was placed in a sealed chamber
to allow airborne particle collection. The concentration and size distribution were
obtained by a fast mobility particle sizer (FMPS) and an optical particle sizer (OPS).
The experiments show that as the temperature increases from 100 to 300 °C, the
emission of ultrafine particles intensifies while that of coarse particles decreases. A
critical temperature at which the ultrafine particle emission rate rises stepwise by
4 to 6 magnitude orders was identified. It is argued that for the investigated
frictional pairs, the critical temperature was found to be between 165 and 190 °C.
Below the critical temperature, fine particles outnumber coarse and ultrafine
particles, although coarse particles make up the bulk of the particulate matter mass.
The friction pairs differ in the ultrafine particle emission rate by 1 to 2 orders of
magnitude. Above the critical temperature, ultrafine particles constitute almost
100% of the total particle number and their relative mass contribution can exceed
50%.
Paper C: Dry sliding of a low steel friction material against cast iron at different
loads: characterization of the friction layer and wear debris
This paper investigate particles chemical composition, morphology and wear
mechanisms induced by different nominal contact pressures.
Pin-on-disc testing was used to investigate the sliding behaviour and the wear
products of a low steel friction material (M1) against a cast iron disc at different
applied loads. The test stand was placed in a clean chamber with a purified
incoming air flux. The outgoing flux carries wear particles to a Dekati ELPI+
impactor that counts, sorts and collect them by their aerodynamic diameter.
Results show that as the nominal contact pressure rose, the coverage of both pin
and disc surfaces by the friction layer was seen to increase. The relevant X-Ray
diffraction patterns revealed the presence of a large amount of graphite and
different compounds originating from the friction material and from the disc,
mainly iron oxides. After the test at the lowest load, the disc worn surface exhibited
abrasive grooves and a friction layer mainly made of compacted iron oxide
particles. At the highest load (above the transition temperature), the disc surface is
covered by a compact friction layer. As concerns the friction layer on the pins, most
of the ingredients from the friction material were detected, in association with the
iron oxides from the disc. The characterization of the collected airborne wear debris
showed that the smallest particles (below 1 µm) are equi-axed whereas the coarser
ones would mostly display a plate-like morphology. The mechanisms of their
formation and relevance to wear behaviour are discussed.

SUMMARY OF THE APPENDED PAPERS | 39
Paper D: On the influence of car brake system parameters on particulate matter
emissions
The main objective of the paper is to enhance previous knowledge, extending the
emissions for different brake system contact conditions and mapping them. This
includes main parameters as well as design and derivative parameters.
The influence of car brake system parameters on particulate matter emissions was
investigated using a pin-on-disc tribometer. Samples from a low-steel friction
material (M1) and a cast iron disc were tested considering different sliding
velocities from 0.66 m/s to 7.68 m/s, nominal contact pressures from 0.55 MPa to
1.67 MPa, and frictional powers from 28 W to 87 W. Disc temperatures were also
measured. Their impact on total concentration, size distribution, particle
coefficient and transition temperature was analysed. Results show that frictional
power is the most significant brake system parameter. However, temperature, as a
response parameter, is the most influential, inducing a shift towards the ultrafine
particulate fraction and raising emissions. A transition temperature, independent
of the system conditions, was identified.
Paper E: On the scaling effect of measuring disc brake airborne particulate
matter emissions – a comparison of a pin-on-disc tribometer and an inertia
dynamometer bench under dragging conditions
The aim of this paper is to investigate how the transition temperature, now
identified as the most influencing parameter for emissions, is affected by the
different test scales. New and used low-steel pins/pads (M1) were tested against
cast iron discs/rotors on both a pin-on-disc tribometer and an inertia dyno-bench.
The latter was used under dragging conditions to simulate the PoD working
conditions. A constant nominal contact pressure and rotational velocity were
imposed in both test stands. Results show that a transition temperature can always
be identified. However, it is influenced by the test scale and the frictional pair
status. It is argued that emissions are assessed in a similar way by the two set-ups
when an equivalent frictional pair status is analysed (e.g. run-in). Further
investigations for fully run-in samples on the pin-on-disc should be performed in
order to confirm the possibility of using the tribometers for the initial assessment
of different friction materials.
Paper F: Could pin-on-disc tribometers be used to study the friction/wear
performance of disc brake materials?
The aim of this paper is to investigate and discuss whether a simplified set-up could
reproduce the friction and wear behaviour of the disc brake assembly by comparing
the friction surfaces with diverse microscopy techniques. Coefficients of friction,
wear, and collected airborne particles are also compared. Although the tests are
based on different testing procedures (tribometers - drag test and dyno-bench test–

40 | SUMMARY OF THE APPENDED PAPERS
single stop), the results show that tribometers provide information related to the
friction wear performance, the character of the friction surfaces and the character
of the wear particles which mirror the behaviour of the samples during dyno-bench
tests. In addition, the third body layers formed using the two different test stands
can be considered comparable, indicating similar wear mechanisms. This indicates
that PoD can also correctly evaluate the friction coefficient differences between
frictional couples. The PoD set-up can therefore be a useful tool for a preliminary
assessment of new friction materials.
Paper G: A test stand investigation on a real driving cycle emission factor for car
brakes
This paper focuses on understanding how real driving conditions can be
reproduced on an inertia dyno bench and on an analysis of brake parameters
obtained from a real vehicle, under urban driving conditions.
The reference vehicle was equipped in order to acquire and capture different brake
system parameters in an urban environment. A road test cycle was specifically
designed to simulate everyday usage of EU cars, by driving in the Bergamo city area.
Four different sections were set-up in order to “warm-up” the brake system, go
through “city traffic” for a first time, “cool down” the system, and conclude in “city
traffic” for a second time.
Obtained data were post-processed and simplified in order to develop a test cycle
suitable for an inertia dyno-bench and calculate the related emission factors.
Results indicate brake emission factors were equal to 0.056-0.061 g/km and 0.033-
0.049* 1011 #/km, and rotor temperatures never exceeded 180°C. This corresponds
to better emissions than a EURO6 engine in terms of particle number and
equivalent to a EURO2 in terms of mass. It is argued that a real driving cycle can
be reproduced in a dedicated laboratory test stand by assessing the corresponding
brake emission factors.

DISCUSSION AND FUTURE WORK | 41
Chapter 4
Discussion and future work
The results provided in this thesis represent a first attempt to explain the relations
between brake system contact conditions, as a combination of parameters, and
airborne particle emissions. Few studies [42] have investigated this topic before,
but different studies [33,35], which have focused on the characterization of
emissions, provide some interesting hypotheses with regard to related observed
phenomena.
Since the car disc brake is a complex system, most of the presented research was
performed using an appositely designed pin-on-disc tribometer. This allowed us to
simplify the geometries and control relevant parameters more easily. In addition,
the adopted approach, i.e. investigating the influence of single parameters [Paper
A, Paper B] before studying their combination [Paper D], or system conditions,
provided a structured method to better tune the ongoing research. Simplifying the
system, however, introduces important limitations. Indeed, the analysed
conditions are restricted by the test stand working range, i.e. maximum applicable
load, rotational speeds and temperatures. In addition, the obtained results need to
be validated in order to understand the level of representativeness for real systems
[Paper E, Paper F, Paper G].
The brake system contact conditions are the results of different influencing factors.
Indeed, three actors that play a major role can be identified: the designer - who has
to satisfy customer needs while avoiding failures and guaranteeing safety – can
establish the working ranges in terms of pressure, speed and frictional power,
define the friction coefficient of the system, and optimize the cooling conditions;
the driver – who has to safely slow down the vehicle or stop it according to his/her
will – influencing the market requirements, therefore the designer choices, and
governing the sliding speed and the nominal contact pressure; the ambient
conditions – unpredictable – which mainly influence the system cooling
conditions.
While the ambient cannot be modified and drivers can be barely influenced, most
of the responsibility for emissions reduction is in the designers' hands, influencing
the final outcome by system optimization.

42 | DISCUSSION AND FUTURE WORK
The considered parameters are classified in this thesis as: main parameters –
braking pressure, sliding speed, COF – independent of each other; derivative
parameters – frictional power – a combination of the previous ones; and response
parameters – temperature – which can be influenced but not controlled. Note that
in the real world, the brake system contact condition can only be described by main
and derivative parameters since temperature is usually unknown.
This study shows that each of the considered parameters has an individual effect
on emissions, but what truly affects them is the system temperature. In particular,
results shows that a transition temperature, defined as a threshold after which the
number concentration increases by several magnitude orders [Paper B] can be
identified irrespective of the system contact conditions or the choice of frictional
couple. Figure 12 shows the transition temperature effect considering most of the
performed tests from this thesis and presented in the collection of papers. An
emission increase of several magnitude orders in the range 170-200°C, for all the
investigated conditions can clearly be identified.
Fig. 12: Transition temperature for different testing conditions. Data collection from the investigated papers
This phenomena is in accordance with previous studies [33,35], performed on a
component scale using inertia dynamic benches, that observed a steep increase in
emissions for temperatures values in the range 300-400°C.
An additional consequence of the temperature increase, especially overtaking of the
transition temperature, is a progressive shift in the number size distribution
towards the ultrafine fraction. The latter is generally dominant for almost any
contact condition but, once the transition has been overcome, it constitutes almost
100% of the emitted particles [Paper B].

DISCUSSION AND FUTURE WORK | 43
Understanding why this shift in particle size and rise in total concentration occur
would be beneficial for emissions reduction. An interesting hypothesis, also
introduced in previous studies [35], is degradation of the phenolic resin [Paper C,
Paper D]. Indeed, its degradation temperature is in the range of 300-350°C [50], it
faces a rubbery state at 320°C [51], and shows a glass transition near 280°C [50].
The temperature measurements performed in this study are taken 3 mm below the
contact surface, using the disc as a reference because it has better thermal
conductivity than the pad material. Therefore, the phenolic resin degradation
temperatures can be easily reached at the contact area, if not locally overcome [52],
affecting the organic binder which consequently releases particles in the air.
It can be argued that a first important step for emission reduction is to keep the
system temperature as low as possible. However, this is not a controllable
parameter since the ambient temperature and the driving style [Paper G] are the
two main influencing factors. Nevertheless, some expedients to influence the
system temperature can be adopted.
Results show that the higher the brake power is, the higher the emissions are.
Nominal contact pressure, sliding speed and COF do not play a major role when
considered alone, but it is when they are combined, giving the developed frictional
power, that counts [Paper D].
Reducing the COF would not provide any advantage since the driver will increase
the nominal contact pressure in order to provide the same braking power, aiming
to brake in a given stopping distance. In addition, a braking style cannot be imposed
on a driver whereas it could be suggested by smart devices adopted on-board.
According to what has been argued, two solutions can therefore be recommended:
improve the system cooling conditions, and/or work on possible alternative binders
if the phenolic resin role is confirmed.
While the latter needs additional investigation to be taken into account, the former
can be adopted with the aid of simulation routines.
Indeed, making use of the proposed specific particle coefficient maps, the brake
system design phases could embrace a new step towards environmental
evaluations. Starting from structural simulations, a thermal model can be run
afterwards, obtaining necessary inputs to enter the maps with the system working
conditions and the temperature. This would then provide a corresponding outcome
in terms of particle emissions and size distribution which can be used to compare
different designs.
Maps, such as the one proposed in this thesis [Paper D] would be easier to develop
on a model scale. This would save time and allow different frictional couples to be
quickly tested, whether they are in production or prototypes. However, this could
only be done if results on a model scale are representative of the real system.
Results show that the PoD and the dynamic bench provide comparable indications
in terms of emissions when similar working conditions and frictional couple status

44 | DISCUSSION AND FUTURE WORK
(run-in or new) are ensured [Paper E]. In addition, analogous assessment is
provided also in terms of friction coefficient, loss on thickness, surface phenomena,
and wear particles chemical composition [Paper F]. Even though further
investigations are needed, the PoD can be considered a reliable test stand for R&D
activities when providing a first assessment of different frictional pairs.
The presented study focuses on urban driving conditions; nevertheless, it can be
argued that the given results are generally valid since the transition can be
considered irrespective of the system conditions. However, the system conditions
determine whether this threshold can be reached or not on road [Paper G]. Indeed,
it has been demonstrated that under urban driving conditions, temperatures not
higher than 180°C are usually reached, with mean values in the range of 110-130°C.
This implies emission levels that are nowadays competitive in terms of particulate
number with respect to EURO6 engines, but comparable with EURO2 when
looking at mass emissions. Indeed particle mass emission factors were equal to
0.056-0.061 g/km, worse than the EURO3 limit of 0.05, thereby falling into the
EURO 2 classification. Conversely the particle number emission factors were
0.033-0.049* 1011 #/km, therefore a long way from the EURO6 limits of 6* 1011
#/km. Comparing the mass emission factor with other non-exhaust sources (see
Fig. 13), the relevant contribution of the brake system is clear. Indeed, literature
shows that under high speed conditions [53], i.e. the most emissive ones [54] for
road surface wear and resuspension due to turbulent air flow, the mass emission
factors are respectively 0.0039-0.0045 g/km and 0.009-0.01 g/km. Thanks to the
REBRAKE project technology [55], the car brake mass emission factor can be
reduced to 0.019 g/km, however, it is clear that additional effort is needed to at
least equal other non-exhaust emission sources.
Since urban driving conditions are the most interesting for legislation, but not the
only ones occurring in a vehicle's life-time, and particle emissions are a concrete
health-related issue, future works should focus on expanding and verifying the
present study for different frictional couples, investigating the role of phenolic resin
in emissions and improving the understanding of relations between the model scale
and the component scale.

DISCUSSION AND FUTURE WORK | 45
Fig. 13: Brake emissions for urban driving conditions (red dot) compared with Euro emission standard limits

46 | DISCUSSION AND FUTURE WORK

CONCLUSIONS | 47
Chapter 5
Conclusions
In this work, relations between the brake system contact conditions and particle
emissions have been investigated on a model scale, using a PoD tribometer. The
latter has been afterward compared with an inertia dynamic bench and real urban
driving conditions have been characterized to assess the representativeness of the
results.
The following research questions have been answered:
How do airborne particle emissions respond to changes in contact conditions on
the pad to rotor interface?
Emissions can vary according to the developed frictional power on the contact
surface and cooling conditions. In particular, higher frictional power – as a result
of the combination between nominal contact pressure, sliding speed and COF -
induce higher emissions. This is mainly due to a system temperature rise.
In addition, an increase in emissions of several magnitude orders, along with a shift
of the size distribution towards the ultrafine fraction, occurs when the system
temperature overcomes a threshold located in the range 180-200 °C.
This is similar for every tested pad composition and is independent of the contact
conditions. A hypothesis for this phenomena is the degradation of the phenolic
resin, a binder common to all the investigated pads.
Can the model scale be representative of component and full scale?
Results show that similar indications are provided by the PoD tribometer and the
dynamic bench test rig if similar working conditions and frictional couple status
are ensured. Both the set-ups show the existence of a transition temperature.
However, that has been demonstrate to variate depending on the system status
(run-in or not) only for inertia dyno bench tests.
In addition, information provided about the friction wear performance, the
character of the friction surfaces and the character of wear particles are similar
among the two test stands. Also the third body layers can be considered
comparable, indicating similar wear mechanisms.

48 | CONCLUSIONS
It can be concluded that the pin-on-disc tribometer can be used for preliminary
studies to assess different frictional couples, however additional studies are
recommended to identify the best methodology to be used in order to obtain
reliable measurements on a model scale.
When real urban driving conditions are assessed, it is possible to notice that the
transition temperature range is hardly reached, especially when used frictional
couples are used, showing a mean system temperature of around 110-130°C and a
maximum temperature of 180°C. It can be therefore concluded that on a full scale,
brake emissions will very seldom be significant in terms of number concentration.
Conversely they can significantly contribute in terms of mass.

REFERENCES | 49
References
[1] Ortiz EEAAG. Air quality in Europe — 2015 report. 2015. doi:10.2800/62459.
[2] Guerreiro C, Gonzalez Ortiz A, de Leeuw F, Viana M, Horalek J. Air quality in Europe — 2016 report. 2016. doi:10.2800/413142.
[3] The Economic Consequences of Outdoor Air Pollution. Paris: 2016. doi:http://dx.doi.org/10.1787/9789264257474-en.
[4] Directives, Ambient air quality EU n.d. http://ec.europa.eu/environment/air/legis.htm.
[5] Lodgejr J. Air quality guidelines. Global update 2005. Particulate matter, ozone, nitrogen dioxide and sulfur dioxide. Environ Sci Pollut Res 1996;3:23–23. doi:10.1007/BF02986808.
[6] Burden of disease from Ambient Air Pollution for 2012. 2014.
[7] European Environment Agency. Environment and human health. vol. EU 25933. 2013. doi:10.2800/9092.
[8] Pope CA, Burnett RT, Thun MJ, Calle EE, Krewski D, Ito K, et al. Lung cancer, cardiopulmonary mortality, and long-term exposure to fine particulate air pollution. J Am Med Assoc 2002;287:1132–41. doi:10.1016/j.scitotenv.2011.03.017.
[9] Pope III CA, Dockery DD. Health Effects of Fine Particulate Air Pollution: Lines that Connect. J Air Waste Manage Assoc 2006;56:709–42. doi:10.1080/10473289.2006.10464485.
[10] Gasser M, Riediker M, Mueller L, Perrenoud A, Blank F, Gehr P, et al. Toxic effects of brake wear particles on epithelial lung cells in vitro. Part Fibre Toxicol 2009;6:30. doi:10.1186/1743-8977-6-30.
[11] Lighty JS, Veranth JM, Sarofim a F. Combustion aerosols: factors governing their size and composition and implications to human health. J Air Waste Manag Assoc 2000;50:1565-1618-1622. doi:10.1080/10473289.2000.10464197.
[12] Schwartz J, Laden F, Zanobetti A. The Concentration-Response Relation between PM2 . 5 and Daily Deaths. Environ Health Perspect 2002;110:1025–9.
[13] Loomis D, Grosse Y, Lauby-Secretan B, Ghissassi F El, Bouvard V, Benbrahim-Tallaa L, et al. The carcinogenicity of outdoor air pollution. Lancet Oncol 2013;14:1262–3. doi:10.1016/S1470-2045(13)70487-X.
[14] Orru H, Maasikmets M, Lai T, Tamm T, Kaasik M, Kimmel V, et al. Health impacts of particulate matter in five major Estonian towns: Main sources of exposure and local differences. Air Qual Atmos Heal 2011;4:247–58. doi:10.1007/s11869-010-0075-6.

50 | REFERENCES
[15] COMM. Commission staff working paper - annex to: THe communication on Thematic Strategy on Air Pollution and The Directive on “Ambient Air Quality and Cleaner Air for Europe.” Assessment 2005.
[16] Pant P, Harrison RM. Estimation of the contribution of road traffic emissions to particulate matter concentrations from field measurements: A review. Atmos Environ 2013;77:78–97. doi:10.1016/j.atmosenv.2013.04.028 Review.
[17] Suleiman A, Tight MR, Quinn AD. Assessment and prediction of the impact of road transport on ambient concentrations of particulate matter PM10. Transp Res Part D Transp Environ 2016;49:301–12. doi:10.1016/j.trd.2016.10.010.
[18] European Commission. COMMISSION REGULATION (EU) No 459/2012 of 29 May 2012. 2012.
[19] Grigoratos T, Martini G. Brake wear particle emissions: a review. Environ Sci Pollut Res 2015;22:2491–504. doi:10.1007/s11356-014-3696-8.
[20] Dahl A, Gharibi A, Swietlicki E, Gudmundsson A, Bohgard M, Ljungman A, et al. Traffic-generated emissions of ultrafine particles from pavement-tire interface. Atmos Environ 2006;40:1314–23. doi:10.1016/j.atmosenv.2005.10.029.
[21] Kumar P, Pirjola L, Ketzel M, Harrison RM. Nanoparticle emissions from 11 non-vehicle exhaust sources - A review. Atmos Environ 2013;67:252–77. doi:10.1016/j.atmosenv.2012.11.011.
[22] Rexeis M, Hausberger S. Trend of vehicle emission levels until 2020 - Prognosis based on current vehicle measurements and future emission legislation. Atmos Environ 2009;43:4689–98. doi:10.1016/j.atmosenv.2008.09.034.
[23] Pompon J-P. The brake disc handbook. 2nd ed. Brembo S.p.A.; 1998.
[24] Day Andrews. Braking of Raod Vehicles. 1st ed. Butterworth-Heinemann; 2014.
[25] ASM Metals Handbook, Volume 1. 10th ed. ASM International; 2010.
[26] Hinds WC. Aerosol Technology: properties,behavior, and measurement of airborne particles. 2nd ed. Wiley-Interscience; 1999.
[27] Eea. Air quality in Europe — 2013 report. 2013. doi:10.2800/92843.
[28] Kulkarni P, Willeke K, editors. AEROSOL MEASUREMENT: Principle, Techniques, and Applications. 3rd ed. Wiley; 2011.
[29] EPA. Environmental Protection Agency 2010. https://www.epa.gov/sites/production/files/2016-09/pm2.5_scale_graphic-color_2.jpg.
[30] WHO. Health Aspects of Air Pollution with Particulate Matter , Ozone and Nitrogen Dioxide. 2003. doi:10.2105/AJPH.48.7.913.

REFERENCES | 51
[31] US EPA. Brake and Tire Wear Emissions from On - road Vehicles in MOVES2014. 2014.
[32] Cha S, Carter P, Bradow RL. Simulation of Automobile Brake Wear Dynamics and Estimation of Emissions. SAE Tech. Pap., 1983. doi:10.4271/831036.
[33] Garg B, Cadle S, Mulawa P, Groblicki P, Laroo C, Parr G. Brake wear particulate matter emissions, Environ. Sci Technol 2000;34:4463–9.
[34] Sanders PG, Xu N, Dalka TM, Maricq MM. Airborne brake wear debris: Size distributions, composition, and a comparison of dynamometer and vehicle tests. Environ Sci Technol 2003;37:4060–9. doi:10.1021/es034145s.
[35] Kukutschová J, Moravec P, Tomášek V, Matějka V, Smolík J, Schwarz J, et al. On airborne nano/micro-sized wear particles released from low-metallic automotive brakes. Environ Pollut 2011;159:998–1006. doi:10.1016/j.envpol.2010.11.036.
[36] Eriksson M, Jacobson S. Tribological surfaces of organic brake pads. Tribol Int 2000;33:817–27. doi:10.1016/S0301-679X(00)00127-4.
[37] Österle W, Dmitriev AI. Functionality of conventional brake friction materials - Perceptions from findings observed at different length scales. Wear 2011;271:2198–207. doi:10.1016/j.wear.2010.11.035.
[38] Wahlström J, Söderberg A, Olofsson U. A cellular automaton approach to numerically simulate the contact situation in disc brakes. Tribol Lett 2011;42:253–62. doi:10.1007/s11249-011-9772-z.
[39] Olofsson U, Olander L, Jansson A. A Study of Airborne Wear Particles Generated From a Sliding Contact. J Tribol 2009;131:44503. doi:10.1115/1.3176990.
[40] Wahlström J, Olofsson U, Jansson A, Olander L. Airborne Wear Particles Emissions from Commercial Disc Brake Materials – Passenger Car Field Test. 2008.
[41] Wahlström J, Olofsson U. A field study of airborne particle emissions from automotive disc brakes. Proc Inst Mech Eng Part D J Automob Eng 2014;229:954407014550053. doi:10.1177/0954407014550053.
[42] Wahlström J, Olander L, Olofsson U. A pin-on-disc study focusing on how different load levels affect the concentration and size distribution of airborne wear particles from the disc brake materials. Tribol Lett 2012;46:195–204. doi:10.1007/s11249-012-9944-5.
[43] Day A. Braking of Road Vehicles. n.d. doi:10.1002/9780470685815.fmatter.
[44] Stachowiak GW, Batchelor AW. Engineering Tribology. 2006. doi:10.1016/B978-075067836-0/50018-3.
[45] Straffelini G. Friction and Wear. 2015. doi:10.1007/978-3-319-05894-8.

52 | REFERENCES
[46] Perricone G, Wahlstro m J, Olofsson U. Towards a test stand for standardized measurements of the brake emissions. Proc Inst Mech Eng Part D J Automob Eng 2015. doi:10.1177/0954407015616025.
[47] Holmberg K, Andersson P, Erdemir A. Global energy consumption due to friction in passenger cars. Tribol Int 2012;47:221–34. doi:10.1016/j.triboint.2011.11.022.
[48] Marjamäki M, Keskinen J, Chen DR, Pui DYH. Performance evaluation of the electrical low-pressure impactor (ELPI). J Aerosol Sci 2000;31:249–61. doi:10.1016/S0021-8502(99)00052-X.
[49] Maricq MM, Xu N, Chase RE. Measuring Particulate Mass Emissions with the Electrical Low Pressure Impactor. Aerosol Sci Technol 2006;40:68–79. doi:10.1080/02786820500466591.
[50] Hong US, Jung SL, Cho KH, Cho MH, Kim SJ, Jang H. Wear mechanism of multiphase friction materials with different phenolic resin matrices. Wear 2009;266:739–44. doi:10.1016/j.wear.2008.08.008.
[51] Nam J, Seferis J, Yoon S. A viscoelastic study of glass transition and degradation process of phenolic resin/carbon fiber composite. Korean J Rheol 1999;11:9--17.
[52] Anderson AE, Knapp R. Hot Spotting in Automotive Friction Systems. Wear 1990;135:319–37.
[53] Lawrence S, Sokhi R, Ravindra K. Quantification of vehicle fleet PM10 particulate matter emission factors from exhaust and non-exhaust sources using tunnel measurement techniques. Environ Pollut 2016;210:419–28. doi:10.1016/j.envpol.2016.01.011.
[54] Mathissen M, Scheer V, Vogt R, Benter T. Investigation on the potential generation of ultrafine particles from the tire-road interface. Atmos Environ 2011;45:6172–9. doi:10.1016/j.atmosenv.2011.08.032.
[55] Perricone G, Olofsson U, Söderberg A, Wahlström J, Straffellini G, Gialanellla S. Reducing PM10 emissions from car brakes through materials optimization and design. Submitt to Wear 2016.