Embed Size (px)
Citation preview

Loughborough UniversityInstitutional Repository
Particle de-agglomerationwith an in-line rotor-statormixer at different solidsloadings and viscosities
This item was submitted to Loughborough University's Institutional Repositoryby the/an author.
Citation: OZCAN-TASKIN, N.G., 2017. Particle de-agglomeration with anin-line rotor-stator mixer at different solids loadings and viscosities. Presentedat the International Symposium on Mixing in Industrial Processes IX (ISMIP9),Birmingham, UK, 25th-28th June 2017.
Additional Information:
• These are conference presentation slides.
Metadata Record: https://dspace.lboro.ac.uk/2134/26072
Version: Accepted for publication
Publisher: c© BHR Group
Rights: This work is made available according to the conditions of the Cre-ative Commons Attribution-NonCommercial-NoDerivatives 4.0 International(CC BY-NC-ND 4.0) licence. Full details of this licence are available at:https://creativecommons.org/licenses/by-nc-nd/4.0/
Please cite the published version.

www.bhrgroup.com© BHR Group 2017
Gustavo A Padron and N. Gül Özcan-Taşkın*
*: Now at Loughborough University, Dept. of Chem. Eng
Particle De-agglomeration with an In-Line Rotor-Stator Mixer at Different Solids Loadings and Viscosities
ISMIP IX – 9th International Symposium on Mixing in Industrial Processes27th June 2017

© BHR Group 2017 Slide 2DOMINO
Introduction
➢ Rotor–stator mixers are used in the chemical, biochemical, agricultural, cosmetics, and food-processing industries and they are employed in many process operations, including homogenization, dispersion, emulsification and grinding, among others (Atiemo‐Obeng & Calabrese, 2004).
➢ Despite their widespread use, the understanding of the effect of process variables on the performance of rotor-stator mixers is still highly empirical.
➢ The work presented looks into the effect of two variables, namely the solids loading and the viscosity of the continuous phase, in a specific process, the deagglomeration of clusters of solid particles, using a fumed silica as a model solid.

© BHR Group 2017 Slide 3DOMINO
➢ Silverson 150/250MS In-line Rotor-Stator
➢ Dual Emulsor screen (EMSC)
► 7 rows of 1 mm diameter round holes (inner and outer screens)
➢ Rotor
► 4 inner blades
► 8 outer teeth
Rotor-Stator Geometry
EMSC Stator
Rotor
Silverson 150/250MS
© BHR Group 2017 Slide 4DOMINO
➢ All power input (P) is eventually dissipated as heat in the fluid
➢ Rig (tank, rotor-stator, lines, connections) insulated to minimise heat losses
➢ T=f(t) measured during R-S operation
➢
➢ Fluids:
► water
► 60%wt Aqueous glycerol solution
► 84%wt Aqueous glycerol solution
Calorimetry Technique
𝑃 = 𝑚𝐶𝑃∆𝑇
𝑡

© BHR Group 2017 Slide 5DOMINO
➢ For a given Fl, Po is constant over the whole Re range, i.e. the flow within the rotor-stator is turbulent.
Power Number vs Reynolds & Flow Number
𝑃𝑜 =𝑃
𝜌𝑁3𝐷5
= 𝑃𝑜1 + 𝑃𝑜2𝐹𝑙
𝑃 = 𝑃𝑜1𝜌𝑁3𝐷5
+𝑃𝑜2𝜌𝑁2𝐷2𝑄
Özcan-Taşkın et al. (2011):
Power number:
𝐹𝑙 =𝑄
𝑁𝐷3 𝑅𝑒 =𝜌𝑁𝐷2
𝜇
Po1 0.13
Po2 9.1

© BHR Group 2017 Slide 6DOMINO
Experimental Set Up – Break-Up Experiments
➢ Silverson 150/250MS rotor-stator
➢ Rotor (Dout= 63.8 mm)
➢ EMSC Stator
➢ Shear Gap () = 0.15 mm
➢ Rotor speeds: 7,950 rpm
➢ Flow rate: 0.6 l/s
➢ Fl: 0.017
➢ P/m: 7.1 W/kg (total mass)
➢ Total suspension volume = 0.1 m3
➢ Fumed silica concentrations: 1, 10 and 15%wt
➢ Glycerol concentrations (1%wt silica): 60 & 85%wt
F
Silverson
150/250MS

© BHR Group 2017 Slide 7DOMINO
Dispersion Rheology
➢ With 1%wt Aerosil in water, the viscosity was “water-like” (not measured)
➢ At 10 and 15%wt Aerosil, the dispersions’ viscosity is considerable higher and they become significantly non-Newtonian
➢ Glycerol solutions: no significant increase after 1%wt Aerosil addition.
© BHR Group 2017 Slide 8DOMINO
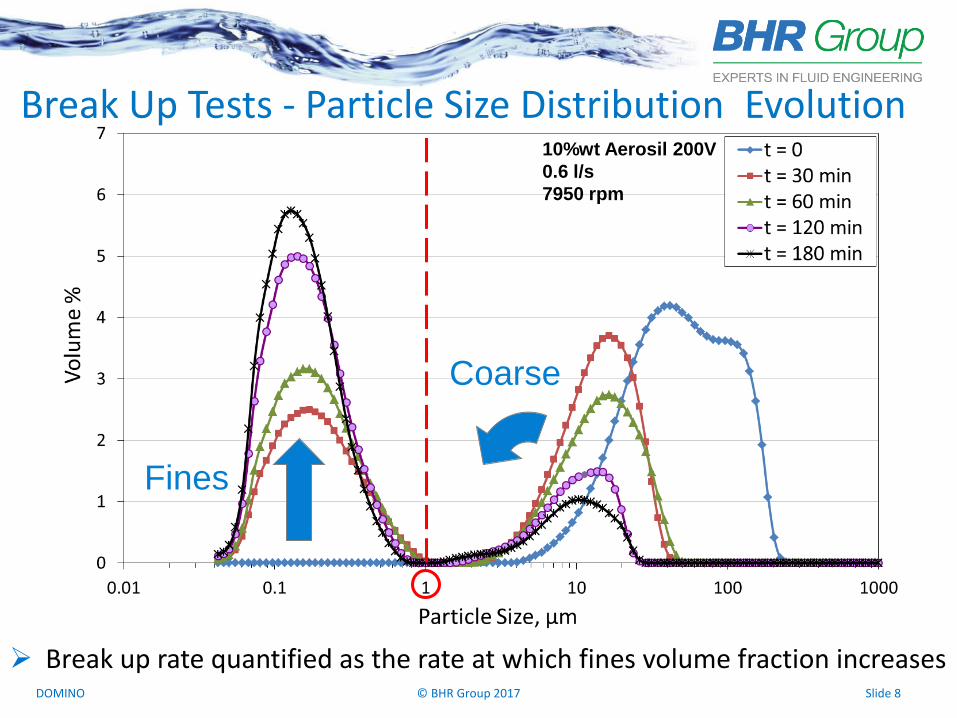
Break Up Tests - Particle Size Distribution Evolution
Coarse
Fines
10%wt Aerosil 200V
0.6 l/s
7950 rpm
➢ Break up rate quantified as the rate at which fines volume fraction increases

© BHR Group 2017 Slide 9DOMINO
Fines Generation Rate
➢ Small difference and no trend with the Aerosil-Water dispersions
➢ In Glycerol/Water solutions, the break up rate is reduced as the viscosity of the solution increases
𝐹(%𝑣𝑜𝑙) = 1 − 𝑒−𝑧𝑁𝑇

© BHR Group 2017 Slide 10DOMINO
µ(a)(N) µ(a)(K) Re (N) Re (K) Z µC d32,t=0 hK d32,t=0/hK
mPa·s mPa·s - - - mPa·s µm µm -
1%wt A-W 1 1 534,273 534,273 0.047 1 28.9 19.4 1.49
10%wt A-W 18.6 38.3 32,131 15,618 0.034 1 36.1 19.4 1.86
15%wt A-W 15.8 92.0 39,899 6,850 0.040 1 38.1 19.4 1.97
1%wt A-10 mPa·s G-W 9.7 9.7 63,418 63,418 0.024 9.7 38.0 95.8 0.40
1%wt A-100 mPa·s G-W 98 98 6,661 6,661 0.0037 98 44.1 519.2 0.08
Fines Generation Rate
➢ Flow within the rotor-stator is turbulent under all conditions (based on power draw data)
➢ In the A-W dispersions, the flow around the particles is given by the continuous phase properties and the initial particle size is greater than the Kolmogorov scale (hK)
➢ In A-G/W dispersions, d32(t=0) < hK, the flow around the particles is viscous and this reduces the break up rate (Z)
𝜂𝐾 =𝜈3
휀𝑚𝑒𝑎𝑛
Τ1 4
ሶ𝛾𝑁 =𝑣𝑡𝑖𝑝𝛿
ሶ𝛾𝐾 =휀
𝜈𝐾
Τ1 2

© BHR Group 2017 Slide 11DOMINO
Effect of Solids Concentration
Specific Energy, MJ/kg(solids)
Fines, %vol 50 75 100*
1%wt 1.85 3.39 9.36
10%wt 0.24 0.50 1.04
15%wt 0.14 0.28 0.63
*: Extrapolated
➢ The energy required per unit mass of solids to achieve a given fines fraction is, at least one order of magnitude higher at 1%wt than at 15%wt. At 10%wt is 60 - 80% higher than at 15%wt.
➢ Therefore, it is more energy efficient to operate at higher solids concentrations (and then dilute as necessary)

© BHR Group 2017 Slide 12DOMINO
➢ The power draw of an in-line rotor-stator has been characterised at Reynolds numbers between 2,400 and 600,000. The results show that the flow in the R-S is turbulent within this range.
➢ Solids concentration has an important effect on the rheology of the dispersions.
➢ The break up rate (fines generation rate) depends on the flow conditions around the particle, not the overall dispersion rheology. The initial mean particle size and the Kolmogorov microscale (mean power input) can be used to determine these flow conditions.
➢ It is more energy efficient to operate at higher solids concentration (as long as the flow with the rotor-stator is still turbulent, because a larger amount of solids is processed in a given time and, therefore, the energy expenditure per unit mass of solids is lower.
Conclusions

© BHR Group 2017 Slide 13DOMINO
➢ Members of the DOMINO Consortium
http://domino.bhrgroup.com/
➢ Mr Chris Hampson
Acknowledgements

© BHR Group 2017 Slide 14DOMINO
End of Presentation
Questions?

© BHR Group 2017 Slide 15DOMINO
References
➢ Atiemo‐Obeng, V. A., & Calabrese, R. V. (2004). Rotor–stator mixing devices. Handbook of industrial mixing: Science and practice, 479-505.
➢ Özcan‐Taşkın, G., Kubicki, D., & Padron, G. (2011). Power and flow characteristics of three rotor‐stator heads. The Canadian Journal of Chemical Engineering, 89(5), 1005-1017

© BHR Group 2017 Slide 16DOMINO
➢ The power draw tests with higher viscosities was only carried out with the GPDH+SQHS. Given the similarities between the Po1 and Po2 values and of the results in water of the two geometries, it stands to reason that the flow is also turbulent when the EMSC is used under the same conditions
Power Number - GPDH+SQHS vs EMSC

© BHR Group 2017 Slide 17DOMINO
Dispersion Rheology – Vane & Basket
0
50
100
150
200
250
300
350
400
450
0 100 200 300 400 500 600 700 800 900Shear rate (s
-1)
Sh
ear
str
ess (
Pa)
Cup & Bob
Vane & Basket
Mineral oil blend (standard)
T = 20oC
➢ The vane and basket geometry’s results were validated by measuring the flow curve of a Newtonian oil standard with it and with the cup and bob geometry.

© BHR Group 2017 Slide 18DOMINO
Primary Particles Aggregates Agglomerates
ErosionRuptureShattering
➢ Rwei, Manas-Zlocsower and Feke (1990), Redner (1990), Ottino et al (2000)
➢ Different relative energy (to agglomerate strength) levels required:
EErosion < ERupture < EShattering
Particle Break Up Mechanisms

© BHR Group 2017 Slide 19DOMINO
➢ All experiments were carried out with Aerosil® 200V in distilled water or glycerol aqueous solutions
➢ Aerosil 200V is a fumed hydrophilic silica manufactured by EvonikIndustries
➢ The primary particle is 12 nm (according to manufacturer)
➢ Electron microscopy studies have shown that the smallest aggregates are of the order of 100 nm
➢ PSD measured by light scattering (Beckman Coulter LS230) using a refractive index of 1.46 + 0.1i
Materials
SEM Images of Aerosil 200V

© BHR Group 2017 Slide 20DOMINO
d32(NT)/hK vs NT
➢ A-W: particle size eventually becomes smaller than hK, but at least for the first ~10 turnovers (fastest break up) it is at least O(hK).
➢ A-G/W: particle size always smaller (up two orders of magnitude) than hK


![Untitled-1 [] · Run Capacitor Stator Winding Relay Rotary Switch Rotor Start capacitor Main or Run Windin Stator Winding Main Winding Start capacitor Rotor](https://img.pdfslide.us/doc/110x75/5fc791720420d159865384b0/untitled-1-run-capacitor-stator-winding-relay-rotary-switch-rotor-start-capacitor.jpg)