Embed Size (px)
Citation preview
MINING ENGINEERS
CALLER NO. D. LITTLETON, COLORADO 80123
Particle Breakage Studies On An impact Grushloag Environment
Research programs conducted by ~ l l i s - ~ h a l m e r s Corporation are showing that the most efficient energy use in crushers is achieved when the forces applied to particles undergoing breakage are increased. Laboratory bench scale tests have been de- veloped to confirm this phenomena, which was first observed in the field using HYDROCOME crushers with automatic setting controls. A new testing machine is described and methods of maximizing such benefits are postulated.
M. D. FIsavel W. W. Wimrner Manager, Mining Industry Sales Manager, Minerals Process Technology
Crushing & Screening Advanced Technology Center Equipment Division
Alfis-Chalrners Corporation Milwaukee, Wisconsin, U.S.A.
For Presentation at the 1981 SME-AIME Annual Meeting Chicago, Illinois February 22-26, 1981
Permtsslon Is hereby given to publlch with appropriate acknowledgements, excerpts or summorles not to exceed one-fourth of tho ontlre text of the paper. Permission to print In more extended form subsequent to publication by the Institute must be obtained from the Exocutlve Secretary of the Society of Mining Engineers of AIME.
If and when this paper lo publlohad by the Society of Mining Engineers of AIME, It may embody certain chnnges made by agreement betwoen the fochntcai Publicatlona Committee and the aulhor, so that the form In which It appears hem Is not nocossarlly thnt In whlch it may bo publtnhed later,
Those prcprlnts arc ovalloblo for salt?, Mali orders to PREPRINTS, Soclety of Mlnlng Englnoerc, Caller No. D. Litlieton, Colorndo 00123.
PREPRINT AVAILABILITY LIST IS PUBLISHED PERIODICALLY IN MINING ENGINEERING.

FOREWORD C. M. B R O W N . Ore C r u s h e r a n d G r i n d e r .
Allis-Chalmers Corporation was founded in Milwau- kee, Wisconsin, in 1847 as the E. P. Allis Company, which had a n initial interest in manufacturing compo- nents in the grinding of flour. As such, its roots were started in reducing material size, which is covered by the generic term, comminution.
The Corporation evolved by a series of mergers into one of the world's first conglomerate companies.
Several key equipment suppliers to the mining and cement industries, in the late 19th century, became part of Allis-Chalmers and provided a broad base to build the modern technology we are using today.
Because this publication is recommending new ap- proaches i n solving old problems, it seems fitting to reflect on some past history to gauge the progress of our technological innovation. During this historical review i t has been surprising to find features on equipment almost 100 years ago that one tends, from today's per- spective, to think are relatively new. Some such devel- opments had to be abandoned because of inadequate technology. The fact that such features existed at that time speaks volumes for the intelligence and inventive genius of the early crusher engineers. Some significant features will be mentioned in the following discussion.
The world's first truly successful compression type crusher was the Blake jaw crusher, first patented by E. W. Blake in 1858. The machine is still used today. Its greatest weaknesses were that i t only crushed during half of the operating cycle, and i t had only limited ca- pability to crush fine.
Rotary vertical shaft crushers were under develop- ment by Gates Iron Works in Chicago in the 18607s, and following several aborted attempts the first successful gyratory type crusher was built, similar to the configu- ration shown i n Fig. (A) according to patents issued to Charles M. Brown of Gates in 1878. I t should be consid- ered the forerunner of al l gyratory a n d cone type crushers. The first unit was tested on loan to the Kirby & Howe Stone Co. of Iowa.
By January 8, 1881, Gates felt so confident of this new design tha t he advertised in the "Engineering & Mining Journal" of that date that he had "The Greatest Rock Breaker On Earth," and guaranteed tha t the crusher would do double the work of any upright con- vergent jaw crusher. He also openly challenged any competitor to a competitive trial.
By the turn of the century Gates claimed to have sold well over 4,000 crushers and was a clear leader in the field. They had also developed a spring relief protected machine to prevent problems associated with uncrush- able tramp iron, but this was subsequently dropped from the model line.
Fraser and Chalmers, a company founded by two Scotsmen in Montana a s a direct result of the Gold Rush around 1850, expanded their mining supply busi- ness by setting up in Chicago in 1860. They made Blake type jaw crushers and, ultimately, developed in 1890 the
No. 201,646. Patented March 26, 1878.
FIG. (A) C. M. BROWN GYRATORY CRUSHER PATENT DRAWING
"COMET" crushing machine, which they claimed was the world's first adjustable under load gyratory unit.
I n the latter part of the 19th century, Robert M. McCully of Philadelphia, Pa., produced the well-known gyratory crusher bearing his name. The machine had the first top suspended crushing shaft, all previous units having bottom shaft support, and great advan- tages were claimed for this arrangement. Power and Mining Machinery Works in Milwaukee made these machines under a n exclusive license early this century.
All of these companies ultimately became part of the Allis-Chalmers conglomerate except the parts of Fraser and Chalmers outside the U.S.A., some of which' still operate under that name.
The science of comminution was just getting started i n the 1890's, so the rather brazen claims as to a machine's superior performance were a t the mercy of aggressive marketing people of tha t era.
Apart from the already quoted advertisement of Gates, for posterity, it is worth quoting a n excerpt from Fraser and Chalmers' "Comet Rock Crusher Catalog No. 6," which was published in 1897.
- - - -

Read What It Will Do
The Comet Crusher is particularly adapted to crush- ing Railroad Ballast and Street Macadam, but. we have designed it with sufficient strength to crush also with ease, Ores, Granite, Phosphate Rock, Corun- d u m , Concrete, etc.
P O \ Y F : l C 2.) Y I I h T I N G P Z A C , I i I S E K Y CO.
fLrPCCNTflGE5
Our machines in many instances have been put to the severest possible tests and stood the work nobly.
The most wonderful capacity of this novel crusher is due to its large receiving capacity and easy motion. A car of rock can be dumped directly into the hopper, in fact men find it almost impossible to feed it. One of our No. C crushers working on exceedingly tough rock exceeded the combined efforts of three men to feed it, "fire flying all the while," as they said, and putting through eight yards of rock in twenty min- utes, or say averaging sixteen yards every hour, in- cluding all delays, stoppages, etc.
The large Crusher E has put through more than a ton of rock every minute.
For the purposes for which it is designed this Crusher has no equal.
FIG. (B) McCULLY SIZE DISTRIBUTION GRAPH (1910)
Generally speaking, the manufacturer relied upon let- ters of testimonial to sell his equipment, and a generous number of these were normally included a s part of any crusher catalog.
This same Fraser and Chalmers' Catalog No. 6 quotes a range of capacities for each size of various machines simply a s "Capacity in tons per hour. Size of Maca- dam." No definition of particle size was given and natu- rally there could be little accountability.
The first attempts a t defining power and capacity appear in Gates' Catalog No. 15, April 1900 edition, where a range of capacities produced through a 2%" ring are quoted for Style D ore breakers, which was qualified "according to the character of the rock."
A publication, undated, but probably printed about 1901, "McCully's Improved Rock and Ore Breaker," quotes capacities stated a s being "tons of 2,000 lbs. Macadam or ballast size, 2% inches" for a range of machines.
Probably one of the first attempts to relate crusher setting, size produced and power required appeared in Power and Mining Machinery Co.'s bulletin No. 4, pub- lished in 1910 for the McCully crushers. A graph used in such determinations is shown in Fig. (B).
I t would appear that from this point up until the pres- ent, little has changed in our methodology concerning crusher application, although computers have been har- nessed to speed up our calculating methods.
Application of crushing equipment for the m'ost part has been a "Black Art."
In the old days, you needed a standard crusher to make coarse particles about 2% inches (65 mm) and upwards, and a shorthead crusher if you wanted to crush finer. These terms were commonplace in manu- facturer catalogs, such as McCully, between 1900 and 1920. Some manufacturers still use such terminology on machines designed since that period.
Clearly there have been substantial improvements to machinery including the application of automatic con- trols to improve productivity from a crusher. Our knowl- edge of the way a material behaves under processing conditions has improved immensely.
I t seems inappropriate that we still use, basically unchanged, the same 70-year-old application methods for most crushing calculations.
This publication suggests a more fundamentally based method of applying crushing machines in terms of scien- tifically based energy and size parameters. Hopefully i t will contribute to the better understanding of these pro- cesses.
Our past experiences are the basis of determining the need for such improved technology.

ABSTRACT
Research programs conducted by Allis-Chalmers Corporation are showing tha t the most efficient energy use i n crushers is achieved when the forces applied to particles undergoing breakage are increased. Laboratory bench scale tests have been developed to confirm this phenomena, which was first observed in the field using HYDROCONE crushers with automatic setting controls. A new testing machine is described and methods of maximizing such benefits are postulated. ' .
Rapidly increasing operat ing costs for minerals beneficiating plants continue to be the biggest single problem in maximizing profitability from these opera- tions. The average world inflation rate has been in- creasing over the last decade and shows little sign of easing. The threat of continued increases in the price of fuel oil (some analysts predict a 25% increase from $32 to $40 per barrel in 1981) will eventually increase the cost of electrical power, in direct proportion for most users. This will undoubtedly cause closure of some lower grade ore bodies unless energy utilization efficiencies, particularly in comminution, can be improved.
Most of the recent literature concerning comminution performance improvement has been directed a t grind- ing mill performance. I t can be expected tha t more refined control systems will improve the overall milling energy efficiency, which is normally the largest single cost component of production. However, published gains by such methods to date appear to be limited to some- thing less than 10%.
The second largest cost for comminution processes is normally tha t for wear metal consumed in grinding operations. ,
Allis-Chalmers h a s continuing research programs into all forms of comminution processes involving crushing and grinding. Improved crushing technology shows the way to reducing both energy and wear metal consumption mainly by producing finer feed which will improve downstream grinding mill performance.
Because there has been less emphasis on crushing technology than milling, this paper will also discuss ol)jectively the co~nparisons of energy and wear metal ' for the two processes.
A new testing procedure for studying crushing phcn- otncna, prescntly being perfected by Allis-Chalmers, is described for the first time. Thcse tlench scale laborn- tory tcsts will give more accurate prediction of both energy requirements and ~ i z c distribution 1)roduced in commcrci:ll crushing processes. As a direct result, this rnr~chine will allow more accurate comparisons to bc mnclc in cripitnl and operating cost expenditures for var- ious com1)inntions of crushing and milling processes.
r 1 1 llest. ncw testing praccdures can Ile run on srnnll sr~rnplcs inc:ltldin~: pieces of drill core rnnterinl. They
could be part of testing and feasibility studies for most new concentrators. The same methods can be used to determine likely yield of various sized crushed products and, therefore, benefit crushed stone producers.
BACKGROUND
The'theoretical and practical phenomena concerning comminution processes have received considerable atten- tion in the literature and are not discussed here in any
' detail. Instead, the breakage studies in this paper are ' based on a n empirical treatment of the fundamental
relationships between energy and the size distributions of processed particles that have been observed both in the laboratory and i n large-scale, commercial cone- crushing operations.
Because of the bewildering number of variables en- countered when studying comminution processes, most investigators have preferred to assume that the size dis- tribution generated in milling and crushing processes bears some relatively fixed relationship such a s those described by Gates-Gaudin-Schuhmannl or Rosin- Rammler."
Fred Bond, in his "Third Theory of C~mminution,"~ ' used the former, essentially assuming that size versus cumulative percent passing that size was represented by a straight line of assumed slope 0.5 below the 80% pass- ing size. Based on this assumption, Bond derived his well-known relationship:
where W = work in KWH/short ton Wi = Work Index
F80 = 80 percent passing size of the feed (micrometers)
Pa0 = 80 percent passing size of the product (micrometers)
The Work Index for rod and ball mills can be deter- mined from laboratory tests and, a s demonstrated by Rowland,l the relationship gives us a reasonably ac- curate tool for the design of rotary grinding mill circuits.
Bond's methods have been less successful in predict- ing fine crushing performance, however, primarily because the typical crusher feed and product distribu- tions do not meet the assumed conditions necessary for the satisfactory application of his equation (see Fig. (1 )).
It is most evident tha t the curved lincs nppenring on Fig. (1) do not represent a Gates-Gnudin-Sshul1m11nr1 size distribution. It is therefore not surprising that 13onrl's procedures do not work well in t h i ~ situation. The IEo~in- Ilnmmlcr dislriltution has also I~ecn fou~ltl inrzt1t:qucilc to ~;cnernlly clescribc crusher producls.

I
Size FIG. (1) TYPICAL CONE CRUSHER FEED AND PRODUCT SIZE DISTRIBUTIONS
Work during the early 60's led to the concept of com- minution a s a repetitive process, with each step consist- ing of two basic operations - the selection of a particle for breakage and the subsequent breakage of this parti- cle by the machine. In this approach, the process under investigation is modelled by combining the particle selectiodbreakage event with information on material flow in and out of the comminution device.
Most workers who have used this approach5 have considered size reduction to be the result of the mechan- ical operation of the comminution device. This mechan- ical operation consumes the energy, and size reduction is merely a result of this energy consumption. This viewpoint is reasonably valid for tumbling mills where energy input tends to be constant and the proportion of the energy that is usefully consumed in particle break- age is low (<lo%). I t does not appear to be valid in com- pression crushers, however, since breakage energy is a significant proportion (>50%) of the total energy input to the crusher and markedly different power rates (energy input per unit of crusher feed) can be obtained by vary- ing ore feedrates and/or crusher parameters such as closed side setting. I t will therefore be necessary to include energy information in any model of the crush- ing process before i t will be possible to accurately pre- dict crusher performance. The inclusion of this energy- size information will significantly increase the complex- ity of these models.
The single-particle breakage event has been the sub- ject of several studies.", 1 8 Most of these have utilized only sufficient energy to break the particle and do not
simulate commercial crushing operations where energy levels are such tha t catastrophic repetitive breakage usually takes place. This approach to the study of com- minution processes does yield valuable information, however, and i t is unfortunate tha t it has not received greater attention.
TEST PROCEDURES FOR THE CHARACTERIZATION OF
CRUSHER PERFORMANCE
The Bond Impact Work Index method h a s been a n industry standard for the determination of crusher power requirements but was originally developed9 to ensure that sufficient power was connected to primary gyra- tory crushers. In this method, pieces of rock are frac- tured by trial and error in the test device shown in Fig. (2), until sufficient impact energy has been applied to break the rock.
Normally, the rock breaks in halves, and in most tests only two and seldom more than three large pieces are observed after fracture. No size distribution information is used i n calculating the Bond Impact Work Index from the formula:
WI = 2.59 Average Impact in ft-lbs/inch . .(a Specific Gravity
This mode of breakage is similar to tha t occurring in a primary gyratory crusher where power rates (energy input per tonne of feed) are low (approximately 0.1

TLCT
SUSHING iNDULUM
I RETAII ! .CHAM, REBC EN1
RECORI
?n two 30-lb. )endulum han ERGY
A
r t u . 13) PENDULUM CRUSHING DEVICE
- iammers hlt wltn lncreaslna lmoacts until stone break
re v- = crushing energy mushing pendulum potential energy before release) ~inetic energy of the two platens bound pendulum maximum potential lergy (after crushing) ?stem energy loss (sound, heat, vibration)
rCT WOF ( TEST O
KWH type ment,
ute well ;e power ites are t
for this require-
iypicall y
, is determined by plotting a1 height of the crushing
pGiluululll w l r l l Ilu L u L n plcaent. The major portion of this loss is by vibration. I t is felt that the difference between system energy losses with and without rock present in the system is minimal as long as enough initial energy is supp; sult in a small elevation of the rebound pendulur
The procedure I er but tends to t crushers where
higher (upwards from 0.25 KWH/tonne).
le systen as a fun 1..1.,, ...
loss, EL the initi
,,I, ,,,".
n energy ction of <th ..- ... s in fine . . - .
power ra . - - - - - - -
much
:ause of this, a research program was instituted by Chalmers Comminution Task Force Committee to
a manne I to that observed 3rcial fin ndulum type test - in most developed by the
United States Bureau of Mines1" and shown diagram- matically in Fig. (3), was built and has been used in a n extensive test program to determine whether it would be nn~nible to predict cone crusher performance.
Bec Allis- break withi devic~ - - ..
: rock in , lied to re; n.
nalogous r more a1 le crushe !rs. A pel
I to that I .-
n commt e similar . - . .
respects A - -. T e fragments from u c v c l a l rock samples broken under
tical conditions were combined for each of the size yses reported in this paper. Bond Work Indices
.. --c! also backcalculated from the data using the stan- dard
anal
! formula
mples selected fo ig in thi! nlr: uauiuly lllinus 38mm (1-l/b ,, plua 19mm (b/* 111
size. The sam is weighed and then placed be- tween the pla ie end of the rebound platen is placed in con1 L the rebound pendulum and the crushing pendulum is raised to a predetermined vertical height which depends on the size of the sample. The crushing pendulum is then released - after striking the crushing platen and breaking the rock, the remaining energy is transferred via the rebound platen to the rebound pendulum. The horizontal distance that the re- bound pendulum travels is recorded by displacement of a marker and is subsequently ed to a height.
],/particle weight 10 10
The .-.-,. .., 8 rock sa: ..., 11.. - r crushir 3 9 , \ -I..-
s device 3 / A , , \ :-
ple rock [tens. Tk tact with . . re F80 is ae~ined as the length of the side of the
cube of the same weight as the average particle.
Confirmation of the ability of the procedure to provide infnrmation suitable for the prediction of crusher per-
lance was obtained by taking feed samples from 31 mercial operations treating a wide range of rocks ores. At the time of taking a feed sample for labora-
tory testing it perfor- mance data , distribu- tions for feec )perating crusher. Several thouDalLu luLn, l L a v c ucclr "loken dur-
ice over the past 3 years.
--+---
form comi and
vertical
I - . - -
convert
- *I . .
in the I 3endulun power, fc 3duct we c..-.,.#a ..n*
n device ?ed rate re taken *Ir" I.-.,-
, relevar and size on the ( I.--.. h%.,
such as I and prc - - The energy used in crushing me sample can De ap-
)m an en nated frc ergy bal; ance of tl he syster i the dev

Typical, comparative product size distributions are given in Figs. (4) through (6) for three materials.
The first thing to notice from these graphs, is that there is an extremely good family relationship within each set of size distribution curves. This is somewhat coincidental, since the pendulum curve is the product of a single particle-single impact breakage event and the typical crusher product curve results from multiple particle-multiple impact breakage, but is probably due to two facts:
- the modes of breakage and the net power rates are similar for the two machines
- the action of the cone crusher is such that an indi- vidual feed particle is subjected to a limited number of breakage events
In order to show that the pendulum product size dis- tribution is sensitive to power rate, several tests have been run on the same feed material a t different levels of pendulum input energy. Typical results are shown in Fig. (7) as Schuhmann size distribution (log-log) plots. I t can be seen that increasing amounts of fine material are produced with increasing energy input. The same effect was previously demonstrated for an operating crusher in Fig. (1). We can, therefore, conclude from this
that net power rates will be the same in the pendulum and the crusher when the two distributions coincide (as they do in Figs. (4) thru (6). This permits us to determine the efficiency of power utilization in crushers and to predict the product size distribution which will arise from operating crushers a t different power rates.
The Bond Work Index figures obtained by backcalcu- lation from the pendulum data are compared with the Net Work Index values obtained from the plants in Fig. (8). The agreement is surprisingly good especially in view of the fact that the 80% passing values do not completely describe the total feed and product size dis- tributions. This agreement is probably due to the fact tha t the use of comparable energy levels in both machines gives rise to similar reduction ratios and pro- duct size distributions. Because of this, the pendulum test provides a good estimate of the Net Work Index when this is required for current design procedures.
The pendulum product distribution is a breakage function and can be used in models of the process to predict crusher product distributions for different oper- ating conditions. As an example of this approach, Whiten's1* model of the cone crusher, Fig. (9), has been used to simulate the situation given in Fig. (4). The result of this simulation is given in Fig. (10) where it can be seen that very good approximations of crusher performance can be obtained.
MESH I INCHES
FIG. (4) COMPARATIVE PRODUCT SIZE DlSTRlBUTlONS - GRANITE

SCREEN SlZE (MICRONS)
FIG. (5) COMPARATIVE PRODUCT SlZE BlSTRlBUTlONS - TRAP ROCK
MESH I INCHES 0 000 0 0
y) 0 0 0 0uJ000 r, 0 y) 0 LDhOy)O
100 90 80 70 60
50.
40
30
20 [I)
z VJ ffl Q a 10 9 5 8 0 7 k 6 a COPPER ORE
5
4 ---- SCP - Arb~trary Shift 3
o Pendulum Crusher #l
2 A Pendulum Crusher #2
1
SCREEN SlZE (MICRONS)
FIG. (6) COMPARATIVE PRODUCT SlZE DISTRIBUTIONS - COPPER ORE

MESH I INCHES 0 00000
100. 90. 80. 70. 60.
50.
40.
30.
20.
10. 9.
COPPER ORE 8. 7.
0.95 KWH/T 6.
0.54 KWH/T 5. 4.
0.32 KWH/T
0.26 KWH/T 3.
0.21 KWH/T 2. 0.14 KWH/T
1.
0 0 0 0 0 0 0 0 0 0 0 0 0 0 0 0 0 0 0
0 0
0 0 0 0
N w w m z g g g g g o o 0 0 0 o o 0 0 0 F
0 N I D m o 0 0 0 0 0
7 N 0 0 0 0 cr w m z
SCREEN SIZE (MICRONS)
FIG. (7) EFFECT OF INCREASING POWER RATE - COPPER ORE
OPERATING WORK INDEX
FIG. (8) COMPARISON OF PLANT AND PENDULUM WORK INDlClES

(Breakage) L47 Mass Balances at the Nodes Give the Equations
f + B C x = x
x = C x + P
Eliminating x and Rearranging Gives
P = (I-C) (I-BC)-' f
P (Product)
1
f (Feed) x
f, p and x are Vectors Giving the Mass Flow Rates in Each Size Fraction
B and C are the Breakage and Classification Matrices, I is the Unit Matrix
A E=-
I
C (Classification)
FIG. (9) WHITEN'S MODEL OF A CONE CRUSHERll
SCREEN SIZE (MICRONS)
FIG. (10) COME CRUSHER SIMULATION - COMPARATIVE SIZE DlSTRlBUTlONS FOR GRANITE

The selection (or clnssificntion) function used in this feed) mill determine the size reduction. This hns simulation was determined by backcalculation. Work is just been clearly demonstrated by the pendulum presently underway to quantify this function. tests.
The esriters are firmly of the opinion that results to date prove that the use of this pendulum device can give more energy-size reduction information in a form read- ily useable for crusher application. The data can be generated in less time and from a much smaller sample than is required for pilot plant testing. Our present pen- dulum tester is a research tool and is currently being modified for use in commercial testing of minerals and rocks. More details of this device will be given a t a later date.
APPLICATION OF TECHNOLOGY
From the discussion so far it is obvious that two energy factors determine a crusher's productivity:
(1) Total power drawn affects the quantity produced of any given size or range of sizes.
(2) The energy applied, previously defined a s the crusher's Power Rate (kilowztt hours per ton of
In a previous paperH, we have shown that the theorcli- cnl forces achieved in a crushing chamber are a direct result of the design geometry and driving power applied to the crusher. Machines from three manufacturers can theoretically apply different crushing forces to processed material, according to Table (1).
The energy intensity within the crushing chamber will differ for various machines. The wide range of eccentric throws and connected powers for various units will give different crushing impacts, which might be considered anologous to the pendulum. The angle of the mantle for the crushing head varies between manufac- turers a s does the length of the crushing zone from less than 200mm (8 inches) to more than 600mm (24 inches) but a s has been indicated from the pendulum size dis- tribution correlations it is the energy input to the feed material which determines the reduction and size dis- tribution. Eccentric throw and chamber shape appear to have little influence.
TABLE (1) TC-OEORETllCAL UNRESOLVED CRUSHING FORCE
Torque From Formula: F = - - 63025 x WB
(British Units) Half Eccentric Throw S x ECC Throw
-
2 "A" Manufacturer Model' 36 45 51 60 84
Kilowatts 93 149 149 224 373 Horsepower 125 200 200 300 500 S Gyr/Min 350 290 290 260 21 0 Throw (in.) 1.13 1.38 1.38 1.5 2.0
mm 2 9 35 35 38 51 F Force Pound 40,015 63,222 63,222 96,961 150,000
k !3 18,156 28,685 28,685 43,993 ' 68,058 "B" Manufacturer Model* 3' 3' 4' 4-1/4' 5-1/2' 5-1/2' 7'
Kilowatts 45 56 7 5 112 149 149 224 Horsepower 60 75 100 150 200 200 300 S Gyr /M~n 385 385 240 240 237 237 21 2 Throw (in.) 2.13 2.31 2.69 3.0 3.5 3.88 4.0
mm 54 59 68 76 89 99 102 F Force Pound 9,244 10,620 19,538 26,260 30,391 27,415 44,593
kg 4,149 4,819 8,865 11,915 13,789 12,439 20,233 "C" Manufacturer Model* 36 48 66 1100 1500 1900
Kilowatts 75 149 224 112 182 298 Horsepower 100 200 300 150 250 400 S Gyr/Min 307 268 220 303 267 21 9 Throw (in.) 2.0 2.6 2.75 2.2 2.75 3.5
rnm 5 1 66 70 56 70 89 F Force Pound 20,529 37,627 62,504 28,364 42,813 65,780
kg 9,314 17,072 28,359 12,869 19,425 29,846 'NOTE Some manufacturers do not give all this specification information in sales literature, and many of these
measurements here were made in the field on operating equipment. Even if correct in one instance, the specif~cations could be different for different machines. For accurate data, the person studying such ~nformat~on should refer to the crusher manufacturer.
This information is only published s o the reader can get an order of magnitude comparison for setting up h ~ s own technical study.

To make the finest product, we should be running the crusher with the lowest practical feed rate and applying the maximum crushing force. This will give the highest power rate but there are physical limits to operating in this mode, especially if the crusher is run a t fixed set- ting. To make a coarse product the power rate'should be no greater than that needed to generate that size. The power drawn in any case should be maximized to yield the greatest quantity of the required product.
There has been adequate reporting by people such a s Szaj13 and Lynch14 that operating crushers at fixed set- ting most often demands that the average operating power be limited to only 50 or 60% of that connected, to guard against crusher stalling and minimize mechani- cal damage. Control devices such as those by Lindgren et all5 have been developed to maximize power drawn and productivity through fixed setting crushers.
The power drawn by a crusher can be changed by varying the feed rate and/or the setting, as shown in Fig's. (11) and (12). A small change in setting can bring about a large change in power rate, Fig. (13). Changing feed rate near optimum power draw gives small change to crusher power rate and the reduction ratio remains approximately the same.
The rapid fluctuation in crusher power draw that is normally associated with high power rate operation
600 1 CRUSHER FEED
FIG. (11) FIXED SETTING FEED RATE POWER RELATIONSHIP
FIG. (12) VARIABLE SETTING POWER RELATIONSHIP
CLOSED SIDE SElTlMG
FIG. (13) SMALL CHANGE IN SETTING GIVES LARGE CHANGE IN CRUSHERS POWER RATE
makes it desirable to fit a crusher with an automatic setting control system as shown in Fig. 14 to guard against mechanical overloading. At the same time this maximizes the power rate and average power drawn for a particular configuration.
It has been determined that within a cone crushing chamber, machines using automatic setting regulation can normally operate at more than twice the power rate compared to units operating in a fixed setting mode.
I Feed alteration
FIG. (14) ALLIS-CHALMERS HYDROCONE CRUSHER WITH AUTOMATIC SETTING
REGULATION AND FEED RATE CONTROL
The device in Fig. (14) works by constantly trying to reduce the machine's setting according to a program, thereby maximizing power drawn within preset limits. If the crusher overloads, it opens up according to another program. Feed rate can be another variable controlled within the same system. The combined setting/feed rate system can be appropriately coordinated to give a crusher power rate control, thus effectively determining reduc- tion ratio as will be seen in more detail following.
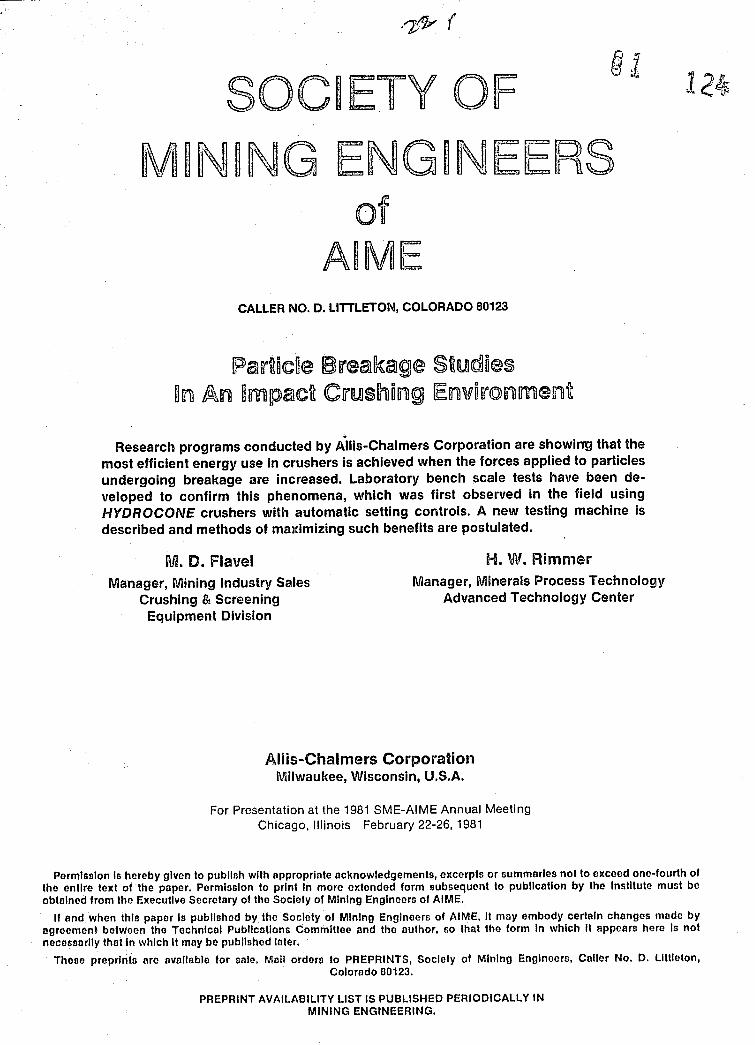
It has been demonstrated that both capacity and quantities of finer sizes produced, Fig. (15), can be improved substantially by using automatic setting controls in a cone crusher.
It can be seen that the yield of minus 13 mm material for the automated set crusher is approximately twice that for the fixed set machine. Also notice that the per- cent minus 13 mm and 9.5 mm in the crushers' dis- charge is about 10% higher even though the crushers are operating a t close to the same close side setting. One of the main reasons for the differential in this test is the larger eccentric throw in the fixed set unit. The smaller eccentric throw and automatically controlled setting increased power draw to give a much higher crushing force. This is analogous to a large pendulum energy in the laboratory tests.
By adjusting both the feed rate and power together, we can change the power rate and, hence, reduction, as is shown from a field test result, Fig. (16). The auto- mated setting and power drawn was almost the same for both operating conditions. The large difference in reduction was due to the different power rates. Super- imposed pendulum results again demonstrate the fam- ily curve relationships for the laboratory tests.
The operating conditions for the crushers are diagram- atically shown in Figs. (17) and (18).
I t is clearly shown that the same energy applied to more material results in a much coarser product. In these tests the percent minus 12.7 mm (1/2 inch) changed from approximately 95% to 65% passing when the feed rate was doubled (power rate was effectively reduced by half). The automated setting control adjusted the crusher to the same power draw setpoint (320 KW). Because there is an exponential relationship between power drawn and close side setting, there was only a small 1 mm change between the tests. If an application engineer had been using a catalog, he might have computed the size distribution as 60% passing the setting. Clearly there would be a considerable error if this happened.
1210
435 TPH + 13 JIM 336 TPH + 13 MM
417 TPH - 13 MM 183 TPH - 13 MM
NET -
PRODUCTIVITY 775 TPH 385 TPH -'h" (13 MM)
FIG. (15) TWO 84" (2134 MM) DIA. MANTLE SECONDARY COME CRUSHERS TEST COMPARlSON

MESH I INCHES 0 00000
V) 0 o . ; o o $ ~ ON h. 0 . ; c d r r j m : d 5 U r- a 5: -$Z%g v m N N . - - W C ~ ~ N N & pj ? L ? r-, - F F N N O I l l 1 I I I i I I 1 l I 1 i I 1 I I I
/ 1 1 1 1 1 1 100.
L 90 - 80. - 7 0 -60. - 50. - 40. - 30. - 20.
- 10. - 9 - 8 . -7 .
. -6.
- 5. 0
+ f O A NOTE: Crushers Receiving Same Feed. - 4. + ,//A -*o Operating Crusher Power Rate 1.1 KW/T
-3, ----- 0 Operating Crusher Power Rate 0.5 KW/T 0'
A +Pendulum Energy Level 1 - 2. A Pendulum Energy Level 2
SCREEN SIZE (MICRONS)
FIG. (16) OPERATING POWER RATES AND P W L U M PRODUCT SlZE DISTRIBUTIONS
300 tph -
CRUSHtNG FORCE
(1 - ,j - -I+
HYD?l&UL1C + CONTROLS
600 tph
-
HYORAULIC
? CONTROLS
1 PRESSURE PRESSURE
FIG. (17) HIGH POWER RATE CRUSHING (11 KWiT) FIG. (18) LOW POWER RATE CRUSHWG (0'53 U W R ) ADJUSTING BOTH FEED RATE AND CRUSHER ADJUSTING BOTH FEED RATE AND CRUSHER
SETTfNG (MORE ENERGY PER ROCK CRUSHED) SETTING (LESS ENERGY PER ROCK CRUSHED)

EXISTING CRUSHER For many years Allis-Chalmcrs published catalog in-
APPLICATION TECHNIQUES formation, similar to Table (2), showing various eccent- ric throws and Dowers connected to individual machines.
The methods of applying crushing machinery have changed little during the last century.
Crushers are being engineered into flow sheets nor- mally by reference to catalog data supplied from var- ious n~anufacturers. This information does not make any allowances for hardness or feed size distribution, which have important bearing on crusher capacities and sizes produced. Many catalogs for approximately similar size machines give capacities that are roughly equivalent. There has previously been no published scientific way of comparing this data. The pendulum impact test can be used a s a standard for this purpose.
Manufacturers have changed connected power and eccentric throws on various machines with and without published changes to production rates and product size distribution analyses. These changes have occurred over such a time span that most engineers are unaware of their significance. Two cases of commonly used catal- ogs should be cited to show how general the nature of published information really is.
Because capacity and reduction ratios changed for the particular throw and chamber configuration, i t was up to the application engineer to come up with operating predictions. This was often a complex problem. If auto- mation were applied to maximize the power drawn by the crusher, capacities could be often increased by up to 100% more than the published capacity, a s already evi- denced by Rg. (1% which shows capacities approxi- mately 40% above the present-day catalog. With auto- matic setting control applied to a crusher, reduction ratios could also be increased substantially on a given feed size distribution. By employing the present stand- ard catalog format of capacities related to close side set- ting, no rational tool can be developed to accurately size the equipment.
Probably the most commonly used capacity and size graduation tables are those in the SME-AIME publica- tion, "Mineral Processing Plant Design,"16 published in 1978. These are given for Rexnord's "Symons" crusher.
In early 1980, new capacities and installed power were given by the manufacturer for these machines. A 25-year survey of the literature, Table (3), shows changes to power for these units. Capacities for different sized machines also changed during this period.
TABLE (2) EXAMPLE OF CRUSHER APPLICATION ENGINEERING INFORMATION USED BY ALLIS-CHALMERS PERSONNEL IN 1970
*Maximum recommended HP.
Capac~ties shown are for open circuit operation and are expressed In short tons per hour and based on clean, dry, scalped, friable feed s~milar to limestone, and weighing 100 Ibs. per cu. ft. with a work index of 13.0 o r less.

TABLE (3)
CATALOG HORSEPOWER - REXNOWD "SYMONS" CRUSHERS Machine
2 foot 3 foot 4 foot 4-1/4 foot 5 foot 5-1/2 foot HD 5-1/2 foot XHD 7 foot HD 7 foot XHD
30 60
100 125-1 50, N.A. 200 200 250-300 300
30-50 75-1 00
100-1 50 150-200 200-250 200-250
Discontinued 300-350 -300-350
30 100 150 200
Discontinued 250 -
350 400
For most manufacturers, nearly all the capacities quoted give the average size distribution for the dis- charged product a s approximately 60% passing a size equivalent to the close side discharge setting. This is regardless of the eccentric throw or physical size of the machine. Because of such complications, designers and operators are referred to the factory for more accurate capacity and size distribution information. With some operators having reported product coarseness a s low a s 14% passing the close side setting, and with some only making a net average of 40% passing twice the close side setting on vast tonnages of easy-to-crush materials, the inexact nature of catalog information calls for a more accurate approach to crusher application.
Many engineers and some design organizations use standard published catalog capacities and size distribu- tions in computer plant-design programs. Since most crusher manufacturers prefer people to seek factory ad- vice for accurate application, information in such standard computer design programs can and h a s resulted in significant errors to plant operating per- formance.
One such plant, which cost several hundred million dollars to construct, compared actual performance data against design aftcr more than one year's operation. This information is summarized in Fig. (19). In order to shield the plant's identity, capacity hns been scaled to 100,000 tonnes per day. The numbers and sizes of crusherr; and screens arc not given but have been scaled to the 100,005-tonncs-per-rlny figure. 'I'he plant was orig- inally designed ~~ssurning it could make the required mill feed throuf:h 12.7 nlm (1/2 inch) squrlrc screens operr~tiril: 75 pcrccnt of t(>ti~l time or 18 hours per day in n 365.dny ycpr.
(1 ) 'She j~lunt tvns conservntively de~i~:necI assuming n conrscr fcaetl nlr~lcriul - I (Kt minue 12.7 ntm versus thc 17!':i nctual. 7'his rvns not, hnwc~rc~ , enoui:h fur flic plnnl to milkc t h ~ dcxign tonnugc c:vrnn whcn nl1r:rntinr: for n I s ~ t ~ ~ ; c r rivr~iliil~ilif..qr ;wried. If thc finrxs l~iltl 1,cr.n in thc tlo-iij:~\ 1)ropor-
tion, plant output would have only been approx- imately:
24 2778 x 0.88 = 65,200
0.9 tonnes per day a t 88 percent availability or 34,800 tonnes short of design.
(2) The crushers are operating a t lower capacities and a t smaller settings than design.
(3) Closed-circuit screen productivity is approximately half design (31 versus 56 TPH per square meter deck). This is because of a buildup in near size particles just above the screen aperture dimension.
(4) The availability of the operating plant increases progressively from 80 percent for the secondary crushers to 88 percent for the tertiary screens. These screens are obviously the plant bottleneck, despite the fact that they are operating a t a coarser aperture (14.3 mm) than design (12.7 mm).
(5) The closed-circuit crushers are making a consid- erably coarser product (45 percent minus 12.7 mm compared to design, 66.5 percent) despite the fact that they are operating a t 6.5 mm setting. The reader should remember that most catalog data would give a standard product for this set- ting a s 60 percent passing 6.5 mm and 95 percent passing 12.7 mm. This coarse product is the rcn- son for the bottleneck in this plant and could have been predicted if the facility had been designed using crusher power rates to calculate reduction ratios.
The crushers in tills plant were automated using var- inblc feed rntc to control power drnwn a t a fixcd close side s c t t i n ~ . First-sl;igc reduction crrishers were run- ning at 60 pcrccnt nverngc conncctecl power :lnd the closrd-circuit crusllcrs were run ot 95 perccant itvcrage connocteci powrr. ?'he ccltiiptncnt theref(~re wns r u n n i n ~ near nlaxi~nrirli cnj)nl~~lity. Obviously \slr nerd bcttcr tiesign mttthoits for rrzlshirrj: E I I I C ~ ~crt:cnina 1)lnnt.s if such c8rrorx I I I . ~ not 10 be rcp(~litc*d.

DESIGN ACTUAL 100,000 TonnesIDay Mill Feed - 88,154 TonnesIDay Mill Feed -
12.7 MM Screen Plant % 14-3 MM Screen
75 Availability 8 8 (overall) Feed Rate
5555 Tonnes Hour 4136
10 Minus 12.7 MM 4 7 in Feed %
Secondary Crusher
37 Setting MM
TPH Per M2
3812 New Feed 2133
5717 Total Feed 4795
Net - 12.7 MM 66.5 Discharge % 45
9.5 Close Set MM 6.5
FIG. (19) COMPARISON OF DESIGN AND ACTUAL PLANT PERFORMANCE AFTER 12 MONTHS OPERATION
MEW DESIGN METHODS
By using automatic setting and feed rate controls on a crusher to maximize power drawn and optimize the power rate a t each stage, significant improvements can be incorporated into any crushing circuit design.
In a recent paper12 we described a method of design- ing a crushing plant using power drawn and power rate to define reduction ratios in each stage of crushing. The plant power and power rates were computed from a Bond calculation as applied to the crushing plant feed and output sizes. A comparison of the low and high energy configurations is shown in Fig. (20). Obviously the automated plant in Case B will, cost much less to construct than Case A, so automation is a n economic necessity.
We would design this plant differently today using energy parameters from the pendulum impact tests for calculations. It would only be necessary to use the Bond feed and product size calculation if no pendulum results were available.
CRUSHING FINER TO REDUCE NllLLlNG COSTS
This new high energy or power rate crushing brings a different perspective to comminution flow sheet selec- tion.
Generally, up until the early 1960's the classical flow sheet for a beneficiation plant was primary crushing followed by two stages of cone crushing in closed or open circuit, making feed for rod mills, followed by ball mills. The rod mill was needed to reduce feed size to the ball mill because crushing plant output was normally coarser than 80% passing 10,000 microns. Such feed causes power inefficiency if fed directly to a ball mill. Even though the rod mill could be a relatively ineffi- cient device for both energy and metal consumption, a s was evidenced by Bond,ll i t still made the overall circuit energy consumption more efficient.
, r
Under the right operating conditions, high power rate crushing can bring mill feed size down to near 80% passing 7,000 microns and finer, which can be handled

CASE A Low Power and Low Power Rate
(Fixed Crusher Close Slde Setting)
CASE B High Power and High Power Rate
(Automated Feed and Close Side Setting)
2.4 M x 6.1 118 Screen
8 Units 8
2134 MM '
Secondary Crushers
8 Units 6
2.4 X 6.1 hR Screen
36 Units 24
NOTES A & B Tonnage of Minus 11 WIM
3889 Product to Mill Storage
1488 All Circuit Capacities in Tonnes per Hour.
2130 MM Tertiary Crushers
28 Units 11
FIG. (20) PLANT PESIGMED USING POWER RATE ENERGY PARAMETERS SHOWING EFFECT ON MACHINE NUMBERS AND CIRCUIT TONNAGES
more efficiently by ball mills. Based on average field observations, the crushers can do this for less than half the energy and between one-tenth and one-twentieth of the metal consumed in a rod mill.
I t is, therefore, feasible to look a t designing more effi- cient single stage ball mill circuits following two stages of fine crushing. The result will be an overall reduction in total applied crushing and milling energy for the same size reduction.
Tr, make the most efficient use of both the crushing a n d grinding comminution energy, both reductions shopld be treated a s dynamic components of the same system. When the feed to the grinding mills gets coarser and/or harder and the production rate drops, the crush- ing plant feed rate should be readjusted to a lower level to maximize power rate, which will flow on a s a benefit helping to increase the mill output. Allis-Chalmers has patents granted and applied for on some such arrange- ments.
The advantages of such schemes will become more obvious when a n ore of varying hardness is fed to the crushing and milling systems.
' We will consider a n ore with a ball mill work index varying between 16 and 13, feeding into a ,single stage ball mill operation with one million kilowatts per day consumed power. For the particular mill configuration,
. a performance graph, Fig. (21), has been constructed according to Bond's methods.
Providing the crushing plant design allows for the machines to be fed continuously and the power on each crushing unit is maximized by adjusting both the feed rate and settings. The power drawn and reduction achieved to the grinding mill feed will be maximized.
The grinding mill output will vary considerably with the Work Index. If the feed size was 13,000 micrometers for the same grind production size, theoretical output from Fig. (21) would change from about 90,000 tons per day on the 13 Work Index down to 65,000 tons per day on the 16 Work Index.
Because of the superior energy efficiency of crushing over milling type processing, when the ore becomes harder in this system significant gains will be made if the feed rate to the crushing plant is reduced to closely match the mill production rate. If we consider the crush- ing plant runs a t an average of 100,000 kilowatt hours per 20-hour day, the available energy for reduction will be:
Soft ore Work Index 13 = 100~000 = 1.1 kwh/t 90,000
Hard ore Work Index 16 = 100*000 = 1.54 kwh/t 65,000
F Q ~ the purposes of this example, we will hypothesize that the the crushing index of the hard ore with the increased energy input of 1.54 kw/t reduces the ball mill

. . 18
Bond Ball Mill Work Index (Short Tons)
Ball Milling Capacity Tonnes Per Bay (000's)
FIG. (21) CHANGING GRINDING MlLL PRODUCTIVITY ACCORDING TO CHANGING WORK INDEX AND MlLL FEED SIZE USING BOND FORMULAS FOR 1 MILLION KWH PER DAY
CONSUMED POWER AT 95 PERCENT MOTOR EFFICIENCY
feed size to 6,500 micrometers. As a result, the mill out- put will increase with this reduced size to approximately 77,000 tons per day. The gain in production compared to the 13,000 micrometer feed will be:
The theoretical gain will actually be greater because the graph in Fig. (21) is constructed according to the Gates-Gaudin-Schuhmann size distribution used by Bond. We have already shown that this does not apply to crushing processes, which generate increased propor- tions of fines with higher energy input levels. As a-con-
.. .
sequence of this, the actua1,gain is likely to be closer to 25%.and the mill production increased to 65,000 x'1.25 = 81,250 tons per day.
Obviously, this will increase the capacity of the crush- ing plant and coarsen its reduction, again influencing mill output. Ideally a control system for the whole plant would balance both crushing and milling operations to maximize the benefits described.
Again, we might hypothesize that the crushing and millirig output would fluctuate between rates of 78,000 and'90,OOO tons per day instead of 65,000 and 90,000 tong per day. The advantages are obvious to all.

SUMMARY AND CONCLUSIONS
Whilst absolute concIusions cannot be drawn in every instance, the following trends and influences are clearly apparent from the Iliscuasion. Further studies in many areas are justified and are still the subject of continuing research programs.
(I) As impact crushing energy is increased, a n increas- ing proportion of finer sizes is produced. In general, the quantity of fines produced is proportional to the applied power rate (KWH/tonne).
(2) A twin pendulum impact crushirig device can gen- erate product size distributions similar to those produced in commercial cone crushing operations.
, . T
(3) By relating the net energy of pendulum crushing to the total energy in the commercial crusher;a cornl minution energy efficiency can be obtained for the commercial crusher.
(4) The breakage size distribution obtained in the pen- dulum, crushing between two flat vertical plattens, is similar to tha t produced in a cone crusher. The effects of the circular chamber and the claims by some manufacturers that there is a special and most efficient angle to the horizontal for breakage in a cone crushing chamber are not corroborated by this study of fundamentals.
(5) I t i s a claim for some designs of cone crushers that the eccentric throw has some mystical influence on the capacity and size distribution produced by a particular machine. The pendulum tests supported by field observations prove conclusively that reduc- tion and size distribution of products are simply related to the energy applied to the material. For a fixed application of power, increasing eccentric throw will reduce the force available to crush. This lowers the available power rate and, hence, the reduction ratio. The size distribution appears to be independent of the number of impacts causing this energy application.
(6) The pendulum results prove tha t the size distribu- tion produccd from crushing processes is a natural breakage pattern characteristic of the material and Lo a lesser extent the mode of breakage.
(7) The size distribution occurring in crushing processes cannclt lse described by the Gates-GaudinSchuhsnann log size versus log c~lmulative pcrecnt passing used by Rond or the Itosin.Ridn~mler relationrrhip. There ajtpenrti to be little correlation in the finer size ranges of products ncluriily occurring and those predicted by such relntionships. New mathematical cxprcrjsion~ arc! needed to definc crufilser energy N ~ Z C r~liltio~~fil~ipfi,
(8) ?'his ~ t ~ d y of fundnmentnlrr does not ~llf?port the ~tntcmc?nt of starnc crrrfiher mnnufncturars ttrnt cruult~rrt npcarrrtr: inofficicntly itt higher cnrrgy illput Icvels. 'rlie prodnctinn of conrecr ~izer; will be less cfficictr~t, tihoulrl this tic. tlic detiirc.tl product for a l,rocc.sPi ~ ~ c : f r [mu erttat~cd R ~ O T L C i>roduction, if power
rates greater than that required to maximize that coarse size are applied.
(9) Crusher power rate, which is influenced by the geometry a n d eccentric throw of the crushing chamber as we11 a s the feed size and hardness of the processed material, will determine reduction and size distribution in the crusher product. This product is related to the close side setting only if th i s i s considered to control crushing energy
. application.
(10) Automatic setting regulation a s applied to cone crushers can increase the average power drawn and maximize power rate along with reduction ratio. The phenomena can be studied with the peh- dulum impact test apparatus.
(11) Crusher productivity in quantities of a fixed size distribution is a function of power drawn a s opposed to physical machine size. From the results of the pendulum tests, it is possible to visualize a small machine drawing more power outproducing a larger machine drawing less power.
(12) Energy utilization by crushing and milling ma- chinery is different. As a general conclusion, this is particularly so with rod mills and, to a lesser extent, ball mills. High power rate crushing resulting in increased fines, can bring significant energy con- servation to comminution circuits using both forms of breakage, The pendulum test device will aliow us to quantify potential gains in the laboratory.
(13) Crushing machines consume less wear metal than grinding mills. This is especially so in the case of rod mills which compete in the fine crushing area. Because wear metal consumption is related to energy consumed to reduce material to a given size, any energy reduction using high power rate crush- ing will reduce such metal consumption. The pen- dulum impact test will give a measure of potential gain from this area'in the laboratory.
(14) Because the pendulum test can be used to predict the size distribution from cone crushers, finite cal- culations can now be made for the following parameters, some of which have often been decided by "Rules of Thumb":
(a) The number of crusher reduction stages.
(b) Number of crushing machines and their cun- nected power.
(c) Circuit loading@.
(d) Screen requirements
((3) Size distribution of plant output.
This methodology will &<vc more rtccurntP rcsults than clcsigns using wtnnclardizcd cnpnclty tnl>leti and product fiizc cii~ttlibution curvcs,
(16) The pc!nrlulum tester curl 11o t~scd to run t t ~ t r j on drill core sized tnnfcrital r_;a that p l n t ~ t drsrgnx ciln Ire nlorc accurntcly formulrit~tl frorrt gcolor:rcrrl

exploration data. Pilot plant tests, which are often impractical to run because of the lack of sufficient sample material, are not now a necessity for feasi- bility and scale-up studies.
(16) The guestimation type comparisons of flow sheets using conventional crushing and grinding processes versus autogenous milling can now be more accu- rately made. The high power rate crushing process that has been studied here is not normally part of such engineering evaluations. It can now be made so, quickly and relatively inexpensively, by using the pendulum impact device.
(17) As a result of these studies, it is postulated that the current method of running crushing plants 8t max- imum capacity through a given screen size will not minimize energy and wear metal costs in beneficia- tion plants employing downstream grinding mills. Crushing and milling circuit control systems that balance the crushing plant output to the grinding mill capacity will maximize plant capacity at the lowest production cost.
(18) Properly applied, the technology described will re- duce the magnitude of the over-design parameters used in most comminution plant design calcula- tions. This should reduce the capital costs of these plants.
We hope this discussion has contributed to a better understanding of the crushing process and how it fits into the spectrum of comminution processing machines. Hopefully, there will be contributions from other manu- . facturers and research organizations to expand on this subject.
ACKNOWLEDGEMENTS
The program that initiated research into alternative testing methods was formulated by Allis-Chalmers' Com- minution Task Force Committee, which must take credit for the development. Many people were involved over the years in the development and the following deserve special mention: D. C. Moore, who selected the equip- ment and formulated methods and procedures for its use; E. S. Burkhardt, F. P. Faulkner, C. J. Terry and K. S. Joung, all of whom were or are associated with Allis- Chalmers Corporation. We would also like to express gratitude to the many commercial operations and their employees who gave, generously, time and information to make this research program a success.
The writers would like to thank Allis-Chalmers Cor- poration for permission to publish and support in the preparation of this paper.

REFERENCES
1. Schuhmann Jr., R., "Principles of Comminution I," AIME Technical Publication 1189,1940.
2. Rosin, P. and Kammler, E., "Laws Governing the Fineness of Powered Coal," Journal of the Institute of Fuels, 7, 1933, pp. 29-36.
3. Bond, F.C., "Third Theory of Comminution," A.I.M.E. Trans., 1952, p. 193, 484; "Mining Engineering," May 1952. Allis-Chalmers publication 07R9235B.
4. Rowland Jr., C. A., "The Tools of Power, Power," presented a t the SME-AIME Fall Metting, Sept. 1-3, 1976. Allis-Chalmers presentation 22P10758.
5. Lynch, A. J., "Mineral Crushing and Grinding Cir- cuits," Developments in Mineral Processing, 1st ed., Vol. 1, Elsevier Scientific Publishing Company, P.O. Box 211, Amsterdam, The Netherlands, 1977. Page 18, Sec 2.2.3.
6. Bergstrom, B. H., Sollenberger, C. L., and Mitchell, W., Jr.. "Energy Aspects of Single Particle Crush- ing," Y'rans. AIAdE, Vol. 220, 1961, pp. 367-372.
7. Gilvarry, J. J., "Fracture of Hrittle Solids I," Jour- nal of Applied P/zjaics, Vol. 32, No. 3, pp. 391-399.
8. Arbiter, N., Harris, C. C., Stamboltzis, G. A., "Sin- gle Fracture of Brittle Spheres," S.hll.E. A.I.M.E. Trans., Vol. 224, March 1969, pp. 118-133.
9. Bond, F. C., "Crushing and Grinding Calculations," Allis-Chalmers Publication No. 07R9235B, Revised
1962 ed., Page 4. Related to private communications on this procedure.
10. Kurth, I). J . , Sundae, L. S., and Schultz, C. W., Report on Investigations No. 8068, 1975, U.S. Bureau of Mines Publication.
11. Whiten, W. J., "A Model for Simulating Crushing Plants," Journal of South African Institute of Min- ing and Metallurgy, Vol. 72, pp. 257-264 (see also Ref. 5 above, pp. 46-51).
12. Flavel, M. D., "Energy Mathematics for Crushing Applications and Systems for Optimizing Commi- nution Costs," presented to the Annual General Meeting of SME-AIME!, Las Vegas, Nevada, Feb. 24-28, 1980.
13. Szaj, A. P., "Preplanning Maintenance Prevents Plant Equipment Failures," Rock Products, March 1980, pp. 55-60.
14. Lynch, A. J., "Mineral Crushing and Grinding Cir- cuits," Deoelopnzents in Ilfinera/ Processing, 1st ed., Vol. 1 . Elsevier Scientific Publishing Company, P.O. Box 211, Amsterdam, The Netherlands, 1977, p. 240.
15. U.S. Patent No. 3,480,212 to Iindgren a1
16. Mular, A. I,., Bhappu, R. 13., editors, "Mineral Pro- cessing Plant Design," Ch 11 by Motz, J. C., "Crushing," pp. 203-238.
17. Bond, F. C.. "Action in a Kod Mill," Engztzeentlg and Mining Jourtlal, March 1960 edition.