Embed Size (px)
Citation preview

Participating Life Insurance Contracts under Risk B ased
Solvency Frameworks: How to increase Capital Effici ency
by Product Design
Andreas Reuß Institut für Finanz- und Aktuarwissenschaften
Helmholtzstraße 22, 89081 Ulm, Germany Phone: +49 731 5031251, fax: +49 731 5031239
Jochen Ruß Institut für Finanz- und Aktuarwissenschaften and Ulm University
Helmholtzstraße 22, 89081 Ulm, Germany Phone: +49 (731) 5031233, fax: +49 (731) 5031239
Jochen Wieland * Ph. D. student, Ulm University
Helmholtzstraße 22, 89081 Ulm, Germany Phone: +49 731 5031237, fax: +49 731 5031239
This version : 20 September 2013
* Corresponding author

CAPITAL EFFICIENCY AND PRODUCT DESIGN 1
Abstract
Traditional participating life insurance contracts with year-to-year (cliquet-style)
guarantees have come under pressure in the current situation of low interest rates
and volatile capital markets, in particular when valued in a market-consistent
valuation framework. Furthermore, such guarantees lead to rather high capital
requirements under risk based solvency frameworks, e.g. Solvency II.
We present several alternative product designs and analyze their impact on the
insurer’s financial situation. We also introduce a measure for “Capital Efficiency” that
considers both, profits and capital requirements, and compare the different product
designs with respect to capital efficiency in a stochastic market consistent valuation
model.
Keywords: Capital Efficiency, Participating Life Insurance, Embedded Options,
Interest Rate Guarantees, Market Consistent Valuation, Risk Based Capital
Requirements, Solvency II, SST.

CAPITAL EFFICIENCY AND PRODUCT DESIGN 1
1 Introduction
Traditional participating life insurance products play a major role in old-age provision
in Continental Europe and in many other countries. These products typically come
with a guaranteed benefit at maturity, which is calculated using some guaranteed
minimum interest rate. Furthermore the clients receive an annual surplus
participation that depends on the performance of the insurer’s assets. With so-called
cliquet-style guarantees, once such surplus has been assigned to the policy at the
end of the year, it increases the guaranteed benefit based on the same guaranteed
minimum interest rate. This product design can create significant financial risk.
Briys and de Varenne [1997] were among the first to analyze the impact of interest
rate guarantees on the insurer's risk exposure. However, they considered a simple
point-to-point guarantee where surplus (if any) is credited at maturity only. The
financial risks of cliquet-style guarantee products have later been investigated e.g. by
Grosen and Jorgensen [2000]. They introduce the “average interest principle”, where
the insurer aims to smooth future bonus distributions by using a bonus reserve as an
additional buffer besides the policy reserve (the customer’s account). Besides valuing
the contract they also calculate default probabilities (however under the risk-neutral
probability measure ). Grosen et al. [2001] extend the model of Grosen and
Jorgensen [2000], and introduce mortality risk. Grosen and Jorgensen [2002] modify
the model used by Briys and de Varenne [1997] by incorporating a regulatory
constraint for the insurer’s assets and analyzing the consequences for the insurer’s
risk policy.

CAPITAL EFFICIENCY AND PRODUCT DESIGN 2
Mitersen and Persson [2003] analyze a different cliquet-style guarantee framework
with so-called terminal bonuses whereas Bauer et al. [2006] specifically investigate
the valuation of participating contracts under the German regulatory framework.
While all this work focuses on the risk-neutral valuation of life insurance contracts
(sometimes referred to as “financial approach”), Kling et al. [2007a] and Kling et al.
[2007b] concentrate on the risk a contract imposes on the insurer (sometimes
referred to as “actuarial approach”) by means of shortfall probabilities under the real-
world probability measure .
Barbarin and Devolder [2005] introduce a methodology that allows for combining the
financial and actuarial approach. They consider a contract similar to Briys and de
Varenne [1997] with a point-to-point guarantee and terminal surplus participation. To
integrate both approaches, they use a two-step method of pricing life insurance
contracts: First, they determine a guaranteed interest rate such that certain
regulatory requirements are satisfied, using value at risk and expected shortfall risk
measures. Second, to obtain fair contracts, they use risk-neutral valuation and adjust
the participation in terminal surplus accordingly. Based on this methodology, Gatzert
and Kling [2007] investigate parameter combinations that yield fair contracts and
analyze the risk implied by fair contracts for various insurance contract models.
Gatzert [2008] extends this approach by introducing the concept of “risk pricing”
using the “fair value of default” to determine contracts with the same risk exposure.
Graf et al. [2011] (also building on Barbarin and Devolder [2005]) derive the risk
minimizing asset allocation for fair contracts using different risk measures like the
shortfall probability or the relative expected shortfall.
Under risk based solvency frameworks such as Solvency II and Swiss Solvency Test
(SST), the risk analysis of interest rate guarantees becomes even more important.

CAPITAL EFFICIENCY AND PRODUCT DESIGN 3
Under these frameworks, the capital requirement is derived from a market-consistent
valuation considering the risk an insurer takes. This risk is particularly high for long
term contracts with a year-to-year guarantee based on a fixed (i.e. not path
dependent) guaranteed interest rate. Measuring and analyzing the financial risk in
relation to the required capital, and analyzing new risk figures such as the Time
Value of Options and Guarantees (TVOG) is a relatively new aspect which gains
importance with new solvability frameworks. E.g. the largest German insurance
company (Allianz) announced in a press conference on June 25, 20131 the
introduction of a new participating life insurance product that fundamentally modifies
the type of interest rate guarantee (in a similar way as we do in the remainder of this
paper). It was stressed that the TVOG is significantly reduced for the new product.
Also, it was mentioned that the increase of the TVOG resulting from an interest rate
shock (i.e. the solvency capital requirement for interest rate risk) is reduced by 80%
when compared to the previous product. This is consistent with the findings of this
paper.
The aim of this paper is a comprehensive risk analysis of different participating life
insurance products. Currently, there is an ongoing discussion, whether and how
models assessing the insurer’s risk should be modified to reduce the capital
requirements (i.e. by introducing an “ultimate forward rate” set by the regulator). We
will in contrast analyze how (for a given model) the insurer’s risk and hence capital
requirement can be influenced by product design. Since traditional cliquet-style
participating life insurance products lead to very high capital requirements, we will
introduce products with modified types of guarantees which reduce the insurer’s risk,
1 Cf. “Allianz Capital Markets Day” presentation on June 25, 2013: Allianz [2013], particularly slide D24.
CAPITAL EFFICIENCY AND PRODUCT DESIGN 4
profit volatility, as well as the capital requirements under risk based solvency
frameworks. In order to compare different product designs from an insurer’s
perspective, we develop and discuss the concept of “Capital Efficiency” which relates
profit to capital requirements. We identify the key drivers of capital efficiency which
are then used in our analyses to assess different product designs.
The remainder of this paper is structured as follows:
In Section 2, we present the three considered products that all come with the same
level of guaranteed maturity benefit but with different types of guarantee:
• Traditional product: a traditional contract with a cliquet-style guarantee based
on a guaranteed interest rate >0,
• Alternative product 1: a contract with the same guaranteed maturity benefit
that is valid only at maturity; additionally, there is a 0% year-to-year guarantee
on the account value,
• Alternative product 2: a contract with the same guaranteed maturity benefit
that is valid only at maturity but no other guarantee; this means that the
account value may decrease in some years.
In spite of the different types of guarantees, all the products include a surplus
participation depending on the insurer’s return on assets. Our model is based on the
surplus participation requirements given by German regulation. That means in
particular that each year at least 90% of the (book value) investment return has to be
distributed to the policyholders.
To illustrate the mechanics, we will illustrate the different products under different
deterministic scenarios. This shows the differences in product design and how they
affect the insurer’s risk.

CAPITAL EFFICIENCY AND PRODUCT DESIGN 5
In Section 3, we introduce our stochastic model which is based on a standard
financial market model: The stock return and short rate processes are modeled using
a correlated Black-Scholes and Vasicek model.2 We then describe how the evolution
of the insurance portfolio and the insurer’s balance sheet are simulated in our asset-
liability-model. The considered asset allocation consists of bonds with different
maturities and stocks. The model also reflects management rules.
Furthermore, we introduce a measure for capital efficiency based on currently
discussed solvency regulations such as the Solvency II framework. We also propose
a more tractable measure for an assessment of the key drivers of capital efficiency.
In Section 4, we present the numerical results. We show that the alternative products
are significantly more capital efficient: financial risk and therefore also capital
requirement is significantly reduced, although in most scenarios all products provide
the same maturity benefit to the policyholder. The asymmetry, i.e. particularly the
heavy left tail of the insurer’s profit distribution is reduced by the modified products.
This leads to a significant reduction of both, the TVOG and the solvency capital
requirement for interest rate risk.
Section 5 concludes and provides an outlook on further research.
2 Considered products
In this section, we describe the three different participating life insurance products
that we will analyze in what follows. Note that for the sake of simplicity, we assume
for all three products that in case of death of the policyholder in year , the current
account value (defined below) is paid at the end of year but no additional death
2 The correlated Black-Scholes and Vasicek model is applied in Zaglauer and Bauer [2008] and Bauer et al. [2012] in a similar way.

CAPITAL EFFICIENCY AND PRODUCT DESIGN 6
benefit is provided. This allows us to ignore mortality for the calculation of premiums
and actuarial reserves. Similarly, we assume that the surrender value is equal to the
account value.
2.1 The traditional product
First, we consider a traditional participating life insurance contract with a cliquet-style
guarantee. It provides a guaranteed benefit at maturity based on annual premium
payments . The pricing is based on a constant interest rate and reflects annual
charges . Based on the actuarial equivalence principle3, the relation between the
annual premium and the guaranteed benefit is given by
∑ · 1 During the lifetime of the contract, the insurer has to build up sufficient actuarial
reserves for the guaranteed benefit at maturity. For the traditional product, at any
time , the same constant interest rate is applied to calculate the (prospective)
actuarial reserve, i.e.
·
∑ ·
.
The development of the actuarial reserves is then given by:
· 1 . Traditional participating life insurance contracts typically include an annual surplus
participation that depends on the performance of the insurer’s assets. For example,
German regulation requires that at least ! 90% of the (local GAAP book value)
earnings on the insurer’s assets have to be credited to the policyholders’ accounts.
For the traditional product, any surplus assigned to a contract immediately increases
3 For the concept of equivalence principle, see e.g. Saxer [1955], Wolthuis [1994].

CAPITAL EFFICIENCY AND PRODUCT DESIGN 7
the guaranteed benefit based on the same interest rate . More precisely, the surplus
% is credited to a bonus reserve account & (where & 0 and the interest rate
will also apply each year on the bonus reserve:
& & · 1 %.
The client’s account value consists of the sum of the actuarial reserve and
the bonus reserve &; the maturity benefit is equal to .
In this setting, is a year-to-year minimum guaranteed interest rate, i.e. (in book
value terms) at least this rate has to be earned each year on the assets backing the
account value. Therefore, such contracts contain an optionality that is often referred
to as asymmetry: If the asset return is above , a large part (e.g. 90%) of the return is
credited to the client as a surplus and the shareholders receive only a small portion
(e.g. 10%) of the return. If, on the other hand, the asset returns are below , then
100% of the shortfall has to be compensated by the shareholder. Additionally, if the
insurer earns a high return on assets and hence distributes a high surplus, this
increases the insurer’s future risk since the rate has to be earned on this surplus
amount in subsequent years. Such products constitute a significant financial risk to
the insurance company, in particular in a framework of low interest rates and volatile
capital markets.4
The mechanics of this year-to-year guarantee is illustrated in Figure 2-1 for two
exemplary scenarios. We consider a traditional policy with term to maturity 20
years and a guaranteed benefit of 20,000 €. Following the current situation in
Germany, we let 1.75% and assume a surplus participation rate of ! 90% on
the asset returns.
4 This was also a key result of the QIS5 final report preparing for Solvency II, cf. EIOPA [2013a] and BaFin [2013].

CAPITAL EFFICIENCY AND PRODUCT DESIGN 8
The first scenario is not critical for the insurer. The asset return (which is arbitrarily
assumed for illustrative purposes) starts at 3%, then over time drops to 2% and
increases back to 3%. The chart shows this asset return, the “client’s yield” (i.e. the
interest credited to the client’s account including surplus), the “required yield” (which
is defined as the minimum rate that has to be credited to the client’s account), and
the insurer’s yield (which is the portion of the surplus that goes to the shareholder).
Obviously, in this simple example, the client’s yield always amounts to 90% of the
asset return and the insurer’s yield always amounts to 10% of the asset return. By
definition, for this product design, the required yield is constant and always coincides
with 1.75%.
In the second scenario, we let the asset return drop all the way down to 1%.
Whenever 90% of the asset return would be less than the required yield, the insurer
has to credit the required yield to the account value. This happens at the
shareholder’s expense, i.e. the insurer’s yield is reduced and even becomes
negative. This means that a shortfall occurs and the insurer has to provide additional
funds.
Figure 2-1: Two exemplary scenarios for the traditi onal product: asset returns and yield distribution
It is worthwhile noting that in this traditional product design, the interest rate plays
three different roles:

CAPITAL EFFICIENCY AND PRODUCT DESIGN 9
• pricing interest rate , used for determining the ratio between the premium
and the guaranteed maturity benefit,
• reserving interest rate -, i.e. technical interest rate used for the calculation of
the prospective actuarial reserves,
• year-to-year minimum guaranteed interest rate ., i.e. a minimum return on the
account value.
2.2 Alternative products
We will now introduce two alternative product designs which are based on the idea to
allow different values for the pricing rate, the reserving rate and the year-to-year
minimum guaranteed interest rate on the account value. This leads to the following
formulae for the relation between the annual premium and the guaranteed benefit
and the actuarial reserves:
∑ · /1 ,0
· 1
∑ · 1
Note, that in the first years of the contract, negative values for are possible in
case of , 2 -, which implies a “financial buffer” at the beginning of the contract.
The year-to-year minimum guaranteed interest rate . is not relevant for the formulae
above, but it is simply a restriction for the development of the client’s account, i.e.
3 · /1 .0,
where 4567, 08 is the initial account value of the contract.
The crucial difference between such new participating products and traditional
participating products is that the guaranteed maturity benefit is not increased during
the lifetime of the contract. Note, however, that the prospective reserve in this

CAPITAL EFFICIENCY AND PRODUCT DESIGN 10
setting is only a minimum reserve for the guaranteed maturity benefit: If at any time
this minimum reserve exceeds the account value, then the account value has to be
increased to the minimum reserve, i.e. it always holds that 3 . Under “normal”
circumstances (i.e. whenever the account value exceeds the minimum reserve), the
technical reserve (under local GAAP) coincides with the account value and exceeds
the minimum reserve; note that the surrender value is equal to the account value and
the technical reserve may not be below the surrender value.
The required yield on the account value in year is equal to
9 456 : ;<=7>?@,8>A@BCDE@BC 1, .F . (1)
Within the maximum function in (1), the first condition assures that the account value
is non-negative and never lower than the actuarial reserve. The required yield
decreases if the bonus reserve (which is included in ) increases; in this sense,
the bonus reserve acts as a “financial buffer” which reduces future yield
requirements. The second condition simply makes sure that the year-to-year
minimum guaranteed interest rate is always credited. Depending on the choice of .,
the account value may increase with a lower rate than the technical rate -, or even
decrease if . 2 0.
The surplus participation rules remain unchanged: the policyholder’s share ! (e.g.
90%) of the asset return is credited to the policyholders (but not less than 9). Hence,
as long as the policyholder’s share is above the technical interest rate used in the
traditional product, there is no difference between the traditional and the alternative
product designs. Only in years with an adverse capital market development, the yield
on the account value may be reduced if the required yield 9 allows for it.

CAPITAL EFFICIENCY AND PRODUCT DESIGN 11
Obviously, only combinations fulfilling . G , G - result in suitable products. If the
first inequality is violated, then the year-to-year minimum guaranteed interest rate
results in a higher guaranteed maturity benefit than intended by the pricing rate. If the
second inequality is violated then at outset of the contract, additional reserves
(exceeding the first premium) are required.
In what follows, we will consider two concrete alternative product designs. Obviously,
the choice of . fundamentally changes the mechanics of the guarantee embedded in
the product (or the “type” of guarantee), whereas the choice of , changes the level of
the guarantee. Since we want to focus on the effect of the different guarantee
mechanisms, we use a pricing rate that coincides with the technical rate from the
traditional product. Hence the guaranteed maturity benefit remains unchanged. Since
the legally prescribed maximum value for the reserving rate also coincides with the
technical rate from the traditional product, we get , - 1.75%.
In our alternative product 1, we set . 0% (0% year-to-year guarantee) and for
alternative 2 we set . 100% (no year-to-year guarantee). In order to illustrate the
mechanics of the alternative products, Figure 2-2 and Figure 2-3 show the two
scenarios from Figure 2-1 for both alternative products. In the first scenario (shown
on the left) the required yield 9 on the account value gradually decreases to zero for
both alternative product designs because buffers (in the sense described above) are
created. For alternative 1, the required yield decreases to zero and stays there, while
for the alternative 2 it even becomes negative after some years.
The adverse scenario on the right shows that the required yield rises again after
years with low asset returns since the buffer is reduced. However, contrary to the
traditional product, the asset return stays above the required level and no shortfall
occurs.

CAPITAL EFFICIENCY AND PRODUCT DESIGN 12
From a policyholder’s perspective, both alternative product designs provide the same
maturity benefit as the traditional product design in the first scenario. This is due to
the fact that the asset return (and therefore the client’s yield) is always above 1.75%.
In the second scenario, however, the maturity benefit is slightly lower for both
alternative product designs since (part of) the buffer built up in years 1 to 8 can be
used to avoid a shortfall. In this scenario, there is no difference between the two
alternative products for the policyholder, because the asset return (and therefore the
client’s yield) is always positive.
Figure 2-2: Two exemplary scenarios for alternative 1: asset returns and yield distribution.
Figure 2-3: Two exemplary scenarios for alternative 2: asset returns and yield distribution.
Even if scenarios where the policyholder’s benefit for the alternative product designs
is smaller than for the traditional design appear unlikely, the difference in the product
design has a significant impact on the insurer’s solvency requirements since the
financial risks particularly in adverse scenarios are a key driver for the solvency

CAPITAL EFFICIENCY AND PRODUCT DESIGN 13
capital requirement. This will be considered in a stochastic framework in the following
sections.
3 Stochastic modeling and analyzed key figures
Since surplus participation is typically based on local GAAP book values (in particular
in Continental Europe), we use a stochastic balance sheet and cash flow projection
model for the analysis of the alternative product designs presented in the previous
section. The model includes management rules concerning asset allocation,
reinvestment strategy, handling of unrealized gains and losses and surplus
distribution. It allows us to derive key figures for the comparison of the considered
products with respect to profitability and capital requirements. Since the focus of the
paper is on the valuation of future profits and capital requirements we will introduce
the model under a risk-neutral measure. Similar models have been used (also in a
real-world framework) in Kling et al. [2007a], Kling et al. [2007b] and Graf et al.
[2011].
3.1 The financial market model
We apply a financial market model where the insurer’s assets are invested in a
portfolio consisting of coupon bonds and stocks. We treat both assets as risky assets
in a risk-neutral, frictionless and continuous financial market. Additionally, cash flows
during the year are invested in a riskless bank account (until assets are reallocated).
We let the short rate process H follow a Vasicek model, and the stock price I follows
a geometric Brownian motion described by
JH KL HJ M-JN and
OP@P@
HJ QMPJN R1 QSMPJN
S,

CAPITAL EFFICIENCY AND PRODUCT DESIGN 14
where N and N
S each denote a Wiener process on some probability space
Ω, U, with a risk-neutral measure and a filtration U, to which N and N
S are
adapted. The parameters K, L, M-, MP and Q are deterministic and constant. For the
purpose of performing Monte Carlo simulations the stochastic differential equations
can be solved to
I I · V6! W HXJY Z[\S W QMPJNX
W R1 QSMPJNX
S and
H V] · H L1 V] ^ M- · V]XJNX
,
where I 1 and the initial short rate H is a deterministic parameter. Then, the bank
account is given by & exp W HXJY . It can be shown that the four (stochastic)
integrals in the formulae above follow a joint normal distribution5. Monte Carlo paths
are calculated using random realizations of this multidimensional distribution. The
yield curve is then given by6
H% V6! bc deBfg
] H % eBfg] · L Z1\
S]\ eBfg] S Z1\
h]ij 1
for any time and term % k . Based on the yield curves, we calculate par yields that
determine the coupon rates of the considered coupon bonds.
3.2 The asset-liability model
The insurer’s simplified balance sheet at time is given by Table 3-1.
5 Cf. Zaglauer and Bauer [2008]. A comprehensive explanation of this property is included in Bergmann [2011].
6 See Seyboth [2011] as well as Branger and Schlag [2004].

CAPITAL EFFICIENCY AND PRODUCT DESIGN 15
Assets Liabilities
&P l &m
Table 3-1: Balance sheet at time n.
On the liability side, we consider the account value of the insurance contracts as
defined in section 2. Since the analysis is performed for a specific portfolio of
insurance contracts on a stand-alone basis, there is no explicit allowance for
shareholder’s equity or other reserves on the liability side. Further, we do not
consider new business. l denotes the profit or loss of the shareholders in year t,
with corresponding cash flow at the beginning of the next year.
In our projection of the assets and insurance contracts, incoming cash flows
(premium payments at the beginning of the year, coupon payments and repayment of
nominal at the end of the year) and outgoing cash flows (expenses at the beginning
of the year and benefit payments at the end of the year) occur. In each simulation
path, cash flows occurring at the beginning of the year are invested in a bank
account. At the end of the year, the market values of the stocks and coupon bonds
are derived and the asset allocation is readjusted according to a rebalancing strategy
with a constant stock ratio of o based on market values. Conversely, 1 o is
invested in bonds and any money on the bank account is withdrawn and invested in
the portfolio consisting of stocks and bonds.
If in the process of rebalancing bonds need to be bought, the amount is fully invested
into newly issued coupon bonds yielding at par with a given term p. However,
towards the end of the projection, when the insurance contracts’ remaining term is
less than p years, we invest in bonds with a term that coincides with the longest
remaining term of the insurance contracts. If bonds need to be sold, they are sold

CAPITAL EFFICIENCY AND PRODUCT DESIGN 16
proportionally to the market values of the different remaining terms in the existing
portfolio.
With respect to accounting, we use book-value accounting rules following German
GAAP: Coupon bonds are considered as held to maturity and their book value &m is
always given by their nominal amounts (irrespective if the market value is higher or
lower). In contrast, for the book value of the stocks &P, the insurer has some
discretion. This may result in unrealized gains or losses (UGL).
Of course, interest rate movements as well as the rebalancing will cause fluctuations
with respect to the UGL of bonds. Also, the rebalancing may lead to the realization of
UGL of stocks. In addition, we assume an additional management rule with respect
to UGL of stocks: We assume that the insurer wants to create rather stable book
value returns (and hence surplus distributions) in order to signal stability to the
market. We therefore assume that a ratio J,qc of the UGL of stocks is realized
annually if unrealized gains exist and a ratio Jre. of the UGL is realized annually if
unrealized losses exist. In particular, Jre. 100% has to be chosen in a legal
framework where unrealized losses on stocks are not possible.
Based on this model, the total asset return on a book value basis can be calculated
in each simulation path each year as the sum of coupon payments from bonds,
interest payments on the bank account and the realization of UGL. The split between
policyholders and shareholders is driven by the parameter ! explained in section 2
which describes the minimum portion of the asset return that has to be credited to the
policyholders. If the cumulative required yield on the account values of all
policyholders is larger than this share, there is no surplus for the policyholders, and
exactly the required yield 9 is credited to every account. Otherwise, surplus is
credited to the policies which amounts to the difference between the policyholders’

CAPITAL EFFICIENCY AND PRODUCT DESIGN 17
share of the asset return and the cumulative required yield. As this is the typical
practice e.g. in Germany, we assume that this surplus is distributed among the
policyholders such that all policyholders receive the same total yield (defined by the
required yield plus surplus rate), if possible. To achieve that, we apply an algorithm
that sorts the accounts by required yield, i.e. 9, … , 9
, t u v in ascending order.
First, all contracts receive their respective required yield. Then the available surplus
is distributed: Starting with the contract(s) with the lowest required yield 9, the
algorithm distributes the available surplus to all these contracts until the gap to the
next required yield 9S is filled. Then all the contracts with a required yield lower or
equal to 9S receive an equal amount of (relative) surplus until the gap to 9
w is
filled, etc. This is continued until the entire surplus is distributed. The result is that all
contracts receive the same total yield if this unique total yield exceeds the required
yield of all contracts. Otherwise, all contracts with a required yield above some
threshold receive exactly their required yield and all contracts with a required yield
below that threshold receive an identical total yield that exceeds the respective
contracts’ required yield (i.e. they receive some surplus) but is lower than the
threshold value.
From this, the insurer’s profit l results as the difference between the total asset
return and the amount credited to all policyholder accounts. If the profit is negative, a
shortfall has occurred which we assume to be compensated by a corresponding
capital inflow (e.g. from the insurer’s shareholders) at the beginning of the next year.7
7 We do not consider the shareholders’ default put option resulting from their limited liability, which is in line with both Solvency II valuation standards and the market consistent embedded value framework (MCEV), cf. e.g. Bauer et al. [2012] or DAV [2011], section 5.3.4.

CAPITAL EFFICIENCY AND PRODUCT DESIGN 18
Balance sheet and cash flows are projected over x years until the run-off of the in-
force portfolio at time zero.
3.3 Key drivers for capital efficiency
The term capital efficiency is frequently used in an intuitive sense, in particular
amongst practitioners, to describe the feasibility, profitability, capital requirement, and
riskiness of products under risk based solvency frameworks such as Solvency II (to
be introduced in the European Union) or Swiss Solvency Test (SST, already in place
in Switzerland). However, to the best of our knowledge, no formal definition of this
term exists. Also, there is probably no unique correct definition of this term.
Nevertheless, it seems obvious, that capital requirement alone is not a suitable figure
for managing a product portfolio from an insurer’s perspective. Rather, capital
requirement and the resulting cost of capital should be considered in relation to
profitability.
Therefore, a suitable measure of “Capital Efficiency” could be some ratio of
profitability and capital requirement, e.g. based on the distribution of the random
variable
∑ l&y
∑ z · zz&y
The numerator represents the present value of the insurer’s future profits, whereas
the denominator is equal to the present value of future cost of capital. z denotes
the required capital at time under some risk based solvency framework, i.e. the
amount of shareholder’s equity needed to support the business in force. The cost of
capital is derived by applying the cost of capital rate zz for year on the required
CAPITAL EFFICIENCY AND PRODUCT DESIGN 19
capital at the beginning of the year.8 In practical applications, however, the
distribution of this ratio might not be easy to calculate. Therefore, moments of this
distribution, a separate analysis of (moments of) the numerator and the denominator
or even just an analysis of key drivers on that ratio might have to do as a proxy.
In this spirit, we will use a Monte Carlo framework to calculate the following key
figures using the model described above:
A typical market consistent measure for the insurer’s profitability is the expected
present value of future profits (PVFP)9, which corresponds to the expected value of
the numerator. The PVFP is estimated based on Monte Carlo simulations:
| ∑ ∑ ~@
m@yr ,
where is the number of scenarios, lr denotes the insurer’s profit/loss in year in
scenario , and &r is the value of the bank account after years in scenario .
In addition, the degree of asymmetry of the shareholder’s cash flows can be
characterized by the distribution of the PVFP over all scenarios10 and by the time
value of options and guarantees (TVOG). Under the MCEV framework11, the latter is
defined by
| |
where | ∑ ~@m@y is the present value of future profits in the so-called
“certainty equivalent (CE)” scenario. This deterministic scenario reflects the
expected development of the capital market under the risk-neutral measure. It can be
8 This approach is similar to the calculation of the cost of residual nonhedgeable risk (CRNHR) as introduced in the MCEV Principles in CFO-Forum [2009], although z reflects the total capital requirement including hedgeable risks.
9 The concept of PVFP is introduced as part of the MCEV Principles in CFO-Forum [2009].
10 Note that this is a distribution under the risk-neutral measure and has to be interpreted carefully. However, it can be useful for explaining differences between products regarding PVFP and TVOG. 11 Cf. CFO-Forum [2009].

CAPITAL EFFICIENCY AND PRODUCT DESIGN 20
derived from the initial yield curve H%12 based on the assumption that all assets
earn the forward rate implied by the initial yield curve. The TVOG is also used as an
indicator for capital requirement under risk-based solvency frameworks.
Comparing the expected PVFP between two different interest rate levels – one that
we call basic level and a significant lower one that we call stress level – provides
another important key figure for interest rate risk and capital requirements. As a key
driver for the denominator, we therefore consider
Δ| |5%% |%HV%%
which can be interpreted as a proxy for the solvency capital requirement (SCR) for
interest rate risk in the standard formula13 of the Solvency II framework.
4 Results
4.1 Assumptions
The stochastic valuation model described in the previous section is applied to a
portfolio of participating contracts with product parameters as given in Table 4-1. For
simplicity, we assume that all policyholders are 40 years old at inception of the
contract and mortality is based on the German standard mortality table (DAV 2008
T). Furthermore, we assume annual charges that are typical in the German market
consisting of annual administration charges · throughout the contract’s lifetime,
and acquisition charges · · which are equally distributed over the first 5 years of
the contract. Hence, the charge function is given by · · ·D u7,…,h8. Other
product parameters are given in Table 4-1.
12 Cf. Oechslin et al. [2007]. 13 A description of the current version of the standard formula can be found in EIOPA [2013b].

CAPITAL EFFICIENCY AND PRODUCT DESIGN 21
, / - / .
Traditional Product:
1.75% / 1.75% / 1.75%
Alternative 1:
1.75% / 1.75% / 0%
Alternative 2:
1.75% / 1.75% / -100%
20,000 € 20 years 3% 4%
Table 4-1: Product parameters
Stochastic projections are performed for a portfolio that was built up in the past (i.e.
before 0) over 20 years based on 1,000 new policies per year. Hence, we have a
homogeneous portfolio at the beginning of the projections with time to maturity
between 1 year and 19 years (i.e. the projection horizon is x 19 years). For each
contract, the account value at 0 is derived from a projection in a (historic)
certainty equivalent scenario (using parameters described below). In line with the
valuation approach under Solvency II and MCEV, we do not consider new business.
The book value of the asset portfolio at 0 coincides with the book value of
liabilities. We assume a stock ratio of o 5% with unrealized gains on stocks at 0
equal to 10% of the book value of stocks. The coupon bond portfolio consists of
bonds with a uniform coupon of 3.0% where the time to maturity is equally split
between 1 year and p 10 years.
Capital market parameters for the basic and stress projections are shown in Table
4-2. The parameters K, M-, MP and Q are directly adopted from Graf et al. [2011]. The
parameters L and H are chosen such that they are more in line with the current low
interest rate level. The capital market stress corresponds to an immediate drop of
interest rates by 100 basis points.
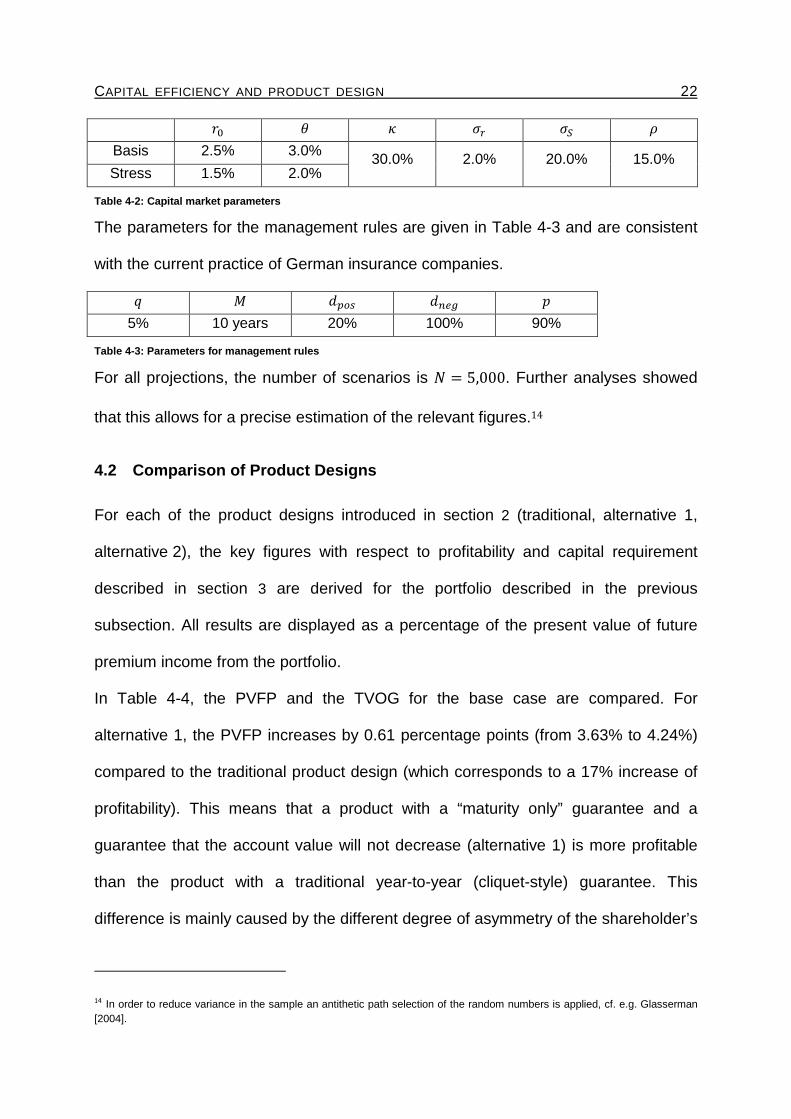
CAPITAL EFFICIENCY AND PRODUCT DESIGN 22
H L K M- MP Q
Basis 2.5% 3.0% 30.0% 2.0% 20.0% 15.0% Stress 1.5% 2.0%
Table 4-2: Capital market parameters
The parameters for the management rules are given in Table 4-3 and are consistent
with the current practice of German insurance companies.
o p J,qc Jre. !
5% 10 years 20% 100% 90%
Table 4-3: Parameters for management rules
For all projections, the number of scenarios is 5,000. Further analyses showed
that this allows for a precise estimation of the relevant figures.14
4.2 Comparison of Product Designs
For each of the product designs introduced in section 2 (traditional, alternative 1,
alternative 2), the key figures with respect to profitability and capital requirement
described in section 3 are derived for the portfolio described in the previous
subsection. All results are displayed as a percentage of the present value of future
premium income from the portfolio.
In Table 4-4, the PVFP and the TVOG for the base case are compared. For
alternative 1, the PVFP increases by 0.61 percentage points (from 3.63% to 4.24%)
compared to the traditional product design (which corresponds to a 17% increase of
profitability). This means that a product with a “maturity only” guarantee and a
guarantee that the account value will not decrease (alternative 1) is more profitable
than the product with a traditional year-to-year (cliquet-style) guarantee. This
difference is mainly caused by the different degree of asymmetry of the shareholder’s
14 In order to reduce variance in the sample an antithetic path selection of the random numbers is applied, cf. e.g. Glasserman [2004].

CAPITAL EFFICIENCY AND PRODUCT DESIGN 23
cash flows which is characterized by the time value of options and guarantees. Since
the | (from the “certainty equivalent” scenario) is equal to 4.26% for all
products in the base case, the difference of TVOG between the traditional product
and alternative 1 is also 0.61 percentage points. This corresponds to a TVOG
reduction of approx. 90% for alternative 1, which shows that the risk resulting from
the interest rate guarantee is much lower for the modified product.
Compared to this, the differences between alternative 1 and alternative 2 are almost
negligible in the considered setup. The additional increase of the expected PVFP is
only 0.01 percentage points which is due to a slightly lower TVOG compared to
alternative 1. This shows that the fact that the account value may decrease in some
years in product alternative 2 does not provide a material additional risk reduction.
Traditional product Alternative 1 Alternative 2
| 3.63% 4.24% 4.25%
0.63% 0.02% 0.01%
Table 4-4: PVFP and TVOG for base case (as percenta ge of the present value of premium income).
Additional insights can be obtained by analyzing the distribution of the PVFP (see
Figure 4-1)15: For the traditional product design, the distribution is highly asymmetric
with a strong left tail and a significant risk of negative shareholder cash flows (on a
present value basis). In contrast, both alternative product designs exhibit an almost
symmetric distribution of shareholder cash flows which explains the low TVOG.
Hence, the new products result in a significantly more stable profit perspective for the
shareholders, while for the traditional product the shareholder is exposed to
significantly higher shortfall risk.
15 Note that this is a distribution under the risk-neutral measure and has to be interpreted carefully. However, it is useful for explaining differences between products regarding PVFP and TVOG.

CAPITAL EFFICIENCY AND PRODUCT DESIGN 24
Figure 4-1: Histogram of PVFP in base case.
Ultimately, the results described above can be traced back to differences in the
required yield. A percentile plot of the required yield is shown in Figure 4-2. While for
the traditional product, by definition, the required yield always amounts to 1.75%, it is
equal to 0% in most scenarios for the alternative 1 product. Only in the most adverse
scenarios, the required yield rises towards 1.75%. The required yield in the first
projection year reflects the financial buffer available for the considered portfolio of
existing contracts at 0. 16
Figure 4-2: Percentile plots of required yield for traditional and alternative 1 product.
16 This is different from the illustrations in section 2 which consider individual contracts from inception to maturity.

CAPITAL EFFICIENCY AND PRODUCT DESIGN 25
Apart from the higher profitability, the alternative product designs also imply a lower
capital requirement for interest rate risk. This is illustrated in Table 4-5 which displays
the expected PVFP under the interest rate stress and the difference to the basic
level. Compared to the basic level, the PVFP for the traditional product decreases by
75% which corresponds to an SCR for interest rate risk of 2.73% of the present value
of future premiums. In contrast, the PVFP decreases by only around 40% for the
alternative product designs and thus the capital requirement is only 1.66% and
1.65%, respectively.
Traditional product Alternative 1 Alternative 2
|5%% 3.63% 4.24% 4.25%
|%HV%% 0.90% 2.58% 2.60%
Δ| 2.73% 1.66% 1.65%
Table 4-5: PVFP for stress setup and PVFP differenc e between basic and stress level.
We have seen that a change in the type of guarantee results in a significant increase
of the PVFP. This raises the question by what amount the level of guarantee in the
traditional product setting needs to be reduced in order to achieve the same PVFP.
Our analyses show that a traditional product with guaranteed interest rate 0.9%
instead of 1.75% has the same expected PVFP (i.e. 4.25%) as the alternative
product designs with , 1.75%. Hence, although changing only the type of
guarantee and leaving the level of guarantee intact might be perceived as a rather
small product modification by the policyholder, it has the same effect on the insurer’s
profitability as reducing the level of guarantee by a significant amount.
Furthermore, our results indicate that even in an adverse capital market situation the
alternative product designs may still provide an acceptable level of profitability: The
profitability of the modified products if interest rates are reduced by 50 bps roughly
coincides with the profitability of the traditional product in the base case. This again

CAPITAL EFFICIENCY AND PRODUCT DESIGN 26
shows that the alternative product designs are more capital efficient than the
traditional product design.
4.3 Sensitivity Analyses
In order to assess the robustness of the results presented in the previous section, we
investigate three different sensitivities:
1. Lower interest rate level (-100 bps): The long term average L and initial rate H
in Table 4-2 are replaced by L 2.0%, H 1.5% for the basic level, and
L 1.0%, H 0.5% for the stress level.
2. More risky asset allocation: The stock ratio is set to o 10% instead of 5%.
3. Higher initial buffer: The initial bonus reserve & is doubled for
all contracts17.
The results are given in Table 4-6.
If the assumed basic interest rate level is lowered by 100 bps, the PVFP decreases
and the TVOG increases significantly for all products. In particular, the alternative
product designs now also exhibit a significant TVOG. This shows that in an adverse
capital market situation, also the guarantees embedded in the alternative product
designs can lead to a significant shortfall risk for the shareholder and an asymmetric
distribution of profits as illustrated in Figure 4-3. Nevertheless, the alternative product
designs are still much more profitable and less volatile than the traditional product
design and the changes in PVFP / TVOG are much less pronounced than for the
traditional product: while the PVFP is reduced from 3.63% to 0.90%, i.e. by 2.73
percentage points for the traditional product, it is only reduced by 1.66 percentage
points (from 4.24% to 2.58%) for alternative 1.
17 The initial book values of the assets are increased proportionally to cover this additional reserve.

CAPITAL EFFICIENCY AND PRODUCT DESIGN 27
Base case Traditional product
Alternative 1 Alternative 2
3.63% 4.24% 4.25%
0.63% 0.02% 0.01%
n 0.90% 2.58% 2.60%
2.73% 1.66% 1.65%
Interest rate sensitivity
0.90% 2.58% 2.60%
2.13% 0.78% 0.76%
n -4.66% -1.81% -1.76%
5.56% 4.39% 4.36%
Stock ratio sensitivity
1.80% 3.83% 3.99%
2.45% 0.43% 0.26%
n -1.43% 1.65% 1.92%
3.23% 2.18% 2.07%
Initial buffer sensitivity
3.74% 4.39% 4.39%
0.64% <0.01% <0.01%
n 1.02% 2.87% 2.91%
2.72% 1.52% 1.48%
Table 4-6: PVFP, TVOG, PVFP under interest rate str ess and for base case and all sensitivities.
As expected, in the interest rate level sensitivity, an additional interest rate stress
results in higher changes of PVFP. For all product designs, the PVFP after stress is
negative and the capital requirement increases significantly. However, as in the base
case (cf. Table 4-5), the SCR for the traditional product is more than one percentage
point larger than for the new products.

CAPITAL EFFICIENCY AND PRODUCT DESIGN 28
Figure 4-3: Histogram of PVFP for projection with i nterest rate sensitivity (-100bps).
The stock ratio sensitivity also leads to a decrease of PVFP and an increase of
TVOG for all products. Again, the effect on the PVFP of the traditional product is
much stronger: The profit is about cut in half (from 3.63% to 1.80%), while for the
alternative 1 product the reduction is much smaller (from 4.24% to 3.83%), and even
smaller for alternative 2 (from 4.25% to 3.99%). It is noteworthy that with a larger
stock ratio of o 10% the difference between the two alternative products becomes
more pronounced which is reflected by the difference in terms of TVOG. Alternative 2
has a lower shortfall risk than alternative 1 since the account value may decrease in
some years as long as the guaranteed benefit at maturity is preserved. Hence, we
can conclude that the guarantee that the account value may not decrease becomes
more risky if asset returns exhibit a higher volatility.
The results for the stressed PVFPs under the stock ratio sensitivity are in line with
these results: First, the traditional product requires even more solvency capital: The
SCR is half a percentage point larger than in the base case (3.23% compared to
2.73%), and it is also more than one percentage point larger than for the alternative

CAPITAL EFFICIENCY AND PRODUCT DESIGN 29
products with 10% stocks (2.18%/2.07%). Second, the interest rate stress shows a
more substantial difference between the two different alternative products. While the
difference of the SCR between alternative 1 and 2 was 0.01% in the base case, it is
now 0.11%.
For the final sensitivity, an increase of the initial buffer, we observe a slight increase
of the PVFP for all products. However, there are remarkable differences for the effect
on TVOG between the traditional and the alternative products: While for the
traditional product the TVOG remains approximately the same, for the alternative
products it is essentially reduced to zero. This strongly supports our product
motivation in section 2: For the alternative products, larger surpluses from previous
years create a “buffer” reducing risk in future years.18 Furthermore, the stressed
PVFPs imply that the decrease of capital requirements is significantly larger with the
alternative products: 0.14% reduction (from 1.66% to 1.52%) for alternative 1 and
0.17% reduction (from 1.65% to 1.48%) for alternative 2, compared to just 0.01%
reduction for the traditional product.
Finally, we analyze the percentile plots for the required yields in the base case and in
the different sensitivities. The results for alternative 1 are shown in Figure 4-4, and
for alternative 2 in Figure 4-5. For all sensitivities, the required yield for alternative 1
product starts at a level of 0% since at the beginning of the projection the portfolio
experienced a history with returns that were sufficient to create a “buffer”. With the
stochastic projection the required yield increases only for the most adverse scenarios
such that only for a small share of scenarios the required yield rises to above 1.0% at
any time. In the interest rate sensitivity, this ratio is a lot higher, and also the average
18 From this, we can conclude that if such alternative products had been sold in the past, the risk situation of the insurance industry would be significantly better today in spite of the rather high nominal maturity value guarantees for products sold in the past.

CAPITAL EFFICIENCY AND PRODUCT DESIGN 30
required yield significantly exceeds 0%. Similarly, for a larger stock ratio, the
probability for a higher required yield increases when compared to the base case,
however the effect is much less pronounced than in the interest rate sensitivity, and it
is slightly reduced towards the end of the projection horizon. If the initial buffer is
doubled, the increase of the required yield in adverse scenarios is essentially
delayed by few years (until buffers are used up).
Figure 4-4: Percentile plots of the required yield in the base case and the sensitivities for alternat ive 1 product.
For product alternative 2 the required yield starts below zero at about –4.0% in the
base case which means that the insurer could – in case of a negative asset return –
even credit a negative surplus for the next year (and may avoid a shortfall). Over the
analyzed time horizon, the range of possible values of the required yield becomes
gradually larger: the 99th percentile increases to 1.75% (the maximum possible due
to product design) and the 1st percentile decreases to below –20%. The median and
the mean stay close together indicating a rather symmetric distribution of the required
yield and decrease gradually to about –7.5%. For the interest rate sensitivity, the
required yield starts at the same level, but then strongly increases in most scenarios.

CAPITAL EFFICIENCY AND PRODUCT DESIGN 31
In the last years of the projection lifetime the required yield is at 1.75% for more than
25% of the scenarios. Hence, the interest rate stress is particularly dangerous in the
long run after financial buffers have been absorbed by systematically low returns. For
the higher stock ratio, the 1 to 99% percentile range is higher than in the base case:
between –25% and 1.75% in the last year, i.e. the higher volatility of stocks is
reflected in the distribution of the required yield. With the initial bonus reserve
doubled, the required yield at the beginning is as low as –9.3%. Then it increases
slightly as the additional buffer is consumed gradually in cases of an adverse capital
market. At the end of the time horizon, the percentiles are almost on the same level
as in the base case. This results from the very low bonus reserve at t=0 of those
policies which have been in the portfolio for only a few years when the projection
starts. Of course, these are the only policies remaining in the last years of the
projection. For those policies doubling the initial bonus reserve has no material effect,
and if adverse scenarios materialize close to the end of the time horizon, the policies
with the larger additional reserves have already left.
Figure 4-5: Percentile plots of the required yield in the base case and the sensitivities for alternat ive 2 product.

CAPITAL EFFICIENCY AND PRODUCT DESIGN 32
4.4 Reduction in the level of guarantee
So far we have only considered contracts with a different type of guarantee. We will
now consider contracts with a lower level of guarantee, i.e. products where the
pricing interest rate is below the reserving rate for the alternative products, i.e.
, 2 -. If we apply , 1.25% instead of 1.75%, the annual premium required to
achieve the same guaranteed maturity benefit rises by approx. 5.4% which is
essentially the additional initial buffer of this contract design. We also calculate the
results for the traditional product with a lower interest rate 1.25%, (which is
applied for pricing, reserving and as minimum year-to-year guarantee).
Homogeneous sample portfolios at 0 are derived using the assumptions
described in section 4.1.
The results are presented in Table 4-7. We can see that the PVFP is further increased
and the TVOG is very close to 0 for the modified alternative products which implies
an almost symmetric distribution of the PVFP. The TVOG can even become slightly
negative due to the additional buffer in all scenarios. Although the risk situation for
the traditional product is also improved significantly due to the lower guarantee, the
alternative products can still preserve their advantages. Particularly, a more
remarkable effect can be seen for the SCR which amounts to 1.03% and 0.99% for
the alternative products 1 and 2, respectively, compared to 1.69% for the traditional
product. Hence, the buffer leads to a significant additional SCR reduction for the
alternative products meaning that these are less affected by interest rate risk.

CAPITAL EFFICIENCY AND PRODUCT DESIGN 33
Tradi -tional
Alter -native 1
Alter -native 2
Traditional . %
Altern. 1 w/ . %
Altern. 2 w/ . %
| 3.63% 4.24% 4.25% 4.12% 4.31% 4.31%
0.63% 0.02% 0.01% 0.14% -0.05% -0.05%
|%HV%% 0.90% 2.58% 2.60% 2.43% 3.28% 3.32%
Δ| 2.73% 1.66% 1.65% 1.69% 1.03% 0.99%
Table 4-7: PVFP, TVOG, PVFP under interest rate str ess and for the alternative products with lower pricing ra te.
5 Conclusion and Outlook
In this paper, we have analyzed different product designs of traditional participating
life insurance contracts with a guaranteed benefit at maturity. A particular focus of
our analysis was on the impact of product design on capital requirement under risk
based solvency frameworks such as Solvency II and on the insurer’s profitability.
We have performed a consistent valuation of the different products, and have
analyzed the key drivers of Capital Efficiency, particularly the value of the embedded
options and guarantees and the insurer’s profitability.
As expected, our results confirm that products with a typical year-to-year guarantee
are rather risky for the insurer and hence result in a rather high capital requirement.
Our proposed product modifications significantly enhance Capital Efficiency, reduce
the insurer’s risk, and increase profitability. Although the design of the modified
products makes sure that the policyholder receives less than with the traditional
product only in extreme scenarios, these products still provide a massive relief for the
insurer since extreme scenarios drive the capital requirements under Solvency II and
SST.
It is particularly noteworthy that starting from a standard product where the
guaranteed maturity benefit is based on an interest rate of 1.75%, changing the type
of the guarantee to our modified products (but leaving the level of guarantee intact)

CAPITAL EFFICIENCY AND PRODUCT DESIGN 34
has the same impact on profitability as reducing the level of guarantee to an interest
rate of 0.9% and not modifying the type of guarantee.
We would like to stress that the product design approach presented in this paper is
not model arbitrage (hiding risks in “places the model cannot see"), but a real
reduction of economic risks. In our opinion, such concepts can be highly relevant in
practice if modified products keep the product features that are perceived and
desired by the policyholder, and do away with those options and guarantees of which
policyholders often do not even know they exist. Similar modifications are also
possible for many other old age provision products like dynamic hybrid products19 or
annuity payout products. Therefore, we expect that the importance of “risk
management by product design” will increase. This is particularly the case since –
whenever the same pool of assets is used to back new and old products – new
capital efficient products might even help reduce the risk resulting from an “old” book
of business by reducing the required yield of the pool of assets.
We therefore feel that there is room for additional research: It would be interesting to
analyze similar product modifications for the annuity payout phase. Also – since
many insurers have sold the traditional product variant in the past – an analysis of a
change in new business strategy might be worthwhile: How would an insurer’s risk
and profitability change and how would the modified products interact with the
existing business if the insurer has an existing (traditional) book of business in place
and starts selling modified products today.
Another interesting question is how the insurer’s optimal strategic asset allocation
changes if modified products are being sold: If typical criteria for determining an
19 Cf. Kochanski and Karnarski [2011].

CAPITAL EFFICIENCY AND PRODUCT DESIGN 35
optimal asset allocation are given (e.g. maximizing profitability under the restriction
that some shortfall probability or expected shortfall is not exceeded), then the c.p.
lower risk of the modified products might allow for a more risky asset allocation and
hence also higher expected profitability for the insurer and higher expected surplus
for the policyholder. So, if this dimension is also considered, the policyholder would
somehow be compensated for the fact the he receives a weaker type of guarantee.
Furthermore, the insurer might share the reduced cost of capital with the
policyholder, also resulting in higher expected benefits in the alternative product
designs.
Finally, a direct analysis of a capital efficiency ratio and not only its key drivers might
be worthwhile.
Since traditional participating life insurance products play a major role in old-age
provision in many countries and since in the current interest framework and under
risk based solvency frameworks these products have come under strong pressure,
the concept of “Capital Efficiency” and the analysis of different product designs
should be of high significance for insurers, researchers, and regulators to identify
sustainable life insurance products. In particular, we would hope that legislators and
regulators would embrace sustainable product designs where the insurer’s risk is
significantly reduced, but key product features as perceived and requested by
policyholders are still present.
6 References
Allianz, 2013. Presentation “Allianz Capital Markets Day”. [Online] Available at: https://www.allianz.com/v_1372138505000/media/investor_relations/en/conferences/capital_markets_days/documents/2013_allianz_cmd.pdf
BaFin, 2013. Ergebnisse der fünften quantitativen Auswirkungsstudie zu Solvency II (QIS 5). [Online] Available at: http://www.bafin.de/SharedDocs/Downloads/DE/
CAPITAL EFFICIENCY AND PRODUCT DESIGN 36
Versicherer_Pensionsfonds/QIS/dl_qis5_ergebnisse_bericht_bafin.pdf?__blob=publicationFile&v=8
Barbarin, J. and Devolder, P., 2005. Risk measure and fair valuation of an investment guarantee in life insurance. Insurance: Mathematics and Economics, 37(2), p. 297–323.
Bauer, D., Kiesel, R., Kling, A. and Russ, J., 2006. Risk-neutral valuation of participating life insurance contracts. Insurance: Mathematics and Economics, 39(2), p. 171–183.
Bauer, D., Reuss, A. and Singer, D., 2012. On the Calculation of Solvency Capital Requirement based on Nested Simulations. ASTIN Bulletin, 42(2), p. 453–499.
Bergmann, D., 2011. Nested Simulations in Life Insurance. PhD Thesis, University of Ulm.
Branger, N. and Schlag, C., 2004. Zinsderivate. Modelle und Bewertung. Berlin.
Briys, E. and de Varenne, F., 1997. On the Risk of Insurance Liabilities: Debunking Some Common Pitfalls. The Journal of Risk and Insurance, 64(4), p. 637–694.
CFO-Forum, 2009. Market Consistent Embedded Value Principles. [Online] Available at: http://www.cfoforum.nl/downloads/MCEV_Principles_and_Guidance_October_2009.pdf
DAV, 2011. DAV Fachgrundsatz zum Market Consistent Embedded Value. Köln.
EIOPA, 2013. EIOPA Report on the fifth Quantitative Impact Study (QIS5) for Solvency II. [Online] Available at: http://eiopa.europa.eu/fileadmin/tx_ dam/files/publications/reports/QIS5_Report_Final.pdf
EIOPA, 2013. Technical Specifications on the Long Term Guarantee Assessment. [Online] Available at: https://eiopa.europa.eu/consultations/qis/insurance/long-term-guarantees-assessment/technical-specifications/index.html
Gatzert, N., 2008. Asset management and surplus distribution strategies in life insurance: an examination with respect to risk pricing and risk measurement. Insurance: Mathematics and Economics, 42(2), p. 839–849.
Gatzert, N. and Kling, A., 2007. Analysis of participating life insurance contracts: a unification approach. The Journal of Risk and Insurance, 74(3), p. 547–570.
Glasserman, P., 1994. Monte Carlo Methods in Financial Engineering. New York: Springer.
Graf, S., Kling, A. and Russ, J., 2011. Risk analysis and valuation of life insurance contracts: Combining actuarial and financial approaches. Insurance: Mathematics and Economics, 49(1), p. 115–125.

CAPITAL EFFICIENCY AND PRODUCT DESIGN 37
Grosen, A., Jensen, B. and Jorgensen, P., 2001. A Finite Difference Approach to the Valuation of Path Dependent Life Insurance Liabilities. Geneva Papers on Risk and Insurance Theory, Volume 26, p. 57–84.
Grosen, A. and Jorgensen, P., 2000. Fair Valuation of Life Insurance Liabilities: The Impact of Interest Rate Guarantees, Surrender Options, and Bonus Policies. Insurance: Mathematics and Economics, 26(1), p. 37–57.
Grosen, A. and Jorgensen, P., 2002. Life Insurance Liabilities at Market Value: An analysis of Insolvency Risk, Bonus Policy, and Regulatory Intervention Rules in a Barrier Option Framework. The Journal of Risk and Insurance, 69(1), p. 63–91.
Kling, A., Richter, A. and Russ, J., 2007a. The impact of surplus distribution on the risk exposure of with profit life insurance policies including interest rate guarantees. The Journal of Risk and Insurance, 74(3), pp. 571-589.
Kling, A., Richter, A. and Russ, J., 2007b. The interaction of guarantees, surplus distribution, and asset allocation in with-profit life insurance policies. Insurance: Mathematics and Economics, 40(1), p. 164–178.
Kochanski, M. and Karnarski, B., 2011. Solvency capital requirement for hybrid products. Eurpoean Actuarial Journal, 1(2), p. 173–198.
Mitersen, K. and Persson, S.-A., 2003. Guaranteed Investment Contracts: Distributed and Undistributed Excess Return. Scandinavian Actuarial Journal, 103(4), p. 257–279.
Oechslin, J., Aubry, O. and Aellig, M., 2007. Replicating embedded options. Life & Pensions, February, pp. 47-52.
Saxer, W., 1955. Versicherungsmathematik. Berlin: Springer.
Seyboth, M., 2011. Der Market Consistent Appraisal Value und seine Anwendung im Rahmen der wertorientierten Steuerung von Lebensversicherungsunternehmen. PhD Thesis, University of Ulm.
Wolthuis, H., 1994. Life Insurance Mathematics. Brussels: CAIRE.
Zaglauer, K. and Bauer, D., 2008. Risk-neutral valuation of participating life insurance contracts in a stochastic interest rate environment. Insurance: Mathematics and Economics, 43(1), p. 29–40.