Embed Size (px)
Citation preview
Partial safety factors for homogeneous reliability ofnonlinear reinforced concrete columns
A. Mohamed a,*, R. Soares b, W.S. Venturini b
aLaRAMA/IFMA-UBP, Campus des Cezeaux, BP 265, 63175 Aubiere cedex, FrancebEESC-USP, Av. Trabalhador Saocarlense, 400, 13566-590 Sao Carlos, Brazil
Abstract
The design of reinforced concrete structures is based on the verification of the rules defined by standardspecifications, where partial safety factors are introduced to ensure safety. However, the use of constantfactors for different kinds of columns leads to inhomogeneous safety levels. In this paper, a new format forconcrete and steel safety factors is proposed, in order to ensure uniform target reliability. These factors aregiven in terms of the column design parameters, such as material strengths, steel ratio, slenderness andloading eccentricity. The adopted mechanical model takes into account material and geometrical non-linearities. The response surface technique is used to evaluate the structural reliability. Numerical applica-tions show how the calibrated safety factors lead to a better design than those proposed by the Eurocode2.# 2001 Elsevier Science Ltd. All rights reserved.
Keywords: Safety factors; Calibration; Reliability; Reinforced concrete; Nonlinear analysis; Optimum design; Eurocode
1. Introduction
With the increasing availability of high performance concrete, observed in the last decade, thereinforced concrete (RC) structures become more and more slender, requiring, therefore, the use ofmore accurate nonlinear theories in practical structural design. The design procedures consist ofverifying a certain number of relationships representing the good standing of the structure againstthe loading actions. In the standard codes of practice, the safety is ensured by introducing somefactors to minimize strength and to maximize loading, and hence, to guarantee an acceptable safetymargin. These factors are common for all kinds of structures within the domain of application ofthe design code. Naturally, these constant safety factors cannot ensure constant safety level forall structures; they just ensure a lower bound. This approach leads to the design of structures
0167-4730/01/$ - see front matter # 2001 Elsevier Science Ltd. All rights reserved.
PII : S0167-4730(01)00009-1
Structural Safety 23 (2001) 137–156www.elsevier.nl/locate/strusafe
* Corresponding author. Tel.: +33-4-7328-8029; fax: +33-4-7328-8100.E-mail addresses: [email protected] (A. Mohamed), [email protected] (R. Soares), [email protected] (W.S.
Venturini).
exhibiting reliability higher than the required level. In this case, the structure is conceptually over-dimensioned. On the other hand, in some cases, the partial safety factors may lead to structureswith global reliability lower than the recommended level, what means unsafe design that must beavoided.In general, the calibration process should fulfill a specific goal for the considered class of
structures. The calibration may be carried out in order to optimize safety goals, risk goals, eco-nomical goals or any combined goals. For the risk goals, the Eurocode ‘‘Basis of design’’ remindsus that the selection of a structural reliability level against one or more potential risks takes intoaccount the structural failure probabilities as well as the probabilities that these failures lead toprejudicial consequences. On the other hand, non-uniform reliabilities may lead to optimal solu-tions from the economical point of view. As amatter of fact, the complete calibration process shouldtake into account complex criteria such as the structural failure modes, the expected consequences,the risk prevention methods, the fluctuating construction costs, the expected failure costs as well asthe maintenance and the reparation costs. Of course, this complete calibration process is verycomplicated and cannot be easily applied because some costs and risk considerations are notexplicitly defined (for example, human and environmental damages). Actually, the design codesof practice are limited to ensuring some target reliability, without rigorous considerations foreconomical and risk aspects. This approach seems to be accepted by the engineering community,as it dissociates the structural reliability levels from the specific failure consequences, whichrequires less information at the design stage. Another advantage consists of making the code easyto use by reducing the particularity of the structural system; the available global information is stillapplicable for the same class of elements to be used in different structures. This means that the samecalibration rule can be applied for the columns with the same properties (e.g. slenderness ratio),whatever the type of the considered structure (e.g. shelters, private or public buildings). By seekingfor simplicity and generality, the present design codes aim to ensure what we call ‘‘iso-reliabilitydesigns’’, but only lower bound is practically guaranteed.A solution of the iso-reliability design may consist of performing a complete reliability analysis for
every structural member to be designed, and then to adjust the design parameters in order to get thetarget uniform safety. It is obvious that such a procedure is laborious and cannot be used in practice.To make decisions, the designer is always seeking simple, accurate and practical procedures.The reliability analysis allows us to define the failure probability for a particular design con-
figuration, defined by a limit state function. At failure, the structural behavior is generally verydifferent from the serviceability state (e.g. mostly linear elastic). In order to obtain accurate safetyestimation, the limit state function must represent the realistic structural behavior, by taking intoaccount material and geometrical nonlinearities.The structural members are usually rather slender enforcing the designers to adopt an appro-
priate model to consider the geometrical nonlinearities. Nevertheless, material nonlinearities arecertainly more important. They govern the member stiffness reduction during the whole lifetime ofthe structure. The elastic–plastic behavior is the natural choice to be assumed for both the concretematerial and the reinforcement steel [1]. As only the concrete compressive stresses are taken intoaccount, the tensile strength is neglected; these methods are appropriate to verify the ultimate limitstate at particular cross-sections, but not to evaluate the member stiffness.In order to take into account the tension stiffening effects to estimate properly the global
structural stiffness, some approximate methods, written in terms of internal moment-curvature
138 A. Mohamed et al. / Structural Safety 23 (2001) 137–156
diagrams, have been proposed. Among them, it is important to mention the simple ACI 318model [2], in which an average stiffness is considered for each individual member. This is a simplebut a very convenient model to be adopted in practical designs. It is important to point out twoother more precise models that were proposed by Debernardi [3] and Ghali and Favre [4]; the lastone gave origin to the well-known Code Model 90 found in the CEB-FIP recommendations [5].Practically all international codes of practice have been proposed by incorporating reliability
concepts, as it can be seen in the Eurocode1 ‘‘Basis of design’’ and in several CEB recommenda-tions [5]. Recently, other more realistic models to incorporate reliability into the reinforced con-crete column analysis have been proposed. For instance, Tabsh [6] has investigated the safety ofreinforced concrete members in bending. The analyzed structural elements were designed on theACI 318 design-code basis, using load combination and strength reduction factors.Frangopol et al. [7,8] carried out many investigations for columns and bridges, where the
reliability is shown to be affected by load correlation and loading paths. In these works, thereliability analysis is performed by using Monte Carlo simulations, using an appropriate nonlinearstress-strain relationship and a strongly simplified elastic-plastic buckling model. Reid [9] showedthe rather high reduction of the RC column reliability for the case of long term loading. Holickyand Vrouwenvelder [10] have analyzed 12 reinforced concrete columns, where the reliability indexwas studied in terms of time. The study was conducted by applying long and short-term actions,for which the reinforced concrete element behavior was represented by a bending moment–normalforce relationship; the FORM method is applied to approximate the failure probability.For reinforced concrete frames, Val et al. [11] presented a method based on a combination of a
finite element model with the first order reliability method FORM, applied to predict the relia-bility of nonlinear RC plane frames, by taking into account physical and geometrical non-linearities. The reliability analysis of reinforced concrete structures has also been extended tomulti-story buildings. Epaarachchi et al. [12] developed a preliminary probabilistic model toestimate the structural collapse probability of typical multi-story buildings during the construc-tion phase. The Monte Carlo simulations were used to estimate the failure probability.In the present paper, a partial safety factor format is proposed to ensure a uniform reliability
for RC columns. Knowing the high computation cost in nonlinear analysis, the reliability schemeis built by coupling the finite element model with adaptive Response Surface Method (RSM).This is calculated by fitting the ultimate state of the structure using quadratic polynomials. Thesearch algorithm has shown to be efficient and robust for nonlinear RC structures.To represent the nonlinear behavior of concrete structures at the failure stage, local models
based on axial stress–strain relationships are adopted to describe the concrete behavior in tensionand in compression. The steel is assumed to follow an elastic–plastic law with constant strainhardening. The parametric analysis of columns allows us to identify the influence of each para-meter, and to define the safety factor format. The correctness of the proposed format is verifiedby the mean of RC structural design examples, and compared with the Eurocode2.
2. Mechanical model
The accuracy of the adopted mechanical model is essential for realistic reliability estimation.The chosen algorithm must be appropriate to capture precisely the ultimate loads which are the
A. Mohamed et al. / Structural Safety 23 (2001) 137–156 139
basic information to build up robust failure surfaces. Thus, an appropriate geometrical andphysical nonlinear mechanical model has been considered in this work; the adopted model isverified to be sufficiently accurate to represent the RC structural behavior. The so-called geome-trically exact model has been chosen to describe the geometrical nonlinearity effects [13,14]. Usingthis theory, no restriction regarding the strain magnitude is enforced. The mechanical model isthen completed by following an accurate model to describe the nonlinear behavior of RC struc-tures.
2.1. Geometrical nonlinearity
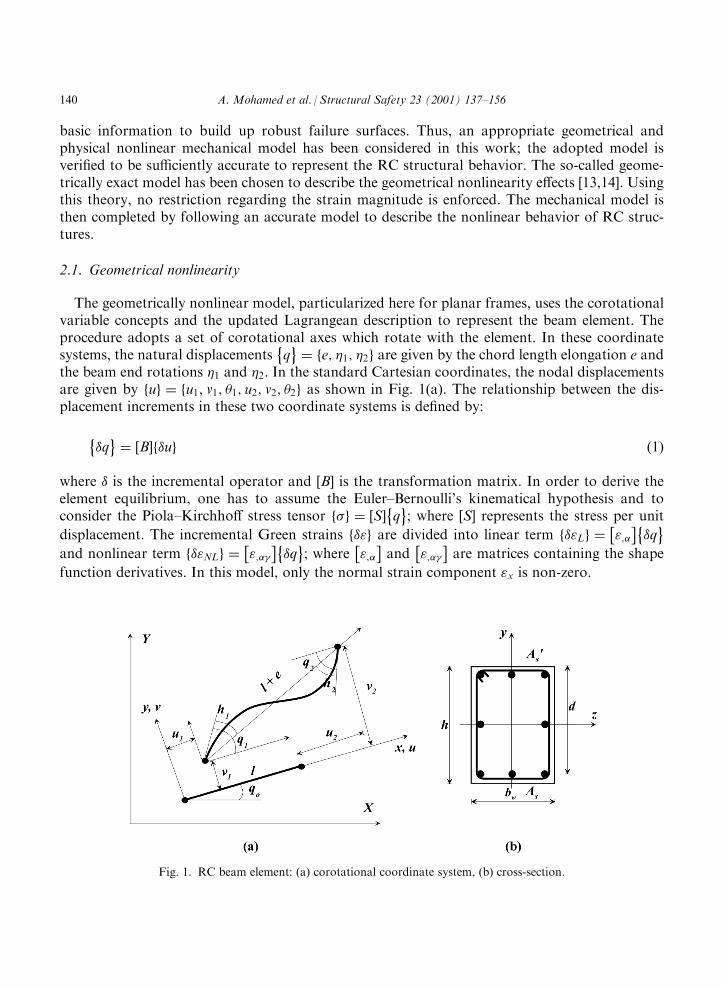
The geometrically nonlinear model, particularized here for planar frames, uses the corotationalvariable concepts and the updated Lagrangean description to represent the beam element. Theprocedure adopts a set of corotational axes which rotate with the element. In these coordinatesystems, the natural displacements q
� �¼ e; �1; �2f g are given by the chord length elongation e and
the beam end rotations �1 and �2. In the standard Cartesian coordinates, the nodal displacementsare given by uf g ¼ u1; v1; �1; u2; v2; �2f g as shown in Fig. 1(a). The relationship between the dis-placement increments in these two coordinate systems is defined by:
�q� �
¼ B½ � �uf g ð1Þ
where � is the incremental operator and B½ � is the transformation matrix. In order to derive theelement equilibrium, one has to assume the Euler–Bernoulli’s kinematical hypothesis and toconsider the Piola–Kirchhoff stress tensor �f g ¼ S½ � q
� �; where S½ � represents the stress per unit
displacement. The incremental Green strains �"f g are divided into linear term �"Lf g ¼ ";�� �
�q� �
and nonlinear term �"NLf g ¼ ";��� �
�q� �
; where ";�� �
and ";��� �
are matrices containing the shape
function derivatives. In this model, only the normal strain component "x is non-zero.
Fig. 1. RC beam element: (a) corotational coordinate system, (b) cross-section.
140 A. Mohamed et al. / Structural Safety 23 (2001) 137–156
By introducing the material constitutive law ��f g ¼ @�@"
� ��"f g, the Virtual Work Principle allows
us to write the element equilibrium as follows:
Kt uð Þ½ � �uf g ¼ �Ff g ð2Þ
where �uf g and �Ff g are respectively the vectors of incremental nodal displacements and forcesand Kt uð Þ½ � is the tangent stiffness matrix defined in the Cartesian coordinates, it is calculated by:
Kt uð Þ½ � ¼ B½ �t
ðL
ðA
";�� �t @�
@"
� �";�� �
dA dx B½ �
þ B½ �t
ðL
ðA
S½ �t ";��� �
dA dx B½ � þ
ðL
ðA
S½ �t ";�� �
dA dx G�½ �
ð3Þ
where L is the element length, A is the cross-sectional area and G�½ � ¼ @2q�=@ui@uj
� �is the matrix
of coordinate second order derivatives. In Eq. (3), the first term of the tangent matrix is thestandard stiffness matrix (i.e. geometrically linear matrix), the second term is known as the initialdisplacement matrix (i.e. effects of nonlinear deformations) and the third term is known as theinitial stress matrix (i.e. stress stiffening or softening).
2.2. Material nonlinearity
To take account for complex material behavior, the tangent matrix in Eq. (3) is modified byintegrating appropriate constitutive relationships. For RC structures, the nonlinear behavior ofconcrete and steel materials must be known a priori in order to obtain an accurate mechanicalmodeling. Over the concrete tensile zone, one has to take into account the cracking effects and theremaining tensile stress bearing capacity between fractures.For simplicity and justified by their good performance, approximated smeared models have
been successfully adopted to represent the concrete behavior over the tensile zone. The crackingeffects can be modeled by averaging the stiffness to take into account the small values of the strainsin the vicinity of the cracked cross-sections, as well as the unbonding effects to allow crack opening.In order to define an appropriate reinforced concrete smeared model, one can follow the con-tinuum damage mechanics theory. It gives precisely the global stiffness reduction, depending onthe number of parameters chosen, and preserves the continuum representation of the structuralelement (e.g. [15,16]).Taking into account that we are dealing only with uniaxial state of stress in tension and com-
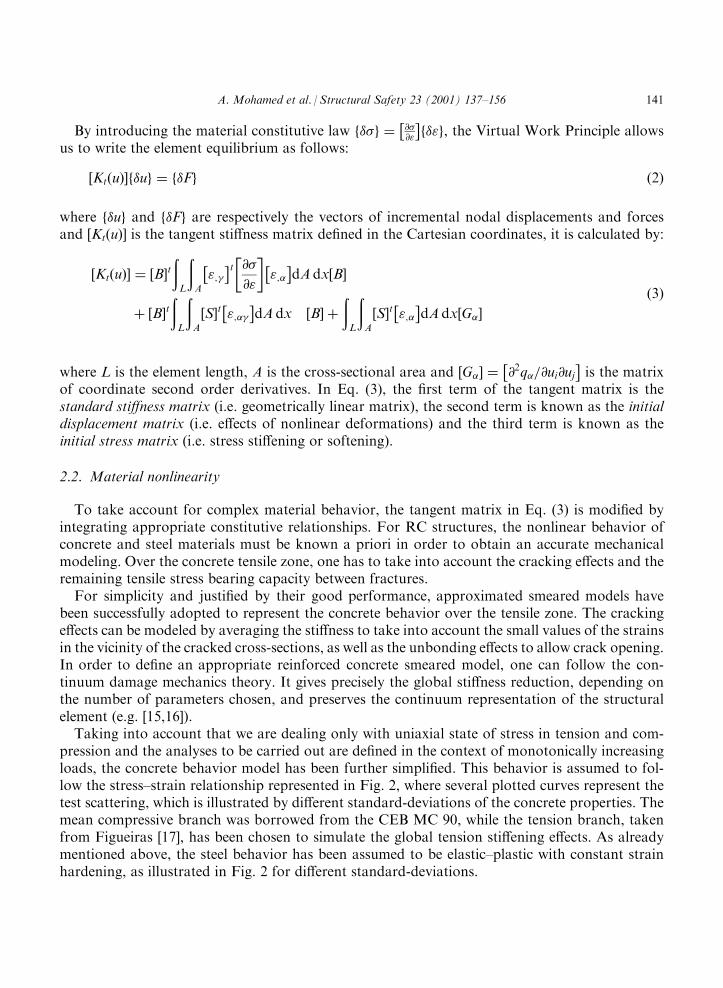
pression and the analyses to be carried out are defined in the context of monotonically increasingloads, the concrete behavior model has been further simplified. This behavior is assumed to fol-low the stress–strain relationship represented in Fig. 2, where several plotted curves represent thetest scattering, which is illustrated by different standard-deviations of the concrete properties. Themean compressive branch was borrowed from the CEB MC 90, while the tension branch, takenfrom Figueiras [17], has been chosen to simulate the global tension stiffening effects. As alreadymentioned above, the steel behavior has been assumed to be elastic–plastic with constant strainhardening, as illustrated in Fig. 2 for different standard-deviations.
A. Mohamed et al. / Structural Safety 23 (2001) 137–156 141
In order to represent the planar frame deformations, one has to assume field approximationsover the element length. Third order interpolation polynomial is adopted to approximate thedeflection field, while rotations and axial displacements are represented by the second and firstorder polynomials, respectively.After choosing the described nonlinear models for concrete and steel, the actual internal forces
can be accurately computed by performing the appropriate integrals over the cross-sections. Then,the prediction and the correction vectors, required to solve the nonlinear system of equations usingthe Newton–Raphson scheme, can be computed by performing the integral along the frame ele-ments. Only the normal forces and the bending moments are taken into account to define thereduced stiffness matrix (i.e. no correction is applied to the shear components). So, the concretebehavior is assumed to be governed by simple uniaxial stress criteria.The well-known layered model has been adopted to compute the actual internal forces at each
cross-section. The strain state is computed at the geometric center of each layer by using the cur-vature values and assuming the Bernoulli’s hypothesis. Then, the stress over the cross-section canbe evaluated by using the constitutive behavior for concrete and steel. The reinforcement con-tribution is concentrated at its geometrical center and computed by assuming continuous state ofstrains over the cross-section, therefore, treated as particular layers. After finding the updatedstress distributions along the cross-section, the bending moments and the normal forces, for theparticular case of rectangular cross-section depicted in Fig. 1(b), are given by:
Mx ¼ bw
ðh=2
h=2
�cxydy þ
XNs
k¼1
�skx Askysk ð4aÞ
N ¼ bw
ðh=2
h=2
�cxdy þ
XNs
k¼1
�skx Ask ð4bÞ
where �cx is the normal stress component at a coordinate y and �sk
x is the steel stress at the layerplaced at ysk, while Ask represents the ysk-layer steel cross-section and Ns is the number of rein-forcement layers.The prediction and the correction vectors as well as the reduced stiffness tangent matrix can be
evaluated by carrying out the integrals along the element using a Gaussian scheme.
Fig. 2. Uniaxial concrete and steel stress–strain relationships.
142 A. Mohamed et al. / Structural Safety 23 (2001) 137–156
It is to be noted that the mechanical model described above was implemented only to analyzethe case of static and monotonically increasing loads. Thus, the recommendations obtained inthis work regarding the partial safety coefficients of RC structures are valid only under thoseloading conditions. An extension may be possible for low amplitude cyclic and dynamic loadingswith respect to monotonic dominant loading at the failure stage. However, further studies shouldbe carried out for general loading paths.
3. Mechanical-reliability coupling by the RSM
The mechanical-reliability scheme proposed in this work is obtained by coupling the mechan-ical model described in Section 2 with the response surface method (RSM), which is briefly dis-cussed in this section.The mechanical model is required to build up the failure surfaces (FS) of the structural ultimate
capacity. Herein, they are constructed within the context of nonlinear analysis of reinforcedconcrete structures, for which the previously described RC nonlinear model gives very accurateresults. The complex structural response in the vicinity of the ultimate failure point leads tosome numerical errors because the stiffness matrix becomes ill-conditioned. But as the RSM isbased on the response regression, these fluctuating errors are significantly reduced and can beneglected.To couple mechanical and reliability models, the Monte Carlo simulations seem to be the sim-
plest choice to perform RC structural reliability analysis. Many works have adopted this couplingscheme (see for example [7,8,11,18]). Bearing in mind that each nonlinear analysis represents sig-nificant time consumption, the Monte Carlo based coupling leads to very high computation effortand gives limited information about the variable importance factors and sensitivities. In the presentwork, an efficient reliability method is developed by using an adaptive response surface method(RSM). Moreover, this approach allows us to define accurately the importance factors with rea-sonable calculation cost; this information is very useful in the calculation of the partial safetyfactors.
3.1. Column failure surface
The RSM aims to build approximate solutions for the structural response in the vicinity of thedesign point. For a given combination of the deterministic parameters, such as: geometrical data,material properties and boundary conditions, the response surface describes the failure function inthe space of the considered random variables x. An appropriate experience plane (EP) has to definethe set of variable realizations, allowing the description of the response surface by minimumsquare regression. Theoretically, any shape surface can be adopted to represent the structuralresponse, but the use of complete quadratic polynomial seems to be a good choice.In our study, the ultimate loading capacity Pu is the structural response that we are looking for.
Thus, each numerical experiment to be used in the EP is obtained by performing a complete andspecific nonlinear analysis. It is clear that each mechanical call represents a significant computationcost. So, the numerical experiments should be optimally scheduled in order to reduce the totalnumerical effort.
A. Mohamed et al. / Structural Safety 23 (2001) 137–156 143
The failure function G(x) can be defined by the difference between the ultimate capacity of thestructure Pu and the internal forces due to the loads acting on the structure Pa.
G xð Þ ¼ Pu Pa ð5Þ
where G xð Þ > 0 indicates the safe condition, G xð Þ < 0 the failure condition and G xð Þ ¼ 0 the limitstate. When the probabilistic transformation u ¼ T xð Þ is applied to the failure function G xð Þ inthe physical space x, its image H uð Þ ¼ G xð Þ, defined in the normalized space u, can be obtained.Using this transformation, the reliability index is calculated by solving the constrained optimi-zation problem:
minimize uð Þ ¼ffiffiffiffiffiffiffiffiuTu
psubjected to H uð Þ40 ð6Þ
The minimized solution can be found by using any general optimization procedure; in thepresent case, the Rackwitz and Fiessler algorithm [19] has shown to be a very good alternativeregarding the accuracy of the results. The solution of problem (6) is usually referred to as thedesign point, noted u* or P*.
3.2. Evaluation of strengths and actions
To evaluate the failure function, the structural strengths and the external actions should becomputed. The strength is defined by the ultimate load that the structure can carry Pu. In non-linear mechanics, the loads are applied in increments using the loading factor �. The collapse loadwill be reached by cumulating the incremental loads, which may be sub-divided according to thechosen tolerance. In this process, the singularity of the stiffness matrix characterizes the ultimateload. In the present work, instead of using Pu to build the failure surface, it is more convenient todeal with a dimensionless variable: the cumulated loading factor �.The applied action Pa represents the allowable combination of dead and live loads acting on
the structure. As the main interest of this work is concerning the evaluation of the safety factorsrecommended by international codes of practice, the action Pa will be computed by applying theallowable loads according to these specifications. Thus, the applied load is evaluated by the designformat using the reduced strength values (�c and �s partial factors) for concrete and steel, inaddition to dead load and live load factors (�G and �Q); in this case, the factors are taken from thecodes of practice to be checked.Following this procedure, it is possible to find the reliability index related with the structures
designed according to the code of practice format. The nonlinear mechanical and reliability ana-lyses are carried out with the software STST [20], developed for the modeling of reinforced con-crete structures by coupling RSM and FEM.
4. Calibration of partial safety factors for slender columns
The aim of this work is to give general, and simple, definition of the safety factors such thatuniform reliability can be achieved. Instead of subdividing the domain of validity of the code and
144 A. Mohamed et al. / Structural Safety 23 (2001) 137–156
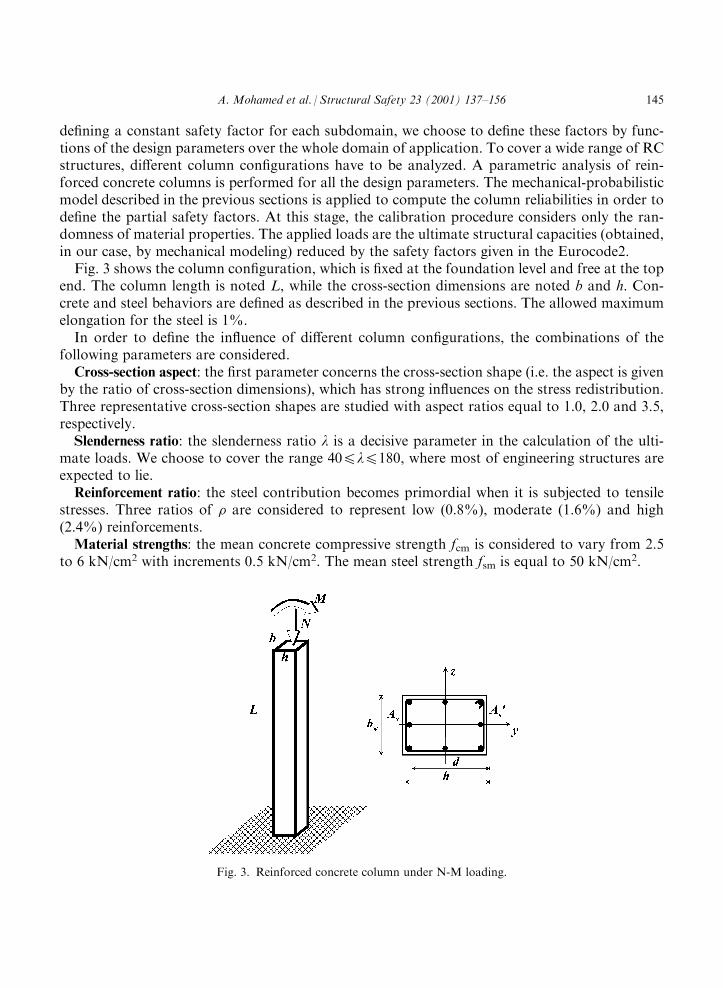
defining a constant safety factor for each subdomain, we choose to define these factors by func-tions of the design parameters over the whole domain of application. To cover a wide range of RCstructures, different column configurations have to be analyzed. A parametric analysis of rein-forced concrete columns is performed for all the design parameters. The mechanical-probabilisticmodel described in the previous sections is applied to compute the column reliabilities in order todefine the partial safety factors. At this stage, the calibration procedure considers only the ran-domness of material properties. The applied loads are the ultimate structural capacities (obtained,in our case, by mechanical modeling) reduced by the safety factors given in the Eurocode2.Fig. 3 shows the column configuration, which is fixed at the foundation level and free at the top
end. The column length is noted L, while the cross-section dimensions are noted b and h. Con-crete and steel behaviors are defined as described in the previous sections. The allowed maximumelongation for the steel is 1%.In order to define the influence of different column configurations, the combinations of the
following parameters are considered.Cross-section aspect: the first parameter concerns the cross-section shape (i.e. the aspect is given
by the ratio of cross-section dimensions), which has strong influences on the stress redistribution.Three representative cross-section shapes are studied with aspect ratios equal to 1.0, 2.0 and 3.5,respectively.Slenderness ratio: the slenderness ratio l is a decisive parameter in the calculation of the ulti-
mate loads. We choose to cover the range 404l4180, where most of engineering structures areexpected to lie.Reinforcement ratio: the steel contribution becomes primordial when it is subjected to tensile
stresses. Three ratios of � are considered to represent low (0.8%), moderate (1.6%) and high(2.4%) reinforcements.Material strengths: the mean concrete compressive strength fcm is considered to vary from 2.5
to 6 kN/cm2 with increments 0.5 kN/cm2. The mean steel strength fsm is equal to 50 kN/cm2.
Fig. 3. Reinforced concrete column under N-M loading.
A. Mohamed et al. / Structural Safety 23 (2001) 137–156 145
Loading eccentricity: the loading eccentricity defines the way the column is deformed. Weconsider the range: 0:14 M
N�h ¼eh 41:3.
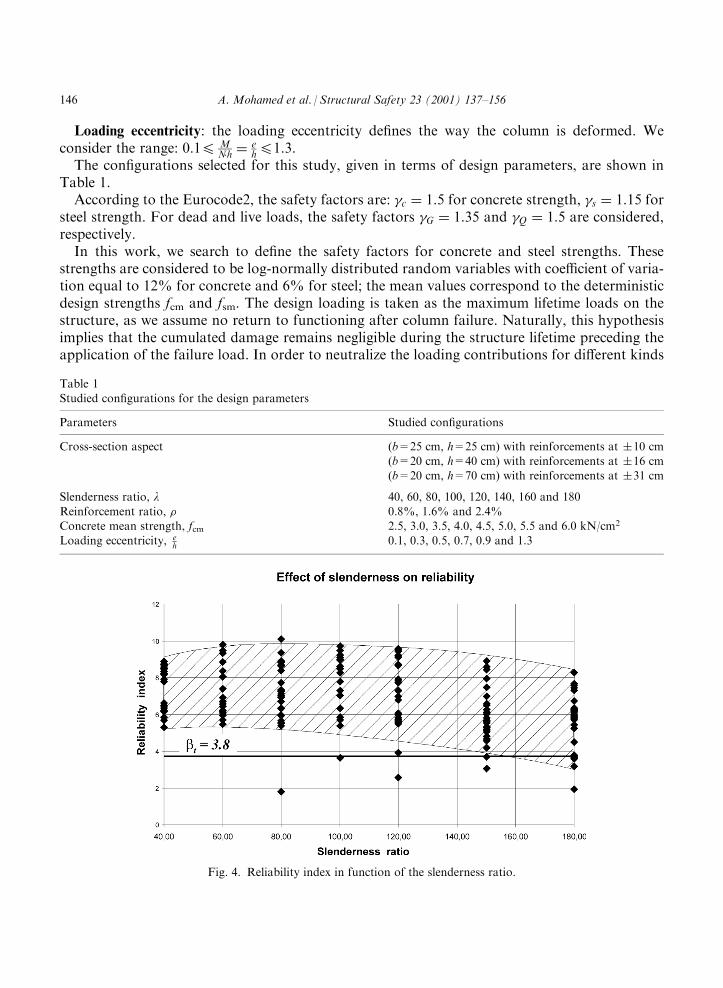
The configurations selected for this study, given in terms of design parameters, are shown inTable 1.According to the Eurocode2, the safety factors are: �c ¼ 1:5 for concrete strength, �s ¼ 1:15 for
steel strength. For dead and live loads, the safety factors �G ¼ 1:35 and �Q ¼ 1:5 are considered,respectively.In this work, we search to define the safety factors for concrete and steel strengths. These
strengths are considered to be log-normally distributed random variables with coefficient of varia-tion equal to 12% for concrete and 6% for steel; the mean values correspond to the deterministicdesign strengths fcm and fsm. The design loading is taken as the maximum lifetime loads on thestructure, as we assume no return to functioning after column failure. Naturally, this hypothesisimplies that the cumulated damage remains negligible during the structure lifetime preceding theapplication of the failure load. In order to neutralize the loading contributions for different kinds
Table 1
Studied configurations for the design parameters
Parameters Studied configurations
Cross-section aspect (b=25 cm, h=25 cm) with reinforcements at �10 cm(b=20 cm, h=40 cm) with reinforcements at �16 cm(b=20 cm, h=70 cm) with reinforcements at �31 cm
Slenderness ratio, l 40, 60, 80, 100, 120, 140, 160 and 180
Reinforcement ratio, � 0.8%, 1.6% and 2.4%Concrete mean strength, fcm 2.5, 3.0, 3.5, 4.0, 4.5, 5.0, 5.5 and 6.0 kN/cm2
Loading eccentricity, eh 0.1, 0.3, 0.5, 0.7, 0.9 and 1.3
Fig. 4. Reliability index in function of the slenderness ratio.
146 A. Mohamed et al. / Structural Safety 23 (2001) 137–156
of structures, the design ultimate loads are calculated by the characteristic values at 95% quan-tile, multiplied by the safety factors specified by the Eurocode2. To calculate the 95% quantile,the applied load uncertainties are supposed to follow a log-normal distribution with coefficients ofvariation equal to 15% for dead loads and 25% for live loads. This leads to an under-estimation ofthe structural reliabilities (i.e. the effective reliability is necessarily higher than the calculated valuesbecause pessimistic loading is considered). Under these considerations, the calculated reliabilitylevels are independent of loading combinations and paths. It is to be noted that the proposedstrategy can be extended to calibrate the loading safety factors, but in this case, reliable statisticalcharacterization of the loading variables should be defined for each design configuration, which isnot a sufficiently available information for usual structures.
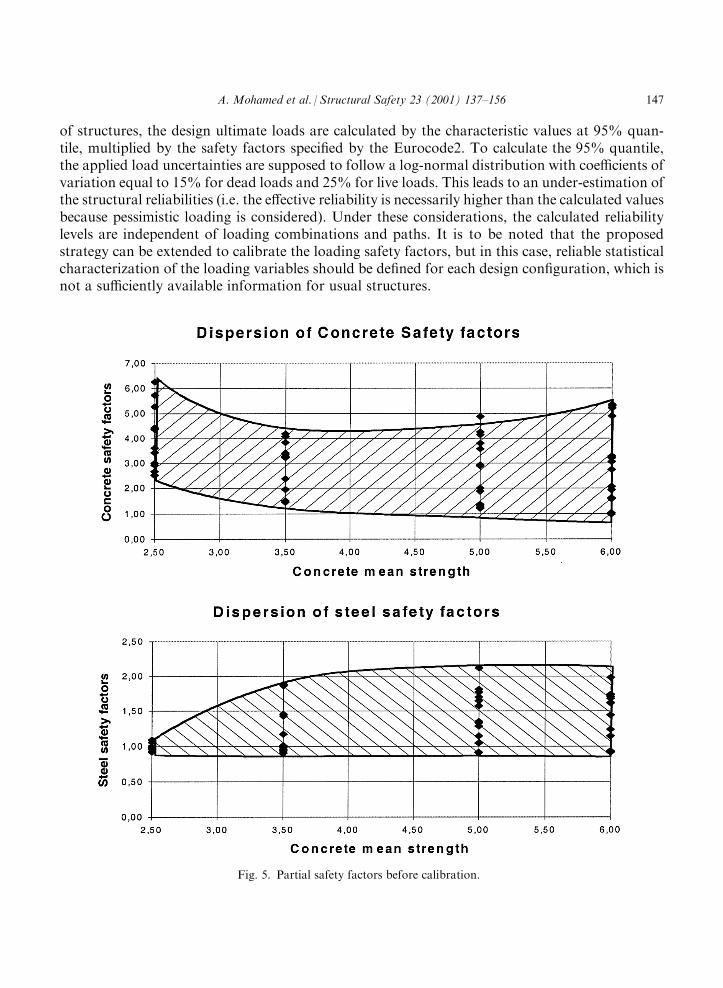
Fig. 5. Partial safety factors before calibration.
A. Mohamed et al. / Structural Safety 23 (2001) 137–156 147
If we consider all the parameter combinations given in Table 1, we get 3528 column config-urations. Performing the reliability analysis for all these cases leads to very high numerical efforts.This can be reduced by using the technique of design of experiments. A Taguchi plane based on 144numerical experiments is proposed to give a good representation of the parameter effects.With the safety factors given by the Eurocode2, nearly 95% of the found reliability indexes lie
between min=3.6 and max=9.5 (Fig. 4), which correspond to a failure probability: 6.5 1022
4Pf41:6 104; only 3% of the cases have reliability index lower than 3.6 while 2% are greaterthat 9.5. It is clear that the Eurocode2 ensures the lower bound, but fails to give uniform relia-bility for all structures.Fig. 4 shows that the target reliability of 3.8, is ensured in almost all cases, especially for slen-
derness lower than 160. However, the average reliability belongs to the range: 64 average47,which is much higher than the target. Thus, the Eurocode2 recommendations ensure very goodsafety level in almost all cases, but they lead to rather uneconomic solutions in many situations.We can also observe that the reliability dispersion increases with large slenderness (� � 4 forl=40 and � � 5 for l=180). Fig. 5 shows the observed partial safety factors for concrete andsteel. For columns with slenderness ratios higher than 80, the large eccentricity reduces sig-nificantly the concrete safety factors, especially for high concrete strengths.It has been observed that high reliability values occur when higher concrete strength is com-
bined with high reinforcement ratio, and also, low reliability occurs when low concrete strength iscombined with low reinforcement ratio. For low concrete compressive strengths, the steelstrength plays an important role in the column safety. In this case, the concrete safety factors aremuch greater than 1.4 in most situations. On the other hand, the columns made with high rein-forcement ratios require a lower concrete safety factor.
4.1. Parameter effects on reliability
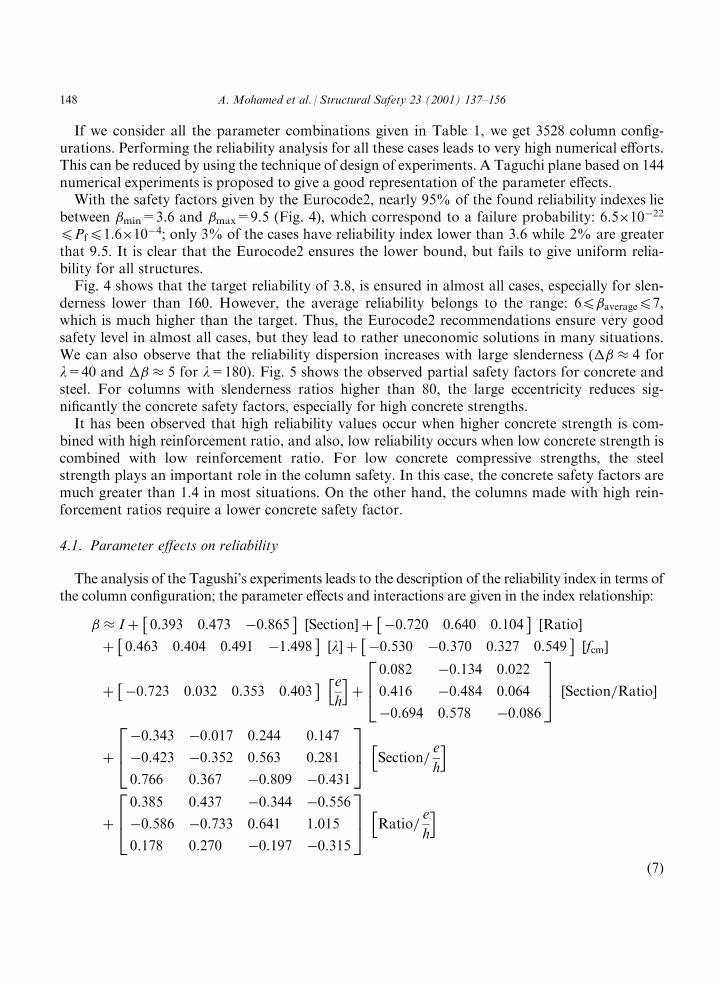
The analysis of the Tagushi’s experiments leads to the description of the reliability index in terms ofthe column configuration; the parameter effects and interactions are given in the index relationship:
� I þ 0:393 0:473 0:865� �
Section½ � þ 0:720 0:640 0:104� �
Ratio½ �
þ 0:463 0:404 0:491 1:498� �
l½ � þ 0:530 0:370 0:327 0:549� �
fcm½ �
þ 0:723 0:032 0:353 0:403� � e
h
h iþ
0:082 0:134 0:022
0:416 0:484 0:064
0:694 0:578 0:086
264
375 Section=Ratio½ �
þ
0:343 0:017 0:244 0:147
0:423 0:352 0:563 0:281
0:766 0:367 0:809 0:431
264
375 Section=
e
h
h i
þ
0:385 0:437 0:344 0:556
0:586 0:733 0:641 1:015
0:178 0:270 0:197 0:315
264
375 Ratio=
e
h
h i
ð7Þ
148 A. Mohamed et al. / Structural Safety 23 (2001) 137–156
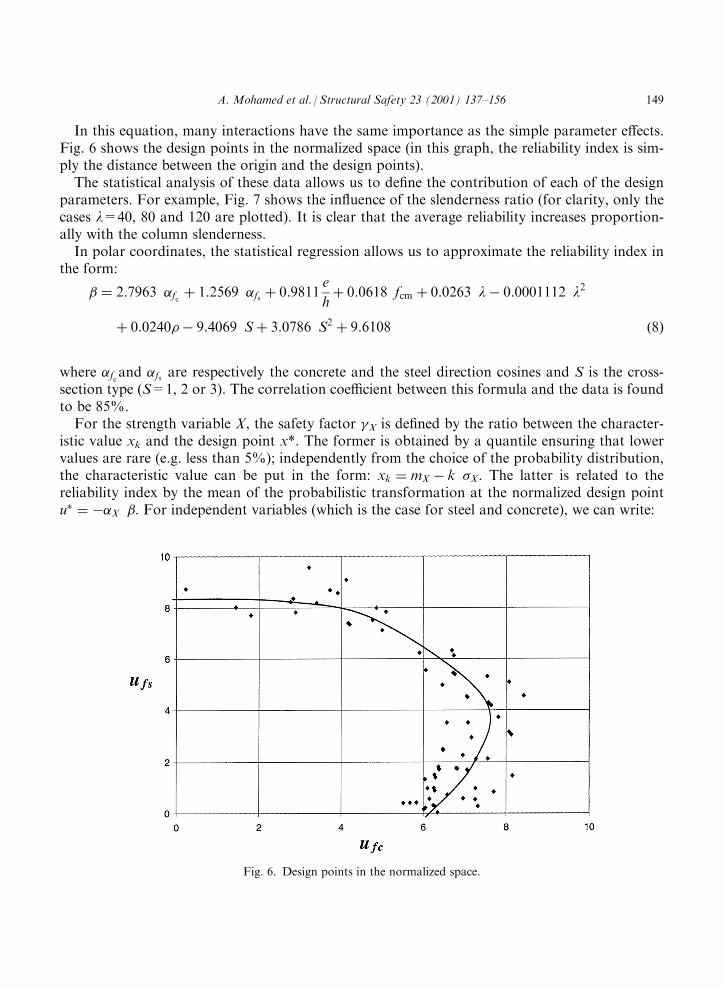
In this equation, many interactions have the same importance as the simple parameter effects.Fig. 6 shows the design points in the normalized space (in this graph, the reliability index is sim-ply the distance between the origin and the design points).The statistical analysis of these data allows us to define the contribution of each of the design
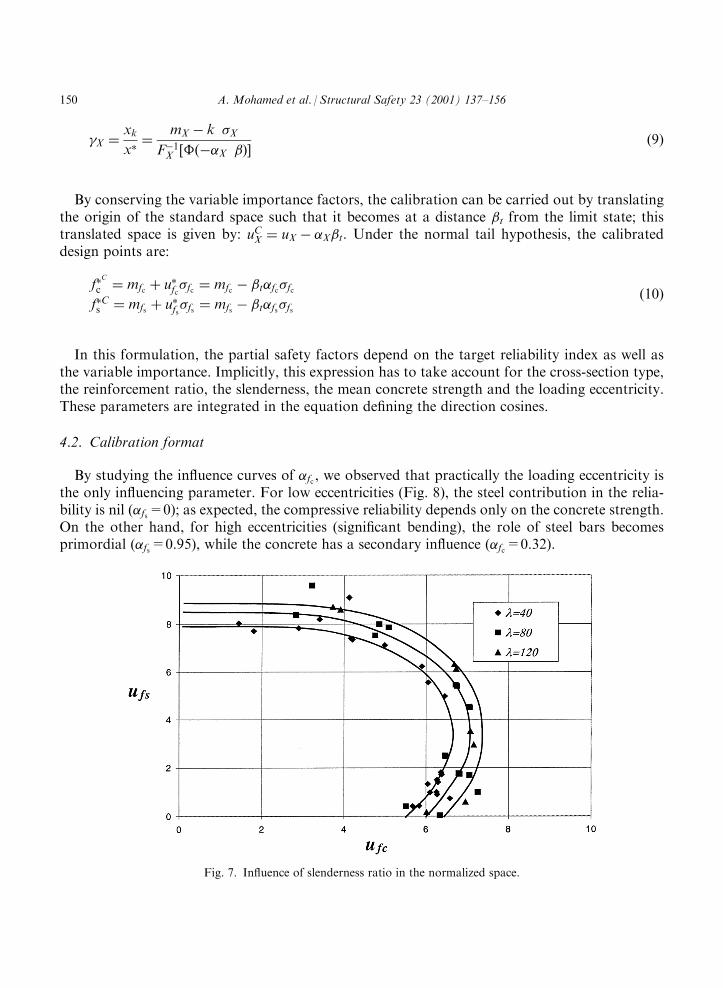
parameters. For example, Fig. 7 shows the influence of the slenderness ratio (for clarity, only thecases l=40, 80 and 120 are plotted). It is clear that the average reliability increases proportion-ally with the column slenderness.In polar coordinates, the statistical regression allows us to approximate the reliability index in
the form:
¼ 2:7963 �fc þ 1:2569 �fs þ 0:9811e
hþ 0:0618 fcm þ 0:0263 l 0:0001112 l2
þ 0:0240� 9:4069 S þ 3:0786 S2 þ 9:6108 ð8Þ
where �fcand �fs are respectively the concrete and the steel direction cosines and S is the cross-section type (S=1, 2 or 3). The correlation coefficient between this formula and the data is foundto be 85%.For the strength variable X, the safety factor �X is defined by the ratio between the character-
istic value xk and the design point x*. The former is obtained by a quantile ensuring that lowervalues are rare (e.g. less than 5%); independently from the choice of the probability distribution,the characteristic value can be put in the form: xk ¼ mX k �X. The latter is related to thereliability index by the mean of the probabilistic transformation at the normalized design pointu� ¼ �X . For independent variables (which is the case for steel and concrete), we can write:
Fig. 6. Design points in the normalized space.
A. Mohamed et al. / Structural Safety 23 (2001) 137–156 149
�X ¼xk
x�¼
mX k �X
F1X � �X ð Þ½ �
ð9Þ
By conserving the variable importance factors, the calibration can be carried out by translatingthe origin of the standard space such that it becomes at a distance t from the limit state; thistranslated space is given by: uC
X ¼ uX �X t. Under the normal tail hypothesis, the calibrateddesign points are:
f�C
c ¼ mfc þ u�fc�fc ¼ mfc t�fc�fc
f�Cs ¼ mfs þ u�
fs�fs ¼ mfs t�fs�fs
ð10Þ
In this formulation, the partial safety factors depend on the target reliability index as well asthe variable importance. Implicitly, this expression has to take account for the cross-section type,the reinforcement ratio, the slenderness, the mean concrete strength and the loading eccentricity.These parameters are integrated in the equation defining the direction cosines.
4.2. Calibration format
By studying the influence curves of �fc , we observed that practically the loading eccentricity isthe only influencing parameter. For low eccentricities (Fig. 8), the steel contribution in the relia-bility is nil (�fs=0); as expected, the compressive reliability depends only on the concrete strength.On the other hand, for high eccentricities (significant bending), the role of steel bars becomesprimordial (�fs=0.95), while the concrete has a secondary influence (�fc=0.32).
Fig. 7. Influence of slenderness ratio in the normalized space.
150 A. Mohamed et al. / Structural Safety 23 (2001) 137–156
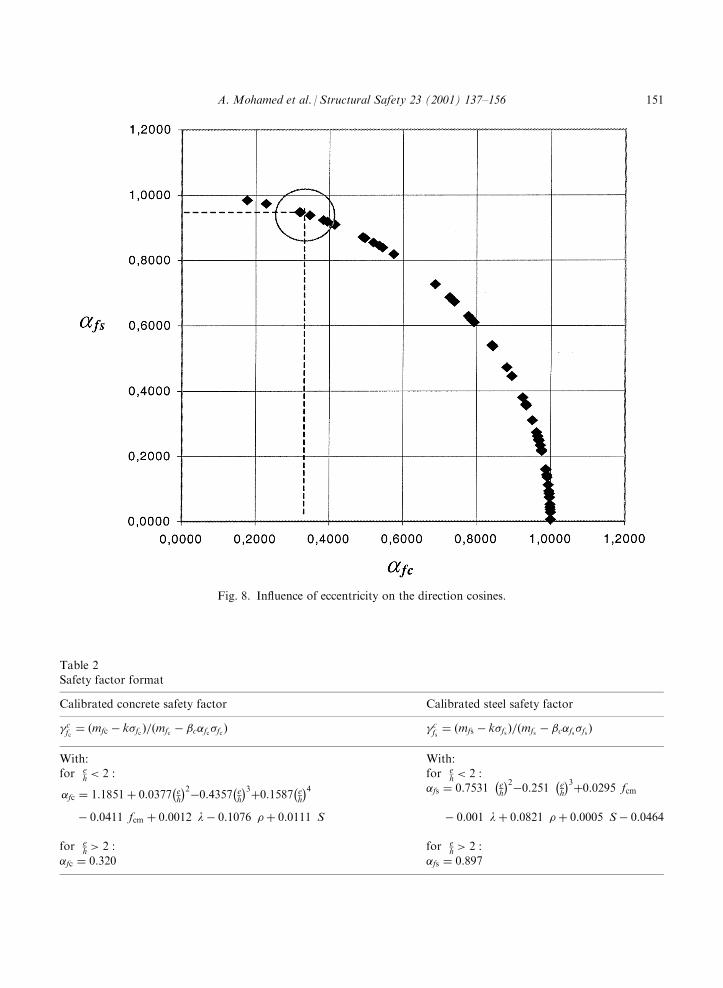
Fig. 8. Influence of eccentricity on the direction cosines.
Table 2Safety factor format
Calibrated concrete safety factor Calibrated steel safety factor
�cfc¼ ðmfc k�fc Þ=ðmfc c�fc�fc Þ �c
fs¼ ðmfs k�fs Þ=ðmfs c�fs�fs Þ
With: With:for e
h < 2 : for eh < 2 :
�fc ¼ 1:1851þ 0:0377 eh
� �20:4357 e
h
� �3þ0:1587 e
h
� �4 0:0411 fcm þ 0:0012 l 0:1076 �þ 0:0111 S
�fs ¼ 0:7531 eh
� �20:251 e
h
� �3þ0:0295 fcm
0:001 lþ 0:0821 �þ 0:0005 S 0:0464
for eh > 2 : for e
h > 2 :
�fc ¼ 0:320 �fs ¼ 0:897
A. Mohamed et al. / Structural Safety 23 (2001) 137–156 151
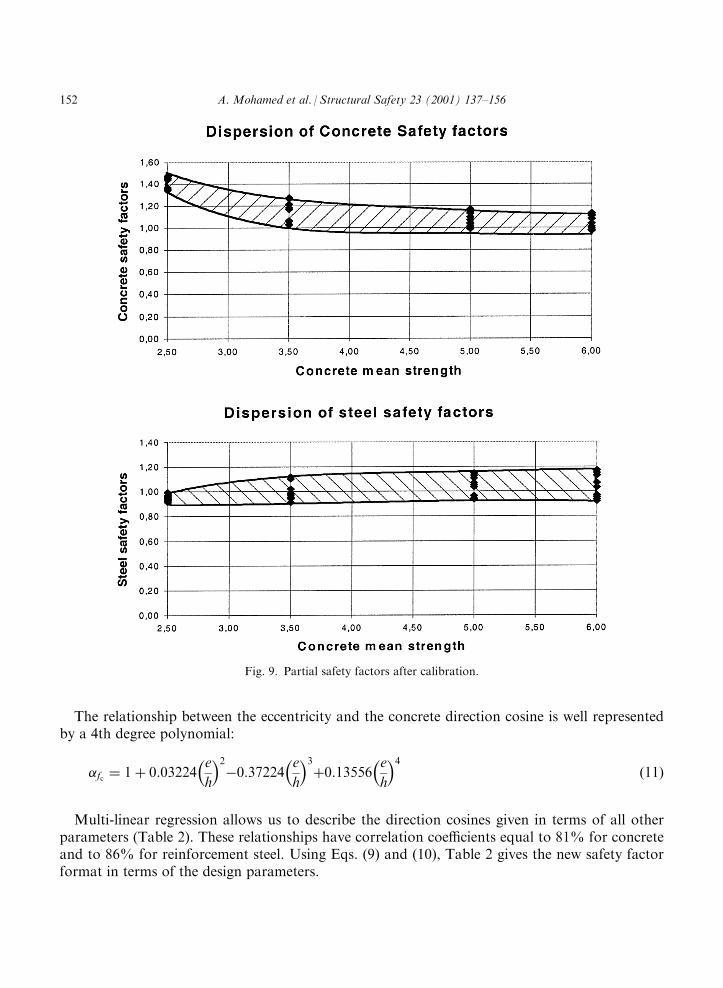
The relationship between the eccentricity and the concrete direction cosine is well representedby a 4th degree polynomial:
�fc ¼ 1þ 0:03224e
h
� �20:37224
e
h
� �3þ0:13556
e
h
� �4ð11Þ
Multi-linear regression allows us to describe the direction cosines given in terms of all otherparameters (Table 2). These relationships have correlation coefficients equal to 81% for concreteand to 86% for reinforcement steel. Using Eqs. (9) and (10), Table 2 gives the new safety factorformat in terms of the design parameters.
Fig. 9. Partial safety factors after calibration.
152 A. Mohamed et al. / Structural Safety 23 (2001) 137–156
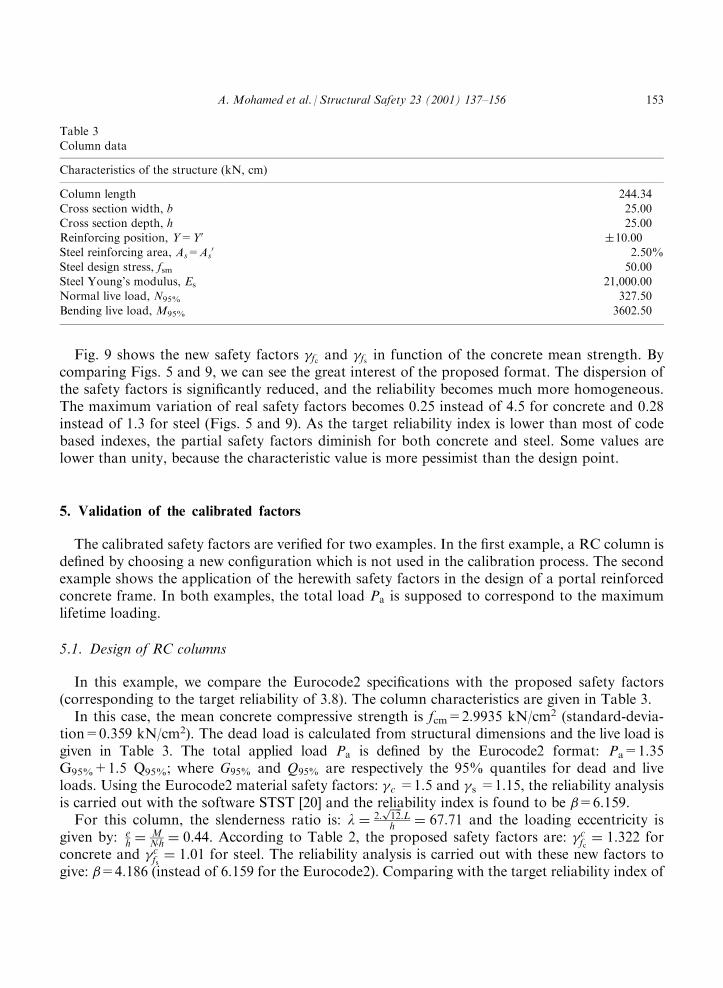
Fig. 9 shows the new safety factors �fc and �fs in function of the concrete mean strength. Bycomparing Figs. 5 and 9, we can see the great interest of the proposed format. The dispersion ofthe safety factors is significantly reduced, and the reliability becomes much more homogeneous.The maximum variation of real safety factors becomes 0.25 instead of 4.5 for concrete and 0.28instead of 1.3 for steel (Figs. 5 and 9). As the target reliability index is lower than most of codebased indexes, the partial safety factors diminish for both concrete and steel. Some values arelower than unity, because the characteristic value is more pessimist than the design point.
5. Validation of the calibrated factors
The calibrated safety factors are verified for two examples. In the first example, a RC column isdefined by choosing a new configuration which is not used in the calibration process. The secondexample shows the application of the herewith safety factors in the design of a portal reinforcedconcrete frame. In both examples, the total load Pa is supposed to correspond to the maximumlifetime loading.
5.1. Design of RC columns
In this example, we compare the Eurocode2 specifications with the proposed safety factors(corresponding to the target reliability of 3.8). The column characteristics are given in Table 3.In this case, the mean concrete compressive strength is fcm=2.9935 kN/cm2 (standard-devia-
tion=0.359 kN/cm2). The dead load is calculated from structural dimensions and the live load isgiven in Table 3. The total applied load Pa is defined by the Eurocode2 format: Pa=1.35G95%+1.5 Q95%; where G95% and Q95% are respectively the 95% quantiles for dead and liveloads. Using the Eurocode2 material safety factors: �c =1.5 and �s =1.15, the reliability analysisis carried out with the software STST [20] and the reliability index is found to be =6.159.For this column, the slenderness ratio is: l ¼ 2:
ffiffiffiffi12
p:L
h ¼ 67:71 and the loading eccentricity isgiven by: e
h ¼M
N�h ¼ 0:44. According to Table 2, the proposed safety factors are: �cfc¼ 1:322 for
concrete and �cfs¼ 1:01 for steel. The reliability analysis is carried out with these new factors to
give: =4.186 (instead of 6.159 for the Eurocode2). Comparing with the target reliability index of
Table 3Column data
Characteristics of the structure (kN, cm)
Column length 244.34
Cross section width, b 25.00Cross section depth, h 25.00Reinforcing position, Y=Y0 �10.00Steel reinforcing area, As=As
0 2.50%
Steel design stress, fsm 50.00Steel Young’s modulus, Es 21,000.00Normal live load, N95% 327.50
Bending live load, M95% 3602.50
A. Mohamed et al. / Structural Safety 23 (2001) 137–156 153
3.8, we have a relative overestimation of 7%, which is very satisfactory for practical design,especially with the several hypotheses made in the calibration development (e.g. approximationsin the � function regression, as shown in Table 2).
5.2. RC portal frame
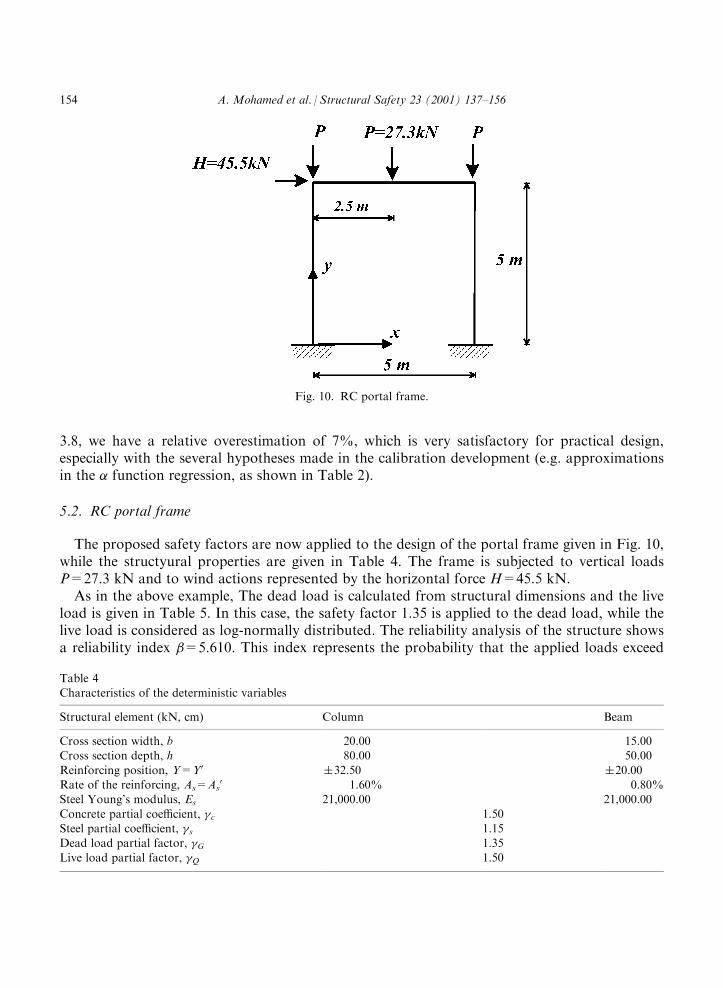
The proposed safety factors are now applied to the design of the portal frame given in Fig. 10,while the structyural properties are given in Table 4. The frame is subjected to vertical loadsP=27.3 kN and to wind actions represented by the horizontal force H=45.5 kN.As in the above example, The dead load is calculated from structural dimensions and the live
load is given in Table 5. In this case, the safety factor 1.35 is applied to the dead load, while thelive load is considered as log-normally distributed. The reliability analysis of the structure showsa reliability index =5.610. This index represents the probability that the applied loads exceed
Fig. 10. RC portal frame.
Table 4Characteristics of the deterministic variables
Structural element (kN, cm) Column Beam
Cross section width, b 20.00 15.00Cross section depth, h 80.00 50.00
Reinforcing position, Y=Y0 �32.50 �20.00Rate of the reinforcing, As=As
0 1.60% 0.80%Steel Young’s modulus, Es 21,000.00 21,000.00
Concrete partial coefficient, �c 1.50Steel partial coefficient, �s 1.15Dead load partial factor, �G 1.35
Live load partial factor, �Q 1.50
154 A. Mohamed et al. / Structural Safety 23 (2001) 137–156
the frame capacity. The cross-section aspect is equal to 4.0. The reinforcement ratio is 1.6% andthe slenderness ratio is l ¼ 43:3. The loading eccentricity in the columns is equal to: e
h ¼ 6:60 > 2.Using the proposed format for �fc and �fs , we get: �c
fc¼ 0:939 and �c
fs¼ 1:167. The analysis
using these values, leads to the new reliability index =3.982, which is sufficiently close to thetarget value 3.8.
6. Conclusion
In this paper, a new format for concrete and steel safety factors is proposed for reinforcedconcrete columns. These factors are related to the design parameters: cross-section aspect, con-crete quality, slenderness ratio, reinforcement ratio and applied loading eccentricity. Comparingwith the Eurocode2 specifications, the proposed factors ensure regular reliability for a wide rangeof design configurations. The reliability analysis takes into account material and geometricalnonlinearities in order to evaluate the ultimate capacity of reinforced concrete structures. Thecoupling between mechanical and reliability models is carried out by the response surface meth-ods, leading to robust procedures with reduced computation cost.As the present results are very encouraging for a better design of reinforced concrete structures,
we intend to extend this work to the analysis of complex reinforced concrete frames with non-symmetrically reinforced cross-sections and non-monotonically loading paths, such as cyclingand dynamic loading. Moreover, a parallel work is in progress in order to take account for eco-nomic and risk considerations during the calibration process.
Acknowledgements
This work has been carried out during the IFMA projects realized by Sonia Blayac, GeraldineOliveux, Frederic Cadiou and Alexandre Rivault. Acknowledgement goes also to FAPESP (SaoPaulo State Research Foundation).
References
[1] Chen WF, Lui EM. Plasticity for structural engineers. New York: McGraw-Hill, 1988.[2] Sargin M. Stress–strain relationship for concrete and the analysis of structural concrete sections. S.M. Study No 4,
University of Waterloo, Solid Mechanics Division, 1971.
[3] Debernardi PG. Behavior of concrete structures in service. J Structural Mechanics, ASCE 1989:32–50.
Table 5Characteristics of the random variables
Random variable (kN, cm) Mean Coefficient ofvariation
Concrete compressive strength, fcm 2.9935 12%Steel stress, fsm 50.00 6%Vertical Live load, P 27.30 20%Horizontal Live load, H 45.50 20%
A. Mohamed et al. / Structural Safety 23 (2001) 137–156 155
[4] Ghali A, Favre R. Concrete structures: structures and deformation. London: Chapman & Hall, 1986.
[5] Comite Euro-International du Beton. CEB-FIP Model Codes. Bulletin d’Information No. 191/195/196/203/204/205/213/214/229, 1988/1990/1993/1995.
[6] Tabsh SW. Safety of concrete members designed by ACI 318, chapter 9 and appendix C load combinations. In:
Probabilistic mechanics and structural reliability. Proceedings of the seventh specialty conference, Worcester,Massachusetts, USA, 1996. p. 218–21.
[7] Frangopol DM, Ide Y, Iwaki I. Effects of load path and load correlation on the reliability of concrete columns. In:
Probabilistic mechanics and structural reliability. Proceedings of the seventh specialty conference, Worcester,Massachusetts, USA, 1996. p. 206–9.
[8] Frangopol DM, Ide Y, Spacone E, Iwaki I. A new look at reliability of reinforced concrete columns. J StructuralSafety 1996;2/3(18):123–50.
[9] Reid SG. Strength and reliability of reinforced concrete columns with sustained loading. In: Probabilisticmechanics and structural reliability. Proceedings of the seventh specialty conference, Worcester, Massachusetts,USA, 1996. p. 234–7.
[10] Holicky M, Vrouwenvelder T. Time variant reliability of a reinforced concrete column. In: Advances in safety andreliability. Proceedings of the ESREL’97 International Conference on Safety and Reliability, Lisbon, Portugal,1997. p. 1307–14.
[11] Val D, Bljuger F, Yankelevsky D. Reliability evaluation in nonlinear analysis of reinforced concrete structures. JStructural Safety 1997;2(19):203–17.
[12] Epaarachchi D, Stewart MG, Rosowsky DV. System risks for multi-story reinforced concrete building construc-
tion. In: Probabilistic mechanics and structural reliability. Proceedings of the seventh specialty conference, Wor-cester, Massachusetts, USA, 1996. p. 230–3.
[13] Simo JC. A finite strain beam formulation. The three-dimensional dynamic problem. Part I. Computer Methods inApplied Mechanics and Engineering 1985;58:79–116.
[14] Crisfield MA. A consistent corotational formulation for nonlinear, three-dimensional, beam elements. ComputerMethods in Applied Mechanics and Engineering 1990;81:131–50.
[15] Mazars J. Application de la mecanique de l’endommagement au comportement non lineaire et a la rupture du
beton de structure. These de Doctorat d’Etat, Universite Paris VI, 1984.[16] Lemaitre J, Chaboche JL. Mecanique des materiaux solides. Paris: Dunod, 1985.[17] Figueiras JA. Ultimate load analysis of anisotropic and reinforced concrete plates and shells. PhD thesis, Uni-
versity of Wales, 1983.[18] Lin KY, Frangopol DM. Reliability-based optimum design of reinforced concrete girders. J Structural Safety
1996;2/3(18):239–58.
[19] Rackwitz R, Fiessler B. Structural reliability under combined random load sequences. Computers and Structures1978;9:489–94.
[20] STST-Software of Statistical design of Structures, Sao Paulo University, Sao Carlos, Brazil, 1999.
156 A. Mohamed et al. / Structural Safety 23 (2001) 137–156


![Design of Reinforced Concrete Columns[1]](https://img.pdfslide.us/doc/110x75/55cf881055034664618ceef8/design-of-reinforced-concrete-columns1.jpg)