Embed Size (px)
Citation preview
Munich Personal RePEc Archive
Partial-Equilibrium and Industrial-Shift
Analysis of the U.S.–Colombia FTA
Lord, Montague
1 April 2004
Online at https://mpra.ub.uni-muenchen.de/50635/
MPRA Paper No. 50635, posted 17 Oct 2013 17:28 UTC
F I N A L R E P O R T
Partial-Equilibrium and Industrial-ShiftAnalysis of the U.S.–Colombia FTA
SUBMITTED TO
USAID/Colombia
SUBMITTED BY
Nathan Associates Inc.
PREPARED BY
Montague J. Lord
April 2004
www.nathan inc . com

Contents
Executive Summary vii
1. Introduction 1
FTAA Process 1
Colombia’s Bilateral Negotiations with the United States 3
Report Structure 3
2. Trade and Market Access Conditions 5
Trade Structure 5
U.S.-Colombia Trade Compatibility 6
Market Access 11
3. Modeling Methodology 13
Alternative Quantitative Approaches 13
Measuring Direct Trade Effects 14
Estimation Procedure—Specification of Import Demand Relationships 19
4. Empirical Estimates 23
Colombia’s Import Demand 23
U.S. Import Demand 25
5. Impact Analysis 33
Staging Tariff Reductions 33
Measuring the FTA Impact 34
II
Contents (continued)
6. Production-Shift Analysis 41
Measuring the Effective Rate of Protection 41
Industry-level Supply Responses to the FTA 43
Output and Employment Adjustments to the FTA 45
Bibliography 65
Appendix A. Technical Descriptions
Appendix B. Statistics
ILLUSTRATIONS
Figures
Figure 3-1. FTA Impact on Colombia’s Production and Consumption 16
Figure 3-2. FTA Effects on Imports 16
Figure 4-1. Average Tariff versus Price Wedge of Major Agricultural Goods, 1991-2002 24
Figure 5-1. Colombia—Impact of FTA on Import Value under Alternative Tariff StagingReductions 37
Figure 5-2. Colombia—Impact of FTA on Export Value under Alternative Tariff Staging
Reductions 37
Figure 6-1. The Geometry of Output Resources 44
Tables
Table 2-1. Colombia Trade with the World and the United States, 1997-2001 6
Table 2-2. Colombia’s Exports to the World and United States, 2001-2002 7
Table 2-3. Colombia’s Imports from the World and United States, 2001-2002 9
Table 2-4. Indices of Trade Compatibility 11
Table 2-5. Comparison of Colombia and U.S. Tariff Schedules 12
Table 4-1. Income, Price, and Exchange Rate Elasticities of Colombia’s Import Demand 26
Table 4-2. Regression Results of U.S. Import Demand for Colombia’s Major Exports 29
III
Contents (continued)
Table 5-1. Impact of FTA on Colombia’s Import Value under Different Tariff StagingReductions 35
Table 5-2. Impact of FTA on Colombia’s Major Export Value to the United States underDifferent Tariff Staging Reductions 36
Table 5-3. Impact of FTA on Colombia’s Trade Based on Chile’s Tariff Staging Schedule 38
Table 6-1. Nominal and Effective Rates of Protection 48
Table 6-2. Regression Results of Colombia’s Production Supply Equation (6.4) 51
Table 6-3. Colombia: Industrial Production FTA-Related Shift-Analysis 55
Table 6-4. Colombia—Employment Effects of Industrial Production Shifts 60

Acknowledgments
This report was prepared under the auspices of USAID/Colombia. The author, Montague
Lord, would like to thank the Ministry of Trade and Industry and the National Planning
Department (Departamento Nacional de Planeacion–DNP) for collaborating on this report.Carolina Lozano (DNP) provided valuable comments on the model and contributed to its
development. Support was also provided by Juan Carlos Elorza, Francisco González (USAID),
and Omer Ozak. Overall direction in the preparation of the report was provided by Khalida
Fazli of Nathan Associates Inc.

Executive Summary
Colombia and the United States began discussing bilateral negotiations for a free trade area
during the summer of 2003. Actual negotiations are expected to begin in mid-2004 and an
agreement is expected to be implemented by 2006. The agreement is likely to be
comprehensive, though the primary benefit for both countries will be increased market access.
This study aims to assess Colombia’s interests in the FTA with the United States. We measurethe effects of the agreement on trade balances and industrial production and employment
using a partial equilibrium approach.
In examining the effects of the FTA under different tariff staging reductions, as well as the
staging scheme adopted in the U.S.–Chile FTA, we recognize that Colombia already enjoyspreferential access to the U.S. market and therefore lower tariffs on most exports under
ATPADEA. Thus, our simulations examine the impact of an agreement should ATPADEA
benefits expire. We evaluate the impact of the FTA on Colombia’s imports and exports to theUnited States for staging of tariff reductions between one and 10 years. As expected, the effect
on imports is significant because of the relatively high price elasticity of Colombia’s importsand the initially high tariffs. The cumulative impact of imports is about 18 percent growth in
their value over 10 years.
The effect on U.S. imports of Colombian products is likely to be small because of the
comparatively low tariffs on U.S. imports and relatively low average price elasticity of U.S.
import demand. Although changes in the volume of Colombia’s exports are proportional to
changes in U.S. imports of those products resulting from tariff-induced price changes, the
same does not hold for the value of the exports. While tariff cuts lower prices for U.S.
consumers, those cuts do not affect the price received by Colombian exports to the U.S.
market. As a result, tariff-induced price changes cause Colombia’s exports to expand, withoutaffecting the corresponding prices of those exports in Colombia.
We also evaluate the impact of the FTA on Colombia’s exports and imports based on the
broad guidelines of the U.S.-Chile FTA whereby tariffs on agricultural products are
eliminated over 12 years and tariffs on other products are eliminated over 10 years. As
expected, Colombia’s imports are likely to increase more than its exports, with the result that
VIII PARTIAL-EQUILIBRIUM AND INDUSTRIAL-SHIFTANALYSIS OF THEU.S.–COLOMBIA FTA
the trade balance with the United States deteriorates somewhat. But while exports to the
United States generally have a dampened response to tariff-induced price changes, some
export products have considerably higher than average responses to those changes. For
example, petroleum gases, anthracite coal, propane, and some cotton knits have particularly
high price elasticities of import demand, and imports in the U.S. market therefore tend to
respond strongly to price variations. Colombia’s trade balance with the United States willremain in surplus.
Industry-level analysis—which examines the cascading effects of Colombia’s present tariff
structure by considering trade taxes applied to imports of raw materials and intermediate
goods that affect the price of the final good—offers useful measures of how trade
liberalization alters effective rates of protection. The effective rate of protection measures how
tariffs on a product and its tradable inputs jointly affect the value added of a particular
activity. Calculating only the nominal rate of protection suggests that the tariff on imports
will encourage domestic producers to increase their output. But whether they do so depends
also on the tariffs applied to inputs used in manufacturing. The effective rate of protection
therefore measures the net protection on the production process rather than simply the gross
protection on the industry’s output.
The incidence of tariff reductions for inputs and final products differs between import-
substitution industries and export-oriented ones. In measuring the incidence of the effective
rate of protection in Colombia and its elimination under the FTA we separate calculations for
export-oriented and import-competing industries. For import-substituting industries, the
tariff on the final good acts as a subsidy, while the tariff on inputs acts as a tax. Protection
granted to final goods therefore increases returns to value-adding factors in those industries.
Higher protection on outputs raises the domestic prices for import-competing goods and
increases the returns for their production. Taxes on intermediate inputs, however, reduce the
returns to value-adding factors.
Export-oriented industries derive no benefits from domestic protection on their output.
Instead, they confront world prices for their sales while being taxed on their inputs through
tariffs paid on imported inputs. Because Colombia’s tariff regime raises prices for
intermediate goods its effect on the country’s export-oriented industries is always negative.
For most import-substituting industries, the FTA will likely lead to contractions, but cost
reductions will substantially mitigate the effects of those contractions (e.g., when the nominal
rate of protection declines by 13 percent, cost-associated price declines averaging -9 percent
nearly will offset price declines averaging 11 percent). Export-oriented industries are expected
to expand production by nearly 10 percent on average as a result of lower input costs likely
under an FTA. Especially large production increases are expected in export activities for
fruits, nuts, and beverages; cattle farming; forestry products; coal mining; petroleum, canning
of fruits and vegetables; and manufactures of vegetable and animal oils. Output of import-
substituting industries is expected to contract by nearly 4 percent as producers face more
EXECUTIVE SUMMARY IX
competition from foreign suppliers. Overall, gains from expanded output in export-oriented
industries significantly outweigh contractions likely to be experienced by import-substituting
industries, and Colombia’s output could expand by about 5 percent overall.
The employment effects associated with FTA-induced adjustments in Colombia’s industriesassumes fixed labor-output coefficients in production. For this reason, export-oriented
industries likely to expand their employment are those that will increase their output
significantly, while those experiencing the largest contractions in employment are those with
larger output adjustments. Overall, total employment in Colombia is likely to increase by
more than 5 percent, with the largest gains in mining industries, followed by export-oriented
industrial activities. Naturally the biggest gains will occur in export-oriented industries,
which are likely to increase employment by 7.5 percent. Import-competing industries are
likely to experience contractions in their labor force, which in our estimates average less than
4 percent.
In sum, labor adjustment costs are likely to be relatively small. Twenty percent of the formal
labor force works in import-substituting manufacturing, which is the most vulnerable sector.
Even if 4 percent of those workers have to change jobs, the adjustment would represent
considerably less than 1 percent of the labor force. Moreover, the labor turnover rate in
manufacturing is normally 78 percent a year, so this reduction could be accommodated by
normal turnover in 2 years. Many displaced workers will likely be absorbed into other sectors,
especially the service and export-oriented industries, the latter of which is expected to
increase its employment by 7.5 percent, which would add another 1.5 percent to Colombia’stotal employment figures under the FTA. In addition, evidence of significant Colombian labor
force mobility suggests that workers could adjust from import-substituting industries to those
directed to export markets because tariff reductions are likely to take place over several years.

1. Introduction
In this study we assess Colombia’s interests in a free-trade area with the United States, eitherthrough the Free Trade Area of the Americas (FTAA) regional trade agreement or a bilateral
trade agreement. Our purpose is to provide the Government of Colombia with a quantitative
framework for analyzing the country’s interests in liberalizing trade with the United States ina manner that is economically and technically viable, supportive of the Government’s overall
reform program, and responsive to private sector needs. We provide detailed product and
industry-specific information on the effects of implementing tariff changes to support a
practical, action-oriented plan.
We measure the effects of trade liberalization between Colombia and the United States using
a partial equilibrium approach. We use sector, industry, or product estimates to examine the
effects of changes in trade policy on sectors or products of particular interest. Because these
types of models examine narrow product categories, they are able to capture the likely direct
effects of policy changes on individual products. They do not, however, capture interactions
between sectors and so do not account for secondary or indirect effects that could result as
capital and labor move from the less productive to the more productive sectors. Thus, while
partial equilibrium models are suitable for examining the direct effects of liberalization on
narrow product categories, general equilibrium analysis is more suitable for analyzing the
effects of trade liberalization on upstream, downstream, and substitute products. Partial
equilibrium analysis can also be dynamic, and in contrast to general equilibrium analysis, can
be used to assess the impact of trade policy reforms over time.
FTAAProcess
The FTAA initiative was formally launched at the 1994 Summit of the Americas in Miami. The
intent is to complete negotiations by January 2005 to develop obligations in 10 areas: market
access, agriculture, services, investment, government procurement, intellectual property,
competition policy, subsidies, antidumping and countervailing duties, and dispute
settlement. Progress has been slow. To ensure that negotiations conclude by January 2005, the
Eighth Ministerial Meeting held in November 2003 broke with the “single undertaking”
2 PARTIAL-EQUILIBRIUM AND INDUSTRIAL-SHIFTANALYSIS OF THEU.S.–COLOMBIA FTA
principle that all issues are to be negotiated as a block. Instead, a mixed plan was approved
whereby countries will accept shared obligations on a series of issues but have the option of
engaging in bilateral or multilateral negotiations on other issues.
The final FTAA will be divided into a basic agreement and additional agreements. The basic
agreement will cover common obligations for all countries, but at a lower level than originally
envisioned. The additional agreements will allow countries to participate at different levels of
commitment. While the basic agreement will likely cover market access commitments, the
additional agreements will cover areas such as investment, intellectual property, customs
clearance, rules of origin and government procurement.
The objectives of the market access negotiations were set out at the Fourth Meeting of
Ministers of Trade in San Jose, Costa Rica, in March 1998.1 These objectives were as follows:
Progressive elimination of tariffs, nontariff barriers, and other measures restricting trade
between participating countries;
Negotiation of all tariffs;
Negotiation of different trade liberalization timetables; and
Inclusion of smaller economies in FTAA negotiations.
Initial market access offers were to be made on all tariff lines by August 2003.2 Those offers
represented reductions to FTAA member countries making similar concessions from the base
most-favored-nation (MFN) tariff schedules. Thereafter, revised offers were to be submitted
that provided for linear tariff eliminations, meaning that all tariffs, regardless of their levels,
would be reduced by an agreed percentage. There is, however, the possibility of nonlinear
exceptions that provide for different rates of tariff cuts across products. Countries can select
from four types of schedules for tariff elimination: immediate, no more than five years, no
more than 10 years, and longer than 10 years.
For nontariff measures, countries were to submit an initial report on notification of such
measures by November 2002. A common methodology was then to be developed for their
reduction and elimination. These measures included those distorting trade in agricultural
products, including those that have an effect equivalent to agricultural export subsidies.
1 See http://www.ftaa-alca.org/ngroups/popup/PopMAObjectives_e.htm.2 The product offers were to consist of (1) the percentage of trade (by value) with hemispheric partners in eachof the product baskets (A, B, C, and D), as well as for products not included in any basket; (2) the percentageof tariff lines represented by products offered in each product basket (A, B, C, and D), as well as for productsnot included in any basket; (3) the percentage of trade (by value) with hemispheric partners in each productbasket (A, B, C, and D) that is subject to tariff-rate quotas; and (4) the percentage of tariff lines in each productbasket (A, B, C, and D) that are subject to tariff-rate quotas. Agricultural products are to be considered as aseparate product basket. See http://www.ftaa-alca.org/TNC/tnc23_e.asp.
INTRODUCTION 3
Colombia’sBilateralNegotiationswiththeUnitedStates
The collapse of the World Trade Organization (WTO) talks in Cancun, Mexico, in 2003
focused interest on regional and bilateral negotiations in the Americas and elsewhere.
Colombia is no longer a part of a group of developing countries that opposed WTO
negotiations without a resolution of the U.S. and EU agricultural subsidies. Instead, it and
other Latin American countries are entering into discussions regarding bilateral trade
agreements with the United States.
Colombia and the United States initiated discussions on bilateral negotiations during the
summer of 2003, with actual negotiations expected to begin in spring 2004 and the planned
implementation of the agreement to begin by 2006. The FTA is likely to be comprehensive
and, notwithstanding the variety and complexity of issues to be negotiated, increased market
access is likely to be the primary benefit for both countries when all goods traded between the
two countries receive duty-free access.
The start-up of operations would coincide roughly with the expiration of the current Andean
Trade Preference Act–Drug Eradication Act (ATPADEA), which was signed in 1991 andrenewed in 2002 to provide Bolivia, Colombia, Ecuador, and Peru with duty-free or reduced-
duty access for certain goods exported to the U.S. market. Although many supporters of
ATPA sought to renew it before its expiration in 2001, the U.S. House of Representatives and
Senate did not reach an agreement on a final bill that would allow ATPA to continue. It was
only on August 6, 2002, that President Bush renewed a new version of ATPA through
December 31, 2006. The current version provides duty-free access to additional products such
as petroleum and petroleum products, regional apparel, footwear, certain leather items, and
tuna. One of the benefits of a FTA for Colombia would be that its exports would not have to
rely on periodic congressional reauthorization of preferential treatment, such as granted
under the ATPA.
ReportStructure
In Chapter 2 we characterize trade and market access conditions between Colombia and the
United States, including the structure and geographic composition of Colombia’s trade, andthe country’s commodity trade with the United States; the compatibility of Colombia’s trade
with the United States; and the existing tariff structures of both countries. In Chapter 3 we
describe methods used to quantify trade liberalization schemes and the partial equilibrium
model that we have chosen for this study. In Chapter 4 we set forth empirical estimates of the
trade relationship in the model at the detailed product and industry levels, and summarize
results. Chapter 5 presents the results of our model simulations under alternative trade
liberalization strategies. We compare the direct effects of trade liberalization across those
alternative strategies, discussing the overall and product-specific impacts under each

4 PARTIAL-EQUILIBRIUM AND INDUSTRIAL-SHIFTANALYSIS OF THEU.S.–COLOMBIA FTA
scenario. Chapter 6 examines production shifts likely to take place in export-oriented and
import-substituting industries, and measures their likely changes in output and employment
levels. Technical and statistical data, including modeling data, are provided in appendixes.
2. Trade andMarketAccessConditions
TradeStructure
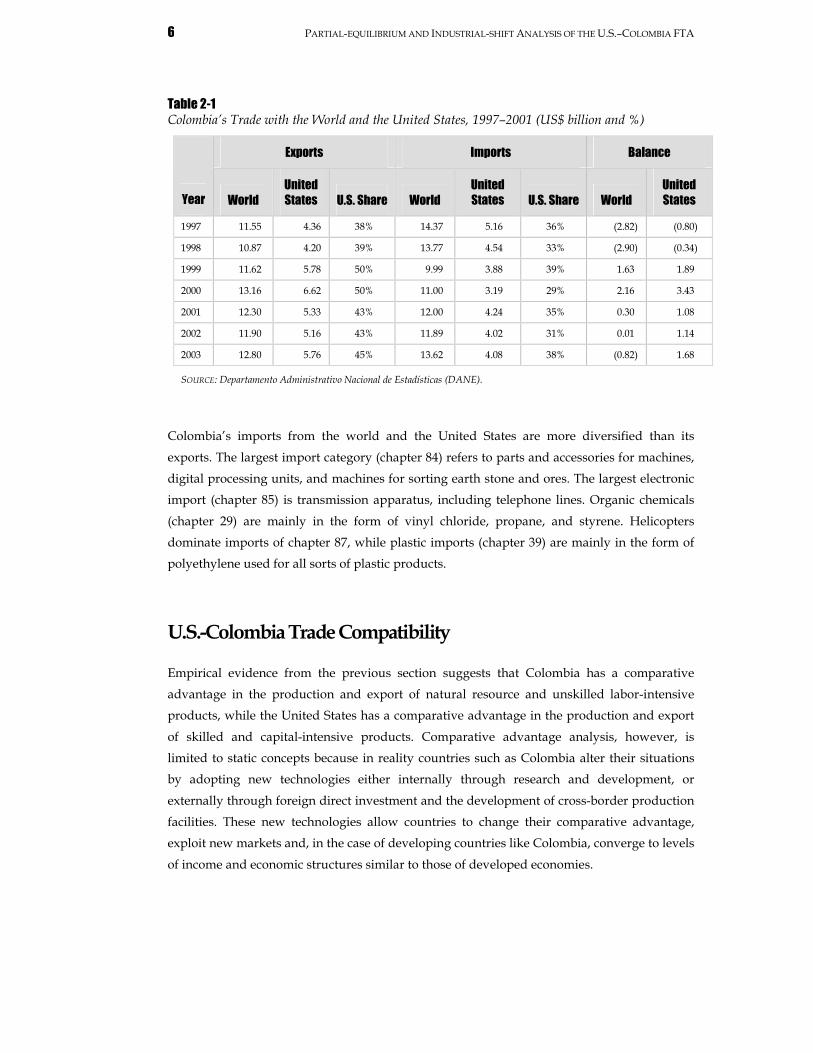
Colombia’s overall trade with the United States represented an average of 40 percent of totaltrade between 1997 and 2003.3While the importance of the U.S. market grew from less than 40
percent to 45 percent in the last 7 years, the share of imports from the United States changed
little. As a result, Colombia has experienced a growing trade surplus with the United States,
while maintaining a generally un-trending trade balance with the rest of the world (Table 2-1).
These patterns suggest, first, that Colombia’s trade surplus with the United States has helpedits current account balance; and secondly, that a FTA with the United States could afford an
opportunity for Colombia to further improve its trade surplus over the long run by offering
increased opportunities for exporters to exploit market growth opportunities in the United
States.
On the export side, Colombia is no longer a dual-export economy dependent on petroleum
and coffee for foreign exchange revenue. Exports, however, remain fairly concentrated in
natural resource–based products such as fuels, coffee, live plants, edible fruits, sugar, iron andsteel, paper and paperboard, chemical products, fish and crustaceans, ornamental fish, and
precious and semiprecious stones (Table 2-2). Other types of products are mainly unskilled,
labor-intensive products such as plastics, apparel and accessories, tanning dyes and extracts,
and electric motors and transformers. Of these exports, the major ones currently directed to
the United States are petroleum, cut flowers, coffee, paint pigments, apparel items, bananas,
and precious and semiprecious stones.
3 Total trade is defined as exports plus imports.
6 PARTIAL-EQUILIBRIUM AND INDUSTRIAL-SHIFTANALYSIS OF THEU.S.–COLOMBIA FTA
Table 2-1Colombia’s Trade with the World and the United States, 1997–2001 (US$ billion and %)
Exports Imports Balance
Year World
United
States U.S. Share World
United
States U.S. Share World
United
States
1997 11.55 4.36 38% 14.37 5.16 36% (2.82) (0.80)
1998 10.87 4.20 39% 13.77 4.54 33% (2.90) (0.34)
1999 11.62 5.78 50% 9.99 3.88 39% 1.63 1.89
2000 13.16 6.62 50% 11.00 3.19 29% 2.16 3.43
2001 12.30 5.33 43% 12.00 4.24 35% 0.30 1.08
2002 11.90 5.16 43% 11.89 4.02 31% 0.01 1.14
2003 12.80 5.76 45% 13.62 4.08 38% (0.82) 1.68
SOURCE: Departamento Administrativo Nacional de Estadísticas (DANE).
Colombia’s imports from the world and the United States are more diversified than its
exports. The largest import category (chapter 84) refers to parts and accessories for machines,
digital processing units, and machines for sorting earth stone and ores. The largest electronic
import (chapter 85) is transmission apparatus, including telephone lines. Organic chemicals
(chapter 29) are mainly in the form of vinyl chloride, propane, and styrene. Helicopters
dominate imports of chapter 87, while plastic imports (chapter 39) are mainly in the form of
polyethylene used for all sorts of plastic products.
U.S.-ColombiaTradeCompatibility
Empirical evidence from the previous section suggests that Colombia has a comparative
advantage in the production and export of natural resource and unskilled labor-intensive
products, while the United States has a comparative advantage in the production and export
of skilled and capital-intensive products. Comparative advantage analysis, however, is
limited to static concepts because in reality countries such as Colombia alter their situations
by adopting new technologies either internally through research and development, or
externally through foreign direct investment and the development of cross-border production
facilities. These new technologies allow countries to change their comparative advantage,
exploit new markets and, in the case of developing countries like Colombia, converge to levels
of income and economic structures similar to those of developed economies.
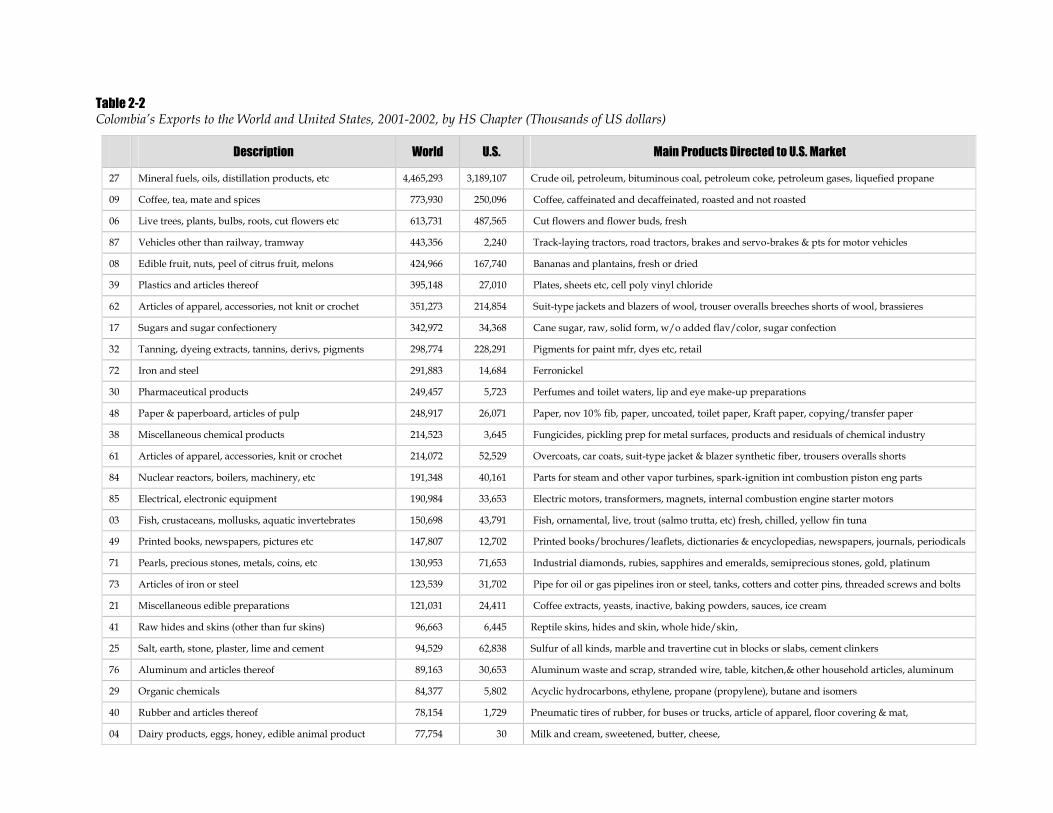
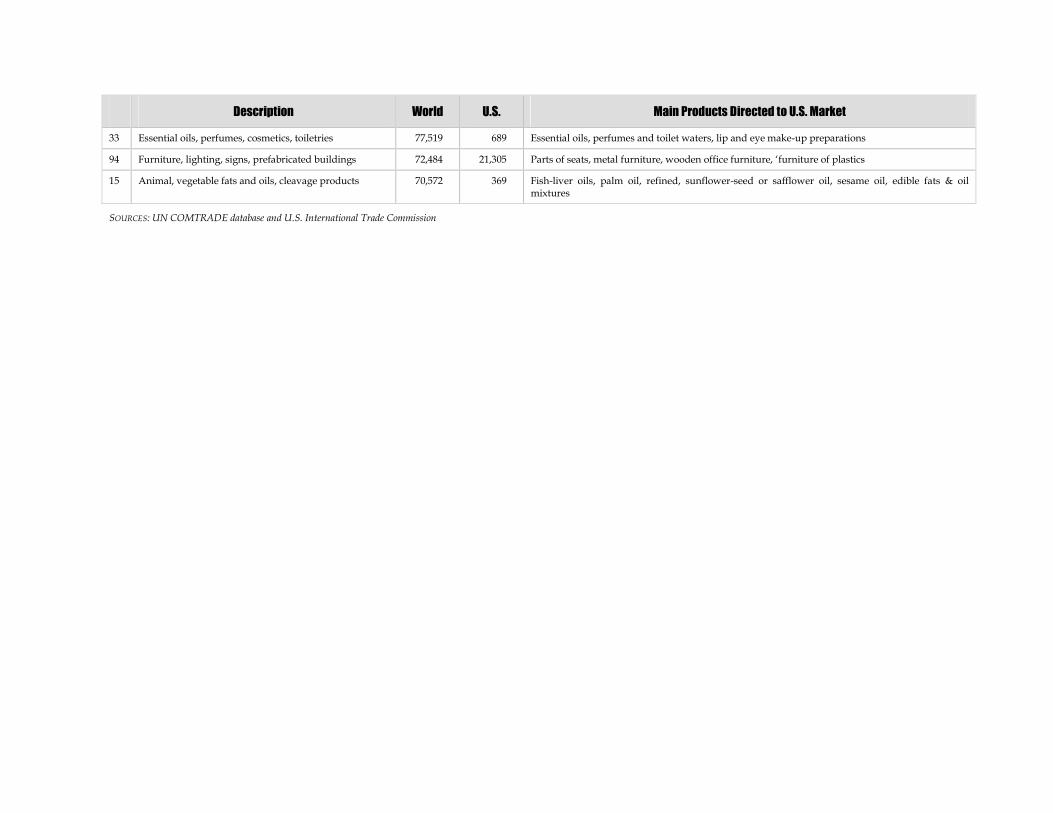
Table 2-2Colombia’s Exports to the World and United States, 2001-2002, by HS Chapter (Thousands of US dollars)
Description World U.S. Main Products Directed to U.S. Market
27 Mineral fuels, oils, distillation products, etc 4,465,293 3,189,107 Crude oil, petroleum, bituminous coal, petroleum coke, petroleum gases, liquefied propane
09 Coffee, tea, mate and spices 773,930 250,096 Coffee, caffeinated and decaffeinated, roasted and not roasted
06 Live trees, plants, bulbs, roots, cut flowers etc 613,731 487,565 Cut flowers and flower buds, fresh
87 Vehicles other than railway, tramway 443,356 2,240 Track-laying tractors, road tractors, brakes and servo-brakes & pts for motor vehicles
08 Edible fruit, nuts, peel of citrus fruit, melons 424,966 167,740 Bananas and plantains, fresh or dried
39 Plastics and articles thereof 395,148 27,010 Plates, sheets etc, cell poly vinyl chloride
62 Articles of apparel, accessories, not knit or crochet 351,273 214,854 Suit-type jackets and blazers of wool, trouser overalls breeches shorts of wool, brassieres
17 Sugars and sugar confectionery 342,972 34,368 Cane sugar, raw, solid form, w/o added flav/color, sugar confection
32 Tanning, dyeing extracts, tannins, derivs, pigments 298,774 228,291 Pigments for paint mfr, dyes etc, retail
72 Iron and steel 291,883 14,684 Ferronickel
30 Pharmaceutical products 249,457 5,723 Perfumes and toilet waters, lip and eye make-up preparations
48 Paper & paperboard, articles of pulp 248,917 26,071 Paper, nov 10% fib, paper, uncoated, toilet paper, Kraft paper, copying/transfer paper
38 Miscellaneous chemical products 214,523 3,645 Fungicides, pickling prep for metal surfaces, products and residuals of chemical industry
61 Articles of apparel, accessories, knit or crochet 214,072 52,529 Overcoats, car coats, suit-type jacket & blazer synthetic fiber, trousers overalls shorts
84 Nuclear reactors, boilers, machinery, etc 191,348 40,161 Parts for steam and other vapor turbines, spark-ignition int combustion piston eng parts
85 Electrical, electronic equipment 190,984 33,653 Electric motors, transformers, magnets, internal combustion engine starter motors
03 Fish, crustaceans, mollusks, aquatic invertebrates 150,698 43,791 Fish, ornamental, live, trout (salmo trutta, etc) fresh, chilled, yellow fin tuna
49 Printed books, newspapers, pictures etc 147,807 12,702 Printed books/brochures/leaflets, dictionaries & encyclopedias, newspapers, journals, periodicals
71 Pearls, precious stones, metals, coins, etc 130,953 71,653 Industrial diamonds, rubies, sapphires and emeralds, semiprecious stones, gold, platinum
73 Articles of iron or steel 123,539 31,702 Pipe for oil or gas pipelines iron or steel, tanks, cotters and cotter pins, threaded screws and bolts
21 Miscellaneous edible preparations 121,031 24,411 Coffee extracts, yeasts, inactive, baking powders, sauces, ice cream
41 Raw hides and skins (other than fur skins) 96,663 6,445 Reptile skins, hides and skin, whole hide/skin,
25 Salt, earth, stone, plaster, lime and cement 94,529 62,838 Sulfur of all kinds, marble and travertine cut in blocks or slabs, cement clinkers
76 Aluminum and articles thereof 89,163 30,653 Aluminum waste and scrap, stranded wire, table, kitchen,& other household articles, aluminum
29 Organic chemicals 84,377 5,802 Acyclic hydrocarbons, ethylene, propane (propylene), butane and isomers
40 Rubber and articles thereof 78,154 1,729 Pneumatic tires of rubber, for buses or trucks, article of apparel, floor covering & mat,
04 Dairy products, eggs, honey, edible animal product 77,754 30 Milk and cream, sweetened, butter, cheese,
Description World U.S. Main Products Directed to U.S. Market
33 Essential oils, perfumes, cosmetics, toiletries 77,519 689 Essential oils, perfumes and toilet waters, lip and eye make-up preparations
94 Furniture, lighting, signs, prefabricated buildings 72,484 21,305 Parts of seats, metal furniture, wooden office furniture, ‘furniture of plastics
15 Animal, vegetable fats and oils, cleavage products 70,572 369 Fish-liver oils, palm oil, refined, sunflower-seed or safflower oil, sesame oil, edible fats & oilmixtures
SOURCES: UN COMTRADE database and U.S. International Trade Commission
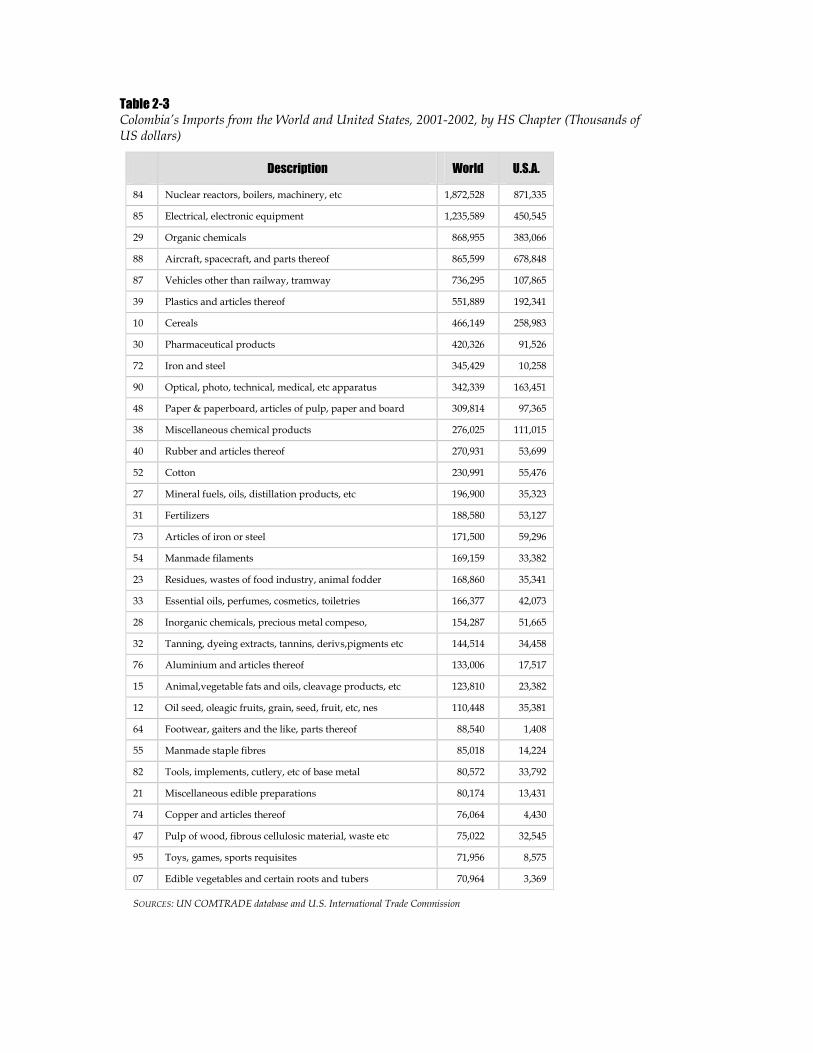
Table 2-3Colombia’s Imports from the World and United States, 2001-2002, by HS Chapter (Thousands ofUS dollars)
Description World U.S.A.
84 Nuclear reactors, boilers, machinery, etc 1,872,528 871,335
85 Electrical, electronic equipment 1,235,589 450,545
29 Organic chemicals 868,955 383,066
88 Aircraft, spacecraft, and parts thereof 865,599 678,848
87 Vehicles other than railway, tramway 736,295 107,865
39 Plastics and articles thereof 551,889 192,341
10 Cereals 466,149 258,983
30 Pharmaceutical products 420,326 91,526
72 Iron and steel 345,429 10,258
90 Optical, photo, technical, medical, etc apparatus 342,339 163,451
48 Paper & paperboard, articles of pulp, paper and board 309,814 97,365
38 Miscellaneous chemical products 276,025 111,015
40 Rubber and articles thereof 270,931 53,699
52 Cotton 230,991 55,476
27 Mineral fuels, oils, distillation products, etc 196,900 35,323
31 Fertilizers 188,580 53,127
73 Articles of iron or steel 171,500 59,296
54 Manmade filaments 169,159 33,382
23 Residues, wastes of food industry, animal fodder 168,860 35,341
33 Essential oils, perfumes, cosmetics, toiletries 166,377 42,073
28 Inorganic chemicals, precious metal compeso, 154,287 51,665
32 Tanning, dyeing extracts, tannins, derivs,pigments etc 144,514 34,458
76 Aluminium and articles thereof 133,006 17,517
15 Animal,vegetable fats and oils, cleavage products, etc 123,810 23,382
12 Oil seed, oleagic fruits, grain, seed, fruit, etc, nes 110,448 35,381
64 Footwear, gaiters and the like, parts thereof 88,540 1,408
55 Manmade staple fibres 85,018 14,224
82 Tools, implements, cutlery, etc of base metal 80,572 33,792
21 Miscellaneous edible preparations 80,174 13,431
74 Copper and articles thereof 76,064 4,430
47 Pulp of wood, fibrous cellulosic material, waste etc 75,022 32,545
95 Toys, games, sports requisites 71,956 8,575
07 Edible vegetables and certain roots and tubers 70,964 3,369
SOURCES: UN COMTRADE database and U.S. International Trade Commission
10 PARTIAL-EQUILIBRIUM AND INDUSTRIAL-SHIFTANALYSIS OF THEU.S.–COLOMBIA FTA
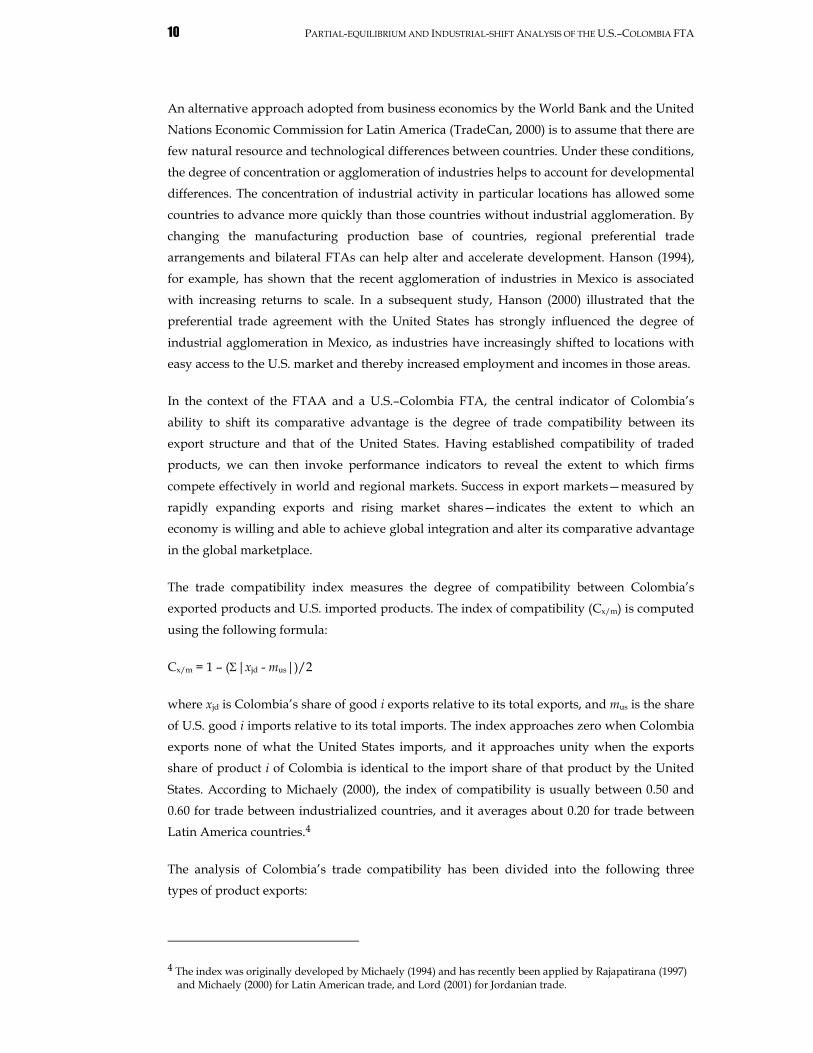
An alternative approach adopted from business economics by the World Bank and the United
Nations Economic Commission for Latin America (TradeCan, 2000) is to assume that there are
few natural resource and technological differences between countries. Under these conditions,
the degree of concentration or agglomeration of industries helps to account for developmental
differences. The concentration of industrial activity in particular locations has allowed some
countries to advance more quickly than those countries without industrial agglomeration. By
changing the manufacturing production base of countries, regional preferential trade
arrangements and bilateral FTAs can help alter and accelerate development. Hanson (1994),
for example, has shown that the recent agglomeration of industries in Mexico is associated
with increasing returns to scale. In a subsequent study, Hanson (2000) illustrated that the
preferential trade agreement with the United States has strongly influenced the degree of
industrial agglomeration in Mexico, as industries have increasingly shifted to locations with
easy access to the U.S. market and thereby increased employment and incomes in those areas.
In the context of the FTAA and a U.S.–Colombia FTA, the central indicator of Colombia’s
ability to shift its comparative advantage is the degree of trade compatibility between its
export structure and that of the United States. Having established compatibility of traded
products, we can then invoke performance indicators to reveal the extent to which firms
compete effectively in world and regional markets. Success in export markets—measured by
rapidly expanding exports and rising market shares—indicates the extent to which an
economy is willing and able to achieve global integration and alter its comparative advantage
in the global marketplace.
The trade compatibility index measures the degree of compatibility between Colombia’sexported products and U.S. imported products. The index of compatibility (Cx/m) is computed
using the following formula:
Cx/m = 1 – (|xjd - mus|)/2
where xjd is Colombia’s share of good i exports relative to its total exports, and mus is the share
of U.S. good i imports relative to its total imports. The index approaches zero when Colombia
exports none of what the United States imports, and it approaches unity when the exports
share of product i of Colombia is identical to the import share of that product by the United
States. According to Michaely (2000), the index of compatibility is usually between 0.50 and
0.60 for trade between industrialized countries, and it averages about 0.20 for trade between
Latin America countries.4
The analysis of Colombia’s trade compatibility has been divided into the following threetypes of product exports:
4 The index was originally developed by Michaely (1994) and has recently been applied by Rajapatirana (1997)and Michaely (2000) for Latin American trade, and Lord (2001) for Jordanian trade.
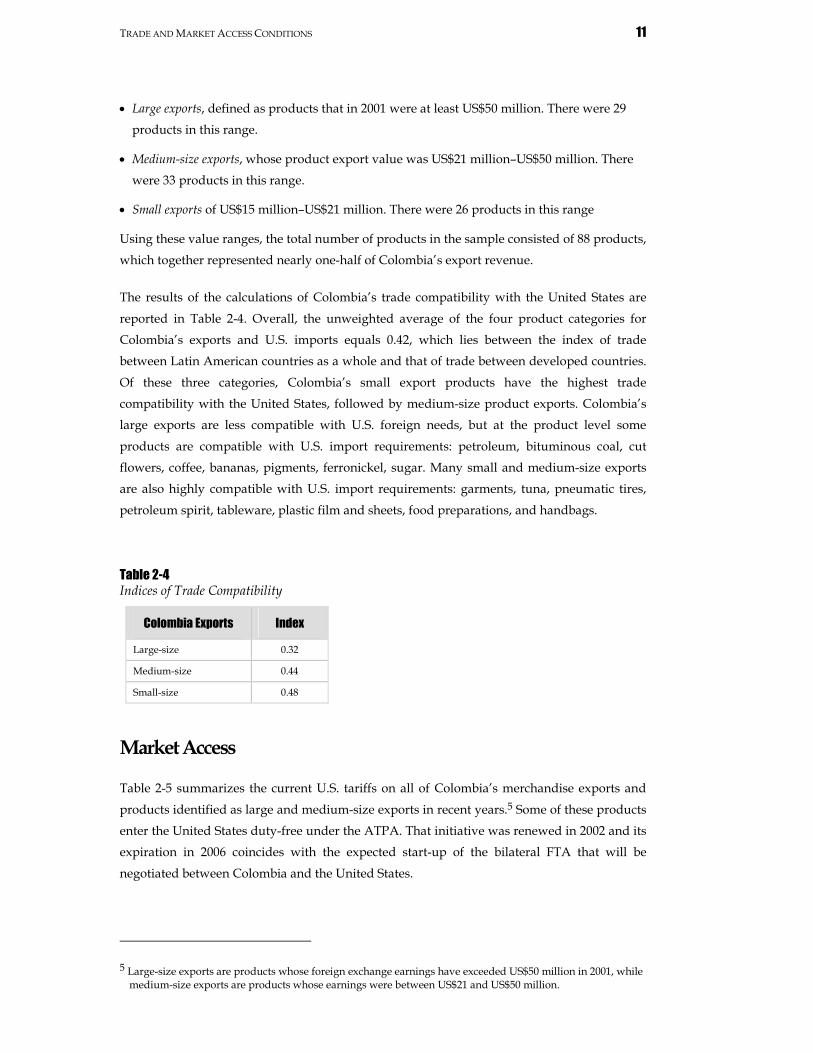
TRADE ANDMARKETACCESSCONDITIONS 11
Large exports, defined as products that in 2001 were at least US$50 million. There were 29
products in this range.
Medium-size exports, whose product export value was US$21 million–US$50 million. Therewere 33 products in this range.
Small exports of US$15 million–US$21 million. There were 26 products in this range
Using these value ranges, the total number of products in the sample consisted of 88 products,
which together represented nearly one-half of Colombia’s export revenue.
The results of the calculations of Colombia’s trade compatibility with the United States are
reported in Table 2-4. Overall, the unweighted average of the four product categories for
Colombia’s exports and U.S. imports equals 0.42, which lies between the index of tradebetween Latin American countries as a whole and that of trade between developed countries.
Of these three categories, Colombia’s small export products have the highest trade
compatibility with the United States, followed by medium-size product exports. Colombia’slarge exports are less compatible with U.S. foreign needs, but at the product level some
products are compatible with U.S. import requirements: petroleum, bituminous coal, cut
flowers, coffee, bananas, pigments, ferronickel, sugar. Many small and medium-size exports
are also highly compatible with U.S. import requirements: garments, tuna, pneumatic tires,
petroleum spirit, tableware, plastic film and sheets, food preparations, and handbags.
Table 2-4Indices of Trade Compatibility
Colombia Exports Index
Large-size 0.32
Medium-size 0.44
Small-size 0.48
MarketAccess
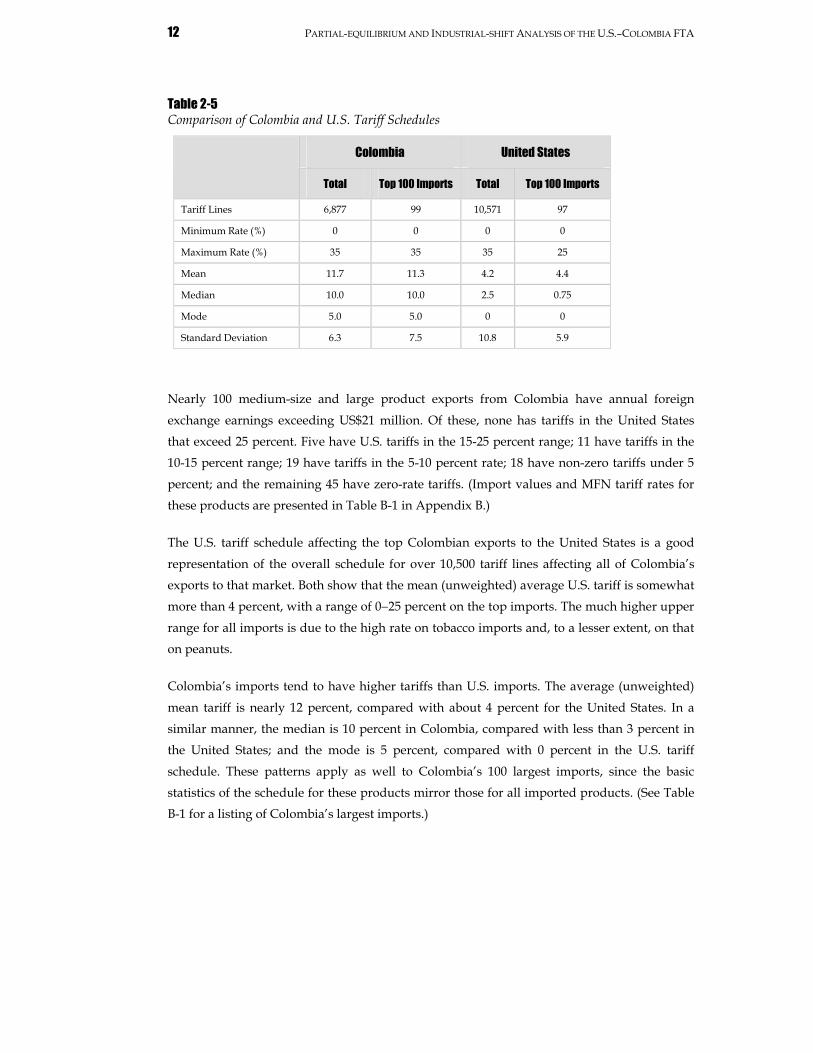
Table 2-5 summarizes the current U.S. tariffs on all of Colombia’s merchandise exports and
products identified as large and medium-size exports in recent years.5 Some of these products
enter the United States duty-free under the ATPA. That initiative was renewed in 2002 and its
expiration in 2006 coincides with the expected start-up of the bilateral FTA that will be
negotiated between Colombia and the United States.
5 Large-size exports are products whose foreign exchange earnings have exceeded US$50 million in 2001, whilemedium-size exports are products whose earnings were between US$21 and US$50 million.
12 PARTIAL-EQUILIBRIUM AND INDUSTRIAL-SHIFTANALYSIS OF THEU.S.–COLOMBIA FTA
Table 2-5Comparison of Colombia and U.S. Tariff Schedules
Colombia United States
Total Top 100 Imports Total Top 100 Imports
Tariff Lines 6,877 99 10,571 97
Minimum Rate (%) 0 0 0 0
Maximum Rate (%) 35 35 35 25
Mean 11.7 11.3 4.2 4.4
Median 10.0 10.0 2.5 0.75
Mode 5.0 5.0 0 0
Standard Deviation 6.3 7.5 10.8 5.9
Nearly 100 medium-size and large product exports from Colombia have annual foreign
exchange earnings exceeding US$21 million. Of these, none has tariffs in the United States
that exceed 25 percent. Five have U.S. tariffs in the 15-25 percent range; 11 have tariffs in the
10-15 percent range; 19 have tariffs in the 5-10 percent rate; 18 have non-zero tariffs under 5
percent; and the remaining 45 have zero-rate tariffs. (Import values and MFN tariff rates for
these products are presented in Table B-1 in Appendix B.)
The U.S. tariff schedule affecting the top Colombian exports to the United States is a good
representation of the overall schedule for over 10,500 tariff lines affecting all of Colombia’sexports to that market. Both show that the mean (unweighted) average U.S. tariff is somewhat
more than 4 percent, with a range of 025 percent on the top imports. The much higher upper
range for all imports is due to the high rate on tobacco imports and, to a lesser extent, on that
on peanuts.
Colombia’s imports tend to have higher tariffs than U.S. imports. The average (unweighted)
mean tariff is nearly 12 percent, compared with about 4 percent for the United States. In a
similar manner, the median is 10 percent in Colombia, compared with less than 3 percent in
the United States; and the mode is 5 percent, compared with 0 percent in the U.S. tariff
schedule. These patterns apply as well to Colombia’s 100 largest imports, since the basicstatistics of the schedule for these products mirror those for all imported products. (See Table
B-1 for a listing of Colombia’s largest imports.)
3.ModelingMethodology
AlternativeQuantitativeApproaches
Most attempts to quantify the effects of trade liberalization rely on one of the following
approaches, each of which provides a level of information that is not generally available in the
other approaches:
Partial equilibrium analysis uses single-sector or single-product estimates of supply and
demand to examine the effects of trade liberalization on particular sectors or products.
Because these models examine narrow product categories, they can capture the likely direct
effects of policy changes on individual products. Moreover, partial equilibrium analysis is
dynamic and can be used to assess the impact of trade liberalization on such factors as the
growth rate of economic activity. The main limitation of this approach, however, is that it
does not capture interactions between economic sectors, and therefore does not account for
secondary or indirect effects that could result as capital and labor move from the less
productive to the more productive sectors of the economy.
Macroeconomic analysis provides valuable information about the transmission of trade
liberalization effects on the economy, and the feedback effects that occur in the external
sector from income and price changes. The dynamic nature of these models allows us to
track the effect that relative prices changes will have on investment, consumption, and
other major components of the economy, as well as the fiscal revenue implications of those
adjustments. Like partial equilibrium analysis, macroeconomic analysis of trade
liberalization focuses on the demand side of the economy, and the results therefore allow us
to examine the difference between estimates of the direct effects of tariff reforms and those
arising from both direct and indirect changes in the macroeconomy. And, like the partial
equilibrium approach, this type of analysis does not look at supply-side adjustments from
relative prices changes in the economy.
Industry-level analysis offers useful measures of how trade liberalization alters effective
rates of protection and how these rates changes could shift the existing tariff-induced bias
away from import substitution to export expansion and investment in the production of
14 PARTIAL-EQUILIBRIUM AND INDUSTRIAL-SHIFTANALYSIS OF THEU.S.–COLOMBIA FTA
nontradables. Because the magnitude of protection tends to vary considerably across
industries, this type of detailed industry analysis can be used to show how changes in
tariffs on U.S. traded goods could influence production and the distribution of benefits and
costs among Colombian industries and consumers. While this type of analysis addresses
industry-specific demand and supply conditions by examining factor input prices, it does
not provide an economy-wide perspective on the effects of trade liberalization.
General equilibrium analysis provides the type of economy-wide perspective that is not
available in the other three approaches. It therefore offers a useful means of analyzing the
effects of trade liberalization on upstream, downstream, and substitute products. The
advantages and limitations of this approach are well-illustrated by the computable general
equilibrium model (Light 2003) recently constructed for Colombia to evaluate the potential
effects of bilateral trade liberalization with the United States. The advantage of this approach
is the ability to capture feedback effects of relative price changes and resource flows on overall
gross domestic product (GDP) and social welfare. The major limitations are (1) the
comparative static nature of the analysis, which precludes examination of year-to-year
changes arising from trade liberalization and (2) the sensitivity of the results to model
parameters and the fact that the parameters are not generated from within the model and
are therefore not internally consistent.
MeasuringDirectTradeEffects
Tariff reductions under a U.S.–Colombia FTA would affect Colombia’s trade balance throughthree channels. First, reductions on import tariffs in Colombia would be expected to increase
the quantity of imports demanded in that country. Second, reductions in U.S. tariffs on
imports from Colombia would be expected to increase the quantity of imports demanded in
the United States and thereby increase the quantity of exports demanded from Colombia, that
is, a change in the quantity of imports demanded in the United States will have a proportional
effect on the quantity of exports demanded from Colombia. Third, the change in prices of
exports of Colombia relative to those of the rest of the world could give rise to a change in the
demand for Colombia’s exports by the United States that is not proportional to the change in
U.S. import demand if the price elasticity of export demand is less than infinite.6
In the partial equilibrium analysis, we can calculate the following direct effects of the FTA
through econometric estimates of the demand for imports and exports:
Total effect refers to the change in the level of domestic demand for imported inputs
resulting from tariff-associated price changes.
6 This effect is associated with the Armington assumption that goods originating from different geographicsources are imperfect substitutes for one another.
MODELINGMETHODOLOGY 15
Government revenue effect is the change in customs fees resulting from tariff changes, which
combine changes in revenue per unit of imports and changes in import volumes resulting
from the total trade effect.
Consumer welfare effect refers to the changes that consumers obtain from price changes on
imported goods when tariffs are changed.
The indirect effects of the FTA can be measured only within a general equilibrium framework,
and consist of the following:
Sector production effect refers to changes in domestic output levels associated with the
changes in the allocation of resources brought about by the movements of factors of
production.
International competitiveness effect arises from the changes in access to factors of production
for export-oriented goods, and resulting changes in export prices relative to competing
suppliers of foreign markets.
Terms-of-trade effect is brought about from the changes in prices of tradables that arise from
exchange rate effects and other changes in the foreign and domestic economies.
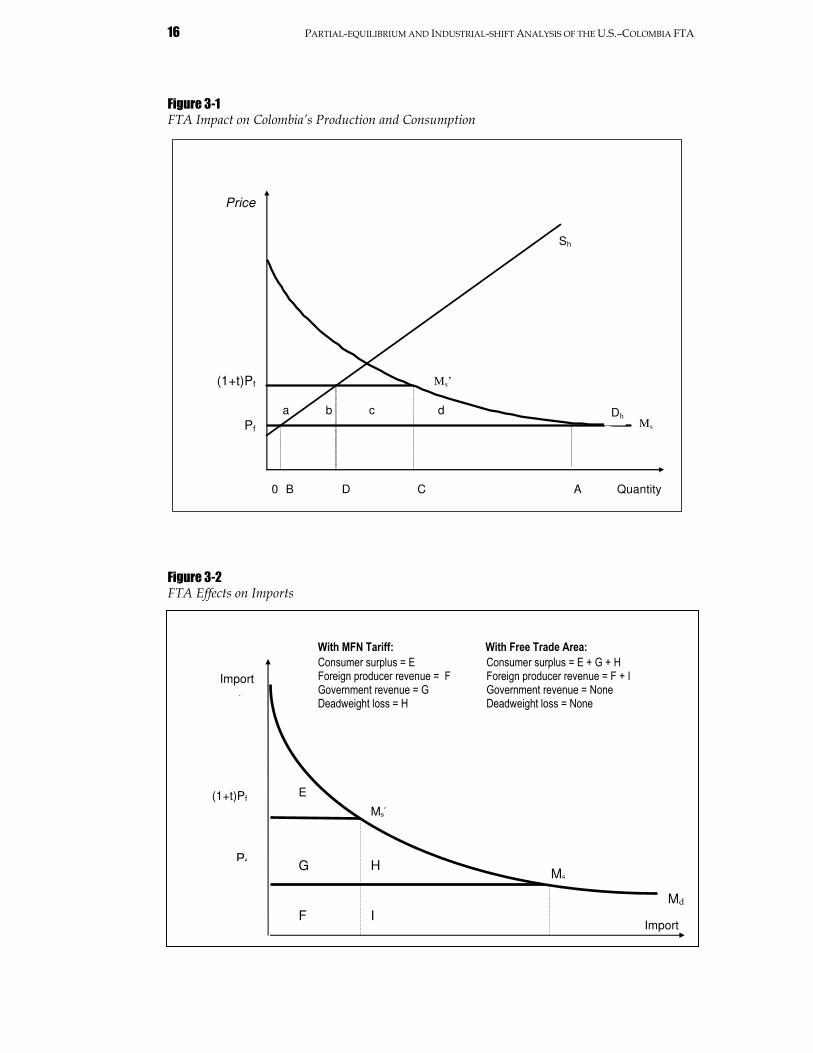
The direct effects of the FTA are demonstrated in Figures 3-1 and 3-2.7 Figure 3-1 shows the
domestic demand schedule, Dh, and the domestic and foreign supply schedules, Sh and Ms,
respectively, of a product. At the border-equivalent price Pf the amount 0A is consumed, 0B is
produced in Colombia, and the difference BA is imported. With an ad valorem tariff of t, the
foreign supply schedule (import supply schedule) shifts from Ms to Ms’. The domestic-
equivalent price is Pd = Pf + tPf = Pf(1+t). At that price the quantity demanded decreases to 0C
and the domestic supplied increases to 0D. The tariff produces the following effects:
1. Consumer surplus declines by a + b + c + d.
2. Producer surplus increases by a.
3. Government revenue increases by c.
4. The deadweight loss for consumers is d.
5. The deadweight production or efficiency loss is b.
6. Total welfare loss is d + b.
7 Roussland and Suomela (1993) offer a description of those effects for a small open economy in a partialequilibrium framework.
16 PARTIAL-EQUILIBRIUM AND INDUSTRIAL-SHIFTANALYSIS OF THEU.S.–COLOMBIA FTA
Figure 3-1FTA Impact on Colombia’s Production and Consumption
Figure 3-2FTA Effects on Imports
0 B D C A Quantity
ba
E
dQu
Ms’
c
Sh
Ms’
0 B D C A Quantity
Price
(1+t)Pf
PfMs
Dh
Md
G
E
F
E
H
I
Ms’
Ms
Ms’
With MFN Tariff:
Consumer surplus = EForeign producer revenue = FGovernment revenue = GDeadweight loss = H
With Free Trade Area:
Consumer surplus = E + G + HForeign producer revenue = F + IGovernment revenue = NoneDeadweight loss = None
Import
Import
price
(1+t)Pf
Pf
MODELINGMETHODOLOGY 17
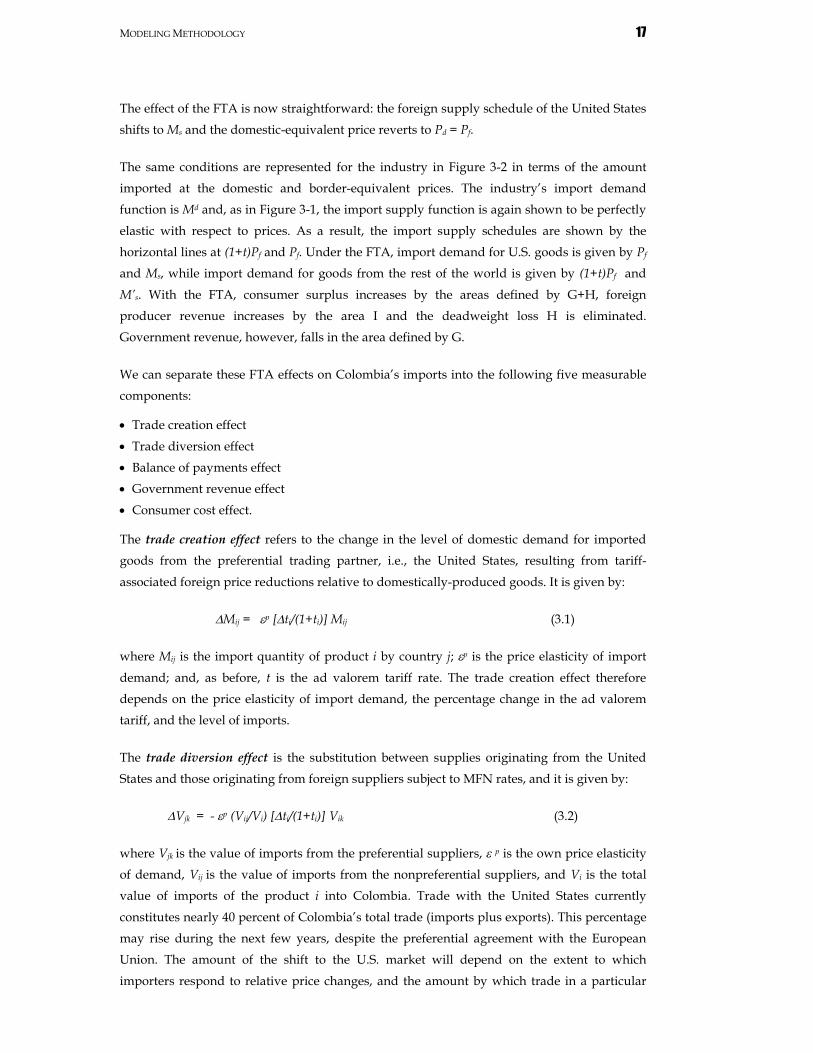
The effect of the FTA is now straightforward: the foreign supply schedule of the United States
shifts toMs and the domestic-equivalent price reverts to Pd = Pf.
The same conditions are represented for the industry in Figure 3-2 in terms of the amount
imported at the domestic and border-equivalent prices. The industry’s import demandfunction isMd and, as in Figure 3-1, the import supply function is again shown to be perfectly
elastic with respect to prices. As a result, the import supply schedules are shown by the
horizontal lines at (1+t)Pf and Pf. Under the FTA, import demand for U.S. goods is given by Pf
and Ms, while import demand for goods from the rest of the world is given by (1+t)Pf and
M’s. With the FTA, consumer surplus increases by the areas defined by G+H, foreign
producer revenue increases by the area I and the deadweight loss H is eliminated.
Government revenue, however, falls in the area defined by G.
We can separate these FTA effects on Colombia’s imports into the following five measurablecomponents:
Trade creation effect
Trade diversion effect
Balance of payments effect
Government revenue effect
Consumer cost effect.
The trade creation effect refers to the change in the level of domestic demand for imported
goods from the preferential trading partner, i.e., the United States, resulting from tariff-
associated foreign price reductions relative to domestically-produced goods. It is given by:
Mij = p [ti/(1+ti)] Mij (3.1)
where Mij is the import quantity of product i by country j; p is the price elasticity of import
demand; and, as before, t is the ad valorem tariff rate. The trade creation effect therefore
depends on the price elasticity of import demand, the percentage change in the ad valorem
tariff, and the level of imports.
The trade diversion effect is the substitution between supplies originating from the United
States and those originating from foreign suppliers subject to MFN rates, and it is given by:
Vjk = - p (Vij/Vi) [ti/(1+ti)] Vik (3.2)
where Vjk is the value of imports from the preferential suppliers, p is the own price elasticity
of demand, Vij is the value of imports from the nonpreferential suppliers, and Vi is the total
value of imports of the product i into Colombia. Trade with the United States currently
constitutes nearly 40 percent of Colombia’s total trade (imports plus exports). This percentagemay rise during the next few years, despite the preferential agreement with the European
Union. The amount of the shift to the U.S. market will depend on the extent to which
importers respond to relative price changes, and the amount by which trade in a particular
18 PARTIAL-EQUILIBRIUM AND INDUSTRIAL-SHIFTANALYSIS OF THEU.S.–COLOMBIA FTA
good will shift from the nonpreferential suppliers to preferential suppliers will depend on the
cross-price elasticity between the price of goods originating from nonpreferential area and the
imports from U.S. sources (for details, see Appendix A).
The balance of payments effect is the sum of the value of changes in individual product
imports, and is therefore the sum of the trade creation and trade diversion effects:
V = [1 - (Vik/Vi)] p [ti/(1+ti)] Vi (3.3)
Consequently, for those products having a price-elastic import demand schedule, tariff
reductions should lead to a net increase in the value of imports over the level that existed
before the tariff cuts.
The government revenue effect includes both the lower revenue per unit of imports and the
higher import volumes resulting from the trade creation effect:
T/T = t/t + M/M (3.4)
where T denotes the customs revenue. In Colombia, trade taxes represent nearly 9 percent of
total tax revenue of the Central Government, and revenue generated from the value added tax
(VAT) represents about 40 percent of the total. It is difficult, however, to estimate the
percentage of the VAT revenue that is attributed to imports since aggregate figures are
presented in the national budget. In any event, the government revenue effect is important
from a policy point of view, even though in principle, customs duties should be used mainly
as an instrument of protection, whereas the sales tax and customs fees should act as revenue
instruments.
The consumer cost effect refers to the gains that consumers obtain from lower prices on
imported goods when tariffs are lowered, and welfare gain, W, is normally calculated as the
average increase in the quantity of imports, i, valued at the average between the tariff
incidence before and after liberalization:
W = t M/2 (3.5)
The magnitude of these effects depends on the price elasticity of import and export demand
of Colombia, and is therefore an empirical issue. By its very nature, the econometric modeling
approach provides internally consistent empirical results at a detailed level. In the following
section, we specify the system of equations to be estimated and present the empirical results
in the following chapter. The estimate takes into account changes in the levels of demand
arising from the imposition of tariffs, and time-related adjustments arising from the lagged
response of imports and exports to possible changes in those tariffs.
MODELINGMETHODOLOGY 19
EstimationProcedure—SpecificationofImportDemandRelationships
The elasticities approach to the balance of payments suggests that the demand for imports of
Colombia and the United States is related to relative price movements as well as income. The
specifications of the import demand relationships for Colombia and the United States are
derived in Appendix A. In this section we summarize their main features.
Imports have a steady-state, or long-term, response to the growth of domestic income, but
that response is not necessarily proportional. This characteristic suggests that the dynamic
specification of the import demand equation should not introduce restrictions that would
impose long-term unitary elasticity with respect to income. In contrast, the model should
encompass long-term proportionality responses when they exist.
The demand for imports is determined by the local currency price of imports. For Colombia
we can break down the (Colombian peso) price variable into the U.S. dollar price and the real
effective exchange rate as follows:
Pn = Pc(1+t)/R = P/R (3.6)
where Pn is the Colombian peso price of the imported product, Pc is c.i.f. (cost, insurance, and
freight) import price in U.S. dollars of the product, P is the U.S. dollar import price of the
good with the tariff, t is the tariff rate, and R is the real exchange rate.
The real exchange rate takes into account changes in the price of domestic goods, Pn, relative
to foreign goods, Pf, and the nominal exchange rate, Rn. It is defined as follows:8
R = Pn/( RnPf) ( 3.7)
The demand for imports by Colombia is therefore directly affected by c.i.f. price in U.S.
dollars of the imported good, the tariff on that good, and the real exchange rate.9
We adopt an error-correction mechanism (ECM) for the import-demand relationship because
the growth rate of Colombia’s imports depends on the expansion path of economic activity.The ECM specification adjusts for any disequilibrium between cointegrated variables and
thus provides the means by which the observed short-term behavior of variables is associated
with their long-term equilibrium growth paths. The expression for imports, M, in terms of
8 This definition is the one used by the IMF, while the more traditional definition is R = RnPf/Pe. To facilitate theinterpretation of the results for readers, we have adopted the IMF definition. See Edwards (1988: Appendix)for alternative definitions of the real exchange rate.
9 If the import supply elasticity is less than infinite, then the pass-through of exchange rate changes from importprice changes in foreign currency terms to import prices in local currency terms will be less than complete(see Branson, 1972, and the summary by Goldstein and Khan, 1985). Consequently, the estimated price andexchange rate coefficients may differ from one another. For a derivation of the import supply schedule, seeLord (1991: Annex D).
20 PARTIAL-EQUILIBRIUM AND INDUSTRIAL-SHIFTANALYSIS OF THEU.S.–COLOMBIA FTA
income, Y, the price of the product, P, in U.S. dollar terms and including the tariff, and the
real effective exchange rate, R, is then:
mt = 20 + 21(m – y)t-1 + 22yt + 23yt-1 + 24pt + 25pt-1
+ 26rt + 27rt-1 + u2t (3.8)
where -1 < 21 < 0; 22 > 0; 23 > 21; 24 and 25 < 0; 26 and 27 > 0; and where all variables are
measured in logarithmic terms. The use of the logarithmic specification provides a means by
which the elasticity can be calculated directly from the estimated equation; the results are
consistent when the elasticities remain constant over time. Tests of parameter constancy
provide a means of validating that hypothesis.
On a steady-state growth path, the long-term dynamic equilibrium relationship implicit in
equation (3.8) is:
M = kYyPpRr (3.9)
The income, price and exchange rate elasticities in (3.9) are defined as follows:
Income elasticity of import demand –
y = 1 - (23/21) (3.10)
Its value is positive since the expected sign of 21 is negative and 23 > 21.When 21 < 23 < 0,
import demand is inelastic with respect to income; when 23 = 0, it has a unitary elasticity; and
when 23 > 0.
Price elasticity of import demand –
p = - 25/21 (.3.11)
It has a negative value since the expected signs of both 25 and 21 are negative.
Real cross-rate elasticity of import demand –
r = - 27/21 (3.12)
It has a positive value since the expected sign of 21 is negative and that of 27 is positive.
At the bilateral trade level, the real exchange rate is measured by the “real cross-rate,” whichtakes into account changes in the nominal exchange rate of Colombia with the United States
and the relative price levels between those two countries. The decomposition allows us to
separate the own-price (transmitted through their effect on the domestic currency–denominated price level) and cross-rate effects.
MODELINGMETHODOLOGY 21
Note that the demand for imports is determined by the local currency (Colombian peso) price
of imports. We therefore can define the price variable into the U.S. dollar prices and the real
exchange rate. Because the real exchange rate takes into account changes in the price of
domestic goods relative to foreign goods, and the nominal exchange rate, the real exchange
rate, as well as the foreign currency–denominated import price, directly affect the demand for
imports in Colombia.
Also note that a rise in the real exchange rate represents a real revaluation in a fixed exchange
rate system, and an appreciation in a flexible exchange rate system, which under the
purchasing power definition can be brought about by either a fall in the nominal exchange
rate or a rise in the relative price of domestic goods (equivalent to a relative fall in the price of
foreign goods). Conversely, a fall in real exchange rate represents a real devaluation under a
fixed exchange rate system, and a depreciation under a flexible exchange rate system. The fall is
associated with a rise either in the nominal exchange rate or in relative prices of foreign goods
(equivalent to a rise in relative prices of domestic goods).
Finally, it should be emphasized that the analysis is based on an 11 observations (1991–2001).Earlier data were not available, and the major structural changes that occurred in the
Colombian economy in the early 1990s significantly complicated the interpretation of any
results derived from a data set that extended into the previous decade. The few observations
about data should be taken into account in interpreting the results of the analysis that follows.

4. Empirical Estimates
Colombia’sImportDemand
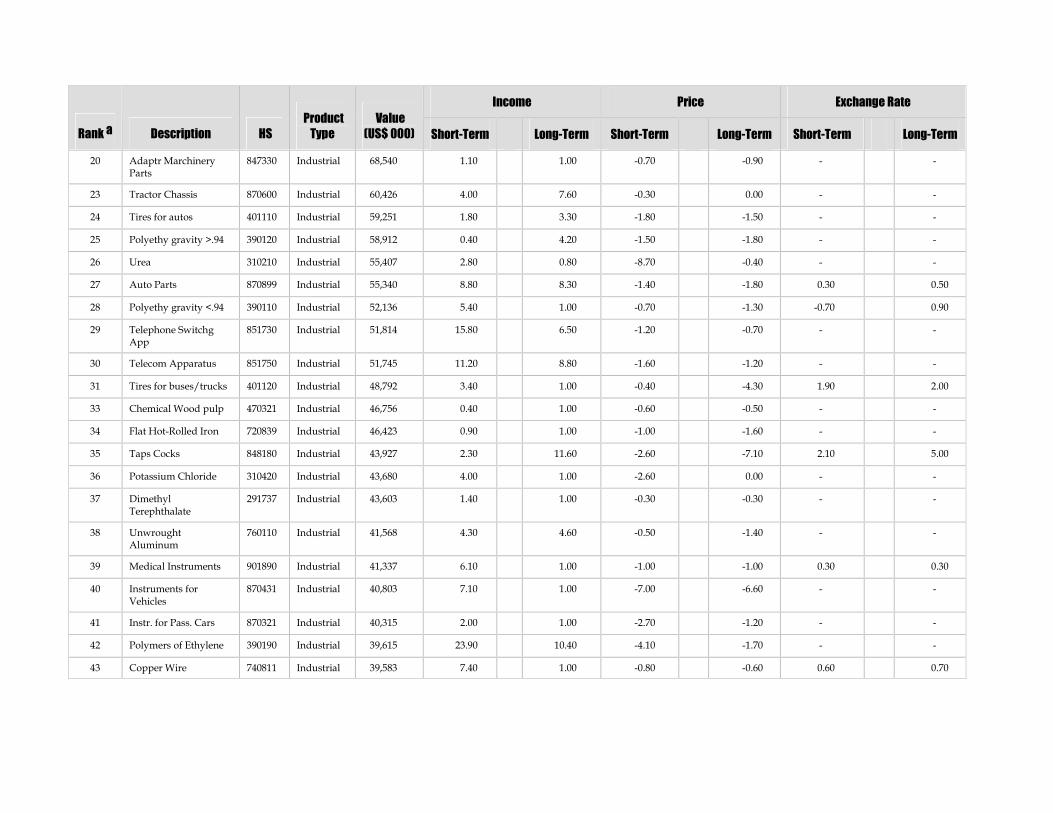
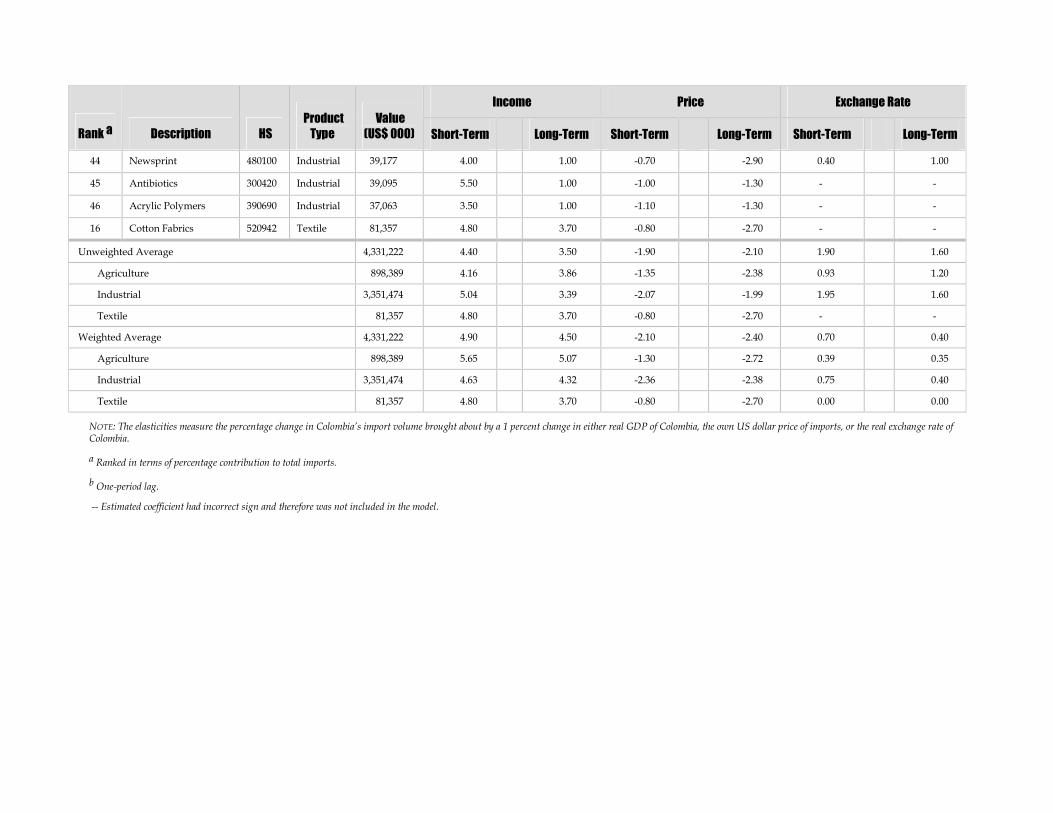
Table 4-1 presents the unweighted income, price, and exchange rate elasticities of Colombia’sprincipal product imports. The long-term price elasticities vary from –0.02 for helicopters to
-7.1 for taps cocks, with an unweighted average of –2.1. The trade-weighted average elasticityis –2.4 in the long term, and in the short term between -1.9 (unweighted) and -2.1
(unweighted), with most responses occurring in the first period. Within product categories,
agricultural and textile product imports have a stronger response to price changes (-2.7) than
industrial products (-2.4). The price elasticity estimates suggest that tariff reductions are likely
to have important consequences for Colombia’s imports of products such as transmission
apparatus, and instruments for vehicles and wheat, among others. Tariff reductions are less
likely to affect the demand for products with low price elasticities, such as potassium
chloride, tractor chassis, and helicopters.
The income elasticity of Colombia’s major imports averages 3.5 on an unweighted basis and4.5 on a trade-weighted basis. Among individual products, elasticities vary from a low of 0.8
for urea to a high of more than 15 for transmission apparatus. Other than urea, all products
have either a unitary elasticity or an elasticity greater than unity. The average trade-weighted
short-term elasticity, 4.9, is similar to that of the unweighted elasticity, 4.4. Within product
groups, agricultural products have a greater long-term response to income changes (5.1) than
industrial products (4.3) or textiles (3.7).
The inclusion of the exchange rate as an explanatory variable in the import demand
relationship is important because any change in Colombia’s exchange rate policy could have
significant consequences for the demand of most imports.10 In general, however, imports are
10 Recall that the real exchange rate of Colombia relative to the United States (i.e., the real cross-rate) has beendefined according to the IMF definition. A rise in real cross-rate represents a real revaluation in a fixedexchange rate system, and an appreciation in a flexible exchange rate system, which under the purchasingpower definition can be brought about by either a fall in the nominal exchange rate or a rise in the relativeprice of domestic goods (equivalent to a fall in the relative price of foreign goods). Conversely, a fall in real
24 PARTIAL-EQUILIBRIUM AND INDUSTRIAL-SHIFTANALYSIS OF THEU.S.–COLOMBIA FTA
less responsive to exchange rate variations than they are to own-price changes. The trade-
weighted average exchange elasticity is 0.7 in the short term and 0.4 in the long term. This
average refers to products for which import demand is statistically significant to exchange
rate variations, which represented about 25 percent of all the products.
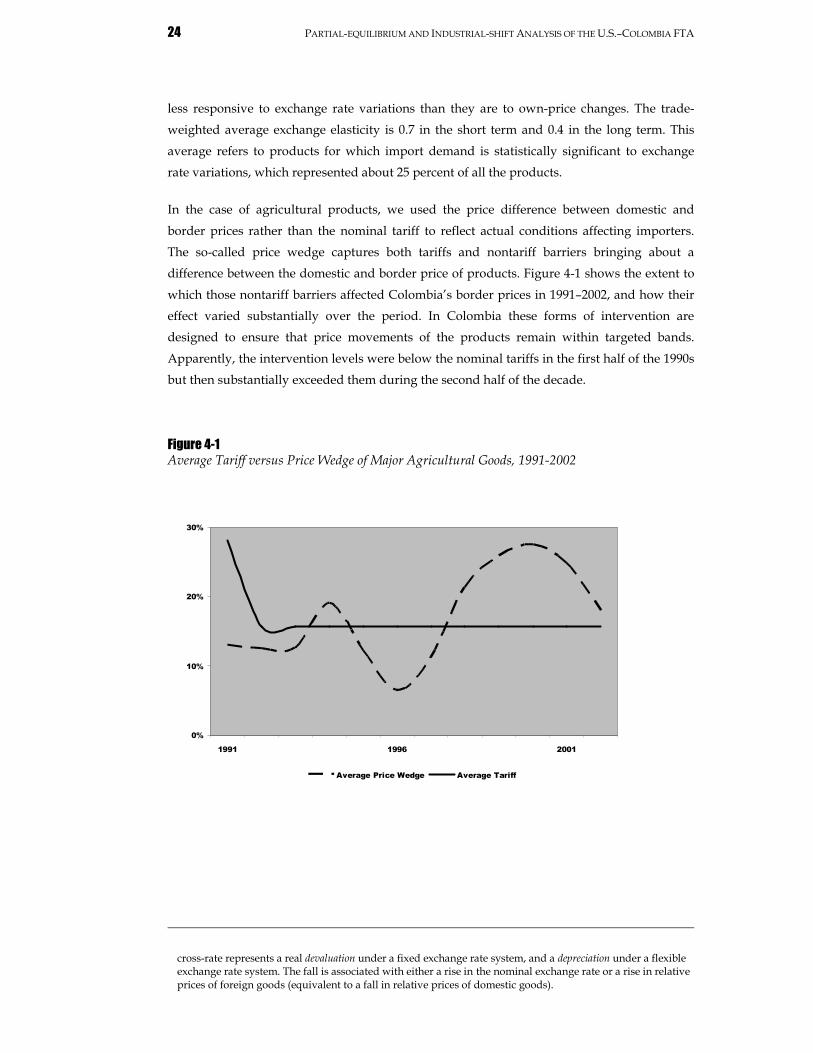
In the case of agricultural products, we used the price difference between domestic and
border prices rather than the nominal tariff to reflect actual conditions affecting importers.
The so-called price wedge captures both tariffs and nontariff barriers bringing about a
difference between the domestic and border price of products. Figure 4-1 shows the extent to
which those nontariff barriers affected Colombia’s border prices in 1991–2002, and how their
effect varied substantially over the period. In Colombia these forms of intervention are
designed to ensure that price movements of the products remain within targeted bands.
Apparently, the intervention levels were below the nominal tariffs in the first half of the 1990s
but then substantially exceeded them during the second half of the decade.
Figure 4-1Average Tariff versus Price Wedge of Major Agricultural Goods, 1991-2002
cross-rate represents a real devaluation under a fixed exchange rate system, and a depreciation under a flexibleexchange rate system. The fall is associated with either a rise in the nominal exchange rate or a rise in relativeprices of foreign goods (equivalent to a fall in relative prices of domestic goods).
0%
10%
20%
30%
1991 1996 2001
Average Price Wedge Average Tariff
EMPIRICAL ESTIMATES 25
U.S.ImportDemand
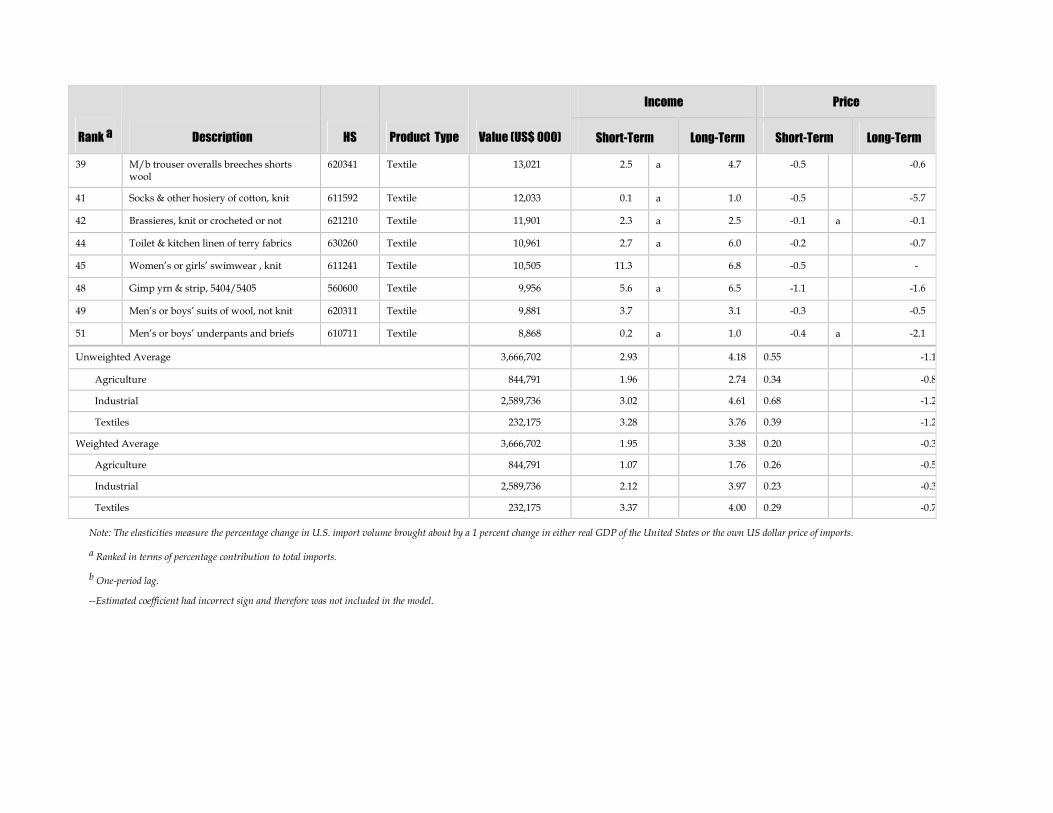
Concurrent with the much lower import duties of the United States are that country’sgenerally lower price elasticities of import demand than those found in Colombia. Table 4-2
shows that the trade-weighted price elasticity of U.S. import demand for Colombia’s major
imports equals only -0.31, while the comparable elasticity in Colombia is -2.4. Individual
product elasticities vary from a low of -0.1 for bananas and shrimp to a high of -5.7 for socks
and other types of hosiery. These price elasticity estimates are similar across the three major
types of goods imported: agriculture (-0.5), industrial goods (-0.3) and textiles (-0.7). The
simple unweighted averages are, however, considerably higher: -1.2 for all products, -1.3 for
textiles, -1.2 for industrial products, and -0.9 for agriculture. These unweighted averages are,
nevertheless, lower than the comparable elasticities of Colombia.
The income elasticity of demand for U.S. imports of Colombia’s major exports averages 4.2based on an unweighted average and 3.4 based on a trade-weight average. Among individual
products, elasticities vary from a high of nearly 10 for gold and gold powder to a low of unity
for a wide range of products such as men’s underpants, socks, cut flowers, coal, and lobster.Among the major product groups, that for textile and industrial products have the highest
average income elasticity (4.0 on a trade-weighted basis), followed by that of agricultural
products (1.8). For Colombia, agricultural products average 5.1; industrial products average
4.3; and textiles average 3.7.
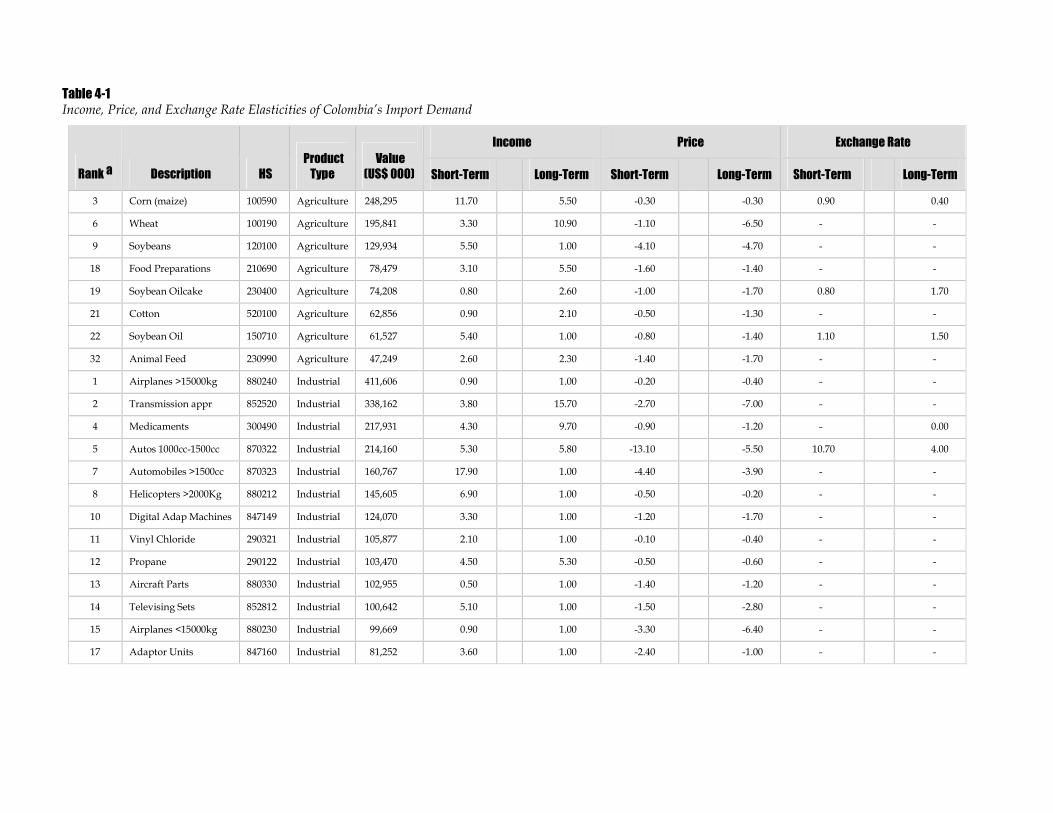
Table 4-1Income, Price, and Exchange Rate Elasticities of Colombia’s Import Demand
Income Price Exchange Rate
Rank a Description HS
Product
Type
Value
(US$ 000) Short-Term Long-Term Short-Term Long-Term Short-Term Long-Term
3 Corn (maize) 100590 Agriculture 248,295 11.70 5.50 -0.30 -0.30 0.90 0.40
6 Wheat 100190 Agriculture 195,841 3.30 10.90 -1.10 -6.50 - -
9 Soybeans 120100 Agriculture 129,934 5.50 1.00 -4.10 -4.70 - -
18 Food Preparations 210690 Agriculture 78,479 3.10 5.50 -1.60 -1.40 - -
19 Soybean Oilcake 230400 Agriculture 74,208 0.80 2.60 -1.00 -1.70 0.80 1.70
21 Cotton 520100 Agriculture 62,856 0.90 2.10 -0.50 -1.30 - -
22 Soybean Oil 150710 Agriculture 61,527 5.40 1.00 -0.80 -1.40 1.10 1.50
32 Animal Feed 230990 Agriculture 47,249 2.60 2.30 -1.40 -1.70 - -
1 Airplanes >15000kg 880240 Industrial 411,606 0.90 1.00 -0.20 -0.40 - -
2 Transmission appr 852520 Industrial 338,162 3.80 15.70 -2.70 -7.00 - -
4 Medicaments 300490 Industrial 217,931 4.30 9.70 -0.90 -1.20 - 0.00
5 Autos 1000cc-1500cc 870322 Industrial 214,160 5.30 5.80 -13.10 -5.50 10.70 4.00
7 Automobiles >1500cc 870323 Industrial 160,767 17.90 1.00 -4.40 -3.90 - -
8 Helicopters >2000Kg 880212 Industrial 145,605 6.90 1.00 -0.50 -0.20 - -
10 Digital AdapMachines 847149 Industrial 124,070 3.30 1.00 -1.20 -1.70 - -
11 Vinyl Chloride 290321 Industrial 105,877 2.10 1.00 -0.10 -0.40 - -
12 Propane 290122 Industrial 103,470 4.50 5.30 -0.50 -0.60 - -
13 Aircraft Parts 880330 Industrial 102,955 0.50 1.00 -1.40 -1.20 - -
14 Televising Sets 852812 Industrial 100,642 5.10 1.00 -1.50 -2.80 - -
15 Airplanes <15000kg 880230 Industrial 99,669 0.90 1.00 -3.30 -6.40 - -
17 Adaptor Units 847160 Industrial 81,252 3.60 1.00 -2.40 -1.00 - -
Income Price Exchange Rate
Rank a Description HS
Product
Type
Value
(US$ 000) Short-Term Long-Term Short-Term Long-Term Short-Term Long-Term
20 Adaptr MarchineryParts
847330 Industrial 68,540 1.10 1.00 -0.70 -0.90 - -
23 Tractor Chassis 870600 Industrial 60,426 4.00 7.60 -0.30 0.00 - -
24 Tires for autos 401110 Industrial 59,251 1.80 3.30 -1.80 -1.50 - -
25 Polyethy gravity >.94 390120 Industrial 58,912 0.40 4.20 -1.50 -1.80 - -
26 Urea 310210 Industrial 55,407 2.80 0.80 -8.70 -0.40 - -
27 Auto Parts 870899 Industrial 55,340 8.80 8.30 -1.40 -1.80 0.30 0.50
28 Polyethy gravity <.94 390110 Industrial 52,136 5.40 1.00 -0.70 -1.30 -0.70 0.90
29 Telephone SwitchgApp
851730 Industrial 51,814 15.80 6.50 -1.20 -0.70 - -
30 Telecom Apparatus 851750 Industrial 51,745 11.20 8.80 -1.60 -1.20 - -
31 Tires for buses/trucks 401120 Industrial 48,792 3.40 1.00 -0.40 -4.30 1.90 2.00
33 Chemical Wood pulp 470321 Industrial 46,756 0.40 1.00 -0.60 -0.50 - -
34 Flat Hot-Rolled Iron 720839 Industrial 46,423 0.90 1.00 -1.00 -1.60 - -
35 Taps Cocks 848180 Industrial 43,927 2.30 11.60 -2.60 -7.10 2.10 5.00
36 Potassium Chloride 310420 Industrial 43,680 4.00 1.00 -2.60 0.00 - -
37 DimethylTerephthalate
291737 Industrial 43,603 1.40 1.00 -0.30 -0.30 - -
38 UnwroughtAluminum
760110 Industrial 41,568 4.30 4.60 -0.50 -1.40 - -
39 Medical Instruments 901890 Industrial 41,337 6.10 1.00 -1.00 -1.00 0.30 0.30
40 Instruments forVehicles
870431 Industrial 40,803 7.10 1.00 -7.00 -6.60 - -
41 Instr. for Pass. Cars 870321 Industrial 40,315 2.00 1.00 -2.70 -1.20 - -
42 Polymers of Ethylene 390190 Industrial 39,615 23.90 10.40 -4.10 -1.70 - -
43 Copper Wire 740811 Industrial 39,583 7.40 1.00 -0.80 -0.60 0.60 0.70
Income Price Exchange Rate
Rank a Description HS
Product
Type
Value
(US$ 000) Short-Term Long-Term Short-Term Long-Term Short-Term Long-Term
44 Newsprint 480100 Industrial 39,177 4.00 1.00 -0.70 -2.90 0.40 1.00
45 Antibiotics 300420 Industrial 39,095 5.50 1.00 -1.00 -1.30 - -
46 Acrylic Polymers 390690 Industrial 37,063 3.50 1.00 -1.10 -1.30 - -
16 Cotton Fabrics 520942 Textile 81,357 4.80 3.70 -0.80 -2.70 - -
Unweighted Average 4,331,222 4.40 3.50 -1.90 -2.10 1.90 1.60
Agriculture 898,389 4.16 3.86 -1.35 -2.38 0.93 1.20
Industrial 3,351,474 5.04 3.39 -2.07 -1.99 1.95 1.60
Textile 81,357 4.80 3.70 -0.80 -2.70 - -
Weighted Average 4,331,222 4.90 4.50 -2.10 -2.40 0.70 0.40
Agriculture 898,389 5.65 5.07 -1.30 -2.72 0.39 0.35
Industrial 3,351,474 4.63 4.32 -2.36 -2.38 0.75 0.40
Textile 81,357 4.80 3.70 -0.80 -2.70 0.00 0.00
NOTE: The elasticities measure the percentage change in Colombia’s import volume brought about by a 1 percent change in either real GDP of Colombia, the own US dollar price of imports, or the real exchange rate ofColombia.
a Ranked in terms of percentage contribution to total imports.
b One-period lag.
-- Estimated coefficient had incorrect sign and therefore was not included in the model.
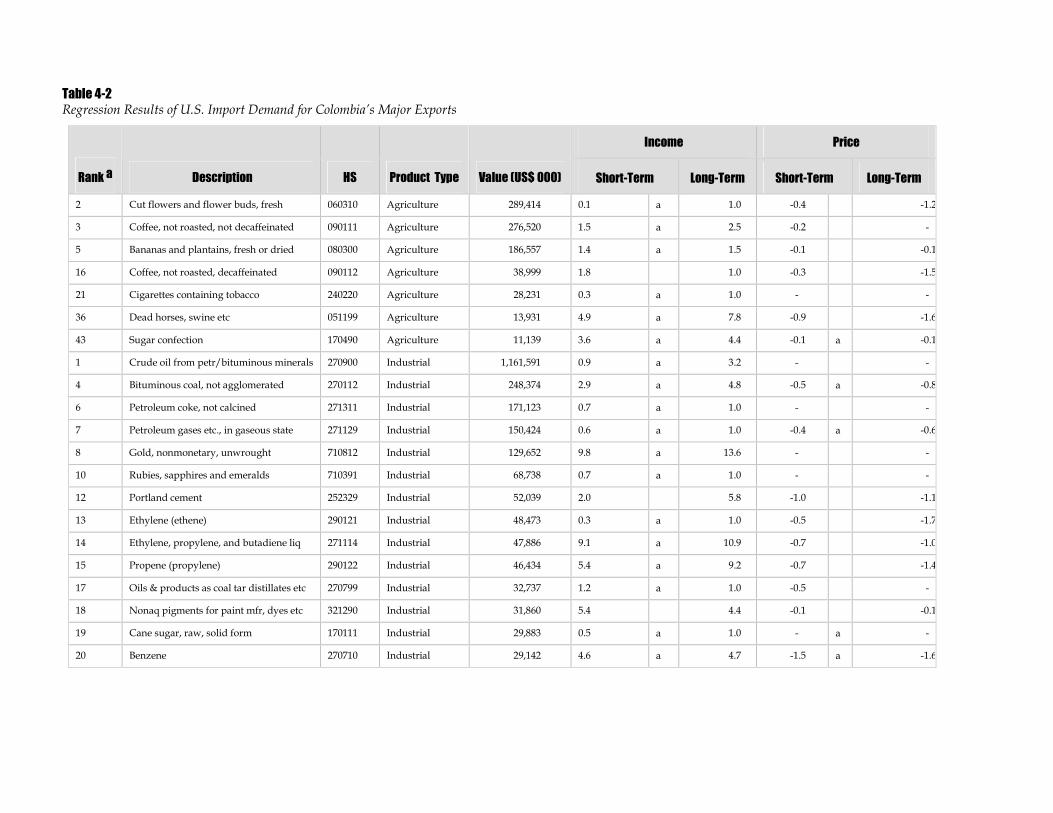
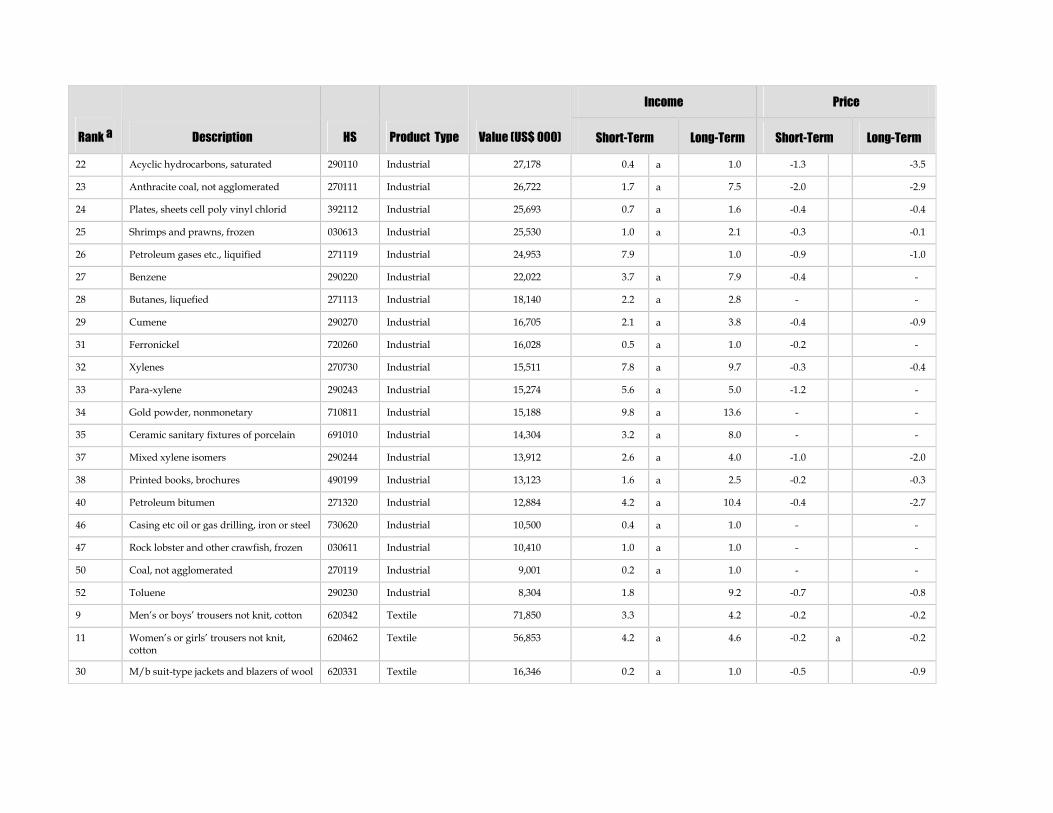
Table 4-2Regression Results of U.S. Import Demand for Colombia’s Major Exports
Income Price
Rank a Description HS Product Type Value (US$ 000) Short-Term Long-Term Short-Term Long-Term
2 Cut flowers and flower buds, fresh 060310 Agriculture 289,414 0.1 a 1.0 -0.4 -1.2
3 Coffee, not roasted, not decaffeinated 090111 Agriculture 276,520 1.5 a 2.5 -0.2 -
5 Bananas and plantains, fresh or dried 080300 Agriculture 186,557 1.4 a 1.5 -0.1 -0.1
16 Coffee, not roasted, decaffeinated 090112 Agriculture 38,999 1.8 1.0 -0.3 -1.5
21 Cigarettes containing tobacco 240220 Agriculture 28,231 0.3 a 1.0 - -
36 Dead horses, swine etc 051199 Agriculture 13,931 4.9 a 7.8 -0.9 -1.6
43 Sugar confection 170490 Agriculture 11,139 3.6 a 4.4 -0.1 a -0.1
1 Crude oil from petr/bituminous minerals 270900 Industrial 1,161,591 0.9 a 3.2 - -
4 Bituminous coal, not agglomerated 270112 Industrial 248,374 2.9 a 4.8 -0.5 a -0.8
6 Petroleum coke, not calcined 271311 Industrial 171,123 0.7 a 1.0 - -
7 Petroleum gases etc., in gaseous state 271129 Industrial 150,424 0.6 a 1.0 -0.4 a -0.6
8 Gold, nonmonetary, unwrought 710812 Industrial 129,652 9.8 a 13.6 - -
10 Rubies, sapphires and emeralds 710391 Industrial 68,738 0.7 a 1.0 - -
12 Portland cement 252329 Industrial 52,039 2.0 5.8 -1.0 -1.1
13 Ethylene (ethene) 290121 Industrial 48,473 0.3 a 1.0 -0.5 -1.7
14 Ethylene, propylene, and butadiene liq 271114 Industrial 47,886 9.1 a 10.9 -0.7 -1.0
15 Propene (propylene) 290122 Industrial 46,434 5.4 a 9.2 -0.7 -1.4
17 Oils & products as coal tar distillates etc 270799 Industrial 32,737 1.2 a 1.0 -0.5 -
18 Nonaq pigments for paint mfr, dyes etc 321290 Industrial 31,860 5.4 4.4 -0.1 -0.1
19 Cane sugar, raw, solid form 170111 Industrial 29,883 0.5 a 1.0 - a -
20 Benzene 270710 Industrial 29,142 4.6 a 4.7 -1.5 a -1.6
Income Price
Rank a Description HS Product Type Value (US$ 000) Short-Term Long-Term Short-Term Long-Term
22 Acyclic hydrocarbons, saturated 290110 Industrial 27,178 0.4 a 1.0 -1.3 -3.5
23 Anthracite coal, not agglomerated 270111 Industrial 26,722 1.7 a 7.5 -2.0 -2.9
24 Plates, sheets cell poly vinyl chlorid 392112 Industrial 25,693 0.7 a 1.6 -0.4 -0.4
25 Shrimps and prawns, frozen 030613 Industrial 25,530 1.0 a 2.1 -0.3 -0.1
26 Petroleum gases etc., liquified 271119 Industrial 24,953 7.9 1.0 -0.9 -1.0
27 Benzene 290220 Industrial 22,022 3.7 a 7.9 -0.4 -
28 Butanes, liquefied 271113 Industrial 18,140 2.2 a 2.8 - -
29 Cumene 290270 Industrial 16,705 2.1 a 3.8 -0.4 -0.9
31 Ferronickel 720260 Industrial 16,028 0.5 a 1.0 -0.2 -
32 Xylenes 270730 Industrial 15,511 7.8 a 9.7 -0.3 -0.4
33 Para-xylene 290243 Industrial 15,274 5.6 a 5.0 -1.2 -
34 Gold powder, nonmonetary 710811 Industrial 15,188 9.8 a 13.6 - -
35 Ceramic sanitary fixtures of porcelain 691010 Industrial 14,304 3.2 a 8.0 - -
37 Mixed xylene isomers 290244 Industrial 13,912 2.6 a 4.0 -1.0 -2.0
38 Printed books, brochures 490199 Industrial 13,123 1.6 a 2.5 -0.2 -0.3
40 Petroleum bitumen 271320 Industrial 12,884 4.2 a 10.4 -0.4 -2.7
46 Casing etc oil or gas drilling, iron or steel 730620 Industrial 10,500 0.4 a 1.0 - -
47 Rock lobster and other crawfish, frozen 030611 Industrial 10,410 1.0 a 1.0 - -
50 Coal, not agglomerated 270119 Industrial 9,001 0.2 a 1.0 - -
52 Toluene 290230 Industrial 8,304 1.8 9.2 -0.7 -0.8
9 Men’s or boys’ trousers not knit, cotton 620342 Textile 71,850 3.3 4.2 -0.2 -0.2
11 Women’s or girls’ trousers not knit,cotton
620462 Textile 56,853 4.2 a 4.6 -0.2 a -0.2
30 M/b suit-type jackets and blazers of wool 620331 Textile 16,346 0.2 a 1.0 -0.5 -0.9
Income Price
Rank a Description HS Product Type Value (US$ 000) Short-Term Long-Term Short-Term Long-Term
39 M/b trouser overalls breeches shortswool
620341 Textile 13,021 2.5 a 4.7 -0.5 -0.6
41 Socks & other hosiery of cotton, knit 611592 Textile 12,033 0.1 a 1.0 -0.5 -5.7
42 Brassieres, knit or crocheted or not 621210 Textile 11,901 2.3 a 2.5 -0.1 a -0.1
44 Toilet & kitchen linen of terry fabrics 630260 Textile 10,961 2.7 a 6.0 -0.2 -0.7
45 Women’s or girls’ swimwear , knit 611241 Textile 10,505 11.3 6.8 -0.5 -
48 Gimp yrn & strip, 5404/5405 560600 Textile 9,956 5.6 a 6.5 -1.1 -1.6
49 Men’s or boys’ suits of wool, not knit 620311 Textile 9,881 3.7 3.1 -0.3 -0.5
51 Men’s or boys’ underpants and briefs 610711 Textile 8,868 0.2 a 1.0 -0.4 a -2.1
Unweighted Average 3,666,702 2.93 4.18 0.55 -1.19
Agriculture 844,791 1.96 2.74 0.34 -0.89
Industrial 2,589,736 3.02 4.61 0.68 -1.23
Textiles 232,175 3.28 3.76 0.39 -1.25
Weighted Average 3,666,702 1.95 3.38 0.20 -0.31
Agriculture 844,791 1.07 1.76 0.26 -0.51
Industrial 2,589,736 2.12 3.97 0.23 -0.34
Textiles 232,175 3.37 4.00 0.29 -0.71
Note: The elasticities measure the percentage change in U.S. import volume brought about by a 1 percent change in either real GDP of the United States or the own US dollar price of imports.
a Ranked in terms of percentage contribution to total imports.
b One-period lag.
--Estimated coefficient had incorrect sign and therefore was not included in the model.

5. ImpactAnalysis
StagingTariffReductions
Although market access negotiations on the U.S.–Colombia FTA have yet to start, a useful
starting point for this analysis could be to examine the tariff schedule negotiated under the
U.S.–Chile FTA.11 The US-Chile FTA will eliminate tariffs on U.S. and Chilean goods and
services over a 10-year period for industrial goods and a 12-year period for agricultural
products in both countries. However, fully 85 percent of bilateral trade in consumer and
industrial products will immediately become duty-free, with other product tariff rates being
reduced over time. In the case of the United States, about 75 percent of U.S. farm exports will
enter Chile duty-free within 4 years and all duties will be fully phased out within 12 years of
the agreement’s implementation. For Chile, 95 percent of its export products will gain duty-free status immediately, and only about 1 percent will be covered by the longest 12-year
phase-out period.
Other guidelines for Colombia are provided by other recent agreements that the United States
has concluded, including those with Israel and Jordan, NAFTA, and most recently CAFTA.
Under the U.S.–Jordan FTA, for example, tariffs on virtually all trade between Jordan and the
United States are to be eliminated within 10 years. The tariff reductions are set to take place in
four stages: (1) tariffs of less than 5 percent will be phased out in 2 years; (2) tariffs between 5
and 10 percent will be eliminated in 4 years; (3) tariffs between 10 and 20 percent will be
removed in 5 years; and (4) tariffs that are more than 20 percent will be eliminated in 10 years.
Notwithstanding the transparency inherent in Jordan’s FTA, Chile’s staging for tariff
reductions probably represents a more relevant simulation benchmark for Colombia. It is
therefore Chile’s staging that is adopted as the benchmark against which other staging
scenarios are assessed by the present model. Finally, it is important to note that Colombia
already receives preferential access to the U.S. market and therefore reduced tariffs on most
11 The U.S.–Chile FTA was concluded at the end of 2002, Annex 3.3 of the Agreement provides for staging oftariff reductions for five categories.
34 PARTIAL-EQUILIBRIUM AND INDUSTRIAL-SHIFTANALYSIS OF THEU.S.–COLOMBIA FTA
exports under ATPADEA. The present exercise simulates the differential impacts of an FTA
and the expiration of ATPADEA benefits, rather than just the impacts of an FTA with the
United States.
MeasuringtheFTAImpact
In the first instance, we have evaluated the impact of the FTA on Colombia’s imports andexports to the United States for staging of tariff reductions between 1 and 10 years. Tables 5-1
and 5-2 summarize the effects on imports of U.S. goods and exports to U.S. markets. As
expected, the effect of the FTA on imports is large both because of the relatively high price
elasticity of Colombia’s import demand (-2.4 trade-weighted average) and the initially hightariffs (over 11 percent on average). In contrast, the price elasticity of U.S. import demand is
-0.3 and tariffs average about 4 percent.
The cumulative impact of imports varies from 17 percent to 19 percent over 10 years,
depending on how tariff reductions are staged. If tariffs are reduced immediately, the effect is
greater, as imports adjust with a lag to actual changes that have occurred recently (in 2003).
Spreading the reduction over a longer period, for example, 10 years, tends to ameliorate
recent changes and produce a smaller effect. The difference in staging from the point of view
of the direct impact on import value is not, however, large. One other observation that is
worth noting is that, because imports tend to adjust with a lag to price changes, there is a lag
between tariff reductions and adjustments in the volume of imports demanded. Hence, the
initial adjustment in imports is observed in Figure 5-1 to begin in period 2.
Table 5-2 shows the anticipated effect on U.S. imports of Colombia’s major exports to thatmarket to be minimal. Apart from the comparatively low tariffs on U.S. imports, the average
price elasticity of U.S. import demand is less than unity (-0.3). The result is that for every one
percent change in the tariff-adjusted price of imports, there is a less-than-proportional
increase in the demand for imports. Although changes in the volume of Colombia’s exports are
proportional to changes in U.S. imports of those products resulting from tariff-induced price
changes, the same does not hold for the value of Colombia’s exports. Although tariff cuts leadto price reductions for U.S. consumers, those cuts do not affect the price received by
Colombian exports to the U.S. market. As a result, tariff-induced price changes cause
Colombia’s exports to expand, without affecting the corresponding prices of those exports inColombia.
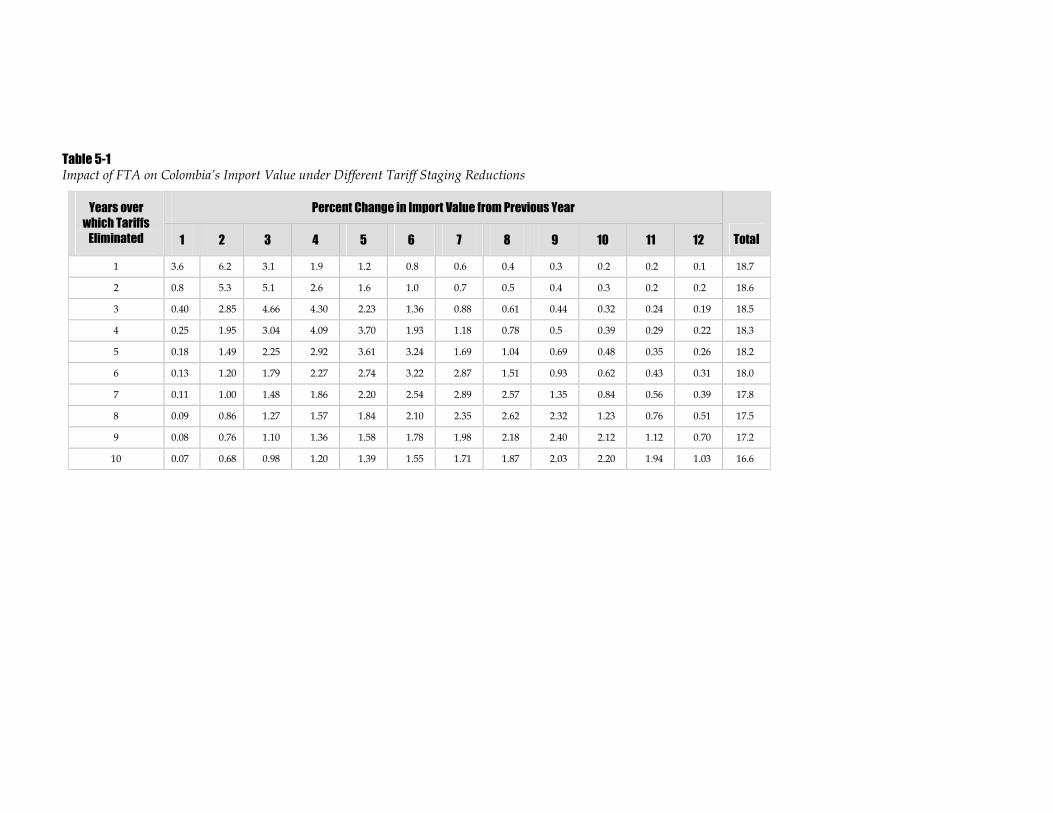
Table 5-1Impact of FTA on Colombia’s Import Value under Different Tariff Staging Reductions
Percent Change in Import Value from Previous YearYears over
which Tariffs
Eliminated 1 2 3 4 5 6 7 8 9 10 11 12 Total
1 3.6 6.2 3.1 1.9 1.2 0.8 0.6 0.4 0.3 0.2 0.2 0.1 18.7
2 0.8 5.3 5.1 2.6 1.6 1.0 0.7 0.5 0.4 0.3 0.2 0.2 18.6
3 0.40 2.85 4.66 4.30 2.23 1.36 0.88 0.61 0.44 0.32 0.24 0.19 18.5
4 0.25 1.95 3.04 4.09 3.70 1.93 1.18 0.78 0.5 0.39 0.29 0.22 18.3
5 0.18 1.49 2.25 2.92 3.61 3.24 1.69 1.04 0.69 0.48 0.35 0.26 18.2
6 0.13 1.20 1.79 2.27 2.74 3.22 2.87 1.51 0.93 0.62 0.43 0.31 18.0
7 0.11 1.00 1.48 1.86 2.20 2.54 2.89 2.57 1.35 0.84 0.56 0.39 17.8
8 0.09 0.86 1.27 1.57 1.84 2.10 2.35 2.62 2.32 1.23 0.76 0.51 17.5
9 0.08 0.76 1.10 1.36 1.58 1.78 1.98 2.18 2.40 2.12 1.12 0.70 17.2
10 0.07 0.68 0.98 1.20 1.39 1.55 1.71 1.87 2.03 2.20 1.94 1.03 16.6
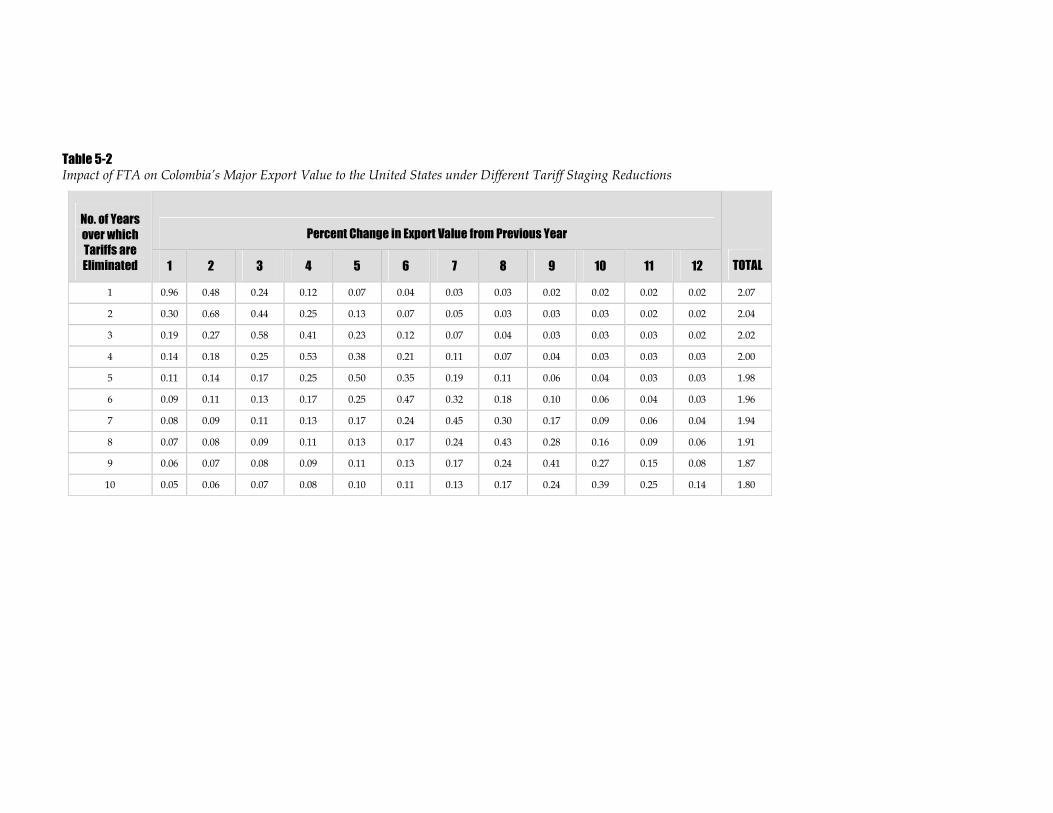
Table 5-2Impact of FTA on Colombia’s Major Export Value to the United States under Different Tariff Staging Reductions
Percent Change in Export Value from Previous YearNo. of Years
over which
Tariffs are
Eliminated 1 2 3 4 5 6 7 8 9 10 11 12 TOTAL
1 0.96 0.48 0.24 0.12 0.07 0.04 0.03 0.03 0.02 0.02 0.02 0.02 2.07
2 0.30 0.68 0.44 0.25 0.13 0.07 0.05 0.03 0.03 0.03 0.02 0.02 2.04
3 0.19 0.27 0.58 0.41 0.23 0.12 0.07 0.04 0.03 0.03 0.03 0.02 2.02
4 0.14 0.18 0.25 0.53 0.38 0.21 0.11 0.07 0.04 0.03 0.03 0.03 2.00
5 0.11 0.14 0.17 0.25 0.50 0.35 0.19 0.11 0.06 0.04 0.03 0.03 1.98
6 0.09 0.11 0.13 0.17 0.25 0.47 0.32 0.18 0.10 0.06 0.04 0.03 1.96
7 0.08 0.09 0.11 0.13 0.17 0.24 0.45 0.30 0.17 0.09 0.06 0.04 1.94
8 0.07 0.08 0.09 0.11 0.13 0.17 0.24 0.43 0.28 0.16 0.09 0.06 1.91
9 0.06 0.07 0.08 0.09 0.11 0.13 0.17 0.24 0.41 0.27 0.15 0.08 1.87
10 0.05 0.06 0.07 0.08 0.10 0.11 0.13 0.17 0.24 0.39 0.25 0.14 1.80
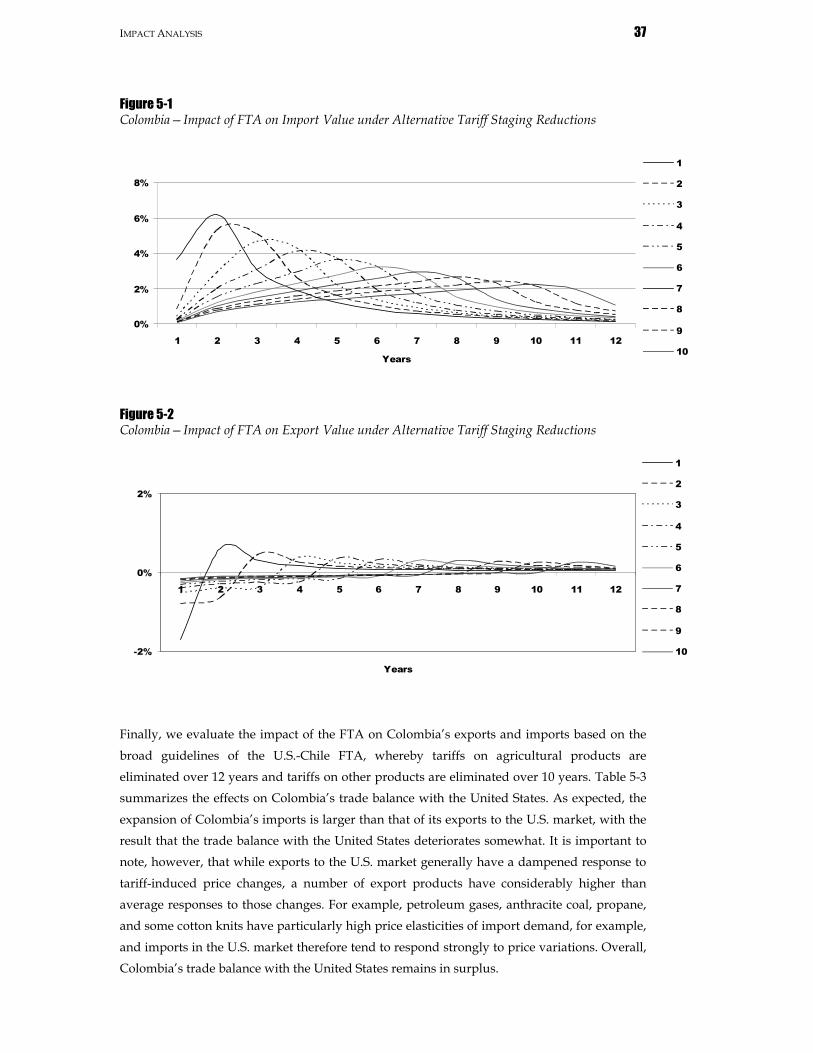
IMPACTANALYSIS 37
Figure 5-1Colombia—Impact of FTA on Import Value under Alternative Tariff Staging Reductions
Figure 5-2Colombia—Impact of FTA on Export Value under Alternative Tariff Staging Reductions
Finally, we evaluate the impact of the FTA on Colombia’s exports and imports based on the
broad guidelines of the U.S.-Chile FTA, whereby tariffs on agricultural products are
eliminated over 12 years and tariffs on other products are eliminated over 10 years. Table 5-3
summarizes the effects on Colombia’s trade balance with the United States. As expected, the
expansion of Colombia’s imports is larger than that of its exports to the U.S. market, with theresult that the trade balance with the United States deteriorates somewhat. It is important to
note, however, that while exports to the U.S. market generally have a dampened response to
tariff-induced price changes, a number of export products have considerably higher than
average responses to those changes. For example, petroleum gases, anthracite coal, propane,
and some cotton knits have particularly high price elasticities of import demand, for example,
and imports in the U.S. market therefore tend to respond strongly to price variations. Overall,
Colombia’s trade balance with the United States remains in surplus.
0%
2%
4%
6%
8%
1 2 3 4 5 6 7 8 9 10 11 12
Years
1
2
3
4
5
6
7
8
9
10
-2%
0%
2%
1 2 3 4 5 6 7 8 9 10 11 12
Years
1
2
3
4
5
6
7
8
9
10
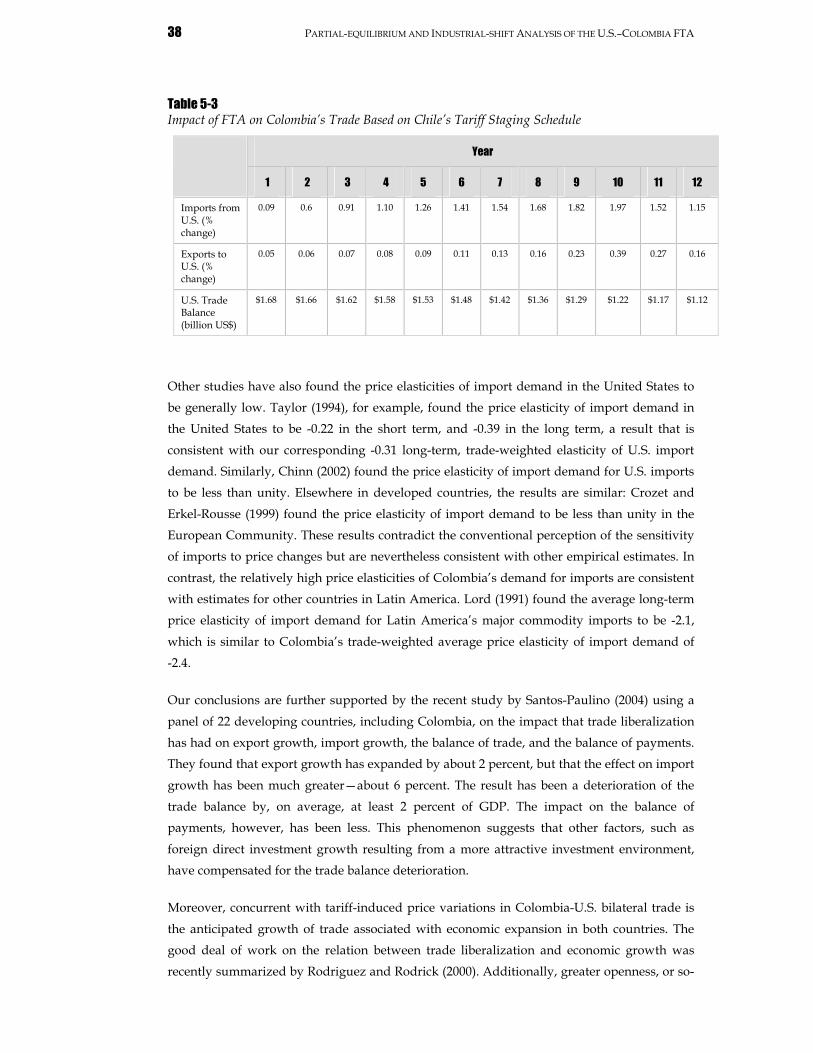
38 PARTIAL-EQUILIBRIUM AND INDUSTRIAL-SHIFTANALYSIS OF THEU.S.–COLOMBIA FTA
Table 5-3Impact of FTA on Colombia’s Trade Based on Chile’s Tariff Staging Schedule
Year
1 2 3 4 5 6 7 8 9 10 11 12
Imports fromU.S. (%change)
0.09 0.6 0.91 1.10 1.26 1.41 1.54 1.68 1.82 1.97 1.52 1.15
Exports toU.S. (%change)
0.05 0.06 0.07 0.08 0.09 0.11 0.13 0.16 0.23 0.39 0.27 0.16
U.S. TradeBalance(billion US$)
$1.68 $1.66 $1.62 $1.58 $1.53 $1.48 $1.42 $1.36 $1.29 $1.22 $1.17 $1.12
Other studies have also found the price elasticities of import demand in the United States to
be generally low. Taylor (1994), for example, found the price elasticity of import demand in
the United States to be -0.22 in the short term, and -0.39 in the long term, a result that is
consistent with our corresponding -0.31 long-term, trade-weighted elasticity of U.S. import
demand. Similarly, Chinn (2002) found the price elasticity of import demand for U.S. imports
to be less than unity. Elsewhere in developed countries, the results are similar: Crozet and
Erkel-Rousse (1999) found the price elasticity of import demand to be less than unity in the
European Community. These results contradict the conventional perception of the sensitivity
of imports to price changes but are nevertheless consistent with other empirical estimates. In
contrast, the relatively high price elasticities of Colombia’s demand for imports are consistentwith estimates for other countries in Latin America. Lord (1991) found the average long-term
price elasticity of import demand for Latin America’s major commodity imports to be -2.1,
which is similar to Colombia’s trade-weighted average price elasticity of import demand of-2.4.
Our conclusions are further supported by the recent study by Santos-Paulino (2004) using a
panel of 22 developing countries, including Colombia, on the impact that trade liberalization
has had on export growth, import growth, the balance of trade, and the balance of payments.
They found that export growth has expanded by about 2 percent, but that the effect on import
growth has been much greater—about 6 percent. The result has been a deterioration of the
trade balance by, on average, at least 2 percent of GDP. The impact on the balance of
payments, however, has been less. This phenomenon suggests that other factors, such as
foreign direct investment growth resulting from a more attractive investment environment,
have compensated for the trade balance deterioration.
Moreover, concurrent with tariff-induced price variations in Colombia-U.S. bilateral trade is
the anticipated growth of trade associated with economic expansion in both countries. The
good deal of work on the relation between trade liberalization and economic growth was
recently summarized by Rodriguez and Rodrick (2000). Additionally, greater openness, or so-
IMPACTANALYSIS 39
called globalization, has important implications for economic growth, poverty, and income
inequality. Dollar and Kraay (2004) recently assessed those relationships and concluded that
evidence from individual cases and cross-country analysis supports the view that
globalization leads to faster growth and poverty reduction in countries such as Colombia.
The partial equilibrium approach used in the present analysis excludes consideration of
feedback effects between the external and domestic sectors, and therefore does not take into
account the sectoral adjustments and indirect macroeconomic impact that would accompany
trade liberalization. Moreover, a major issue raised by partial equilibrium analysis of trade
liberalization is the small size of the estimated effects, a phenomenon that has been attributed
to the nature of the partial equilibrium calculations. These limitations suggest two directions
for further analysis of Colombia’s FTA with the United States. First, tariff cuts in Colombia
will probably influence the industries that provide both material and other inputs to the final
goods industries through changes in relative prices of factors of production and the final
products themselves. These linkages will, in turn, affect the allocation of domestic resources
and influence the competitive position of Colombia’s products in the domestic and U.S.markets. The effective rate of protection measures the effect of tariff changes on domestic
production, how tariffs on Colombia’s products and their tradable inputs jointly affect the
value added of particular activities. When only the nominal rate of protection is calculated,
the tariff on imports suggests that domestic producers will be encouraged to increase their
output. However, whether they increase their output depends not only on the tariff on
imports of final products, but on the tariffs applied to inputs used in their manufacture. The
effective rate of protection therefore measures the net protection on production processes
rather than simply gross protection on output of industries. We use this approach in the next
chapter to measure domestic production adjustments in Colombia resulting from the FTA.
Although it is beyond the scope of this study, a second extension is the macroeconomic
framework of external sector adjustments. While not offering the same level of detail,
estimates of the effects of trade liberalization in a macroeconomic framework incorporate
dynamics and allow for calculations of feedback effects between import and export
adjustments and the macroeconomy. As a consequence, the sizes of the estimates are likely to
more accurately reflect adjustments to trade liberalization associated with broad-based
reforms. From an analytical point of view, the appropriate framework for Colombia is the
Mundell-Fleming model of a small open economy. Data requirements for the macroeconomic
model, though not considerable, would require careful data selection to ensure integrity of the
underlying relationships. Together with the industry-level assessment, macroeconomic
analysis of the FTA would offer a more complete appreciation or approximation of its
potential impact on the Colombian economy.

6. Production-ShiftAnalysis
Colombia has a cascading tariff structure, insofar as trade taxes on final goods are generally
higher than on intermediate and capital goods used in the production of those goods. That
structure implies that the resource allocation of industries is more influenced by the lower
tariff rates applied to production inputs than by those applied to final goods. In this chapter
we examine the incentives provided to Colombian industries under the current tariff regime
and the implications that the U.S.-Colombian FTA has for those industries. We begin by
discussing the concept and measurement of the effective rate of protection and suggest the
need to separate its
MeasuringtheEffectiveRateofProtection
The effective rate of protection measures the cascading effects by considering tariffs applied to
imports of raw materials and intermediate goods that affect the price of the final good. (See
Appendix A, section A.3, for the derivation of the effective rate of protection.) The effective
rate of protection measures how tariffs on a product and its tradable inputs jointly affect the
added value of a particular activity. Calculating only the nominal rate of protection suggests
that the tariff on imports will encourage domestic producers to increase their output. But
whether they increase output depends also on the tariffs applied to inputs used in
manufacturing. Domestic producers enjoy an implicit subsidy on production when there are
tariffs on imports, but they face a tax on their imported inputs, which can neutralize the effect
of the subsidy. The effective rate of protection therefore measures the net protection on the
production process, rather than simply the gross protection on the industry’s output.
The formula for the effective rate of protection is as follows:
ERP = (V*j - Vj)/ Vj (6.1)
where ERP = effective rate of protection
V*j = Value added per unit of j in activity j at tariff-applied price
Vj = Value added per unit of j in activity j at tariff-free price
42 PARTIAL-EQUILIBRIUM AND INDUSTRIAL-SHIFTANALYSIS OF THEU.S.–COLOMBIA FTA
Alternatively, we can specify the effective rate of protection in terms of tariffs on the applied
inputs and output of the industry as follows:
ERP = (1 - i ai)/[1/(1+t)] – i [ai/(1+ti)] – 1 (6.2)
where t = nominal tariff rate on imported equivalent to the domestic output.
ti = nominal tariff rate on tradable input i in the production of the good.
ai = value of input i per unit of output.
Like the nominal rate of protection, a positive effective rate of protection indicates that the
returns earned from production are greater than those earned without intervention. Likewise,
a negative effective rate of protection indicates that the reverse is true. In the case where the
effective rate of protection is zero, the effect is the same as without intervention.
The effective rate of protection formula suggests the following
t = ti implies that the effective rate of protection will equal the nominal rate of protection
(NRP), i.e., ERP = NRP.
t < ti implies that the effective rate of protection will be positive, suggesting that the
effective protection for the industry is greater nominal protection on both the final and
imported inputs.
t < ti implies that the effective rate of protection for the industry is smaller than the nominal
protection on both the final and imported inputs.
The incidence of tariff reductions on inputs and final products differs between import-
substitution industries and export-oriented ones. In measuring the incidence of the effective
rate of protection in Colombia and its elimination under the FTA we therefore separate
calculations for export-oriented industries from those for import-competing industries. The
distinction is critical to the output and employment effects arising from the U.S.–Colombia
FTA because tariffs protect import-substituting but not export-oriented industries.
For import-substituting industries, the tariff on the final good acts as a subsidy while the tariff
on inputs acts as a tax. Protection granted to final goods therefore increases returns to value-
adding factors in those industries. Higher protection on outputs raises the domestic prices for
import-competing goods and increases the returns for their production. Taxes on intermediate
inputs, however, reduce the returns to value-adding factors.
Export-oriented industries derive no benefits from domestic protection of their output. Instead,
they confront world prices for their sales while being taxed on their inputs through tariffs
paid on imported inputs. Because Colombia’s tariff regime raises prices for intermediate
goods its effect on the country’s export-oriented industries is always negative.
The anti-export bias is found by combining the effects of the tariffs on import-substitution
activities and export-oriented activities within the same industry. We can measure the anti-
export bias, denoted A, for any given industry as follows:
PRODUCTION-SHIFTANALYSIS 43
A = [(1 + ERPm) / (1 + ERPx) – 1] * 100 (6.3)
Where ERPm = the effective rate of protection on the import-substitution activities of the
industry, and
ERPx = the effective rate of protection on the export-oriented activities of the
industry.
Table 6-1 presents the nominal and effective rates of protection of Colombia’s industries, aswell as the resulting anti-export bias. The first column reports the nominal rate of protection
and the next two columns report the effective rates of protection for the import-substitution
and export-orientation activities, respectively. In general, agricultural industries have lower
nominal and effective rates of protection than mining and industrial activities, while
industrial activities have higher effective rates of protection.
Industry-levelSupplyResponsestotheFTA
While estimates of effective rates of protection are suggestive of which industries are more or
less favored or threatened by current tariffs and proposed reforms, the effective rates of
protection are more indicative of the potential direction of change in resource pull than of the
output magnitudes involved. Predicting the quantitative impact of reforms requires a supply-
side analysis. In this section, we provide an industry-level analysis of some potential
consequences of tariff reform.
To motivate the analysis, we begin with a graphic illustration of the impact of the FTA on an
industry. Our approach assumes constant nontradable factor prices except owing to tariff
changes directly, and so is legitimate only to the extent that this is approximately the case.
Naturally, a significant restructuring of relative output prices would lead to changes in the
demand for such nontraded factors (e.g., labor or land) and so to changes in the factor prices.
Tradable input prices are assumed fixed on world markets and so the domestic prices of these
inputs depend only on changes in the input tariff rates, which are accounted for in our
analysis. This maintained assumption of fixed nontraded factor prices in Colombia following
the FTA may be viewed as roughly legitimate—overall output in the industries under
consideration does not dominate the economy—or it may be viewed as a simplifying
assumption that could then be relaxed to mitigate the findings in a thoughtful way. For
example, as labor-intensive industries expand and wages eventually rise the cost structure
will be affected and expansion will be moderated.
We estimate the impact of the FTA on the industries being considered. The approach is
illustrated in Figure 6-1 which represents an industry supply curve diagram with initial price
and quantity supplied given by P1 and Q1. When tariffs are changed on inputs and output
simultaneously, two forces are at work in the industry. First, a change in the input tariffs will
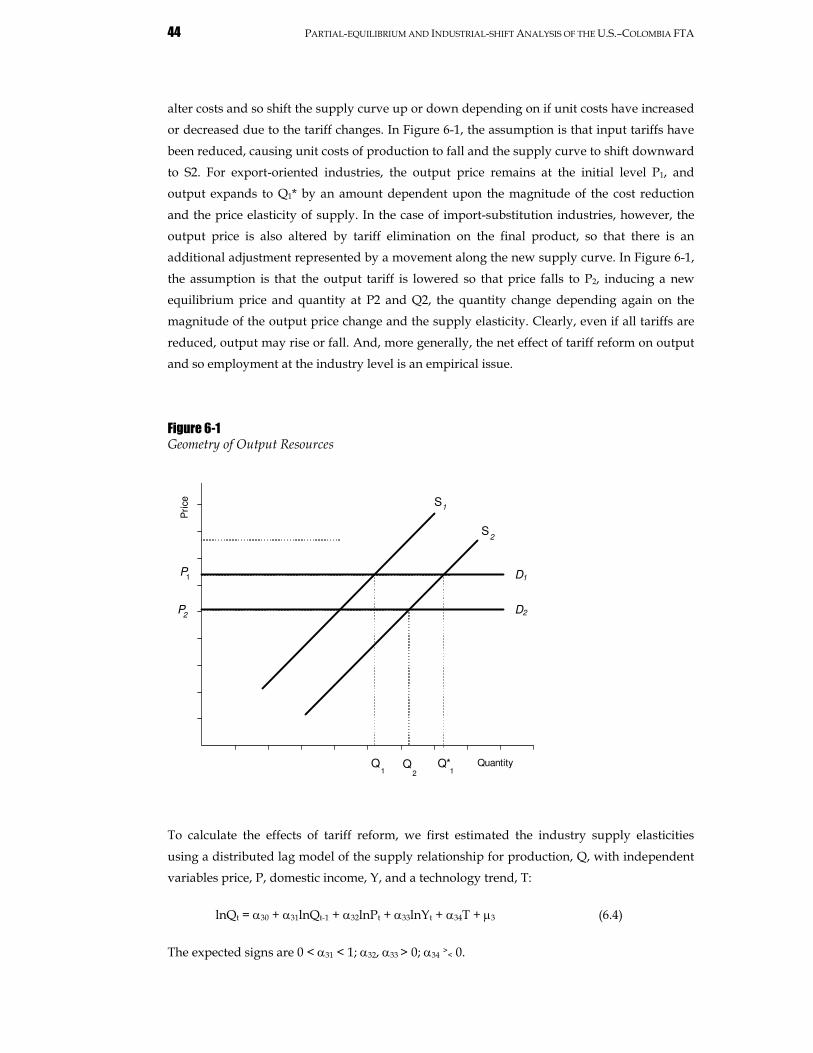
44 PARTIAL-EQUILIBRIUM AND INDUSTRIAL-SHIFTANALYSIS OF THEU.S.–COLOMBIA FTA
alter costs and so shift the supply curve up or down depending on if unit costs have increased
or decreased due to the tariff changes. In Figure 6-1, the assumption is that input tariffs have
been reduced, causing unit costs of production to fall and the supply curve to shift downward
to S2. For export-oriented industries, the output price remains at the initial level P1, and
output expands to Q1* by an amount dependent upon the magnitude of the cost reduction
and the price elasticity of supply. In the case of import-substitution industries, however, the
output price is also altered by tariff elimination on the final product, so that there is an
additional adjustment represented by a movement along the new supply curve. In Figure 6-1,
the assumption is that the output tariff is lowered so that price falls to P2, inducing a new
equilibrium price and quantity at P2 and Q2, the quantity change depending again on the
magnitude of the output price change and the supply elasticity. Clearly, even if all tariffs are
reduced, output may rise or fall. And, more generally, the net effect of tariff reform on output
and so employment at the industry level is an empirical issue.
Figure 6-1Geometry of Output Resources
To calculate the effects of tariff reform, we first estimated the industry supply elasticities
using a distributed lag model of the supply relationship for production, Q, with independent
variables price, P, domestic income, Y, and a technology trend, T:
lnQt = 30 + 31lnQt-1 + 32lnPt + 33lnYt + 34T + 3 (6.4)
The expected signs are 0 < 31 < 1; 32, 33> 0; 34 >< 0.
P2
P1
Q2
Q1
S1
S2
D1
Quantity
Pri
ce
Q*1
D2
PRODUCTION-SHIFTANALYSIS 45
Table 6-2 (and Table B-11 in Appendix B) report the estimates, some diagnostics, and the
elasticities. Overall, the production-weighted price elasticity of supply is 0.5 in the short term,
and 1.6 in the long term (unweighted: 0.7 and 1.8 respectively). Among the different types of
industries, industrial activities have the highest price elasticity, averaging 2.0 in the long term,
and mining activities have the lowest, averaging 1.0 in the long term, with agriculture not far
behind at 1.1. From an analytical viewpoint, the distinction between export-oriented and
import-substituting industries is central to the FTA impact analysis. Export-oriented activities
have a significantly low price elasticity of supply (1.1) than those involved in import-
substituting activities (1.9). Consequently, we would expect larger adjustments in the import-
substituting industries than in the export substituting ones if all of them confronted the same
tariff structure on inputs and their final products.
OutputandEmploymentAdjustmentstotheFTA
Shifts in the supply curves associated with input tariff changes were calculated as the FTA-
induced change in input tariffs weighted by each input’s total nonfactor costs. Movementsalong the new supply curve resulting from output tariff changes and cost change–inducedequilibrating changes were then calculated using the elasticity estimates. As indicated earlier,
for import-substituting industries, both cost-induced supply adjustments and price-induced
changes in output were calculated, whereas only cost-induced supply adjustments were
estimated for export-oriented industries not enjoying a protected market, and consequently
pre-FTA higher prices.
The impact of the FTA on Colombia’s output is shown in Table 6-3 for individual industries,industry types, and the total. The FTA leads to contractions for most import-substituting
industries, but cost reductions substantially mitigate those declines. For instance, the NRP
declines by 12.7 percent, but for import-substituting industries the benefits of cost-associated
price declines averaging -9.3 nearly offset the price-declines averaging 11.1 percent for these
types of activities.12
The results presented in Table 6-3 clearly point to the benefits to be derived from the FTA for
export-oriented industries, which are expected to expand production by nearly 10 percent on
average as a result of lower costs on their inputs. Especially large production increases are
expected for fruits, nuts and beverages; cattle farming; forestry products; coal mining;
petroleum; canning of fruits and vegetables; and manufactures of vegetable and animal oils.
For the import-substituting industries output is expected to contract by nearly 4 percent as
producers face competition from foreign suppliers. The largest adjustments are expected to
12 The ISIC classification used in this section for the agricultural sector corresponds to Revision 3, while theISIC classification for manufacturing industry and mining corresponds to Revision 2. Under ISIC Revision 3one can obtain a wider breakdown for the agricultural sector at the 4-digit level.
46 PARTIAL-EQUILIBRIUM AND INDUSTRIAL-SHIFTANALYSIS OF THEU.S.–COLOMBIA FTA
occur in (1) finished textiles, (2) wearing apparel, (3) canning of fish, (4) manufactures of
sporting goods, (5) cordage and rope, (6) electrical apparatus, and (7) cement, lime and
plaster. Overall, gains from expansion in output from export-oriented industries significantly
outweigh contractions likely to be experienced by import-substituting industries. Colombia’soverall output could expand by about 5 percent. Especially large output gains are likely in
mining, followed by export-oriented industries.
The employment effects associated with the FTA-induced adjustments in Colombia’sindustries assume fixed labor-output coefficients in production. For this reason, the same
export-oriented industries likely to expand their employment are those that will significantly
increase their output, while those experiencing the largest contractions in employment are
those with larger output adjustments. Table 6-4 calculates possible changes in industry
employment parameterized to 2000 levels that would ensue following the FTA. These
employment changes are of course suggestive of the quantities involved. Using the output
adjustment estimates above, we calculated the percentage change in employment resulting
from the FTA-related tariff adjustments. We then calibrated the actual levels of employment
by industry to calculate the estimated change in labor demand by sector. Overall, total
employment of Colombia increases by more than 5 percent, with the largest gains occurring in
mining industries, followed by export-oriented industrial activities. Naturally the biggest
gains in employment will occur in export-oriented industries, which are shown to increase
employment by 7.5 percent. Import-competing industries are likely to experience contractions
in their labor force, which in our estimates average less than 4 percent.
Trade liberalization in Colombia can be expected to increase demand for labor in the long
term. Removing policies that favor capital-intensive import-substitution sectors at the expense
of more competitive export sectors ultimately results in expansion of the export sectors and a
contraction of the import-substitution sectors. The net effect in the long term is higher wages
and expanding employment. During the transition, however, import-substituting industries
are likely to experience contraction in employment. The export sector growth, however, is
likely to absorb displaced workers and require additional workers.
There is considerable evidence that adjustment costs are likely to be small. Twenty percent of
the formal labor force works in the most vulnerable sector, import-substituting activities in
manufacturing. Even if 4 percent of those workers have to change jobs, as is suggested by our
analysis, the adjustment would represent less than 1 percent of the labor force. The annual
labor turnover rate in manufacturing is normally 78 percent, so this adjustment could be
accommodated in two years. Many of these displaced workers are likely to be absorbed into
other sectors, especially the service and export-oriented industries, which are expected to
increase employment by 7.5 percent, which will add another 1.5 percent to Colombia’s totalemployment figures. Moreover, the evidence of significant Colombian labor force mobility
clearly suggests that workers could adjust from import-substituting industries to those

PRODUCTION-SHIFTANALYSIS 47
directed to export markets because the phasing of tariff reductions are likely to take place
over several years.
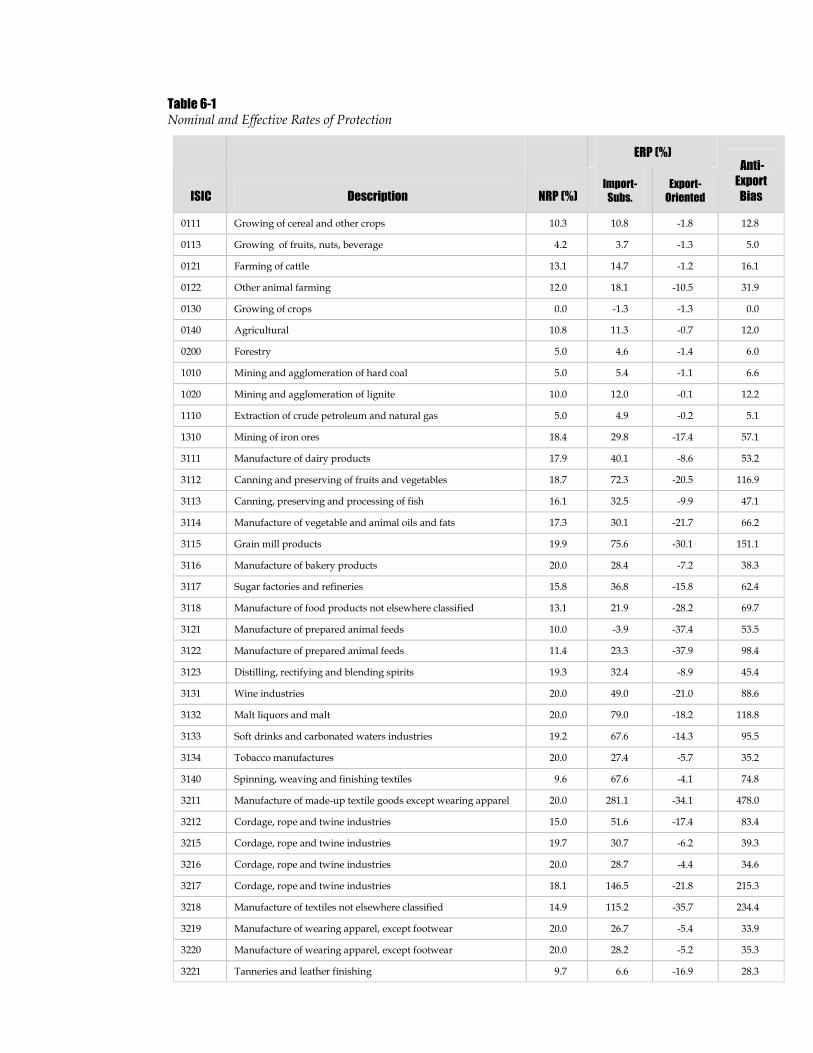
Table 6-1Nominal and Effective Rates of Protection
ERP (%)
ISIC Description NRP (%)Import-
Subs.
Export-
Oriented
Anti-
Export
Bias
0111 Growing of cereal and other crops 10.3 10.8 -1.8 12.8
0113 Growing of fruits, nuts, beverage 4.2 3.7 -1.3 5.0
0121 Farming of cattle 13.1 14.7 -1.2 16.1
0122 Other animal farming 12.0 18.1 -10.5 31.9
0130 Growing of crops 0.0 -1.3 -1.3 0.0
0140 Agricultural 10.8 11.3 -0.7 12.0
0200 Forestry 5.0 4.6 -1.4 6.0
1010 Mining and agglomeration of hard coal 5.0 5.4 -1.1 6.6
1020 Mining and agglomeration of lignite 10.0 12.0 -0.1 12.2
1110 Extraction of crude petroleum and natural gas 5.0 4.9 -0.2 5.1
1310 Mining of iron ores 18.4 29.8 -17.4 57.1
3111 Manufacture of dairy products 17.9 40.1 -8.6 53.2
3112 Canning and preserving of fruits and vegetables 18.7 72.3 -20.5 116.9
3113 Canning, preserving and processing of fish 16.1 32.5 -9.9 47.1
3114 Manufacture of vegetable and animal oils and fats 17.3 30.1 -21.7 66.2
3115 Grain mill products 19.9 75.6 -30.1 151.1
3116 Manufacture of bakery products 20.0 28.4 -7.2 38.3
3117 Sugar factories and refineries 15.8 36.8 -15.8 62.4
3118 Manufacture of food products not elsewhere classified 13.1 21.9 -28.2 69.7
3121 Manufacture of prepared animal feeds 10.0 -3.9 -37.4 53.5
3122 Manufacture of prepared animal feeds 11.4 23.3 -37.9 98.4
3123 Distilling, rectifying and blending spirits 19.3 32.4 -8.9 45.4
3131 Wine industries 20.0 49.0 -21.0 88.6
3132 Malt liquors and malt 20.0 79.0 -18.2 118.8
3133 Soft drinks and carbonated waters industries 19.2 67.6 -14.3 95.5
3134 Tobacco manufactures 20.0 27.4 -5.7 35.2
3140 Spinning, weaving and finishing textiles 9.6 67.6 -4.1 74.8
3211 Manufacture of made-up textile goods except wearing apparel 20.0 281.1 -34.1 478.0
3212 Cordage, rope and twine industries 15.0 51.6 -17.4 83.4
3215 Cordage, rope and twine industries 19.7 30.7 -6.2 39.3
3216 Cordage, rope and twine industries 20.0 28.7 -4.4 34.6
3217 Cordage, rope and twine industries 18.1 146.5 -21.8 215.3
3218 Manufacture of textiles not elsewhere classified 14.9 115.2 -35.7 234.4
3219 Manufacture of wearing apparel, except footwear 20.0 26.7 -5.4 33.9
3220 Manufacture of wearing apparel, except footwear 20.0 28.2 -5.2 35.3
3221 Tanneries and leather finishing 9.7 6.6 -16.9 28.3
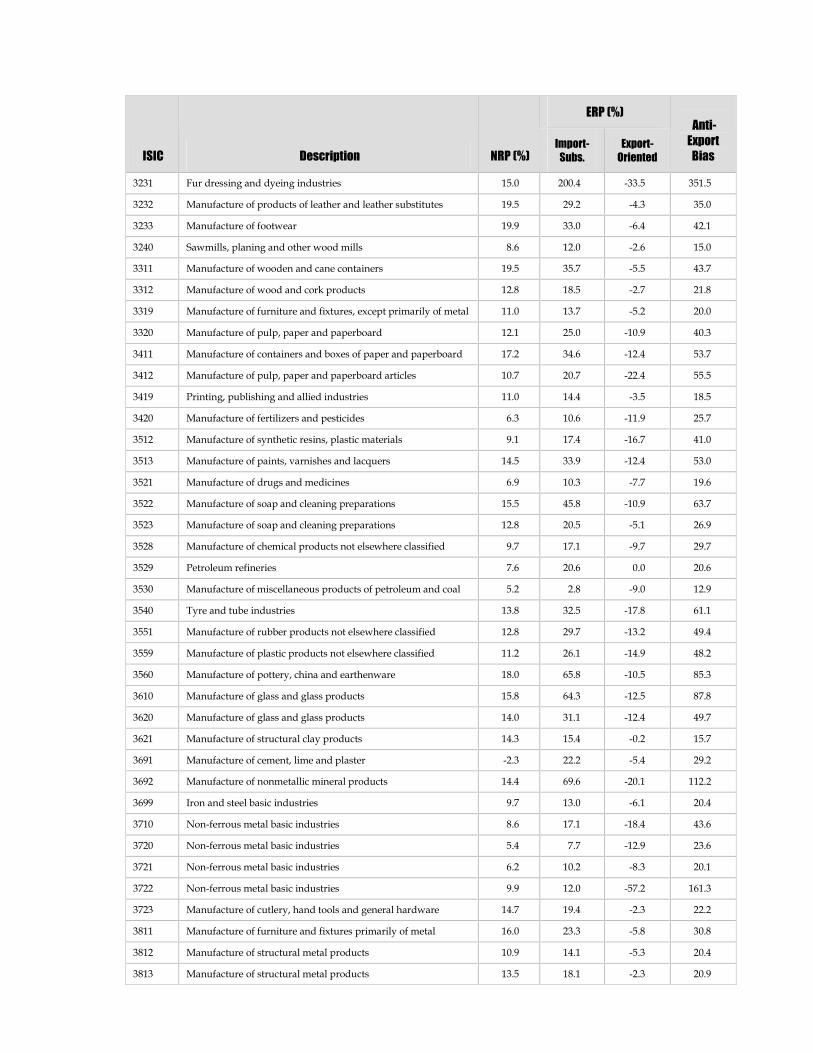
ERP (%)
ISIC Description NRP (%)Import-
Subs.
Export-
Oriented
Anti-
Export
Bias
3231 Fur dressing and dyeing industries 15.0 200.4 -33.5 351.5
3232 Manufacture of products of leather and leather substitutes 19.5 29.2 -4.3 35.0
3233 Manufacture of footwear 19.9 33.0 -6.4 42.1
3240 Sawmills, planing and other wood mills 8.6 12.0 -2.6 15.0
3311 Manufacture of wooden and cane containers 19.5 35.7 -5.5 43.7
3312 Manufacture of wood and cork products 12.8 18.5 -2.7 21.8
3319 Manufacture of furniture and fixtures, except primarily of metal 11.0 13.7 -5.2 20.0
3320 Manufacture of pulp, paper and paperboard 12.1 25.0 -10.9 40.3
3411 Manufacture of containers and boxes of paper and paperboard 17.2 34.6 -12.4 53.7
3412 Manufacture of pulp, paper and paperboard articles 10.7 20.7 -22.4 55.5
3419 Printing, publishing and allied industries 11.0 14.4 -3.5 18.5
3420 Manufacture of fertilizers and pesticides 6.3 10.6 -11.9 25.7
3512 Manufacture of synthetic resins, plastic materials 9.1 17.4 -16.7 41.0
3513 Manufacture of paints, varnishes and lacquers 14.5 33.9 -12.4 53.0
3521 Manufacture of drugs and medicines 6.9 10.3 -7.7 19.6
3522 Manufacture of soap and cleaning preparations 15.5 45.8 -10.9 63.7
3523 Manufacture of soap and cleaning preparations 12.8 20.5 -5.1 26.9
3528 Manufacture of chemical products not elsewhere classified 9.7 17.1 -9.7 29.7
3529 Petroleum refineries 7.6 20.6 0.0 20.6
3530 Manufacture of miscellaneous products of petroleum and coal 5.2 2.8 -9.0 12.9
3540 Tyre and tube industries 13.8 32.5 -17.8 61.1
3551 Manufacture of rubber products not elsewhere classified 12.8 29.7 -13.2 49.4
3559 Manufacture of plastic products not elsewhere classified 11.2 26.1 -14.9 48.2
3560 Manufacture of pottery, china and earthenware 18.0 65.8 -10.5 85.3
3610 Manufacture of glass and glass products 15.8 64.3 -12.5 87.8
3620 Manufacture of glass and glass products 14.0 31.1 -12.4 49.7
3621 Manufacture of structural clay products 14.3 15.4 -0.2 15.7
3691 Manufacture of cement, lime and plaster -2.3 22.2 -5.4 29.2
3692 Manufacture of nonmetallic mineral products 14.4 69.6 -20.1 112.2
3699 Iron and steel basic industries 9.7 13.0 -6.1 20.4
3710 Non-ferrous metal basic industries 8.6 17.1 -18.4 43.6
3720 Non-ferrous metal basic industries 5.4 7.7 -12.9 23.6
3721 Non-ferrous metal basic industries 6.2 10.2 -8.3 20.1
3722 Non-ferrous metal basic industries 9.9 12.0 -57.2 161.3
3723 Manufacture of cutlery, hand tools and general hardware 14.7 19.4 -2.3 22.2
3811 Manufacture of furniture and fixtures primarily of metal 16.0 23.3 -5.8 30.8
3812 Manufacture of structural metal products 10.9 14.1 -5.3 20.4
3813 Manufacture of structural metal products 13.5 18.1 -2.3 20.9
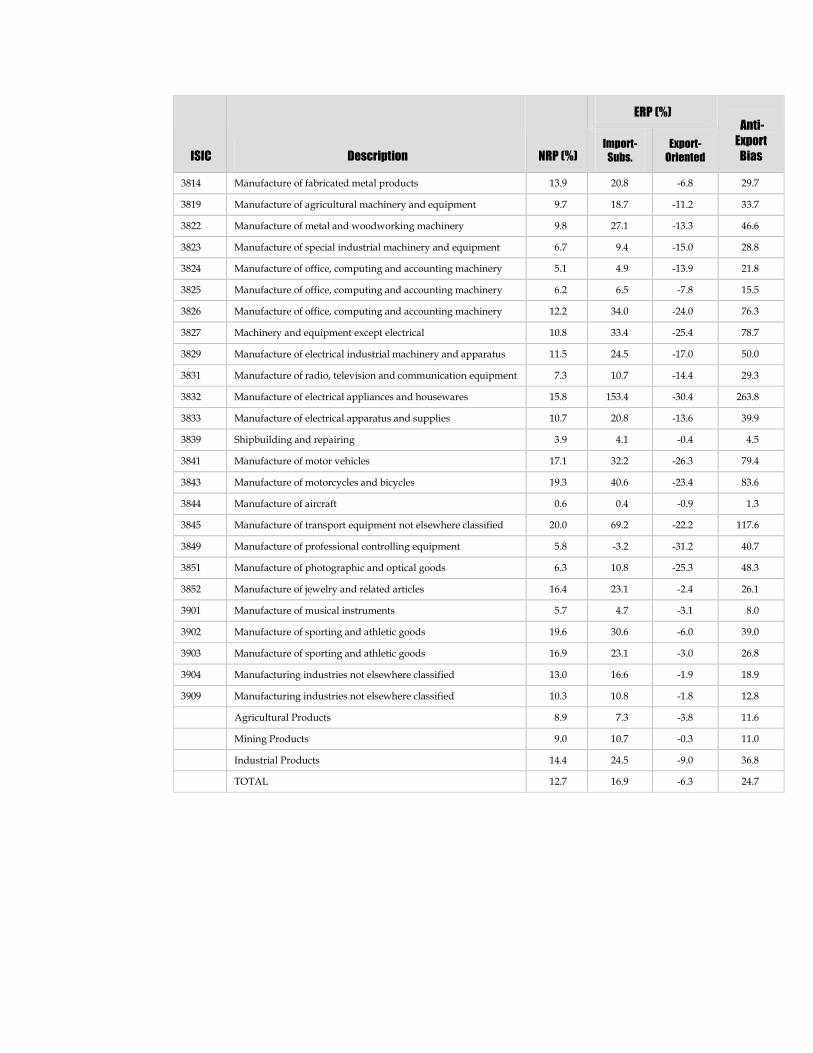
ERP (%)
ISIC Description NRP (%)Import-
Subs.
Export-
Oriented
Anti-
Export
Bias
3814 Manufacture of fabricated metal products 13.9 20.8 -6.8 29.7
3819 Manufacture of agricultural machinery and equipment 9.7 18.7 -11.2 33.7
3822 Manufacture of metal and woodworking machinery 9.8 27.1 -13.3 46.6
3823 Manufacture of special industrial machinery and equipment 6.7 9.4 -15.0 28.8
3824 Manufacture of office, computing and accounting machinery 5.1 4.9 -13.9 21.8
3825 Manufacture of office, computing and accounting machinery 6.2 6.5 -7.8 15.5
3826 Manufacture of office, computing and accounting machinery 12.2 34.0 -24.0 76.3
3827 Machinery and equipment except electrical 10.8 33.4 -25.4 78.7
3829 Manufacture of electrical industrial machinery and apparatus 11.5 24.5 -17.0 50.0
3831 Manufacture of radio, television and communication equipment 7.3 10.7 -14.4 29.3
3832 Manufacture of electrical appliances and housewares 15.8 153.4 -30.4 263.8
3833 Manufacture of electrical apparatus and supplies 10.7 20.8 -13.6 39.9
3839 Shipbuilding and repairing 3.9 4.1 -0.4 4.5
3841 Manufacture of motor vehicles 17.1 32.2 -26.3 79.4
3843 Manufacture of motorcycles and bicycles 19.3 40.6 -23.4 83.6
3844 Manufacture of aircraft 0.6 0.4 -0.9 1.3
3845 Manufacture of transport equipment not elsewhere classified 20.0 69.2 -22.2 117.6
3849 Manufacture of professional controlling equipment 5.8 -3.2 -31.2 40.7
3851 Manufacture of photographic and optical goods 6.3 10.8 -25.3 48.3
3852 Manufacture of jewelry and related articles 16.4 23.1 -2.4 26.1
3901 Manufacture of musical instruments 5.7 4.7 -3.1 8.0
3902 Manufacture of sporting and athletic goods 19.6 30.6 -6.0 39.0
3903 Manufacture of sporting and athletic goods 16.9 23.1 -3.0 26.8
3904 Manufacturing industries not elsewhere classified 13.0 16.6 -1.9 18.9
3909 Manufacturing industries not elsewhere classified 10.3 10.8 -1.8 12.8
Agricultural Products 8.9 7.3 -3.8 11.6
Mining Products 9.0 10.7 -0.3 11.0
Industrial Products 14.4 24.5 -9.0 36.8
TOTAL 12.7 16.9 -6.3 24.7
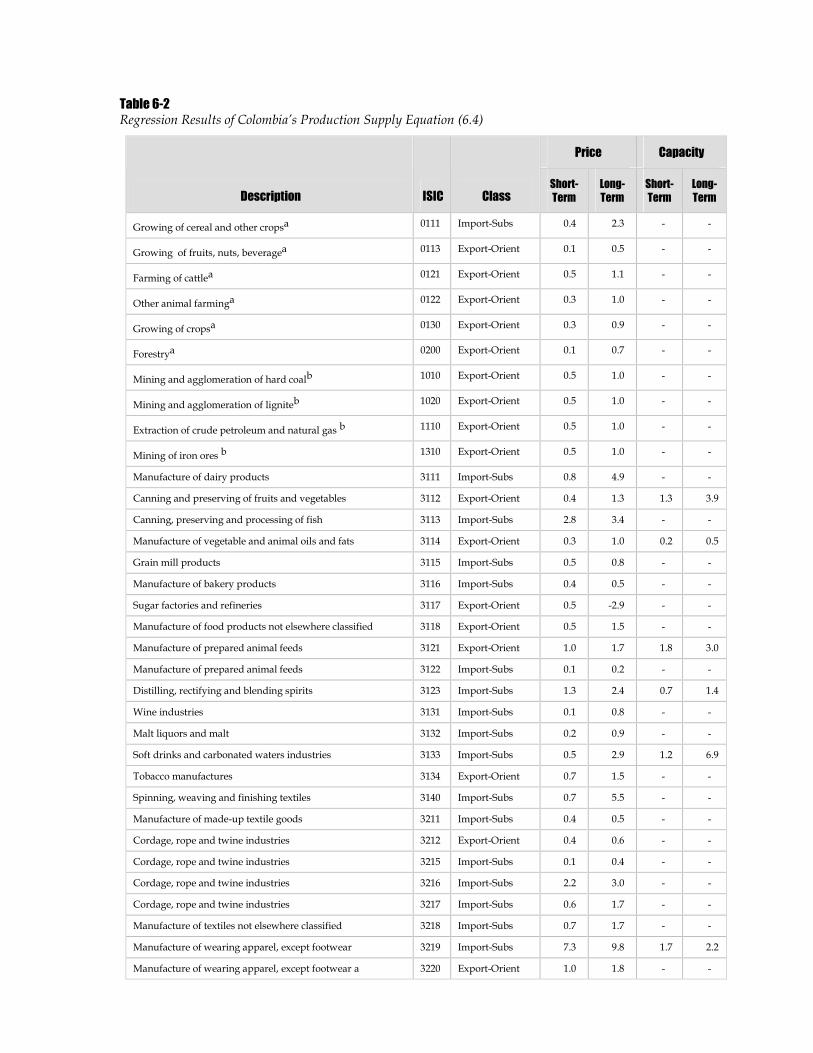
Table 6-2Regression Results of Colombia’s Production Supply Equation (6.4)
Price Capacity
Description ISIC ClassShort-
Term
Long-
Term
Short-
Term
Long-
Term
Growing of cereal and other cropsa 0111 Import-Subs 0.4 2.3 - -
Growing of fruits, nuts, beveragea 0113 Export-Orient 0.1 0.5 - -
Farming of cattlea 0121 Export-Orient 0.5 1.1 - -
Other animal farminga 0122 Export-Orient 0.3 1.0 - -
Growing of cropsa 0130 Export-Orient 0.3 0.9 - -
Forestrya 0200 Export-Orient 0.1 0.7 - -
Mining and agglomeration of hard coalb 1010 Export-Orient 0.5 1.0 - -
Mining and agglomeration of ligniteb 1020 Export-Orient 0.5 1.0 - -
Extraction of crude petroleum and natural gas b 1110 Export-Orient 0.5 1.0 - -
Mining of iron ores b 1310 Export-Orient 0.5 1.0 - -
Manufacture of dairy products 3111 Import-Subs 0.8 4.9 - -
Canning and preserving of fruits and vegetables 3112 Export-Orient 0.4 1.3 1.3 3.9
Canning, preserving and processing of fish 3113 Import-Subs 2.8 3.4 - -
Manufacture of vegetable and animal oils and fats 3114 Export-Orient 0.3 1.0 0.2 0.5
Grain mill products 3115 Import-Subs 0.5 0.8 - -
Manufacture of bakery products 3116 Import-Subs 0.4 0.5 - -
Sugar factories and refineries 3117 Export-Orient 0.5 -2.9 - -
Manufacture of food products not elsewhere classified 3118 Export-Orient 0.5 1.5 - -
Manufacture of prepared animal feeds 3121 Export-Orient 1.0 1.7 1.8 3.0
Manufacture of prepared animal feeds 3122 Import-Subs 0.1 0.2 - -
Distilling, rectifying and blending spirits 3123 Import-Subs 1.3 2.4 0.7 1.4
Wine industries 3131 Import-Subs 0.1 0.8 - -
Malt liquors and malt 3132 Import-Subs 0.2 0.9 - -
Soft drinks and carbonated waters industries 3133 Import-Subs 0.5 2.9 1.2 6.9
Tobacco manufactures 3134 Export-Orient 0.7 1.5 - -
Spinning, weaving and finishing textiles 3140 Import-Subs 0.7 5.5 - -
Manufacture of made-up textile goods 3211 Import-Subs 0.4 0.5 - -
Cordage, rope and twine industries 3212 Export-Orient 0.4 0.6 - -
Cordage, rope and twine industries 3215 Import-Subs 0.1 0.4 - -
Cordage, rope and twine industries 3216 Import-Subs 2.2 3.0 - -
Cordage, rope and twine industries 3217 Import-Subs 0.6 1.7 - -
Manufacture of textiles not elsewhere classified 3218 Import-Subs 0.7 1.7 - -
Manufacture of wearing apparel, except footwear 3219 Import-Subs 7.3 9.8 1.7 2.2
Manufacture of wearing apparel, except footwear a 3220 Export-Orient 1.0 1.8 - -
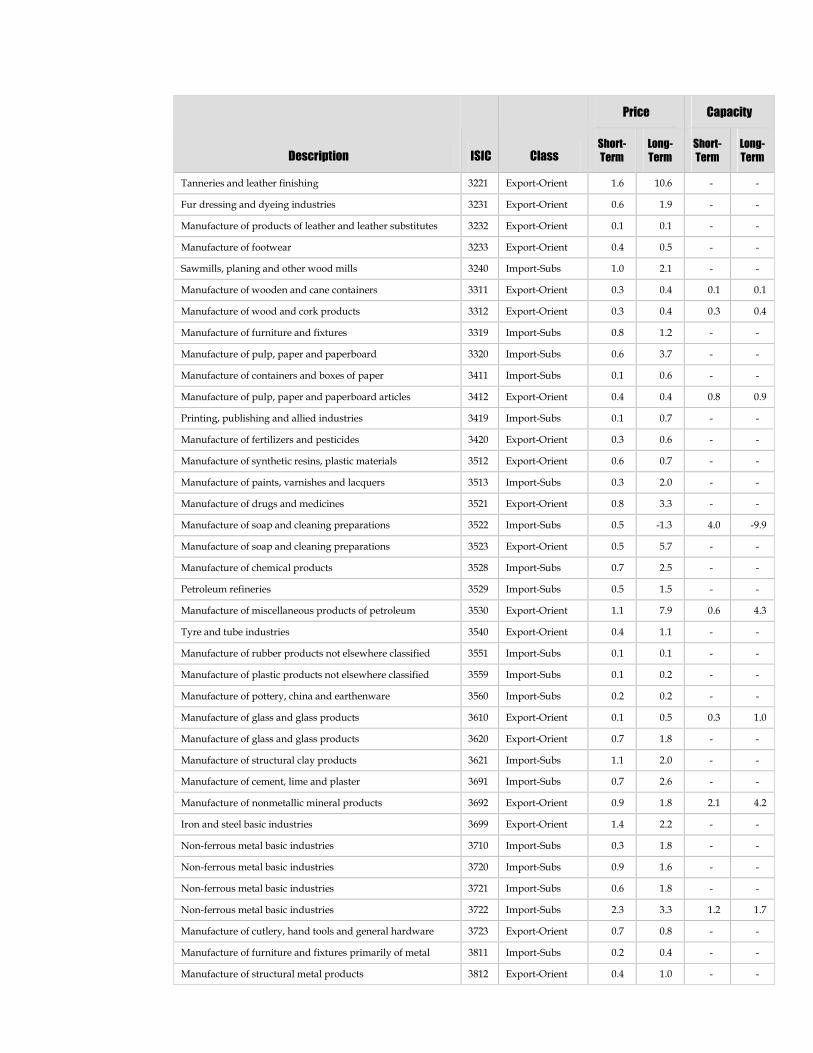
Price Capacity
Description ISIC ClassShort-
Term
Long-
Term
Short-
Term
Long-
Term
Tanneries and leather finishing 3221 Export-Orient 1.6 10.6 - -
Fur dressing and dyeing industries 3231 Export-Orient 0.6 1.9 - -
Manufacture of products of leather and leather substitutes 3232 Export-Orient 0.1 0.1 - -
Manufacture of footwear 3233 Export-Orient 0.4 0.5 - -
Sawmills, planing and other wood mills 3240 Import-Subs 1.0 2.1 - -
Manufacture of wooden and cane containers 3311 Export-Orient 0.3 0.4 0.1 0.1
Manufacture of wood and cork products 3312 Export-Orient 0.3 0.4 0.3 0.4
Manufacture of furniture and fixtures 3319 Import-Subs 0.8 1.2 - -
Manufacture of pulp, paper and paperboard 3320 Import-Subs 0.6 3.7 - -
Manufacture of containers and boxes of paper 3411 Import-Subs 0.1 0.6 - -
Manufacture of pulp, paper and paperboard articles 3412 Export-Orient 0.4 0.4 0.8 0.9
Printing, publishing and allied industries 3419 Import-Subs 0.1 0.7 - -
Manufacture of fertilizers and pesticides 3420 Export-Orient 0.3 0.6 - -
Manufacture of synthetic resins, plastic materials 3512 Export-Orient 0.6 0.7 - -
Manufacture of paints, varnishes and lacquers 3513 Import-Subs 0.3 2.0 - -
Manufacture of drugs and medicines 3521 Export-Orient 0.8 3.3 - -
Manufacture of soap and cleaning preparations 3522 Import-Subs 0.5 -1.3 4.0 -9.9
Manufacture of soap and cleaning preparations 3523 Export-Orient 0.5 5.7 - -
Manufacture of chemical products 3528 Import-Subs 0.7 2.5 - -
Petroleum refineries 3529 Import-Subs 0.5 1.5 - -
Manufacture of miscellaneous products of petroleum 3530 Export-Orient 1.1 7.9 0.6 4.3
Tyre and tube industries 3540 Export-Orient 0.4 1.1 - -
Manufacture of rubber products not elsewhere classified 3551 Import-Subs 0.1 0.1 - -
Manufacture of plastic products not elsewhere classified 3559 Import-Subs 0.1 0.2 - -
Manufacture of pottery, china and earthenware 3560 Import-Subs 0.2 0.2 - -
Manufacture of glass and glass products 3610 Export-Orient 0.1 0.5 0.3 1.0
Manufacture of glass and glass products 3620 Export-Orient 0.7 1.8 - -
Manufacture of structural clay products 3621 Import-Subs 1.1 2.0 - -
Manufacture of cement, lime and plaster 3691 Import-Subs 0.7 2.6 - -
Manufacture of nonmetallic mineral products 3692 Export-Orient 0.9 1.8 2.1 4.2
Iron and steel basic industries 3699 Export-Orient 1.4 2.2 - -
Non-ferrous metal basic industries 3710 Import-Subs 0.3 1.8 - -
Non-ferrous metal basic industries 3720 Import-Subs 0.9 1.6 - -
Non-ferrous metal basic industries 3721 Import-Subs 0.6 1.8 - -
Non-ferrous metal basic industries 3722 Import-Subs 2.3 3.3 1.2 1.7
Manufacture of cutlery, hand tools and general hardware 3723 Export-Orient 0.7 0.8 - -
Manufacture of furniture and fixtures primarily of metal 3811 Import-Subs 0.2 0.4 - -
Manufacture of structural metal products 3812 Export-Orient 0.4 1.0 - -
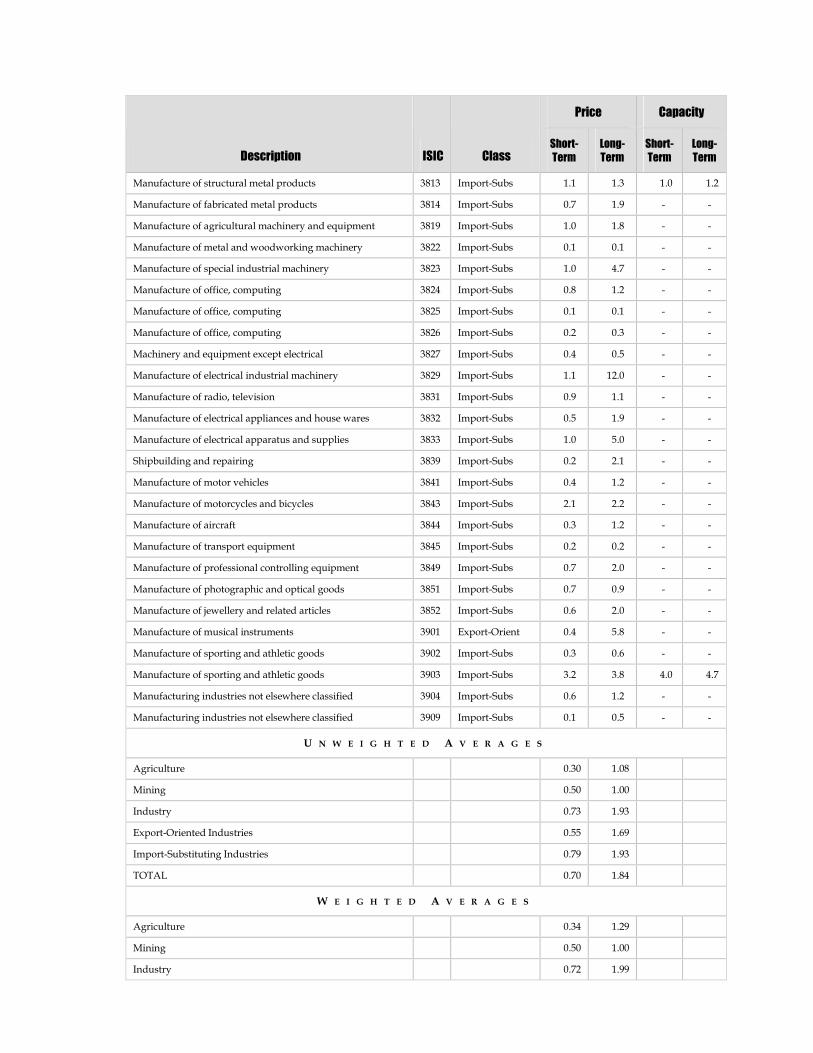
Price Capacity
Description ISIC ClassShort-
Term
Long-
Term
Short-
Term
Long-
Term
Manufacture of structural metal products 3813 Import-Subs 1.1 1.3 1.0 1.2
Manufacture of fabricated metal products 3814 Import-Subs 0.7 1.9 - -
Manufacture of agricultural machinery and equipment 3819 Import-Subs 1.0 1.8 - -
Manufacture of metal and woodworking machinery 3822 Import-Subs 0.1 0.1 - -
Manufacture of special industrial machinery 3823 Import-Subs 1.0 4.7 - -
Manufacture of office, computing 3824 Import-Subs 0.8 1.2 - -
Manufacture of office, computing 3825 Import-Subs 0.1 0.1 - -
Manufacture of office, computing 3826 Import-Subs 0.2 0.3 - -
Machinery and equipment except electrical 3827 Import-Subs 0.4 0.5 - -
Manufacture of electrical industrial machinery 3829 Import-Subs 1.1 12.0 - -
Manufacture of radio, television 3831 Import-Subs 0.9 1.1 - -
Manufacture of electrical appliances and house wares 3832 Import-Subs 0.5 1.9 - -
Manufacture of electrical apparatus and supplies 3833 Import-Subs 1.0 5.0 - -
Shipbuilding and repairing 3839 Import-Subs 0.2 2.1 - -
Manufacture of motor vehicles 3841 Import-Subs 0.4 1.2 - -
Manufacture of motorcycles and bicycles 3843 Import-Subs 2.1 2.2 - -
Manufacture of aircraft 3844 Import-Subs 0.3 1.2 - -
Manufacture of transport equipment 3845 Import-Subs 0.2 0.2 - -
Manufacture of professional controlling equipment 3849 Import-Subs 0.7 2.0 - -
Manufacture of photographic and optical goods 3851 Import-Subs 0.7 0.9 - -
Manufacture of jewellery and related articles 3852 Import-Subs 0.6 2.0 - -
Manufacture of musical instruments 3901 Export-Orient 0.4 5.8 - -
Manufacture of sporting and athletic goods 3902 Import-Subs 0.3 0.6 - -
Manufacture of sporting and athletic goods 3903 Import-Subs 3.2 3.8 4.0 4.7
Manufacturing industries not elsewhere classified 3904 Import-Subs 0.6 1.2 - -
Manufacturing industries not elsewhere classified 3909 Import-Subs 0.1 0.5 - -
U N W E I G H T E D A V E R A G E S
Agriculture 0.30 1.08
Mining 0.50 1.00
Industry 0.73 1.93
Export-Oriented Industries 0.55 1.69
Import-Substituting Industries 0.79 1.93
TOTAL 0.70 1.84
W E I G H T E D A V E R A G E S
Agriculture 0.34 1.29
Mining 0.50 1.00
Industry 0.72 1.99
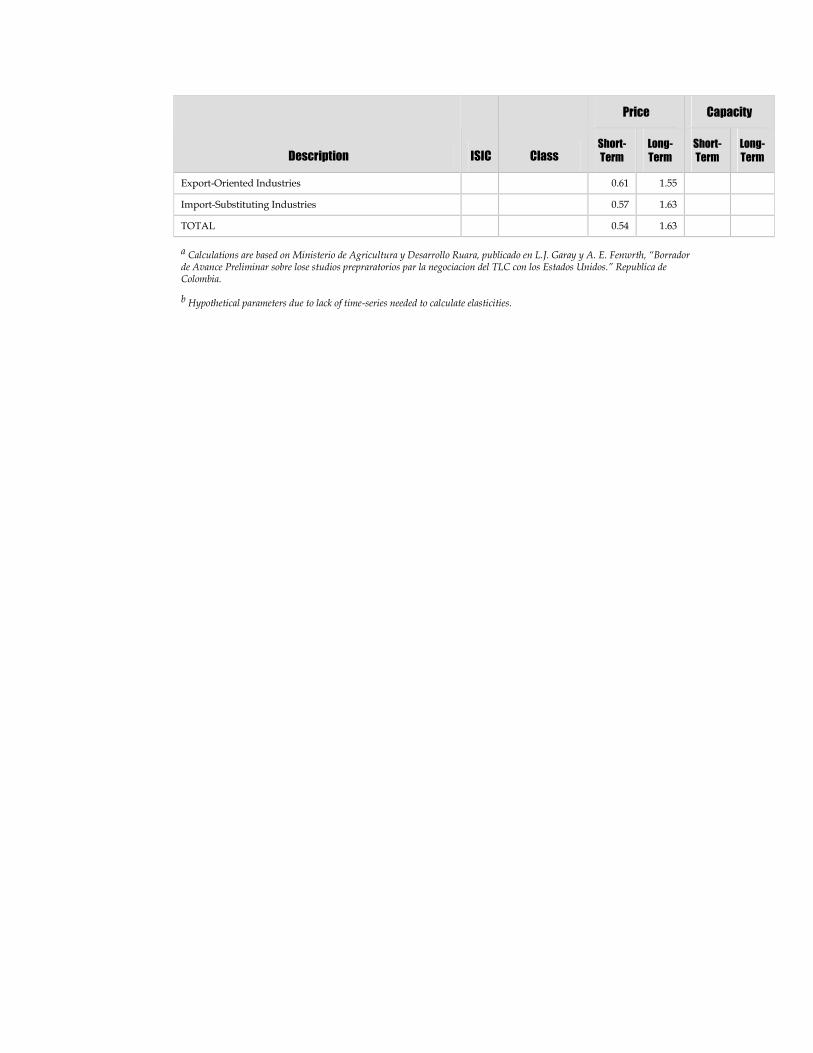
Price Capacity
Description ISIC ClassShort-
Term
Long-
Term
Short-
Term
Long-
Term
Export-Oriented Industries 0.61 1.55
Import-Substituting Industries 0.57 1.63
TOTAL 0.54 1.63
a Calculations are based on Ministerio de Agricultura y Desarrollo Ruara, publicado en L.J. Garay y A. E. Fenwrth, “Borrador de Avance Preliminar sobre lose studios prepraratorios par la negociacion del TLC con los Estados Unidos.” Republica deColombia.
b Hypothetical parameters due to lack of time-series needed to calculate elasticities.
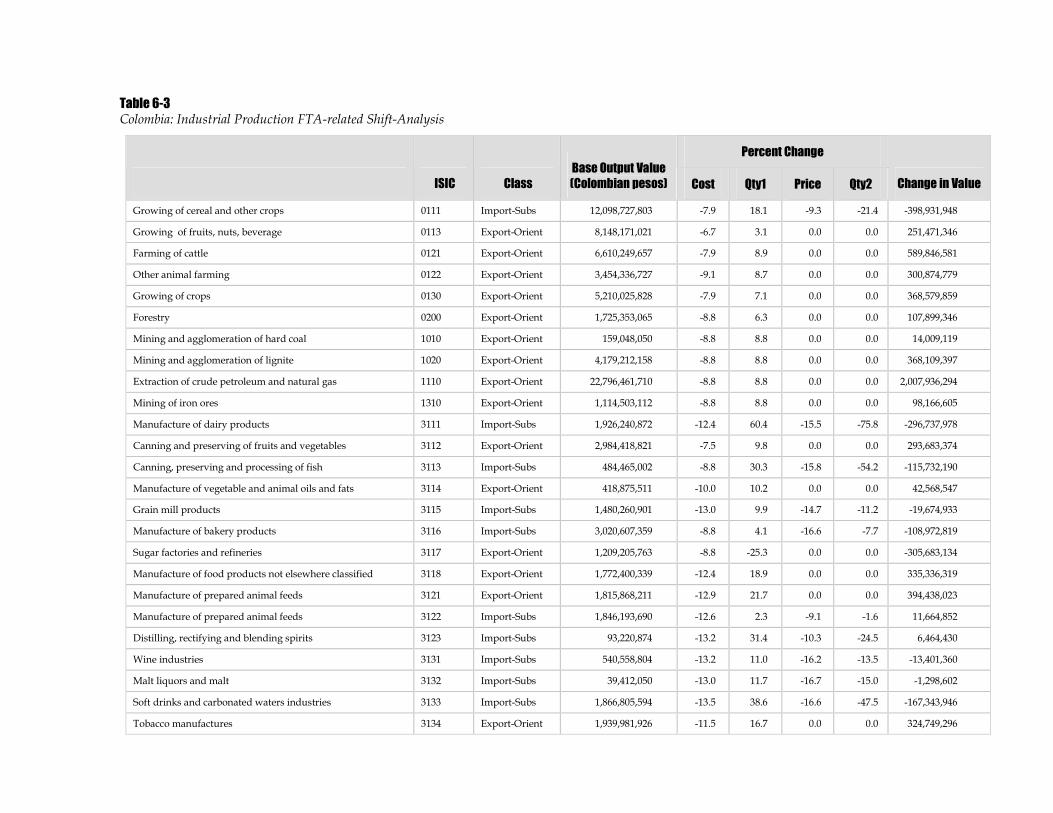
Table 6-3Colombia: Industrial Production FTA-related Shift-Analysis
Percent Change
ISIC Class
Base Output Value
(Colombian pesos) Cost Qty1 Price Qty2 Change in Value
Growing of cereal and other crops 0111 Import-Subs 12,098,727,803 -7.9 18.1 -9.3 -21.4 -398,931,948
Growing of fruits, nuts, beverage 0113 Export-Orient 8,148,171,021 -6.7 3.1 0.0 0.0 251,471,346
Farming of cattle 0121 Export-Orient 6,610,249,657 -7.9 8.9 0.0 0.0 589,846,581
Other animal farming 0122 Export-Orient 3,454,336,727 -9.1 8.7 0.0 0.0 300,874,779
Growing of crops 0130 Export-Orient 5,210,025,828 -7.9 7.1 0.0 0.0 368,579,859
Forestry 0200 Export-Orient 1,725,353,065 -8.8 6.3 0.0 0.0 107,899,346
Mining and agglomeration of hard coal 1010 Export-Orient 159,048,050 -8.8 8.8 0.0 0.0 14,009,119
Mining and agglomeration of lignite 1020 Export-Orient 4,179,212,158 -8.8 8.8 0.0 0.0 368,109,397
Extraction of crude petroleum and natural gas 1110 Export-Orient 22,796,461,710 -8.8 8.8 0.0 0.0 2,007,936,294
Mining of iron ores 1310 Export-Orient 1,114,503,112 -8.8 8.8 0.0 0.0 98,166,605
Manufacture of dairy products 3111 Import-Subs 1,926,240,872 -12.4 60.4 -15.5 -75.8 -296,737,978
Canning and preserving of fruits and vegetables 3112 Export-Orient 2,984,418,821 -7.5 9.8 0.0 0.0 293,683,374
Canning, preserving and processing of fish 3113 Import-Subs 484,465,002 -8.8 30.3 -15.8 -54.2 -115,732,190
Manufacture of vegetable and animal oils and fats 3114 Export-Orient 418,875,511 -10.0 10.2 0.0 0.0 42,568,547
Grain mill products 3115 Import-Subs 1,480,260,901 -13.0 9.9 -14.7 -11.2 -19,674,933
Manufacture of bakery products 3116 Import-Subs 3,020,607,359 -8.8 4.1 -16.6 -7.7 -108,972,819
Sugar factories and refineries 3117 Export-Orient 1,209,205,763 -8.8 -25.3 0.0 0.0 -305,683,134
Manufacture of food products not elsewhere classified 3118 Export-Orient 1,772,400,339 -12.4 18.9 0.0 0.0 335,336,319
Manufacture of prepared animal feeds 3121 Export-Orient 1,815,868,211 -12.9 21.7 0.0 0.0 394,438,023
Manufacture of prepared animal feeds 3122 Import-Subs 1,846,193,690 -12.6 2.3 -9.1 -1.6 11,664,852
Distilling, rectifying and blending spirits 3123 Import-Subs 93,220,874 -13.2 31.4 -10.3 -24.5 6,464,430
Wine industries 3131 Import-Subs 540,558,804 -13.2 11.0 -16.2 -13.5 -13,401,360
Malt liquors and malt 3132 Import-Subs 39,412,050 -13.0 11.7 -16.7 -15.0 -1,298,602
Soft drinks and carbonated waters industries 3133 Import-Subs 1,866,805,594 -13.5 38.6 -16.6 -47.5 -167,343,946
Tobacco manufactures 3134 Export-Orient 1,939,981,926 -11.5 16.7 0.0 0.0 324,749,296
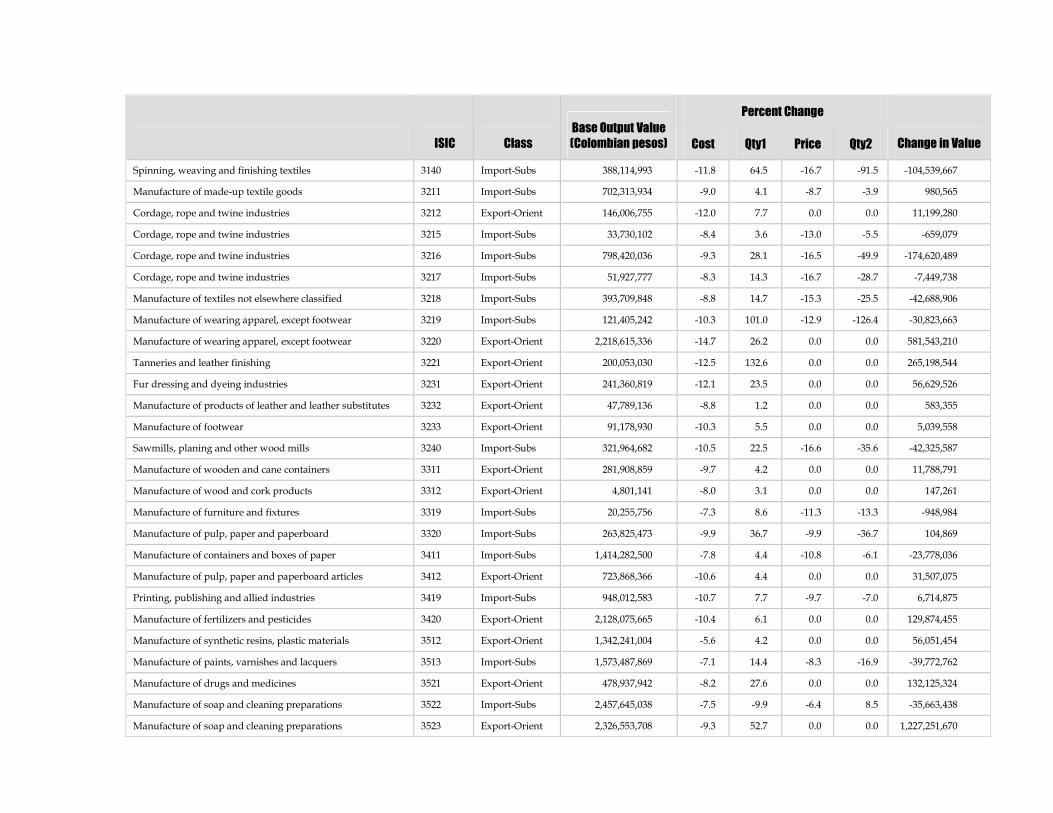
Percent Change
ISIC Class
Base Output Value
(Colombian pesos) Cost Qty1 Price Qty2 Change in Value
Spinning, weaving and finishing textiles 3140 Import-Subs 388,114,993 -11.8 64.5 -16.7 -91.5 -104,539,667
Manufacture of made-up textile goods 3211 Import-Subs 702,313,934 -9.0 4.1 -8.7 -3.9 980,565
Cordage, rope and twine industries 3212 Export-Orient 146,006,755 -12.0 7.7 0.0 0.0 11,199,280
Cordage, rope and twine industries 3215 Import-Subs 33,730,102 -8.4 3.6 -13.0 -5.5 -659,079
Cordage, rope and twine industries 3216 Import-Subs 798,420,036 -9.3 28.1 -16.5 -49.9 -174,620,489
Cordage, rope and twine industries 3217 Import-Subs 51,927,777 -8.3 14.3 -16.7 -28.7 -7,449,738
Manufacture of textiles not elsewhere classified 3218 Import-Subs 393,709,848 -8.8 14.7 -15.3 -25.5 -42,688,906
Manufacture of wearing apparel, except footwear 3219 Import-Subs 121,405,242 -10.3 101.0 -12.9 -126.4 -30,823,663
Manufacture of wearing apparel, except footwear 3220 Export-Orient 2,218,615,336 -14.7 26.2 0.0 0.0 581,543,210
Tanneries and leather finishing 3221 Export-Orient 200,053,030 -12.5 132.6 0.0 0.0 265,198,544
Fur dressing and dyeing industries 3231 Export-Orient 241,360,819 -12.1 23.5 0.0 0.0 56,629,526
Manufacture of products of leather and leather substitutes 3232 Export-Orient 47,789,136 -8.8 1.2 0.0 0.0 583,355
Manufacture of footwear 3233 Export-Orient 91,178,930 -10.3 5.5 0.0 0.0 5,039,558
Sawmills, planing and other wood mills 3240 Import-Subs 321,964,682 -10.5 22.5 -16.6 -35.6 -42,325,587
Manufacture of wooden and cane containers 3311 Export-Orient 281,908,859 -9.7 4.2 0.0 0.0 11,788,791
Manufacture of wood and cork products 3312 Export-Orient 4,801,141 -8.0 3.1 0.0 0.0 147,261
Manufacture of furniture and fixtures 3319 Import-Subs 20,255,756 -7.3 8.6 -11.3 -13.3 -948,984
Manufacture of pulp, paper and paperboard 3320 Import-Subs 263,825,473 -9.9 36.7 -9.9 -36.7 104,869
Manufacture of containers and boxes of paper 3411 Import-Subs 1,414,282,500 -7.8 4.4 -10.8 -6.1 -23,778,036
Manufacture of pulp, paper and paperboard articles 3412 Export-Orient 723,868,366 -10.6 4.4 0.0 0.0 31,507,075
Printing, publishing and allied industries 3419 Import-Subs 948,012,583 -10.7 7.7 -9.7 -7.0 6,714,875
Manufacture of fertilizers and pesticides 3420 Export-Orient 2,128,075,665 -10.4 6.1 0.0 0.0 129,874,455
Manufacture of synthetic resins, plastic materials 3512 Export-Orient 1,342,241,004 -5.6 4.2 0.0 0.0 56,051,454
Manufacture of paints, varnishes and lacquers 3513 Import-Subs 1,573,487,869 -7.1 14.4 -8.3 -16.9 -39,772,762
Manufacture of drugs and medicines 3521 Export-Orient 478,937,942 -8.2 27.6 0.0 0.0 132,125,324
Manufacture of soap and cleaning preparations 3522 Import-Subs 2,457,645,038 -7.5 -9.9 -6.4 8.5 -35,663,438
Manufacture of soap and cleaning preparations 3523 Export-Orient 2,326,553,708 -9.3 52.7 0.0 0.0 1,227,251,670
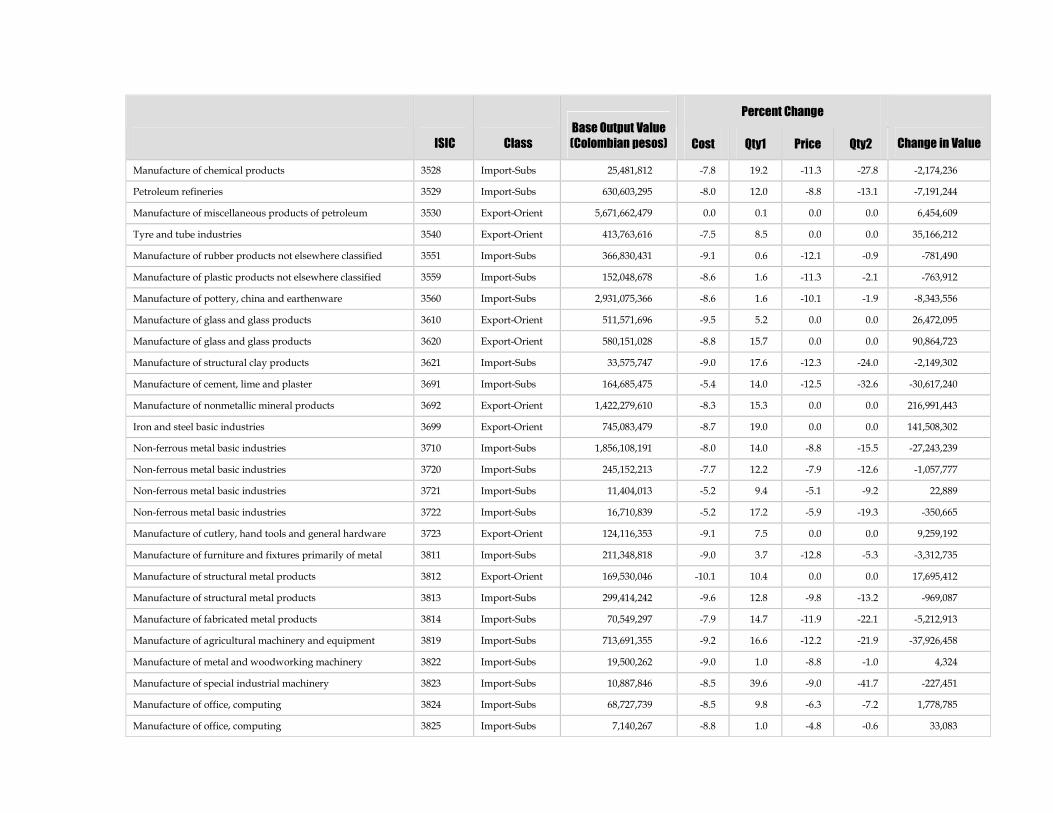
Percent Change
ISIC Class
Base Output Value
(Colombian pesos) Cost Qty1 Price Qty2 Change in Value
Manufacture of chemical products 3528 Import-Subs 25,481,812 -7.8 19.2 -11.3 -27.8 -2,174,236
Petroleum refineries 3529 Import-Subs 630,603,295 -8.0 12.0 -8.8 -13.1 -7,191,244
Manufacture of miscellaneous products of petroleum 3530 Export-Orient 5,671,662,479 0.0 0.1 0.0 0.0 6,454,609
Tyre and tube industries 3540 Export-Orient 413,763,616 -7.5 8.5 0.0 0.0 35,166,212
Manufacture of rubber products not elsewhere classified 3551 Import-Subs 366,830,431 -9.1 0.6 -12.1 -0.9 -781,490
Manufacture of plastic products not elsewhere classified 3559 Import-Subs 152,048,678 -8.6 1.6 -11.3 -2.1 -763,912
Manufacture of pottery, china and earthenware 3560 Import-Subs 2,931,075,366 -8.6 1.6 -10.1 -1.9 -8,343,556
Manufacture of glass and glass products 3610 Export-Orient 511,571,696 -9.5 5.2 0.0 0.0 26,472,095
Manufacture of glass and glass products 3620 Export-Orient 580,151,028 -8.8 15.7 0.0 0.0 90,864,723
Manufacture of structural clay products 3621 Import-Subs 33,575,747 -9.0 17.6 -12.3 -24.0 -2,149,302
Manufacture of cement, lime and plaster 3691 Import-Subs 164,685,475 -5.4 14.0 -12.5 -32.6 -30,617,240
Manufacture of nonmetallic mineral products 3692 Export-Orient 1,422,279,610 -8.3 15.3 0.0 0.0 216,991,443
Iron and steel basic industries 3699 Export-Orient 745,083,479 -8.7 19.0 0.0 0.0 141,508,302
Non-ferrous metal basic industries 3710 Import-Subs 1,856,108,191 -8.0 14.0 -8.8 -15.5 -27,243,239
Non-ferrous metal basic industries 3720 Import-Subs 245,152,213 -7.7 12.2 -7.9 -12.6 -1,057,777
Non-ferrous metal basic industries 3721 Import-Subs 11,404,013 -5.2 9.4 -5.1 -9.2 22,889
Non-ferrous metal basic industries 3722 Import-Subs 16,710,839 -5.2 17.2 -5.9 -19.3 -350,665
Manufacture of cutlery, hand tools and general hardware 3723 Export-Orient 124,116,353 -9.1 7.5 0.0 0.0 9,259,192
Manufacture of furniture and fixtures primarily of metal 3811 Import-Subs 211,348,818 -9.0 3.7 -12.8 -5.3 -3,312,735
Manufacture of structural metal products 3812 Export-Orient 169,530,046 -10.1 10.4 0.0 0.0 17,695,412
Manufacture of structural metal products 3813 Import-Subs 299,414,242 -9.6 12.8 -9.8 -13.2 -969,087
Manufacture of fabricated metal products 3814 Import-Subs 70,549,297 -7.9 14.7 -11.9 -22.1 -5,212,913
Manufacture of agricultural machinery and equipment 3819 Import-Subs 713,691,355 -9.2 16.6 -12.2 -21.9 -37,926,458
Manufacture of metal and woodworking machinery 3822 Import-Subs 19,500,262 -9.0 1.0 -8.8 -1.0 4,324
Manufacture of special industrial machinery 3823 Import-Subs 10,887,846 -8.5 39.6 -9.0 -41.7 -227,451
Manufacture of office, computing 3824 Import-Subs 68,727,739 -8.5 9.8 -6.3 -7.2 1,778,785
Manufacture of office, computing 3825 Import-Subs 7,140,267 -8.8 1.0 -4.8 -0.6 33,083
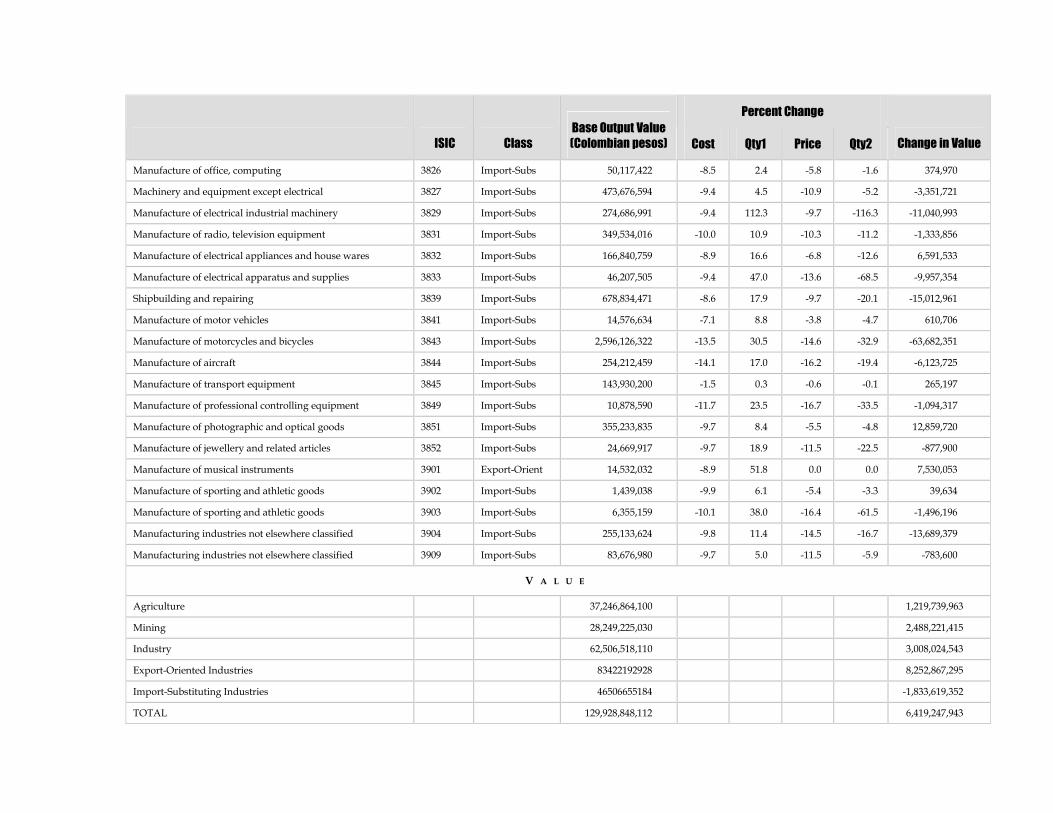
Percent Change
ISIC Class
Base Output Value
(Colombian pesos) Cost Qty1 Price Qty2 Change in Value
Manufacture of office, computing 3826 Import-Subs 50,117,422 -8.5 2.4 -5.8 -1.6 374,970
Machinery and equipment except electrical 3827 Import-Subs 473,676,594 -9.4 4.5 -10.9 -5.2 -3,351,721
Manufacture of electrical industrial machinery 3829 Import-Subs 274,686,991 -9.4 112.3 -9.7 -116.3 -11,040,993
Manufacture of radio, television equipment 3831 Import-Subs 349,534,016 -10.0 10.9 -10.3 -11.2 -1,333,856
Manufacture of electrical appliances and house wares 3832 Import-Subs 166,840,759 -8.9 16.6 -6.8 -12.6 6,591,533
Manufacture of electrical apparatus and supplies 3833 Import-Subs 46,207,505 -9.4 47.0 -13.6 -68.5 -9,957,354
Shipbuilding and repairing 3839 Import-Subs 678,834,471 -8.6 17.9 -9.7 -20.1 -15,012,961
Manufacture of motor vehicles 3841 Import-Subs 14,576,634 -7.1 8.8 -3.8 -4.7 610,706
Manufacture of motorcycles and bicycles 3843 Import-Subs 2,596,126,322 -13.5 30.5 -14.6 -32.9 -63,682,351
Manufacture of aircraft 3844 Import-Subs 254,212,459 -14.1 17.0 -16.2 -19.4 -6,123,725
Manufacture of transport equipment 3845 Import-Subs 143,930,200 -1.5 0.3 -0.6 -0.1 265,197
Manufacture of professional controlling equipment 3849 Import-Subs 10,878,590 -11.7 23.5 -16.7 -33.5 -1,094,317
Manufacture of photographic and optical goods 3851 Import-Subs 355,233,835 -9.7 8.4 -5.5 -4.8 12,859,720
Manufacture of jewellery and related articles 3852 Import-Subs 24,669,917 -9.7 18.9 -11.5 -22.5 -877,900
Manufacture of musical instruments 3901 Export-Orient 14,532,032 -8.9 51.8 0.0 0.0 7,530,053
Manufacture of sporting and athletic goods 3902 Import-Subs 1,439,038 -9.9 6.1 -5.4 -3.3 39,634
Manufacture of sporting and athletic goods 3903 Import-Subs 6,355,159 -10.1 38.0 -16.4 -61.5 -1,496,196
Manufacturing industries not elsewhere classified 3904 Import-Subs 255,133,624 -9.8 11.4 -14.5 -16.7 -13,689,379
Manufacturing industries not elsewhere classified 3909 Import-Subs 83,676,980 -9.7 5.0 -11.5 -5.9 -783,600
V A L U E
Agriculture 37,246,864,100 1,219,739,963
Mining 28,249,225,030 2,488,221,415
Industry 62,506,518,110 3,008,024,543
Export-Oriented Industries 83422192928 8,252,867,295
Import-Substituting Industries 46506655184 -1,833,619,352
TOTAL 129,928,848,112 6,419,247,943
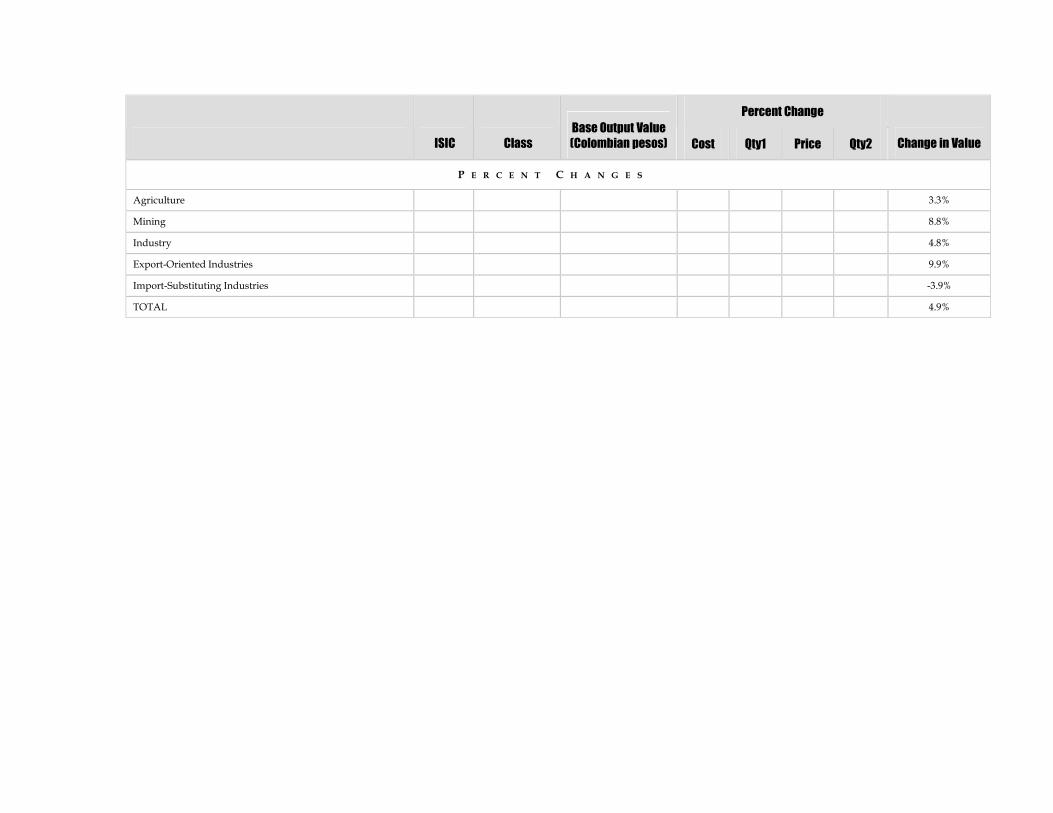
Percent Change
ISIC Class
Base Output Value
(Colombian pesos) Cost Qty1 Price Qty2 Change in Value
P E R C E N T C H A N G E S
Agriculture 3.3%
Mining 8.8%
Industry 4.8%
Export-Oriented Industries 9.9%
Import-Substituting Industries -3.9%
TOTAL 4.9%
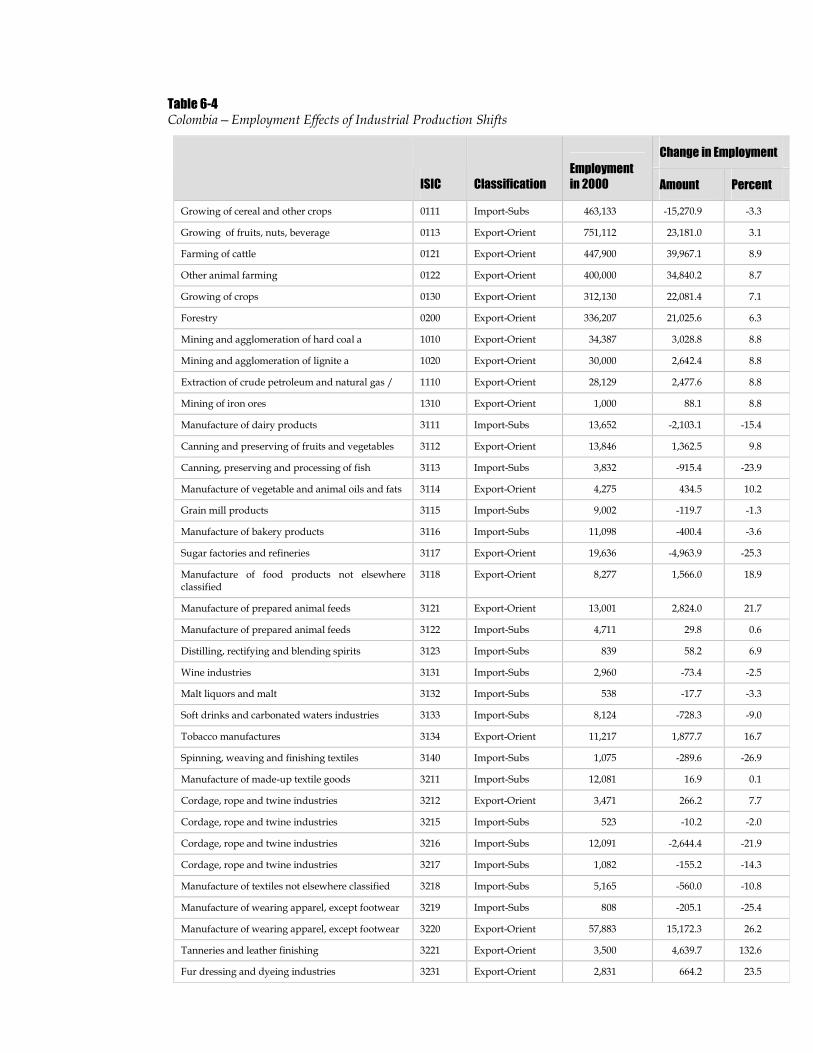
Table 6-4Colombia—Employment Effects of Industrial Production Shifts
Change in Employment
ISIC Classification
Employment
in 2000 Amount Percent
Growing of cereal and other crops 0111 Import-Subs 463,133 -15,270.9 -3.3
Growing of fruits, nuts, beverage 0113 Export-Orient 751,112 23,181.0 3.1
Farming of cattle 0121 Export-Orient 447,900 39,967.1 8.9
Other animal farming 0122 Export-Orient 400,000 34,840.2 8.7
Growing of crops 0130 Export-Orient 312,130 22,081.4 7.1
Forestry 0200 Export-Orient 336,207 21,025.6 6.3
Mining and agglomeration of hard coal a 1010 Export-Orient 34,387 3,028.8 8.8
Mining and agglomeration of lignite a 1020 Export-Orient 30,000 2,642.4 8.8
Extraction of crude petroleum and natural gas / 1110 Export-Orient 28,129 2,477.6 8.8
Mining of iron ores 1310 Export-Orient 1,000 88.1 8.8
Manufacture of dairy products 3111 Import-Subs 13,652 -2,103.1 -15.4
Canning and preserving of fruits and vegetables 3112 Export-Orient 13,846 1,362.5 9.8
Canning, preserving and processing of fish 3113 Import-Subs 3,832 -915.4 -23.9
Manufacture of vegetable and animal oils and fats 3114 Export-Orient 4,275 434.5 10.2
Grain mill products 3115 Import-Subs 9,002 -119.7 -1.3
Manufacture of bakery products 3116 Import-Subs 11,098 -400.4 -3.6
Sugar factories and refineries 3117 Export-Orient 19,636 -4,963.9 -25.3
Manufacture of food products not elsewhereclassified
3118 Export-Orient 8,277 1,566.0 18.9
Manufacture of prepared animal feeds 3121 Export-Orient 13,001 2,824.0 21.7
Manufacture of prepared animal feeds 3122 Import-Subs 4,711 29.8 0.6
Distilling, rectifying and blending spirits 3123 Import-Subs 839 58.2 6.9
Wine industries 3131 Import-Subs 2,960 -73.4 -2.5
Malt liquors and malt 3132 Import-Subs 538 -17.7 -3.3
Soft drinks and carbonated waters industries 3133 Import-Subs 8,124 -728.3 -9.0
Tobacco manufactures 3134 Export-Orient 11,217 1,877.7 16.7
Spinning, weaving and finishing textiles 3140 Import-Subs 1,075 -289.6 -26.9
Manufacture of made-up textile goods 3211 Import-Subs 12,081 16.9 0.1
Cordage, rope and twine industries 3212 Export-Orient 3,471 266.2 7.7
Cordage, rope and twine industries 3215 Import-Subs 523 -10.2 -2.0
Cordage, rope and twine industries 3216 Import-Subs 12,091 -2,644.4 -21.9
Cordage, rope and twine industries 3217 Import-Subs 1,082 -155.2 -14.3
Manufacture of textiles not elsewhere classified 3218 Import-Subs 5,165 -560.0 -10.8
Manufacture of wearing apparel, except footwear 3219 Import-Subs 808 -205.1 -25.4
Manufacture of wearing apparel, except footwear 3220 Export-Orient 57,883 15,172.3 26.2
Tanneries and leather finishing 3221 Export-Orient 3,500 4,639.7 132.6
Fur dressing and dyeing industries 3231 Export-Orient 2,831 664.2 23.5
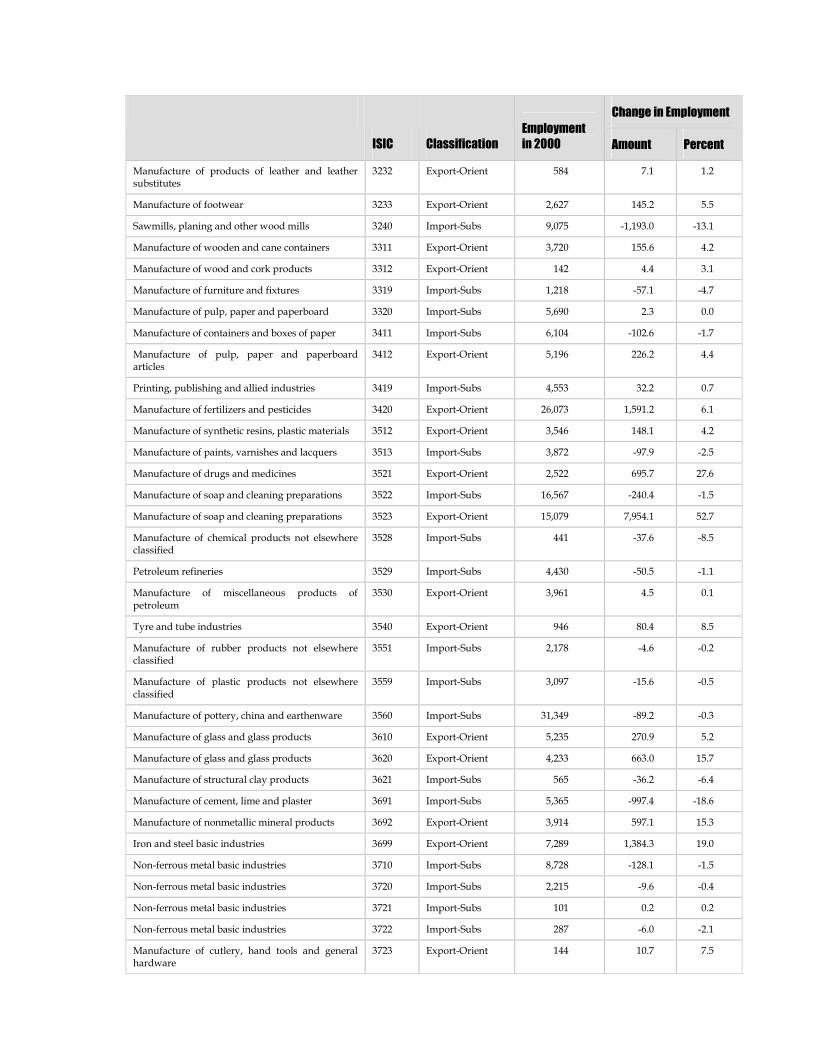
Change in Employment
ISIC Classification
Employment
in 2000 Amount Percent
Manufacture of products of leather and leathersubstitutes
3232 Export-Orient 584 7.1 1.2
Manufacture of footwear 3233 Export-Orient 2,627 145.2 5.5
Sawmills, planing and other wood mills 3240 Import-Subs 9,075 -1,193.0 -13.1
Manufacture of wooden and cane containers 3311 Export-Orient 3,720 155.6 4.2
Manufacture of wood and cork products 3312 Export-Orient 142 4.4 3.1
Manufacture of furniture and fixtures 3319 Import-Subs 1,218 -57.1 -4.7
Manufacture of pulp, paper and paperboard 3320 Import-Subs 5,690 2.3 0.0
Manufacture of containers and boxes of paper 3411 Import-Subs 6,104 -102.6 -1.7
Manufacture of pulp, paper and paperboardarticles
3412 Export-Orient 5,196 226.2 4.4
Printing, publishing and allied industries 3419 Import-Subs 4,553 32.2 0.7
Manufacture of fertilizers and pesticides 3420 Export-Orient 26,073 1,591.2 6.1
Manufacture of synthetic resins, plastic materials 3512 Export-Orient 3,546 148.1 4.2
Manufacture of paints, varnishes and lacquers 3513 Import-Subs 3,872 -97.9 -2.5
Manufacture of drugs and medicines 3521 Export-Orient 2,522 695.7 27.6
Manufacture of soap and cleaning preparations 3522 Import-Subs 16,567 -240.4 -1.5
Manufacture of soap and cleaning preparations 3523 Export-Orient 15,079 7,954.1 52.7
Manufacture of chemical products not elsewhereclassified
3528 Import-Subs 441 -37.6 -8.5
Petroleum refineries 3529 Import-Subs 4,430 -50.5 -1.1
Manufacture of miscellaneous products ofpetroleum
3530 Export-Orient 3,961 4.5 0.1
Tyre and tube industries 3540 Export-Orient 946 80.4 8.5
Manufacture of rubber products not elsewhereclassified
3551 Import-Subs 2,178 -4.6 -0.2
Manufacture of plastic products not elsewhereclassified
3559 Import-Subs 3,097 -15.6 -0.5
Manufacture of pottery, china and earthenware 3560 Import-Subs 31,349 -89.2 -0.3
Manufacture of glass and glass products 3610 Export-Orient 5,235 270.9 5.2
Manufacture of glass and glass products 3620 Export-Orient 4,233 663.0 15.7
Manufacture of structural clay products 3621 Import-Subs 565 -36.2 -6.4
Manufacture of cement, lime and plaster 3691 Import-Subs 5,365 -997.4 -18.6
Manufacture of nonmetallic mineral products 3692 Export-Orient 3,914 597.1 15.3
Iron and steel basic industries 3699 Export-Orient 7,289 1,384.3 19.0
Non-ferrous metal basic industries 3710 Import-Subs 8,728 -128.1 -1.5
Non-ferrous metal basic industries 3720 Import-Subs 2,215 -9.6 -0.4
Non-ferrous metal basic industries 3721 Import-Subs 101 0.2 0.2
Non-ferrous metal basic industries 3722 Import-Subs 287 -6.0 -2.1
Manufacture of cutlery, hand tools and generalhardware
3723 Export-Orient 144 10.7 7.5
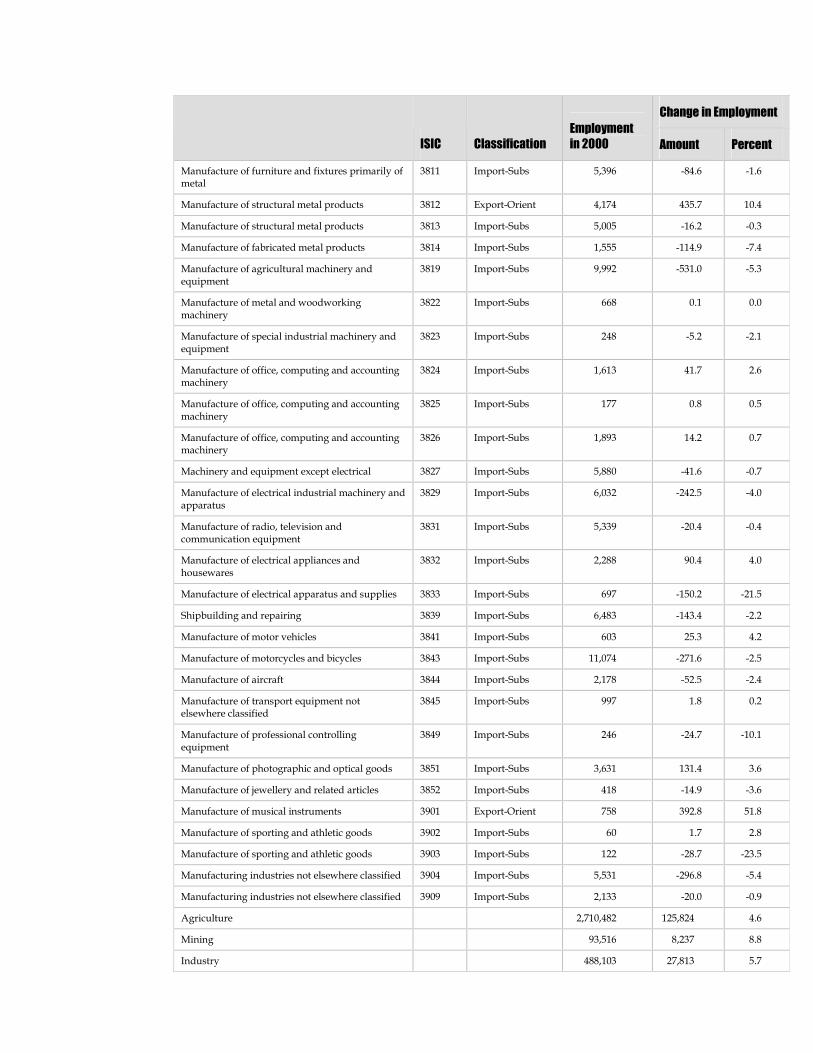
Change in Employment
ISIC Classification
Employment
in 2000 Amount Percent
Manufacture of furniture and fixtures primarily ofmetal
3811 Import-Subs 5,396 -84.6 -1.6
Manufacture of structural metal products 3812 Export-Orient 4,174 435.7 10.4
Manufacture of structural metal products 3813 Import-Subs 5,005 -16.2 -0.3
Manufacture of fabricated metal products 3814 Import-Subs 1,555 -114.9 -7.4
Manufacture of agricultural machinery andequipment
3819 Import-Subs 9,992 -531.0 -5.3
Manufacture of metal and woodworkingmachinery
3822 Import-Subs 668 0.1 0.0
Manufacture of special industrial machinery andequipment
3823 Import-Subs 248 -5.2 -2.1
Manufacture of office, computing and accountingmachinery
3824 Import-Subs 1,613 41.7 2.6
Manufacture of office, computing and accountingmachinery
3825 Import-Subs 177 0.8 0.5
Manufacture of office, computing and accountingmachinery
3826 Import-Subs 1,893 14.2 0.7
Machinery and equipment except electrical 3827 Import-Subs 5,880 -41.6 -0.7
Manufacture of electrical industrial machinery andapparatus
3829 Import-Subs 6,032 -242.5 -4.0
Manufacture of radio, television andcommunication equipment
3831 Import-Subs 5,339 -20.4 -0.4
Manufacture of electrical appliances andhousewares
3832 Import-Subs 2,288 90.4 4.0
Manufacture of electrical apparatus and supplies 3833 Import-Subs 697 -150.2 -21.5
Shipbuilding and repairing 3839 Import-Subs 6,483 -143.4 -2.2
Manufacture of motor vehicles 3841 Import-Subs 603 25.3 4.2
Manufacture of motorcycles and bicycles 3843 Import-Subs 11,074 -271.6 -2.5
Manufacture of aircraft 3844 Import-Subs 2,178 -52.5 -2.4
Manufacture of transport equipment notelsewhere classified
3845 Import-Subs 997 1.8 0.2
Manufacture of professional controllingequipment
3849 Import-Subs 246 -24.7 -10.1
Manufacture of photographic and optical goods 3851 Import-Subs 3,631 131.4 3.6
Manufacture of jewellery and related articles 3852 Import-Subs 418 -14.9 -3.6
Manufacture of musical instruments 3901 Export-Orient 758 392.8 51.8
Manufacture of sporting and athletic goods 3902 Import-Subs 60 1.7 2.8
Manufacture of sporting and athletic goods 3903 Import-Subs 122 -28.7 -23.5
Manufacturing industries not elsewhere classified 3904 Import-Subs 5,531 -296.8 -5.4
Manufacturing industries not elsewhere classified 3909 Import-Subs 2,133 -20.0 -0.9
Agriculture 2,710,482 125,824 4.6
Mining 93,516 8,237 8.8
Industry 488,103 27,813 5.7

Change in Employment
ISIC Classification
Employment
in 2000 Amount Percent
Export-Oriented Industries 2,926,429 219,430 7.5
Import-Substituting Industries 736,808 (28,171) -3.8
TOTAL 3,292,101 161,875 4.9


Bibliography
Chinn, M. 2002. Doomed to Deficits? Aggregate U.S. Trade Flows Re-examined. Available
online at http://papers.ssrn.com/sol3/Delivery.cfm/SSRN_ID346280_
code021119500.pdf? abstractid=346280 .
Cline, W. et al. 1978. Trade Negotiations in the Tokyo Round: A Quantitative Assessment.
Washington, DC: Brookings Institution.
Crozet M., and H. Erkel-Rousse. 1999. Trade performances and the estimation of price-
elasticities: Quality matters. Econometric Society European Meeting. Santiago de
Compostela.
Davidson et al. 1978. Econometric Modelling of the Aggregate Time-Series Relationship
Between Consumers’ Expenditure and Income in the United Kingdom. Economic Journal
88: 661-92.
Dollar, D., and A. Kraay. 2004. Trade, Growth, and Poverty. Economic Journal. 114: F22-F49.
Goldstein, M. and M.S. Khan. 1985. Income and Price Effects in Foreign Trade. In Handbook of
International Economics, 2. Edited by R.W. Jones and P.B. Kenen. Amsterdam: North-
Holland.
Engle, R.F., and C.W.J. Granger. 1987. Co-Integration and Error Correction: Representation,
Estimation, and Testing. Econometrica, 55(2): 251-76.
Hanson, G.H. 1994. Regional Adjustment to Trade Liberalization. National Bureau of
Economic Research. Working Paper No. 4713.
Light, Miles K. 2003. Colombian Trade Liberalization: Quantitative Assessment. Draft report
presented to USAID/Colombia.
Lord, M. 1991. Imperfect Competition and International Commodity Trade: Theory,
Dynamics, and Policy Modelling. Oxford: Clarendon Press.
66 PARTIAL-EQUILIBRIUM AND INDUSTRIAL-SHIFTANALYSIS OF THEU.S.–COLOMBIA FTA
Lord, M. 1998. The Handbook of Latin American Trade in Manufactures. Edited by Edward Elgar
Publishing Limited.
Michaely, M. 2000. Trade Expansion in the Andean Group. Mimeo. World Bank.
Rodriguez, F., and D. Rodrick 2000. Trade Policy and Economic Growth: A Skeptic’s Guide. InNBER Macroeconomic Annual 2000. Edited by B. Bernanke and K. Rogoff. Cambridge,
MA: MIT Press.
Sanso, M. and A. Montanes. 2002. Cointegration, Error Correction Mechanism and Trade
Liberalization: The Case of the Spanish Imports of Manufactures. Applied Economics, 34:2,
pages 231-240.
Santo-Paulino, A., and A.P. Thirlwall. 2004. The Impact of Trade Liberalization on Exports,
Imports and the Balance of Payments of Developing Countries. Economic Journal 114: F50-
F72.
Shiells, C.R, A. Subramanian and P. Uimonen. 1996. Effects of the Uruguay Round on Egypt
and Morocco. Washington, DC: IMF Working Paper WP/96/7. January.
Taylor, John. 1994. Macroeconomic Policy in a World Economy. New York: W.W. Norton.
TradeCan. 2000. TradeCan Database and Software for a Competitiveness Analysis of Nations.
Washington, DC: The World Bank and Economic Commission for Latin American and the
Caribbean (ECLAC).
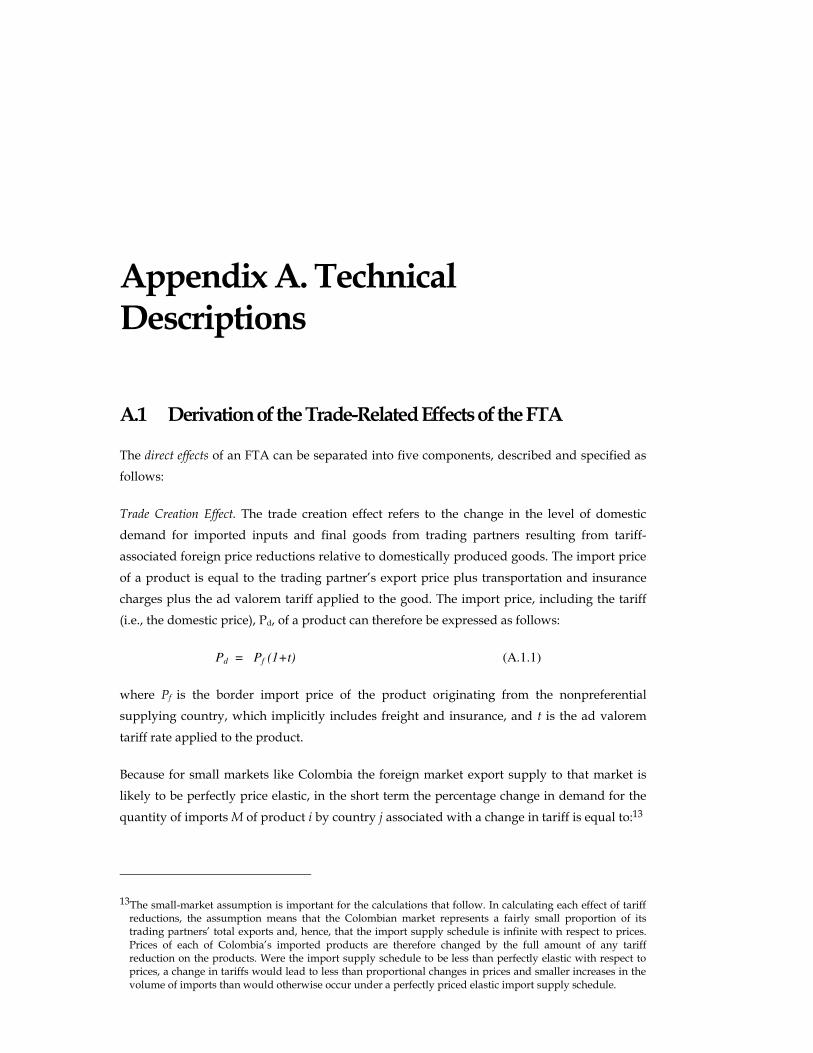
AppendixA. TechnicalDescriptions
A.1 DerivationoftheTrade-RelatedEffectsoftheFTA
The direct effects of an FTA can be separated into five components, described and specified as
follows:
Trade Creation Effect. The trade creation effect refers to the change in the level of domestic
demand for imported inputs and final goods from trading partners resulting from tariff-
associated foreign price reductions relative to domestically produced goods. The import price
of a product is equal to the trading partner’s export price plus transportation and insurancecharges plus the ad valorem tariff applied to the good. The import price, including the tariff
(i.e., the domestic price), Pd, of a product can therefore be expressed as follows:
Pd = Pf (1+t) (A.1.1)
where Pf is the border import price of the product originating from the nonpreferential
supplying country, which implicitly includes freight and insurance, and t is the ad valorem
tariff rate applied to the product.
Because for small markets like Colombia the foreign market export supply to that market is
likely to be perfectly price elastic, in the short term the percentage change in demand for the
quantity of importsM of product i by country j associated with a change in tariff is equal to:13
13The small-market assumption is important for the calculations that follow. In calculating each effect of tariffreductions, the assumption means that the Colombian market represents a fairly small proportion of itstrading partners’ total exports and, hence, that the import supply schedule is infinite with respect to prices. Prices of each of Colombia’s imported products are therefore changed by the full amount of any tariff reduction on the products. Were the import supply schedule to be less than perfectly elastic with respect toprices, a change in tariffs would lead to less than proportional changes in prices and smaller increases in thevolume of imports than would otherwise occur under a perfectly priced elastic import supply schedule.
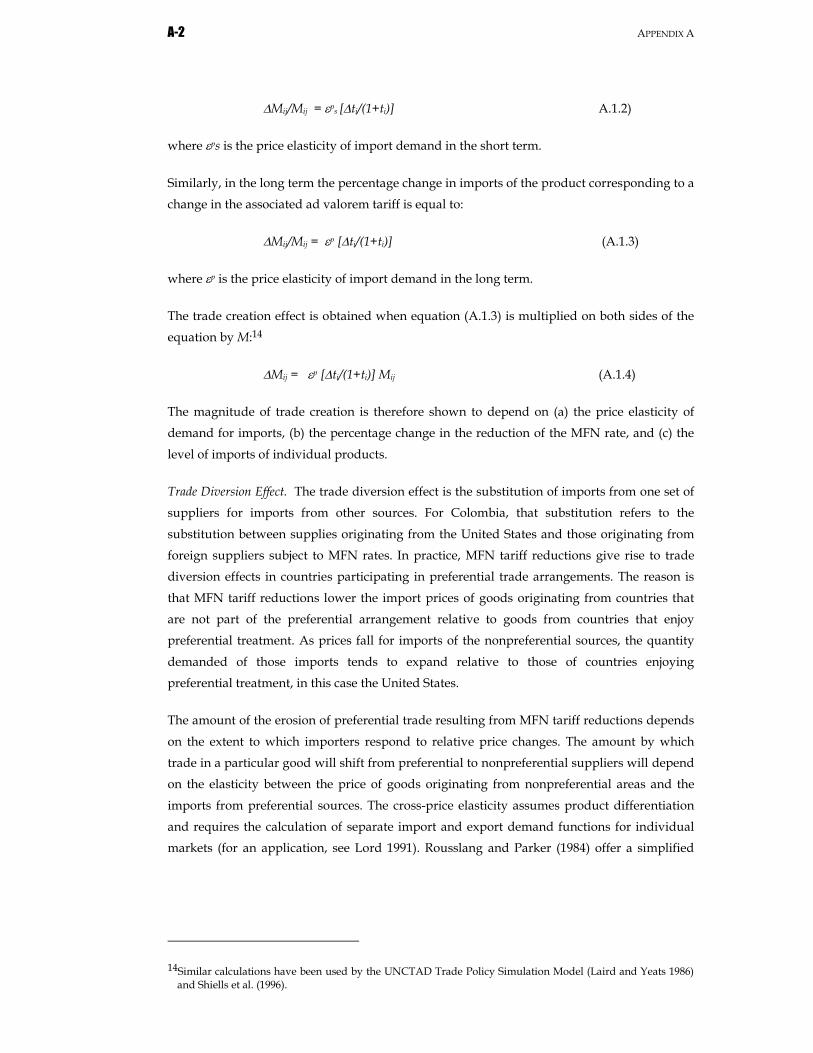
A-2 APPENDIXA
Mij/Mij = ps [ti/(1+ti)] A.1.2)
where ps is the price elasticity of import demand in the short term.
Similarly, in the long term the percentage change in imports of the product corresponding to a
change in the associated ad valorem tariff is equal to:
Mij/Mij = p [ti/(1+ti)] (A.1.3)
where p is the price elasticity of import demand in the long term.
The trade creation effect is obtained when equation (A.1.3) is multiplied on both sides of the
equation byM:14
Mij = p [ti/(1+ti)] Mij (A.1.4)
The magnitude of trade creation is therefore shown to depend on (a) the price elasticity of
demand for imports, (b) the percentage change in the reduction of the MFN rate, and (c) the
level of imports of individual products.
Trade Diversion Effect. The trade diversion effect is the substitution of imports from one set of
suppliers for imports from other sources. For Colombia, that substitution refers to the
substitution between supplies originating from the United States and those originating from
foreign suppliers subject to MFN rates. In practice, MFN tariff reductions give rise to trade
diversion effects in countries participating in preferential trade arrangements. The reason is
that MFN tariff reductions lower the import prices of goods originating from countries that
are not part of the preferential arrangement relative to goods from countries that enjoy
preferential treatment. As prices fall for imports of the nonpreferential sources, the quantity
demanded of those imports tends to expand relative to those of countries enjoying
preferential treatment, in this case the United States.
The amount of the erosion of preferential trade resulting from MFN tariff reductions depends
on the extent to which importers respond to relative price changes. The amount by which
trade in a particular good will shift from preferential to nonpreferential suppliers will depend
on the elasticity between the price of goods originating from nonpreferential areas and the
imports from preferential sources. The cross-price elasticity assumes product differentiation
and requires the calculation of separate import and export demand functions for individual
markets (for an application, see Lord 1991). Rousslang and Parker (1984) offer a simplified
14Similar calculations have been used by the UNCTAD Trade Policy Simulation Model (Laird and Yeats 1986)and Shiells et al. (1996).
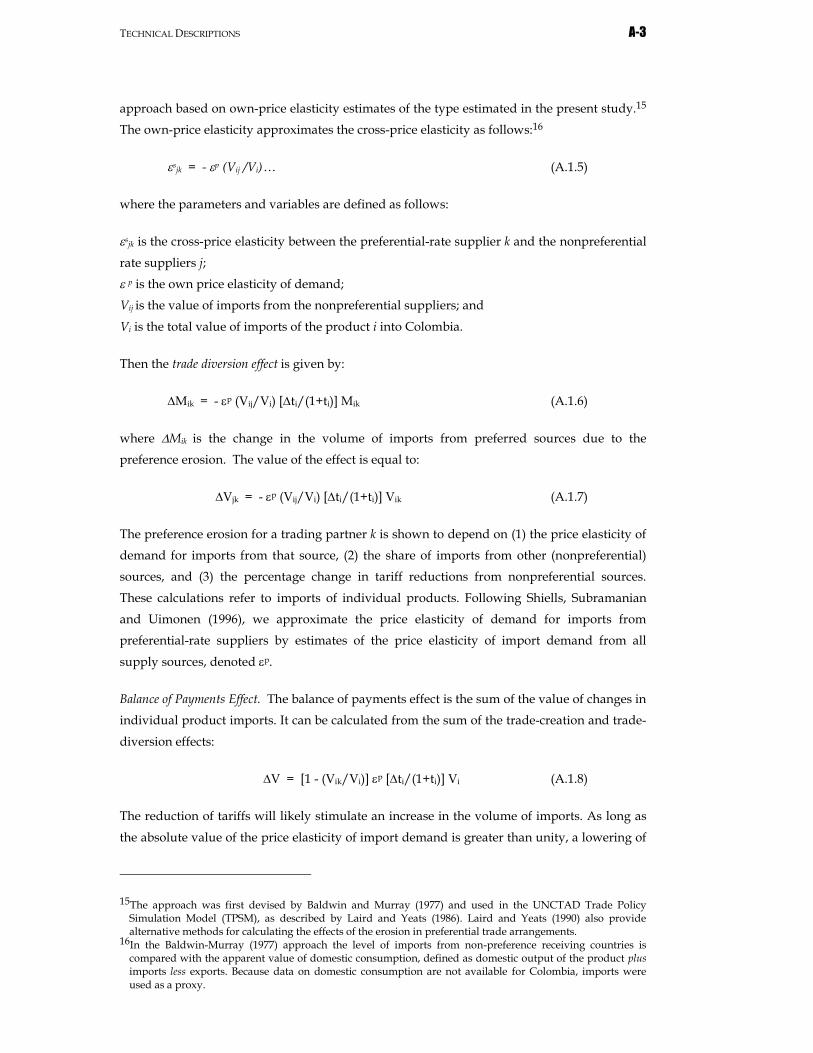
TECHNICALDESCRIPTIONS A-3
approach based on own-price elasticity estimates of the type estimated in the present study.15
The own-price elasticity approximates the cross-price elasticity as follows:16
sjk = - p (Vij /Vi)… (A.1.5)
where the parameters and variables are defined as follows:
sjk is the cross-price elasticity between the preferential-rate supplier k and the nonpreferential
rate suppliers j;
p is the own price elasticity of demand;
Vij is the value of imports from the nonpreferential suppliers; and
Vi is the total value of imports of the product i into Colombia.
Then the trade diversion effect is given by:
Mik = - p (Vij/Vi) [ti/(1+ti)] Mik (A.1.6)
where Mik is the change in the volume of imports from preferred sources due to the
preference erosion. The value of the effect is equal to:
Vjk = - p (Vij/Vi) [ti/(1+ti)] Vik (A.1.7)
The preference erosion for a trading partner k is shown to depend on (1) the price elasticity of
demand for imports from that source, (2) the share of imports from other (nonpreferential)
sources, and (3) the percentage change in tariff reductions from nonpreferential sources.
These calculations refer to imports of individual products. Following Shiells, Subramanian
and Uimonen (1996), we approximate the price elasticity of demand for imports from
preferential-rate suppliers by estimates of the price elasticity of import demand from all
supply sources, denoted p.
Balance of Payments Effect. The balance of payments effect is the sum of the value of changes in
individual product imports. It can be calculated from the sum of the trade-creation and trade-
diversion effects:
V = [1 - (Vik/Vi)] p [ti/(1+ti)] Vi (A.1.8)
The reduction of tariffs will likely stimulate an increase in the volume of imports. As long as
the absolute value of the price elasticity of import demand is greater than unity, a lowering of
15The approach was first devised by Baldwin and Murray (1977) and used in the UNCTAD Trade PolicySimulation Model (TPSM), as described by Laird and Yeats (1986). Laird and Yeats (1990) also providealternative methods for calculating the effects of the erosion in preferential trade arrangements.
16In the Baldwin-Murray (1977) approach the level of imports from non-preference receiving countries iscompared with the apparent value of domestic consumption, defined as domestic output of the product plusimports less exports. Because data on domestic consumption are not available for Colombia, imports wereused as a proxy.
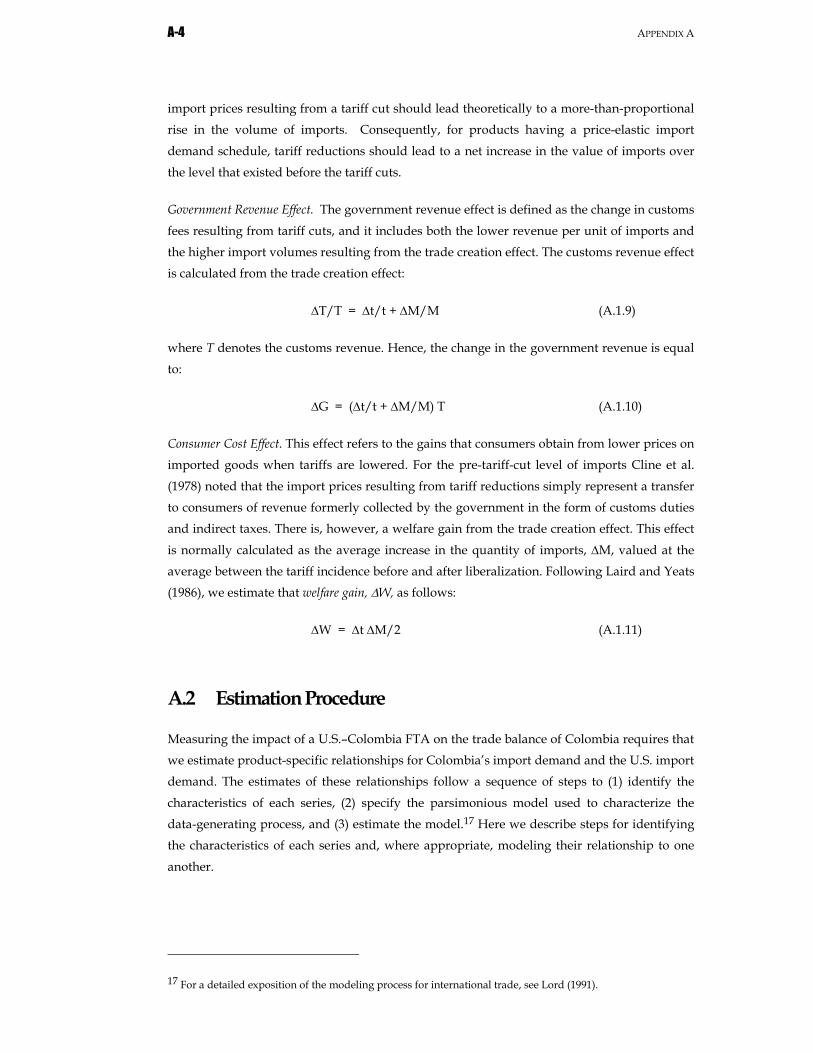
A-4 APPENDIXA
import prices resulting from a tariff cut should lead theoretically to a more-than-proportional
rise in the volume of imports. Consequently, for products having a price-elastic import
demand schedule, tariff reductions should lead to a net increase in the value of imports over
the level that existed before the tariff cuts.
Government Revenue Effect. The government revenue effect is defined as the change in customs
fees resulting from tariff cuts, and it includes both the lower revenue per unit of imports and
the higher import volumes resulting from the trade creation effect. The customs revenue effect
is calculated from the trade creation effect:
T/T = t/t + M/M (A.1.9)
where T denotes the customs revenue. Hence, the change in the government revenue is equal
to:
G = (t/t + M/M) T (A.1.10)
Consumer Cost Effect. This effect refers to the gains that consumers obtain from lower prices on
imported goods when tariffs are lowered. For the pre-tariff-cut level of imports Cline et al.
(1978) noted that the import prices resulting from tariff reductions simply represent a transfer
to consumers of revenue formerly collected by the government in the form of customs duties
and indirect taxes. There is, however, a welfare gain from the trade creation effect. This effect
is normally calculated as the average increase in the quantity of imports, M, valued at the
average between the tariff incidence before and after liberalization. Following Laird and Yeats
(1986), we estimate that welfare gain, W, as follows:
W = t M/2 (A.1.11)
A.2 EstimationProcedure
Measuring the impact of a U.S.–Colombia FTA on the trade balance of Colombia requires thatwe estimate product-specific relationships for Colombia’s import demand and the U.S. importdemand. The estimates of these relationships follow a sequence of steps to (1) identify the
characteristics of each series, (2) specify the parsimonious model used to characterize the
data-generating process, and (3) estimate the model.17 Here we describe steps for identifying
the characteristics of each series and, where appropriate, modeling their relationship to one
another.
17 For a detailed exposition of the modeling process for international trade, see Lord (1991).
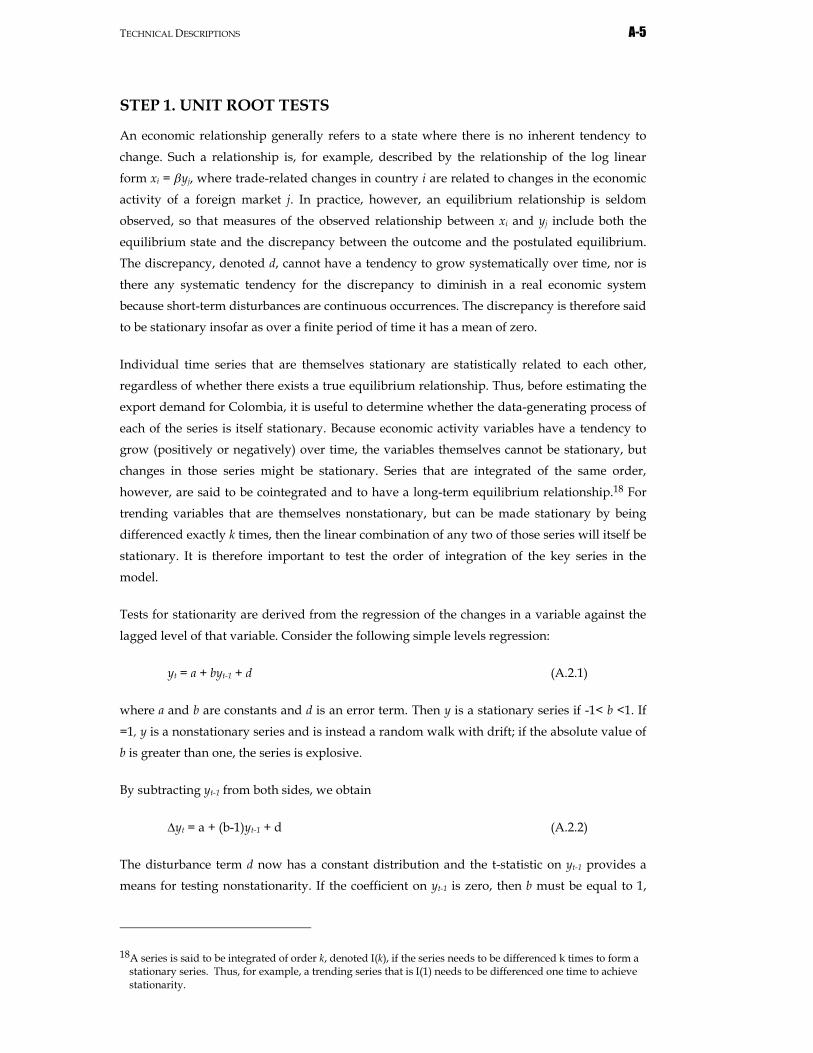
TECHNICALDESCRIPTIONS A-5
STEP 1. UNIT ROOT TESTS
An economic relationship generally refers to a state where there is no inherent tendency to
change. Such a relationship is, for example, described by the relationship of the log linear
form xi = yj, where trade-related changes in country i are related to changes in the economic
activity of a foreign market j. In practice, however, an equilibrium relationship is seldom
observed, so that measures of the observed relationship between xi and yj include both the
equilibrium state and the discrepancy between the outcome and the postulated equilibrium.
The discrepancy, denoted d, cannot have a tendency to grow systematically over time, nor is
there any systematic tendency for the discrepancy to diminish in a real economic system
because short-term disturbances are continuous occurrences. The discrepancy is therefore said
to be stationary insofar as over a finite period of time it has a mean of zero.
Individual time series that are themselves stationary are statistically related to each other,
regardless of whether there exists a true equilibrium relationship. Thus, before estimating the
export demand for Colombia, it is useful to determine whether the data-generating process of
each of the series is itself stationary. Because economic activity variables have a tendency to
grow (positively or negatively) over time, the variables themselves cannot be stationary, but
changes in those series might be stationary. Series that are integrated of the same order,
however, are said to be cointegrated and to have a long-term equilibrium relationship.18 For
trending variables that are themselves nonstationary, but can be made stationary by being
differenced exactly k times, then the linear combination of any two of those series will itself be
stationary. It is therefore important to test the order of integration of the key series in the
model.
Tests for stationarity are derived from the regression of the changes in a variable against the
lagged level of that variable. Consider the following simple levels regression:
yt = a + byt-1 + d (A.2.1)
where a and b are constants and d is an error term. Then y is a stationary series if -1< b <1. If
=1, y is a nonstationary series and is instead a random walk with drift; if the absolute value of
b is greater than one, the series is explosive.
By subtracting yt-1 from both sides, we obtain
yt = a + (b-1)yt-1 + d (A.2.2)
The disturbance term d now has a constant distribution and the t-statistic on yt-1 provides a
means for testing nonstationarity. If the coefficient on yt-1 is zero, then b must be equal to 1,
18A series is said to be integrated of order k, denoted I(k), if the series needs to be differenced k times to form astationary series. Thus, for example, a trending series that is I(1) needs to be differenced one time to achievestationarity.
A-6 APPENDIXA
and y is therefore stationary. The Augmented Dickey-Fuller test is a test on the t-statistic of
the coefficient on yt-1. The hypothesis H0 = b-1 = 0 is called the unit-root hypothesis and it
implies that yt is nonstationary.
The second test for nonstationarity is the Durbin-Watson (DW) test on the levels regression
specified above. Because the DW statistically is given by
DW = 2(1-r) (A.2.3)
where r is the correlation coefficient between yt and yt-1, then y is white noise when r is zero.
The DW is therefore 2 when y is stationary.
STEP 2. MODELING DEMAND RELATIONSHIPS
Economic series that are related to the long-term adjustment processes of other variables have
been designated by Granger and Weiss (1983) and Engle and Granger (1987) to be
cointegrated series. The theory of cointegration states that if two series, x and y, grow over
time in such a way that the linear combination of these two variables, given by dt = xt - yt, is
stationary, and if is unique, then x and y are said to be cointegrated. The series dt measures
the disequilibrium at period t when the long-term relationship between the two variables is xt
= yt. The theory of cointegration states that movements in variables are related in a
predicable way to the discrepancy between observed and equilibrium states. The sequence of
this discrepancy tends to decay to its mean of zero.
Engle and Granger (1987) have demonstrated that a data-generating process of the form
known as the error-correction mechanism adjusts for any disequilibrium between variables
that are cointegrated, which has been used for instance by Sanso and Montanes (2002) to
examine the effects of a tariff cut process on trade flows when the variables are nonstationary.
The error-correction mechanism thus provides the means by which the short-term observed
behavior of variables is associated with their long-term equilibrium growth paths. Davidson
et al. (1978) established a closely related specification know as the equilibrium-correcting
mechanism that models both the short and long-term relationships between variables.
Rearranging the terms of a first-order stochastic difference equation yields the following
ECM:
xt = o + 1(x – y)t-1 + 2yt + 3yt-1 + vt (A.2.4)
where -1 < 1 < 0, 2 > 0 and 3 > -1, and where all variables are measured in logarithmic
terms.
The second term, 1(x – y)t-1, is the mechanism for adjusting any disequilibrium in the
previous period. When the rate of growth of the dependent variable xt falls below its steady-
state path, the value of the ratio of variables in the second term decreases in the subsequent
TECHNICALDESCRIPTIONS A-7
period. That decrease, combined with the negative coefficient of the term, has a positive
influence on the growth rate of the dependent variable. Conversely, when the growth rate of
the dependent variable increases above its steady-state path, the adjustment mechanism
embodied in the second term generates downward pressure on the growth rate of the
dependent variable until it reaches that of its steady-state path. The speed with which the
system approaches its steady-state path depends on the proximity of the coefficient to minus
one. If the coefficient is close to minus one, the system converges to its steady-state path
quickly; if it is near zero, the approach of the system to the steady-state path is slow. Because
the variables are measured in logarithms, x and y can be interpreted as the rate of change
of the variables. Thus the third term, 2yt, expresses the steady-state growth in X associated
with Y. Finally, the fourth term, 3yt-1, shows that the steady-state response of the dependent
variable X to the variable Y is nonproportional when the coefficient has non-zero significance.
The equilibrium solution of equation (A.2.4) is a constant value if there is convergence.
Because the solution is unrelated to time, the rate of change over time of the dependent
variable X (given by xt) and the explanatory variable Y (given by yt) are equal to zero.
However, in dynamic equilibrium, equation (A.2.4) generates a steady-state response in
which growth occurs at a constant rate, say g. For the dynamic specification of the
relationship in (A.2.4), if g1 is defined as the steady-state growth rate of the dependent
variable X, and g2 corresponds to the steady-state growth rate of the explanatory variable Y,
then, because lower-case letters denote the logarithms of variables, g1 = x and g2 = y in
dynamic equilibrium. In equilibrium the systematic dynamics of equation (A.2.4) are
expressed as:
g1 = o + 1(x – y) + 2g2 + 3y (A.2.5)
or, in terms of the original (anti-logarithmic) values of the variables:
X = k0 Y (A.2.6)
where k0 = exp{(-o/1) + [(1 - 21 - 3)/ 12]g2, and where = 1 - 3/1.
The dynamic solution of equation (A.2.6) therefore shows X to be influenced by changes in
the rate of growth of Y, as well as the long-term elasticity of X with respect to Y. For example,
where the rate of growth of the explanatory variable accelerates, say from g2 to g’2, the value
of the variable X would increase. However, it is important to reiterate that the response to
each explanatory variable can be either transient or steady-state. When theoretical
considerations suggest that an explanatory variable generates a transient, rather than steady-
state, response, it is appropriate to constrain its long-term effect to zero.
A-8 APPENDIXA
STEP 3. MODELING PRICE AND INCOME EFFECTS OF FOREIGNANDDOMESTIC IMPORTS
Several features in the modeling of Colombia’s imports need to be incorporated into thepresent analysis. The first important characteristic of the import demand for any one product
is that its long-term response to the growth of domestic income is not necessarily
proportional. This suggests that the dynamic specification of the import demand equation
should not introduce any restrictions that would impose long-term unitary elasticity with
respect to income. In contrast, the model should encompass long-term proportionality
responses when they exist.
A second feature of the present modeling approach is that the dynamics for import demand
relationships can be restricted to one period because the adjustment of imports to price and
income changes tends to decline exponentially over time. Accordingly, in terms of the general
stochastic difference specification, the expression for imports, M, in terms of income, Y, the
price of the product, P, in US dollar terms and including the tariff, and the real effective
exchange rate, R, can be expressed as:
mt = 10 + 11mt-1 + 12yt + 13yt-1 + 14pt + 15pt-1 + 16rt + 17rt-1 + u1t (A.2.7)
where lower case letters denote logarithms of corresponding capital letters, and the expected
signs of the coefficients are 0 11 1; 12 and 130; 14 and 15 0; 16 and 17 > 0. Income is
treated as (weakly) exogenous for the parameters of interest. The use of the logarithmic
specification in equation (A.2.7) provides a means by which the elasticity can be calculated
directly from the estimated equation; the results are consistent when the elasticities remain
constant over time. Tests of parameter constancy provide a means of validating that
hypothesis.
The third important characteristic is that the demand for imports is determined by the local
currency price (in Colombian pesos) of imports. Therefore, we can decompose the price
variable into the US dollar price and the real effective exchange rate in equation (A.2.7) as
follows:
Pn = Pc(1+t)/R = P/R (A.2.8)
where Pn is the Colombian peso price of the imported product, Pc is c.i.f. (cost, insurance, and
freight) import price in U.S. dollars of the product, P is the U.S. dollar import price of the
good with the tariff, t is the tariff rate, and R is the real exchange rate.
TECHNICALDESCRIPTIONS A-9
The real exchange rate takes into account changes in the price of domestic goods, Pn, relative
to foreign goods, Pf, and the nominal exchange rate, Rn. It is defined as follows:19
R = Pn/( RnPf) (A.2.9)
The demand for imports by Colombia is therefore directly affected by c.i.f. price in U.S.
dollars of the imported good, the tariff on that good, and the real exchange rate.
The fourth characteristic is that if the import supply elasticity is less than infinite, then the
pass-through of exchange rate changes from import price changes in foreign currency terms
to import prices in local currency terms will be less than complete (see Branson 1972 and the
summary by Goldstein and Khan 1985). Consequently, the estimated price and exchange rate
coefficients in equation (A.2.7) may differ.
It is also appropriate to adopt the error-correction mechanism because the growth rate of
Colombia’s imports in equation (A.2.7) depends on the expansion path of economic activity.The error-correction mechanism specification adjusts for any disequilibrium between
variables that are cointegrated and thus provides the means by which the short-term observed
behavior of variables is associated with their long-term equilibrium growth paths.
Rearranging the terms of the first-order stochastic difference equation (A.2.7) yields the
following error-correction mechanism:
mt = 20 + 21(m – y)t-1 + 22yt + 23yt-1 + 24pt + 25pt-1 + 26rt + 27rt-1 + u2t
(A.2.10)
where -1 < 21 < 0; 22 > 0; 23 > 21; 24 and 25 < 0; 26 and 27 > 0; and where all variables are
measured in logarithmic terms.
The import price and exchange rate terms in the foregoing specification have been so
transformed as to nest the ‘differences’ formulation of the variables in the levels form of the
equation. This transformation reduces the possibility of the occurrence of the spurious
correlation typically associated with time-series data when the relationship between import
demand and import prices is estimated. On a steady-state growth path, the long-term
dynamic equilibrium relationship implicit in equation (A.2.10) is:
M = kYyPpRr (A.2.11)
The income elasticity of import demand is expressed as
y = 1 - (23/21) (A.2.12)
19This definition is the one used by the IMF, while the more traditional definition is R = RnPf/Pe. To facilitatethe interpretation of the results for readers, we have adopted the IMF definition. See Edwards (1988,Appendix) for alternative definitions of the real exchange rate.
A-10 APPENDIXA
Its value is positive because the expected sign of 21 is negative and 23 > 21.When 21 < 23 <
0, import demand is inelastic with respect to income; when 23 = 0, it has a unitary elasticity;
and when 23 > 0, the price elasticity of import demand is expressed as
p = - 25/21 (A.2.13)
It has a negative value since the expected signs of both 25 and 21 are negative.
The real effective exchange rate elasticity of import demand is expressed as
r = - 27/21 (A.2.14)
It has a positive value since the expected sign of 21 is negative and that of 27 is positive.
STEP 4. MODELING COLOMBIA’S EXPORT DEMAND IN THE U.S.MARKET
If changes in the U.S. demand for Colombia’s exports are nonproportional to changes in theU.S. overall import demand for a product, then Colombia’s export demand by the UnitedStates is downward sloping. Lack of proportionality between U.S. imports and its demand for
Colombia’s exports of a product can be measured by extending the first-order stochasticdifference equation to include the relative price variable. Transformation of an autoregressive
distributed lag into an ECM with a differences formulation of the relative price, r, term nested
in the levels form of the equation, yields the equation:
xt = 30 + 31(x – y)t-1 + 32yt + 33yt-1 + 34rt + 35rt-1 + vt (A.2.15)
where -1 < 31 < 0, 32 > 0, 33 > -1, 34 > 0 and 35 > 0, and where all variables are measured in
logarithmic terms.
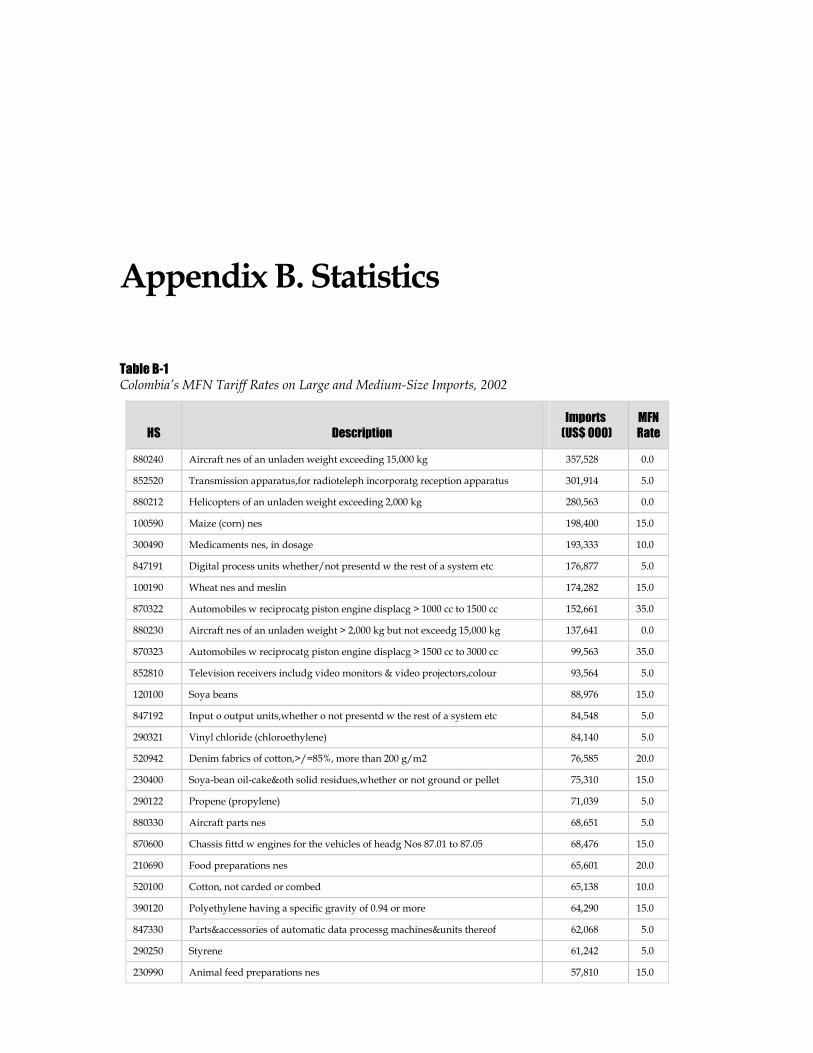
Appendix B. Statistics
Table B-1Colombia’s MFN Tariff Rates on Large and Medium-Size Imports, 2002
HS Description
Imports
(US$ 000)
MFN
Rate
880240 Aircraft nes of an unladen weight exceeding 15,000 kg 357,528 0.0
852520 Transmission apparatus,for radioteleph incorporatg reception apparatus 301,914 5.0
880212 Helicopters of an unladen weight exceeding 2,000 kg 280,563 0.0
100590 Maize (corn) nes 198,400 15.0
300490 Medicaments nes, in dosage 193,333 10.0
847191 Digital process units whether/not presentd w the rest of a system etc 176,877 5.0
100190 Wheat nes and meslin 174,282 15.0
870322 Automobiles w reciprocatg piston engine displacg > 1000 cc to 1500 cc 152,661 35.0
880230 Aircraft nes of an unladen weight > 2,000 kg but not exceedg 15,000 kg 137,641 0.0
870323 Automobiles w reciprocatg piston engine displacg > 1500 cc to 3000 cc 99,563 35.0
852810 Television receivers includg video monitors & video projectors,colour 93,564 5.0
120100 Soya beans 88,976 15.0
847192 Input o output units,whether o not presentd w the rest of a system etc 84,548 5.0
290321 Vinyl chloride (chloroethylene) 84,140 5.0
520942 Denim fabrics of cotton,>/=85%, more than 200 g/m2 76,585 20.0
230400 Soya-bean oil-cake&oth solid residues,whether or not ground or pellet 75,310 15.0
290122 Propene (propylene) 71,039 5.0
880330 Aircraft parts nes 68,651 5.0
870600 Chassis fittd w engines for the vehicles of headg Nos 87.01 to 87.05 68,476 15.0
210690 Food preparations nes 65,601 20.0
520100 Cotton, not carded or combed 65,138 10.0
390120 Polyethylene having a specific gravity of 0.94 or more 64,290 15.0
847330 Parts&accessories of automatic data processg machines&units thereof 62,068 5.0
290250 Styrene 61,242 5.0
230990 Animal feed preparations nes 57,810 15.0
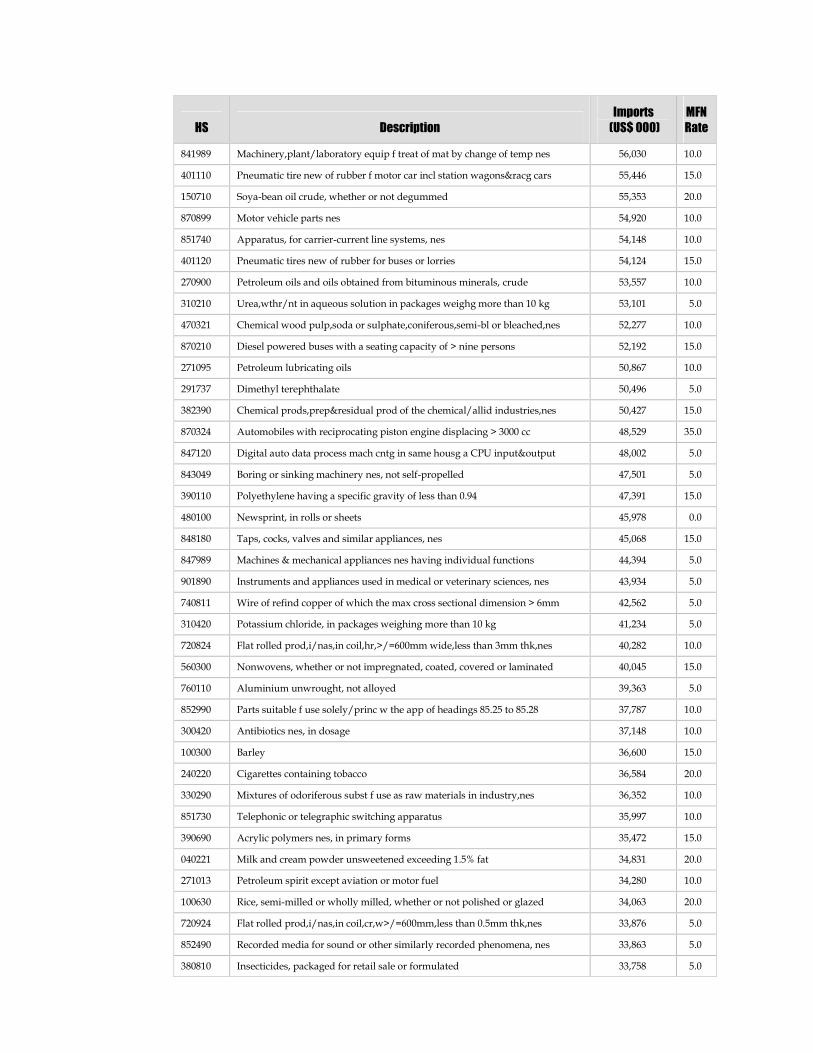
HS Description
Imports
(US$ 000)
MFN
Rate
841989 Machinery,plant/laboratory equip f treat of mat by change of temp nes 56,030 10.0
401110 Pneumatic tire new of rubber f motor car incl station wagons&racg cars 55,446 15.0
150710 Soya-bean oil crude, whether or not degummed 55,353 20.0
870899 Motor vehicle parts nes 54,920 10.0
851740 Apparatus, for carrier-current line systems, nes 54,148 10.0
401120 Pneumatic tires new of rubber for buses or lorries 54,124 15.0
270900 Petroleum oils and oils obtained from bituminous minerals, crude 53,557 10.0
310210 Urea,wthr/nt in aqueous solution in packages weighg more than 10 kg 53,101 5.0
470321 Chemical wood pulp,soda or sulphate,coniferous,semi-bl or bleached,nes 52,277 10.0
870210 Diesel powered buses with a seating capacity of > nine persons 52,192 15.0
271095 Petroleum lubricating oils 50,867 10.0
291737 Dimethyl terephthalate 50,496 5.0
382390 Chemical prods,prep&residual prod of the chemical/allid industries,nes 50,427 15.0
870324 Automobiles with reciprocating piston engine displacing > 3000 cc 48,529 35.0
847120 Digital auto data process mach cntg in same housg a CPU input&output 48,002 5.0
843049 Boring or sinking machinery nes, not self-propelled 47,501 5.0
390110 Polyethylene having a specific gravity of less than 0.94 47,391 15.0
480100 Newsprint, in rolls or sheets 45,978 0.0
848180 Taps, cocks, valves and similar appliances, nes 45,068 15.0
847989 Machines & mechanical appliances nes having individual functions 44,394 5.0
901890 Instruments and appliances used in medical or veterinary sciences, nes 43,934 5.0
740811 Wire of refind copper of which the max cross sectional dimension > 6mm 42,562 5.0
310420 Potassium chloride, in packages weighing more than 10 kg 41,234 5.0
720824 Flat rolled prod,i/nas,in coil,hr,>/=600mm wide,less than 3mm thk,nes 40,282 10.0
560300 Nonwovens, whether or not impregnated, coated, covered or laminated 40,045 15.0
760110 Aluminium unwrought, not alloyed 39,363 5.0
852990 Parts suitable f use solely/princ w the app of headings 85.25 to 85.28 37,787 10.0
300420 Antibiotics nes, in dosage 37,148 10.0
100300 Barley 36,600 15.0
240220 Cigarettes containing tobacco 36,584 20.0
330290 Mixtures of odoriferous subst f use as raw materials in industry,nes 36,352 10.0
851730 Telephonic or telegraphic switching apparatus 35,997 10.0
390690 Acrylic polymers nes, in primary forms 35,472 15.0
040221 Milk and cream powder unsweetened exceeding 1.5% fat 34,831 20.0
271013 Petroleum spirit except aviation or motor fuel 34,280 10.0
100630 Rice, semi-milled or wholly milled, whether or not polished or glazed 34,063 20.0
720924 Flat rolled prod,i/nas,in coil,cr,w>/=600mm,less than 0.5mm thk,nes 33,876 5.0
852490 Recorded media for sound or other similarly recorded phenomena, nes 33,863 5.0
380810 Insecticides, packaged for retail sale or formulated 33,758 5.0
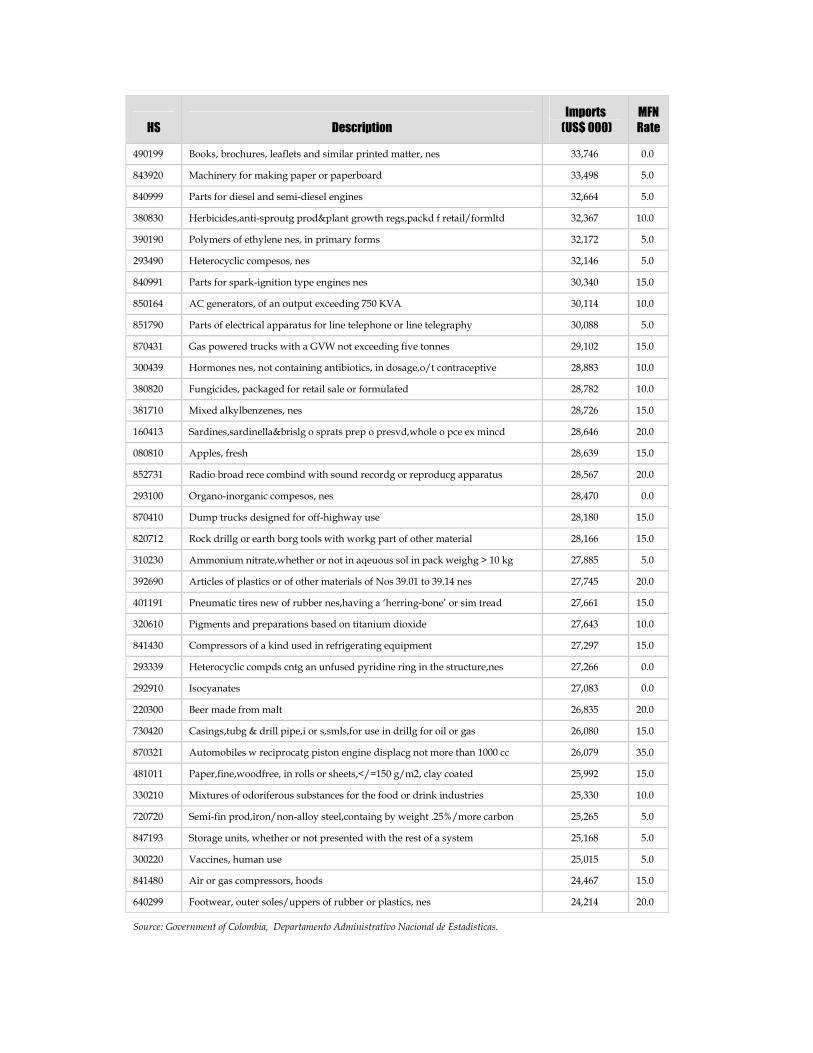
HS Description
Imports
(US$ 000)
MFN
Rate
490199 Books, brochures, leaflets and similar printed matter, nes 33,746 0.0
843920 Machinery for making paper or paperboard 33,498 5.0
840999 Parts for diesel and semi-diesel engines 32,664 5.0
380830 Herbicides,anti-sproutg prod&plant growth regs,packd f retail/formltd 32,367 10.0
390190 Polymers of ethylene nes, in primary forms 32,172 5.0
293490 Heterocyclic compesos, nes 32,146 5.0
840991 Parts for spark-ignition type engines nes 30,340 15.0
850164 AC generators, of an output exceeding 750 KVA 30,114 10.0
851790 Parts of electrical apparatus for line telephone or line telegraphy 30,088 5.0
870431 Gas powered trucks with a GVW not exceeding five tonnes 29,102 15.0
300439 Hormones nes, not containing antibiotics, in dosage,o/t contraceptive 28,883 10.0
380820 Fungicides, packaged for retail sale or formulated 28,782 10.0
381710 Mixed alkylbenzenes, nes 28,726 15.0
160413 Sardines,sardinella&brislg o sprats prep o presvd,whole o pce ex mincd 28,646 20.0
080810 Apples, fresh 28,639 15.0
852731 Radio broad rece combind with sound recordg or reproducg apparatus 28,567 20.0
293100 Organo-inorganic compesos, nes 28,470 0.0
870410 Dump trucks designed for off-highway use 28,180 15.0
820712 Rock drillg or earth borg tools with workg part of other material 28,166 15.0
310230 Ammonium nitrate,whether or not in aqeuous sol in pack weighg > 10 kg 27,885 5.0
392690 Articles of plastics or of other materials of Nos 39.01 to 39.14 nes 27,745 20.0
401191 Pneumatic tires new of rubber nes,having a ‘herring-bone’ or sim tread 27,661 15.0
320610 Pigments and preparations based on titanium dioxide 27,643 10.0
841430 Compressors of a kind used in refrigerating equipment 27,297 15.0
293339 Heterocyclic compds cntg an unfused pyridine ring in the structure,nes 27,266 0.0
292910 Isocyanates 27,083 0.0
220300 Beer made from malt 26,835 20.0
730420 Casings,tubg & drill pipe,i or s,smls,for use in drillg for oil or gas 26,080 15.0
870321 Automobiles w reciprocatg piston engine displacg not more than 1000 cc 26,079 35.0
481011 Paper,fine,woodfree, in rolls or sheets,</=150 g/m2, clay coated 25,992 15.0
330210 Mixtures of odoriferous substances for the food or drink industries 25,330 10.0
720720 Semi-fin prod,iron/non-alloy steel,containg by weight .25%/more carbon 25,265 5.0
847193 Storage units, whether or not presented with the rest of a system 25,168 5.0
300220 Vaccines, human use 25,015 5.0
841480 Air or gas compressors, hoods 24,467 15.0
640299 Footwear, outer soles/uppers of rubber or plastics, nes 24,214 20.0
Source: Government of Colombia, Departamento Administrativo Nacional de Estadisticas.
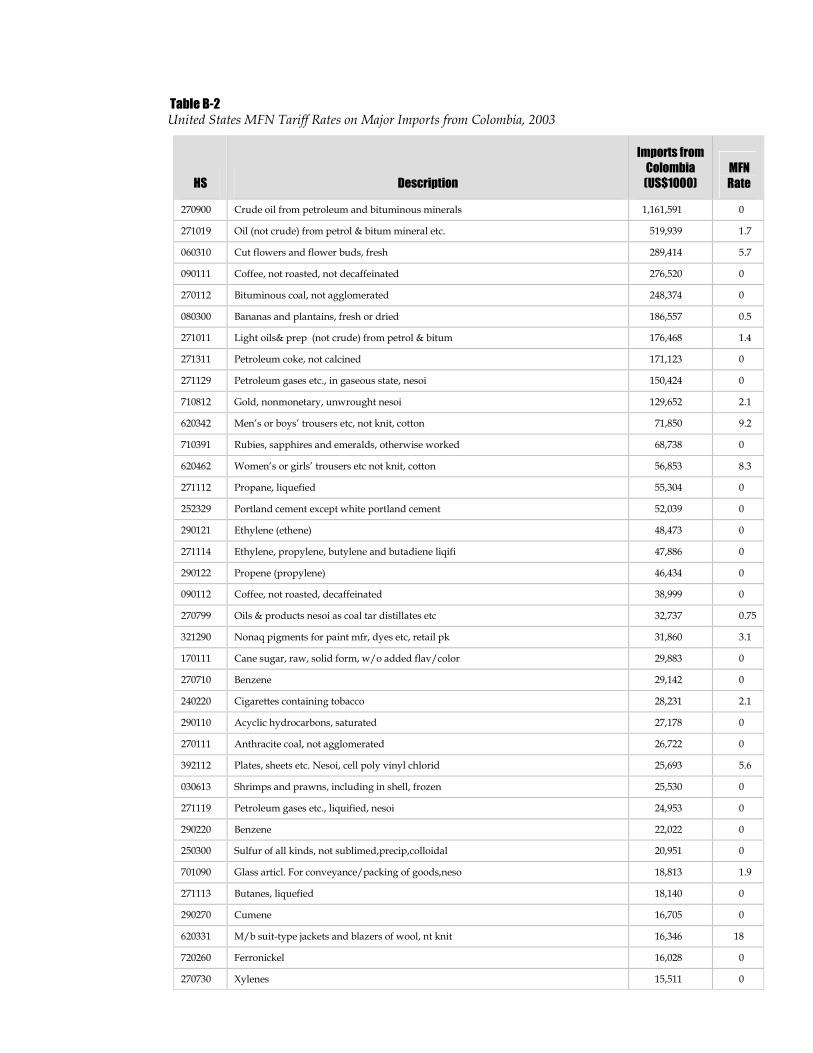
Table B-2United States MFN Tariff Rates on Major Imports from Colombia, 2003
HS Description
Imports from
Colombia
(US$1000)
MFN
Rate
270900 Crude oil from petroleum and bituminous minerals 1,161,591 0
271019 Oil (not crude) from petrol & bitum mineral etc. 519,939 1.7
060310 Cut flowers and flower buds, fresh 289,414 5.7
090111 Coffee, not roasted, not decaffeinated 276,520 0
270112 Bituminous coal, not agglomerated 248,374 0
080300 Bananas and plantains, fresh or dried 186,557 0.5
271011 Light oils& prep (not crude) from petrol & bitum 176,468 1.4
271311 Petroleum coke, not calcined 171,123 0
271129 Petroleum gases etc., in gaseous state, nesoi 150,424 0
710812 Gold, nonmonetary, unwrought nesoi 129,652 2.1
620342 Men’s or boys’ trousers etc, not knit, cotton 71,850 9.2
710391 Rubies, sapphires and emeralds, otherwise worked 68,738 0
620462 Women’s or girls’ trousers etc not knit, cotton 56,853 8.3
271112 Propane, liquefied 55,304 0
252329 Portland cement except white portland cement 52,039 0
290121 Ethylene (ethene) 48,473 0
271114 Ethylene, propylene, butylene and butadiene liqifi 47,886 0
290122 Propene (propylene) 46,434 0
090112 Coffee, not roasted, decaffeinated 38,999 0
270799 Oils & products nesoi as coal tar distillates etc 32,737 0.75
321290 Nonaq pigments for paint mfr, dyes etc, retail pk 31,860 3.1
170111 Cane sugar, raw, solid form, w/o added flav/color 29,883 0
270710 Benzene 29,142 0
240220 Cigarettes containing tobacco 28,231 2.1
290110 Acyclic hydrocarbons, saturated 27,178 0
270111 Anthracite coal, not agglomerated 26,722 0
392112 Plates, sheets etc. Nesoi, cell poly vinyl chlorid 25,693 5.6
030613 Shrimps and prawns, including in shell, frozen 25,530 0
271119 Petroleum gases etc., liquified, nesoi 24,953 0
290220 Benzene 22,022 0
250300 Sulfur of all kinds, not sublimed,precip,colloidal 20,951 0
701090 Glass articl. For conveyance/packing of goods,neso 18,813 1.9
271113 Butanes, liquefied 18,140 0
290270 Cumene 16,705 0
620331 M/b suit-type jackets and blazers of wool, nt knit 16,346 18
720260 Ferronickel 16,028 0
270730 Xylenes 15,511 0
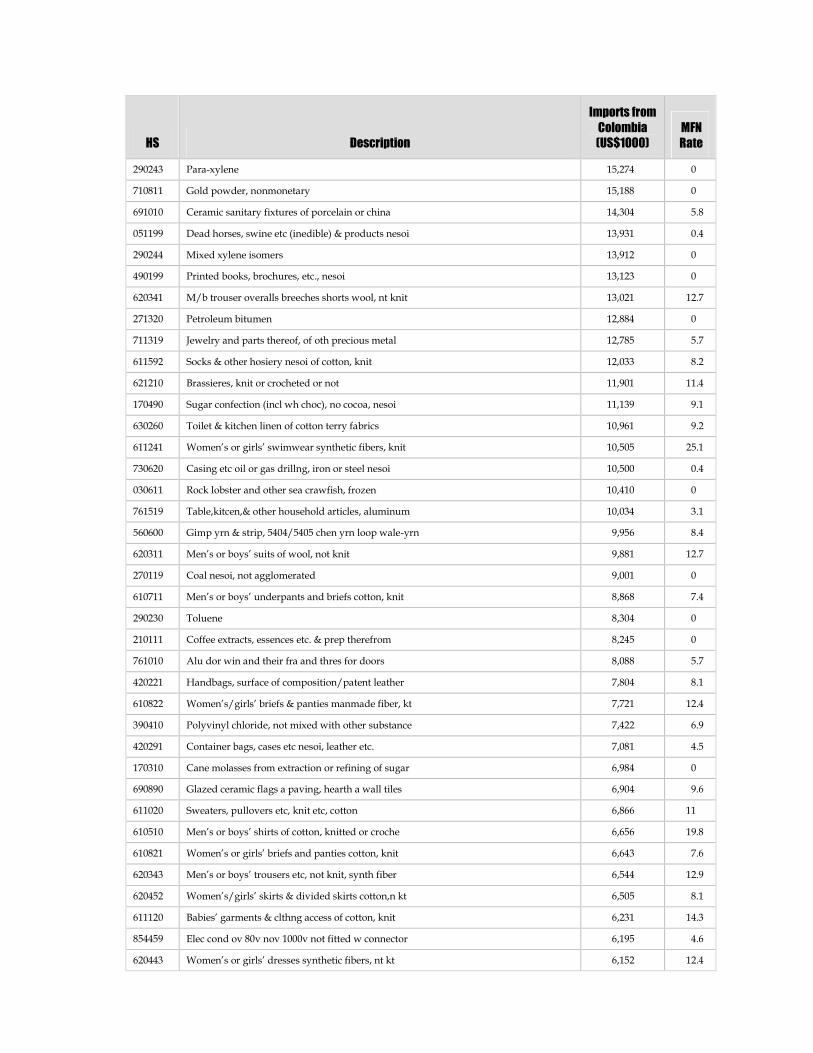
HS Description
Imports from
Colombia
(US$1000)
MFN
Rate
290243 Para-xylene 15,274 0
710811 Gold powder, nonmonetary 15,188 0
691010 Ceramic sanitary fixtures of porcelain or china 14,304 5.8
051199 Dead horses, swine etc (inedible) & products nesoi 13,931 0.4
290244 Mixed xylene isomers 13,912 0
490199 Printed books, brochures, etc., nesoi 13,123 0
620341 M/b trouser overalls breeches shorts wool, nt knit 13,021 12.7
271320 Petroleum bitumen 12,884 0
711319 Jewelry and parts thereof, of oth precious metal 12,785 5.7
611592 Socks & other hosiery nesoi of cotton, knit 12,033 8.2
621210 Brassieres, knit or crocheted or not 11,901 11.4
170490 Sugar confection (incl wh choc), no cocoa, nesoi 11,139 9.1
630260 Toilet & kitchen linen of cotton terry fabrics 10,961 9.2
611241 Women’s or girls’ swimwear synthetic fibers, knit 10,505 25.1
730620 Casing etc oil or gas drillng, iron or steel nesoi 10,500 0.4
030611 Rock lobster and other sea crawfish, frozen 10,410 0
761519 Table,kitcen,& other household articles, aluminum 10,034 3.1
560600 Gimp yrn & strip, 5404/5405 chen yrn loop wale-yrn 9,956 8.4
620311 Men’s or boys’ suits of wool, not knit 9,881 12.7
270119 Coal nesoi, not agglomerated 9,001 0
610711 Men’s or boys’ underpants and briefs cotton, knit 8,868 7.4
290230 Toluene 8,304 0
210111 Coffee extracts, essences etc. & prep therefrom 8,245 0
761010 Alu dor win and their fra and thres for doors 8,088 5.7
420221 Handbags, surface of composition/patent leather 7,804 8.1
610822 Women’s/girls’ briefs & panties manmade fiber, kt 7,721 12.4
390410 Polyvinyl chloride, not mixed with other substance 7,422 6.9
420291 Container bags, cases etc nesoi, leather etc. 7,081 4.5
170310 Cane molasses from extraction or refining of sugar 6,984 0
690890 Glazed ceramic flags a paving, hearth a wall tiles 6,904 9.6
611020 Sweaters, pullovers etc, knit etc, cotton 6,866 11
610510 Men’s or boys’ shirts of cotton, knitted or croche 6,656 19.8
610821 Women’s or girls’ briefs and panties cotton, knit 6,643 7.6
620343 Men’s or boys’ trousers etc, not knit, synth fiber 6,544 12.9
620452 Women’s/girls’ skirts & divided skirts cotton,n kt 6,505 8.1
611120 Babies’ garments & clthng access of cotton, knit 6,231 14.3
854459 Elec cond ov 80v nov 1000v not fitted w connector 6,195 4.6
620443 Women’s or girls’ dresses synthetic fibers, nt kt 6,152 12.4
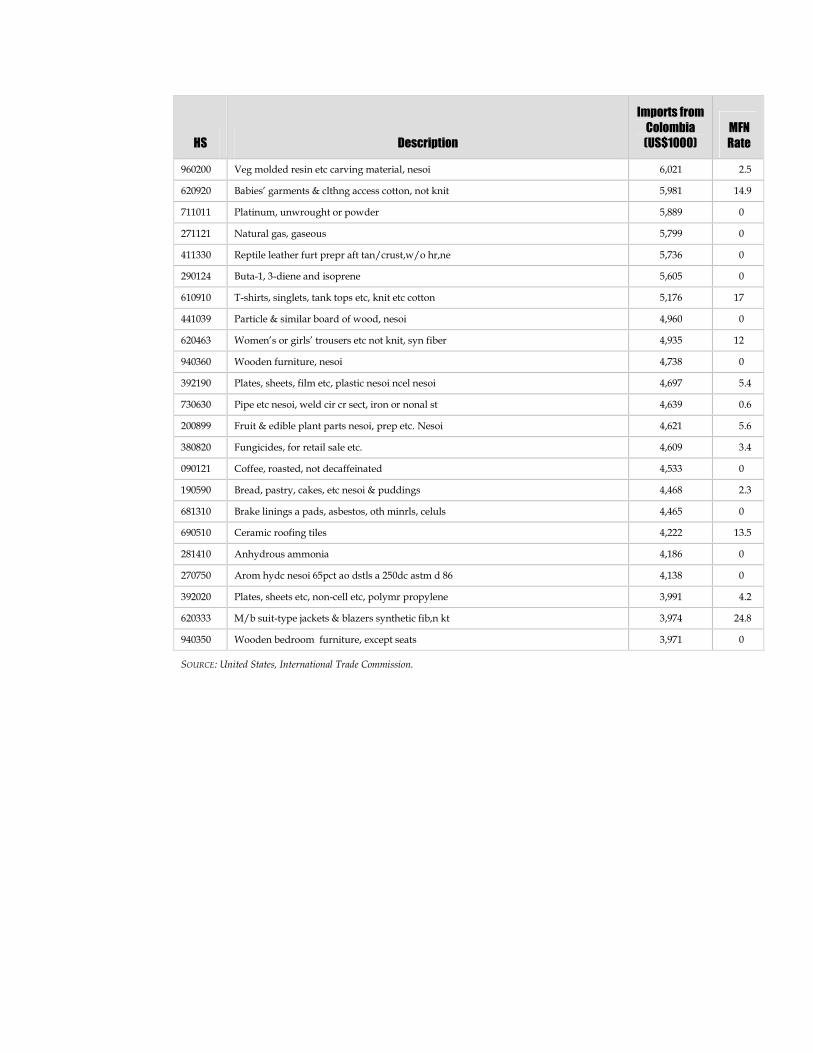
HS Description
Imports from
Colombia
(US$1000)
MFN
Rate
960200 Veg molded resin etc carving material, nesoi 6,021 2.5
620920 Babies’ garments & clthng access cotton, not knit 5,981 14.9
711011 Platinum, unwrought or powder 5,889 0
271121 Natural gas, gaseous 5,799 0
411330 Reptile leather furt prepr aft tan/crust,w/o hr,ne 5,736 0
290124 Buta-1, 3-diene and isoprene 5,605 0
610910 T-shirts, singlets, tank tops etc, knit etc cotton 5,176 17
441039 Particle & similar board of wood, nesoi 4,960 0
620463 Women’s or girls’ trousers etc not knit, syn fiber 4,935 12
940360 Wooden furniture, nesoi 4,738 0
392190 Plates, sheets, film etc, plastic nesoi ncel nesoi 4,697 5.4
730630 Pipe etc nesoi, weld cir cr sect, iron or nonal st 4,639 0.6
200899 Fruit & edible plant parts nesoi, prep etc. Nesoi 4,621 5.6
380820 Fungicides, for retail sale etc. 4,609 3.4
090121 Coffee, roasted, not decaffeinated 4,533 0
190590 Bread, pastry, cakes, etc nesoi & puddings 4,468 2.3
681310 Brake linings a pads, asbestos, oth minrls, celuls 4,465 0
690510 Ceramic roofing tiles 4,222 13.5
281410 Anhydrous ammonia 4,186 0
270750 Arom hydc nesoi 65pct ao dstls a 250dc astm d 86 4,138 0
392020 Plates, sheets etc, non-cell etc, polymr propylene 3,991 4.2
620333 M/b suit-type jackets & blazers synthetic fib,n kt 3,974 24.8
940350 Wooden bedroom furniture, except seats 3,971 0
SOURCE: United States, International Trade Commission.
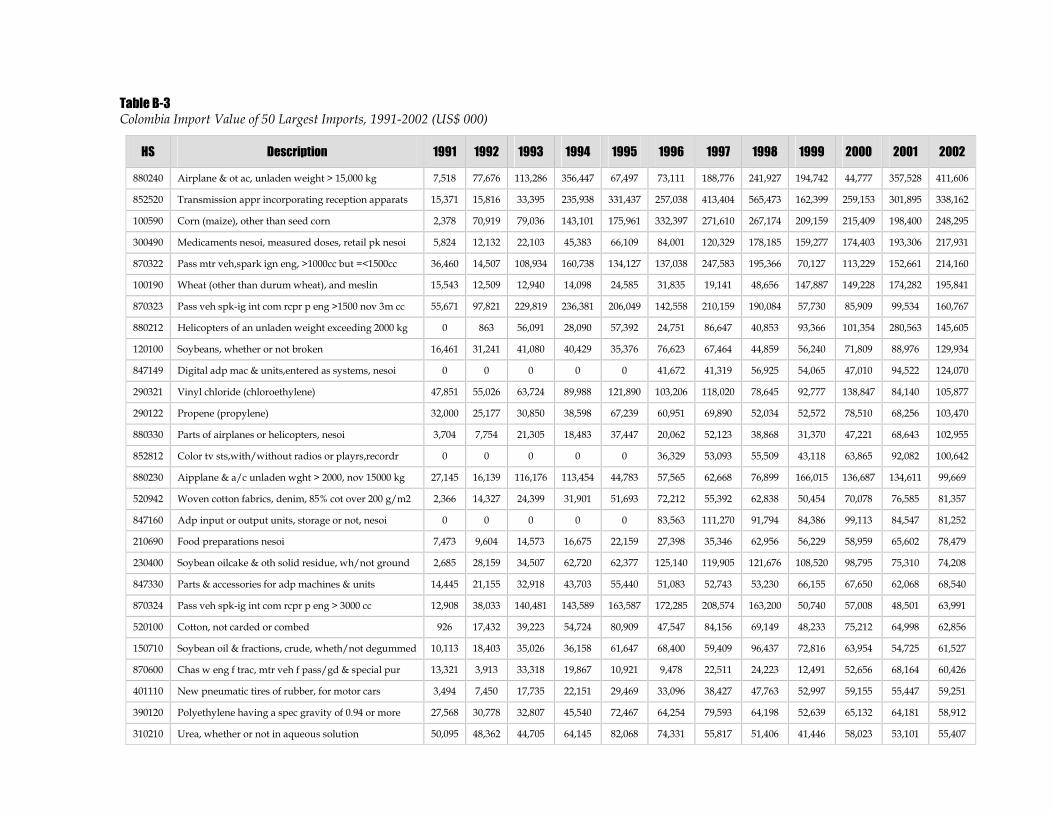
Table B-3Colombia Import Value of 50 Largest Imports, 1991-2002 (US$ 000)
HS Description 1991 1992 1993 1994 1995 1996 1997 1998 1999 2000 2001 2002
880240 Airplane & ot ac, unladen weight > 15,000 kg 7,518 77,676 113,286 356,447 67,497 73,111 188,776 241,927 194,742 44,777 357,528 411,606
852520 Transmission appr incorporating reception apparats 15,371 15,816 33,395 235,938 331,437 257,038 413,404 565,473 162,399 259,153 301,895 338,162
100590 Corn (maize), other than seed corn 2,378 70,919 79,036 143,101 175,961 332,397 271,610 267,174 209,159 215,409 198,400 248,295
300490 Medicaments nesoi, measured doses, retail pk nesoi 5,824 12,132 22,103 45,383 66,109 84,001 120,329 178,185 159,277 174,403 193,306 217,931
870322 Pass mtr veh,spark ign eng, >1000cc but =<1500cc 36,460 14,507 108,934 160,738 134,127 137,038 247,583 195,366 70,127 113,229 152,661 214,160
100190 Wheat (other than durumwheat), and meslin 15,543 12,509 12,940 14,098 24,585 31,835 19,141 48,656 147,887 149,228 174,282 195,841
870323 Pass veh spk-ig int com rcpr p eng >1500 nov 3m cc 55,671 97,821 229,819 236,381 206,049 142,558 210,159 190,084 57,730 85,909 99,534 160,767
880212 Helicopters of an unladen weight exceeding 2000 kg 0 863 56,091 28,090 57,392 24,751 86,647 40,853 93,366 101,354 280,563 145,605
120100 Soybeans, whether or not broken 16,461 31,241 41,080 40,429 35,376 76,623 67,464 44,859 56,240 71,809 88,976 129,934
847149 Digital adp mac & units,entered as systems, nesoi 0 0 0 0 0 41,672 41,319 56,925 54,065 47,010 94,522 124,070
290321 Vinyl chloride (chloroethylene) 47,851 55,026 63,724 89,988 121,890 103,206 118,020 78,645 92,777 138,847 84,140 105,877
290122 Propene (propylene) 32,000 25,177 30,850 38,598 67,239 60,951 69,890 52,034 52,572 78,510 68,256 103,470
880330 Parts of airplanes or helicopters, nesoi 3,704 7,754 21,305 18,483 37,447 20,062 52,123 38,868 31,370 47,221 68,643 102,955
852812 Color tv sts,with/without radios or playrs,recordr 0 0 0 0 0 36,329 53,093 55,509 43,118 63,865 92,082 100,642
880230 Aipplane & a/c unladen wght > 2000, nov 15000 kg 27,145 16,139 116,176 113,454 44,783 57,565 62,668 76,899 166,015 136,687 134,611 99,669
520942 Woven cotton fabrics, denim, 85% cot over 200 g/m2 2,366 14,327 24,399 31,901 51,693 72,212 55,392 62,838 50,454 70,078 76,585 81,357
847160 Adp input or output units, storage or not, nesoi 0 0 0 0 0 83,563 111,270 91,794 84,386 99,113 84,547 81,252
210690 Food preparations nesoi 7,473 9,604 14,573 16,675 22,159 27,398 35,346 62,956 56,229 58,959 65,602 78,479
230400 Soybean oilcake & oth solid residue, wh/not ground 2,685 28,159 34,507 62,720 62,377 125,140 119,905 121,676 108,520 98,795 75,310 74,208
847330 Parts & accessories for adp machines & units 14,445 21,155 32,918 43,703 55,440 51,083 52,743 53,230 66,155 67,650 62,068 68,540
870324 Pass veh spk-ig int com rcpr p eng > 3000 cc 12,908 38,033 140,481 143,589 163,587 172,285 208,574 163,200 50,740 57,008 48,501 63,991
520100 Cotton, not carded or combed 926 17,432 39,223 54,724 80,909 47,547 84,156 69,149 48,233 75,212 64,998 62,856
150710 Soybean oil & fractions, crude, wheth/not degummed 10,113 18,403 35,026 36,158 61,647 68,400 59,409 96,437 72,816 63,954 54,725 61,527
870600 Chas w eng f trac, mtr veh f pass/gd & special pur 13,321 3,913 33,318 19,867 10,921 9,478 22,511 24,223 12,491 52,656 68,164 60,426
401110 New pneumatic tires of rubber, for motor cars 3,494 7,450 17,735 22,151 29,469 33,096 38,427 47,763 52,997 59,155 55,447 59,251
390120 Polyethylene having a spec gravity of 0.94 or more 27,568 30,778 32,807 45,540 72,467 64,254 79,593 64,198 52,639 65,132 64,181 58,912
310210 Urea, whether or not in aqueous solution 50,095 48,362 44,705 64,145 82,068 74,331 55,817 51,406 41,446 58,023 53,101 55,407
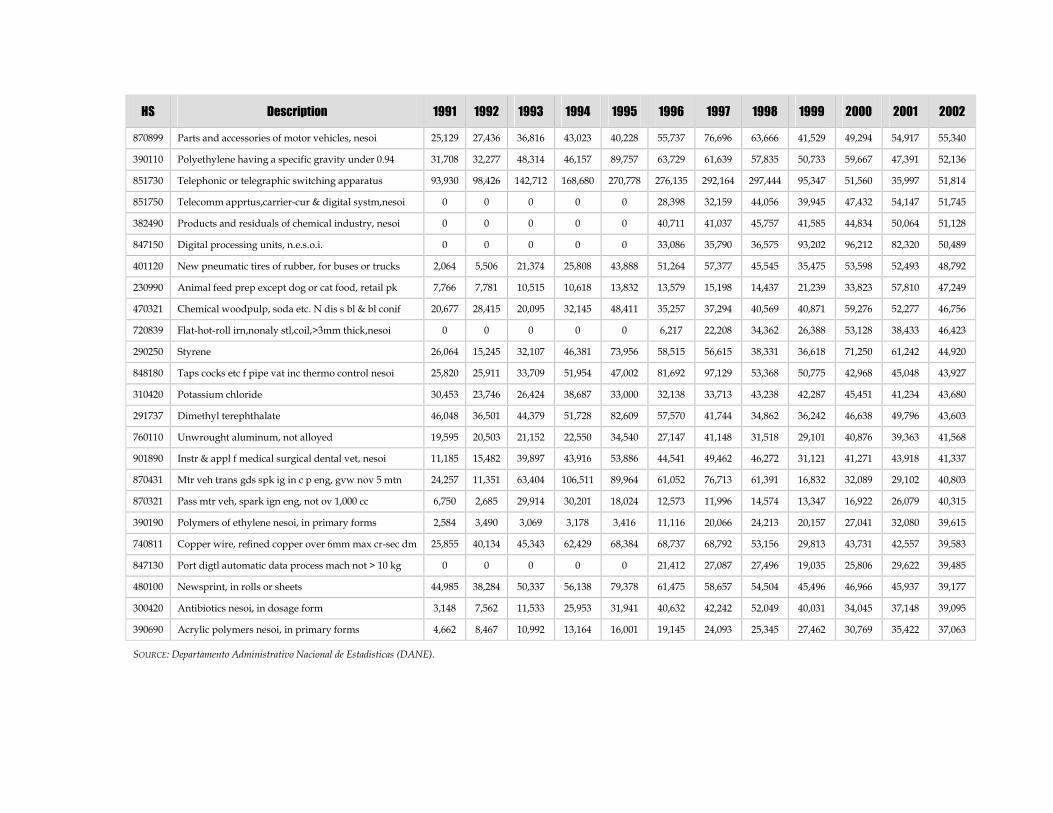
HS Description 1991 1992 1993 1994 1995 1996 1997 1998 1999 2000 2001 2002
870899 Parts and accessories of motor vehicles, nesoi 25,129 27,436 36,816 43,023 40,228 55,737 76,696 63,666 41,529 49,294 54,917 55,340
390110 Polyethylene having a specific gravity under 0.94 31,708 32,277 48,314 46,157 89,757 63,729 61,639 57,835 50,733 59,667 47,391 52,136
851730 Telephonic or telegraphic switching apparatus 93,930 98,426 142,712 168,680 270,778 276,135 292,164 297,444 95,347 51,560 35,997 51,814
851750 Telecomm apprtus,carrier-cur & digital systm,nesoi 0 0 0 0 0 28,398 32,159 44,056 39,945 47,432 54,147 51,745
382490 Products and residuals of chemical industry, nesoi 0 0 0 0 0 40,711 41,037 45,757 41,585 44,834 50,064 51,128
847150 Digital processing units, n.e.s.o.i. 0 0 0 0 0 33,086 35,790 36,575 93,202 96,212 82,320 50,489
401120 New pneumatic tires of rubber, for buses or trucks 2,064 5,506 21,374 25,808 43,888 51,264 57,377 45,545 35,475 53,598 52,493 48,792
230990 Animal feed prep except dog or cat food, retail pk 7,766 7,781 10,515 10,618 13,832 13,579 15,198 14,437 21,239 33,823 57,810 47,249
470321 Chemical woodpulp, soda etc. N dis s bl & bl conif 20,677 28,415 20,095 32,145 48,411 35,257 37,294 40,569 40,871 59,276 52,277 46,756
720839 Flat-hot-roll irn,nonaly stl,coil,>3mm thick,nesoi 0 0 0 0 0 6,217 22,208 34,362 26,388 53,128 38,433 46,423
290250 Styrene 26,064 15,245 32,107 46,381 73,956 58,515 56,615 38,331 36,618 71,250 61,242 44,920
848180 Taps cocks etc f pipe vat inc thermo control nesoi 25,820 25,911 33,709 51,954 47,002 81,692 97,129 53,368 50,775 42,968 45,048 43,927
310420 Potassium chloride 30,453 23,746 26,424 38,687 33,000 32,138 33,713 43,238 42,287 45,451 41,234 43,680
291737 Dimethyl terephthalate 46,048 36,501 44,379 51,728 82,609 57,570 41,744 34,862 36,242 46,638 49,796 43,603
760110 Unwrought aluminum, not alloyed 19,595 20,503 21,152 22,550 34,540 27,147 41,148 31,518 29,101 40,876 39,363 41,568
901890 Instr & appl f medical surgical dental vet, nesoi 11,185 15,482 39,897 43,916 53,886 44,541 49,462 46,272 31,121 41,271 43,918 41,337
870431 Mtr veh trans gds spk ig in c p eng, gvw nov 5 mtn 24,257 11,351 63,404 106,511 89,964 61,052 76,713 61,391 16,832 32,089 29,102 40,803
870321 Pass mtr veh, spark ign eng, not ov 1,000 cc 6,750 2,685 29,914 30,201 18,024 12,573 11,996 14,574 13,347 16,922 26,079 40,315
390190 Polymers of ethylene nesoi, in primary forms 2,584 3,490 3,069 3,178 3,416 11,116 20,066 24,213 20,157 27,041 32,080 39,615
740811 Copper wire, refined copper over 6mmmax cr-sec dm 25,855 40,134 45,343 62,429 68,384 68,737 68,792 53,156 29,813 43,731 42,557 39,583
847130 Port digtl automatic data process mach not > 10 kg 0 0 0 0 0 21,412 27,087 27,496 19,035 25,806 29,622 39,485
480100 Newsprint, in rolls or sheets 44,985 38,284 50,337 56,138 79,378 61,475 58,657 54,504 45,496 46,966 45,937 39,177
300420 Antibiotics nesoi, in dosage form 3,148 7,562 11,533 25,953 31,941 40,632 42,242 52,049 40,031 34,045 37,148 39,095
390690 Acrylic polymers nesoi, in primary forms 4,662 8,467 10,992 13,164 16,001 19,145 24,093 25,345 27,462 30,769 35,422 37,063
SOURCE: Departamento Administrativo Nacional de Estadisticas (DANE).
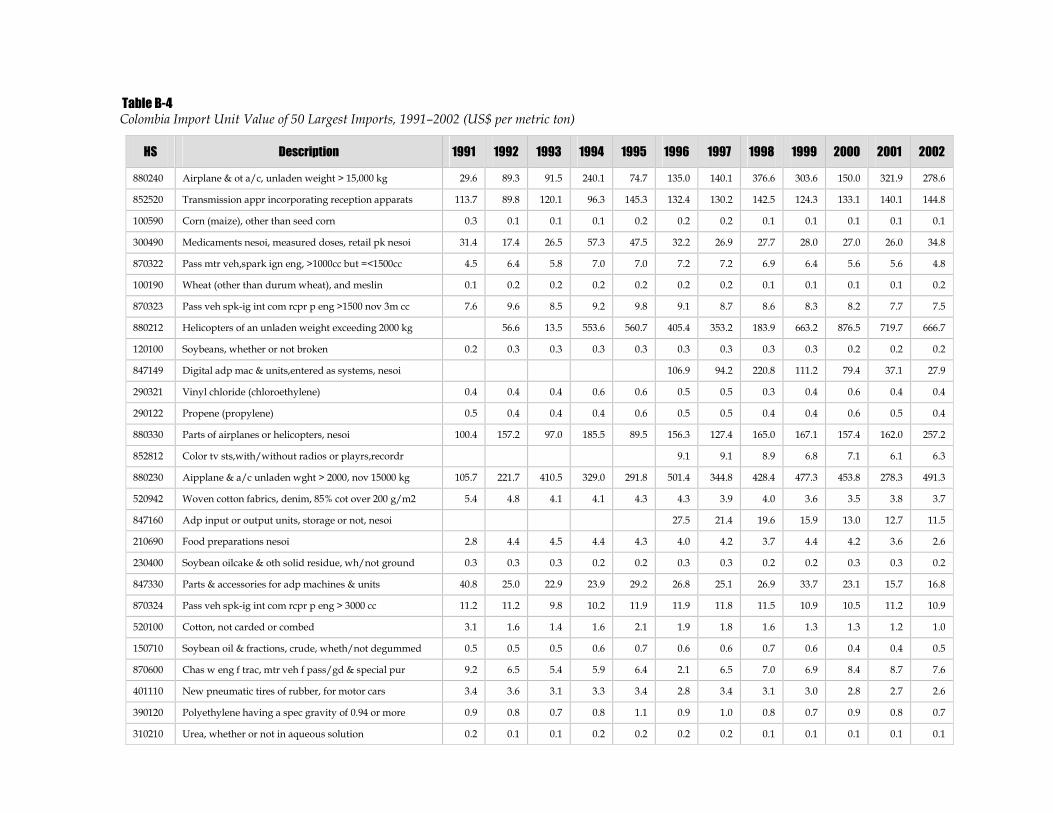
Table B-4Colombia Import Unit Value of 50 Largest Imports, 1991–2002 (US$ per metric ton)
HS Description 1991 1992 1993 1994 1995 1996 1997 1998 1999 2000 2001 2002
880240 Airplane & ot a/c, unladen weight > 15,000 kg 29.6 89.3 91.5 240.1 74.7 135.0 140.1 376.6 303.6 150.0 321.9 278.6
852520 Transmission appr incorporating reception apparats 113.7 89.8 120.1 96.3 145.3 132.4 130.2 142.5 124.3 133.1 140.1 144.8
100590 Corn (maize), other than seed corn 0.3 0.1 0.1 0.1 0.2 0.2 0.2 0.1 0.1 0.1 0.1 0.1
300490 Medicaments nesoi, measured doses, retail pk nesoi 31.4 17.4 26.5 57.3 47.5 32.2 26.9 27.7 28.0 27.0 26.0 34.8
870322 Pass mtr veh,spark ign eng, >1000cc but =<1500cc 4.5 6.4 5.8 7.0 7.0 7.2 7.2 6.9 6.4 5.6 5.6 4.8
100190 Wheat (other than durumwheat), and meslin 0.1 0.2 0.2 0.2 0.2 0.2 0.2 0.1 0.1 0.1 0.1 0.2
870323 Pass veh spk-ig int com rcpr p eng >1500 nov 3m cc 7.6 9.6 8.5 9.2 9.8 9.1 8.7 8.6 8.3 8.2 7.7 7.5
880212 Helicopters of an unladen weight exceeding 2000 kg 56.6 13.5 553.6 560.7 405.4 353.2 183.9 663.2 876.5 719.7 666.7
120100 Soybeans, whether or not broken 0.2 0.3 0.3 0.3 0.3 0.3 0.3 0.3 0.3 0.2 0.2 0.2
847149 Digital adp mac & units,entered as systems, nesoi 106.9 94.2 220.8 111.2 79.4 37.1 27.9
290321 Vinyl chloride (chloroethylene) 0.4 0.4 0.4 0.6 0.6 0.5 0.5 0.3 0.4 0.6 0.4 0.4
290122 Propene (propylene) 0.5 0.4 0.4 0.4 0.6 0.5 0.5 0.4 0.4 0.6 0.5 0.4
880330 Parts of airplanes or helicopters, nesoi 100.4 157.2 97.0 185.5 89.5 156.3 127.4 165.0 167.1 157.4 162.0 257.2
852812 Color tv sts,with/without radios or playrs,recordr 9.1 9.1 8.9 6.8 7.1 6.1 6.3
880230 Aipplane & a/c unladen wght > 2000, nov 15000 kg 105.7 221.7 410.5 329.0 291.8 501.4 344.8 428.4 477.3 453.8 278.3 491.3
520942 Woven cotton fabrics, denim, 85% cot over 200 g/m2 5.4 4.8 4.1 4.1 4.3 4.3 3.9 4.0 3.6 3.5 3.8 3.7
847160 Adp input or output units, storage or not, nesoi 27.5 21.4 19.6 15.9 13.0 12.7 11.5
210690 Food preparations nesoi 2.8 4.4 4.5 4.4 4.3 4.0 4.2 3.7 4.4 4.2 3.6 2.6
230400 Soybean oilcake & oth solid residue, wh/not ground 0.3 0.3 0.3 0.2 0.2 0.3 0.3 0.2 0.2 0.3 0.3 0.2
847330 Parts & accessories for adp machines & units 40.8 25.0 22.9 23.9 29.2 26.8 25.1 26.9 33.7 23.1 15.7 16.8
870324 Pass veh spk-ig int com rcpr p eng > 3000 cc 11.2 11.2 9.8 10.2 11.9 11.9 11.8 11.5 10.9 10.5 11.2 10.9
520100 Cotton, not carded or combed 3.1 1.6 1.4 1.6 2.1 1.9 1.8 1.6 1.3 1.3 1.2 1.0
150710 Soybean oil & fractions, crude, wheth/not degummed 0.5 0.5 0.5 0.6 0.7 0.6 0.6 0.7 0.6 0.4 0.4 0.5
870600 Chas w eng f trac, mtr veh f pass/gd & special pur 9.2 6.5 5.4 5.9 6.4 2.1 6.5 7.0 6.9 8.4 8.7 7.6
401110 New pneumatic tires of rubber, for motor cars 3.4 3.6 3.1 3.3 3.4 2.8 3.4 3.1 3.0 2.8 2.7 2.6
390120 Polyethylene having a spec gravity of 0.94 or more 0.9 0.8 0.7 0.8 1.1 0.9 1.0 0.8 0.7 0.9 0.8 0.7
310210 Urea, whether or not in aqueous solution 0.2 0.1 0.1 0.2 0.2 0.2 0.2 0.1 0.1 0.1 0.1 0.1
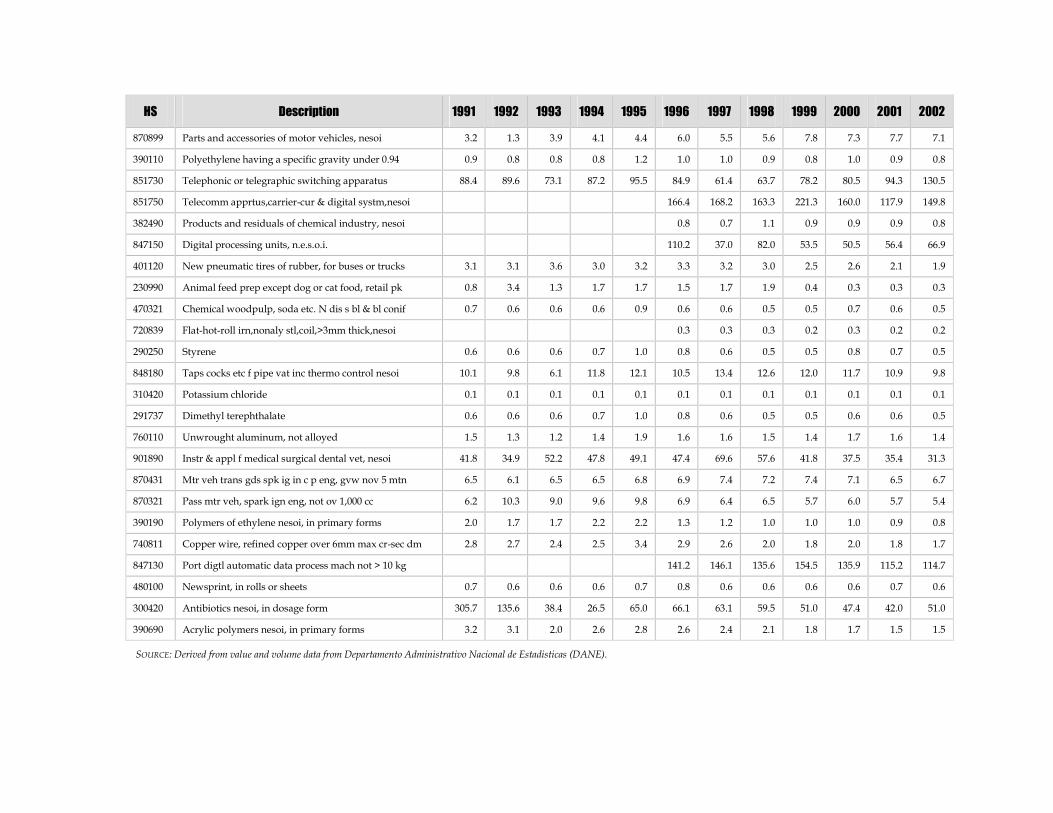
HS Description 1991 1992 1993 1994 1995 1996 1997 1998 1999 2000 2001 2002
870899 Parts and accessories of motor vehicles, nesoi 3.2 1.3 3.9 4.1 4.4 6.0 5.5 5.6 7.8 7.3 7.7 7.1
390110 Polyethylene having a specific gravity under 0.94 0.9 0.8 0.8 0.8 1.2 1.0 1.0 0.9 0.8 1.0 0.9 0.8
851730 Telephonic or telegraphic switching apparatus 88.4 89.6 73.1 87.2 95.5 84.9 61.4 63.7 78.2 80.5 94.3 130.5
851750 Telecomm apprtus,carrier-cur & digital systm,nesoi 166.4 168.2 163.3 221.3 160.0 117.9 149.8
382490 Products and residuals of chemical industry, nesoi 0.8 0.7 1.1 0.9 0.9 0.9 0.8
847150 Digital processing units, n.e.s.o.i. 110.2 37.0 82.0 53.5 50.5 56.4 66.9
401120 New pneumatic tires of rubber, for buses or trucks 3.1 3.1 3.6 3.0 3.2 3.3 3.2 3.0 2.5 2.6 2.1 1.9
230990 Animal feed prep except dog or cat food, retail pk 0.8 3.4 1.3 1.7 1.7 1.5 1.7 1.9 0.4 0.3 0.3 0.3
470321 Chemical woodpulp, soda etc. N dis s bl & bl conif 0.7 0.6 0.6 0.6 0.9 0.6 0.6 0.5 0.5 0.7 0.6 0.5
720839 Flat-hot-roll irn,nonaly stl,coil,>3mm thick,nesoi 0.3 0.3 0.3 0.2 0.3 0.2 0.2
290250 Styrene 0.6 0.6 0.6 0.7 1.0 0.8 0.6 0.5 0.5 0.8 0.7 0.5
848180 Taps cocks etc f pipe vat inc thermo control nesoi 10.1 9.8 6.1 11.8 12.1 10.5 13.4 12.6 12.0 11.7 10.9 9.8
310420 Potassium chloride 0.1 0.1 0.1 0.1 0.1 0.1 0.1 0.1 0.1 0.1 0.1 0.1
291737 Dimethyl terephthalate 0.6 0.6 0.6 0.7 1.0 0.8 0.6 0.5 0.5 0.6 0.6 0.5
760110 Unwrought aluminum, not alloyed 1.5 1.3 1.2 1.4 1.9 1.6 1.6 1.5 1.4 1.7 1.6 1.4
901890 Instr & appl f medical surgical dental vet, nesoi 41.8 34.9 52.2 47.8 49.1 47.4 69.6 57.6 41.8 37.5 35.4 31.3
870431 Mtr veh trans gds spk ig in c p eng, gvw nov 5 mtn 6.5 6.1 6.5 6.5 6.8 6.9 7.4 7.2 7.4 7.1 6.5 6.7
870321 Pass mtr veh, spark ign eng, not ov 1,000 cc 6.2 10.3 9.0 9.6 9.8 6.9 6.4 6.5 5.7 6.0 5.7 5.4
390190 Polymers of ethylene nesoi, in primary forms 2.0 1.7 1.7 2.2 2.2 1.3 1.2 1.0 1.0 1.0 0.9 0.8
740811 Copper wire, refined copper over 6mmmax cr-sec dm 2.8 2.7 2.4 2.5 3.4 2.9 2.6 2.0 1.8 2.0 1.8 1.7
847130 Port digtl automatic data process mach not > 10 kg 141.2 146.1 135.6 154.5 135.9 115.2 114.7
480100 Newsprint, in rolls or sheets 0.7 0.6 0.6 0.6 0.7 0.8 0.6 0.6 0.6 0.6 0.7 0.6
300420 Antibiotics nesoi, in dosage form 305.7 135.6 38.4 26.5 65.0 66.1 63.1 59.5 51.0 47.4 42.0 51.0
390690 Acrylic polymers nesoi, in primary forms 3.2 3.1 2.0 2.6 2.8 2.6 2.4 2.1 1.8 1.7 1.5 1.5
SOURCE: Derived from value and volume data from Departamento Administrativo Nacional de Estadisticas (DANE).

Table B-5Colombia Import Duty of 50 Largest Imports, 1991-2002 (percent)
HS Description 1991 1992 1993 1994 1995 1996 1997 1998 1999 2000 2001 2002
880240 Airplane & ot a/c, unladen weight > 15,000 kg 0 0 0 0 0 0 0 0 0 0 0 0
852520 Transmission appr incorporating reception apparats 15 5 5 5 5 5 5 5 5 5 5 5
100590 Corn (maize), other than seed corn 30 15 15 15 15 15 15 15 15 15 15 15
300490 Medicaments nesoi, measured doses, retail pk nesoi 15 10 10 10 10 10 10 10 10 10 10 10
870322 Pass mtr veh,spark ign eng, >1000cc but =<1500cc 75 35 35 35 35 35 35 35 35 35 35 35
100190 Wheat (other than durumwheat), and meslin 30 15 15 15 15 15 15 15 15 15 15 15
870323 Pass veh spk-ig int com rcpr p eng >1500 nov 3m cc 75 40 40 35 35 35 35 35 35 35 35 35
880212 Helicopters of an unladen weight exceeding 2000 kg 0 5 0 0 0 0 0 0 0 0 0 0
120100 Soybeans, whether or not broken 30 15 15 15 15 15 15 15 15 15 15 15
847149 Digital adp mac & units,entered as systems, nesoi 0 5 5 5 5 5 5 5 5 5 5 5
290321 Vinyl chloride (chloroethylene) 5 5 5 5 5 5 5 5 5 5 5 5
290122 Propene (propylene) 5 0 0 0 5 5 5 5 5 5 5 5
880330 Parts of airplanes or helicopters, nesoi 0 5 5 5 5 5 5 5 5 5 5 5
852812 Color tv sts,with/without radios or playrs,recordr 35 20 20 20 20 20 20 20 20 20 20 20
880230 Aipplane & a/c unladen wght > 2000, nov 15000 kg 0 0 0 0 0 0 0 0 0 0 0 0
520942 Woven cotton fabrics, denim, 85% cot over 200 g/m2 35 20 20 20 20 20 20 20 20 20 20 20
847160 Adp input or output units, storage or not, nesoi 0 5 5 5 5 5 5 5 5 5 5 5
210690 Food preparations nesoi 35 20 20 20 20 20 20 20 20 20 20 20
230400 Soybean oilcake & oth solid residue, wh/not ground 30 15 15 15 15 15 15 15 15 15 15 15
847330 Parts & accessories for adp machines & units 0 5 5 5 5 5 5 5 5 5 5 5
870324 Pass veh spk-ig int com rcpr p eng > 3000 cc 75 40 40 35 35 35 35 35 35 35 35 35
520100 Cotton, not carded or combed 0 10 10 10 10 10 10 10 10 10 10 10
150710 Soybean oil & fractions, crude, wheth/not degummed 40 20 20 20 20 20 20 20 20 20 20 20
870600 Chas w eng f trac, mtr veh f pass/gd & special pur 35 15 15 15 15 15 15 15 15 15 15 15
401110 New pneumatic tires of rubber, for motor cars 25 15 15 15 15 15 15 15 15 15 15 15
390120 Polyethylene having a spec gravity of 0.94 or more 20 15 15 15 15 15 15 15 15 15 15 15
310210 Urea, whether or not in aqueous solution 0 5 5 5 5 5 5 5 5 5 5 5
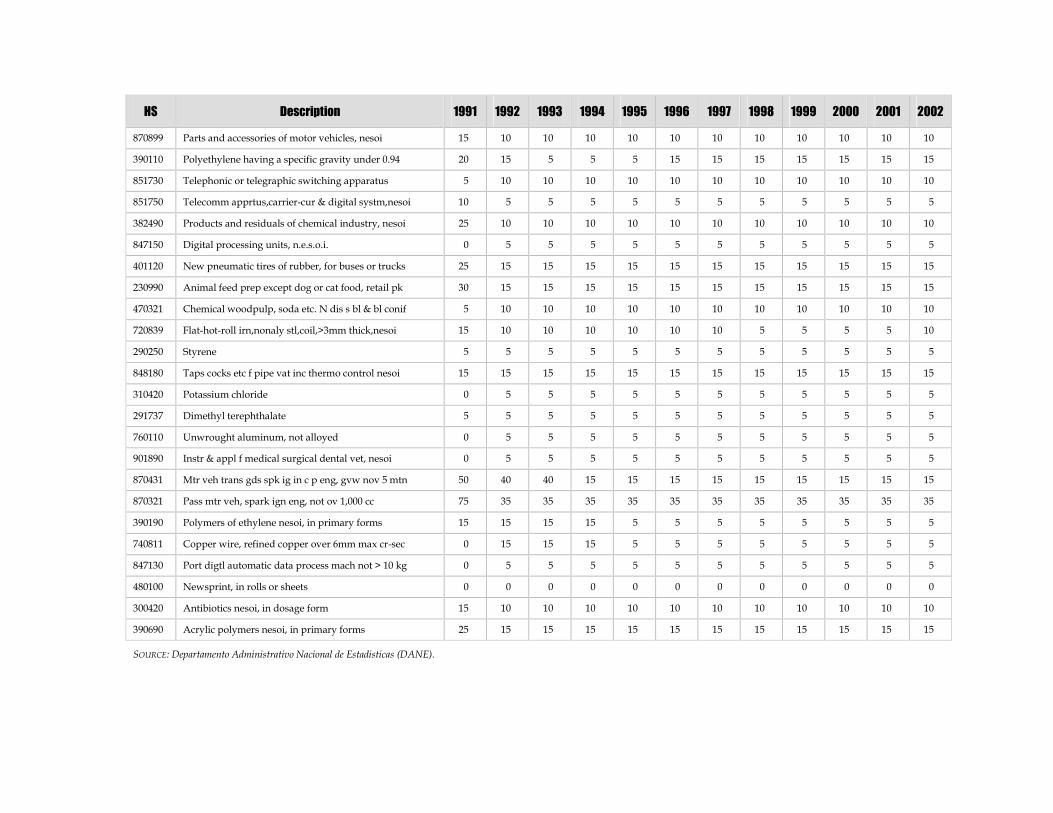
HS Description 1991 1992 1993 1994 1995 1996 1997 1998 1999 2000 2001 2002
870899 Parts and accessories of motor vehicles, nesoi 15 10 10 10 10 10 10 10 10 10 10 10
390110 Polyethylene having a specific gravity under 0.94 20 15 5 5 5 15 15 15 15 15 15 15
851730 Telephonic or telegraphic switching apparatus 5 10 10 10 10 10 10 10 10 10 10 10
851750 Telecomm apprtus,carrier-cur & digital systm,nesoi 10 5 5 5 5 5 5 5 5 5 5 5
382490 Products and residuals of chemical industry, nesoi 25 10 10 10 10 10 10 10 10 10 10 10
847150 Digital processing units, n.e.s.o.i. 0 5 5 5 5 5 5 5 5 5 5 5
401120 New pneumatic tires of rubber, for buses or trucks 25 15 15 15 15 15 15 15 15 15 15 15
230990 Animal feed prep except dog or cat food, retail pk 30 15 15 15 15 15 15 15 15 15 15 15
470321 Chemical woodpulp, soda etc. N dis s bl & bl conif 5 10 10 10 10 10 10 10 10 10 10 10
720839 Flat-hot-roll irn,nonaly stl,coil,>3mm thick,nesoi 15 10 10 10 10 10 10 5 5 5 5 10
290250 Styrene 5 5 5 5 5 5 5 5 5 5 5 5
848180 Taps cocks etc f pipe vat inc thermo control nesoi 15 15 15 15 15 15 15 15 15 15 15 15
310420 Potassium chloride 0 5 5 5 5 5 5 5 5 5 5 5
291737 Dimethyl terephthalate 5 5 5 5 5 5 5 5 5 5 5 5
760110 Unwrought aluminum, not alloyed 0 5 5 5 5 5 5 5 5 5 5 5
901890 Instr & appl f medical surgical dental vet, nesoi 0 5 5 5 5 5 5 5 5 5 5 5
870431 Mtr veh trans gds spk ig in c p eng, gvw nov 5 mtn 50 40 40 15 15 15 15 15 15 15 15 15
870321 Pass mtr veh, spark ign eng, not ov 1,000 cc 75 35 35 35 35 35 35 35 35 35 35 35
390190 Polymers of ethylene nesoi, in primary forms 15 15 15 15 5 5 5 5 5 5 5 5
740811 Copper wire, refined copper over 6mmmax cr-sec 0 15 15 15 5 5 5 5 5 5 5 5
847130 Port digtl automatic data process mach not > 10 kg 0 5 5 5 5 5 5 5 5 5 5 5
480100 Newsprint, in rolls or sheets 0 0 0 0 0 0 0 0 0 0 0 0
300420 Antibiotics nesoi, in dosage form 15 10 10 10 10 10 10 10 10 10 10 10
390690 Acrylic polymers nesoi, in primary forms 25 15 15 15 15 15 15 15 15 15 15 15
SOURCE: Departamento Administrativo Nacional de Estadisticas (DANE).
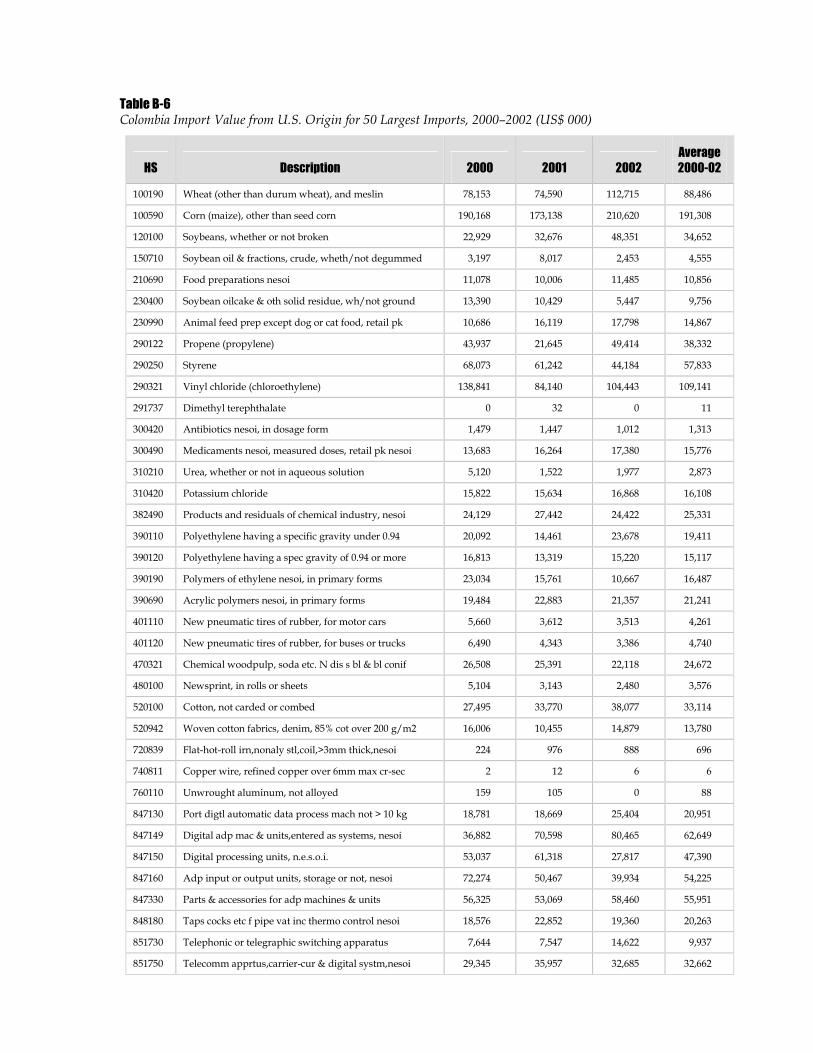
Table B-6Colombia Import Value from U.S. Origin for 50 Largest Imports, 2000–2002 (US$ 000)
HS Description 2000 2001 2002
Average
2000-02
100190 Wheat (other than durumwheat), and meslin 78,153 74,590 112,715 88,486
100590 Corn (maize), other than seed corn 190,168 173,138 210,620 191,308
120100 Soybeans, whether or not broken 22,929 32,676 48,351 34,652
150710 Soybean oil & fractions, crude, wheth/not degummed 3,197 8,017 2,453 4,555
210690 Food preparations nesoi 11,078 10,006 11,485 10,856
230400 Soybean oilcake & oth solid residue, wh/not ground 13,390 10,429 5,447 9,756
230990 Animal feed prep except dog or cat food, retail pk 10,686 16,119 17,798 14,867
290122 Propene (propylene) 43,937 21,645 49,414 38,332
290250 Styrene 68,073 61,242 44,184 57,833
290321 Vinyl chloride (chloroethylene) 138,841 84,140 104,443 109,141
291737 Dimethyl terephthalate 0 32 0 11
300420 Antibiotics nesoi, in dosage form 1,479 1,447 1,012 1,313
300490 Medicaments nesoi, measured doses, retail pk nesoi 13,683 16,264 17,380 15,776
310210 Urea, whether or not in aqueous solution 5,120 1,522 1,977 2,873
310420 Potassium chloride 15,822 15,634 16,868 16,108
382490 Products and residuals of chemical industry, nesoi 24,129 27,442 24,422 25,331
390110 Polyethylene having a specific gravity under 0.94 20,092 14,461 23,678 19,411
390120 Polyethylene having a spec gravity of 0.94 or more 16,813 13,319 15,220 15,117
390190 Polymers of ethylene nesoi, in primary forms 23,034 15,761 10,667 16,487
390690 Acrylic polymers nesoi, in primary forms 19,484 22,883 21,357 21,241
401110 New pneumatic tires of rubber, for motor cars 5,660 3,612 3,513 4,261
401120 New pneumatic tires of rubber, for buses or trucks 6,490 4,343 3,386 4,740
470321 Chemical woodpulp, soda etc. N dis s bl & bl conif 26,508 25,391 22,118 24,672
480100 Newsprint, in rolls or sheets 5,104 3,143 2,480 3,576
520100 Cotton, not carded or combed 27,495 33,770 38,077 33,114
520942 Woven cotton fabrics, denim, 85% cot over 200 g/m2 16,006 10,455 14,879 13,780
720839 Flat-hot-roll irn,nonaly stl,coil,>3mm thick,nesoi 224 976 888 696
740811 Copper wire, refined copper over 6mmmax cr-sec 2 12 6 6
760110 Unwrought aluminum, not alloyed 159 105 0 88
847130 Port digtl automatic data process mach not > 10 kg 18,781 18,669 25,404 20,951
847149 Digital adp mac & units,entered as systems, nesoi 36,882 70,598 80,465 62,649
847150 Digital processing units, n.e.s.o.i. 53,037 61,318 27,817 47,390
847160 Adp input or output units, storage or not, nesoi 72,274 50,467 39,934 54,225
847330 Parts & accessories for adp machines & units 56,325 53,069 58,460 55,951
848180 Taps cocks etc f pipe vat inc thermo control nesoi 18,576 22,852 19,360 20,263
851730 Telephonic or telegraphic switching apparatus 7,644 7,547 14,622 9,937
851750 Telecomm apprtus,carrier-cur & digital systm,nesoi 29,345 35,957 32,685 32,662
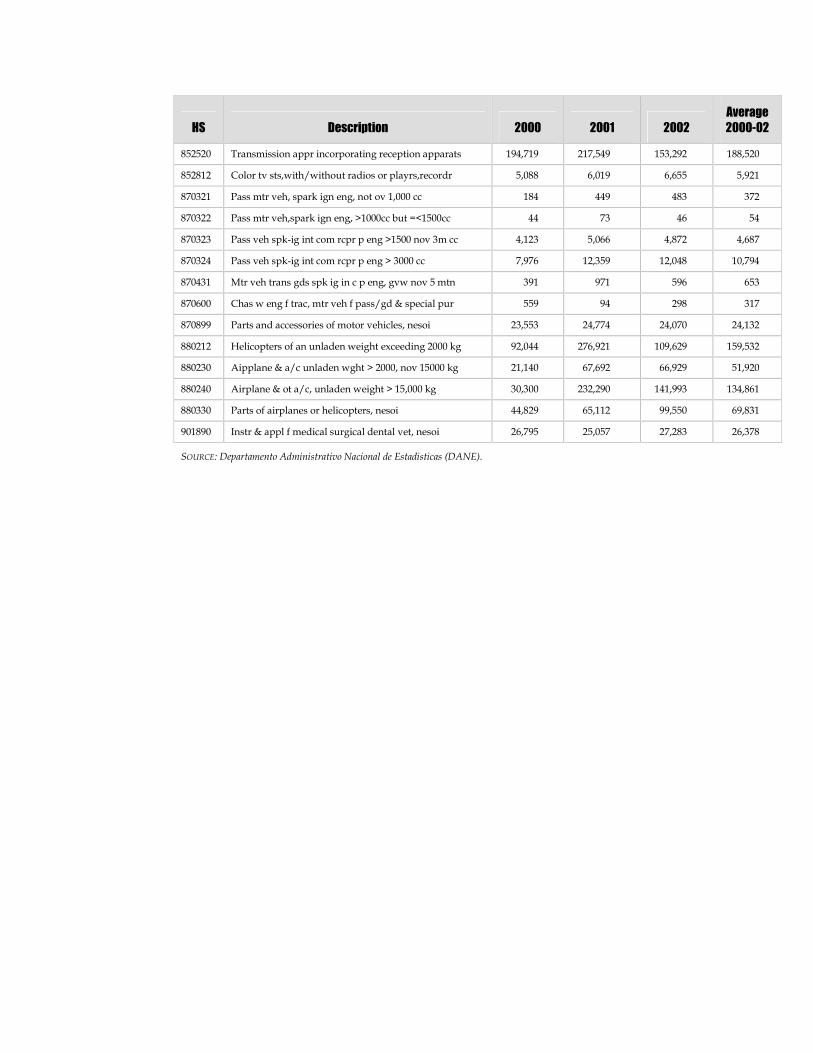
HS Description 2000 2001 2002
Average
2000-02
852520 Transmission appr incorporating reception apparats 194,719 217,549 153,292 188,520
852812 Color tv sts,with/without radios or playrs,recordr 5,088 6,019 6,655 5,921
870321 Pass mtr veh, spark ign eng, not ov 1,000 cc 184 449 483 372
870322 Pass mtr veh,spark ign eng, >1000cc but =<1500cc 44 73 46 54
870323 Pass veh spk-ig int com rcpr p eng >1500 nov 3m cc 4,123 5,066 4,872 4,687
870324 Pass veh spk-ig int com rcpr p eng > 3000 cc 7,976 12,359 12,048 10,794
870431 Mtr veh trans gds spk ig in c p eng, gvw nov 5 mtn 391 971 596 653
870600 Chas w eng f trac, mtr veh f pass/gd & special pur 559 94 298 317
870899 Parts and accessories of motor vehicles, nesoi 23,553 24,774 24,070 24,132
880212 Helicopters of an unladen weight exceeding 2000 kg 92,044 276,921 109,629 159,532
880230 Aipplane & a/c unladen wght > 2000, nov 15000 kg 21,140 67,692 66,929 51,920
880240 Airplane & ot a/c, unladen weight > 15,000 kg 30,300 232,290 141,993 134,861
880330 Parts of airplanes or helicopters, nesoi 44,829 65,112 99,550 69,831
901890 Instr & appl f medical surgical dental vet, nesoi 26,795 25,057 27,283 26,378
SOURCE: Departamento Administrativo Nacional de Estadisticas (DANE).
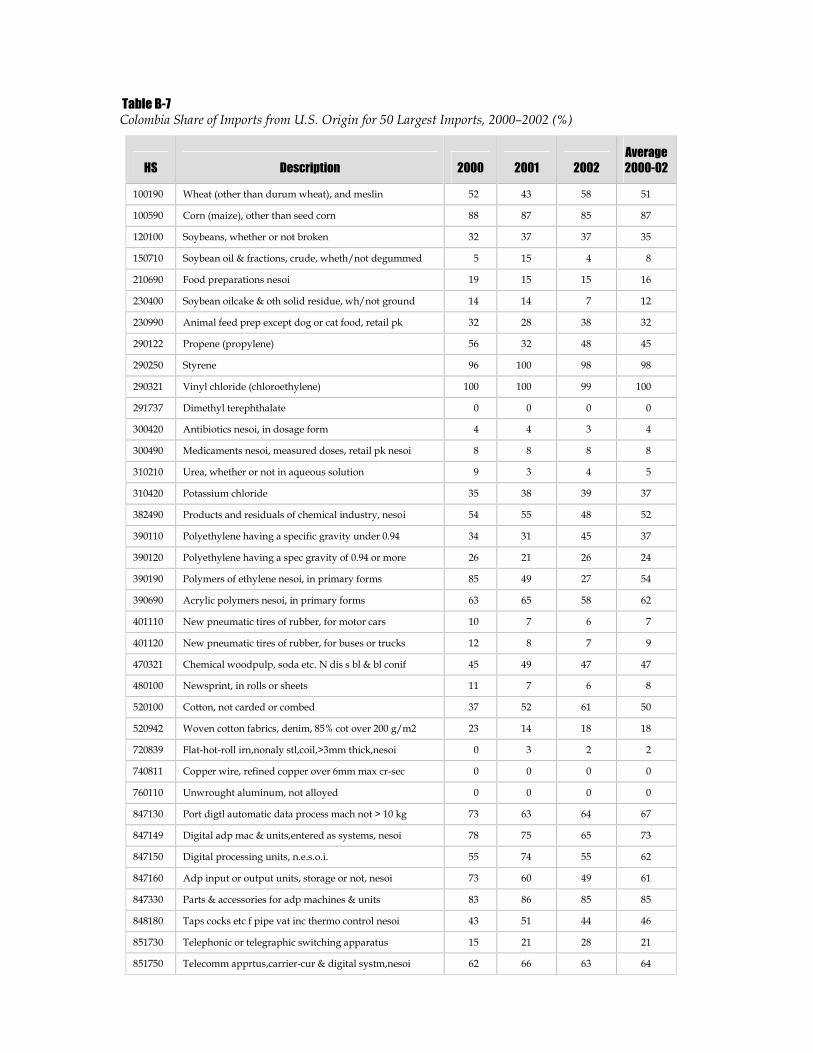
Table B-7Colombia Share of Imports from U.S. Origin for 50 Largest Imports, 2000–2002 (%)
HS Description 2000 2001 2002
Average
2000-02
100190 Wheat (other than durumwheat), and meslin 52 43 58 51
100590 Corn (maize), other than seed corn 88 87 85 87
120100 Soybeans, whether or not broken 32 37 37 35
150710 Soybean oil & fractions, crude, wheth/not degummed 5 15 4 8
210690 Food preparations nesoi 19 15 15 16
230400 Soybean oilcake & oth solid residue, wh/not ground 14 14 7 12
230990 Animal feed prep except dog or cat food, retail pk 32 28 38 32
290122 Propene (propylene) 56 32 48 45
290250 Styrene 96 100 98 98
290321 Vinyl chloride (chloroethylene) 100 100 99 100
291737 Dimethyl terephthalate 0 0 0 0
300420 Antibiotics nesoi, in dosage form 4 4 3 4
300490 Medicaments nesoi, measured doses, retail pk nesoi 8 8 8 8
310210 Urea, whether or not in aqueous solution 9 3 4 5
310420 Potassium chloride 35 38 39 37
382490 Products and residuals of chemical industry, nesoi 54 55 48 52
390110 Polyethylene having a specific gravity under 0.94 34 31 45 37
390120 Polyethylene having a spec gravity of 0.94 or more 26 21 26 24
390190 Polymers of ethylene nesoi, in primary forms 85 49 27 54
390690 Acrylic polymers nesoi, in primary forms 63 65 58 62
401110 New pneumatic tires of rubber, for motor cars 10 7 6 7
401120 New pneumatic tires of rubber, for buses or trucks 12 8 7 9
470321 Chemical woodpulp, soda etc. N dis s bl & bl conif 45 49 47 47
480100 Newsprint, in rolls or sheets 11 7 6 8
520100 Cotton, not carded or combed 37 52 61 50
520942 Woven cotton fabrics, denim, 85% cot over 200 g/m2 23 14 18 18
720839 Flat-hot-roll irn,nonaly stl,coil,>3mm thick,nesoi 0 3 2 2
740811 Copper wire, refined copper over 6mmmax cr-sec 0 0 0 0
760110 Unwrought aluminum, not alloyed 0 0 0 0
847130 Port digtl automatic data process mach not > 10 kg 73 63 64 67
847149 Digital adp mac & units,entered as systems, nesoi 78 75 65 73
847150 Digital processing units, n.e.s.o.i. 55 74 55 62
847160 Adp input or output units, storage or not, nesoi 73 60 49 61
847330 Parts & accessories for adp machines & units 83 86 85 85
848180 Taps cocks etc f pipe vat inc thermo control nesoi 43 51 44 46
851730 Telephonic or telegraphic switching apparatus 15 21 28 21
851750 Telecomm apprtus,carrier-cur & digital systm,nesoi 62 66 63 64
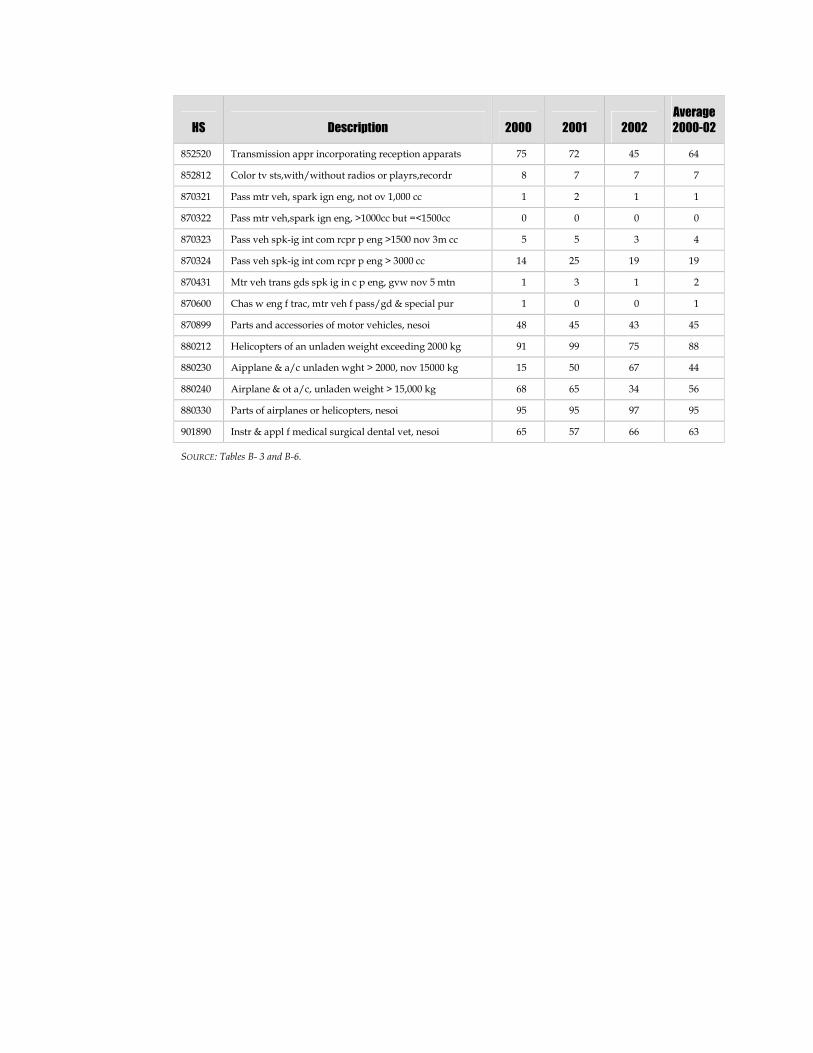
HS Description 2000 2001 2002
Average
2000-02
852520 Transmission appr incorporating reception apparats 75 72 45 64
852812 Color tv sts,with/without radios or playrs,recordr 8 7 7 7
870321 Pass mtr veh, spark ign eng, not ov 1,000 cc 1 2 1 1
870322 Pass mtr veh,spark ign eng, >1000cc but =<1500cc 0 0 0 0
870323 Pass veh spk-ig int com rcpr p eng >1500 nov 3m cc 5 5 3 4
870324 Pass veh spk-ig int com rcpr p eng > 3000 cc 14 25 19 19
870431 Mtr veh trans gds spk ig in c p eng, gvw nov 5 mtn 1 3 1 2
870600 Chas w eng f trac, mtr veh f pass/gd & special pur 1 0 0 1
870899 Parts and accessories of motor vehicles, nesoi 48 45 43 45
880212 Helicopters of an unladen weight exceeding 2000 kg 91 99 75 88
880230 Aipplane & a/c unladen wght > 2000, nov 15000 kg 15 50 67 44
880240 Airplane & ot a/c, unladen weight > 15,000 kg 68 65 34 56
880330 Parts of airplanes or helicopters, nesoi 95 95 97 95
901890 Instr & appl f medical surgical dental vet, nesoi 65 57 66 63
SOURCE: Tables B- 3 and B-6.
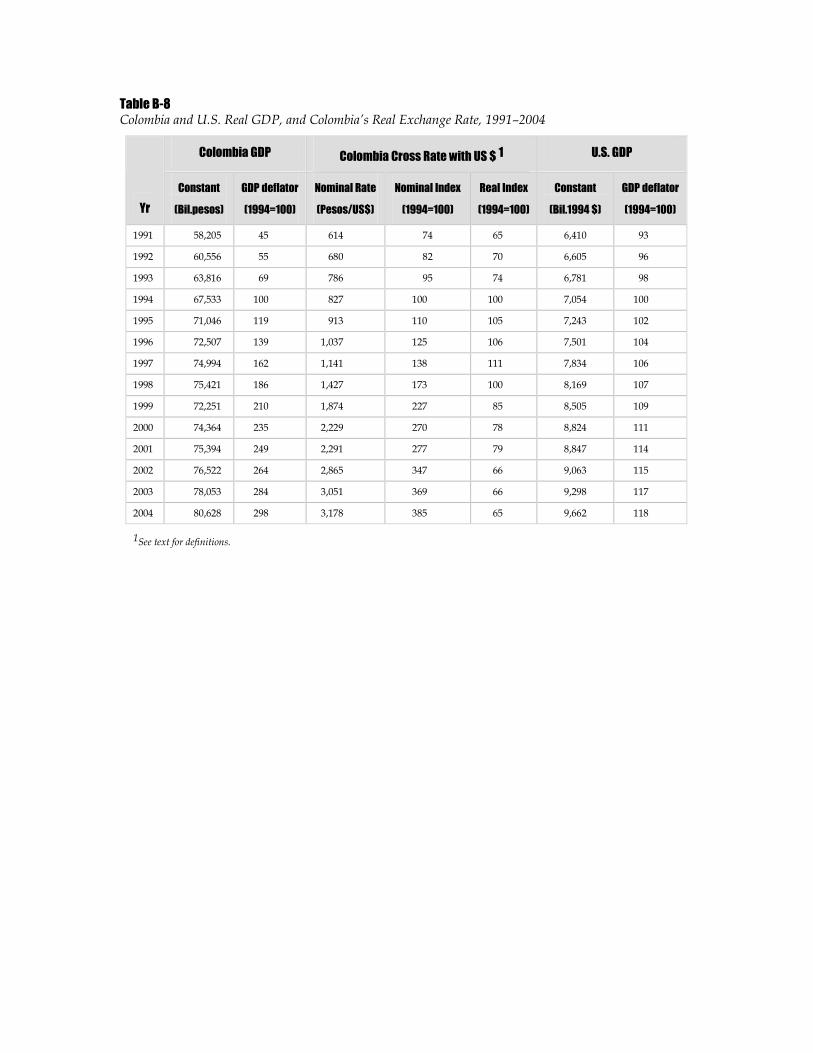
Table B-8Colombia and U.S. Real GDP, and Colombia’s Real Exchange Rate, 1991–2004
Colombia GDP Colombia Cross Rate with US $ 1 U.S. GDP
Yr
Constant
(Bil.pesos)
GDP deflator
(1994=100)
Nominal Rate
(Pesos/US$)
Nominal Index
(1994=100)
Real Index
(1994=100)
Constant
(Bil.1994 $)
GDP deflator
(1994=100)
1991 58,205 45 614 74 65 6,410 93
1992 60,556 55 680 82 70 6,605 96
1993 63,816 69 786 95 74 6,781 98
1994 67,533 100 827 100 100 7,054 100
1995 71,046 119 913 110 105 7,243 102
1996 72,507 139 1,037 125 106 7,501 104
1997 74,994 162 1,141 138 111 7,834 106
1998 75,421 186 1,427 173 100 8,169 107
1999 72,251 210 1,874 227 85 8,505 109
2000 74,364 235 2,229 270 78 8,824 111
2001 75,394 249 2,291 277 79 8,847 114
2002 76,522 264 2,865 347 66 9,063 115
2003 78,053 284 3,051 369 66 9,298 117
2004 80,628 298 3,178 385 65 9,662 118
1See text for definitions.

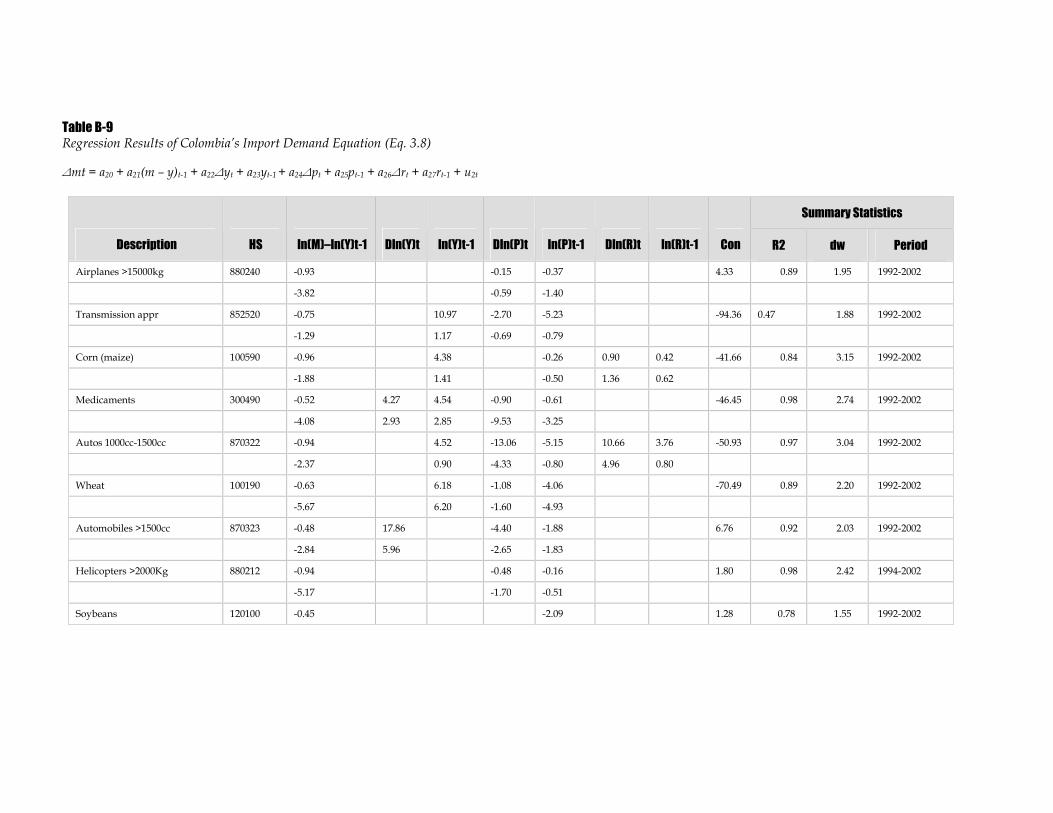
Table B-9Regression Results of Colombia’s Import Demand Equation (Eq. 3.8)
Δmt = a20 + a21(m – y)t-1 + a22Δyt + a23yt-1+ a24Δpt + a25pt-1 + a26Δrt + a27rt-1 + u2t
Summary Statistics
Description HS ln(M)–ln(Y)t-1 Dln(Y)t ln(Y)t-1 Dln(P)t ln(P)t-1 Dln(R)t ln(R)t-1 Con R2 dw Period
Airplanes >15000kg 880240 -0.93 -0.15 -0.37 4.33 0.89 1.95 1992-2002
-3.82 -0.59 -1.40
Transmission appr 852520 -0.75 10.97 -2.70 -5.23 -94.36 0.47 1.88 1992-2002
-1.29 1.17 -0.69 -0.79
Corn (maize) 100590 -0.96 4.38 -0.26 0.90 0.42 -41.66 0.84 3.15 1992-2002
-1.88 1.41 -0.50 1.36 0.62
Medicaments 300490 -0.52 4.27 4.54 -0.90 -0.61 -46.45 0.98 2.74 1992-2002
-4.08 2.93 2.85 -9.53 -3.25
Autos 1000cc-1500cc 870322 -0.94 4.52 -13.06 -5.15 10.66 3.76 -50.93 0.97 3.04 1992-2002
-2.37 0.90 -4.33 -0.80 4.96 0.80
Wheat 100190 -0.63 6.18 -1.08 -4.06 -70.49 0.89 2.20 1992-2002
-5.67 6.20 -1.60 -4.93
Automobiles >1500cc 870323 -0.48 17.86 -4.40 -1.88 6.76 0.92 2.03 1992-2002
-2.84 5.96 -2.65 -1.83
Helicopters >2000Kg 880212 -0.94 -0.48 -0.16 1.80 0.98 2.42 1994-2002
-5.17 -1.70 -0.51
Soybeans 120100 -0.45 -2.09 1.28 0.78 1.55 1992-2002
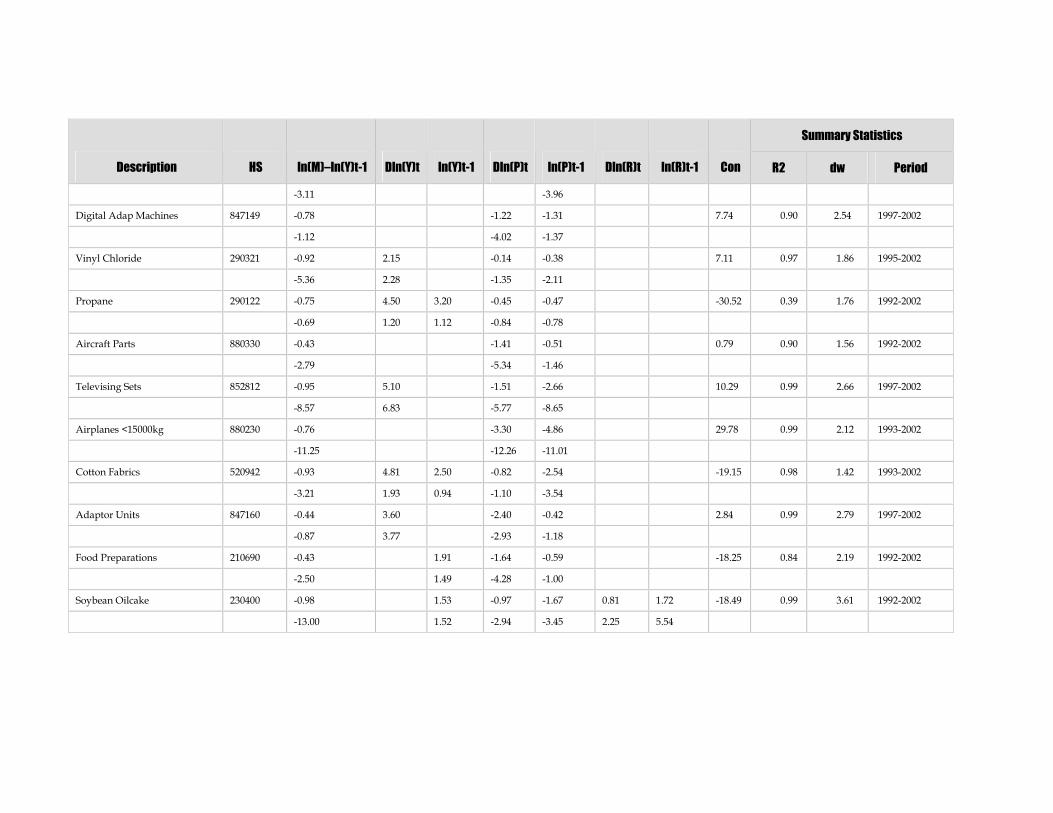
Summary Statistics
Description HS ln(M)–ln(Y)t-1 Dln(Y)t ln(Y)t-1 Dln(P)t ln(P)t-1 Dln(R)t ln(R)t-1 Con R2 dw Period
-3.11 -3.96
Digital AdapMachines 847149 -0.78 -1.22 -1.31 7.74 0.90 2.54 1997-2002
-1.12 -4.02 -1.37
Vinyl Chloride 290321 -0.92 2.15 -0.14 -0.38 7.11 0.97 1.86 1995-2002
-5.36 2.28 -1.35 -2.11
Propane 290122 -0.75 4.50 3.20 -0.45 -0.47 -30.52 0.39 1.76 1992-2002
-0.69 1.20 1.12 -0.84 -0.78
Aircraft Parts 880330 -0.43 -1.41 -0.51 0.79 0.90 1.56 1992-2002
-2.79 -5.34 -1.46
Televising Sets 852812 -0.95 5.10 -1.51 -2.66 10.29 0.99 2.66 1997-2002
-8.57 6.83 -5.77 -8.65
Airplanes <15000kg 880230 -0.76 -3.30 -4.86 29.78 0.99 2.12 1993-2002
-11.25 -12.26 -11.01
Cotton Fabrics 520942 -0.93 4.81 2.50 -0.82 -2.54 -19.15 0.98 1.42 1993-2002
-3.21 1.93 0.94 -1.10 -3.54
Adaptor Units 847160 -0.44 3.60 -2.40 -0.42 2.84 0.99 2.79 1997-2002
-0.87 3.77 -2.93 -1.18
Food Preparations 210690 -0.43 1.91 -1.64 -0.59 -18.25 0.84 2.19 1992-2002
-2.50 1.49 -4.28 -1.00
Soybean Oilcake 230400 -0.98 1.53 -0.97 -1.67 0.81 1.72 -18.49 0.99 3.61 1992-2002
-13.00 1.52 -2.94 -3.45 2.25 5.54
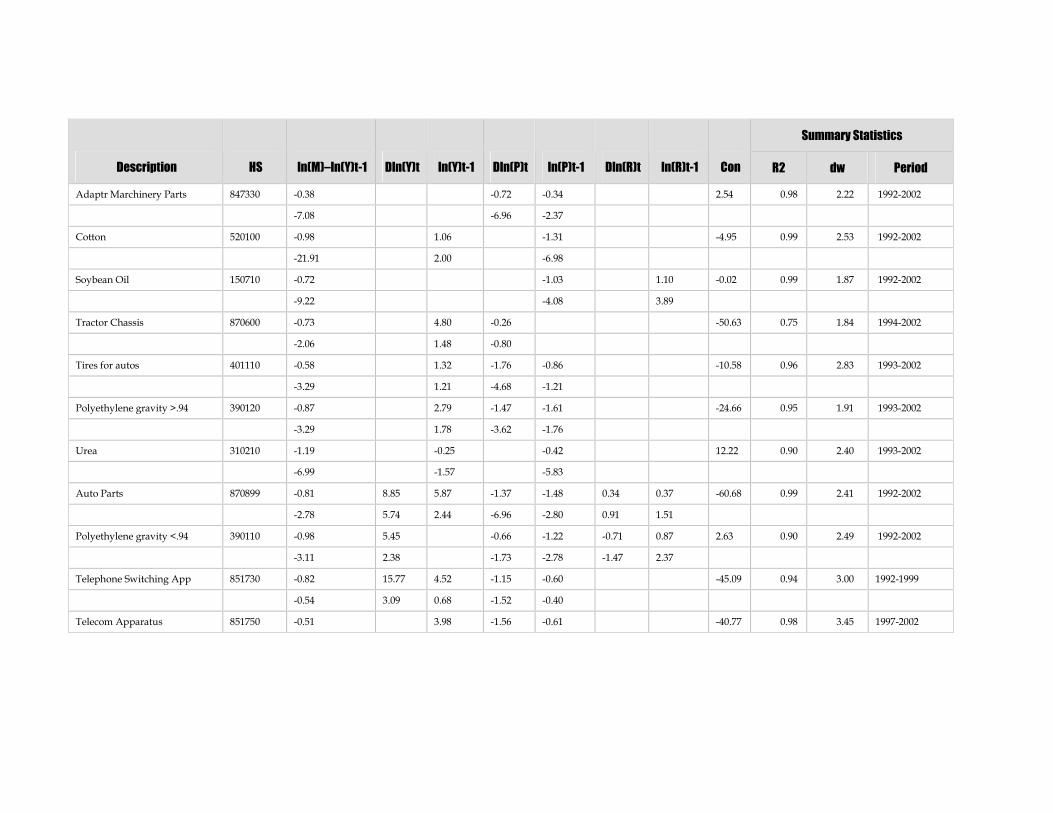
Summary Statistics
Description HS ln(M)–ln(Y)t-1 Dln(Y)t ln(Y)t-1 Dln(P)t ln(P)t-1 Dln(R)t ln(R)t-1 Con R2 dw Period
Adaptr Marchinery Parts 847330 -0.38 -0.72 -0.34 2.54 0.98 2.22 1992-2002
-7.08 -6.96 -2.37
Cotton 520100 -0.98 1.06 -1.31 -4.95 0.99 2.53 1992-2002
-21.91 2.00 -6.98
Soybean Oil 150710 -0.72 -1.03 1.10 -0.02 0.99 1.87 1992-2002
-9.22 -4.08 3.89
Tractor Chassis 870600 -0.73 4.80 -0.26 -50.63 0.75 1.84 1994-2002
-2.06 1.48 -0.80
Tires for autos 401110 -0.58 1.32 -1.76 -0.86 -10.58 0.96 2.83 1993-2002
-3.29 1.21 -4.68 -1.21
Polyethylene gravity >.94 390120 -0.87 2.79 -1.47 -1.61 -24.66 0.95 1.91 1993-2002
-3.29 1.78 -3.62 -1.76
Urea 310210 -1.19 -0.25 -0.42 12.22 0.90 2.40 1993-2002
-6.99 -1.57 -5.83
Auto Parts 870899 -0.81 8.85 5.87 -1.37 -1.48 0.34 0.37 -60.68 0.99 2.41 1992-2002
-2.78 5.74 2.44 -6.96 -2.80 0.91 1.51
Polyethylene gravity <.94 390110 -0.98 5.45 -0.66 -1.22 -0.71 0.87 2.63 0.90 2.49 1992-2002
-3.11 2.38 -1.73 -2.78 -1.47 2.37
Telephone Switching App 851730 -0.82 15.77 4.52 -1.15 -0.60 -45.09 0.94 3.00 1992-1999
-0.54 3.09 0.68 -1.52 -0.40
Telecom Apparatus 851750 -0.51 3.98 -1.56 -0.61 -40.77 0.98 3.45 1997-2002
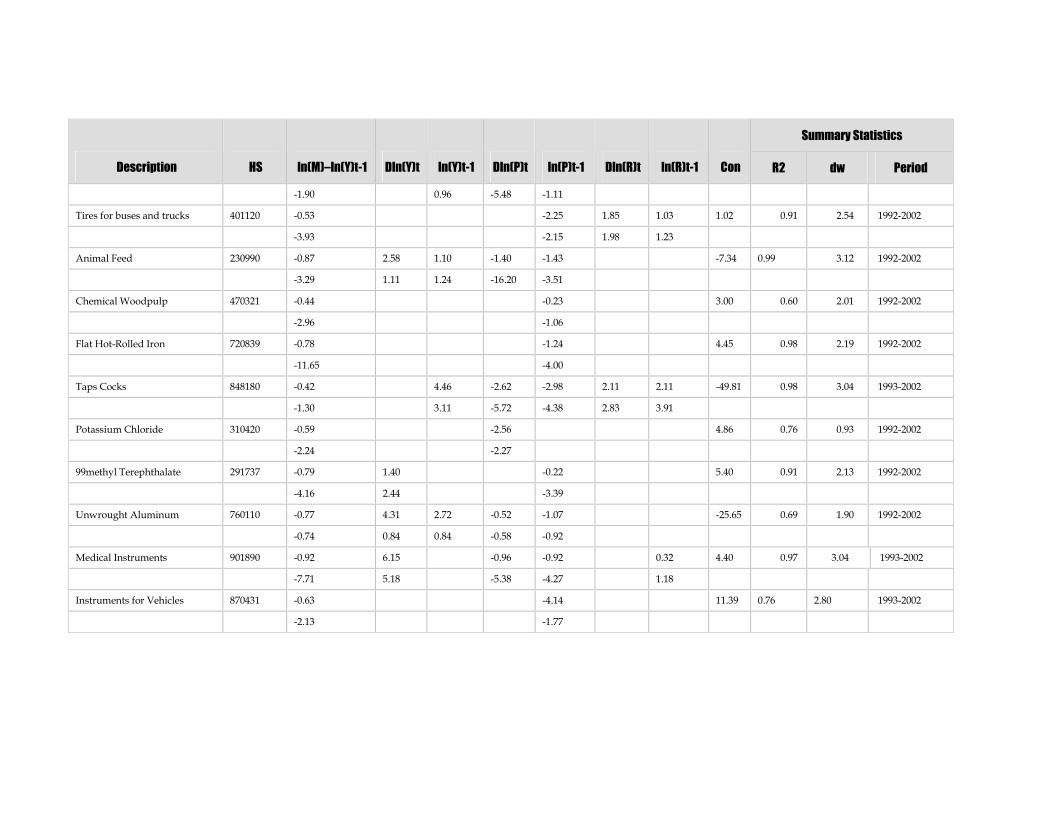
Summary Statistics
Description HS ln(M)–ln(Y)t-1 Dln(Y)t ln(Y)t-1 Dln(P)t ln(P)t-1 Dln(R)t ln(R)t-1 Con R2 dw Period
-1.90 0.96 -5.48 -1.11
Tires for buses and trucks 401120 -0.53 -2.25 1.85 1.03 1.02 0.91 2.54 1992-2002
-3.93 -2.15 1.98 1.23
Animal Feed 230990 -0.87 2.58 1.10 -1.40 -1.43 -7.34 0.99 3.12 1992-2002
-3.29 1.11 1.24 -16.20 -3.51
Chemical Woodpulp 470321 -0.44 -0.23 3.00 0.60 2.01 1992-2002
-2.96 -1.06
Flat Hot-Rolled Iron 720839 -0.78 -1.24 4.45 0.98 2.19 1992-2002
-11.65 -4.00
Taps Cocks 848180 -0.42 4.46 -2.62 -2.98 2.11 2.11 -49.81 0.98 3.04 1993-2002
-1.30 3.11 -5.72 -4.38 2.83 3.91
Potassium Chloride 310420 -0.59 -2.56 4.86 0.76 0.93 1992-2002
-2.24 -2.27
99methyl Terephthalate 291737 -0.79 1.40 -0.22 5.40 0.91 2.13 1992-2002
-4.16 2.44 -3.39
Unwrought Aluminum 760110 -0.77 4.31 2.72 -0.52 -1.07 -25.65 0.69 1.90 1992-2002
-0.74 0.84 0.84 -0.58 -0.92
Medical Instruments 901890 -0.92 6.15 -0.96 -0.92 0.32 4.40 0.97 3.04 1993-2002
-7.71 5.18 -5.38 -4.27 1.18
Instruments for Vehicles 870431 -0.63 -4.14 11.39 0.76 2.80 1993-2002
-2.13 -1.77
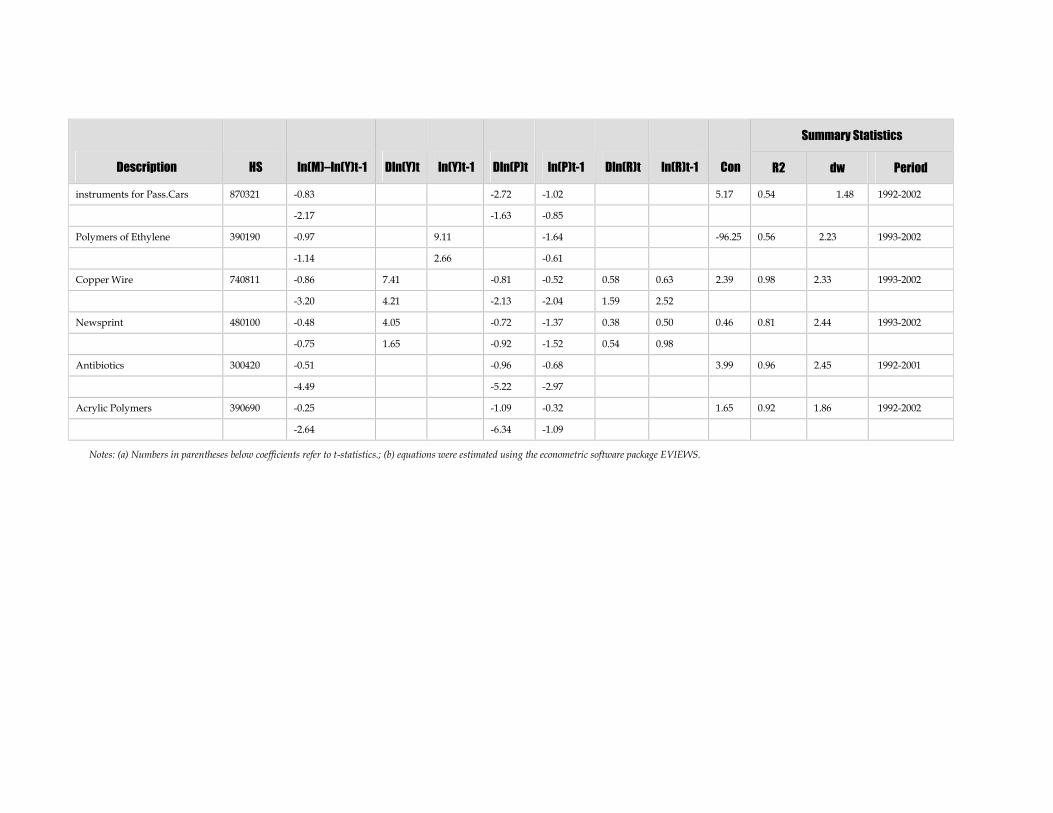
Summary Statistics
Description HS ln(M)–ln(Y)t-1 Dln(Y)t ln(Y)t-1 Dln(P)t ln(P)t-1 Dln(R)t ln(R)t-1 Con R2 dw Period
instruments for Pass.Cars 870321 -0.83 -2.72 -1.02 5.17 0.54 1.48 1992-2002
-2.17 -1.63 -0.85
Polymers of Ethylene 390190 -0.97 9.11 -1.64 -96.25 0.56 2.23 1993-2002
-1.14 2.66 -0.61
Copper Wire 740811 -0.86 7.41 -0.81 -0.52 0.58 0.63 2.39 0.98 2.33 1993-2002
-3.20 4.21 -2.13 -2.04 1.59 2.52
Newsprint 480100 -0.48 4.05 -0.72 -1.37 0.38 0.50 0.46 0.81 2.44 1993-2002
-0.75 1.65 -0.92 -1.52 0.54 0.98
Antibiotics 300420 -0.51 -0.96 -0.68 3.99 0.96 2.45 1992-2001
-4.49 -5.22 -2.97
Acrylic Polymers 390690 -0.25 -1.09 -0.32 1.65 0.92 1.86 1992-2002
-2.64 -6.34 -1.09
Notes: (a) Numbers in parentheses below coefficients refer to t-statistics.; (b) equations were estimated using the econometric software package EVIEWS.
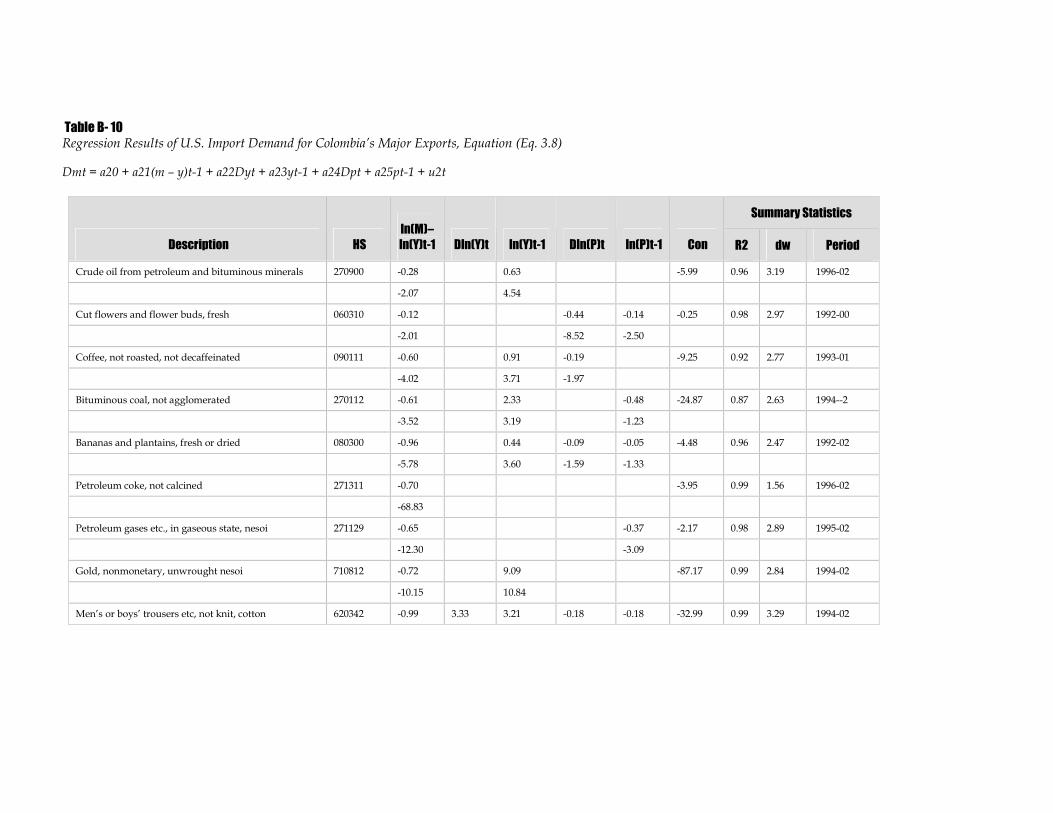
Table B- 10Regression Results of U.S. Import Demand for Colombia’s Major Exports, Equation (Eq. 3.8)
Dmt = a20 + a21(m – y)t-1 + a22Dyt + a23yt-1 + a24Dpt + a25pt-1 + u2t
Summary Statistics
Description HS
ln(M)–ln(Y)t-1 Dln(Y)t ln(Y)t-1 Dln(P)t ln(P)t-1 Con R2 dw Period
Crude oil from petroleum and bituminous minerals 270900 -0.28 0.63 -5.99 0.96 3.19 1996-02
-2.07 4.54
Cut flowers and flower buds, fresh 060310 -0.12 -0.44 -0.14 -0.25 0.98 2.97 1992-00
-2.01 -8.52 -2.50
Coffee, not roasted, not decaffeinated 090111 -0.60 0.91 -0.19 -9.25 0.92 2.77 1993-01
-4.02 3.71 -1.97
Bituminous coal, not agglomerated 270112 -0.61 2.33 -0.48 -24.87 0.87 2.63 1994--2
-3.52 3.19 -1.23
Bananas and plantains, fresh or dried 080300 -0.96 0.44 -0.09 -0.05 -4.48 0.96 2.47 1992-02
-5.78 3.60 -1.59 -1.33
Petroleum coke, not calcined 271311 -0.70 -3.95 0.99 1.56 1996-02
-68.83
Petroleum gases etc., in gaseous state, nesoi 271129 -0.65 -0.37 -2.17 0.98 2.89 1995-02
-12.30 -3.09
Gold, nonmonetary, unwrought nesoi 710812 -0.72 9.09 -87.17 0.99 2.84 1994-02
-10.15 10.84
Men’s or boys’ trousers etc, not knit, cotton 620342 -0.99 3.33 3.21 -0.18 -0.18 -32.99 0.99 3.29 1994-02
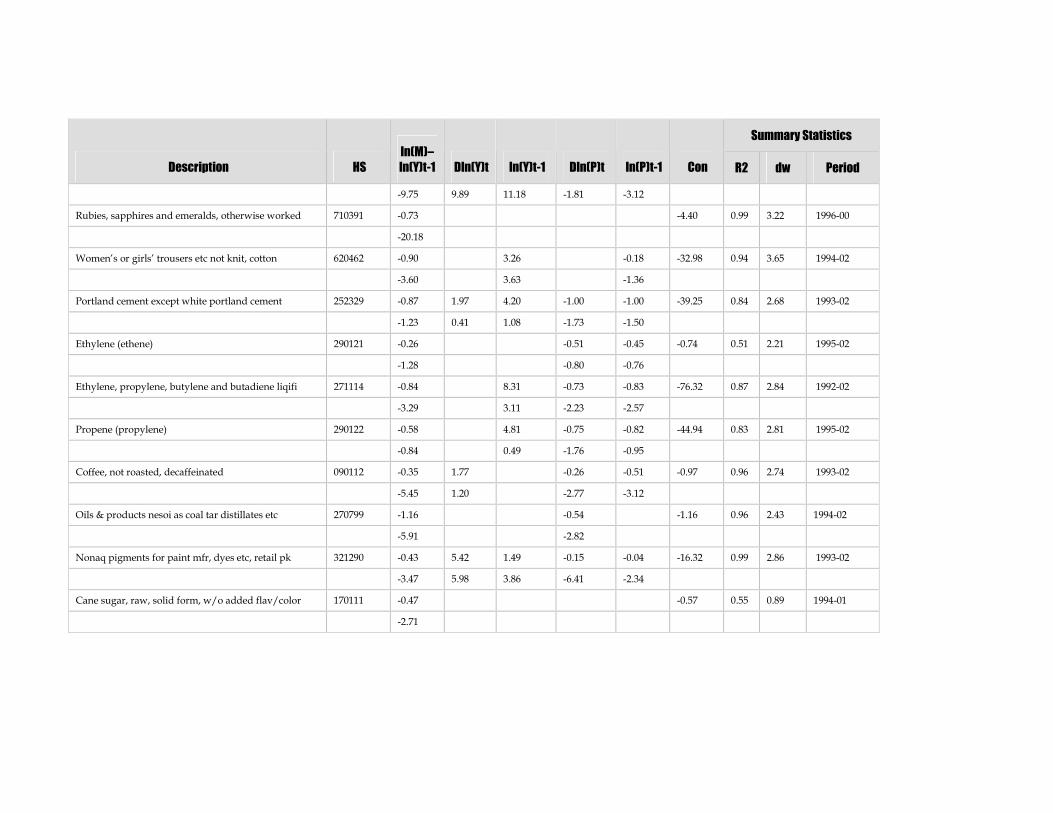
Summary Statistics
Description HS
ln(M)–ln(Y)t-1 Dln(Y)t ln(Y)t-1 Dln(P)t ln(P)t-1 Con R2 dw Period
-9.75 9.89 11.18 -1.81 -3.12
Rubies, sapphires and emeralds, otherwise worked 710391 -0.73 -4.40 0.99 3.22 1996-00
-20.18
Women’s or girls’ trousers etc not knit, cotton 620462 -0.90 3.26 -0.18 -32.98 0.94 3.65 1994-02
-3.60 3.63 -1.36
Portland cement except white portland cement 252329 -0.87 1.97 4.20 -1.00 -1.00 -39.25 0.84 2.68 1993-02
-1.23 0.41 1.08 -1.73 -1.50
Ethylene (ethene) 290121 -0.26 -0.51 -0.45 -0.74 0.51 2.21 1995-02
-1.28 -0.80 -0.76
Ethylene, propylene, butylene and butadiene liqifi 271114 -0.84 8.31 -0.73 -0.83 -76.32 0.87 2.84 1992-02
-3.29 3.11 -2.23 -2.57
Propene (propylene) 290122 -0.58 4.81 -0.75 -0.82 -44.94 0.83 2.81 1995-02
-0.84 0.49 -1.76 -0.95
Coffee, not roasted, decaffeinated 090112 -0.35 1.77 -0.26 -0.51 -0.97 0.96 2.74 1993-02
-5.45 1.20 -2.77 -3.12
Oils & products nesoi as coal tar distillates etc 270799 -1.16 -0.54 -1.16 0.96 2.43 1994-02
-5.91 -2.82
Nonaq pigments for paint mfr, dyes etc, retail pk 321290 -0.43 5.42 1.49 -0.15 -0.04 -16.32 0.99 2.86 1993-02
-3.47 5.98 3.86 -6.41 -2.34
Cane sugar, raw, solid form, w/o added flav/color 170111 -0.47 -0.57 0.55 0.89 1994-01
-2.71
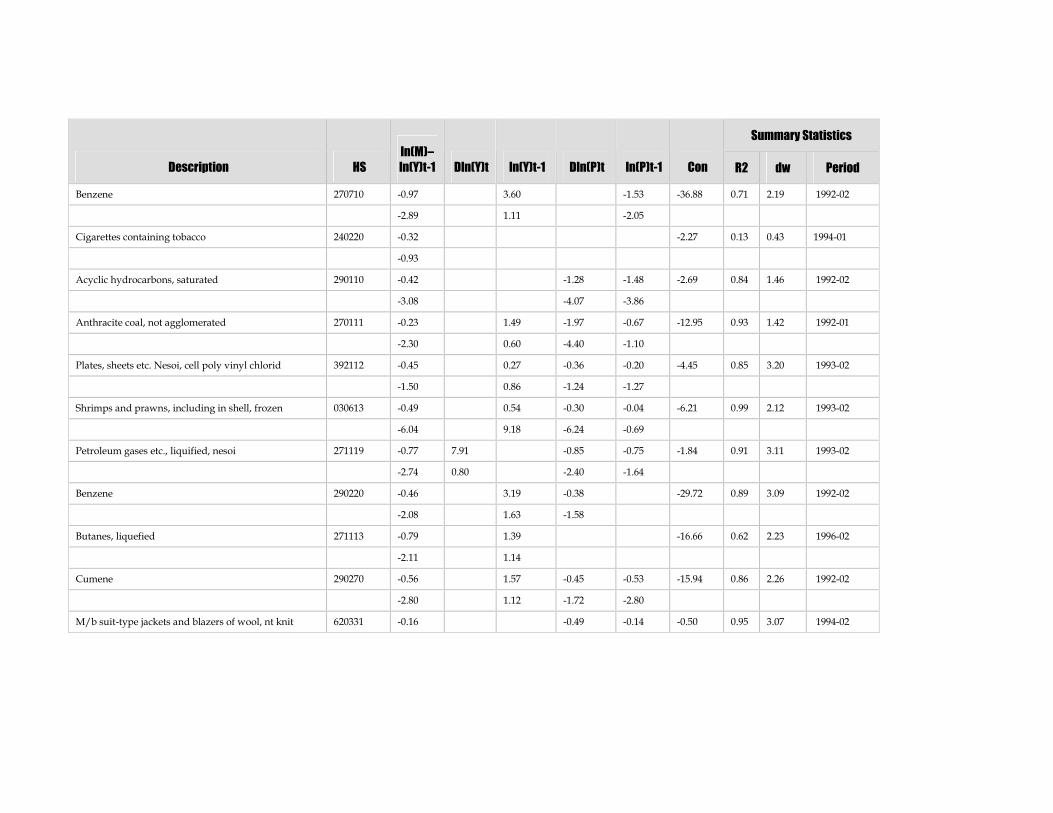
Summary Statistics
Description HS
ln(M)–ln(Y)t-1 Dln(Y)t ln(Y)t-1 Dln(P)t ln(P)t-1 Con R2 dw Period
Benzene 270710 -0.97 3.60 -1.53 -36.88 0.71 2.19 1992-02
-2.89 1.11 -2.05
Cigarettes containing tobacco 240220 -0.32 -2.27 0.13 0.43 1994-01
-0.93
Acyclic hydrocarbons, saturated 290110 -0.42 -1.28 -1.48 -2.69 0.84 1.46 1992-02
-3.08 -4.07 -3.86
Anthracite coal, not agglomerated 270111 -0.23 1.49 -1.97 -0.67 -12.95 0.93 1.42 1992-01
-2.30 0.60 -4.40 -1.10
Plates, sheets etc. Nesoi, cell poly vinyl chlorid 392112 -0.45 0.27 -0.36 -0.20 -4.45 0.85 3.20 1993-02
-1.50 0.86 -1.24 -1.27
Shrimps and prawns, including in shell, frozen 030613 -0.49 0.54 -0.30 -0.04 -6.21 0.99 2.12 1993-02
-6.04 9.18 -6.24 -0.69
Petroleum gases etc., liquified, nesoi 271119 -0.77 7.91 -0.85 -0.75 -1.84 0.91 3.11 1993-02
-2.74 0.80 -2.40 -1.64
Benzene 290220 -0.46 3.19 -0.38 -29.72 0.89 3.09 1992-02
-2.08 1.63 -1.58
Butanes, liquefied 271113 -0.79 1.39 -16.66 0.62 2.23 1996-02
-2.11 1.14
Cumene 290270 -0.56 1.57 -0.45 -0.53 -15.94 0.86 2.26 1992-02
-2.80 1.12 -1.72 -2.80
M/b suit-type jackets and blazers of wool, nt knit 620331 -0.16 -0.49 -0.14 -0.50 0.95 3.07 1994-02
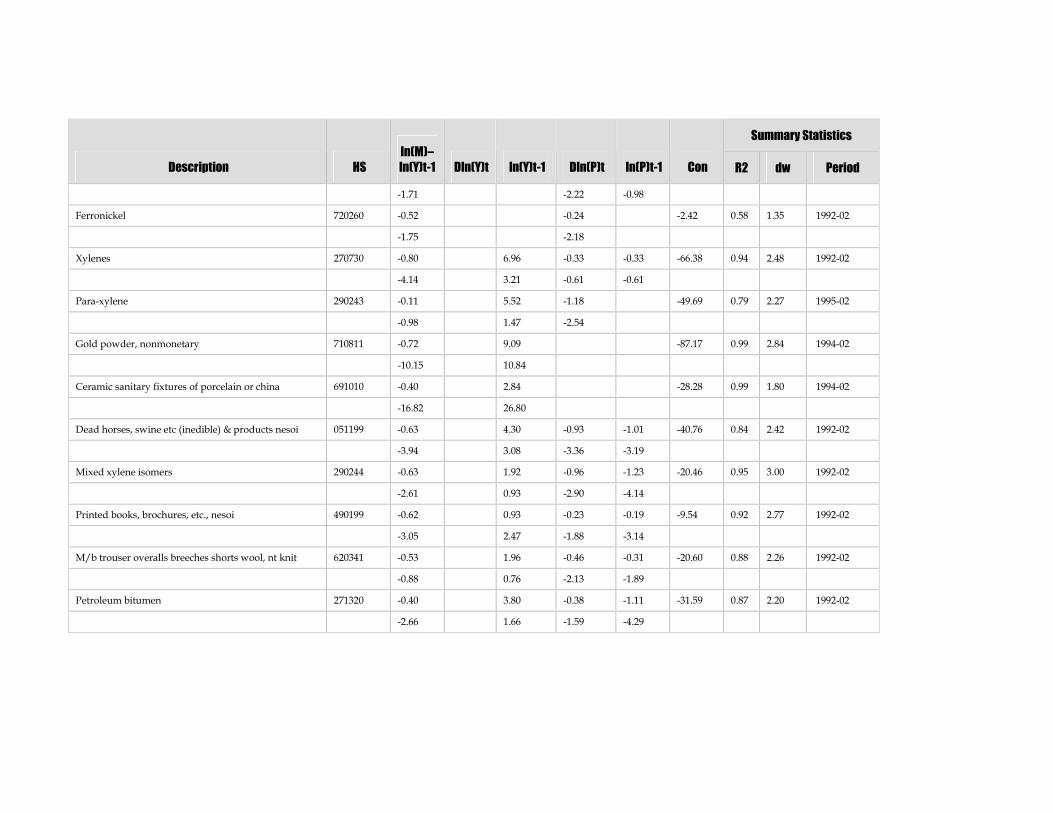
Summary Statistics
Description HS
ln(M)–ln(Y)t-1 Dln(Y)t ln(Y)t-1 Dln(P)t ln(P)t-1 Con R2 dw Period
-1.71 -2.22 -0.98
Ferronickel 720260 -0.52 -0.24 -2.42 0.58 1.35 1992-02
-1.75 -2.18
Xylenes 270730 -0.80 6.96 -0.33 -0.33 -66.38 0.94 2.48 1992-02
-4.14 3.21 -0.61 -0.61
Para-xylene 290243 -0.11 5.52 -1.18 -49.69 0.79 2.27 1995-02
-0.98 1.47 -2.54
Gold powder, nonmonetary 710811 -0.72 9.09 -87.17 0.99 2.84 1994-02
-10.15 10.84
Ceramic sanitary fixtures of porcelain or china 691010 -0.40 2.84 -28.28 0.99 1.80 1994-02
-16.82 26.80
Dead horses, swine etc (inedible) & products nesoi 051199 -0.63 4.30 -0.93 -1.01 -40.76 0.84 2.42 1992-02
-3.94 3.08 -3.36 -3.19
Mixed xylene isomers 290244 -0.63 1.92 -0.96 -1.23 -20.46 0.95 3.00 1992-02
-2.61 0.93 -2.90 -4.14
Printed books, brochures, etc., nesoi 490199 -0.62 0.93 -0.23 -0.19 -9.54 0.92 2.77 1992-02
-3.05 2.47 -1.88 -3.14
M/b trouser overalls breeches shorts wool, nt knit 620341 -0.53 1.96 -0.46 -0.31 -20.60 0.88 2.26 1992-02
-0.88 0.76 -2.13 -1.89
Petroleum bitumen 271320 -0.40 3.80 -0.38 -1.11 -31.59 0.87 2.20 1992-02
-2.66 1.66 -1.59 -4.29
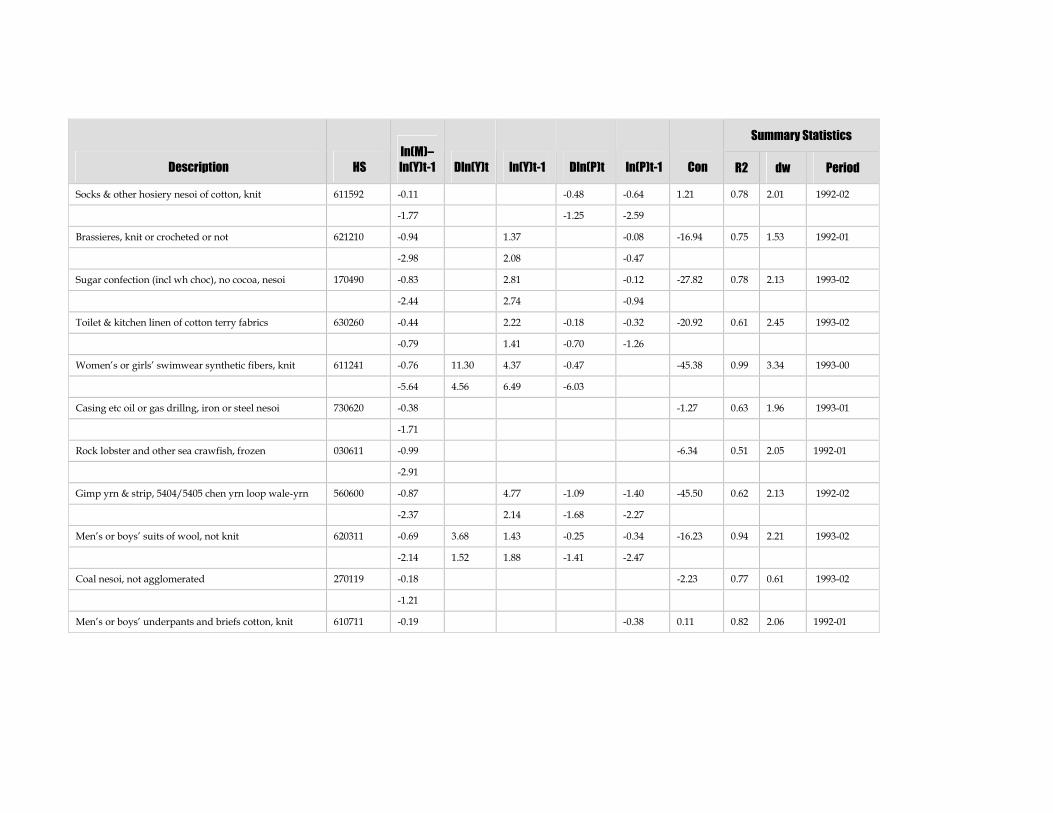
Summary Statistics
Description HS
ln(M)–ln(Y)t-1 Dln(Y)t ln(Y)t-1 Dln(P)t ln(P)t-1 Con R2 dw Period
Socks & other hosiery nesoi of cotton, knit 611592 -0.11 -0.48 -0.64 1.21 0.78 2.01 1992-02
-1.77 -1.25 -2.59
Brassieres, knit or crocheted or not 621210 -0.94 1.37 -0.08 -16.94 0.75 1.53 1992-01
-2.98 2.08 -0.47
Sugar confection (incl wh choc), no cocoa, nesoi 170490 -0.83 2.81 -0.12 -27.82 0.78 2.13 1993-02
-2.44 2.74 -0.94
Toilet & kitchen linen of cotton terry fabrics 630260 -0.44 2.22 -0.18 -0.32 -20.92 0.61 2.45 1993-02
-0.79 1.41 -0.70 -1.26
Women’s or girls’ swimwear synthetic fibers, knit 611241 -0.76 11.30 4.37 -0.47 -45.38 0.99 3.34 1993-00
-5.64 4.56 6.49 -6.03
Casing etc oil or gas drillng, iron or steel nesoi 730620 -0.38 -1.27 0.63 1.96 1993-01
-1.71
Rock lobster and other sea crawfish, frozen 030611 -0.99 -6.34 0.51 2.05 1992-01
-2.91
Gimp yrn & strip, 5404/5405 chen yrn loop wale-yrn 560600 -0.87 4.77 -1.09 -1.40 -45.50 0.62 2.13 1992-02
-2.37 2.14 -1.68 -2.27
Men’s or boys’ suits of wool, not knit 620311 -0.69 3.68 1.43 -0.25 -0.34 -16.23 0.94 2.21 1993-02
-2.14 1.52 1.88 -1.41 -2.47
Coal nesoi, not agglomerated 270119 -0.18 -2.23 0.77 0.61 1993-02
-1.21
Men’s or boys’ underpants and briefs cotton, knit 610711 -0.19 -0.38 0.11 0.82 2.06 1992-01
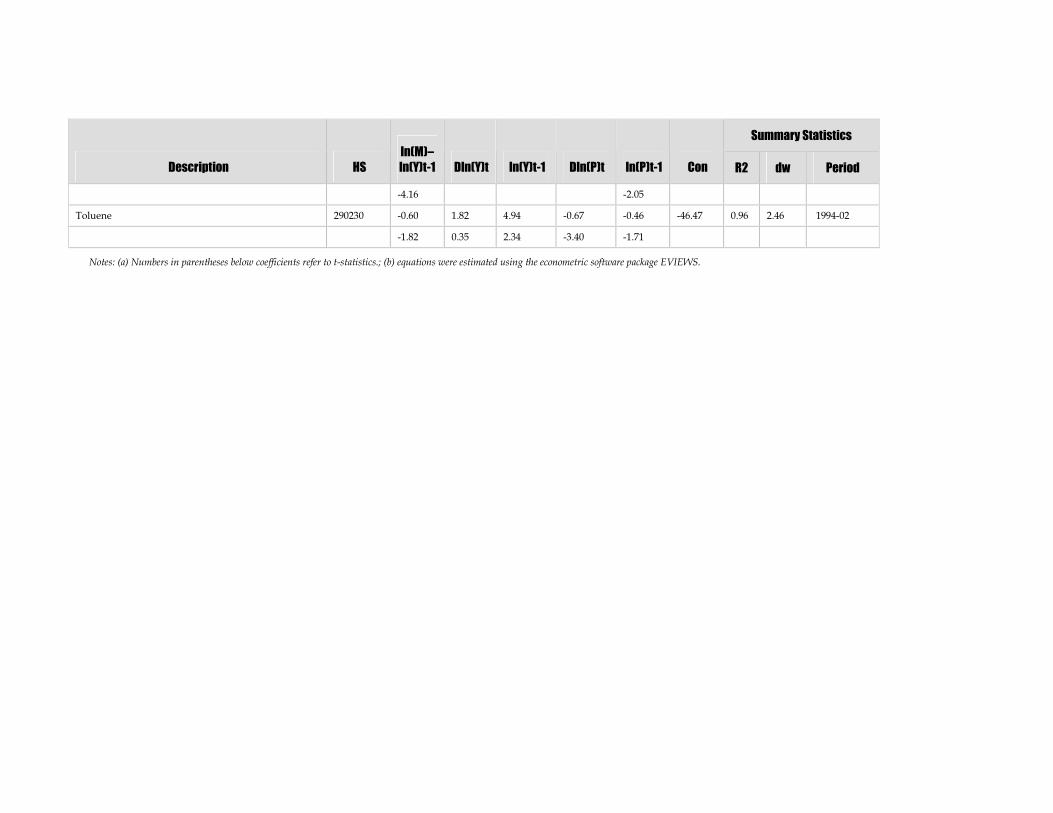
Summary Statistics
Description HS
ln(M)–ln(Y)t-1 Dln(Y)t ln(Y)t-1 Dln(P)t ln(P)t-1 Con R2 dw Period
-4.16 -2.05
Toluene 290230 -0.60 1.82 4.94 -0.67 -0.46 -46.47 0.96 2.46 1994-02
-1.82 0.35 2.34 -3.40 -1.71
Notes: (a) Numbers in parentheses below coefficients refer to t-statistics.; (b) equations were estimated using the econometric software package EVIEWS.
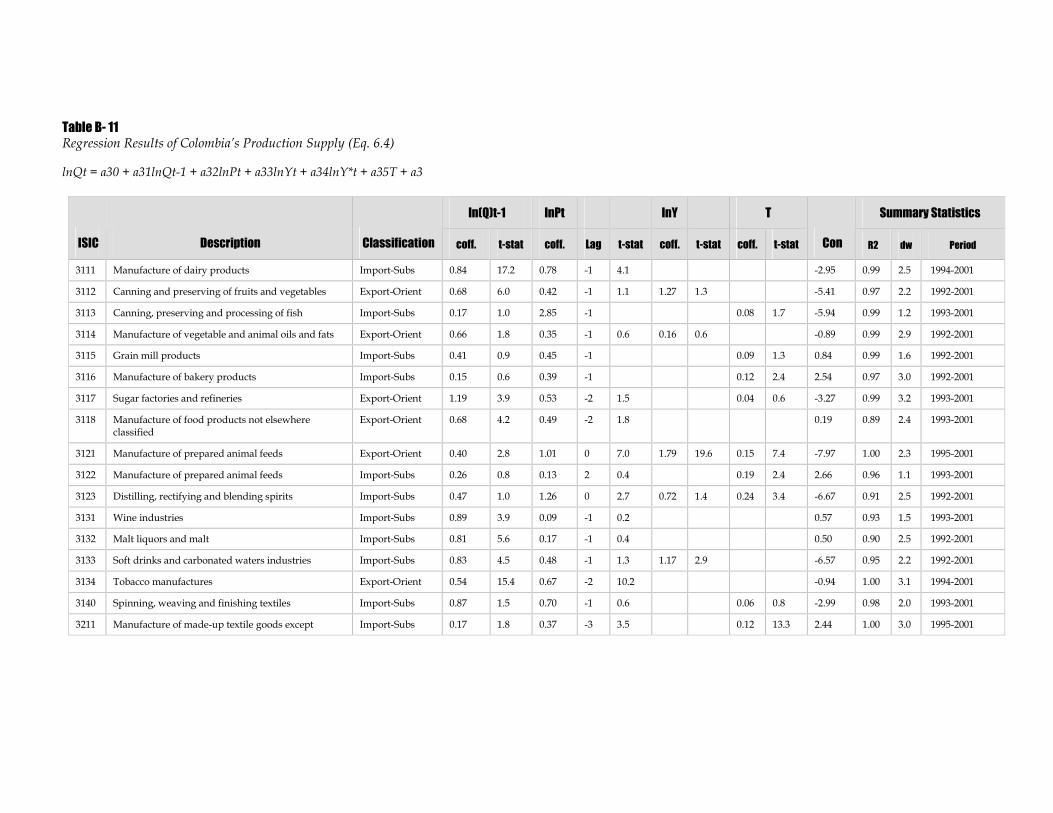
Table B- 11Regression Results of Colombia’s Production Supply (Eq. 6.4)
lnQt = a30 + a31lnQt-1 + a32lnPt + a33lnYt + a34lnY*t + a35T + a3
ln(Q)t-1 lnPt lnY T Summary Statistics
ISIC Description Classification coff. t-stat coff. Lag t-stat coff. t-stat coff. t-stat Con R2 dw Period
3111 Manufacture of dairy products Import-Subs 0.84 17.2 0.78 -1 4.1 -2.95 0.99 2.5 1994-2001
3112 Canning and preserving of fruits and vegetables Export-Orient 0.68 6.0 0.42 -1 1.1 1.27 1.3 -5.41 0.97 2.2 1992-2001
3113 Canning, preserving and processing of fish Import-Subs 0.17 1.0 2.85 -1 0.08 1.7 -5.94 0.99 1.2 1993-2001
3114 Manufacture of vegetable and animal oils and fats Export-Orient 0.66 1.8 0.35 -1 0.6 0.16 0.6 -0.89 0.99 2.9 1992-2001
3115 Grain mill products Import-Subs 0.41 0.9 0.45 -1 0.09 1.3 0.84 0.99 1.6 1992-2001
3116 Manufacture of bakery products Import-Subs 0.15 0.6 0.39 -1 0.12 2.4 2.54 0.97 3.0 1992-2001
3117 Sugar factories and refineries Export-Orient 1.19 3.9 0.53 -2 1.5 0.04 0.6 -3.27 0.99 3.2 1993-2001
3118 Manufacture of food products not elsewhereclassified
Export-Orient 0.68 4.2 0.49 -2 1.8 0.19 0.89 2.4 1993-2001
3121 Manufacture of prepared animal feeds Export-Orient 0.40 2.8 1.01 0 7.0 1.79 19.6 0.15 7.4 -7.97 1.00 2.3 1995-2001
3122 Manufacture of prepared animal feeds Import-Subs 0.26 0.8 0.13 2 0.4 0.19 2.4 2.66 0.96 1.1 1993-2001
3123 Distilling, rectifying and blending spirits Import-Subs 0.47 1.0 1.26 0 2.7 0.72 1.4 0.24 3.4 -6.67 0.91 2.5 1992-2001
3131 Wine industries Import-Subs 0.89 3.9 0.09 -1 0.2 0.57 0.93 1.5 1993-2001
3132 Malt liquors and malt Import-Subs 0.81 5.6 0.17 -1 0.4 0.50 0.90 2.5 1992-2001
3133 Soft drinks and carbonated waters industries Import-Subs 0.83 4.5 0.48 -1 1.3 1.17 2.9 -6.57 0.95 2.2 1992-2001
3134 Tobacco manufactures Export-Orient 0.54 15.4 0.67 -2 10.2 -0.94 1.00 3.1 1994-2001
3140 Spinning, weaving and finishing textiles Import-Subs 0.87 1.5 0.70 -1 0.6 0.06 0.8 -2.99 0.98 2.0 1993-2001
3211 Manufacture of made-up textile goods except Import-Subs 0.17 1.8 0.37 -3 3.5 0.12 13.3 2.44 1.00 3.0 1995-2001
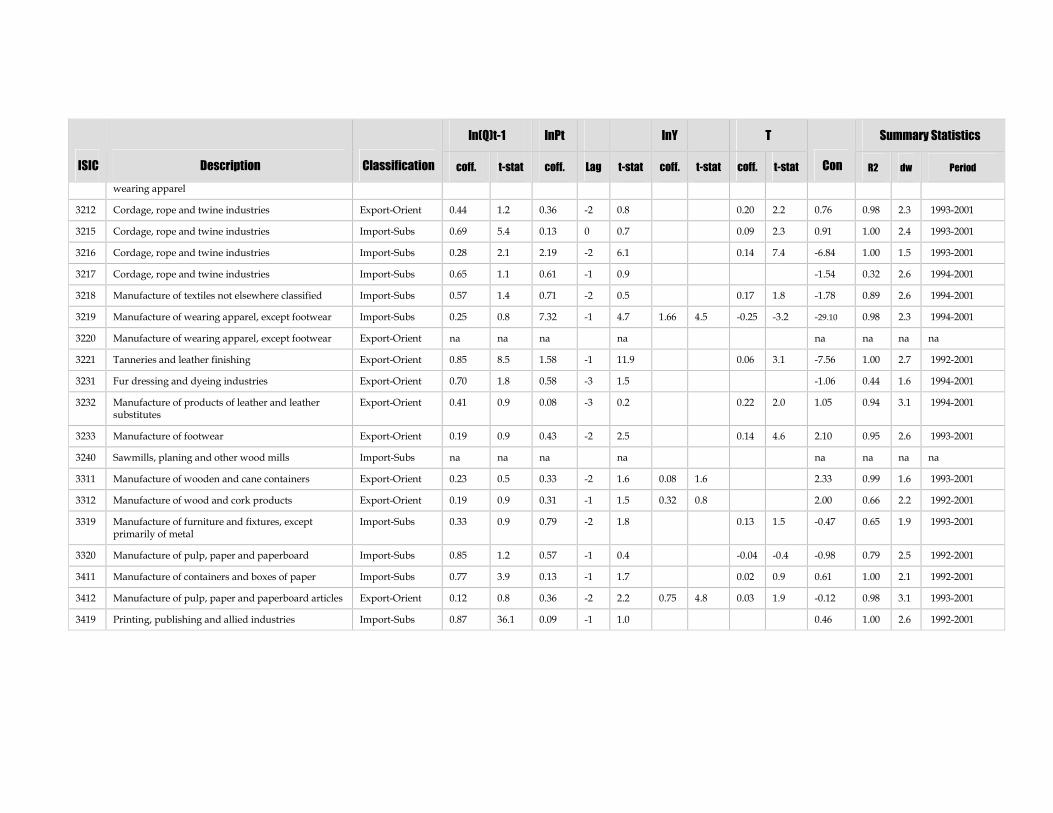
ln(Q)t-1 lnPt lnY T Summary Statistics
ISIC Description Classification coff. t-stat coff. Lag t-stat coff. t-stat coff. t-stat Con R2 dw Period
wearing apparel
3212 Cordage, rope and twine industries Export-Orient 0.44 1.2 0.36 -2 0.8 0.20 2.2 0.76 0.98 2.3 1993-2001
3215 Cordage, rope and twine industries Import-Subs 0.69 5.4 0.13 0 0.7 0.09 2.3 0.91 1.00 2.4 1993-2001
3216 Cordage, rope and twine industries Import-Subs 0.28 2.1 2.19 -2 6.1 0.14 7.4 -6.84 1.00 1.5 1993-2001
3217 Cordage, rope and twine industries Import-Subs 0.65 1.1 0.61 -1 0.9 -1.54 0.32 2.6 1994-2001
3218 Manufacture of textiles not elsewhere classified Import-Subs 0.57 1.4 0.71 -2 0.5 0.17 1.8 -1.78 0.89 2.6 1994-2001
3219 Manufacture of wearing apparel, except footwear Import-Subs 0.25 0.8 7.32 -1 4.7 1.66 4.5 -0.25 -3.2 -29.10 0.98 2.3 1994-2001
3220 Manufacture of wearing apparel, except footwear Export-Orient na na na na na na na na
3221 Tanneries and leather finishing Export-Orient 0.85 8.5 1.58 -1 11.9 0.06 3.1 -7.56 1.00 2.7 1992-2001
3231 Fur dressing and dyeing industries Export-Orient 0.70 1.8 0.58 -3 1.5 -1.06 0.44 1.6 1994-2001
3232 Manufacture of products of leather and leathersubstitutes
Export-Orient 0.41 0.9 0.08 -3 0.2 0.22 2.0 1.05 0.94 3.1 1994-2001
3233 Manufacture of footwear Export-Orient 0.19 0.9 0.43 -2 2.5 0.14 4.6 2.10 0.95 2.6 1993-2001
3240 Sawmills, planing and other wood mills Import-Subs na na na na na na na na
3311 Manufacture of wooden and cane containers Export-Orient 0.23 0.5 0.33 -2 1.6 0.08 1.6 2.33 0.99 1.6 1993-2001
3312 Manufacture of wood and cork products Export-Orient 0.19 0.9 0.31 -1 1.5 0.32 0.8 2.00 0.66 2.2 1992-2001
3319 Manufacture of furniture and fixtures, exceptprimarily of metal
Import-Subs 0.33 0.9 0.79 -2 1.8 0.13 1.5 -0.47 0.65 1.9 1993-2001
3320 Manufacture of pulp, paper and paperboard Import-Subs 0.85 1.2 0.57 -1 0.4 -0.04 -0.4 -0.98 0.79 2.5 1992-2001
3411 Manufacture of containers and boxes of paper Import-Subs 0.77 3.9 0.13 -1 1.7 0.02 0.9 0.61 1.00 2.1 1992-2001
3412 Manufacture of pulp, paper and paperboard articles Export-Orient 0.12 0.8 0.36 -2 2.2 0.75 4.8 0.03 1.9 -0.12 0.98 3.1 1993-2001
3419 Printing, publishing and allied industries Import-Subs 0.87 36.1 0.09 -1 1.0 0.46 1.00 2.6 1992-2001
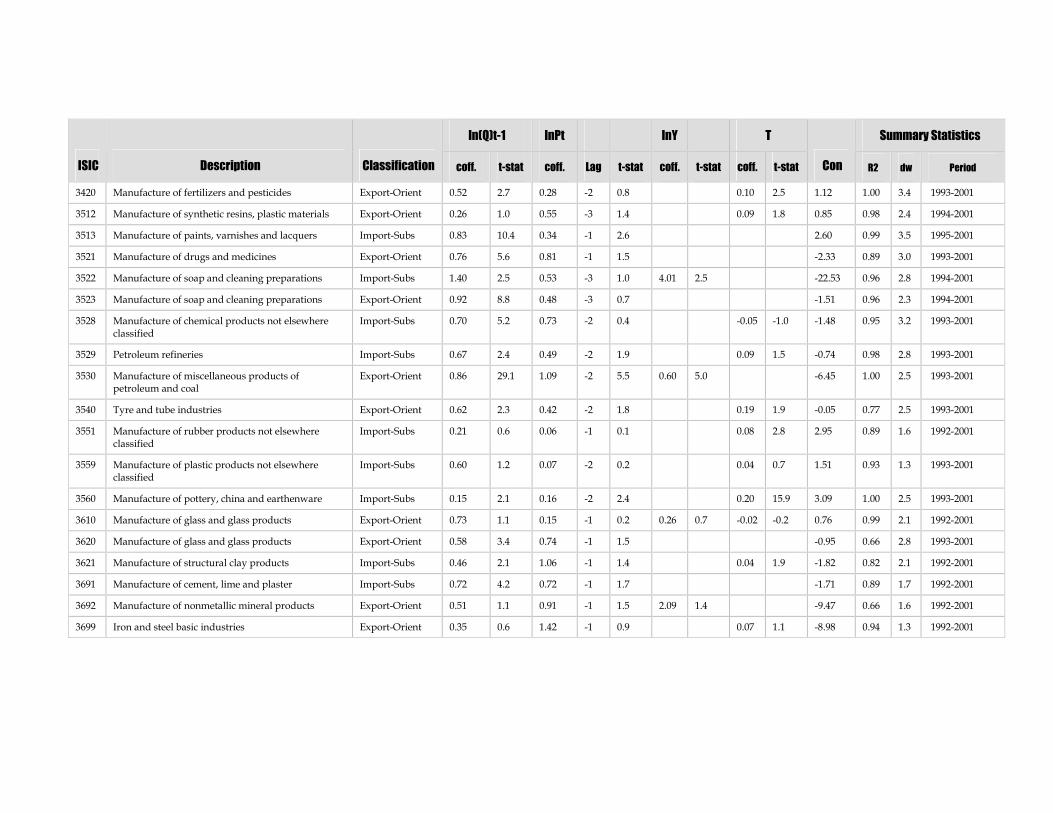
ln(Q)t-1 lnPt lnY T Summary Statistics
ISIC Description Classification coff. t-stat coff. Lag t-stat coff. t-stat coff. t-stat Con R2 dw Period
3420 Manufacture of fertilizers and pesticides Export-Orient 0.52 2.7 0.28 -2 0.8 0.10 2.5 1.12 1.00 3.4 1993-2001
3512 Manufacture of synthetic resins, plastic materials Export-Orient 0.26 1.0 0.55 -3 1.4 0.09 1.8 0.85 0.98 2.4 1994-2001
3513 Manufacture of paints, varnishes and lacquers Import-Subs 0.83 10.4 0.34 -1 2.6 2.60 0.99 3.5 1995-2001
3521 Manufacture of drugs and medicines Export-Orient 0.76 5.6 0.81 -1 1.5 -2.33 0.89 3.0 1993-2001
3522 Manufacture of soap and cleaning preparations Import-Subs 1.40 2.5 0.53 -3 1.0 4.01 2.5 -22.53 0.96 2.8 1994-2001
3523 Manufacture of soap and cleaning preparations Export-Orient 0.92 8.8 0.48 -3 0.7 -1.51 0.96 2.3 1994-2001
3528 Manufacture of chemical products not elsewhereclassified
Import-Subs 0.70 5.2 0.73 -2 0.4 -0.05 -1.0 -1.48 0.95 3.2 1993-2001
3529 Petroleum refineries Import-Subs 0.67 2.4 0.49 -2 1.9 0.09 1.5 -0.74 0.98 2.8 1993-2001
3530 Manufacture of miscellaneous products ofpetroleum and coal
Export-Orient 0.86 29.1 1.09 -2 5.5 0.60 5.0 -6.45 1.00 2.5 1993-2001
3540 Tyre and tube industries Export-Orient 0.62 2.3 0.42 -2 1.8 0.19 1.9 -0.05 0.77 2.5 1993-2001
3551 Manufacture of rubber products not elsewhereclassified
Import-Subs 0.21 0.6 0.06 -1 0.1 0.08 2.8 2.95 0.89 1.6 1992-2001
3559 Manufacture of plastic products not elsewhereclassified
Import-Subs 0.60 1.2 0.07 -2 0.2 0.04 0.7 1.51 0.93 1.3 1993-2001
3560 Manufacture of pottery, china and earthenware Import-Subs 0.15 2.1 0.16 -2 2.4 0.20 15.9 3.09 1.00 2.5 1993-2001
3610 Manufacture of glass and glass products Export-Orient 0.73 1.1 0.15 -1 0.2 0.26 0.7 -0.02 -0.2 0.76 0.99 2.1 1992-2001
3620 Manufacture of glass and glass products Export-Orient 0.58 3.4 0.74 -1 1.5 -0.95 0.66 2.8 1993-2001
3621 Manufacture of structural clay products Import-Subs 0.46 2.1 1.06 -1 1.4 0.04 1.9 -1.82 0.82 2.1 1992-2001
3691 Manufacture of cement, lime and plaster Import-Subs 0.72 4.2 0.72 -1 1.7 -1.71 0.89 1.7 1992-2001
3692 Manufacture of nonmetallic mineral products Export-Orient 0.51 1.1 0.91 -1 1.5 2.09 1.4 -9.47 0.66 1.6 1992-2001
3699 Iron and steel basic industries Export-Orient 0.35 0.6 1.42 -1 0.9 0.07 1.1 -8.98 0.94 1.3 1992-2001
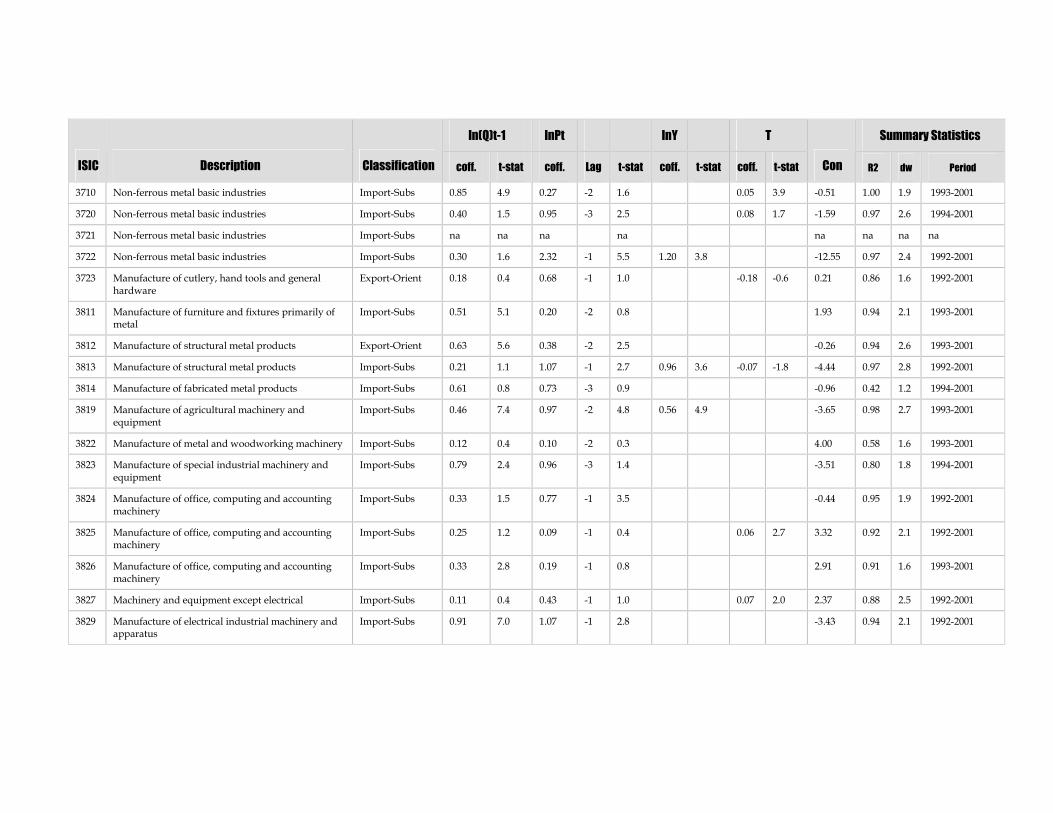
ln(Q)t-1 lnPt lnY T Summary Statistics
ISIC Description Classification coff. t-stat coff. Lag t-stat coff. t-stat coff. t-stat Con R2 dw Period
3710 Non-ferrous metal basic industries Import-Subs 0.85 4.9 0.27 -2 1.6 0.05 3.9 -0.51 1.00 1.9 1993-2001
3720 Non-ferrous metal basic industries Import-Subs 0.40 1.5 0.95 -3 2.5 0.08 1.7 -1.59 0.97 2.6 1994-2001
3721 Non-ferrous metal basic industries Import-Subs na na na na na na na na
3722 Non-ferrous metal basic industries Import-Subs 0.30 1.6 2.32 -1 5.5 1.20 3.8 -12.55 0.97 2.4 1992-2001
3723 Manufacture of cutlery, hand tools and generalhardware
Export-Orient 0.18 0.4 0.68 -1 1.0 -0.18 -0.6 0.21 0.86 1.6 1992-2001
3811 Manufacture of furniture and fixtures primarily ofmetal
Import-Subs 0.51 5.1 0.20 -2 0.8 1.93 0.94 2.1 1993-2001
3812 Manufacture of structural metal products Export-Orient 0.63 5.6 0.38 -2 2.5 -0.26 0.94 2.6 1993-2001
3813 Manufacture of structural metal products Import-Subs 0.21 1.1 1.07 -1 2.7 0.96 3.6 -0.07 -1.8 -4.44 0.97 2.8 1992-2001
3814 Manufacture of fabricated metal products Import-Subs 0.61 0.8 0.73 -3 0.9 -0.96 0.42 1.2 1994-2001
3819 Manufacture of agricultural machinery andequipment
Import-Subs 0.46 7.4 0.97 -2 4.8 0.56 4.9 -3.65 0.98 2.7 1993-2001
3822 Manufacture of metal and woodworking machinery Import-Subs 0.12 0.4 0.10 -2 0.3 4.00 0.58 1.6 1993-2001
3823 Manufacture of special industrial machinery andequipment
Import-Subs 0.79 2.4 0.96 -3 1.4 -3.51 0.80 1.8 1994-2001
3824 Manufacture of office, computing and accountingmachinery
Import-Subs 0.33 1.5 0.77 -1 3.5 -0.44 0.95 1.9 1992-2001
3825 Manufacture of office, computing and accountingmachinery
Import-Subs 0.25 1.2 0.09 -1 0.4 0.06 2.7 3.32 0.92 2.1 1992-2001
3826 Manufacture of office, computing and accountingmachinery
Import-Subs 0.33 2.8 0.19 -1 0.8 2.91 0.91 1.6 1993-2001
3827 Machinery and equipment except electrical Import-Subs 0.11 0.4 0.43 -1 1.0 0.07 2.0 2.37 0.88 2.5 1992-2001
3829 Manufacture of electrical industrial machinery andapparatus
Import-Subs 0.91 7.0 1.07 -1 2.8 -3.43 0.94 2.1 1992-2001
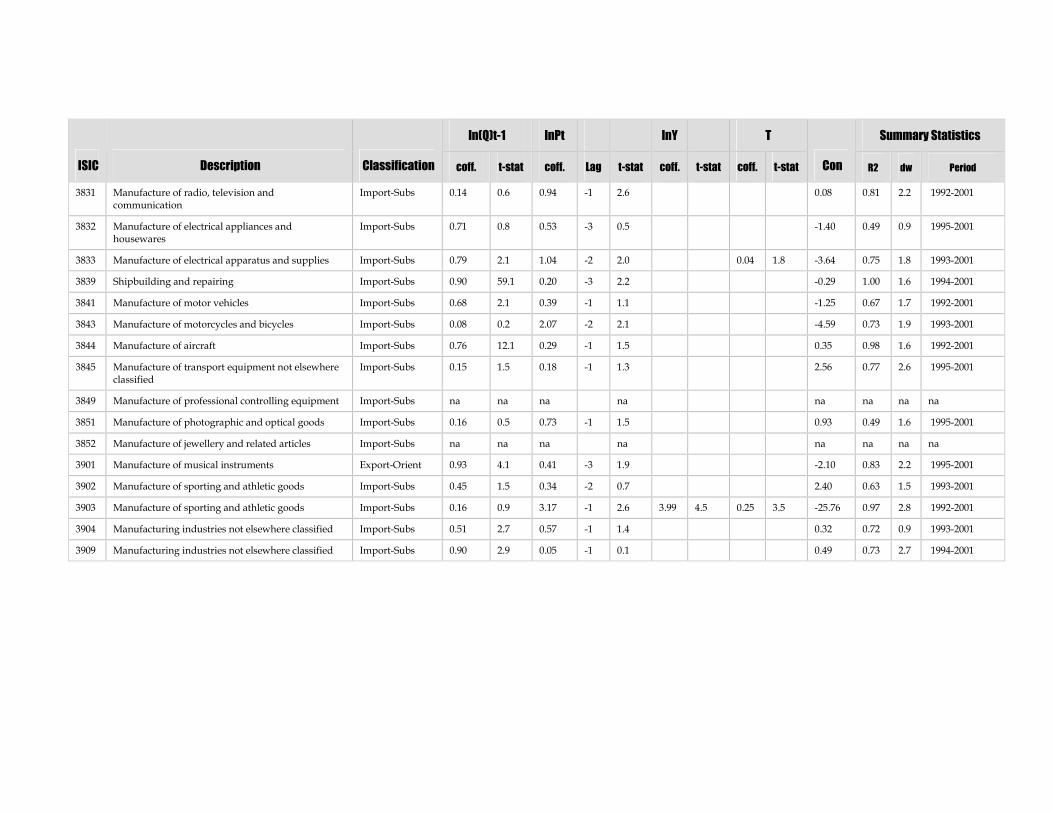
ln(Q)t-1 lnPt lnY T Summary Statistics
ISIC Description Classification coff. t-stat coff. Lag t-stat coff. t-stat coff. t-stat Con R2 dw Period
3831 Manufacture of radio, television andcommunication
Import-Subs 0.14 0.6 0.94 -1 2.6 0.08 0.81 2.2 1992-2001
3832 Manufacture of electrical appliances andhousewares
Import-Subs 0.71 0.8 0.53 -3 0.5 -1.40 0.49 0.9 1995-2001
3833 Manufacture of electrical apparatus and supplies Import-Subs 0.79 2.1 1.04 -2 2.0 0.04 1.8 -3.64 0.75 1.8 1993-2001
3839 Shipbuilding and repairing Import-Subs 0.90 59.1 0.20 -3 2.2 -0.29 1.00 1.6 1994-2001
3841 Manufacture of motor vehicles Import-Subs 0.68 2.1 0.39 -1 1.1 -1.25 0.67 1.7 1992-2001
3843 Manufacture of motorcycles and bicycles Import-Subs 0.08 0.2 2.07 -2 2.1 -4.59 0.73 1.9 1993-2001
3844 Manufacture of aircraft Import-Subs 0.76 12.1 0.29 -1 1.5 0.35 0.98 1.6 1992-2001
3845 Manufacture of transport equipment not elsewhereclassified
Import-Subs 0.15 1.5 0.18 -1 1.3 2.56 0.77 2.6 1995-2001
3849 Manufacture of professional controlling equipment Import-Subs na na na na na na na na
3851 Manufacture of photographic and optical goods Import-Subs 0.16 0.5 0.73 -1 1.5 0.93 0.49 1.6 1995-2001
3852 Manufacture of jewellery and related articles Import-Subs na na na na na na na na
3901 Manufacture of musical instruments Export-Orient 0.93 4.1 0.41 -3 1.9 -2.10 0.83 2.2 1995-2001
3902 Manufacture of sporting and athletic goods Import-Subs 0.45 1.5 0.34 -2 0.7 2.40 0.63 1.5 1993-2001
3903 Manufacture of sporting and athletic goods Import-Subs 0.16 0.9 3.17 -1 2.6 3.99 4.5 0.25 3.5 -25.76 0.97 2.8 1992-2001
3904 Manufacturing industries not elsewhere classified Import-Subs 0.51 2.7 0.57 -1 1.4 0.32 0.72 0.9 1993-2001
3909 Manufacturing industries not elsewhere classified Import-Subs 0.90 2.9 0.05 -1 0.1 0.49 0.73 2.7 1994-2001