Embed Size (px)
Citation preview

Part One GeneralOceanCirculation
1.1 IntroductionIDeep Circulationof theWorld Ocean
Bruce A. Warren
Historically, the deep circulation of the ocean has beenviewed from the perspective of property fields, mainlythe distributions of temperature, salinity, density, anddissolved-oxgyen concentration. The practical reasonfor not considering velocity measurements as well, ofcourse, was a technical incapacity for making themuntil very recently. On the whole, this was probablynot a bad thing: not merely because the property dis-tributions are as interesting in themselves as the mo-tion field, but also because the scalar fields are so muchmore stable than the velocity vectors-allowing spotmeasurements from different areas even years apart tobe combined into coherent pictures that tell a gooddeal about general patterns of deep flow, albeit indi-rectly. The slight differences between correspondinghydrographic sections in the atlases by Fuglister (1960)and by Wust and Defant (1936), when compared withthe fluctuations much larger than the means of deepvelocities observed by the MODE Group (1978), forexample, demonstrate how much easier it is to obtainstatistically significant information pertinent to theoverall global deep circulation from water-propertydata than from current measurements.
On the other hand, the information gained from theproperty fields allows only a limited view of the deepmotions, at very best some kind of long-term average.Although oceanographers have usually been mindful ofvariability in the deep flow, even if only to accomplisheddy mixing, it seems extremely unlikely that anyoneimagined the highly energetic low-frequency meso-scale motions that current records have revealed. In-stead, because of the stability of the property fields, itwas stationarity rather than variability that was em-phasized, however implicitly, in the circulation pic-tures derived from them. That stability also was surelythe basis for the conceptual structure of water typesand masses that has been so enormously useful in sum-marizing and comprehending the temperature-salinitystructure of the ocean and in identifying features inthe property fields that can be exploited as tracers forthe flow. Without velocity information, though, suchdescriptions of oceans have sometimes degeneratedinto taxonomic sterility (naming something doesn'texplain it), and perhaps sometimes there has been tooelemental a character ascribed to water masses (as ifthey were truly building blocks rather than names forfeatures), leading to pictures of the ocean more sugges-tive of rigid geological strata than of the real motionfield that forms the distributions.
Plainly there cannot be a satisfying description ofthe deep ocean circulation that does not meld stationdata with current records. It does not seem to me,though, that such a description is yet possible. Far too
6Bruce A. Warren
few current records have been obtained to describe thedeep, low-frequency motions in a global sense; it isonly in the western North Atlantic that one can evencontemplate making a basin-wide description. More-over, we simply have not learned how to combine thestable station data with the fluctuating-velocity rec-ords to tell a story that is both consistent and inform-ative. For example, Reid, Nowlin, and Patzert (1977)reported a record (Cato 2) from a current meter mooredon the South American continental slope in the coreof the North Atlantic Deep Water: for 2 weeks thedaily-averaged velocity vectors were directed south-westward, parallel to the isobaths, as one would haveexpected in this particular deep western boundary cur-rent; but then the flow abruptly changed direction andwent eastward for nearly 2 weeks. Nevertheless, withdue regard for different density and accuracy of obser-vations, the high-salinity core of the current lookedvery much as had been depicted by Fuglister (1960) andWuiist and Defant (1936). How are we to approach thesetwo different sets of data, to reconcile the variabilityof the one to the steadiness of the other, and to learnsomething significant from their combination aboutthat boundary current?
Finally, it is not at all clear what effect the low-frequency velocity fluctuations have on the long-termmean flow. There is enough theoretical reason (e.g.,Rhines, 1977) to suspect that their role in its dynamicsmay be substantial, but measurements of deep Rey-nolds stresses are meager. In fact, values reported bySchmitz (1977) from the Sargasso Sea well south of theGulf Stream actually favor a negligible contribution tothe vorticity balance there, but those measurementsare far too few to give a general characterization of thedeep open ocean.
Consequently, although I recognize its incomplete-ness, the following account of the deep circulation ofthe world ocean is undertaken mainly from the tradi-tional perspective of hydrographic station data, withreference to current measurements only where theyseem helpful in estimating velocities and transports ofthe prominent currents. The emphasis is on mean ther-mohaline circulation. What has been learned about thelow-frequency motions is. described in detail byWunsch in chapter 11 of this volume.
In section 1.2, I have attempted a historical reviewof what seem to me to be the important events anddates in the development of ideas about the deep cir-culation, from the first deep temperature measure-ments through Sverdrup's comprehensive synthesis inchapter XV of The Oceans (Sverdrup, Johnson, andFleming, 1942). In section 1.3, I have discussed thedynamical ideas of Stommel and his colleagues thatled to the overthrow of a substantial part of Sverdrup'spicture, and its revision in contemporary thinking withdynamically consistent models of circulation. Section
1.4 is an account of the sinking processes that supplywater to the deep ocean from the surface layer. Section1.5 is a consideration of how well the kinds of deep-circulation patterns envisioned in dynamical theorystand up to observation; it is necessarily mainly a di-gest of the evidence for deep western boundary currentsin the world ocean. Finally, in section 1.6, I have spec-ulated about some fundamental aspects of the deepcirculation that seem to me to be not very well under-stood at this time.
The focus throughout is more on the circulation ofdeep water than on the complementary problem of itsproperties, because the subject of deep-water charac-teristics has been treated in detail by Worthington inchapter 2 of this volume. There is, of course, someoverlap with that chapter, as well as with Reid's gen-eral discussion of the mid-depth circulation (chapter3). To the extent that our opinions are in conflict, wehope that readers will recognize subjects for furtherobservation and thought.
1.2 Historical Development of Ideas about the DeepCirculation
In 1751 Henry Ellis, captain of the British slavetraderEarl of Halifax, wrote to the Reverend Stephen Halesto describe some deep temperature measurements thathe had made at lat. 25°13'N, long. 25°12'W, with a"bucket sea-gage" devised and provided for him byHales. This instrument, to be attached to a soundingline, was a "common houshold pail" covered at topand bottom by valves that would be forced open duringdescent and pushed shut by drawing the bucket backto the surface; it was furnished with a thermometer sothat the temperature of the water sample thus trappedcould be read when the bucket was returned to theship. In his letter, which Hales transmitted to theRoyal Society of London, Ellis (1751) reported:
Upon the passage, I made several trials with the bucketsea-gage, in latitude 25'-13" north; longitude 25'-12"west. I charged it and let it down to different depths,from 360 feet to 5346 feet; when I discovered, by asmall thermometer of Fahrenheit's, made by Mr. Bird,which went down in it, that the cold increased regu-larly, in proportion to the depths, till it descended to3900 feet: from whence the mercury in the thermom-eter came up at 53 degrees; and tho' I afterwards sunkit to the depth of 5346 feet, that is a mile and 66 feet,it came up no lower. The warmth of the water uponthe surface, and that of the air, was at that time by thethermometer 84 degrees. I doubt not but that the waterwas a degree or two colder, when it enter'd the bucket,at the greatest depth, but in coming up had acquiredsome warmth.
Ellis's guess of one or two degrees warming duringthe ascent was based on changes observed in the tem-perature of the sample while on deck. Modern data,however, indicate that Ellis's values were some 10-
7Deep Circulation of the World Ocean
13°F too high. Perhaps he underestimated the conduc-tion through the walls of the sampler when it was inthe ocean, or perhaps the valves were not tight enoughto prevent exchange of water while it was being raised(especially if raised unevenly).
Nevertheless, these are the earliest recorded subsur-face temperature measurements in the open ocean-indeed, the first anywhere to a substantial depth-andthey pointed to what must be the most fundamentaland striking physical feature of the ocean: that deepwater is all cold, and warm water is confined to arelatively thin layer near the surface in the tropics andsubtropics.
Ellis himself did not seem to realize the far-reachingsignificance of his data, for he remarked later in hisletter to Hales:
This experiment, which seem'd at first but mere foodfor curiosity, became in the interim very useful to us.By its means we supplied our cold bath, and cooled ourwines or water at pleasure; which is vastly agreeableto us in this burning climate.
He does not seem to have made any further measure-ments, nor does his work appear to have stimulatedimmediate exploration of the deep water by others, for,according to Prestwich's (1875) tabulation, it was morethan 60 years before any additional temperature meas-urements were made to the depth that Ellis reached(though others were made during this time at lesserdepths).
What Ellis's observations meant, of course, was thatdeep water in the tropics must derive from polar re-gions, and that, accordingly, there must be a meridionalcirculation system in the ocean to carry deep waterequatorward. Evidently (M. Deacon, 1971), the firstrecorded recognition of this profound implication wasby Count Rumford in his essay, "The Propagation ofHeat in Fluids," first published in 1797.1 Rumford hadmade the experimental discovery of convection cur-rents in liquids (the basic subject of this essay), and, inconsidering their possible role in nature, he reasoned(Rumford, 1800):
But if the water of the ocean, which, on being deprivedof a great part of its Heat by cold winds, descends tothe bottom of the sea, cannot be warmed where itdescends, as its specific gravity is greater than that ofwater at the same depth in warmer latitudes, it willimmediately begin to spread on the bottom of the sea,and to flow towards the equator, and this must nec-essarily produce a current at the surface in an oppositedirection.
In advancing evidence for such a deep flow, he drewthe correct inference from Ellis's measurements, in asclear and straightforward a fashion as one could want:
But a still more striking, and I might, I believe, say, anincontrovertible proof of the existence of currents ofcold water at the bottom of the sea, setting from the
poles towards the equator, is the very remarkable dif-ference that has been found to subsist between thetemperature of the sea at the surface and at great depth,at the tropic-though the temperature of the atmos-phere there is so constant that the greatest changesproduced in it by the seasons seldom amounts to morethan five or six degrees; yet the difference between theHeat of the water at the surface of the sea, and that atthe depth of 3600 [sic] feet, has been found to amountto no less than 31 degrees; the temperature above or atthe surface being 84°, and at the given depth below nomore than 53°.
It appears to me to be extremely difficult, if not quiteimpossible, to account for this degree of cold at thebottom of the sea in the torrid zone, on any othersupposition than that of cold currents from the poles;and the utility of these currents in tempering the ex-cessive heats of these climates is too evident to requireany illustration.2
During the early nineteenth century, Humboldt(1814, 1831, 1845) popularized the notion of deep cur-rents flowing from polar regions toward the equator.He mentioned no sources for the idea, but he did citeEllis's measurements and later ones of better qualityas supporting data.3
The physicist Lenz (1845) had interested himself inhow the subsurface vertical temperature gradient var-ied with latitude. In the course of his investigation hediscovered the shoaling of the thermocline at the equa-tor in the Atlantic; and the much sparser data availablefrom the Pacific suggested the same phenomenon tohim there. He regarded that shoaling as evidence forupwelling of deep water to the sea surface, and, ac-quainted with Humboldt's work, he proposed a morespecific scheme of closed meridional circulations thanhad been given hitherto. This scheme involved greatconvection cells symmetric about the equator, withwater sinking in high latitudes, flowing equatorwardat depth, and rising in the tropics to return polewardnear the surface. He considered that this upwelling alsocontributed to the reduction in surface salinity that hehad observed at the equator in the Atlantic. His un-derstanding of the driving mechanism was not moreprofound than Rumford's, but he did recognize thatwind stress and the earth's rotation would distort themotions substantially from the simple cellular form.He made no explicit reference to the Indian Ocean, buthe discussed the symmetric cells in terms of generalvalidity. Variants on Lenz's construction, some perhapsconceived independently, were to influence interpre-tations of the deep circulation into the first decade ofthe twentieth century (e.g., Schott, 1902; Brennecke,1909).
Dr. Carpenter, for one (Carpenter, Jeffreys, andThomson, 1869), invoked the general idea to accountfor differences in deep temperatures observed in thenorthern North Atlantic, and his resulting prolongedand contentious controversy with Croll attracted agreat deal of attention to it (M. Deacon, 1971).4 Car-
8Bruce A. Warren
penter had a more elastic conception of the convectioncells than did Lenz, though, believing that their warm,poleward-directed limbs could touch bottom in places;nor was he rigid about the equatorial symmetry, con-sidering that the northern cells would be weaker andless extended laterally than the southern ones, in con-formity with the oceans being much more open topolar water in the south than in the north-wherebydeep water from the Antarctic could be expected topenetrate into the northern hemisphere. He referredexplicitly to recent subsurface temperature measure-ments in the Arabian Sea to argue that all deep waterin the Indian Ocean derived from the Antarctic, and heimplied a belief that most of the deep water in thePacific would also be found to come from the south.
Nevertheless, Prestwich (1875) seems to have beenthe first to demonstrate from observations the nonex-istence in the Pacific of relatively strong deep upwell-ing near the equator and the lack of a northern sourcefor the deep water there. These facts showed that deepwater in the North Pacific, as well as that in the SouthPacific, was supplied from the Antarctic, and thus in-validated Lenz's picture of symmetric convection cells.Prestwich believed, however, that it was still a correctdescription of the meridional circulation in the Atlan-tic.
Following the Challenger expedition, Buchan (1895)produced world-ocean maps of the distribution of tem-perature at various levels, based mainly on the Chal-lenger data. His map for 2200 fathoms illustrated thespreading of deep water from the Antarctic into thethree oceans, including details of how its course isshaped by submarine ridges:
It is also to be noted that the lowest deep-sea temper-atures are found in those parts of the ocean which liein the Southern hemisphere, and that, on the whole,higher temperatures are encountered as we recede fromthe Antarctic region. It may also be pointed out thatthe lower deep-sea temperatures extend farther to thenorth from the Southern Ocean, just over those depthsof the sea which appear to have, and probably do have,a direct communication with the south; that is, are notcut off by any intervening submarine ridge separatingthem from the cold waters of Antarctica.
... There can be no doubt that these very low deep-sea temperatures have their origin in the Southern orAntarctic Ocean, the icy cold waters of which are prop-agated northward, the rate of propagation being soslight as to be regarded rather as a slow creep than asa distinctly recognizable movement of the water.
Buchan (1895) also inferred a southward movementof deep water from the North Atlantic into the SouthAtlantic. As Merz and Wiist (1922) pointed out later,this perception, together with Buchanan's (1884) spe-cific-gravity profile that showed the intermediate-water salinity minimum extending well north of theequator from high southern latitudes, would have beensufficient to disprove Lenz's equatorial upwelling from
great depth to the sea surface-and thereby his sym-metric convection cells for the Atlantic; but neitherBuchan nor Buchanan attempted a comprehensive dis-cussion of the meridional circulation.
Buchan formed his idea of southward flow after no-ticing in the Challenger data that the vertical temper-ature gradients at depths from 800 fathoms to 1500fathoms and deeper (how much deeper not stated) weremuch smaller in the South Atlantic than in the NorthAtlantic. He linked this difference to the distributionof salinity (specific gravity):
The specific gravities at the bottom of the ocean afforda ready explanation for this remarkable distribution oftemperature. Owing to the higher specific gravities ofthe North Atlantic, an extensive deep-sea current fromthe North to the South Atlantic, carrying a higher tem-perature with it, sets in at depths at which the influ-ence of the surface currents is no longer felt, and be-comes more pronounced as the depth below 1000fathoms is increased. Hence the North Atlantic re-ceives large accessions to its salinity from the surfacecurrents, which the deep-sea currents again return tothe South Atlantic.
This was probably the first recognition of deep south-ward flow across the equator, but unfortunately it isall that Buchan (1895) said on the subject. One cannottell whether he also realized that the deep flow waslayered, with North Atlantic water overriding the bot-tom water from the Antarctic, or whether he viewed"deep water" in the terms of his day as a single unitmoving uniformly northward or southward, wherebythe oppositely directed North Atlantic and Antarcticflows would simply collide and upwell at some middlesouthern latitude.
Whatever Buchan may have believed, the first un-ambiguous, well-documented statement of deep south-ward flow from the North Atlantic between the bottomand intermediate waters from the Antarctic was madeby Brennecke (1911) on the basis of stations occupiedby the Deutschland along the western rim of the SouthAtlantic:
Das Hauptergebnis unserer Reihenmessungen ist dieFeststellung eines Tiefenstromes in etwa 1500 bis 3000m Tiefe der vom Nordatlantischen Ozean nach Sildenvordringt und durch hohe Temperatur und hohen Salz-gehalt sich von der uber- und unterlagernder Schichtabhebt. Dieser Tiefenstrom konnte bei allen Rehen-messungen von 5°S-Br. bis 40°S-Br. klar erkannt wer-den. Wenn bislang noch nicht erkannt worden ist, soliegt dies einerseits an der geringen Zahl der Messun-gen, die im diesen Schichten tatsachlich ausgefiihrtworden sind, andererseits an den friihen vielfach ben-utzten Maxima-Mimima-Thermometem, die eineTemperaturumkehr in der Tiefe nicht anzeigen. Soweitunserer Messungen Aufschluss geben, wird dieser Tie-fenstrom bei seinem Vordringen nach SUiden in gr6ssereTiefe gedrangt, bzw. in seiner Oberschicht mehr undmehr durch den schon von fruiheren Forschungen herbekannten, entgegengesetzt gerichteten, d.h. nordwirts
9Deep Circulation of the World Ocean
vordringenden Tiefenstrom in 1000 m (ausgezeichnetdurch das Minimum des Salzgehalts) gemischt.
The Challenger thermometers having been of the min-imum-type, Buchan could not have detected the tem-perature inversion. Another factor that contributed toBrennecke's success was that, although he could nothave known it, he actually made his stations in theswiftest part of the southward flow, where the inver-sion is much more markedly developed than to theeast, and where, happily, the strongest evidence for theflow was available.
In the early 1920s, Merz amassed a file of all availabledeep observations of temperature and salinity, and be-gan a program of systematic reexamination of thesedata to delineate the deep circulation of the wholeworld ocean. In the course of this study Merz and Wiist(1922) and Merz (1925) explicitly refuted the existenceof Lenz's symmetric convection cells in the Atlantic,on the evidence already cited, and they proposed acomprehensive new picture of the meridional circula-tion there, whose essential feature was hemisphericexchange of water: ocean-wide northward flow acrossthe equator in the upper kilometer, compensated bysouthward flow below to about 4000 m, with basin-wide northward and southward flows of bottom waterin the western and eastern basins, respectively.5 Theirworking materials were north-south sections of tem-perature and salinity, and they regarded the depressionof isotherms and isohalines in the upper 2 km in thenorthern subtropics as indicating sinking from the sur-face in those latitudes, and thus formation of the NorthAtlantic deep water there. In making this misinterpre-tation of that feature, they evidently did not fully con-sider either the baroclinic character of the Gulf Streamgyre or the development of anomalously high temper-atures and salinities at mid-depth from mixing of theMediterranean outflow into the gyre.6
Following Merz's death in 1925 on the Meteor Ex-pedition, M11ller and Wust undertook to complete hisprogram for the Indian and Pacific Oceans, respec-tively. In her study of the Indian Ocean data set Miller(1929) joined with Schott (1926) to advance the Merzscheme of meridional circulation, emphasizing he-mispheric exchange, for that ocean too-northwardflow of intermediate and bottom water, southward flowof deep water in between-with the deep water sinkingfrom the surface in the Arabian Sea, and receiving con-tributions from the Red Sea and Persian Gulf outflows.Thomsen (1933), however, found systematic error insome of these salinity values, and new data from theDana showed much less extensive southward penetra-tion of high-salinity deep water from the North IndianOcean than Miller had described, implying a differentcharacter of deep-layer flow from that in the Atlantic:certainly weaker, and if directed across the equator atall, only in response to the northward movement of
intermediate and bottom water. Implicit in this con-clusion was rejection of the idea of deep water sinkingfrom the surface of the Arabian Sea, although the influxof Red Sea water was recognized. From the distributionof bottom potential temperature, Wust (1934) clarifiedthe role of the Central Indian Ridge in dividing thebottom flow into at least two separate regimes (theNinetyeast Ridge being then unknown), with bottomwater entering from the south into both the westernand the eastern basins of the Indian Ocean, as Schott(1902) had suggested in his report on the Valdivia ob-servations.
For the Pacific, Wust (1929) found that the generalquality of data available was inferior to that for theother two oceans, and, with deep property differencesbeing much smaller there anyway, he did not reachsuch definite conclusions as for the Atlantic. Never-theless, his analysis suggested to him that the Pacificwas different from the Atlantic, in that hemisphericexchange was insignificant, and that, in both the Northand South Pacific, intermediate and bottom waterspread equatorward and deep water poleward (i.e., thatdeep water sank from the surface layer near the equa-tor, rather than in middle northern latitudes, as hethought it did in the Atlantic). In one respect, Wiist's(1929, 1938) work on the deep Pacific in this decadewas actually retrogressive, because some temperaturemeasurements made by the Tuscarora in 1874 that areincompatible with modem data led him to infer anorthern source for bottom water in the Sea of Okh-otsk, contrary to Prestwich's (1875) correct finding thatsinking to great depth does not occur anywhere in theNorth Pacific.
From his study of the Carnegie observations, Sver-drup (1931) realized that there was not, in fact, anyequatorial downwelling in the Pacific. He also recog-nized that Pacific bottom water did not derive fromsinking directly to the south near Antarctica, as is thecase for the Atlantic, but that all water below the low-salinity intermediate layers in the Pacific was, in effect,carried to it by the Circumpolar Current. He thoughtit likely that at least in the South Pacific there wassome southward return flow of deep water, as in theother two oceans, but the very low oxygen concentra-tion in the deep North Pacific indicated only smallhemispheric exchange.
The idea of a deep-water connection among the At-lantic, Indian, and Pacific Oceans via the CircumpolarCurrent was reinforced by the systematic cruises of theDiscovery in the Antarctic, which obtained evidencefor the extension of high-salinity deep water all theway from the Atlantic to the Pacific (Deacon, 1937).
By the time Wust began his comprehensive treat-ment of the Meteor results, Helland-Hansen and Nan-sen (1926) had shown clearly-and Defant (1931) hadreaffirmed-that the high salinities at mid-depths in
IOBruce A. Warren
the subtropical North Atlantic were due to the Medi-terranean outflow; and Wattenberg (1929) had tracedthe maximum in oxygen concentration below to highnorthern latitudes. Wiist (1935) therefore abandonedthe broad mid-latitude source for the deep water thatMerz and he (1922) had proposed, and that he (1928)had later modified somewhat. Instead, he distinguishedthree layers within the deep water, all spreading south-ward, and each with its own "formation" site: UpperNorth Atlantic Deep Water, characterized by the deepsalinity maximum attributed to the Mediterraneanoutflow; Middle North Atlantic Deep Water, identifiedby a maximum in dissolved-oxygen concentration, andtraced to the Labrador Sea; and Lower North AtlanticDeep Water, identical to Wiist's (1928) earlier "NorthAtlantic Bottom Water," defined by a second anddeeper oxygen maximum, and thought to be formedsomewhere in the waters south or southeast of Green-land by deep convection in winter.
The picture of deep circulation for the world oceanthat Sverdrup (Sverdrup, Johnson, and Fleming, 1942,chapter XV) then constructed was broadly Merzian:ocean-wide or basin-wide flows in deep and bottomlayers, the bottom water moving generally northward,the deep water southward-with the greatest hemi-spheric exchange in the Atlantic and the least in thePacific. Sverdrup departed qualitatively from the Mer-zian schematic only in inferring that the principalmovement of deep (and bottom) water in the NorthPacific was a slow, nearly closed, clockwise circula-tion. By this time, though, the areal extent of regionswhere deep sinking was thought to occur had beenmuch reduced from what Merz had supposed: sinkingin the southern hemisphere limited mainly to the Ant-arctic continental slope in the Weddell Sea (Brennecke,1915, 1921; Mosby, 1934), and sinking in the northernhemisphere confined to high latitudes in the westernbasin of the Atlantic, with probably smaller, subsurfaceinfluxes of relatively dense water from such marginalseas as the Mediterranean and Red Seas.
Even then, however, Wiist had already realized thatthe idea of deep and bottom flows in the Atlantic thatwere uniform in a basin-wide sense was oversimplifiedto the point of being misleading. His maps of tracerdistributions from the Meteor data (Wiist, 1935) dem-onstrated more intense southward propagation ofNorth Atlantic Deep Water in the western than in theeastern South Atlantic, and geostrophic velocity cal-culations (Wiist, 1938) showed relatively strong north-ward flow of Antarctic Bottom Water (at speeds ofseveral centimeters per second) only close to the SouthAmerican continental slope. In discussing property dis-tributions, Wiist (1935) was careful to speak of the"spreading" ("Ausbreitung") of water types, statingthat such spreading had a current-like character onlyon the western side of the Atlantic, and that elsewhere
it was accomplished, in effect, by eddy fluxes. He re-garded this distribution of currents as an extremelystrange phenomenon, for which he was unable to givea satisfactory explanation; and, indeed, the real signif-icance of these "deep western boundary currents" wasnot to be appreciated until dynamically consistentmodels of the deep circulation were developed.
It should be acknowledged, however, that, as pene-trating as Wuist's insights were, it was not, in fact, hewho first discovered the bottom-water boundary cur-rent, but Buchanan, who was presumably the chiefcontributor to chapter XXII of the Challenger ReportNarrative. The Challenger stations were the first setthat by virtue of their spacing could possibly have re-vealed such a feature, and Buchanan (Tizard, Mosely,Buchanan, and Murray, 1885a) did not fail to see it:
Another equally remarkable current is that whichbrings the cold water from the south polar regions upalong the South American coast at the bottom as far asthe Equator.... That this does take place is shown bythe low bottom temperatures observed at every Stationalong the western side of the South Atlantic almost tothe Equator, and that there is here a sensible currentof cold water along the bottom is shown by the suddenchange in the rate of decrease of temperature withincreasing depth which is observed at depths of from2000 to 2200 fathoms.
... The temperature of the water from 2400 fathomsto the bottom was uniform, the mean result of sixobservations being 32.43° . This water underruns thebody of the Atlantic water, which at 1500 to 2000fathoms has here a temperature of 37°, producing atemperature gradient of about 1.3° per hundred fathomsat the steepest. For the preservation of this gradient, aconsiderable supply of cold water is requisite, and itmust be drawn from higher latitudes. But any motionof the water towards the Equator will be accompaniedby a strong deflection to the westward (proportional tothe change of the cosine of the latitude). A measure ofthis deflecting force is furnished by the rise of this coldwater at the more inshore Station on the 2 8TH, wherethe maximum gradient is at about 1750 fathoms, whileon the 2 9TH, at a distance of 120 miles,7 it is at about2100 fathoms.
In the last two sentences Buchanan seems to havebeen groping toward some notion of the thermal-windrelation, and to have correctly associated the lateralscale of the slope in the maximum-gradient surfacewith that of the northward flow beneath. He had badluck with his discoveries, though. Not only was thisone ignored [except for an allusion by Wiist (1933)],but, as will be recalled, his almost simultaneous dis-covery of the Atlantic Equatorial Undercurrent wascompletely forgotten after three decades.
1.3 A Dynamical Framework
Paralleling the intuitively appealing concept of ocean-wide or basin-wide meridional flows were two otherideas that seemed equally reasonable. One is that, in
IIDeep Circulation of the World Ocean
compensation for the known sinking of near-surfacewater in small regions, there is a general slow upwardmovement of deep water over most of the rest of theocean, which balances the downward diffusion of heatfrom the upper layer and thus accounts for the exist-ence of the main thermocline. The other is that themean horizontal deep flow in the open ocean is strictlygeostrophic, in the sense that streamlines parallel iso-bars, and the speed is inversely proportional to theirspacing and to the sine of the latitude. As indicated insection 1.1, the latter may not seem so obvious now asit once did, but there is yet no proof to the contrary.Stommel (1965, manuscript of first edition completedin 1955) perceived the dynamical implication of theseideas-that the vertically integrated deep flow shouldbe directed poleward-with the bizarre corollary thatdeep water in the open ocean of known polar originshould be moving on the whole toward its sourcesrather than away from them. Specifically, broad, deepequatorward flows in the North Atlantic, South Indian,and South Pacific Oceans, as envisaged in the Merz-Sverdrup picture, do not seem consistent with the pe-culiar dynamics of slow motions on a rotating sphere.
The physical argument is simple. The geostrophicvorticity balance is flv = fwz, where f is the Coriolisparameter, l3 its meridional derivative, v the northwardvelocity component and w the vertical component, andz the vertical coordinate (positive upward). Integratingthe equation vertically from the ocean bottom to the"top" of the deep water (however defined), and takingthe floor of the ocean to be level in the large-scalemean, so that the vertical velocity at the bottom canbe taken to be zero in a large-scale sense, then yieldsthe result that, with upward velocities at the top of thedeep water, the meridional component of flow is pole-ward, in both the northern and the southern hemi-spheres. This can also be seen in more rudimentaryterms: because geostrophic flow cannot cross isobars,the transport per unit depth between any two stream-lines of the horizontal flow increases downstream inflow toward lower latitudes, and decreases downstreamin flow toward higher latitudes. If water is also movingupward out of the deep layer, then the associated hor-izontal flow must be the convergent one--directedpoleward.
Clearly, however, there must be regions where thisconstraint breaks down, so that deep water of polarorigin can reach the low latitudes where it is found.For the large-scale circulation generally, the regionswhere the rules of the open ocean are relaxed are thewestern boundaries of basins, where relatively narrow,intense currents exist to satisfy whatever boundary orcontinuity conditions are not fulfilled by the interiorflow (see section 1.5.4). Stommel (1958) therefore hy-pothesized deep western boundary currents for all theoceans to carry deep water away from its sources, to
supply it to the interiors of oceans from their westernsides (rather than from their polar margins) and thusfeed the poleward interior flows, and to correct ocean-wide continuity imbalances between the upward fluxand the meridional flow.
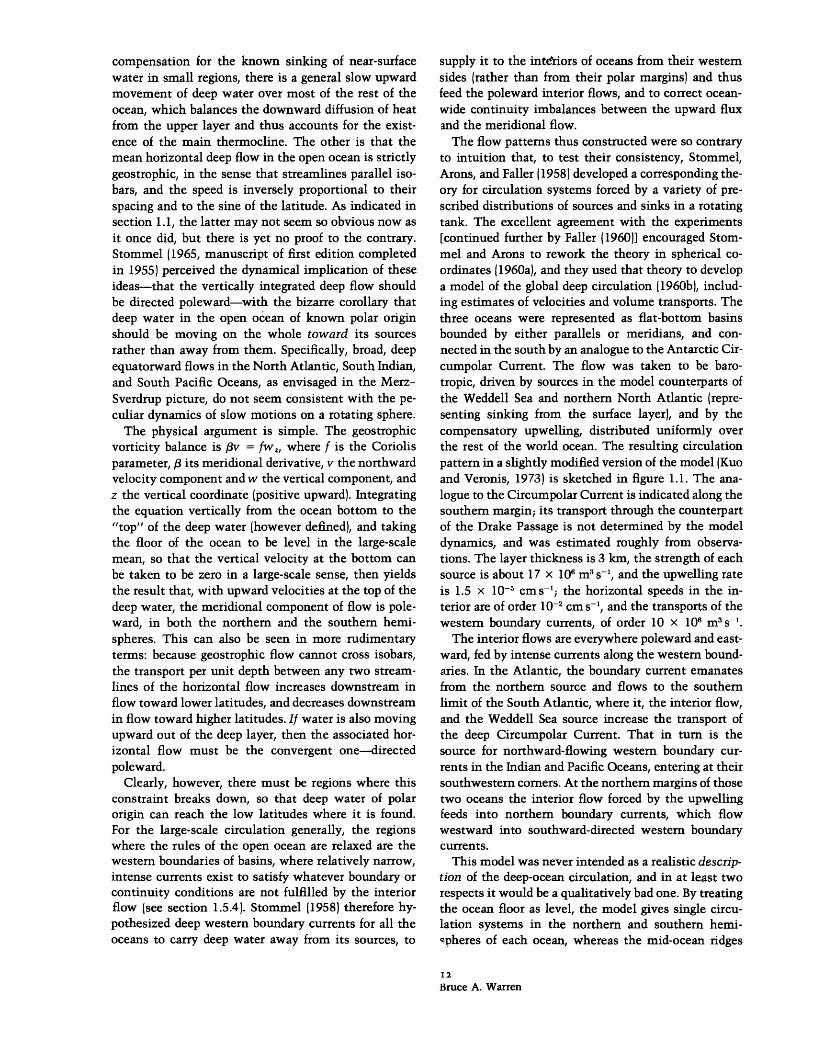
The flow patterns thus constructed were so contraryto intuition that, to test their consistency, Stommel,Arons, and Faller (1958) developed a corresponding the-ory for circulation systems forced by a variety of pre-scribed distributions of sources and sinks in a rotatingtank. The excellent agreement with the experiments[continued further by Faller (1960)] encouraged Stom-mel and Arons to rework the theory in spherical co-ordinates (1960a), and they used that theory to developa model of the global deep circulation (1960b), includ-ing estimates of velocities and volume transports. Thethree oceans were represented as flat-bottom basinsbounded by either parallels or meridians, and con-nected in the south by an analogue to the Antarctic Cir-cumpolar Current. The flow was taken to be baro-tropic, driven by sources in the model counterparts ofthe Weddell Sea and northern North Atlantic (repre-senting sinking from the surface layer), and by thecompensatory upwelling, distributed uniformly overthe rest of the world ocean. The resulting circulationpattern in a slightly modified version of the model (Kuoand Veronis, 1973) is sketched in figure 1.1. The ana-logue to the Circumpolar Current is indicated along thesouthern margin; its transport through the counterpartof the Drake Passage is not determined by the modeldynamics, and was estimated roughly from observa-tions. The layer thickness is 3 km, the strength of eachsource is about 17 x 106 m3 s-', and the upwelling rateis 1.5 x 10⁻⁵ cms- 1; the horizontal speeds in the in-terior are of order 10-2 cm s- 1, and the transports of thewestern boundary currents, of order 10 x 106 m3 s-'.
The interior flows are everywhere poleward and east-ward, fed by intense currents along the western bound-aries. In the Atlantic, the boundary current emanatesfrom the northern source and flows to the southernlimit of the South Atlantic, where it, the interior flow,and the Weddell Sea source increase the transport ofthe deep Circumpolar Current. That in turn is thesource for northward-flowing western boundary cur-rents in the Indian and Pacific Oceans, entering at theirsouthwestern corners. At the northern margins of thosetwo oceans the interior flow forced by the upwellingfeeds into northern boundary currents, which flowwestward into southward-directed western boundarycurrents.
This model was never intended as a realistic descrip-tion of the deep-ocean circulation, and in at least tworespects it would be a qualitatively bad one. By treatingthe ocean floor as level, the model gives single circu-lation systems in the northern and southern hemi-spheres of each ocean, whereas the mid-ocean ridges
I2Bruce A. Warren

divide the oceans into separate basins with multiplecirculation systems and multiple entrance points fordeep water from the Antarctic. Also, because the modelis barotropic, it cannot allow layered deep flow, withopposed boundary currents one above the other, as oc-cur most spectacularly in the South Atlantic, whereAntarctic Bottom Water flows northward beneath thesouthward current of North Atlantic Deep Water. (Infact, there could be no direct, boundary-current flow ofAntarctic Bottom Water from the Weddell Sea into theSouth Atlantic anyway were it not that the Drake Pas-sage sill is substantially shallower than the floor of theAtlantic to the east.)
Nevertheless, it was a dynamically consistentscheme, which offered some drastically different ideasabout the deep circulation from those in the Merz-Sverdrup picture of basin-wide meridional flows, es-pecially the new physical concept of deep westernboundary currents. A search was immediately made forthe predicted deep current off the east coast of theUnited States, by means of direct current measure-ments with neutrally buoyant floats; its discovery wasreported by Swallow and Worthington (1957), and pro-vided dramatic support for the essential truth of thenew conceptual scheme. Considering what has beenlearned since then about the prevalence of strong, low-frequency motions in the deep water, one would prob-ably question now how sound a "proof" of the currentthose measurements were, given their restricted geo-graphical scope and brevity of duration (1 to 4 days);
but they were consistent among themselves and withlater observations (see section 1.5).
Actually, as pointed out in section 1.2, the relativelyintense deep meridional flows adjacent to South Amer-ica had been recognized long before, and Stommel(1950a) had already suggested that they might be dy-namically akin to the Gulf Stream. Moreover, as thetheory was being developed, Wiist (1955) constructedgeostrophic velocity sections for two of the Meteortransects, one of which vividly illustrated these twocurrents, the one directed northward, the other south-ward. Thus the general idea of deep western boundarycurrents was not without observational support evenbefore its confirmation by Swallow and Worthington(1957).
It was only for simplicity and clarity that the Stom-mel-Arons model was presented as a barotropic one.It can be brought somewhat closer to the real stratifiedocean by regarding it instead as a theory for verticallyintegrated flow. Equatorward interior flow at some lev-els is therefore not excluded, so long as the verticalintegral is poleward. Layered interior flows might bedifficult to detect in tracer distributions, though, be-cause mixing of properties can mask the flow patterns(see below, this section).
The theory is clear, however, in allowing no hemi-spheric exchange of water (of the sort that Merz em-phasized) through the interior flow, because at all lev-els the meridional component of flow vanishes withthe Coriolis parameter at the equator: hemispheric ex-
WESTERN BOUNDARYTRANSPORT
no- 1 2 3 4
600
300
U-
30
550
70OU- VV U- DU'L 4U'_ 1UVW YVUW
0 3
zo
-2
TRANSPORT OF ANTARCTIC CIRCUMPOLAR CURRENT (without recirculation)
Figure I . Deep circulation in a schematic world ocean drivenby uniform upwelling with sources at the counterparts of the
North Pole and Weddell Sea. See text. Transports measuredin units of about 6 x 10⁶ m s-'. (Kuo and Veronis, 1973.)
I3Deep Circulation of the World Ocean
-
I
I,
-L F
�_j L-------- - ----- ___1
I - - - - - - - - - - - - -
, - . ..
v^
change by the mean flow is limited to the boundarycurrents. There can still be hemispheric exchange ofproperties all along the equator, of course, through lat-eral mixing.
A more fundamental novelty of the Stommel-Aronsmodel is in its looser connection between specific hor-izontal flows and specific sinking phenomena than wasimplied in the earlier schemes. The net interior flowat any position is directly coupled to the local upwardmovement of the deep water, but the amplitude of thatupwelling (as distinguished from its geographical var-iation) is related to the world-ocean integral of the rateof sinking into the deep water, rather than to the down-ward flux in any one sinking region. Nor is there anyone-to-one relation between the transport of a deepwestern boundary current and the rate of sinking in aregion from which it may emanate, even after subtract-ing losses to interior upwelling-as may be seen byconsidering the water budget for the portion of a deepocean north of an arbitrary parallel of latitude. Theboundary-current transport T out of that volume (pos-itive southward) can be calculated as
T=f wdl- fwdo- + S,
where S is the rate of sinking into that volume, and wis the vertical velocity at the top of the deep water; thefirst term on the right, expressing the net interior trans-port into the volume, includes an integral of w alongthe arbitrary latitude, and the second term is an inte-gral over the top of the volume. Not only can T be lessthan S, as is obvious without the formula, but T canalso be greater than S, signifying recirculation in anocean or basin, because the boundary current mustcompensate not only the sinking but also any excessof interior transport into the volume over upward fluxout of it. Extreme examples of this effect are illustratedin the northern Pacific and Indian areas of figure 1.1,where southward flowing boundary currents are re-quired even though no sinking occurs to the north.
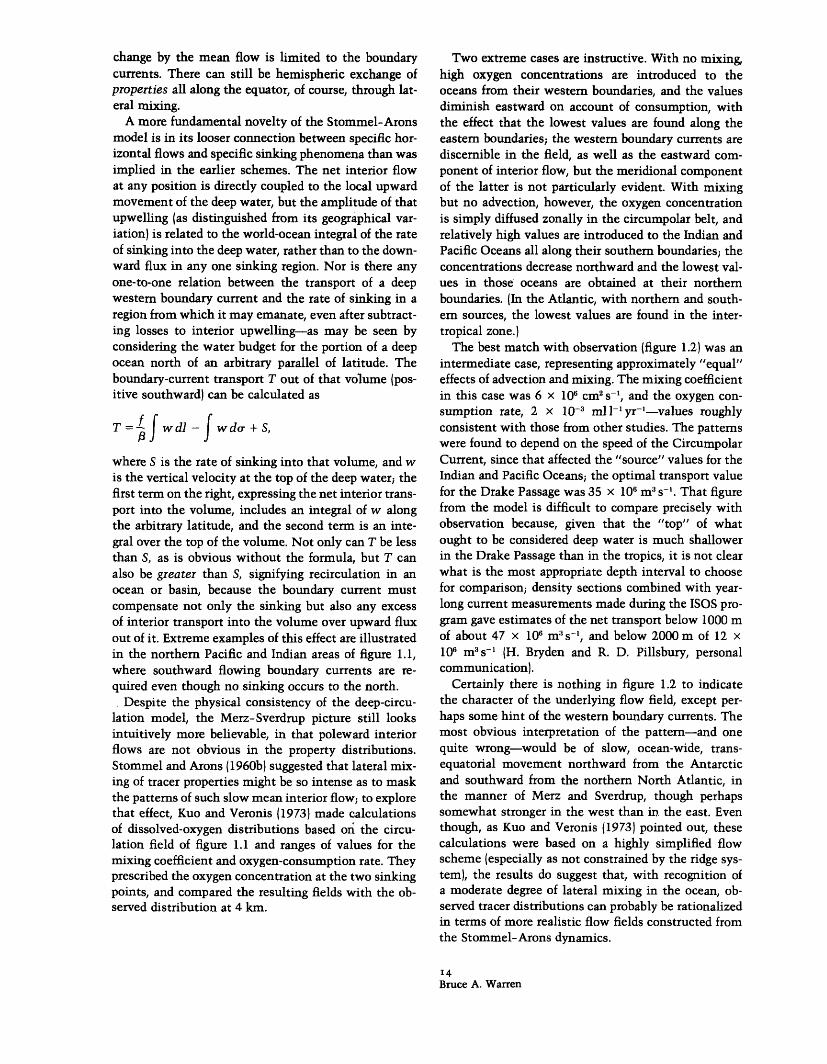
Despite the physical consistency of the deep-circu-lation model, the Merz-Sverdrup picture still looksintuitively more believable, in that poleward interiorflows are not obvious in the property distributions.Stommel and Arons (1960b) suggested that lateral mix-ing of tracer properties might be so intense as to maskthe patterns of such slow mean interior flow; to explorethat effect, Kuo and Veronis (1973) made calculationsof dissolved-oxygen distributions based on the circu-lation field of figure 1.1 and ranges of values for themixing coefficient and oxygen-consumption rate. Theyprescribed the oxygen concentration at the two sinkingpoints, and compared the resulting fields with the ob-served distribution at 4 km.
Two extreme cases are instructive. With no mixing,high oxygen concentrations are introduced to theoceans from their western boundaries, and the valuesdiminish eastward on account of consumption, withthe effect that the lowest values are found along theeastern boundaries; the western boundary currents arediscernible in the field, as well as the eastward com-ponent of interior flow, but the meridional componentof the latter is not particularly evident. With mixingbut no advection, however, the oxygen concentrationis simply diffused zonally in the circumpolar belt, andrelatively high values are introduced to the Indian andPacific Oceans all along their southern boundaries; theconcentrations decrease northward and the lowest val-ues in those oceans are obtained at their northernboundaries. (In the Atlantic, with northern and south-ern sources, the lowest values are found in the inter-tropical zone.)
The best match with observation (figure 1.2) was anintermediate case, representing approximately "equal"effects of advection and mixing. The mixing coefficientin this case was 6 x 106 cm2 s-', and the oxygen con-sumption rate, 2 x 10⁻³ mll- 1 yr-'-values roughlyconsistent with those from other studies. The patternswere found to depend on the speed of the CircumpolarCurrent, since that affected the "source" values for theIndian and Pacific Oceans; the optimal transport valuefor the Drake Passage was 35 x 106 m3 s- '. That figurefrom the model is difficult to compare precisely withobservation because, given that the "top" of whatought to be considered deep water is much shallowerin the Drake Passage than in the tropics, it is not clearwhat is the most appropriate depth interval to choosefor comparison; density sections combined with year-long current measurements made during the ISOS pro-gram gave estimates of the net transport below 1000 mof about 47 x 106 m 1s-1, and below 2000 m of 12 x106 m3 s- ' (H. Bryden and R. D. Pillsbury, personalcommunication).
Certainly there is nothing in figure 1.2 to indicatethe character of the underlying flow field, except per-haps some hint of the western boundary currents. Themost obvious interpretation of the pattern-and onequite wrong-would be of slow, ocean-wide, trans-equatorial movement northward from the Antarcticand southward from the northern North Atlantic, inthe manner of Merz and Sverdrup, though perhapssomewhat stronger in the west than in the east. Eventhough, as Kuo and Veronis (1973) pointed out, thesecalculations were based on a highly simplified flowscheme (especially as not constrained by the ridge sys-tem), the results do suggest that, with recognition ofa moderate degree of lateral mixing in the ocean, ob-served tracer distributions can probably be rationalizedin terms of more realistic flow fields constructed fromthe Stommel-Arons dynamics.
I4Bruce A. Warren
Figure I.2 Model distribution of dissolved-oxygen concentra-tion (mll - }) associated with the flow field in figure 1.1. See
Although the Stommel-Arons (1960b) model itselfis not a theory for the actual mean deep circulation,the model does provide a dynamical framework inwhich to think about aspects of the circulation. Evi-dence bearing on the verification of elements of themodel as applied to the real ocean is discussed in sec-tion 1.5.
1.4 Sources of Deep Water
Even though the individual sites where water sinks togreat depth do not seem so important for driving theoverall deep circulation as they once did, it is desirableto know the rates at which sinking occurs, because thecompensating upwelling from the rest of the deepwater is thought to force its mean horizontal circula-tion. Moreover, the climatic conditions at the specificsinking regions determine the characteristics of thedescending water, and thereby the properties and lay-ering of deep water through the world ocean. The sink-ing phenomena are an integral part of the deep circu-lation as well, and the various processes by which near-surface water is brought to depth are of considerableinterest in themselves.
As noted in section 1.2, in the southern hemispheredeep sinking is limited to the waters around Antarc-tica. In the northern hemisphere it occurs only in thenorthern North Atlantic, but there are also outflowsfrom marginal seas: the Mediterranean Sea, the RedSea, and the Persian Gulf. These outflows descend prin-cipally to mid-depths, but affect the water character-istics at deeper levels too.
1.4.1 Sinking around AntarcticaThe only location in the Southern Ocean where sinkingto the bottom through convective overturning has beenidentified is the Bransfield Strait (figure 1.3), whichseparates the northern tip of the Antarctic Peninsula
text for "best-fit" values of controlling parameters. (Kuo andVeronis, 1973.)
from the South Shetland Islands {(Clowes, 1934; Gordonand Nowlin, 1978). There a somewhat isolated troughof depth 1100-2800 m is filled with a mass of nearlyhomogeneous water very different from the surround-ing Circumpolar Deep Water: much higher oxygen con-centration, and notably lower temperature, salinity,and nutrient concentrations. Values of tritium concen-tration, increasing toward the bottom below 300 m in1975, are further evidence for recent contact betweenthe bottom water and the sea surface. Although noobservations have been made there in the winter sea-son, these circumstances strongly imply that local win-ter convection renews the water column through itsfull depth. So far as one can tell from the propertydistributions, however, none of this bottom waterflows out of the trough into the rest of the ocean,probably because of the topographic barriers.
Reduced vertical stratification northeast of theBransfield Strait, in a zone separating the Scotia andWeddell Seas, raises the possibility of some deep con-vection there too (G. E. R. Deacon and Moorey, 1975),but the evidence to date is less clear-cut than that fromthe Bransfield Strait.
The bottom water that does enter the rest of theocean originates in several areas of the Antarctic con-tinental shelf, where water is made sufficiently coldand saline that, in flowing down the continental slopeand mixing with the surrounding deep water, it is denseenough to reach the floor of the ocean. In order ofdecreasing amount and extent of influence on the deep-water property distributions-and presumably, there-fore, of rate of bottom-water production-these regionsare the Weddell Sea, the Ross Sea, and the Adlie Coast(figure 1.3; A. L. Gordon, 1974); perhaps there is someproduction off Enderby Land too.
Because of its predominant role, the Weddell Sea hasattracted the most attention, although the extremeharshness of working conditions there has discouraged
ISDeep Circulation of the World Ocean

1800
Figure i.3 Index map identifying Antarctic place names men-tioned in text.
I6Bruce A. Warren

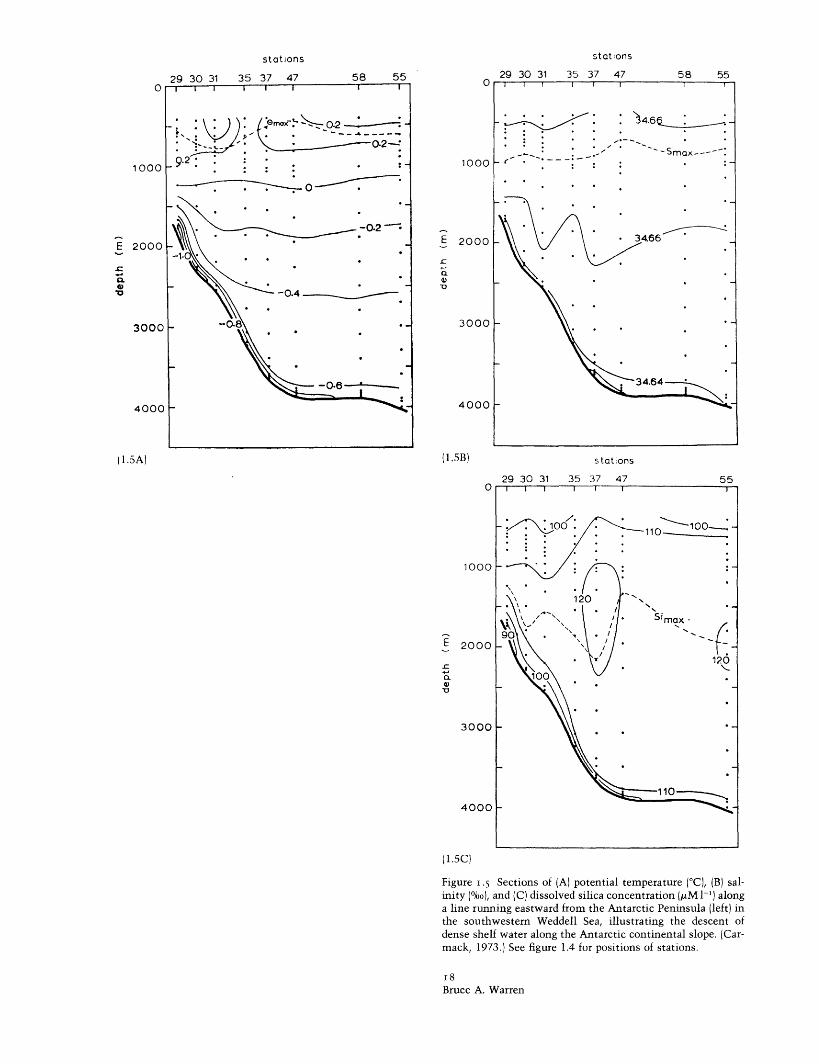
any wintertime observations since the Deutschlandwas frozen into the pack ice in 1912 (Brennecke, 1921).Nevertheless, summer data suggest that flow down thecontinental slope takes place throughout the year. Sec-tions of temperature, salinity, and dissolved-silica con-centration, as constructed from observations made in1968 on a station line running eastward from the Ant-arctic Peninsula (figure 1.5; see figure 1.4 for stationpositions) show a 200-m thick layer of relatively cold,fresh, low-silica bottom water on the slope, extendingonto the floor of the Weddell Sea (Carmack, 1973).Although the station line did not reach the continentalshelf ice cover has prevented any shelf-water obser-vations in that region), the evidence points plainly toa flow of shelf water down the slope, probably quiteobliquely, entraining, and being diluted by, the sur-rounding water along the way. Similar sections nearlongs. 40°W and 29°W (Foster and Carmack, 1976a), aswell as 10-20°W (Carmack and Foster, 1975), showdiminishing evidence for downslope flow to the east-ward, and the distribution of bottom potential temper-ature in the Weddell Sea (figure 1.6; Foster and Car-mack, 1976a) demonstrates that the newly formedbottom water leaves the continental slope mainly atthe northern tip of the Antarctic Peninsula, in lats.63-65°S.
This Weddell Sea Bottom Water-defined by Car-mack and Foster (1975) as of potential temperature 0<-0.7°C-is widespread in the Weddell Sea, but since
60" 50" 40" 30e 20"
60' 50' 40- 30' 20'
Figure 1.4 Positions of stations occupied by U.S.C.G.C. Gla-cier in the Weddell Sea, 26 February- 13 March 1968, that areused for the construction of the sections in figure 1.5. Isobathslabeled in meters. (After Carmack, 1973.)
water of such extreme characteristics is not found tothe north in the Argentine Basin (Reid, Nowlin, andPatzert, 1977), it must be mixed fairly rapidly into thewater above. That overlying water in the Weddell Seais itself also "Antarctic Bottom Water," but "older"water, whose, properties have been modified by mixingelsewhere; it flows westward into the Weddell Seaclose to the continent in the clockwise Weddell gyre(e.g., Brennecke, 1918; G. E. R. Deacon, 1976).
By combining station data with current records ofduration between 3 and 4 weeks, Carmack and Foster(1975) estimated that the net flow of Weddell Sea Bot-tom Water out of the Weddell Sea is about 16 x106 m3 s -'. At their stations, that water had a meanpotential temperature of -0.786°C, brought about, pre-sumably, by mixing overlying water of 0 = -0.6 to-0.7°C into water that initially, at the edge of thecontinental shelf, was of 0 = -1.2 to -1.4°C. Theyestimated, therefore, that the rate of sinking from theshelf in the Weddell Sea is 2-5 x 10⁶ m3 s-1.
In accounting for the formation of Weddell Sea Bot-tom Water, three distinct processes need to be treated:(1) how the density of the shelf water is increased tothe point where it can sink through the relativelywarm, saline water at mid-depths; (2) how the watermoves off the shelf; and (3) how it descends with en-trainment to the floor of the Weddell Sea. The firstproblem has been considered at length by Gill (1973).Although near-surface water in the open Weddell Seahas a temperature close to the freezing point, it isgenerally too fresh to be dense enough to sink throughthe water below. On the shelf, however, the salinitycan be increased by salt release during ice formation,and there more saline water is, in fact, found, which isdense enough to sink to depth. By itself the annualcycle of freezing and melting at-the sea surface cannotaccount for the greater salinity of the water on theshelf, because whatever salt were added to the waterduring winter freezing would be mixed back into themelt water during summer. Nor can it be supposedthat the salt-enriched water formed during winter im-mediately leaves the shelf, because it is found duringsummer both on the shelf and flowing down the con-tinental slope. Seabrooke, Hufford, and Elder 11971)therefore suggested that the salinity enhancementtakes place year-round through freezing at the base ofthe Filchner and Ronne Ice Shelves (figure 1.3). Gill(1973) showed that this was unlikely, however: becausethe heat flux through the ice shelf is too small to allowenough salt release for a significant rate of bottom-water production; because the evidence is for meltingrather than freezing under the ice shelf anyway; andbecause the temperature of the most saline shelf wateris commonly well above the freezing point at the depthof the ice-shelf base. It seems instead that the higher
I7Deep Circulation of the World Ocean
stations
29 30 31 35 37 47 58 55 0
1000
E
-va-o
2000
3000
4000
(1.5B)
0
1000
2000
-Ca.
'o
3000
4000
stations
29 30 31 35 37 47 58 55
stations
29 30 31 35 37 47 55
(1.5C)
Figure .5 Sections of (A) potential temperature (°C), (B) sal-inity (oo), and (C) dissolved silica concentration (M l-') alonga line running eastward from the Antarctic Peninsula (left) inthe southwestern Weddell Sea, illustrating the descent ofdense shelf water along the Antarctic continental slope. (Car-mack, 1973.) See figure 1.4 for positions of stations.
I8Bruce A. Warren
0
1000
2000E
c
Q0.
' -Smax.----:C
I I I | I I I I
- \ ) ) *ze°x ' -2 .2 ·.
-0.2
-0.4'- -0.8 ._-3000
4000
(1.5A)
I I I I I I
i* * ..
I
- - -
_
_
_
-
_
-
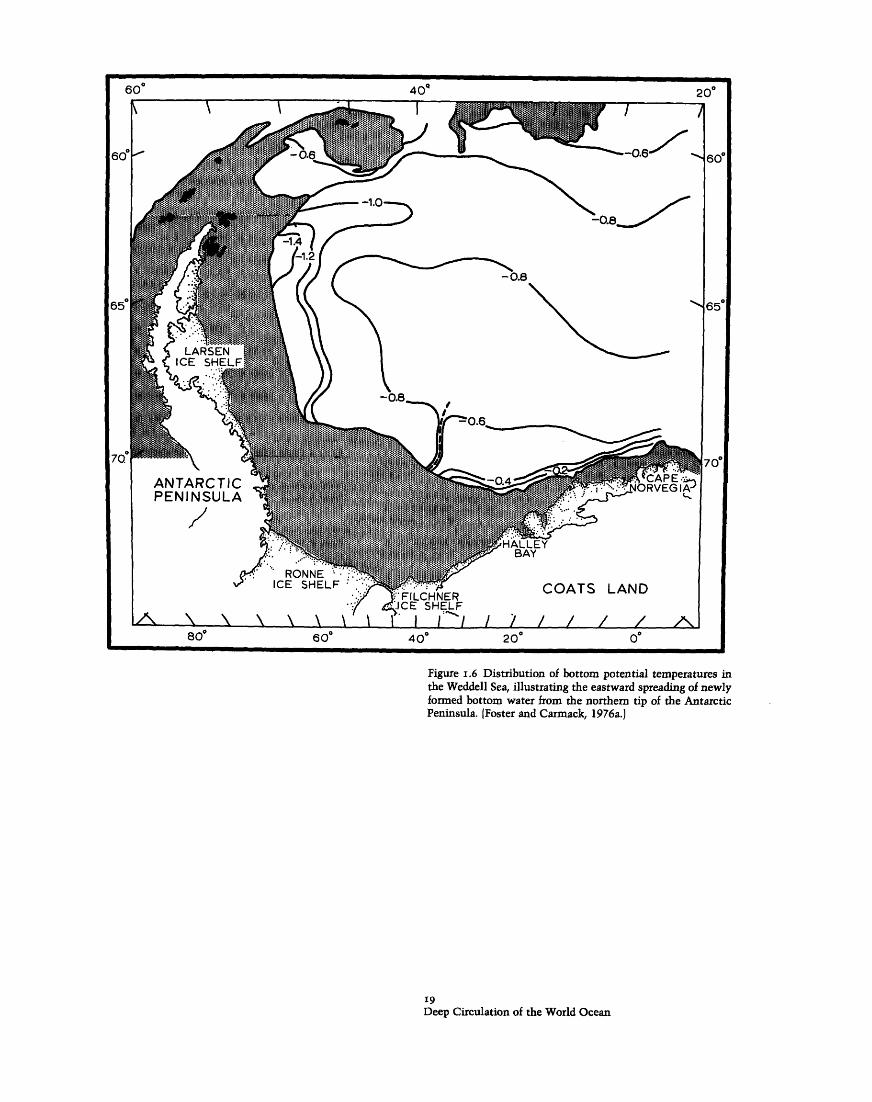
Figure I.6 Distribution of bottom potential temperatures inthe Weddell Sea, illustrating the eastward spreading of newlyformed bottom water from the northern tip of the AntarcticPeninsula. (Foster and Carmack, 1976a.)
I9Deep Circulation of the World Ocean
salinities are indeed due to the seasonal freezing-melt-ing cycle at the sea surface: evidently there is a pre-vailing offshore movement of the pack ice that trans-ports potential melt water locked up in ice out of theregion, thus allowing a net brine production there. Thatmovement also increases the wintertime brine releaseby opening up leads in the ice field where much morerapid freezing occurs. A plausibly estimated value forthe net effective rate of ice formation on the continen-tal shelf, through the complete seasonal cycle, is about1 myr - ' (Gill, 1973).s
Given denser water on the shelf than offshore, it isstill not immediately obvious why it moves toward thecontinental slope, because even if the density differ-ence were imparted impulsively, the water should onlyadvance offshore a distance of order of the deformationradius (10-20 km), and the ensuing steady motionshould be geostrophic flow along the isobaths, ratherthan across them. In zonally symmetric conditionswithout longshore pressure gradients, the only possiblesteady efflux of bottom water from the shelf would bein a frictional boundary layer, but the likely transportthere is much too small to be realistic (Gill, 1973).Antarctica is far from zonally symmetric, of course,and the existence of large-scale indentations in thecoastline, with much broadened continental shelves,as in the Weddell Sea, allows much more substantialtransport off the shelf.
In particular, the salinity of the shelf water in theWeddell Sea increases markedly from east to west, byabout 0.4%o, and the associated longshore density gra-dient implies a thermal-wind shear, with surface watermoving onshore and the deeper shelf water movingoffshore. Combining these density data with a valuefor the onshore Ekman flux associated with easterlywinds, Gill (1973) estimated the offshore transport ofdense water along the length of the shelf to be about1 x 106 m3 s- , of which half is compensation for thesurface Ekman flux. The net offshore salt transportassociated with this vertical circulation is only abouthalf that required to remove the amount of salt addedat the surface by net ice formation of 1 myr -1. It seemslikely, though, that the longshore salinity gradient isitself maintained by a slow westward flow along theshelf-part of the Antarctic coastal current-wherebythe salinity of the water is gradually raised to the west-ward by the widespread freezing there. There are nodirect measurements of mean velocities on the shelf,but a longshore flow of 1 x 10⁶ m 3 s- l, carrying salt-enriched water off the shelf at its western end on theAntarctic Peninsula, would be adequate to remove theremaining salt produced during the annual ice-forma-tion cycle (Gill, 1973). These estimates, derived en-tirely from conditioning on the shelf, thus give a figurefor the total flux of dense water off the shelf of about
2 x 10⁶ m3 s- l, which is in fairly good agreement withthe value of 2-5 x 10⁶ m3 s- ' obtained by Carmackand Foster (1975) from direct measurements of the out-flow of Weddell Sea Bottom Water.
The offshore-moving shelf water encounters thewaters of the open Weddell Sea in a frontal zone at theedge of the continental shelf. Detailed studies of thiszone demonstrate a rather complicated mixing process,involving both the warm deep water of the WeddellSea and the winter-cooled near-surface water, throughwhich the characteristics of the shelf water are modi-fied to those of the descending Weddell Sea BottomWater (Foster and Carmack, 1976a).
As noted, there are subtleties as well in the dynamicsof the descent on account of the rotational constraint,which tends to orient the flow westward along theisobaths rather than across them. In order to identifythe conditions that bring about flow down the slope tothe floor of the Weddell Sea, with the amount of en-trainment observed, Killworth (1977) considered a se-ries of simplified models of turbulent plumes in a sta-bly stratified environment. Bottom friction wasessential, of course, for any downslope flow at all, butthe mere fact of shelf water being denser than its sur-roundings was not in itself sufficient for flow to reachthe sea floor with the right entrainment, whether theplume was two-dimensional, three-dimensional, or in-termittent. Because the thermal-expansion coefficientfor sea water increases with pressure, however, verycold descending water can draw on its own internalenergy to increase its kinetic energy; thus if a relativelydense falling parcel is sufficiently colder than its sur-roundings, the buoyancy force acting on it can increaseduring the descent, even though the parcel is falling instably stratified water. With this effect taken into ac-count, Killworth (1977) was able to construct modelplumes (three-dimensional, steady as well as intermit-tent) that both descended far enough to reach the floorof the Weddell Sea and entrained roughly the observedamount of surrounding water along the way. These hada substantial component of flow along the isobaths too,consistent with the bulk of the bottom water enteringonto the sea floor in the northwestern comer of theWeddell Sea.
The Weddell Sea Bottom Water is fresher than theoverlying water, but in the southwestern Pacific-spe-cifically, north of the Ross Sea (figure 1.3) to the mid-ocean ridge (about lat. 65°S), and close to Antarcticasouth of Australia-the salinity increases with depthnear the bottom to values >34.72%o (Gordon, 1971,1975a; Gordon and Molinelli, 1975). This high-salinitybottom water must have a different source, and it hasbeen traced to the Ross Sea (e.g., A. L. Gordon, 1974),where cold, saline shelf water has been observed to
20Bruce A. Warren
descend the western continental slope in a mannersimilar to that of the downslope flow in the WeddellSea (Gordon, 1975a). Although the effect of the RossSea bottom water on the deep temperature distributionis barely noticeable, and its effect on the salinity dis-tribution only became clear through the precision af-forded by conductivity measurements, its productionrate is not necessarily a great deal less than that ofWeddell Sea Bottom Water, because the water withwhich the shelf water mixes to form bottom water isboth more saline and much warmer than in the Wed-dell Sea. No transport measurements like those of Car-mack and Foster (1975) have been made, however.
The oceanographic conditions on the Ross Sea con-tinental shelf are roughly similar to those in the Wed-dell Sea, in that there is westward flow along the shelf,and the salinity of the shelf water increases to the westby 0.3-0.4%bo (Jacobs, Amos, and Bruchhausen, 1970;Jacobs, Gordon, and Ardai, 1979). This correspondencesuggests that the mechanisms sketched by Gill (1973)are also operative in the Ross Sea in moving densewater off the shelf onto the continental slope. A ver-tical circulation (involving the Ekman transport andgeostrophic shear) about 60% as large as that on theWeddell Sea shelf is indicated (Gill, 1973); that is, anoffshore flux along the length of the Ross Sea shelf ofroughly 0.6 x 10⁶ m3 s-'. No estimate has been madeof the rate of removal of shelf water by the longshoreflow.
The water deeper than 300-500 m on the westernpart of the Ross Sea shelf is the most saline (34.8-35.0°bo) and the most dense (or = 28.0-28.1) waterfound in the Antarctic (Jacobs, Amos, and Bruchhau-sen, 1970; Gordon, 1971). One wonders to what extentit may be involved in the formation of bottom waterin the Ross Sea, but no very satisfactory account seemsto have been given for the existence of this very salinewater. Because the high salinities of the layer are highlycorrelated with low temperatures, and because itsthickness and breadth increase southward to the RossIce Shelf, it is tempting to think that the characteristicsof the layer may be imparted through freezing at thebase of the ice shelf. Near the front of the ice shelf,though, the evidence is of melting at the base (Jacobs,Amos, and Bruchhausen, 1970). Moreover, vertical var-iations of temperature and salinity observed beneaththe ice shelf far to the south at 82°S, 169°W demon-strated melting there too at the time of observation,but because the lowest 6 m of ice was of marine originrather than terrestrial, it is not certain what the pre-vailing condition is at that point (Gilmour, 1979; Ja-cobs, Gordon, and Ardai, 1979). Even if freezing is oc-curring, the maximum possible rate at the base of theice shelf is very small (3.5 cm yr-1; Jacobs, Gordon, andArdai, 1979), and any outflow from beneath the ice
shelf consistent with the required salinity enhance-ment would be much less than the estimated offshoretransport of water on the continental shelf. The bulkof this very saline water is found in a large topographicdepression on the shelf, whose sill depths near the edgeof the shelf are not well known (Jacobs, Amos, andBruchhausen, 1970); perhaps most of that dense layeris indeed renewed only slowly through freezing underthe western Ross Ice Shelf, is trapped in the depression,and does not contribute significantly to the local bot-tom-water formation (Gordon, 1971).
On the other hand, the high salinity of this westernshelf water might be due entirely to annual sea-icefreezing, as proposed by Gill (1973). Unusually densewater formed in that process could contribute substan-tially to bottom water, or it might form infrequentlyand merely accumulate in the topographic depressionif the sill is actually shallow enough to allow muchcontainment. The situation is unclear.
Several similar deep depressions-though of muchsmaller area-exist on the continental shelf off theAd6lie Coast of Antarctica (figure 1.3). They are filledbelow their sill depths with water of temperature closeto the freezing point, and of salinity 34.4-34.7oo, prob-ably as a result of deep convection associated withwinter sea-ice formation (Gordon and Tchernia, 1972).Evidently such water spills over the sills, because it isfound as a layer a few tens of meters thick on thenearby continental slope, underlying the high-salinitybottom water from the Ross Sea. This low-salinity bot-tom water mixes into the Ross Sea water rapidlyenough that it has not been detected far from the con-tinental rise near its points of origin. No estimates ofthe rate of production of the Ad6lie Coast water havebeen made, though the rate must be relatively small,given the small volumes of such water that have beenfound away from the shelf. The flow down the conti-nental slope appears intermittent, inasmuch as dupli-cated stations in February 1969 and December 1971showed that the comparatively fresh layer was morewidespread at the latter time (Gordon and Tchemia,1972).
Evidence has also been cited by Jacobs and Georgi(1977) for some small production of bottom water offEnderby Land. They suggest that new source regionsare revealed almost with each new exploration of theAntarctic continental slope.
Bottom water from these several sources-the Wed-dell Sea being the paramount one-mixes with thewarmer, more saline water above to form the "Antarc-tic Bottom Water" of the world ocean. Since all thesubtypes originate through freezing at the sea surface,it is the coldest, and thereby the densest, deep waterin the open ocean, detectable into northern latitudesby low temperatures close to the bottom.
21Deep Circulation of the World Ocean
Not all deep water formed in the Antarctic is bottomwater, however. Carmack and Killworth (1978) havedescribed a layer of relatively cold, fresh water atdepths of about 2 km off Wilkes Land (figure 1.3; long.150-170°E), which they demonstrated through Kill-worth's (1977) plume theory to have originated mostprobably from shelf water that is not quite denseenough to sink to the bottom. Instead, it sinks to adepth where its density matches that of the surround-ing water, in the manner of the Mediterranean and RedSea outflows. This particular instance of sinking tomid-depths was discernible because the shelf waterintruded into saline deep water from the Ross Sea, andhence could be identified by its relatively low salinity.Such phenomena seem possible elsewhere around Ant-arctica, but in regions where the surrounding deepwater is fresher-more like that in the Weddell Sea-they would be far more difficult to detect in distribu-tions of temperature and salinity, though perhaps lessso in distributions of nutrients (e.g., silica). As Car-mack and Killworth (1978) pointed out, if the salinityof shelf water really is increased almost everywherearound Antarctica by annual freezing, then some proc-ess must operate to remove the extra salt from theshelf; that process may be sinking of water to mid-depths, in the manner that was observed off WilkesLand. If so, then the rate of deep sinking in the Ant-arctic might be much greater than that involved in theimmediate production of bottom water; but there is nobasis at present for estimating how much greater.
Furthermore, a set of closely spaced observations inthe eastern Weddell Sea in February 1977 revealed acolumn of relatively cold, fresh water some 30 km indiameter, extending from near the surface through thewarm, saline deep water to about 4000 m (Gordon,1978). It suggests a relic of deep convective overturn-ing, such as has been well documented in the north-western Mediterranean Sea in regions of similarlysmall area (MEDOC Group, 1970). It may represent yetanother mode of deep sinking in the Antarctic, if notto the bottom at least to mid-depths, that had beenmissed in the past, perhaps because of difficulty ofaccess to critical areas or too coarse a spacing of sta-tions. The specific conditions for overturning in theWeddell Sea have been carefully considered by Kill-worth (1979), but again there is unsufficient basis atpresent for estimating how significant a contributionsuch events may make.
1.4.2 Sinking in the Northern North AtlanticNext to the Antarctic Bottom Water, the densest waterin the open ocean is what Wiist (1935) called LowerNorth Atlantic Deep Water. It does not originate, how-ever, as Nansen (1912) first proposed, and Wiist (1935)and Sverdrup (Sverdrup, Johnson, and Fleming, 1942)
maintained, from wintertime convection to the bottomof the Irminger or Labrador Seas,9 but from dense Nor-wegian Sea water that flows into the North Atlanticover three sills on the ridge connecting Greenland andthe British Isles (figure 1.7). These overflows entrainresident North Atlantic water in the course of theirdescent, and join together to form the bottom water ofthe northern North Atlantic.
It is curious that the significance of these overflowsfor the large-scale circulation was not appreciated untilthe late 1950s. Dr. Carpenter (Carpenter, Jeffreys, andThomson, 1869) had hypothesized long before thatoverflow east of the Faroe Islands was the source ofbottom water in the northern North Atlantic, and Ti-zard (1883) actually observed some such flow over theWyville Thomson Ridge, which is the southwesternboundary of the Faroe Bank Channel (figure 1.7). Knud-sen (1899) discovered the western overflow, and alsofound overflow water on the southern side of the Ice-land-Faroe Ridge, which he supposed had come southacross that ridge; in hindsight, his station positionssuggest that this water was really outflow from theFaroe Bank Channel, and had thus derived from theeastern, rather than the central, overflow. In any case,with better station coverage, Nielsen (1904) unambig-uously established the existence of the central over-flow, and Nansen (1912), with additional observations,discussed all three of them, presenting illustrative sec-tions of water properties across the ridge. Yet somehowall four observers, with the possible exception of Niel-sen, believed that the overflows could make only aminor contribution to the deep water of the NorthAtlantic-an opinion also expressed by Wiist (1935).Although Jacobsen (1916), Brennecke (1921), and De-fant (1938) all briefly suggested somewhat greater sig-nificance for the overflows, they were generally ignoreduntil Cooper (1952, 1955a,b) and Dietrich (1956,1957a,b), more or less independently, recalled them toattention." [Evidence for overflow was also noted byVinogradova, Kislyakov, Litvin, and Ponomarenko(1959) in new data obtained at this time, but they, likethe writers at the turn of the century, did not recognizeits large-scale significance.]
The deepest passage across the ridge is the FaroeBank Channel, which has a sill depth of about 800 m.Evidently some small amounts of Norweigan Sea waterin this passage-do spill intermittently over the WyvilleThomson Ridge (Ellett and Roberts, 1973), but most ofthis overflow continues northwestward through thechannel to its sill, where the measured shear of geo-strophic velocity in combination with analysis of watercharacteristics indicates an outflow of Norwegian Seawater of roughly 1 x 10⁶ m3s - (Crease, 1965). Afterexiting from the Faroe Bank Channel, this current joinsa second overflow, which passes over the ridge betweenthe Faroe Islands and Iceland, where the sill depth is
22Bruce A. Warren

300-400 m (figure 1.7).11 By referencing geostrophicvelocity calculations for sections southeast of Icelandaccording to the water characteristics, Steele, Barrett,and Worthington (1962) estimated the volume trans-port of this combined Iceland-Scotland overflow, afterit has left the ridge, to be about 5 x 10⁶ m3 s- l. Analysisof that overflow water in terms of its component watertypes showed that about 3 x 10⁶ m3 s - l of the net flowis entrained Atlantic water, leaving 1 x 10⁶ m3 s- l forthe transport of "pure" Norwegian Sea water acrossthe Iceland-Faroe sill (Worthington, 1970). With dif-ferent data, Hermann (1967) also estimated roughly2 x 106 m3 s-
1 for the net outflow of Norwegian Seawater between Iceland and Scotland.
This overflow continues southward against the east-ern side of the Mid-Atlantic Ridge, and passes throughthe Gibbs Fracture Zone near lat. 53°N into the Labra-dor Basin (figure 1.7). Its westward volume transportthere was calculated by Worthington and Volkmann
50"1
400N
(1965)-on the same basis as by Steele, Barrett, andWorthington (1962) farther north-to be still about5 x 106 m3 s- x, suggesting little direct flow into lowlatitudes of the eastern North Atlantic, although Leeand Ellett (1965) have detected overflow influence onwater characteristics as far south as lat. 47°N in theeastern Atlantic. This current then flows northward inthe eastern Labrador Basin, and, south of Greenland,joins the third overflow from the Norwegian Sea. Thatoverflow comes through the Denmark Strait (Dietrich,1957b; Mann, 1969), where the sill depth is about600 m, and is easily identified as cold water bankedagainst Greenland (figure 1.8).
Geostrophic velocity calculations, referenced bywater characteristics as for the Iceland-Scotland over-flow, gave a figure of about 10 x 106 m 3 s - for thevolume transport of the full overflow current south ofGreenland (Swallow and Worthington, 1969), therebyindicating a contribution of 5 x 10⁶ m 3 s -l from the
Figure I.7 Index map identifying the overflow currents fromthe Norwegian Sea and local place names mentioned in thetext. (After Worthington, 1970.)
23Deep Circulation of the World Ocean
ZIZ
QQQ1%Qz
0 km 10 20 30 40 50
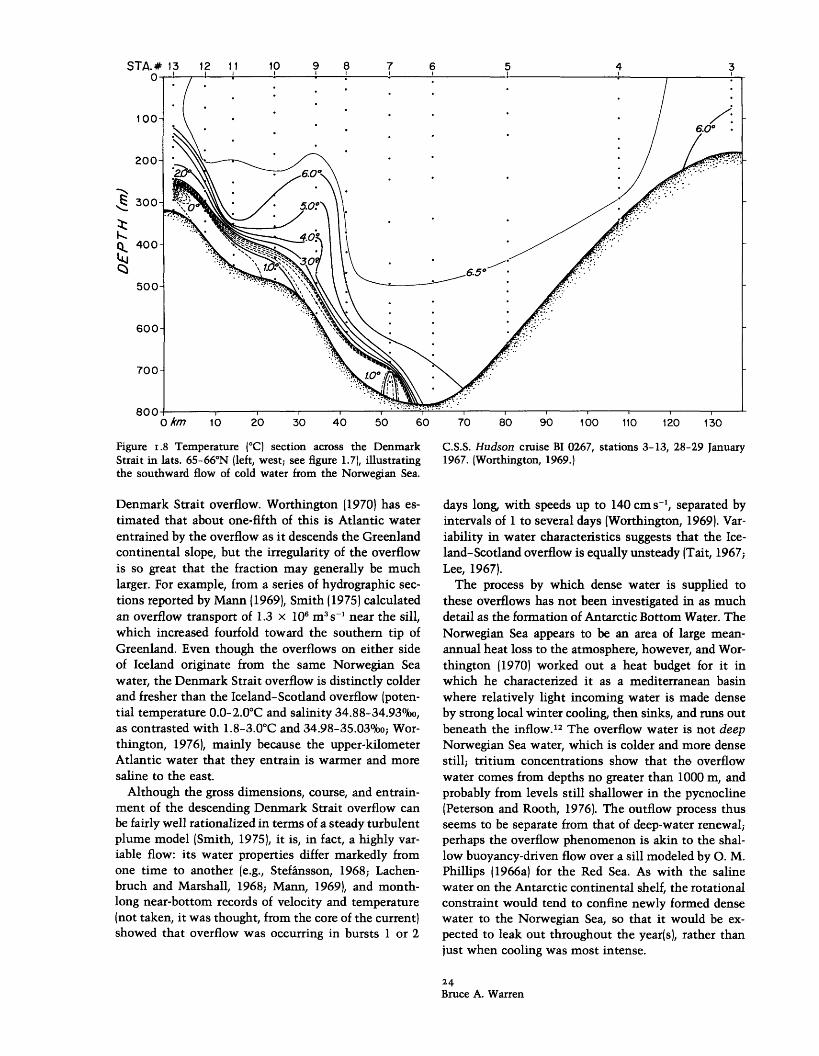
Figure .8 Temperature (C) section across the DenmarStrait in lats. 65-66°N (left, west; see figure 1.7), illustratinthe southward flow of cold water from the Norwegian Se;
Denmark Strait overflow. Worthington (1970) has e,timated that about one-fifth of this is Atlantic wattentrained by the overflow as it descends the Greenlancontinental slope, but the irregularity of the overfloiis so great that the fraction may generally be muclarger. For example, from a series of hydrographic sections reported by Mann (1969), Smith (1975) calculatean overflow transport of 1.3 x 10⁶ m3 s- ' near the silwhich increased fourfold toward the southern tip cGreenland. Even though the overflows on either sidof Iceland originate from the same Norwegian Sewater, the Denmark Strait overflow is distinctly coldsand fresher than the Iceland-Scotland overflow (potertial temperature 0.0-2.0°C and salinity 34.88-34.93%(as contrasted with 1.8-3.0°C and 34.98-35.03%0o; Woithington, 1976), mainly because the upper-kilometeAtlantic water that they entrain is warmer and morsaline to the east.
Although the gross dimensions, course, and entrairment of the descending Denmark Strait overflow cabe fairly well rationalized in terms of a steady turbulenplume model (Smith, 1975), it is, in fact, a highly vaiiable flow: its water properties differ markedly frorone time to another (e.g., StefAnsson, 1968; Lachenbruch and Marshall, 1968; Mann, 1969), and monthlong near-bottom records of velocity and temperatur(not taken, it was thought, from the core of the currenlshowed that overflow was occurring in bursts 1 or '
60 70 80 90 100 110 120 130
C.S.S. Hudson cruise BI 0267, stations 3-13, 28-29 January1967. (Worthington, 1969.)
days long, with speeds up to 140 cm s - , separated byintervals of 1 to several days (Worthington, 1969). Var-iability in water characteristics suggests that the Ice-land-Scotland overflow is equally unsteady (Tait, 1967;Lee, 1967).
The process by which dense water is supplied tothese overflows has not been investigated in as muchdetail as the formation of Antarctic Bottom Water. TheNorwegian Sea appears to be an area of large mean-annual heat loss to the atmosphere, however, and Wor-thington (1970) worked out a heat budget for it inwhich he characterized it as a mediterranean basinwhere relatively light incoming water is made denseby strong local winter cooling, then sinks, and runs outbeneath the inflow.12 The overflow water is not deepNorwegian Sea water, which is colder and more densestill; tritium concentrations show that the overflowwater comes from depths no greater than 1000 m, andprobably from levels still shallower in the pycnocline(Peterson and Rooth, 1976). The outflow process thusseems to be separate from that of deep-water renewal;perhaps the overflow phenomenon is akin to the shal-low buoyancy-driven flow over a sill modeled by O. M.Phillips (1966a) for the Red Sea. As with the salinewater on the Antarctic continental shelf, the rotationalconstraint would tend to confine newly formed densewater to the Norwegian Sea, so that it would be ex-pected to leak out throughout the year(s), rather thanjust when cooling was most intense.
24Bruce A. Warren
The other location in the northern North Atlanticwhere deep sinking occurs is the Labrador Sea. Northof roughly lat. 40°N there is a distinct salinity mini-mum at a potential temperature of about 3.5°C (Wor-thington and Metcalf, 1961), which grows more pro-nounced with approach to the Labrador'Sea, wherenearly homogeneous water (temperature 3.5°C, sal-inity -34.9%o) is found in winter from the sea surfaceto about 1500 m (e.g., Worthington and Wright, 1970).The salinity minimum is associated with an oxygenmaximum, which was Wiist's (1935) diagnostic for hisMiddle North Atlantic Deep Water, and these charac-teristics must be imparted in the Labrador Sea, presum-ably through deep convection driven by intense wintercooling at the surface. Despite extensive wintertimesurveys in the area, however, no well-documenteddeep-overturning events have yet been reported, butLazier (1973a) has found a few examples in the recordsof Weather Ship Bravo (56°30'N, 51°00'W) of deep iso-pycnals rising to the surface layer for brief intervals oftime, in association with virtually homogeneous watercolumns 1500 m deep. Most likely, the convection oc-curs like that in the northwestern Mediterranean Sea(MEDOC Group, 1970), in small patches and very in-termittently (perhaps not even every winter), so thatthe convection could escape notice unless the obser-vations were frequent and closely spaced.13
Because of these small space and time scales, it isdifficult to make much more than a guess at the long-term mean rate of deep sinking in the Labrador Sea.From an estimate of the net annual heat flux acrossthe sea surface, Wright (1972) suggested 3.5 x10⁶ m3 S- 1 .
Both the Labrador Sea water and the overflow waterare more saline at their sources than the AntarcticBottom Water, and their salinities are increased some-what in middle latitudes of the North Atlantic throughmixing with the outflow from the Mediterranean Sea(see below, this section). Although they are both madedense by cooling, their temperatures are not reduced tothe freezing point before sinking, but remain highenough that, despite the salinity difference, they areless dense in situ than the Antarctic Bottom Water,and therefore override it.14 This high-salinity waterspreads throughout the South Atlantic, is carried east-ward around Antarctica in the Circumpolar Current,and its elevated salinities can be followed into lowlatitudes of the South Indian and South Pacific Oceans(Reid and Lynn, 1971). The effect of North AtlanticDeep Water in maintaining high oxygen concentrationsin the deep ocean is familiar, but its source waters arealso exceptionally low in dissolved silica: <8 M 1- inthe Norwegian Sea overflow (Stefansson, 1968),roughly 10 pl.M1-' in the Labrador Sea water (Mann,Coote, and Garner, 1973), and about 6 M1-1 in theMediterranean outflow (Schink, 1967). Consequently,
the deep North Atlantic has the lowest silica concen-trations of all the oceans (Metcalf, 1969), there is apronounced deep silica minimum in the South Atlanticbetween the Antarctic Intermediate and BottomWaters (Mann, Coote, and Garner, 1973), and there iseven a weak silica minimum in the deep southwesternPacific due to the influence of North Atlantic sourcewaters (Warren, 1973).
1.4.3 Outflows from Marginal SeasExcess evaporation makes water in the MediterraneanSea, the Red Sea, and the Persian Gulf more saline andthereby more dense than that in the outlying ocean,and circulations are set up in the shallow connectingstraits in which near-surface water flows in, and dense,saline water flows out beneath. The outflows do notfall to the floor of the open ocean, however, because indescending the continental slopes they entrain enoughlight thermocline water to become less dense than thedeep water of the open ocean, and they therefore spreadout at mid-depths. They are thus not important sourcesfor the deep circulation, but through vertical mixingthey do at least influence the properties of the deepwater; hence they are noted briefly here.
The salinity maximum marking the core of the Med-iterranean outflow [Wiist's (1935) Upper North Atlan-tic Deep Water] is found at a depth of about 1200 m inthe southeastern North Atlantic (e.g., Fuglister, 1960),but relatively high salinities resulting from the outflowcan be detected at least as deep as 3000 m (Worthingtonand Wright, 1970), and the effect of the outflow inraising the salinity of the Labrador Sea water and Nor-wegian Sea overflow water was remarked above. Therate of outflow through the Straits of Gibraltar hasbeen estimated from the overall salt budget for theMediterranean Sea and by current measurements ofduration a few days to 2 weeks; both methods agree ona mean value of about 1 x 10⁶ m 3s- ' (Lacombe, 1971).Calculations by Smith (1975) show that by the timethe outflow current completes its descent and departsfrom the continental slope, its volume transport hasincreased, by entrainment of Atlantic water, to roughly10 x 106 m3 s- . To what extent any of this transportcontributes to the flow of the deep water below-asdistinct from its properties-is not known.
The salinity maximum associated with the Red Seaoutflow occurs at depths of 500-600 m in the northernArabian Sea, but relatively high salinities, due presum-ably to mixing with the outflow water, are found thereat least as deep as 2500 m (Wyrtki, 1971). A salt-budgetcalculation based on climatological data cited by Sied-ler (1968) gives a mean outflow through Bab-el-Mandebof 0.4 x 10⁶ m3 s-h, which is the same value that hederived from direct current measurements there of 2.5
25Deep Circulation of the World Ocean

days duration. Such close agreement was probably for-tuitous, however, because his directly measured inflowvalue was 40% greater. The entrainment during thedescent into the Gulf of Aden has not been estimated.
The Persian Gulf outflow (salinity maximum atdepths of 300-400 m in the Gulf of Oman; Wyrtki,1971) has a small, patchy effect on intermediate-depthproperty fields in the North Indian Ocean (Rochford,1964), but any influence on the deeper distributionsseems to be masked by that of the Red Sea outflow(Wyrtki, 1971). It is probably only slight, however, be-cause the outflow through the Strait of Hormuz is verysmall: only 0.1 x 10⁶ m 3 s- l according to the salt budget(Koske, 1972).
1.5 Deep Western Boundary Currents in the WorldOcean
Many more hydrographic stations have been occupiedsince Sverdrup wrote chapter XV of The Oceans. Theyhave filled in blank areas in the world-ocean coverage,added details to property distributions, and sharpenedthe definition of features, but our broad picture of theproperty fields has not changed qualitatively. What haschanged greatly is the conception of their basis: thatthe underlying mean deep circulation, largely maskedby lateral mixing of the water characteristics, is a sys-tem of western boundary currents and poleward inte-rior flows, as in the dynamically consistent models ofStommel and Arons (1960a,b)-rather than the Merziansystem of basin-wide, slow meridional flows fromsource regions.
Although this conception makes good sense, it is notso easy to tell from observation how correct it is. Thekey element in the circulation theory is the supposedgeneral upward movement of deep water, but the hy-pothesized mean rate (-10-5 cms -') is so small as tobe utterly beyond present measurement capability.Probably measurement of the deep interior flow, to seewhether it is directed poleward in vertical average, istechnically feasible, but certainly not economicallyand socially so, given the immensity of the current-meter program that would be required. Large-scaletracer fields are not of much help in this respect sincemixing effects can make them ambiguous with regardto circulation patterns for the small mean speeds(-10 -2 cm s- ') of the interior flow (section 1.3; Kuo andVeronis, 1973).
What can be observed, through current measure-ments and short lines of hydrographic stations, are thenarrow, relatively swift, deep western boundary cur-rents predicted by the circulation theory. To be sure,some other theory, with different forcing, might alsorequire such boundary currents, but they are a neces-sary element of the Stommel-Arons dynamics, and
demonstrations of their existence in much of the worldocean have contributed strong support-indeed, theprimary observational support-for its essential ideas.This section will therefore assess the evidence for deepwestern boundary currents in the world ocean, withcomment on a few related features of the circulation.
1.5.1 Atlantic OceanThere are two deep boundary currents in the westernAtlantic, the one flowing southward from the Norwe-gian and Labrador Seas, and the other flowing north-ward from the Antarctic [the latter not included in thebarotropic model of Stommel and Arons (1960b) northof the counterpart of the Antarctic Peninsula].
After the Norwegian Sea overflow current passes thesouthern tip of Greenland, it takes a counterclockwisecourse around the Labrador Sea (figure 1.7) and flowssoutheastward along the North American continentalslope by Labrador and Newfoundland (Swallow andWorthington, 1969). Figure 1.9, for example, is a tem-perature section running from southern Labradornortheast to the southern tip of Greenland. The coldoverflow water may be seen pressed up against thelower Greenland slope, and the associated density gra-dient (mainly determined by temperature there) is con-sistent geostrophically with northwestward flow in-creasing in strength from mid-depths to the bottom.Adjacent to the North American continental slope, thesoutheastward-flowing deep boundary current is evi-dent in similar fashion, 200-300 km wide, probablyincluding Labrador Sea water above the overflow water.Three neutrally buoyant floats tracked nearby at depthsof 1600-2400 m all registered southeastward flow and,in combination with station data, suggested extensionof such flow up to about 1200 m. Though the meas-urements were of insufficient duration (12-31 hours)for very satisfactory results, nevertheless the indicatedvolume transport for the deep boundary current wasroughly 10 x 106 m 3 s- ' (Swallow and Worthington,1969).
High-oxygen and low-silica values close to the con-tinental slope in a similar depth interval show that thiscurrent continues around the Grand Banks of New-foundland, at least in the long-term mean, but recordsfrom moored current meters in the area have not yetgiven clear, direct evidence for such flow (Clarke andReiniger, 1973; Clarke, Hill, Reiniger, and Warren,1980).
Westward and southward in the North Atlantic, pro-nounced tracer characteristics marking the deepboundary current are lost, and its cross-stream densitygradient is not readily distinguishable from that of thenearby Gulf Stream; hence evidence for its existencecomes mainly from velocity measurements. On thecontinental slope north of the Gulf Stream near long.
26Bruce A. Warren
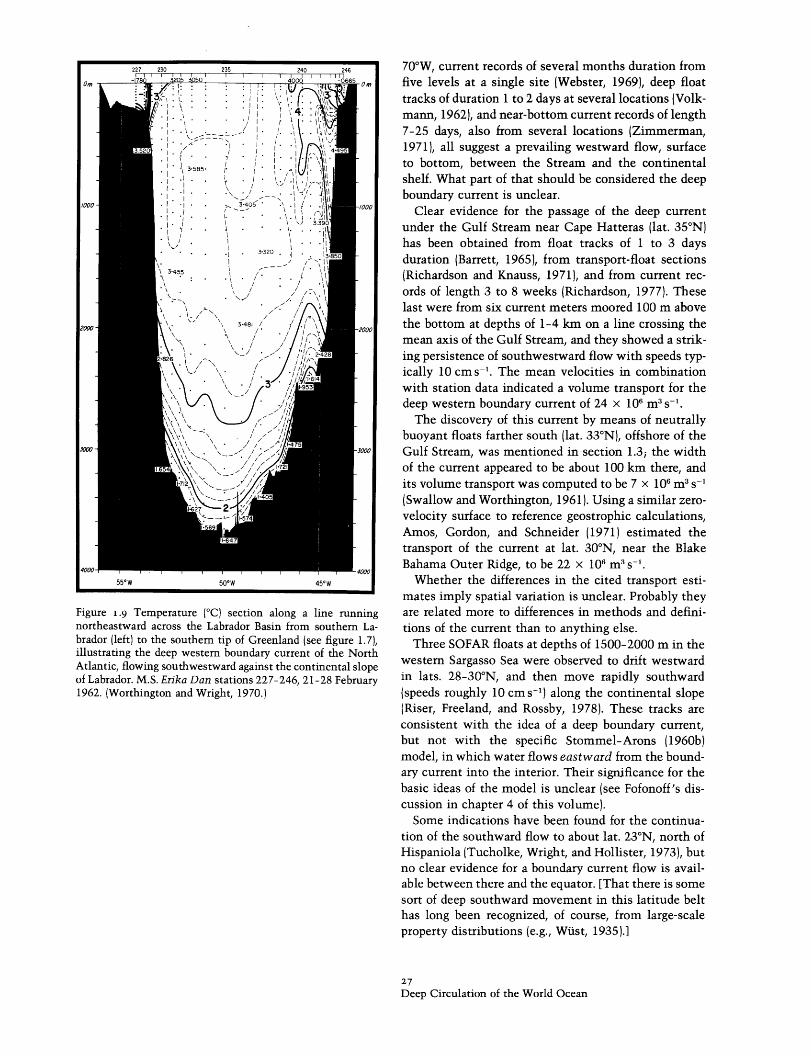
55°W 50W
Figure .9 Temperature (C) section along anortheastward across the Labrador Basin frombrador (left) to the southern tip of Greenland (seillustrating the deep western boundary currentAtlantic, flowing southwestward against the contof Labrador. M.S. Erika Dan stations 227-246, 211962. (Worthington and Wright, 1970.)
/u vW, current recoras or several montns auration tromfive levels at a single site (Webster, 1969), deep floattracks of duration 1 to 2 days at several locations (Volk-mann, 1962), and near-bottom current records of length7-25 days, also from several locations (Zimmerman,1971), all suggest a prevailing westward flow, surfaceto bottom, between the Stream and the continentalshelf. What part of that should be considered the deepboundary current is unclear.
Clear evidence for the passage of the deep currentunder the Gulf Stream near Cape Hatteras (lat. 35°N)has been obtained from float tracks of 1 to 3 daysduration (Barrett, 1965), from transport-float sections(Richardson and Knauss, 1971), and from current rec-ords of length 3 to 8 weeks (Richardson, 1977). Theselast were from six current meters moored 100 m abovethe bottom at depths of 1-4 km on a line crossing themean axis of the Gulf Stream, and they showed a strik-ing persistence of southwestward flow with speeds typ-ically 10 cms-'. The mean velocities in combinationwith station data indicated a volume transport for thedeep western boundary current of 24 x 106 m3 s-'.
The discovery of this current by means of neutrallybuoyant floats farther south (lat. 33°N), offshore of theGulf Stream, was mentioned in section 1.3; the widthof the current appeared to be about 100 km there, andits volume transport was computed to be 7 x 10⁶ m3 s-'(Swallow and Worthington, 1961). Using a similar zero-velocity surface to reference geostrophic calculations,Amos, Gordon, and Schneider (1971) estimated thetransport of the current at lat. 30°N, near the BlakeBahama Outer Ridge, to be 22 x 106 m 3 s- l.
Whether the ditterences in the cited transport esti-mates imply spatial variation is unclear. Probably they
line running are related more to differences in methods and defini-southern La- tions of the current than to anything else..e figure 1.71, Three SOFAR floats at depths of 1500-2000 m in theof the North
tental slope western Sargasso Sea were observed to drift westward-28 February in lats. 28-30°N, and then move rapidly southward
(speeds roughly 10 cm s-) along the continental slope(Riser, Freeland, and Rossby, 1978). These tracks areconsistent with the idea of a deep boundary current,but not with the specific Stommel-Arons (1960b)model, in which water flows eastward from the bound-ary current into the interior. Their significance for thebasic ideas of the model is unclear (see Fofonoff's dis-cussion in chapter 4 of this volume).
Some indications have been found for the continua-tion of the southward flow to about lat. 23°N, north ofHispaniola (Tucholke, Wright, and Hollister, 1973), butno clear evidence for a boundary current flow is avail-able between there and the equator. [That there is somesort of deep southward movement in this latitude belthas long been recognized, of course, from large-scaleproperty distributions (e.g., Wiist, 1935).]
27Deep Circulation of the World Ocean
__- - I I Ir .1 I . I
I

Deep water from the North Atlantic is easily iden-tified in the South Atlantic by its relatively high sal-inity at depths exceeding 1500 m, and relatively strongsouthward flow along the entire western boundary ofthe South Atlantic is evident from intensification closeto South America of the salinity maximum (depth in-creasing southward from 1600 m to about 2500 m) andits associated temperature inversion (Wiist and Defant,1936; Fuglister, 1960). The breadth of this zone of in-creased salinity maximum is 500-1000 km, which,however, is probably greater than the width of theboundary current because of lateral-mixing effects.Clear examples of the North Atlantic tracer character-istics are shown in figure 1.10: sections of potentialtemperature, salinity, and the concentrations of dis-solved oxygen and silica on a line crossing the southernBrazilian Basin, roughly along lat. 30°S (Reid, Nowlin,and Patzert, 1977). The temperature inversion is seenat depths of 1600-1800 m within about 1000 km ofSouth America; the strong salinity maximum and sil-ica minimum are found at about 2000 m within500 km of the continental slope, and the oxygen max-imum lies deeper (2000-3000 m) and extends some-what farther eastward with high values. The impres-sion is of a concentration of southward flow near SouthAmerica, from the "top" of the Antarctic Bottom Waterat about 3500 m to roughly 1500 m.
Probably the most satisfactory estimates of volumetransports for the deep meridional flows in the westernSouth Atlantic are those by Wright (1970). He per-formed geostrophic calculations for the IGY sections(Fuglister, 1960) by assuming zero meridional velocityat the boundary between North Atlantic Deep Waterand Antarctic Bottom Water, as defined by a break inthe temperature-depth and salinity-depth curves near2°C and 34.89%0o, found at levels of 3400-4000 m [thesame break that had been discovered by Buchanan (seesection 1.2), and exploited also for velocity calculationsby Wiist (1938)]. As an upper boundary for the NorthAtlantic Deep Water, he adopted the 1600-m level at16°N and 8S and the 1800-m level at 32°S (Wright,personal communication), and he derived thereby afigure of 9 x 10⁶ m3 s- for the southward transport ofNorth Atlantic Deep Water (including both boundarycurrent and interior flow in the western trough).
Beneath the North Atlantic Deep Water, the cold,northward-flowing Antarctic Bottom Water is pressedup against the South American continental slope alongthe entire length of the South Atlantic, except close tothe equator (Wiist and Defant, 1936; Fuglister, 1960).It is indicated in figure 1.10 by the relatively low tem-perature, salinity, and oxygen concentration and thehigh silica concentration (cf. figure 1.5) below 3500 m,the extreme values being found close against the west-
em boundary. The isotherms (and isopycnals) slopedownward to the east, consistent geostrophically witha northward-flowing current increasing in speed towardthe bottom. The width of this current, as defined bythe zone of sloping isotherms (Cato 6 stations 7-11),is about 500 km. Wright's (1970) calculations give avolume transport for the current of about 6 x 10⁶ m3 s- 'in middle latitudes of the South Atlantic, diminishingto about 2 x 10⁶ m3 s-' near the equator.
The current continues northward across the equator,but in lats. 8-16°N it is found not beside the westernboundary but against the Mid-Atlantic Ridge, which isthe eastern boundary of the basin (Fuglister, 1960).Why this transposition occurs is not wholly clear, butperhaps it is related to the sharp northward increase inthe depth of the western basin there, from about4200 m at lat. 2N to about 5500 m at lat. 16°N. Theidea is familiar that meridional bottom slope has aneffect on ocean circulation analogous to that of varia-tion in the Coriolis parameter; poleward increase indepth tends to counteract the p8-effect, and, if the rateof increase is large enough, boundary currents can beshifted from the western to the eastern sides of basins(e.g., Fandry and Leslie, 1972). The transposition shouldoccur if, roughly speaking, the meridional bottom slopeS > H,/f, where H is the thickness of the bottomcurrent. At lat. 10°N, f = 2.5 x 10⁻⁵s-1 and =2.3 x 10- '1 cm-' s-'; for H 700 m at lats. 8N and16°N (Fuglister, 1960), the critical value of the slope is6.4 x 10- 4, which is less than the actual slope of about8.4 x 10- 4 .
Whatever the reason for the transposition, there isno indication of this boundary current on transatlanticsections at and north of lat. 24°N (Fuglister, 1960).Apparently, the water from it spreads out somehowover the floor of the basin (Worthington and Wright,1970), and such a poleward interior flow would be qual-itatively consistent with the level-bottom Stommel-Arons dynamics. Traces of Antarctic Bottom Waterhave been found in the lowest few hundred meters, forexample, south of the Gulf Stream on the 50th merid-ian (e.g., Clarke et al., 1980), in the vicinity of theBlake-Bahama Outer Ridge near lat. 30°N (Amos, Gor-don, and Schneider, 1971), and north of the BahamaBanks and Hispaniola (Tucholke, Wright, and Hollister,1973). In the latter two instances these traces had fairlydefinitely been incorporated into the southward-flow-ing deep western boundary current, suggesting a gen-eral counterclockwise spreading and movement of Ant-arctic Bottom Water in the western North Atlantic.
The coldest water in the eastern trough of the Atlan-tic (north of the Walvis Ridge) is observed at the equa-tor (potential temperature <1.7°C; Wiist and Defant,1936; Fuglister, 1960). Minimum temperatures in-crease gradually both northward and southward, show-
28Bruce A. Warren
ing that the principal inflow of water below the generalcrest of the Mid-Atlantic Ridge (3500 m depth, say)occurs from the western Atlantic through the Ro-manche Fracture Zone, on the equator (e.g., Drygalski,1904; Wiist, 1933; Metcalf, Heezen, and Stalcup, 1964).No estimate of the rate of this inflow has been made.Silica values on the surface where potential tempera-ture is 2°C increase northward (Metcalf, 1969), as wellas southward (Chan, Drummond, Edmond, and Grant,1977), indicating further that the deep water "ages"poleward.
Many additional fracture zones cut across the Mid-Atlantic Ridge, but the existing evidence suggests thatthere are only three others through which noticeabledeep-water transport may take place. As described insection 1.4, the Iceland- Scotland overflow passes west-ward into the Labrador Basin through the Gibbs Frac-ture Zone at lat. 53°N (Steele, Barrett, and Worthing-ton, 1962). Indications of eastward flow through theVema Fracture Zone near lat. 11°N were shown byHeezen, Gerard, and Tharp (1964), but the flux mustbe much less than that through the Romanche FractureZone, given its much smaller influence on propertydistributions in the eastern Atlantic. Perhaps there isalso some slight westward flow through the Kane Frac-ture Zone near lat. 24°N (Purdy, Rabinowitz, and Vel-terop, 1979): high silica concentrations appear to ex-tend westward across the Mid-Atlantic Ridge there(Metcalf, 1969), but the accuracy of the measurementsis not entirely certain.
As noted in section 1.2, the Walvis Ridge blocksmost direct deep connection between the Antarctic andthe eastern trough of the Atlantic, but bottom temper-atures nearly as low as on the equator at lat. 32°S inthe southwestern corner of the Angola Basin (Fuglister,1960) undoubtedly signify a small leakage of waterfrom the south across the Walvis Ridge, probablythrough the Walvis Passage near long. 7W (Connaryand Ewing, 1974).
The dynamical fact that poleward movement froman equatorial source can be accomplished by an interiorflow may explain to some extent why no deep bound-ary currents along the western margin of the easterntrough (Mid-Atlantic Ridge) have been observed intransatlantic hydrographic sections (Fuglister, 1960).On the other hand, as pointed out in section 1.3, thebudgetary function of western boundary currents is notonly to transport deep water into low latitudes, butalso to correct imbalances between interior flows andupward fluxes; and it is not easy to see how continuitycan be maintained in the eastern trough of the Atlanticwithout recirculation boundary currents. In the NorthPacific and North Indian Oceans, where recirculationboundary currents are essential elements of the Stom-mel-Arons (1960b) model, convincing evidence for
such currents has not been found either (see below,this section); but the observational material there isnot really adequate to demonstrate whether or not theyexist. In any case, there is no match yet between theoryand observation in regard to recirculation currents.
1.5.2 Indian OceanThe geometry of the Indian Ocean is more complicatedthan that of the other oceans, because several majorridges divide it into a multiplicity of separate basins(figure 1.11). The course of deep flow is correspondinglymore tortuous and divided than in the other oceans,and further removed from the simple idealizations(Stommel and Arons, 1960b).
Since the Mozambique Basin (see figure 1.11 for geo-graphical names) is closed off to the north at depthsgreater than 2500-3000 m, the main point where deepwater enters the western Indian Ocean from the Cir-cumpolar Current is the passage between the CrozetPlateau and the Kerguelan Ridge (Jacobs and Georgi,1977). The pattern of potential temperature at 4000 m(Wyrtki, 1971) demonstrates equatorward flow onthrough the Crozet Basin, and this flow has been ob-served to pass through the Southwest Indian Ridge viathe Atlantis II and Melville Fracture Zones (longs. 57°Eand 61°E, respectively) into the Madagascar Basin be-yond (Warren, 1978). On a broader scale, continuity offlow between the Crozet and Madagascar Basins is sup-ported by the distributions of bottom potential tem-perature (Kolla, Sullivan, Streeter, and Langseth, 1976)and of clay-mineral fractions in the sediments of thetwo basins (Kolla, Henderson, and Biscaye, 1976).
This flow extends northward as a relatively narrow,intense, near-bottom current close against Madagascar,the effective western boundary for the deep South In-dian Ocean (Warren, 1974). The distribution of tem-perature along lat. 12°S, from the northern tip of Mad-agascar to the Central Indian Ridge, is illustrated infigure 1.12. The coldest bottom water is seen pressedagainst the slope of Madagascar, and below 3600 m theisotherms slope downward to the east in a zone 400-500 km wide, indicative of the breadth of the boundarycurrent. The sign of the associated horizontal densitygradient is consistent with a northward geostrophicvelocity increasing toward the bottom. Unlike theSouth Atlantic, water characteristics offer no clear de-marcation here between southward flow above andnorthward flow below, but the volume transport of thecurrent was estimated geostrophically, with referenceto 3600 m, to be about 4 x 10⁶ m3 s-' at this section(Warren, 1974). A comparable estimate, 5 x 10⁶ m3 s-
1,
was obtained at a similar section extending eastwardfrom Madagascar along lat. 23°S. (No direct velocitymeasurements have ever been reported in deep bound-ary currents of the Indian Ocean.)
29Deep Circulation of the World Ocean
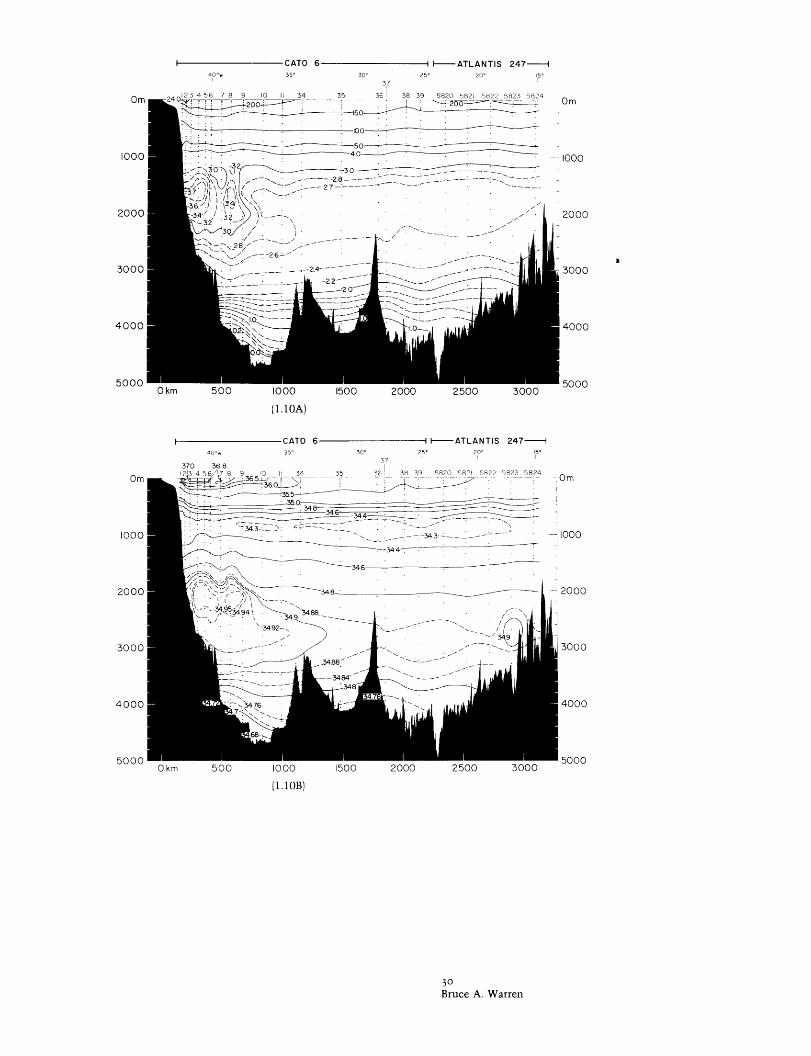
I , CATO 6 I - ATLANTIS 247 -40w 35
°30
°25' 20 15
37
.11 I - I I - .- .1 11 ~ ~ ~ ~ - - - - - - - -
UKm DUU IUUU IDU U U UUUU U ,UUU
(l. OA)
CATO 6 I - ATLANTIS 247 -40w 35
°30 205 20
°15
°
37
Okm 500 1000 1500 2000 2500 3000
Om
1000
2000
3000
4000
5000
)m
000
2000
3000
4000
5000
(l.lOB)
30Bruce A. Warren
On
100(
200C
300C
400C
5000C
Or
1000
200C
300C
400C
500C

I-ATLANTIS 247 I
UKm 0UU IUUU IDUU VUUU ZDUU 3UUU
40w 35' 30- 25'37
1923458 7 9 10 11 34 'A 31 38 39
km U500 I000 1500 2000
-ATLANTIS 247-120° 15
5RO R821 5R?? 5823 5824
250U 000U
Figure I.Io Sections of (A) potential temperature (°C), (B) sal-inity (%o), and the concentrations of (C) dissolved oxygen(mll-1) and {D) silica (tM1 -1) along roughly lat. 30°S fromSouth America (left) to the Mid-Atlantic Ridge, illustratingthe two deep western boundary currents of the South Atlantic,namely, the northward-flowing Antarctic Bottom Water andthe southward-flowing North Atlantic Deep Water above.Cato 6 (R.V. Melville) stations 1-11, 8-12 November 1972and stations 34-39, 25-29 November 1972; R.V. Atlantis sta-tions 5820-5824, 5-9 May 1959. Reid, Nowlin, and Patzert,1977.)
3IDeep Circulation of the World Ocean
Om
1000
2000
3000
4000
5000
)0
00
00
00
00
(1.lOC)
Om
'00
)00
00
00
I0
20
30
40
000m
I000
2000
3000
5000
(1.10D)
4000
5000
l b ICATO
Fr - D· I u
v~vvI Ii ii
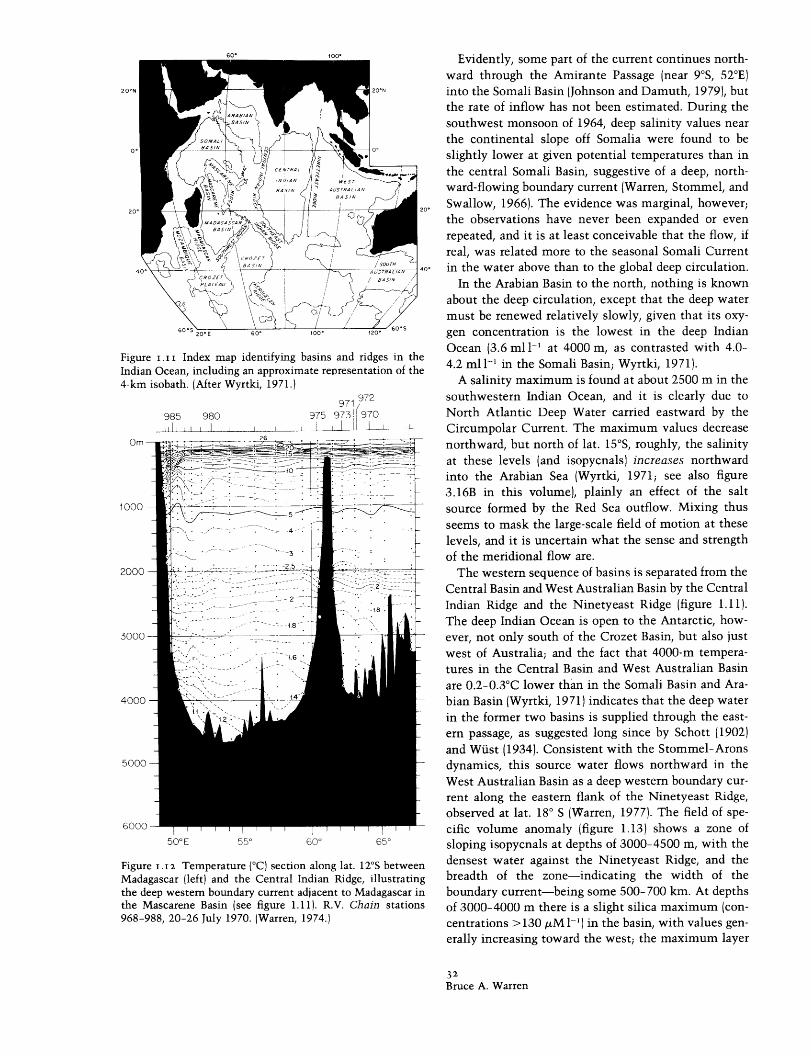
20°E 60' 100' 120'
Figure I.II Index map identifying basins and ridges in theIndian Ocean, including an approximate representation of the4-km isobath. (After Wyrtki, 1971.)
971 972985 980 975 973 97011111 1 1 1 1 1 1 1 L1 1 1 1 1 E
Om
1000
2000
3000
4000
5000
600C50°E 55° 60° 65°
Figure I.I2 Temperature (C) section along lat. 12°S betweenMadagascar (left) and the Central Indian Ridge, illustratingthe deep western boundary current adjacent to Madagascar inthe Mascarene Basin (see figure 1.11). R.V. Chain stations968-988, 20-26 July 1970. (Warren, 1974.)
Evidently, some part of the current continues north-ward through the Amirante Passage (near 9°S, 52°E)into the Somali Basin (Johnson and Damuth, 1979), butthe rate of inflow has not been estimated. During thesouthwest monsoon of 1964, deep salinity values nearthe continental slope off Somalia were found to beslightly lower at given potential temperatures than inthe central Somali Basin, suggestive of a deep, north-ward-flowing boundary current (Warren, Stommel, andSwallow, 1966). The evidence was marginal, however;the observations have never been expanded or evenrepeated, and it is at least conceivable that the flow, ifreal, was related more to the seasonal Somali Currentin the water above than to the global deep circulation.
In the Arabian Basin to the north, nothing is knownabout the deep circulation, except that the deep watermust be renewed relatively slowly, given that its oxy-gen concentration is the lowest in the deep IndianOcean (3.6 mll -1 at 4000 m, as contrasted with 4.0-4.2 ml l- in the Somali Basin; Wyrtki, 1971).
A salinity maximum is found at about 2500 m in thesouthwestern Indian Ocean, and it is clearly due toNorth Atlantic Deep Water carried eastward by theCircumpolar Current. The maximum values decreasenorthward, but north of lat. 15°S, roughly, the salinityat these levels (and isopycnals) increases northwardinto the Arabian Sea (Wyrtki, 1971; see also figure3.16B in this volume), plainly an effect of the saltsource formed by the Red Sea outflow. Mixing thusseems to mask the large-scale field of motion at theselevels, and it is uncertain what the sense and strengthof the meridional flow are.
The western sequence of basins is separated from theCentral Basin and West Australian Basin by the CentralIndian Ridge and the Ninetyeast Ridge (figure 1.11).The deep Indian Ocean is open to the Antarctic, how-ever, not only south of the Crozet Basin, but also justwest of Australia; and the fact that 4000-m tempera-tures in the Central Basin and West Australian Basinare 0.2-0.3°C lower than in the Somali Basin and Ara-bian Basin (Wyrtki, 1971) indicates that the deep waterin the former two basins is supplied through the east-ern passage, as suggested long since by Schott (1902)and Wiist (1934). Consistent with the Stommel-Aronsdynamics, this source water flows northward in theWest Australian Basin as a deep western boundary cur-rent along the eastern flank of the Ninetyeast Ridge,observed at lat. 18° S (Warren, 1977). The field of spe-
cific volume anomaly (figure 1.13) shows a zone ofsloping isopycnals at depths of 3000-4500 m, with thedensest water against the Ninetyeast Ridge, and thebreadth of the zone-indicating the width of theboundary current-being some 500- 700 km. At depthsof 3000-4000 m there is a slight silica maximum (con-centrations > 130 M l1- ) in the basin, with values gen-erally increasing toward the west; the maximum layer
32Bruce A. Warren
2(
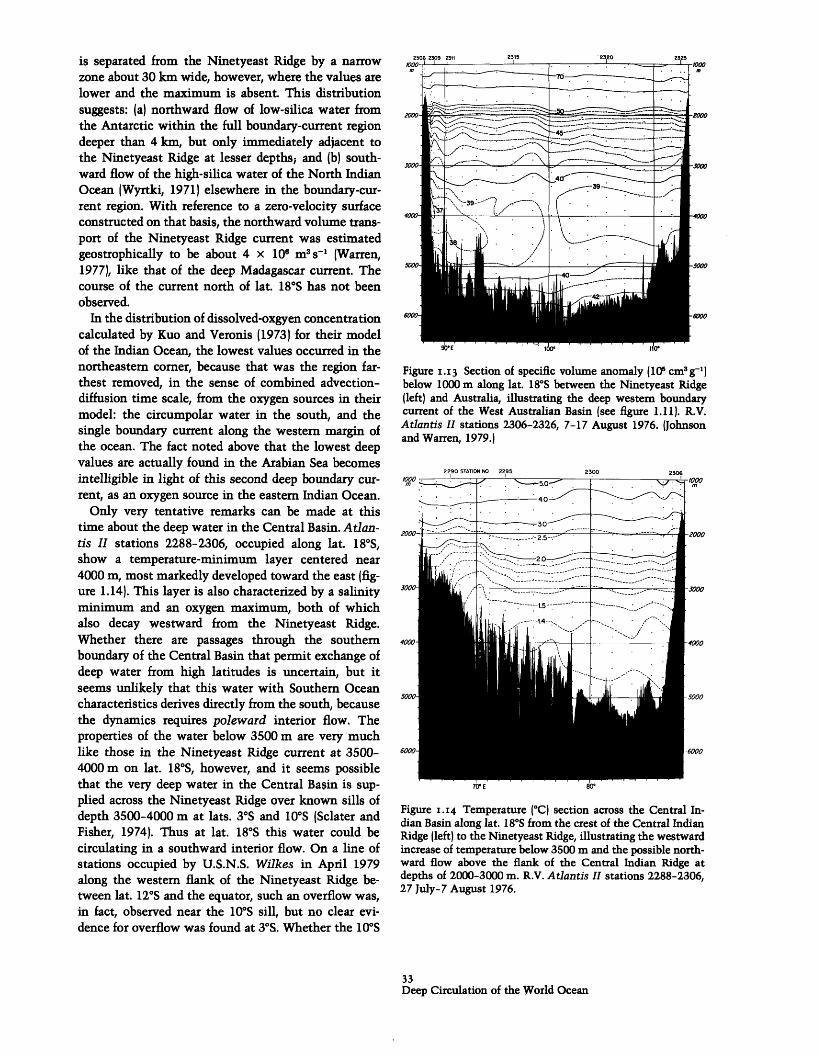
is separated from the Ninetyeast Ridge by a narrowzone about 30 km wide, however, where the values arelower and the maximum is absent. This distributionsuggests: (a) northward flow of low-silica water fromthe Antarctic within the full boundary-current regiondeeper than 4 km, but only immediately adjacent tothe Ninetyeast Ridge at lesser depths; and (b) south-ward flow of the high-silica water of the North IndianOcean (Wyrtki, 1971) elsewhere in the boundary-cur-rent region. With reference to a zero-velocity surfaceconstructed on that basis, the northward volume trans-port of the Ninetyeast Ridge current was estimatedgeostrophically to be about 4 x 10⁶ m 3 s-1 (Warren,1977), like that of the deep Madagascar current. Thecourse of the current north of lat. 18°S has not beenobserved.
In the distribution of dissolved-oxgyen concentrationcalculated by Kuo and Veronis (1973) for their modelof the Indian Ocean, the lowest values occurred in thenortheastern corner, because that was the region far-thest removed, in the sense of combined advection-diffusion time scale, from the oxygen sources in theirmodel: the circumpolar water in the south, and thesingle boundary current along the western margin ofthe ocean. The fact noted above that the lowest deepvalues are actually found in the Arabian Sea becomesintelligible in light of this second deep boundary cur-rent, as an oxygen source in the eastern Indian Ocean.
Only very tentative remarks can be made at thistime about the deep water in the Central Basin. Atlan-tis II stations 2288-2306, occupied along lat. 180S,show a temperature-minimum layer centered near4000 m, most markedly developed toward the east (fig-ure 1.14). This layer is also characterized by a salinityminimum and an oxygen maximum, both of whichalso decay westward from the Ninetyeast Ridge.Whether there are passages through the southernboundary of the Central Basin that permit exchange ofdeep water from high latitudes is uncertain, but itseems unlikely that this water with Southern Oceancharacteristics derives directly from the south, becausethe dynamics requires poleward interior flow. Theproperties of the water below 3500 m are very muchlike those in the Ninetyeast Ridge current at 3500-4000 m on lat. 180S, however, and it seems possiblethat the very deep water in the Central Basin is sup-plied across the Ninetyeast Ridge over known sills ofdepth 3500-4000 m at lats. 3°S and 10°S (Sclater andFisher, 1974). Thus at lat. 18°S this water could becirculating in a southward interior flow. On a line ofstations occupied by U.S.N.S. Wilkes in April 1979along the western flank of the Ninetyeast Ridge be-tween lat. 120S and the equator, such an overflow was,in fact, observed near the 100S sill, but no clear evi-dence for overflow was found at 3°S. Whether the 10°S
2306 2309 2311
2000
5000O
:- ; . _ - _- ----------- ;
------------- ,
.---- :/
1\ii Bt'"a
2320
o.4
i
23,5
f--__
0W0
-5000
6000- -600
Figure I.I3 Section of specific volume anomaly (105 cm3g-1)below 1000 m along lat. 18°S between the Ninetyeast Ridge(left) and Australia, illustrating the deep western boundarycurrent of the West Australian Basin (see figure 1.11). R.V.Atlantis II stations 2306-2326, 7-17 August 1976. ({Johnsonand Warren, 1979.)
70 E 80"
Figure I.I4 Temperature (C) section across the Central In-dian Basin along lat. 18°S from the crest of the Central IndianRidge (left). to the Ninetyeast Ridge, illustrating the westwardincrease of temperature below 3500 m and the possible north-ward flow above the flank of the Central Indian Ridge atdepths of 2000-3000 m. R.V. Atlantis II stations 2288-2306,27 July-7 August 1976.
33Deep Circulation of the World Ocean
· nnA. I I INI .... _ ' . I . ~e0fJ~
= =, ....... - n = La_ I
- _ _ _ - '. -I"' `·
. _ _ _
2315
tvvvm I _
J ..
1 .
ri'" ;
---------t ------- - ------ ---------~~-r-
-45 -:----T---- ----- ----- ----
-------~_-~~-~~`~~-~
'!- -- --
i----- �: - - ---- ------
_ _-~
1Olaf 11V
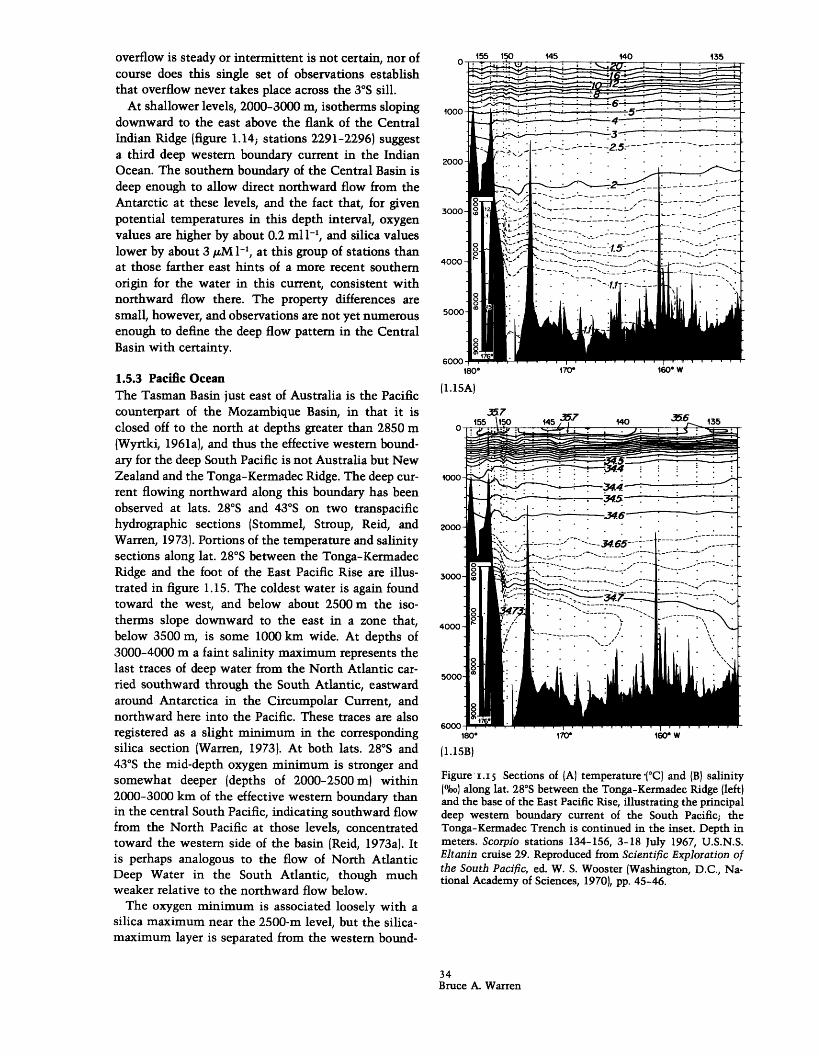
overflow is steady or intermittent is not certain, nor ofcourse does this single set of observations establishthat overflow never takes place across the 3°S sill.
At shallower levels, 2000-3000 m, isotherms slopingdownward to the east above the flank of the CentralIndian Ridge (figure 1.14; stations 2291-2296) suggesta third deep western boundary current in the IndianOcean. The southern boundary of the Central Basin isdeep enough to allow direct northward flow from theAntarctic at these levels, and the fact that, for givenpotential temperatures in this depth interval, oxygenvalues are higher by about 0.2 ml 1- , and silica valueslower by about 3 AM 1-', at this group of stations thanat those farther east hints of a more recent southernorigin for the water in this current, consistent withnorthward flow there. The property differences aresmall, however, and observations are not yet numerousenough to define the deep flow pattern in the CentralBasin with certainty.
1.5.3 Pacific OceanThe Tasman Basin just east of Australia is the Pacificcounterpart of the Mozambique Basin, in that it isclosed off to the north at depths greater than 2850 m(Wyrtki, 1961a), and thus the effective western bound-ary for the deep South Pacific is not Australia but NewZealand and the Tonga-Kermadec Ridge. The deep cur-rent flowing northward along this boundary has beenobserved at lats. 28°S and 43°S on two transpacifichydrographic sections (Stommel, Stroup, Reid, andWarren, 1973). Portions of the temperature and salinitysections along lat. 28°S between the Tonga-KermadecRidge and the foot of the East Pacific Rise are illus-trated in figure 1.15. The coldest water is again foundtoward the west, and below about 2500 m the iso-therms slope downward to the east in a zone that,below 3500 m, is some 1000 km wide. At depths of3000-4000 m a faint salinity maximum represents thelast traces of deep water from the North Atlantic car-ried southward through the South Atlantic, eastwardaround Antarctica in the Circumpolar Current, andnorthward here into the Pacific. These traces are alsoregistered as a slight minimum in the correspondingsilica section (Warren, 1973). At both lats. 28°S and43°S the mid-depth oxygen minimum is stronger andsomewhat deeper (depths of 2000-2500 m) within2000-3000 km of the effective western boundary thanin the central South Pacific, indicating southward flowfrom the North Pacific at those levels, concentratedtoward the western side of the basin (Reid, 1973a). Itis perhaps analogous to the flow of North AtlanticDeep Water in the South Atlantic, though muchweaker relative to the northward flow below.
The oxygen minimum is associated loosely with asilica maximum near the 2500-m level, but the silica-maximum layer is separated from the western bound-
200(
300(
400C
500(
600(180
°
(1.15A)
357- 155 15o0 145 jI
-2.5
· .--- -. -. -- .
. . . ,-- - - - -5 _. _'_,--· · o~~~~~~
170' 160 W
140 , 6 135
1000- :' . : ':4 : ' : : ' ' 'I _ __ _ _ . . : -:4 -:-- ~ ~~~~·
170180°
(1.15B)
160' W
Figure I.I5 Sections of (A) temperature (°C) and (B) salinity(o) along lat. 28°S between the Tonga-Kermadec Ridge (left)and the base of the East Pacific Rise, illustrating the principaldeep western boundary current of the South Pacific; theTonga-Kermadec Trench is continued in the inset. Depth inmeters. Scorpio stations 134-156, 3-18 July 1967, U.S.N.S.Eltanin cruise 29. Reproduced from Scientific Exploration ofthe South Pacific, ed. W. S. Wooster (Washington, D.C., Na-tional Academy of Sciences, 1970), pp. 45-46.
34Bruce A. Warren
O. -_ . l., i . .-
+4 -L- · ~ · -1 ·
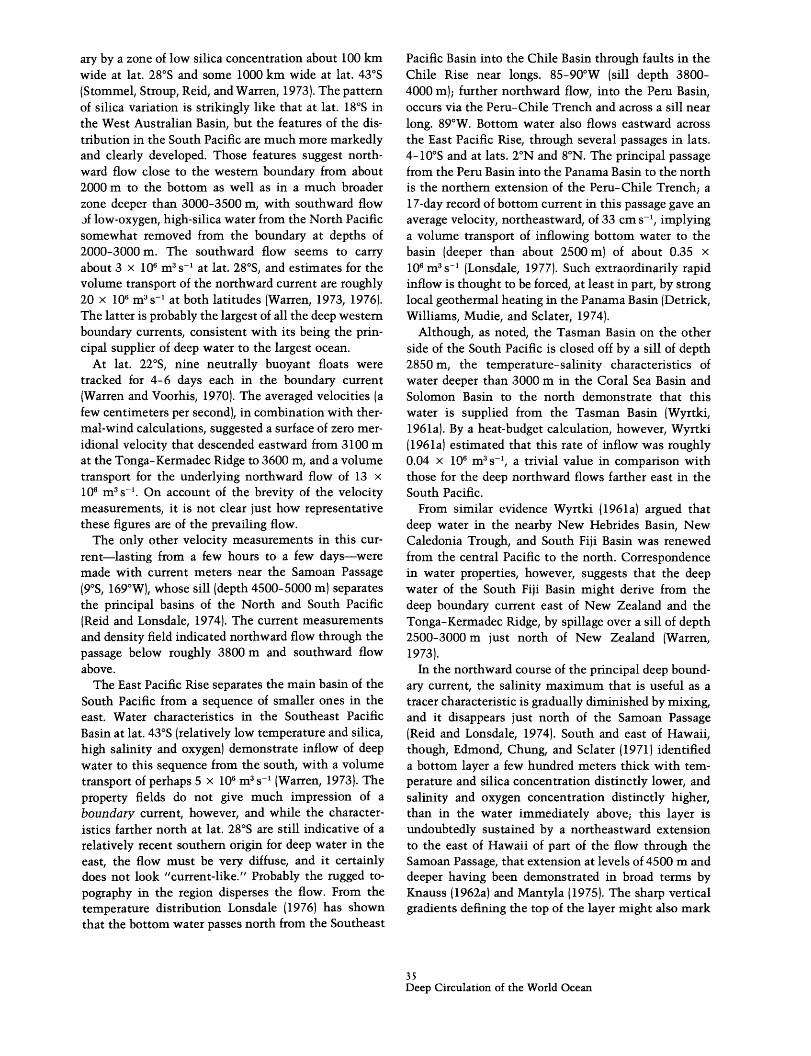
ary by a zone of low silica concentration about 100 kmwide at lat. 28°S and some 1000 km wide at lat. 43°S(Stommel, Stroup, Reid, and Warren, 1973). The patternof silica variation is strikingly like that at lat. 18°S inthe West Australian Basin, but the features of the dis-tribution in the South Pacific are much more markedlyand clearly developed. Those features suggest north-ward flow close to the western boundary from about2000 m to the bottom as well as in a much broaderzone deeper than 3000-3500 m, with southward flowof low-oxygen, high-silica water from the North Pacificsomewhat removed from the boundary at depths of2000-3000 m. The southward flow seems to carryabout 3 x 10⁶ m3 s - at lat. 28°S, and estimates for thevolume transport of the northward current are roughly20 x 106 m3 s- ' at both latitudes (Warren, 1973, 1976).The latter is probably the largest of all the deep westernboundary currents, consistent with its being the prin-cipal supplier of deep water to the largest ocean.
At lat. 22°S, nine neutrally buoyant floats weretracked for 4-6 days each in the boundary current(Warren and Voorhis, 1970). The averaged velocities (afew centimeters per second), in combination with ther-mal-wind calculations, suggested a surface of zero mer-idional velocity that descended eastward from 3100 mat the Tonga-Kermadec Ridge to 3600 m, and a volumetransport for the underlying northward flow of 13 x106 m3 s- 1. On account of the brevity of the velocitymeasurements, it is not clear just how representativethese figures are of the prevailing flow.
The only other velocity measurements in this cur-rent-lasting from a few hours to a few days-weremade with current meters -near the Samoan Passage(9°S, 169°W), whose sill (depth 4500-5000 m) separatesthe principal basins of the North and South Pacific(Reid and Lonsdale, 1974). The current measurementsand density field indicated northward flow through thepassage below roughly 3800 m and southward flowabove.
The East Pacific Rise separates the main basin of theSouth Pacific from a sequence of smaller ones in theeast. Water characteristics in the Southeast PacificBasin at lat. 43°S (relatively low temperature and silica,high salinity and oxygen) demonstrate inflow of deepwater to this sequence from the south, with a volumetransport of perhaps 5 x 10⁶ m3 s- (Warren, 1973). Theproperty fields do not give much impression of aboundary current, however, and while the character-istics farther north at lat. 28°S are still indicative of arelatively recent southern origin for deep water in theeast, the flow must be very diffuse, and it certainlydoes not look "current-like." Probably the rugged to-pography in the region disperses the flow. From thetemperature distribution Lonsdale (1976) has shownthat the bottom water passes north from the Southeast
Pacific Basin into the Chile Basin through faults in theChile Rise near longs. 85-90°W (sill depth 3800-4000 m); further northward flow, into the Peru Basin,occurs via the Peru-Chile Trench and across a sill nearlong. 89°W. Bottom water also flows eastward acrossthe East Pacific Rise, through several passages in lats.4-10°S and at lats. 2°N and 8°N. The principal passagefrom the Peru Basin into the Panama Basin to the northis the northern extension of the Peru-Chile Trench; a17-day record of bottom current in this passage gave anaverage velocity, northeastward, of 33 cm s - , implyinga volume transport of inflowing bottom water to thebasin (deeper than about 2500 m) of about 0.35 x10⁶ m 3 s- (Lonsdale, 1977). Such extraordinarily rapidinflow is thought to be forced, at least in part, by stronglocal geothermal heating in the Panama Basin (Detrick,Williams, Mudie, and Sclater, 1974).
Although, as noted, the Tasman Basin on the otherside of the South Pacific is closed off by a sill of depth2850 m, the temperature-salinity characteristics ofwater deeper than 3000 m in the Coral Sea Basin andSolomon Basin to the north demonstrate that thiswater is supplied from the Tasman Basin (Wyrtki,1961a). By a heat-budget calculation, however, Wyrtki(1961a) estimated that this rate of inflow was roughly0.04 x 106 m3 s- , a trivial value in comparison withthose for the deep northward flows farther east in theSouth Pacific.
From similar evidence Wyrtki (1961a) argued thatdeep water in the nearby New Hebrides Basin, NewCaledonia Trough, and South Fiji Basin was renewedfrom the central Pacific to the north. Correspondencein water properties, however, suggests that the deepwater of the South Fiji Basin might derive from thedeep boundary current east of New Zealand and theTonga-Kermadec Ridge, by spillage over a sill of depth2500-3000 m just north of New Zealand (Warren,1973).
In the northward course of the principal deep bound-ary current, the salinity maximum that is useful as atracer characteristic is gradually diminished by mixing,and it disappears just north of the Samoan Passage(Reid and Lonsdale, 1974). South and east of Hawaii,though, Edmond, Chung, and Sclater (1971) identifieda bottom layer a few hundred meters thick with tem-perature and silica concentration distinctly lower, andsalinity and oxygen concentration distinctly higher,than in the water immediately above; this layer isundoubtedly sustained by a northeastward extensionto the east of Hawaii of part of the flow through theSamoan Passage, that extension at levels of 4500 m anddeeper having been demonstrated in broad terms byKnauss (1962a) and Mantyla (1975). The sharp verticalgradients defining the top of the layer might also mark
35Deep Circulation of the World Ocean

a zero-velocity surface, but that is not self-evident:such gradients certainly do not do so in analogous fea-tures observed in the inflow to the Panama Basin (Lons-dale, 1977) and on the Blake-Bahama Outer Ridge inthe western North Atlantic (Amos, Gordon, andSchneider, 1971). In any case, 4-day current recordsdemonstrating eastward flow of bottom water at speedsof a few centimeters per second along the northern sideof the Clipperton Fracture Zone-southeast of Ha-waii-support the general course of water movementindicated by the large-scale property fields (Johnson,1972). That movement extends eastward across theEast Pacific Rise through the low-latitude faults notedabove, and it can also be traced at least as far north aslat. 30°N (Mantyla, 1975). Such a poleward interiorflow is consistent with the Stommel-Arons dynamics,and it is different from the southward flow in the east-em North Pacific hypothesized by Sverdrup (Sverdrup,Johnson, and Fleming, 1942, chapter XV; see also sec-tion 1.2).
Part of the flow through the Samoan Passage alsoextends northwestward into the North Pacific (e.g.,Wooster and Volkmann, 1960; Knauss, 1962a; Man-tyla, 1975), but there is no conclusive evidence for deepwestern boundary currents anywhere in that ocean. Inlow latitudes this lack of evidence is due at least inpart to the island chains and undulating rises that makeit difficult even to define a clear-cut western boundary;perhaps the very concept of interior flow plus boundarycurrent is not a useful one there. In middle and highlatitudes, Japan and the Kuriles form a distinct westernboundary, but, because the deep North Pacific is so farremoved from near-surface sources, the water is nearlyhomogeneous, and deep property maps near the west-ern margin show mostly observational noise, ratherthan indications of prevailing currents (Moriyasu,1972).
Nan'niti and Akamatsu (1966) have described deepvelocity measurements made with neutrally buoyantfloats tracked for 1-4 days from three sites along theJapan Trench near lats. 32, 38, and 40°N. Motions ob-served at 2-3 km were predominantly southward, withspeeds of a few centimeters per second; floats at 1000and 1500 m moved somewhat faster, and, near 320N,more toward the west. Worthington and Kawai (1972)have reported additional float measurements, lastingabout 1 day each, made just east of Honshu in lats.34-35°N; two floats set to a depth of 1 km inshore ofthe Japan Trench moved westsouthwestward at speedsof order 10 cms - 1, consistent with the observationabove near 320N, while three other floats, released off-shore of the Japan Trench at depths of 1-3 km, movednortheastward. Each of the measurements cited, takenindividually, is of much too short a duration for astatistically significant estimate of mean flow, but the
ensemble hints of a deep, southward-flowing recircu-lation current close against Japan, as predicted by theStommel-Arons model. Velocity measurements ofvery much greater duration are badly needed, however,to establish the existence of that current. Longer-termrecords have been obtained from current metersmoored south of Honshu, but those results probablyreflect the local deep flow in the Shikoku Basin, ratherthan the circulation in the open North Pacific, and theconnection between the former and the latter has notbeen delineated (Taft, 1978).
In the central North Pacific, temperatures at 3500 mare slightly lower than those generally found at thesame level in the South Pacific, suggesting widespreaddeep upwelling (Knauss, 1962a), and thus supportingthat assumption of the Stommel-Arons model.
Along the northern rim of the deep North Pacific,near the Aleutian Trench, there is a band of water100-200 km wide that is colder by about 0.05°C thanthe water to the south (Knauss, 1962a). It is unlikelythat this feature is due to upwelling of deeper waterbecause the anomaly persists all the way to the bottom(Reed, 1969). Reed (1970a) and Mantyla (1975) showedfurther that this band is continuous with cold water tothe west, and inferred therefrom a small eastward flowof deep water along the northern margin. The inferenceseems unexceptionable, but it is puzzling in terms ofthe Stommel-Arons circulation model: as described insection 1.3, the model requires northern boundary cur-rents, but they flow westward in consequence of beingfed by the poleward interior flow; an eastward-flowingcurrent diminishing to the east should be supplying anequatorward interior flow. It is conceivable that in thissubpolar region the vertical velocity at mid-depths isdownward rather than upward, so that the interior flowwould be equatorward rather than poleward, but if so,then the local density-depth curves might be expectedto have curvatures of opposite sign from those to thesouth, where the vertical velocity is thought to beupward. That the observed curvatures are in fact of thesame negative sign suggests (but does not prove) thatthe upwelling is general. Reconciliation of this east-ward current with a southward-flowing western bound-ary current (if the latter indeed exists) would also beproblematical for any simple flow scheme. The coldband is a perplexing feature of the deep circulation.
In summary, when oceans have been reconnoiteredwith appropriate observational strategies, deep westernboundary currents have been found where anticipatedalong the western margin of the North and South At-lantic, along the eastern sides of Madagascar and theNinetyeast Ridge in the South Indian Ocean (perhapsalso along the eastern flank of the Central IndianRidge), and beside the New Zealand platform andTonga-Kermadec Ridge in the South Pacific. North-ward flow east of the East Pacific Rise is less like a
36Bruce A. Warren

boundary current than might have been imagined, per-haps because of the topographic complexity, and in theAtlantic the northward-flowing Antarctic BottomWater current actually becomes an eastern boundarycurrent in the southern North Atlantic, possibly onaccount of meridional bottom slope. The existence ofdeep western boundary currents in the North Pacificand North Indian Oceans has not been definitely es-tablished, probably for lack of suitable measurements.Finally, how eastward flow along the northern rim ofthe Pacific and the apparent absence of western bound-ary currents in the deep eastern Atlantic are to bereconciled with circulation dynamics is not obvious.
1.5.4 Structure of Deep Western Boundary CurrentsWhen Stommel and Arons (1960b) constructed theirmodel of a global deep circulation, they did not inquireinto the character and dynamics of the deep westernboundary currents, but simply hypothesized them asa closure device. It is clear from hydrographic sectionsthat these currents differ among themselves, and differconsiderably in form from the much swifter westernboundary currents of the upper water like the GulfStream and Kuroshio. Most notably, perhaps, the deepcurrents are much wider, except in the North Atlantic.In the South Atlantic, Stommel and Arons (1972) rec-ognized a striking parallelism between isopycnals inthe Antarctic Bottom Water current and the bottomprofile of the broad South American continental rise.They developed a two-layer model to show how suchparallelism-and the associated greatly enhancedwidth of the current-could be consistent with uni-form potential vorticity across the current. Undoubt-edly a gentle bottom slope must act to broaden bottomcurrents, if only because geostrophic flow tends to fol-low isobaths, but in the vicinity of other deep currentsthat are at least as wide, particularly those in the SouthPacific and the West Australian Basin of the IndianOcean (figures 1.15 and 1.13), there is no broad conti-nental rise, and the currents flow over ocean floor thatis level (apart from small-scale features). Some otherphysics must be responsible for the large widths there.
In a different theory based on linear dynamics andthe idea of lateral mixing of density {Warren, 1976), thevelocity and water-property distributions are decom-posed into interior and western-boundary fields, andthe western-boundary density field is governed by abalance between lateral (zonal) diffusion of boundary-field density and vertical advection of the total densityby the boundary current:
-wpoE = Kxx,
where p and w are the boundary fields of density andvertical velocity, E the static stability associated with
the full density field, K the horizontal diffusion coef-ficient, and po a mean density. Linear dynamics is ap-propriate to the deep currents because their speeds aresmall (in contrast to the Gulf Stream, say), but theextent to which density mixes horizontally in differentparts of the ocean, as distinct from temperature andsalinity individually, is uncertain. The theory is in-complete, moreover, in several respects; but, with ap-plication of upper and lower boundary conditions, itproduces eigenfunctions that fairly successfully ration-alize the observed structure of deep boundary currents.
Combining this density balance with the geostrophicvorticity equation and the thermal-wind relation givesa basic zonal scale for each eigenfunction [the "westernscale" cataloged by Blumsack (1973), q.v. for parameterrestrictions] of I = (Kf2 )1(,fgEoh2), where h is the corre-sponding vertical scale and E0 a typical value of E. Indeep water E0 is generally 10- 9 cm-'; for K = 107cm2 s- , and for an eigenfunction of vertical scale1500 m, in midlatitudes (f = 10- 4
s- , l = 2 x 10-13
cm-' s -', g = 103 cms- 2 ) 1 would be 222 km, which isabout right for the observed current widths, consideredas two or three horizontal scales (e-folding distances).
The key property that I varies inversely with h (theeigenfunctions are tall and thin or short and broad)accounts for several features in the form of the cur-rents. In the South Pacific, for example (Warren, 1976),a combination of two eigenfunctions is necessary fora good fit to the observed variation of density withdepth at the western boundary on lat. 28°S (figure 1.15);the one generates the narrow zone of northward flowclose to the boundary between 2000 m and the bottomthat was inferred from the silica distribution, and theother requires the broad zone to the east with weaksouthward flow above 3500 m and northward flow be-low, as indicated by the oxygen, salinity, and silicadistributions. A comparable construction (Johnson andWarren, 1979) accounts moderately well for the similarproperty distributions in the Ninetyeast Ridge current.
The scale relation also helps to explain why the deepboundary current of the North Atlantic (figure 1.9) isnarrower than those in the southern hemisphere. Theformer is directed equatorward uniformly from 1000 mor shallower to the bottom, implying a large verticalscale, while the latter, being composed of equatorwardflows near the bottom and poleward flows at mid-depths (some short distance from the western bound-ary, at least), have rather smaller vertical scales. Forthe North Atlantic current, with f = 1.2 x 10- 4s-' (lat.55°N) and h = 3000 m, I is 80 km; while in the SouthAtlantic (figure 1.10), with f = 0.7 x 10⁻⁴ s- ' (lat. 30°S)and h = 1000 m (quarter-wavelength of vertical varia-tion), 1 = 250 km. It is not obvious, though, why pole-ward flow is part of the boundary-current systems inthe southern hemisphere. It seems natural enough forthe South Atlantic, where there is a northern source
37Deep Circulation of the World Ocean
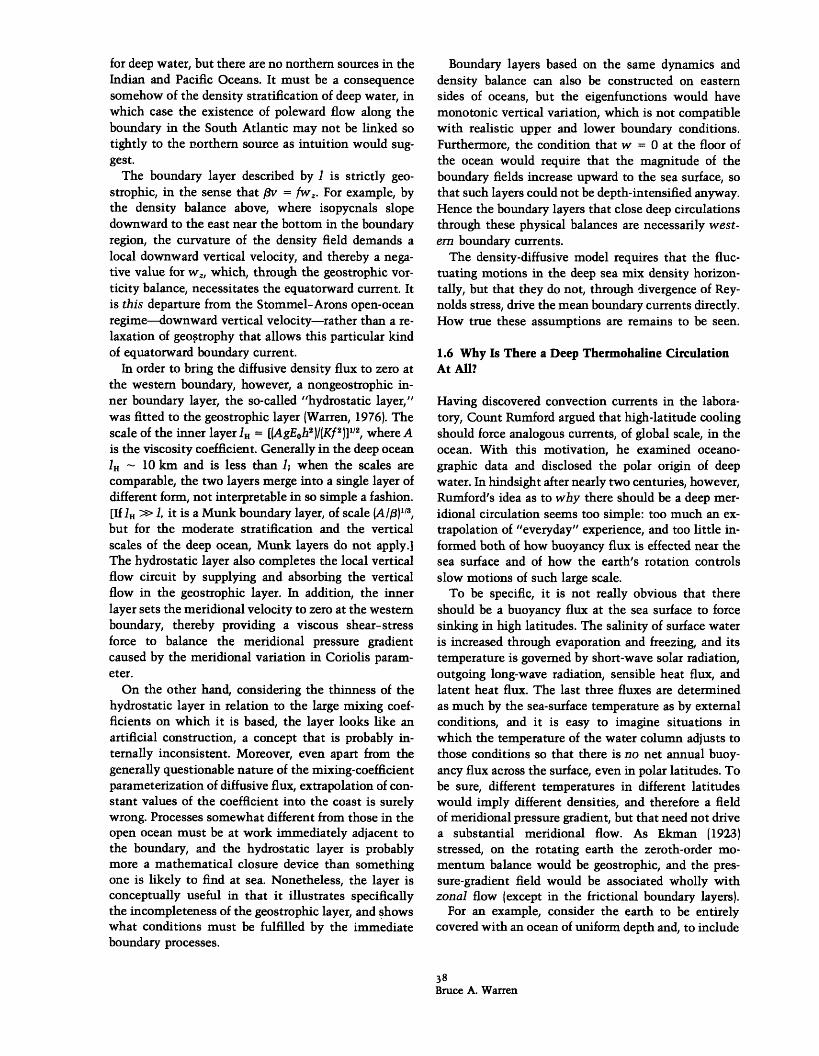
for deep water, but there are no northern sources in theIndian and Pacific Oceans. It must be a consequencesomehow of the density stratification of deep water, inwhich case the existence of poleward flow along theboundary in the South Atlantic may not be linked sotightly to the northern source as intuition would sug-gest.
The boundary layer described by 1 is strictly geo-strophic, in the sense that v = fwz. For example, bythe density balance above, where isopycnals slopedownward to the east near the bottom in the boundaryregion, the curvature of the density field demands alocal downward vertical velocity, and thereby a nega-tive value for wz, which, through the geostrophic vor-ticity balance, necessitates the equatorward current. Itis this departure from the Stommel-Arons open-oceanregime-downward vertical velocity-rather than a re-laxation of geostrophy that allows this particular kindof equatorward boundary current.
In order to bring the diffusive density flux to zero atthe western boundary, however, a nongeostrophic in-ner boundary layer, the so-called "hydrostatic layer,"was fitted to the geostrophic layer (Warren, 1976). Thescale of the inner layer 1. = [(AgEoh2 ) (Kf2)]112, where Ais the viscosity coefficient. Generally in the deep ocean1. - 10 km and is less than 1; when the scales arecomparable, the two layers merge into a single layer ofdifferent form, not interpretable in so simple a fashion.[If I1 >> 1, it is a Munk boundary layer, of scale (AI/3)"3,but for the moderate stratification and the verticalscales of the deep ocean, Munk layers do not apply.]The hydrostatic layer also completes the local verticalflow circuit by supplying and absorbing the verticalflow in the geostrophic layer. In addition, the innerlayer sets the meridional velocity to zero at the westernboundary, thereby providing a viscous shear-stressforce to balance the meridional pressure gradientcaused by the meridional variation in Coriolis param-eter.
On the other hand, considering the thinness of thehydrostatic layer in relation to the large mixing coef-ficients on which it is based, the layer looks like anartificial construction, a concept that is probably in-ternally inconsistent. Moreover, even apart from thegenerally questionable nature of the mixing-coefficientparameterization of diffusive flux, extrapolation of con-stant values of the coefficient into the coast is surelywrong. Processes somewhat different from those in theopen ocean must be at work immediately adjacent tothe boundary, and the hydrostatic layer is probablymore a mathematical closure device than somethingone is likely to find at sea. Nonetheless, the layer isconceptually useful in that it illustrates specificallythe incompleteness of the geostrophic layer, and showswhat conditions must be fulfilled by the immediateboundary processes.
Boundary layers based on the same dynamics anddensity balance can also be constructed on easternsides of oceans, but the eigenfunctions would havemonotonic vertical variation, which is not compatiblewith realistic upper and lower boundary conditions.Furthermore, the condition that w = 0 at the floor ofthe ocean would require that the magnitude of theboundary fields increase upward to the sea surface, sothat such layers could not be depth-intensified anyway.Hence the boundary layers that close deep circulationsthrough these physical balances are necessarily west-ern boundary currents.
The density-diffusive model requires that the fluc-tuating motions in the deep sea mix density horizon-tally, but that they do not, through divergence of Rey-nolds stress, drive the mean boundary currents directly.How true these assumptions are remains to be seen.
1.6 Why Is There a Deep Thermohaline CirculationAt All?
Having discovered convection currents in the labora-tory, Count Rumford argued that high-latitude coolingshould force analogous currents, of global scale, in theocean. With this motivation, he examined oceano-graphic data and disclosed the polar origin of deepwater. In hindsight after nearly two centuries, however,Rumford's idea as to why there should be a deep mer-idional circulation seems too simple: too much an ex-trapolation of "everyday" experience, and too little in-formed both of how buoyancy flux is effected near thesea surface and of how the earth's rotation controlsslow motions of such large scale.
To be specific, it is not really obvious that thereshould be a buoyancy flux at the sea surface to forcesinking in high latitudes. The salinity of surface wateris increased through evaporation and freezing, and itstemperature is governed by short-wave solar radiation,outgoing long-wave radiation, sensible heat flux, andlatent heat flux. The last three fluxes are determinedas much by the sea-surface temperature as by externalconditions, and it is easy to imagine situations inwhich the temperature of the water column adjusts tothose conditions so that there is no net annual buoy-ancy flux across the surface, even in polar latitudes. Tobe sure, different temperatures in different latitudeswould imply different densities, and therefore a fieldof meridional pressure gradient, but that need not drivea substantial meridional flow. As Ekman (1923)stressed, on the rotating earth the zeroth-order mo-mentum balance would be geostrophic, and the pres-sure-gradient field would be associated wholly withzonal flow (except in the frictional boundary layers).
For an example, consider the earth to be entirelycovered with an ocean of uniform depth and, to include
38Bruce A. Warren
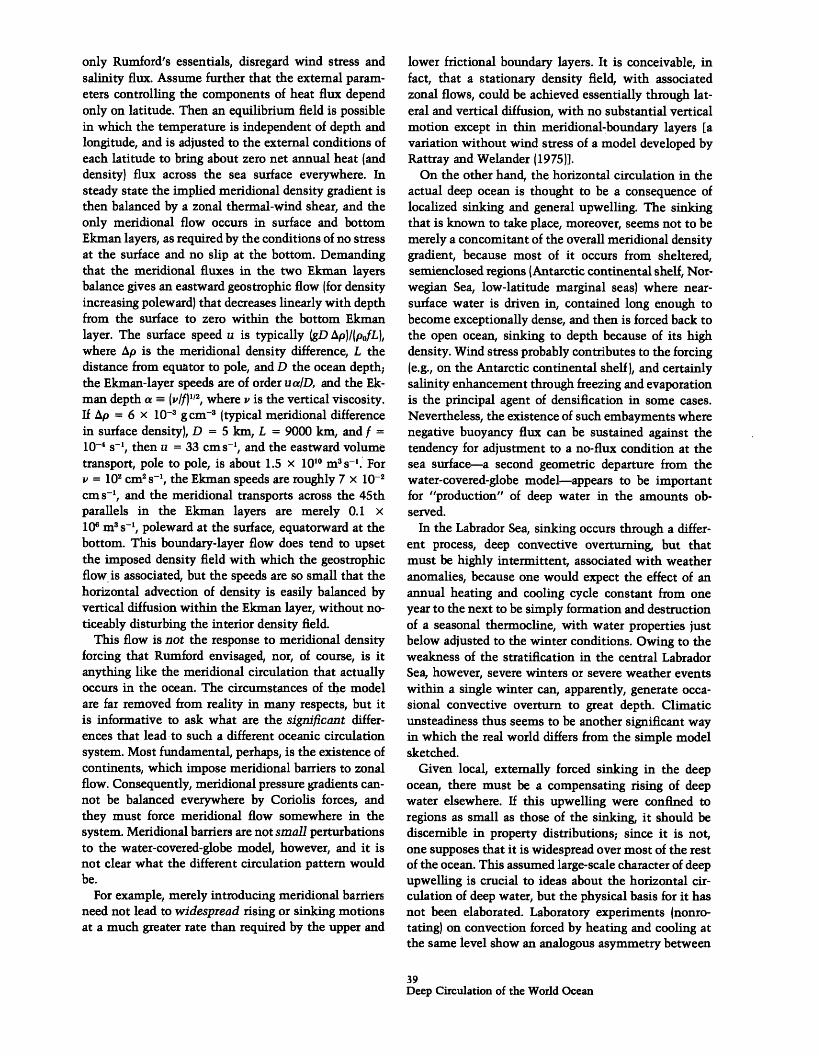
only Rumford's essentials, disregard wind stress andsalinity flux. Assume further that the external param-eters controlling the components of heat flux dependonly on latitude. Then an equilibrium field is possiblein which the temperature is independent of depth andlongitude, and is adjusted to the external conditions ofeach latitude to bring about zero net annual heat (anddensity) flux across the sea surface everywhere. Insteady state the implied meridional density gradient isthen balanced by a zonal thermal-wind shear, and theonly meridional flow occurs in surface and bottomEkman layers, as required by the conditions of no stressat the surface and no slip at the bottom. Demandingthat the meridional fluxes in the two Ekman layersbalance gives an eastward geostrophic flow (for densityincreasing poleward) that decreases linearly with depthfrom the surface to zero within the bottom Ekmanlayer. The surface speed u is typically (gD Ap)/(pofL),where Ap is the meridional density difference, L thedistance from equator to pole, and D the ocean depth;the Ekman-layer speeds are of order ua/D, and the Ek-man depth a- (v/f)'2, where v is the vertical viscosity.If Ap = 6 x 10⁻³ gcm -3 (typical meridional differencein surface density), D = 5 km, L = 9000 km, and f =10- 4 s -
1, then u = 33 cms - a, and the eastward volumetransport, pole to pole, is about 1.5 x 100 m3 s-. ' For
= 10cm 2cm s- , the Ekman speeds are roughly 7 x 10- 2
cm s- , and the meridional transports across the 45thparallels in the Ekman layers are merely 0.1 x10⁶ m3 s-', poleward at the surface, equatorward at thebottom. This boundary-layer flow does tend to upsetthe imposed density field with which the geostrophicflow is associated, but the speeds are so small that thehorizontal advection of density is easily balanced byvertical diffusion within the Ekman layer, without no-ticeably disturbing the interior density field.
This flow is not the response to meridional densityforcing that Rumford envisaged, nor, of course, is itanything like the meridional circulation that actuallyoccurs in the ocean. The circumstances of the modelare far removed from reality in many respects, but itis informative to ask what are the significant differ-ences that lead to such a different oceanic circulationsystem. Most fundamental, perhaps, is the existence ofcontinents, which impose meridional barriers to zonalflow. Consequently, meridional pressure gradients can-not be balanced everywhere by Coriolis forces, andthey must force meridional flow somewhere in thesystem. Meridional barriers are not small perturbationsto the water-covered-globe model, however, and it isnot clear what the different circulation pattern wouldbe.
For example, merely introducing meridional barriersneed not lead to widespread rising or sinking motionsat a much greater rate than required by the upper and
lower frictional boundary layers. It is conceivable, infact, that a stationary density field, with associatedzonal flows, could be achieved essentially through lat-eral and vertical diffusion, with no substantial verticalmotion except in thin meridional-boundary layers [avariation without wind stress of a model developed byRattray and Welander (1975)].
On the other hand, the horizontal circulation in theactual deep ocean is thought to be a consequence oflocalized sinking and general upwelling. The sinkingthat is known to take place, moreover, seems not to bemerely a concomitant of the overall meridional densitygradient, because most of it occurs from sheltered,semienclosed regions (Antarctic continental shelf, Nor-wegian Sea, low-latitude marginal seas) where near-surface water is driven in, contained long enough tobecome exceptionally dense, and then is forced back tothe open ocean, sinking to depth because of its highdensity. Wind stress probably contributes to the forcing(e.g., on the Antarctic continental shelf), and certainlysalinity enhancement through freezing and evaporationis the principal agent of densification in some cases.Nevertheless, the existence of such embayments wherenegative buoyancy flux can be sustained against thetendency for adjustment to a no-flux condition at thesea surface-a second geometric departure from thewater-covered-globe model-appears to be importantfor "production" of deep water in the amounts ob-served.
In the Labrador Sea, sinking occurs through a differ-ent process, deep convective overturning, but thatmust be highly intermittent, associated with weatheranomalies, because one would expect the effect of anannual heating and cooling cycle constant from oneyear to the next to be simply formation and destructionof a seasonal thermocline, with water properties justbelow adjusted to the winter conditions. Owing to theweakness of the stratification in the central LabradorSea, however, severe winters or severe weather eventswithin a single winter can, apparently, generate occa-sional convective overturn to great depth. Climaticunsteadiness thus seems to be another significant wayin which the real world differs from the simple modelsketched.
Given local, externally forced sinking in the deepocean, there must be a compensating rising of deepwater elsewhere. If this upwelling were confined toregions as small as those of the sinking, it should bediscernible in property distributions; since it is not,one supposes that it is widespread over most of the restof the ocean. This assumed large-scale character of deepupwelling is crucial to ideas about the horizontal cir-culation of deep water, but the physical basis for it hasnot been elaborated. Laboratory experiments (nonro-tating) on convection forced by heating and cooling atthe same level show an analogous asymmetry between
39Deep Circulation of the World Ocean
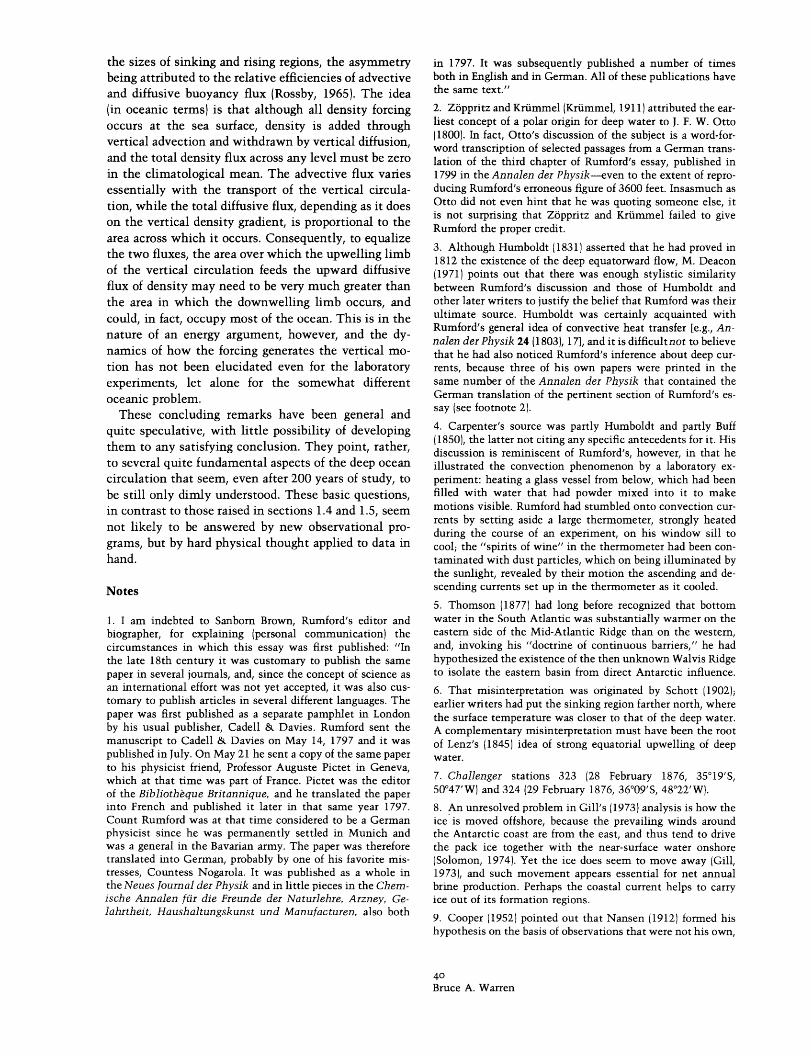
the sizes of sinking and rising regions, the asymmetrybeing attributed to the relative efficiencies of advectiveand diffusive buoyancy flux (Rossby, 1965). The idea(in oceanic terms) is that although all density forcingoccurs at the sea surface, density is added throughvertical advection and withdrawn by vertical diffusion,and the total density flux across any level must be zeroin the climatological mean. The advective flux variesessentially with the transport of the vertical circula-tion, while the total diffusive flux, depending as it doeson the vertical density gradient, is proportional to thearea across which it occurs. Consequently, to equalizethe two fluxes, the area over which the upwelling limbof the vertical circulation feeds the upward diffusiveflux of density may need to be very much greater thanthe area in which the downwelling limb occurs, andcould, in fact, occupy most of the ocean. This is in thenature of an energy argument, however, and the dy-namics of how the forcing generates the vertical mo-tion has not been elucidated even for the laboratoryexperiments, let alone for the somewhat differentoceanic problem.
These concluding remarks have been general andquite speculative, with little possibility of developingthem to any satisfying conclusion. They point, rather,to several quite fundamental aspects of the deep oceancirculation that seem, even after 200 years of study, tobe still only dimly understood. These basic questions,in contrast to those raised in sections 1.4 and 1.5, seemnot likely to be answered by new observational pro-grams, but by hard physical thought applied to data inhand.
Notes
1. I am indebted to Sanborn Brown, Rumford's editor andbiographer, for explaining (personal communication) thecircumstances in which this essay was first published: "Inthe late 18th century it was customary to publish the samepaper in several journals, and, since the concept of science asan international effort was not yet accepted, it was also cus-tomary to publish articles in several different languages. Thepaper was first published as a separate pamphlet in Londonby his usual publisher, Cadell & Davies. Rumford sent themanuscript to Cadell & Davies on May 14, 1797 and it waspublished in July. On May 21 he sent a copy of the same paperto his physicist friend, Professor Auguste Pictet in Geneva,which at that time was part of France. Pictet was the editorof the Bibliotheque Britannique, and he translated the paperinto French and published it later in that same year 1797.Count Rumford was at that time considered to be a Germanphysicist since he was permanently settled in Munich andwas a general in the Bavarian army. The paper was thereforetranslated into German, probably by one of his favorite mis-tresses, Countess Nogarola. It was published as a whole inthe Neues Journal der Physik and in little pieces in the Chem-ische Annalen fir die Freunde der Naturlehre, Arzney, Ge-lahrtheit, Haushaltungskunst und Manufacturen, also both
in 1797. It was subsequently published a number of timesboth in English and in German. All of these publications havethe same text."
2. Zppritz and Kriimmel (Kruimmel, 1911) attributed the ear-liest concept of a polar origin for deep water to J. F. W. Otto(1800). In fact, Otto's discussion of the subject is a word-for-word transcription of selected passages from a German trans-lation of the third chapter of Rumford's essay, published in1799 in the Annalen der Physik--even to the extent of repro-ducing Rumford's erroneous figure of 3600 feet. Insasmuch asOtto did not even hint that he was quoting someone else, itis not surprising that Z6ppritz and Kriimmel failed to giveRumford the proper credit.
3. Although Humboldt (1831) asserted that he had proved in1812 the existence of the deep equatorward flow, M. Deacon(1971) points out that there was enough stylistic similaritybetween Rumford's discussion and those of Humboldt andother later writers to justify the belief that Rumford was theirultimate source. Humboldt was certainly acquainted withRumford's general idea of convective heat transfer [e.g., An-nalen der Physik 24 (1803), 17], and it is difficultnot to believethat he had also noticed Rumford's inference about deep cur-rents, because three of his own papers were printed in thesame number of the Annalen der Physik that contained theGerman translation of the pertinent section of Rumford's es-say (see footnote 2).
4. Carpenter's source was partly Humboldt and partly Buff(18501, the latter not citing any specific antecedents for it. Hisdiscussion is reminiscent of Rumford's, however, in that heillustrated the convection phenomenon by a laboratory ex-periment: heating a glass vessel from below, which had beenfilled with water that had powder mixed into it to makemotions visible. Rumford had stumbled onto convection cur-rents by setting aside a large thermometer, strongly heatedduring the course of an experiment, on his window sill tocool; the "spirits of wine" in the thermometer had been con-taminated with dust particles, which on being illuminated bythe sunlight, revealed by their motion the ascending and de-scending currents set up in the thermometer as it cooled.
5. Thomson 1877) had long before recognized that bottomwater in the South Atlantic was substantially warmer on theeastern side of the Mid-Atlantic Ridge than on the western,and, invoking his "doctrine of continuous barriers," he hadhypothesized the existence of the then unknown Walvis Ridgeto isolate the eastern basin from direct Antarctic influence.
6. That misinterpretation was originated by Schott (1902);earlier writers had put the sinking region farther north, wherethe surface temperature was closer to that of the deep water.A complementary misinterpretation must have been the rootof Lenz's (1845) idea of strong equatorial upwelling of deepwater.
7. Challenger stations 323 (28 February 1876, 35°19'S,50°47'W) and 324 (29 February 1876, 36°09'S, 48°22'W).
8. An unresolved problem in Gill's (1973) analysis is how theice is moved offshore, because the prevailing winds aroundthe Antarctic coast are from the east, and thus tend to drivethe pack ice together with the near-surface water onshore(Solomon, 1974). Yet the ice does seem to move away (Gill,1973), and such movement appears essential for net annualbrine production. Perhaps the coastal current helps to carryice out of its formation regions.
9. Cooper (1952) pointed out that Nansen (1912) formed hishypothesis on the basis of observations that were not his own,
4oBruce A. Warren
and were of uncertain quality; moreover, that his hypothesiswas never actually vindicated, and no evidence can be foundin modem data for convection to the bottom in that region-although observations made due south of Greenland suggestedoverturning to 2500 m in March 1935 (Dietrich, 1957a), andconvection to mid-depths must certainly occur in the Labra-dor Sea. Cooper (1952) did leave open the possibility of unu-sually severe conditions when the data used by Nansen (1912)were collected, so that convection all the way to the bottommight conceivably have been occurring at that time.
10. My impression of the reason why the earlier writers un-derrated the importance of the overflows is that they foundhardly any trace of overflow water in the open ocean justsouth of the Greenland-Scotland ridge. They do not seem tohave suspected that such overflows should join together toform a narrow current along the northern and western bound-aries of the North Atlantic (figure 1.7) rather than spreaddirectly southward, and the early observations were much toosparse to reveal the existence of that current. Cooper (1955a),on the other hand, had access both to the general concept ofwestern boundary currents and to more comprehensive ob-servational coverage.
11. See the many reports of The Iceland-Faroe Ridge Inter-national (ICES) "Overflow" Expedition, May-June, 1960(1967), Rapports et Procbs-Verbaux des Reunions. ConseilPermanent International pour l'Exploration de la Mer 157,274 pp.
12. Tizard (1883) had previously suggested such an analogy,but he abandoned it after concluding that the surface inflowwas compensated mainly by outflow at the surface rather thanat depth.
13. At the XVII General Assembly of the IUGG in Canberra,December 1979, Clarke and Gascard (1979) described a directobservation in March 1976 of convection penetrating todepths greater than 2000 m, with downward velocities as highas 9 cms - 1, in an area of diameter 10 km near the westernside of the Labrador Sea.
14. In much of the western Atlantic, the potential densityreferenced to the sea surface is actually less for the AntarcticBottom Water than for the Lower North Atlantic Deep Waterabove it (e.g., Lynn and Reid, 1968). Because the thermalexpansion coefficient for water increases with pressure, how-ever, the potential density referenced to some appropriatedeep level is indeed greater for the colder Antarctic BottomWater than for the water above-a point first explained, ap-parently, by Ekman (1934).
4IDeep Circulation of the World Ocean