Embed Size (px)
Citation preview

Part One: Data Indicates Needs page 1 Part Two: The Gateway (If You Build It Right, They Will Come) page 11 Part Three: BRIC Bowl Design page 30
Gary Stark – Baylor University, CASPER Summer Program 2014
1
Data Indicates Needs A Personal Message from the Author of Part One – I hope CASPER receives the GEAR UP grant that it applied for, but it is my desire that at least parts of the program the RETs helped develop this summer can be implemented this school year. There are many deficiencies indicated by the STAAR results that do not have to persist. The Gateway will take much time and money, so its deployment would rely on the grant. The BRIC Bowl would take a coordinated effort and time, but it is feasible to pull it off. The dissemination of information from test-item analysis and remedies of deficiencies by simulations can be accomplished more easily. Part one of this paper and PowerPoint presentation are prepared to be used as a stand-alone product. A middle school science department chair could read the paper and use the PowerPoint presentation with the notes provided to inform the other science teachers how the simulations could be used. Science teachers should be allotted the time to work on the few STAAR items, look at the results, and try the simulations. Playing the “Build an Atom” game’s 4 levels should sell any Texas middle school science teacher on the promise of using simulations to increase student understanding. It is my hope that this information is shared with at least the principals or science department chairs of the five middle schools that we discussed in the project. Part one of this paper should be given to this head person and the PowerPoint presentation should be used during professional development with the science teachers. There are notes on most of the slides for the presenters’ information.
Gary R. Stark

Gary Stark – Baylor University, CASPER Summer Program 2014
2
CASPER's Summer Research Experiences for Teachers Program is sponsored by the National Science Foundation, CASPER, Baylor University, the School of Engineering (Mechanical and Electrical) and the College of Arts & Sciences (Physics and Math). The RETs for the summer of 2014 were charged with the task of finding ways to improve local Independent School Districts’ (ISDs) 8th grade science STAAR (State of Texas Assessments of Academic Readiness) results in conjunction with a proposed GEAR UP (Gaining Early Awareness and Readiness for Undergraduate Programs) grant. The GEAR UP grant would begin working with 6th and 7th graders from the traditional public schools in the Waco and La Vega ISDs. As data for the 2014 spring assessment will not be available until August or September of 2014, the RETs analyzed results of previous 5th and 8th grade science STAAR assessments. Their findings for the 8th grade STAAR assessment are in the table below:
TABLE 1.a Comparison of Area 8th Grade Science STAAR Scores to the State Average
School Cesar Chavez Middle School
George Washington Carver Middle School
Indian Springs Middle School
Tennyson Middle School
George Dixon Campus
State Average
ISD Waco Waco Waco Waco La Vega Approx number of students per grade
300 267 203 273 202
% of students passing spring 2012
34 63 52 54 71
% of students passing spring 2013
54 42 48 60 53 75
The number of students passing the 8th grade science STAAR exam was well below the state average for each year. These are the five schools represented in the grant proposal. Indian Springs Middle School was reorganized and did not receive a score for the 2012 test. Data is from the Texas Education Agency.
The five schools scored well below the state average (Table 1.a) and well below neighboring schools. The preliminary summary results for the 2013-14 exams that were released to district officials but not to the public showed similar results as reported by the districts to the local press (Waco Tribune). One of the RETs taught at the George Dixon campus and was able to acquire item analysis results for the 2013 Spring STAAR 5th and 8th grade science assessments from La Vega ISD. The RETs were unsuccessful obtaining item data from the Waco schools. Fifth grade La Vega results were not drastically below state average, with the students performing at or above the state average on 10 of the 44 items on the 5th grade science STAAR test. In 8th grade, the La Vega students were at or above the state average on only 2 of the 54 items, with the largest overage being 2 percentage points. For comparison, the La Vega students were at least 10 percentage points below the state average on 35 of the 54 items.

Gary Stark – Baylor University, CASPER Summer Program 2014
3
Fig. 1.a. La Vega and State results for each item on the 2013 8th Grade Science STAAR Test. The problems were arranged into the four content categories. The center of the graph represents 0% of the students answered the problem correctly and the outer ring represents100% correct. Each data point represents a test item number, the percent of students in the state having it correct in blue, and the percent of students in La Vega having the item correct in red. (e.g., item number 48 was a Matter & Energy problem with 56% of the state students having it correct and 35% of La Vega students having it correct) Larger gaps represent a larger disparity in the percentage of La Vega and state students having the problem correct.
The test items were sorted into content categories. A radar graph (Figure 1.a) was created showing percent correct statewide and for La Vega students. La Vega data points (red) are predominantly inside the state points (blue), indicating that La Vega students performed lower on those specific test items. La Vega students were below the state average in each of the four content areas, Matter & Energy (Chemistry); Motion, Forces & Energy (Physics); Earth & Space; and Organisms & Environments (Biology). There was a greater disparity in Matter & Energy and Earth & Space than the other two content areas. This was a complete shift from the 5th grade data. A possible reason for this is that 2013 was just the second year of test data and schools are still adjusting at which grade level topics are being taught. A common response by educators when confronted with poor results on a high stakes test is that the students did not try or that the students gave up. Results displayed on the graph indicate this is probably not the case as students performed reasonable well on some items at the end of the test. The test had 54 problems, and on the last problem of the test, La Vega students had their greatest percentage of students correct (85%) which was only two percentage points lower than the state average.

Gary Stark – Baylor University, CASPER Summer Program 2014
4
Fig. 1.b. Excerpt of RET analysis of data. Each item on the 5th and 8th grade Science STAAR exams was analyzed for percentage of students who chose the correct answer, difference from state percent correct, the standard tested, content category, percentage of students who chose each distractor, main reason for error (red) and number of vocabulary terms. This excerpt is from the 8th grade exam.
The RETs analyzed each problem to search for weaknesses in student understanding (figure 1.b). Commonalities in mistakes were searched for in items in each content area. Many of the mistakes in Earth & Space and Organisms & Environments could be attributed to vocabulary. There was more of a common theme in missing content in the other two areas. The RET team looked for online videos, games, quizlets, and simulations that could assist students in learning content that did not seem to be mastered in the classroom.

Gary Stark – Baylor University, CASPER Summer Program 2014
5
Fig. 1.c. Excerpt of RET work of simulations to help student overcome difficulties in understanding content material. The first column represents the type of content covered with item numbers. The second column lists the websites of the simulations to help understanding of that type of problem. The third column includes notes on how to use the simulation and if it is appropriate for the team competitions.
After looking for commonalities in content errors, the RET team looked for simulations to address student understanding (figure 1.c). Many simulations had a teaching component and a game component with various levels for students to challenge their understanding. There are many PhET simulations from the University of Colorado - Boulder to help science students. PhET used to stand for the Physics Education Technology Project, but now that the simulations have diversified into the other sciences and math, PhET is the collective name of all of the simulations, not just for physics. Some of the simulations tie in directly to TEKS and STAAR items. Two of the simulations will be discussed in greater detail.

Gary Stark – Baylor University, CASPER Summer Program 2014
6
Fig. 1.d. Problem 19 of the 8th Grade Science STAAR exam testing understanding of TEKS 6.8A Forces, Motion & Energy - compare and contrast potential and kinetic energy.
Fig. 1.e. Screenshot of PhET simulation Energy Skate Park – Basics. The skateboarder moves along a preset track or one that can be built by the student. With the bar graph showing energy and the speedometer turned on, students can see the relationship of velocity, potential energy and kinetic energy at any position along the track.
Figure 1.d. shows a problem testing student understanding of potential and kinetic energy. 24% of La Vega students selected the correct response, B, compared to 44% of the students for the state.. 30% chose A and 35% Chose C, indicating that many students did not understand that the least potential energy and greatest kinetic energy was at the bottom; that they did not understand that potential energy related to position and kinetic energy related to velocity.
The RETs found a PhET simulation to help students understand this situation. Energy Skate Park – Basics (figure 1.e) allows students to look at speed, kinetic energy, and potential energy as a

Gary Stark – Baylor University, CASPER Summer Program 2014
7
skateboarder moves along a track. Students will have an intuitive understanding of the speed and position and will be able to translate the understanding over to maximum and minimum kinetic and potential energy.
Fig. 1.f. Problem 11 of the 2013 8th Grade STAAR Science Test. Students have access to a periodic table with a key that states what the symbol and each number in a cell of the table represent. This problem is testing student understanding of the meaning of the atomic number (number of protons).
Fig. 1.g. Problems 15 and 40 of the 2013 8th Grade STAAR Science Test. Problem 15 is testing student understanding of charge of an electron and relative sizes of atomic particles. Problem 40 is testing student understanding of charges and locations of particles in the nucleus (protons and electrons).
18%
51%
10%
21%
49%
26%
8%
16%
56% 8% 3% 33%
LaVega 8th Grade Data

Gary Stark – Baylor University, CASPER Summer Program 2014
8
Three matter and energy problems (figures 1.f and 1.g) were related to TEKS 8.5 A, B, and C, with a strong emphasis on 8.5A: describe the structure of atoms, including the masses, electrical charges, and locations, of protons and neutrons in the nucleus and electrons in the electron cloud. La Vega students were below state average by 15%, 8%, and 15% respectively on these three problems. Students did not totally understand particle charge, mass, and location. The PhET simulation that would help with these standards and these problems is Build an Atom. (figure 1.h).
Fig. 1.h. Screenshot of the tutorial section of the Build an Atom PhET simulation. Students are taken through the location of the protons, neutrons, and electrons. Students see an arrangement of the symbol and numbers of cell entries on the periodic table. The simulation shows the charge for each particle. It also takes students through differentiating between neutral atoms and ions.
There are four levels in the game associated with this simulation. The game tests for understanding of atomic number, atomic mass, ions, charges and location of particles, and location on the periodic table. It is the opinion of the author that this simulation is the most important one of the simulations listed for two reasons. First, the problems throughout the four levels of the game are very similar to the problems from the STAAR test. Second, if the teachers try the game, they will find that it is easy to make mistakes similar to student mistakes on the STAAR test, but practice clarifies the understanding of science content and what is being asked for in the STAAR and game problems. School administrators or department chairs should make every effort to ensure that all middle school science teachers experience the four levels online. Many teachers will find that they cannot score as high initially as they would expect from their students. The Balancing Chemical Equations simulation and game addresses TEKS 8.5 D, E, and F. One STAAR item (#23) is very similar to the game, while six others (18, 20, 33, 44, 48, and 52) can be tied to it. After students are familiar with Build an Atom and Balancing Chemical Equations simulations, the teacher can easily review the additional ideas for these three items.

Gary Stark – Baylor University, CASPER Summer Program 2014
9
Fig. 1.i. Problems relating to balancing chemical equations or understanding parts of an equation, formula, or chemical reaction. For problem #23, 46% of La Vega students had it correct, which was 21 percentage points below the state average. #18 was 63% and 8 points below, #20 was 37% and 15 points below, #44 was 41% and 12 points below, and #33 was 38% and 23 points below.
Fig. 1.j. Problem 48 was 35% and 21 points below and #52 was 61% and 10 points below.
Figures 1.i and 1.j show seven STAAR test problems associated with TEKS 8.5D (recognize that chemical formulas are used to identify substances and determine the number of atoms of each element in chemical formulas containing subscripts), 8.5E (investigate how evidence of chemical reactions indicate that new substances with different properties are formed) and 8.5F (recognize whether a chemical equation containing coefficients is balanced or not and how that relates to the law of conservation of mass). La Vega students were well below state average in STAAR items associated with these TEKS.

Gary Stark – Baylor University, CASPER Summer Program 2014
10
Fig. 1.k. Screenshot from level 3 of the game portion of the PhET simulation Balancing Chemical Equations. Students are given an incomplete (missing coefficients) chemical equation. As students type in numbers for the coefficients, the simulation shows the representation of the molecule(s). Students attempt to balance the equation and check their answer, receiving immediate feedback. Students have two attempts at each problem. Each level has five chemical equations to balance. The game keeps track of the amount of time it takes to complete the five equations and the student’s best time/score at each level of the game.
The Balancing Chemical Equations PhET simulation (figure 1.k) tutorial and game assists students in understanding parts of a chemical equation and the steps necessary to balance them. In combination with the Build an Atom simulation, most of the deficiencies in the Matter and Energy content area can easily be addressed. The problems outlined here represent 10 of the 54 problems from the 2013 STAAR Science exam, where most of the mastery can be accomplished in game format from two simulations during student discretionary time, not classroom dedicated time. Once teachers appreciate the usefulness of simulations improving student understanding of the TEKS, the teachers should emphasize other simulations. Other PhET simulations that are strongly encouraged for teacher usage include: Density; Forces and Motion; Ramp: Forces and Motion; and Energy Forms and Changes. Conclusions for Part One Teachers need to understand where students are deficient (large scale -TEKS and small scale – STAAR items). For this understanding to occur, teachers must work through the STAAR items. Teachers need to experience how the simulations can help students master the TEKS and perform at a higher level on the STAAR exam. Teachers must work through the simulations and each game level. During professional development with teachers, the teachers must have time to explore the test items and simulations.

Matt Menefee – Baylor University, CASPER RET Summer Program 2014
11
“THE GATEWAY” – IF YOU BUILD IT RIGHT, THEY WILL COME.
THE UNIFIED "GET OUT THE VOTE" MESSAGE
The success of any program can often be traced backed to the amount of buy in or cooperation that we have from the target audience. In most populations there are a myriad of ways to do this. In education we are much more limited in how we can reach out to the target students, we must have the gatekeepers of the students involved, IE teachers. As a fellow teacher and researcher you must realize that we can be very jaded to any new program or idea to come along. To truly reach the students you must first reach out to the teachers, teacher’s aides, and administrators. You MUST make this programs of more than just esoteric value to those who interact with the students most. To this end I recommend large amounts of cash…..Now barring that the being available we need to offer a combination of Continuing Professional Education (CPE) credit and other incentives to insure that educators stay engaged. CPE adds educational value for teachers, but gift cards and cash give a more tangible reward for the educator’s involvement. TEACHER ROLL-OUT A. Reach out to Region 12 Science Collaborative Program Manager. This is position is currently held by Judy York. (Information valid as 7/25/2014). Ask nicely for her feedback and find out if they can be our partner in this program. Please have specific questions ready for them, and specifically find out how we can offer this program for CPE credit. This is essential is making sure that this adds professional value to the program for the educator’s involved. If CPE credit is not possible we will continue on, but please make sure you exhaust all possible avenues to try to receive the hours. We are asking for 6-8 hours of CPE credit for each of the training days, minimum of 1 day up to a maximum of 3 days. In addition we would also like 4 hours of CPE credit for each of partial days that we would be participating in. We need to take these times as suggestions and not as hard facts. A dedicated effort must be made to be aware of the various times of the school year when teachers may have difficulty in communicating due to time constraints. In addition effective communicating with the target audience will allow us to better tailor the fit and timing of the program to better serve our teachers. The best way to communicate with teachers is usually face to face initially, but targeted e-mails may suffice if no other option is available. Secondary and subsequent communications with teachers should be dictated by their preference of face-to-face, text, or phone call.
CPE Breakdown request:
1-3 Training curriculum days for the program, with each day worth 6-8 hours of CPE credit.

Matt Menefee – Baylor University, CASPER RET Summer Program 2014
12
We would prefer one of these days to be in the summer during the work week, with a second day during the school year. If Saturdays are only option we can work with that.
1-2 training camp days for students and educators
These would be half days, with each half day worth 3-4 hours of CPE credit. These would need to be Saturdays during the school year.
2 Big Event “BRIC Bowl” days
We would like each of the event days to be worth between 4 – 8 hours of CPE Credit. We would prefer these to be on Saturdays during the school year, but we could most likely work this into a
weekday if was necessary. B. Sell it to the Superintendent – Bring your fully fleshed out program and incentives to the superintendent and ask for their permission to talk to their principals and teachers. C. Sell it to the principal - Bring your fully fleshed out program and incentives to the principal and ask for their permission to talk to their teachers and other educators. D. Sell it to the front-line teachers and other educators. We need to do more than just have educators convinced of the value of the program, we need them to be our cheer leaders for this program in their class. They must buy in fully to get the full effect of this program. To this end some of the incentives we can offer teachers can be cash, gift cards, CPE credits, and other assorted items of value. We can give these various items away at various levels of class participation. Class participation can be measured using the analytics software that will allow us to see which classes have the highest level of involvement with the “gateway”. The analytics software will also allow us to see which class is using “class time” versus time outside of class. IP address will also allow us to pinpoint high use clusters and regions that have highest and least involvement, this data will allow us to further to cater the program.
Possible Teacher Benchmarks for rewards: 50% or more of students registered 75% or more of students registered
25% of students involved with at least 400 points 60% of students involved with at least 400 points
Teacher of at least 3 students in the top 20 students overall in the gateway Teachers of a BRIC bowl top 4 teams
Teachers of a BRIC bowl championship team.
E. Sell it to the students. Let’s make this happen! For this program to be successful we must be willing to try new things that are not always going to comfortable and conform to pre-established methodologies and ideas. We must get out there and make this program really worth the students time we must offer more than just educational value, but offer rewards of tangible value that are achievable.
Proposed list for prizes
Entry Level Prize for a score of 100 points. We deliver a custom BRIC Gateway participant sticker to your science class.

Matt Menefee – Baylor University, CASPER RET Summer Program 2014
13
1st Tier Prize: 300 Points – 2 dollars credit/gift card for Google Play, Amazon MP3, or iTunes.
2nd Tier Prize: 600 Points – BRIC Gateway Branded Frisbee, mini Basket Ball, or mini Soccer Ball.
3rd Tier Prize: 800 Points – 5 dollars credit/gift card for Google Play, Amazon MP3, or iTunes.
4th Tier Prize: 1600 points – End of semester wings and pizza party at lunch for you and anyone
at your school that has also achieved this score.
5th Tier Prize: 2000 points. $25 dollar gift card to Amazon or Foot Locker
Top 28 students from each team advance to the BRIC Bowl Potential partners for donations: HEB, Wal-Mart, Local Restaurants, Local Sporting Good Stores, Bluebell Creamery, Homestead Heritage, TSTC, MCC, Nike, Local Bookstores, Home Depot, Texas Rangers, Houston Astros, Dallas Stars, Baylor Athletics and anyone else with a community presence. From my personal experience with rewarding students with prizes is that one consideration is that many of our students may not have easy access to transportation. To this end we may need to consider business within walking distance of the school or prizes that can be delivered to the school. THE BRIC SCIENCE GATEWAY A. Hosting We need to build a website that can handle up to 2,500 users at a time that will be actively streaming video that is not primarily hosting video, but imbedding it. To this end this a proposed list of hardware that we would require for the site. The approximate upfront cost for hardware should be about $5,000. This includes: 2 dedicated server quad core processor, 64 gig of ram, 1 hard drive 60 GB, 4 additional data hard drives 150 gig each, and a Xeon processor running Windows Server 2012. This hardware cost only, it does NOT include software, virtual, or hosting costs. This information comes from a website administrator for a Regional ISD in a similar demographic area district. B. Mock-up / “the look” The Gateway: The Gateway is intended to be an internet portal game/video checkpoint for online studying. It is meant to be a place where students can watch STAAR applicable videos in a mobile friendly format; these videos would be curated by various assorted educational students from the Baylor education program, and then would be uploaded by a website administrator. The videos will be broken into smaller observational categories by utilizing the YAG (year at a glance)released STAAR questions from the applicable years (the first year would use 5th and 8th grades, the STAAR and TEKS data/standards for 5th, 6th, 7th, and 8th grade. This sight should mirror “mobile to desktop” and not “desktop to mobile”. The Gateway site should be designed as a mobile native platform in HTML 5, or in any other program for it to work on the maximum amount of devices. The following is a proposed layout for the Gateway website and the program content. C. “Build it, and they will come, if we make it mobile friendly” The students that we want to engage are not the cream of the crop or the best students, we want the students in summer school, with failing grades, and stuck in generational poverty. An
Matt Menefee – Baylor University, CASPER RET Summer Program 2014
14
informal sampling of data that we have collected from La Vega students appears to offer the same information that we have from national and international user data and studies (Pew Research Center, Digital Difference, 4/13/2012) that confirm that children from lower socio-economic background and areas do not have “traditional” ways of the accessing the internet (i.e.: laptop, desktop, tablet computer), these students are usually accessing the internet via mobile devices or iPads. Students like these that are usually referred to as the digital generation; they access the majority of the major entertainment and social media sites via mobile device. If the site is not easily accessible via mobile device then the site will not be as actively used. It is IMPERATIVE that we design the website/gateway to be accessible to ALL mobile devices; this means we must use HTML 5 or better as our build source code, and the design of the mobile device must be mirrored EXACTLY for access via the traditional means of laptop and desktop computers. The website must function flawlessly when it is released and it must have a report error/feedback button so that any difficulties can be assessed and fixed within 1-24 hours (the faster, the better). D. The guidelines for design, functionality, and application of the “Gateway.” The layout for the gateway needs to be a clean design that is as user intuitive as best as possible.

Matt Menefee – Baylor University, CASPER RET Summer Program 2014
15
BRIC SCIENCE GATEWAY LAYOUT These are some basic mock-ups of some of the proposed pages for the BRIC Science Gateway.
Figure 2-a: Splash Page The first screen should introduce them; to the BRIC gateway with an explanation with what it is and how it functions.
Figure 2-a

Matt Menefee – Baylor University, CASPER RET Summer Program 2014
16
Figure 2-b: Choose Your School The next screen is the designate school screen. The students will click on the name of the school that they belong to; this will be divided into the 5-6 schools from La Vega ISD and Waco ISD that are involved in the program. There also needs to be a button for guest gateway.
Figure 2-b

Matt Menefee – Baylor University, CASPER RET Summer Program 2014
17
Figure 2-c: Registration Page The next screen will have the student register the first time or login. If they are registering for the first time, they will need to put in their first and last name and their student id number, birth date and create a nickname for the score board leader board.
x If they are logging in after the first time, all they will need is a nickname and student ID number.
x If they are just a guest they will bypass this step.
x If they are a teacher, they will have already pre-registered during training camp for the program.
Figure 2-c

Matt Menefee – Baylor University, CASPER RET Summer Program 2014
18
Figure 2-d: Student and Teacher login after creating an initial account, students and teachers will go to a separate login page.
Figure 2-d

Matt Menefee – Baylor University, CASPER RET Summer Program 2014
19
Figure 2-e: Menu Upon logging in, students and teachers will be taken to a menu page to navigate the site.
Figure 2-e
Matt Menefee – Baylor University, CASPER RET Summer Program 2014
20
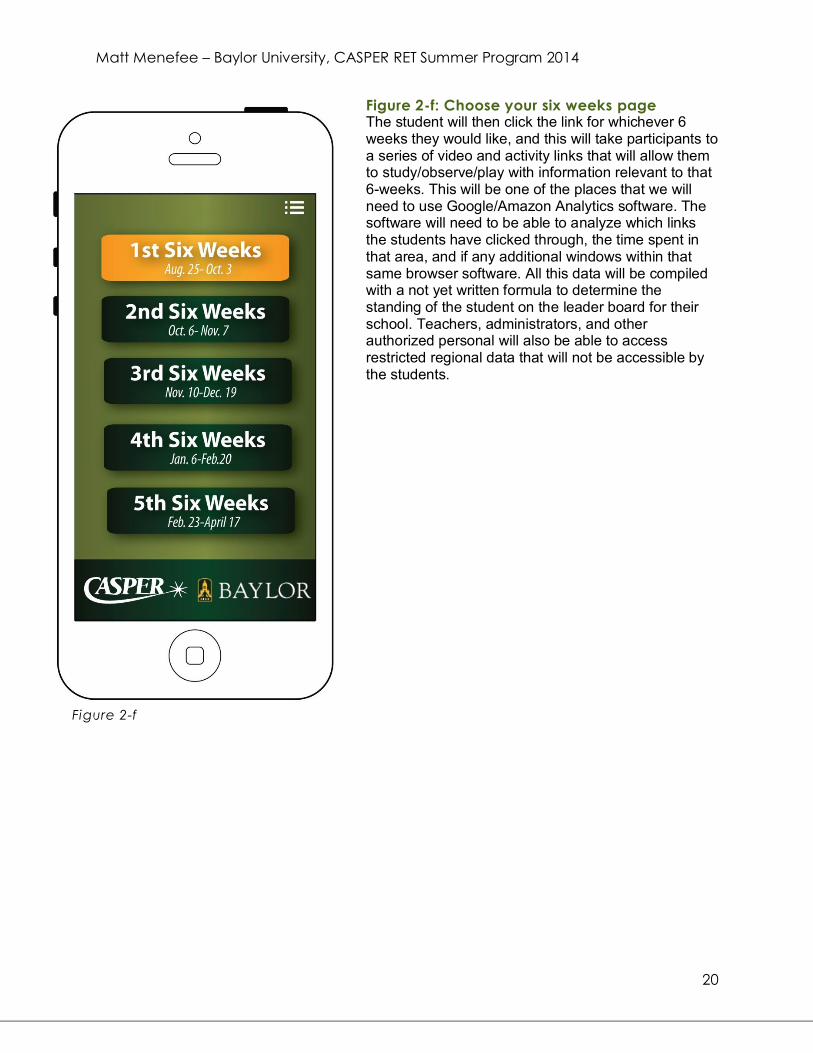
Figure 2-f: Choose your six weeks page The student will then click the link for whichever 6 weeks they would like, and this will take participants to a series of video and activity links that will allow them to study/observe/play with information relevant to that 6-weeks. This will be one of the places that we will need to use Google/Amazon Analytics software. The software will need to be able to analyze which links the students have clicked through, the time spent in that area, and if any additional windows within that same browser software. All this data will be compiled with a not yet written formula to determine the standing of the student on the leader board for their school. Teachers, administrators, and other authorized personal will also be able to access restricted regional data that will not be accessible by the students.
Figure 2-f

Matt Menefee – Baylor University, CASPER RET Summer Program 2014
21
Figure 2-g: Embedded links, activities, and videos This is the meat and the potatoes of the gateway. We must get this right. Utilizing the individual school’s YAG (year at a glance) and overall lesson plan timeline we will place curated and vetted embedded videos, activities, and links for each subject within each school’s 6-week page. Specific YAGs should be available both La Vega and Waco ISDs. Each of the items should have a short description with them so that students can have an idea what they are looking at before they click on it. Additionally the appropriate TEKS coding should be next to it. This will allows us to establish correlation to state standards. We will also need a report button for any errors next to all links. The error button should have a list of potential problem choices. This will allow us to analyze the problem to determine if it this a software issue, connectivity issue, interface issue, hardware issue, and additionally user or server issues.
Figure 2-g

Matt Menefee – Baylor University, CASPER RET Summer Program 2014
22
Addendum imbedded link: At the bottom of every page there will be a link that will allow the student to see their status, status being points and total time spent, it should also give their ranking number for the school that they belong. This ranking can be updated in real time based on amount of time spent in the program. An additional link at the bottom of the data page will take them to the leader board of the top 50 in their school. Students will be listed by nicknames/login names only. As an additional note we will need to make sure we have software installed to make sure that all the nickname/login names are appropriate and they are not using L33T to screw with the naming conventions. We really don’t want to have the Baylor or any our school names being associated with someone who calls himself something inappropriate.

Matt Menefee – Baylor University, CASPER RET Summer Program 2014
23
Figure 2-h: Student Leaderboard Each school will have a scoreboard that shows their ranking of all the students that are registered to compete in the BRIC bowl. It should show the login “nickname” of the student, and their overall of rank based on points/score. It should show the student their rank number and their cumulative score. The student should also be able to expand the table and see the rankings of everybody.
Figure 2-h

Matt Menefee – Baylor University, CASPER RET Summer Program 2014
24
Figure 2-i: Teacher/Admin Analytics An analytics page that is only accessible via teacher or administrator account on a desktop computer. This would show the student name, their login “nickname,” total cumulative score, all programs accessed, and their rank school-wide and program wide (all schools). This page would also allow us to filter certain data profiles to gain very specific information for analysis of the program and resources. *Analytics of the program: This is an extremely important part of the program because without it we cannot grant points or analyze which resource showing the greatest impact or most popular. This program needs to be embedded so that every click-thru, action, time spent, video/action completed should register, and all this information needs to be able to be linkable to every individual student, device used to access the “gateway”, grade level, school, geographic region of the city, and ages. If the schools are willing to release socio-economic data, ethnic data, and any other potential data we should also be able to incorporate this in for an even greater understanding. There is also the possibility of having the students self-report this information.
Figure 2-i

Matt Menefee – Baylor University, CASPER RET Summer Program 2014
25
Figure 2-j: The point value page. Register and login for the first time is worth 10 points Login from both a mobile device and a laptop/desktop is worth 10 points Every completely watched video (5 minutes or under) is worth 5 points (?) Every clicked through activity link with 3-minutes or longer spent on the page is worth 3 points (?) Every completely watched video (between 5:01-10:00 minutes) is worth 10 points (?) Every completely watched video (over 10:00 minutes) is worth 25 points. Point value of an approved uploaded video: 50 points for the first video, 40 points for the 2nd video, 30 points for the 3rd uploaded approved video. Limit of 3 videos. Ask a question about a video that is answered and added to the videos information page, 15 points (?)
Figure 2-j

Matt Menefee – Baylor University, CASPER RET Summer Program 2014
26
Figure 2-k: Video Upload/Requirements page. Students can upload a video of themselves or their classmates demonstrating a science experiment or scientific topic for extra points. Requirements: Video must be appropriate and subject-specific and between 2-4 minutes long. Videos will be approved by a moderator before posting to the gateway. Limit of 3 videos. Proposed Extra Points Values: 50 points for the first video 60 points for the 2nd video 70 points for the 3rd video
Figure 2-k

Matt Menefee – Baylor University, CASPER RET Summer Program 2014
27
About the Author:
Matt R. Menefee: Matt is graduate of Sam Houston State University with a Bachelor of Science in Psychology. Since 1997 he has worked with children and students in a variety of outdoor and extra-curricular enrichment programs. He received his teacher certification in 2007, and has taught in Title 1 schools since then. Acknowledgments: This work was supported by NSF under grant #1263021. The author appreciates The discussions with many CASPER REU/RET members that helped to shape this document. The author is especially grateful to Sarah-Jane Menefee for creating the graphics used in the presentation.

Matt Menefee – Baylor University, CASPER RET Summer Program 2014
28
Science Resources Links: The following information should serve as a starting point for aggregating information for the Gateway. All information provided through the Gateway must be correlated with TEKS and the YAGs of the participating ISDs.
Name of Channel or site Address
Additional information.
TED Talks http://www.youtube.com/user/TEDtalksDirector Veritasium http://www.youtube.com/user/1veritasium?feature=results_main The Science Channel http://www.youtube.com/user/Best0fScience Minute Physics http://www.youtube.com/user/minutephysics Sixty Symbols http://www.youtube.com/user/sixtysymbols Smarter Every Day http://www.youtube.com/user/destinws2 Backstage Science http://www.youtube.com/user/BackstageScience NASA http://www.youtube.com/user/NASAtelevision Bad Astronomy http://www.youtube.com/user/TheBadAstronomer SciShow http://www.youtube.com/user/scishow SciShow Space https://www.youtube.com/user/scishowspace The Brain Scoop https://www.youtube.com/user/thebrainscoop GCP Grey https://www.youtube.com/user/CGPGrey Crash Course https://www.youtube.com/user/crashcourse Khan Academy https://www.youtube.com/user/khanacademy Minute Earth https://www.youtube.com/user/minuteearth It's Okay To Be Smart https://www.youtube.com/user/itsokaytobesmart Numberphile https://www.youtube.com/user/numberphile Periodic Videos https://www.youtube.com/user/periodicvideos Vsauce https://www.youtube.com/user/Vsauce Vihart https://www.youtube.com/user/Vihart
Looking Glass Universe
https://www.youtube.com/watch?v=D89Z3_c2jzg&list=UUFk__1iexL3T5gvGcMpeHNA
informationsupernova https://www.youtube.com/channel/UC6bmrSZjYTA3wwiSeChUhpg
Wired https://www.youtube.com/channel/UCftwRNsjfRo08xYE31tkiyw Make Magazine http://makezine.com/ MakeChannel https://www.youtube.com/user/makemagazine MakerFaire https://www.youtube.com/user/MakerFaireVideo Tested https://www.youtube.com/user/testedcom Discovery https://www.youtube.com/channel/UCqOoboPm3uhY_YXhvhmL-WA SciCentral http://www.scicentral.com/ News Google Science Fair https://www.googlesciencefair.com/en/ About Chemistry http://chemistry.about.com/ Jeopardy Labs https://jeopardylabs.com/

Matt Menefee – Baylor University, CASPER RET Summer Program 2014
29
Spitzer JPL http://www.spitzer.caltech.edu/ acapellascience https://www.youtube.com/channel/UCTev4RNBiu6lqtx8z1e87fQ
alpinekat https://www.youtube.com/channel/UClSz-xF13xHrNxTWZdxhnuQ
Science Rap
Mr. Lee's Science Rap Channel https://www.youtube.com/channel/UC2DwkfiWSqRXxZ685AiFdGQ Sick Science! https://www.youtube.com/user/SteveSpanglerScience Mental Floss https://www.youtube.com/user/MentalFlossVideo National Geographic https://www.youtube.com/user/NatGeoHD1 Bozeman Science https://www.youtube.com/user/bozemanbiology IFL Science http://www.iflscience.com/ Science Up Close http://www.harcourtschool.com/menus/science/up_close5.html grade 5/6 National Science Digital Library http://nsdl.org/ Science Magazine http://www.sciencemag.org/ Moon Phases http://moonphases.info/ The Science Spot http://sciencespot.net/ 100 Greatest Discovery
http://www.sciencechannel.com/famous-scientists-discoveries/100-greatest-discoveries.htm
Science News https://www.sciencenews.org/ PhET http://phet.colorado.edu/ Periodic Videos http://www.periodicvideos.com/ Explore Science http://42explore.com/42explorescience.htm Ed Heads http://edheads.org/ Games Fun Brain http://www.funbrain.com/ Games
Learning Games for Kids http://www.learninggamesforkids.com/
Games, ALL Grade levels
Science Friday http://sciencefriday.com/ NPR
http://www.mytopo.com/maps/index.cfm
No activities - but cool site for topo map of anywhere!
http://www.usra.edu
World Science U http://www.worldscienceu.com/ Physics

Lisa Tarman – Baylor University CASPER RET Summer Program 2014
30
BRIC Bowl Design

Lisa Tarman – Baylor University CASPER RET Summer Program 2014
31
BRIC Bowl - Semifinals The semifinals is roughly based on the format used by Dallastown High School’s (Pennsylvania) annual Physics Olympics. Students identified by Science Gateway scores are formed into groups of 4 students from the same school that compete together as a team throughout the semifinals. There are 11 events that are individually scored. Each team’s composite score depends on their rankings in the eleven events. Unlike the Dallastown Olympics that only considers first through fifth place, the BRIC Bowl Semifinals will rank all teams in all events in order to promote competition at levels. A Semifinals “Prep Camp” should be held 3 weeks prior to the Semifinals. Ideas for the camp follow the event descriptions. The Semifinals would be held on a Saturday. It should start prior to 9:00 AM. Traditionally if students don’t have to report first thing in the morning, the event loses priority status and other plans prevail. (Anecdotal data from Matt) It is important to keep things moving and have little downtime, but it would be wise to have a back-up alternate schedule ready to switch to after 3 blocks incase the pace can’t be maintained. This is a possible schedule of events:
8:30 Arrive / get t-shirt / nametag
Video submissions playing 9:00 30 min 1st block 9:30 ROTATE 9:35 30 min 2nd block
10:05 ROTATE 10:10 30 min 3rd block 10:40 ROTATE 10:45 30 min 4th block Two lunch shifts
11:15 LUNCH – Video submissions playing 30 min 5th block A 11:45 ROTATE ROTATE 11:50 30 min 5th block B LUNCH – Video submissions playing
12:20 ROTATE 12:25 30 min 6th block 12:55 ROTATE 1:00 30 min 7th block 1:30 ROTATE
1:40
CLOSING CEREMONY – entertainment or something to buy at least 30 minutes for final score tabulation before awards. Maybe a screening of the top 3 video entries and recognize teachers. Recognize top 10 finishing teams Hold tie breaker if 8th & 9th are tie. Top 8 teams advance to BRIC Bowl Finals

Lisa Tarman – Baylor University CASPER RET Summer Program 2014
32
If all Waco ISD and LaVega ISD schools are included in the grant, Forty-two teams (168 students) will compete in the BRIC Bowl Semifinals. Eight teams each from LaVega, and Waco’s Carver, Indian Spring, Tennyson, and ten teams from Cesar Chavez because they are larger and have lower STAAR scores as shown in Table 1a. Each team is 4 students plus one parent or teacher chaperone. If fewer students are included in the grant cohort, 28 teams (112 students) with only 4 teams in each block would be a good adjustment. Seven separate areas able to accommodate 32 people are required throughout the day of Semifinals. A large space for all attendees (≈225) is needed if there will be a closing/awards ceremony. Attendees would be restricted to the first floor with access to the 2nd floor via front stairs for bathrooms and Event 1 Team Quiz only. The 42 teams rotate through these seven 30 minute blocks: (event descriptions follow) 30 minute Block:
A B C D E F G
# of teams: 6 teams 6 teams 3 + 3 teams 6 teams 6 teams 6 teams 2+2+2 teams
Events:
1 2 3 & 4 5 6 7 8,9,& 10 Team Quiz Science
Relay Test Mouse
Trap Car Write It Do
It Team Cup
Stack PhET
Games ES -Pictionary Chem- Density
Score Pringle
Physics-Estimation
# of people:
24 students 24 students 24 students 24 students 24 students 24 students 24 students 2 leaders 2+ leaders 3 leaders 2 leaders 2+ leaders 3 leaders 2+ leaders 6
chaperones 6
chaperones 6
chaperones 6
chaperones 6
chaperones 6
chaperones 6 chaperones
Possible location:
2nd floor 1st floor 1st floor 1st floor 1st floor 1st floor 1st floor Large room
at top of stairs
Back hallway
Back hallway ?? Behind
elevators ?? 1160 Partially partitioned into
3 areas Space requirements: 7+ tables Tape on
floor
2 tables Tape on
floor
Need to be able to
separate into to 2 groups
Sit and work on floor
6+ tables & 12 laptops
Power Outlets
Tables / chairs
The eleventh event is the video submission that would be scored prior to the BRIC Bowl. Scorekeeping could be a logistical nightmare. Each event crew must have preprinted score sheets of team names (or numbers) for each block and keep meticulous records. It would be best to have a team of 3-4 score masters that gather score sheets from each event after each block and compile a master collaborative spreadsheet. Since the cumulative scores depend on the rank (1st – 42nd ) on each event, nothing can be determined until after the 7th block. The master spreadsheet should have a worksheet for each event with team names and numbers. Event scores should be entered on each page as they come in. After block 7, each worksheet should be sorted by scores & given a rank (1 – 42) by filling down a +1 series. The ranks must be manually adjusted for ties. Example: If the 7th, 8th, 9th. and 10th ranked teams all have the same event score, they should all be given 8.5 points, the average of their ranks. A team’s “rank score” from all 11 events will be summed for their overall cumulative score. Low score wins.

Lisa Tarman – Baylor University CASPER RET Summer Program 2014
33
The eleven events are:
1. Team Quiz
Description: This event is content-heavy stressing the weaknesses on the STAAR exam as well as many other standards. Each team of four students will collaborate to complete a large multipage written quiz that covers science TEKS for grades 6 & 7 and possibly some random topics from Science Gateway YouTube channels. To introduce an additional layer of strategy, wrong answers will receive a half point deduction. Teams may turn in quizzes before deadline. Time stamp will only be used as a tie breaker to rank teams. For ease of grading, only multiple choice, matching, and one word answers will be included. Pages of the quiz should be printed on different colored paper and not stapled. Each page of the quiz should have a place for team name and number. Scoring: + 1 pt for each correct answer 0 pt for each unanswered question - .5 pt for each wrong answers Time stamp is used to rank teams with the same score Logistics: Event space with a round table with STAAR reference materials (periodic table & formulas) for each team Two monitors that will time stamp and score completed quizzes. Cell phone use must be prohibited Calculators are also not allowed because they are not allowed on the STAAR Test. Supplies: 1 copy of quiz per team 1 copy of reference material per table 1 answer key Still required:
� Create quiz � Create answer key � Copy reference material & quizzes
Lisa Tarman – Baylor University CASPER RET Summer Program 2014
34
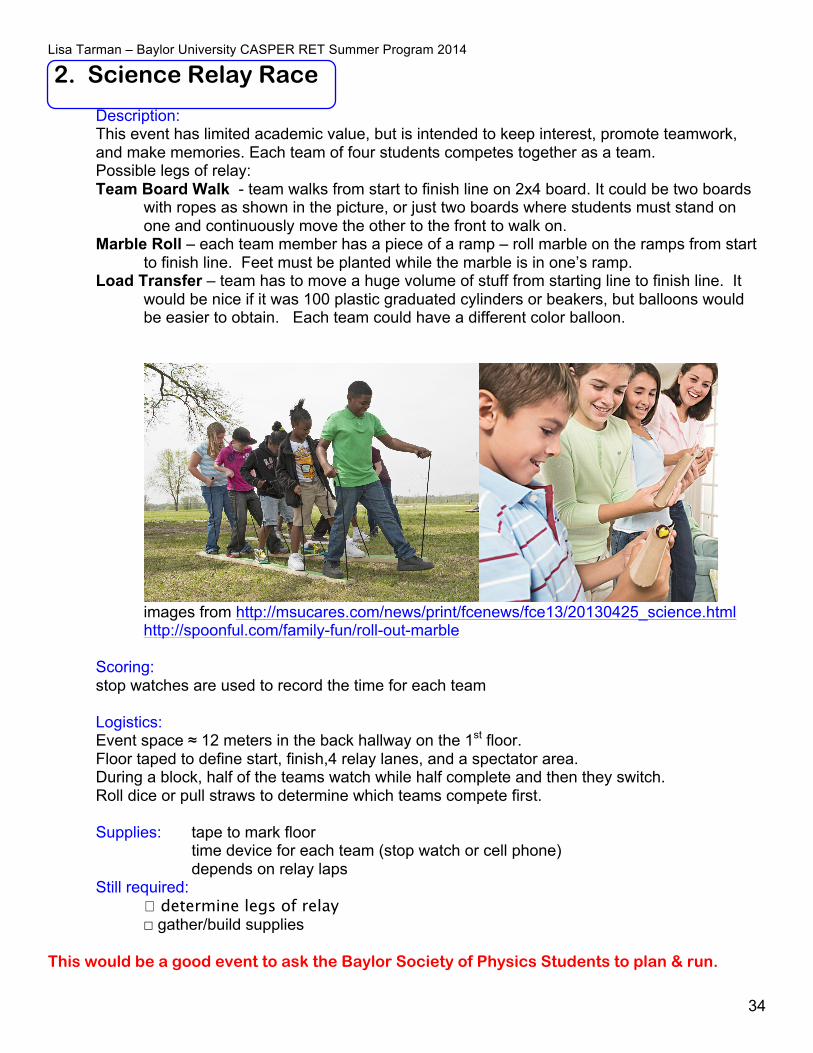
2. Science Relay Race Description: This event has limited academic value, but is intended to keep interest, promote teamwork, and make memories. Each team of four students competes together as a team. Possible legs of relay: Team Board Walk - team walks from start to finish line on 2x4 board. It could be two boards with ropes as shown in the picture, or just two boards where students must stand on one and continuously move the other to the front to walk on. Marble Roll – each team member has a piece of a ramp – roll marble on the ramps from start to finish line. Feet must be planted while the marble is in one’s ramp.
Load Transfer – team has to move a huge volume of stuff from starting line to finish line. It would be nice if it was 100 plastic graduated cylinders or beakers, but balloons would be easier to obtain. Each team could have a different color balloon.
images from http://msucares.com/news/print/fcenews/fce13/20130425_science.html http://spoonful.com/family-fun/roll-out-marble
Scoring: stop watches are used to record the time for each team Logistics: Event space ≈ 12 meters in the back hallway on the 1st floor. Floor taped to define start, finish,4 relay lanes, and a spectator area. During a block, half of the teams watch while half complete and then they switch. Roll dice or pull straws to determine which teams compete first. Supplies: tape to mark floor
time device for each team (stop watch or cell phone) depends on relay laps
Still required: � determine legs of relay
☐ gather/build supplies This would be a good event to ask the Baylor Society of Physics Students to plan & run.

Lisa Tarman – Baylor University CASPER RET Summer Program 2014
35
3. Prior Build – Mail a Pringle
Description: This is an event from the 2008 Dallastown Physics Olympics. It supports TEKS Scientific Investigation and Reasoning standards: 6.2B, 7.2B, 8.2B that relate to designing and building, and loosely supports concept standard 8.6C dealing with force. Mail a single Pringle potato chip through the U.S. Mail and have it arrive in one whole piece. A rectangular package must be designed with minimum dimensions of 3.5 in. x 5 in. x 0.25 in. Packages under the minimum dimensions will be disqualified. The single Pringle must be a standard, original style/flavor Pringle. The Pringle may not be altered in any way to increase its strength. To prevent the addition of foreign materials, chips will be weighed by judges and eaten by team members after unpackaging.
The package may not be marked “fragile” or “hand cancel.” It must be mailed through the U.S. Postal Service using First Class Mail. It must be mailed from the Clay Street post office, with a postmark date no later than _(date)__. It must be mailed to the following address: ___(address)____ The return address on the package must include the team name and number.
At the BRIC Bowl, teams will open their packages and remove the chip. If the chip is unbroken, it will be weighed and then eaten by a team member. Teams with broken chips, teams who refuse to eat their chips, and teams with chips of altered mass will be disqualified.
Scoring: Score = (mass of package)(volume of package) Lowest scores win Logistics: Shared time block and space with Event 4 (prior build) – maybe behind elevators on 1st floor Table for weigh station Sort mailed packages into 7 groups according to the 7 blocks on the schedule Supplies: 1 or 2 electronic scales Rulers Still required:
� determine mailing address

Lisa Tarman – Baylor University CASPER RET Summer Program 2014
36
4. Prior Build – Mousetrap Car
Description: Prior to the BRIC Bowl, each team will design and build a mousetrap powered car that will travel the greatest distance. It supports TEKS Scientific Investigation and Reasoning standards: 6.2B, 7.2B, 8.2B that relate to designing and building. Teams must construct a mousetrap powered, four-wheeled vehicle. The only acceptable source of energy to drive the vehicle is the elastic potential energy (no falling weights, etc.) from the spring in the provided mousetrap, which must remain intact. The vehicle can be made from any materials, which you provide, so long as they do not provide additional energy and it is not a purchased mousetrap cat kit. The mousetrap must be rigidly attached to the vehicle, and must move forward with the vehicle at all times. The vehicle will be released by pressing an unsharpened wooden pencil eraser on the release mechanism by a team member. Teams may release the vehicle as many as two times, with the best distance for the two releases being recorded. Mouse trap car challenges are pretty common. The variations are determined by the particular competition rules. By measuring distance and keeping a defined width boundary, it should be easy to be consistent with scoring. There are many online resources to help students.
http://www.instructables.com/id/Mouse-Trap-car/ http://www.docfizzix.com/old/speed1.jpg Scoring: Scoring will take place on a 1.5 meter wide test track. The perpendicular distance will be measured from the starting line to the point that the car first touched the side line or the front wheel where it stopped. Logistics: Shared time block and space with Event 4 (prior build) A long 1.5 meter wide track should be taped on the floor. Supplies: 1 mousetrap per team provided at the Semifinals Camp tape for floor tape measure

Lisa Tarman – Baylor University CASPER RET Summer Program 2014
37
5. Write it Do It Description:
This is a reoccurring event from Science Olympiad. (http://soinc.org ) This event demonstrates the importance of precise language and communication skills. A model made of simple materials (Styrofoam cups, paper clips, pipe cleaners, legos, etc) is displayed. Two members of the team see the model and have 12 minutes to write a detailed description of how to build the model. Instructions can include only words and no diagrams. The other two team members follow the written directions and have 12 minutes to build the model. Scoring: A very detailed rubric is used to score the model. Could use this one for picture shown: http://scioly.org/wiki/images/c/c0/WIDIClio2013.pdf
Logistics: The event space needs 2 areas. Half of the group (2 from each team) will be in the “work area” writing descriptions of the model, while the other half is in the “screen area” watching submissions or highlights from the video event or something else. The model must be covered then groups switch places. The builders should not be able to see each other’s work. Cardboard tri-fold display boards could be used as screens. Six sets of materials must be available and include items not needed for the model. Ideally – completed models are labeled with team name & number and moved to a separate area out of sight for scorers to fill in rubrics and disassemble to reuse supplies for the next group. Supplies: Simple random/craft materials Trifold or other means to create screens to separate teams Copies of scoring rubrics Still required:
� Build Model � Create & copy Detailed Rubric (or use model & rubric linked above)

Lisa Tarman – Baylor University CASPER RET Summer Program 2014
38
6. Team Cup Stack
Description: This event is another event that is mainly designed to promote teamwork and have fun, but it does illustrate TEKS 6.8B with the changes in velocity and position caused by unbalanced forces. It also encourages students to critically consider cup configurations to maximize score. Team works together to make a pyramid of paper (or plastic) cups. Each team member holds the end of a string that is tied to a rubber band. The rubber band is used to take cups off a stack and build a pyramid in 7 minutes. Scoring: 1 point for each cup in the bottom layer 2 points for each cup in the second layer 3 points for each cup in the third layer - ½ point for cups that are stuck together Logistics: During a block, half of the teams watch while half complete and then they switch. Roll dice or pull straws to determine which teams compete first. Teams could work on floor or table. Could take a picture of each team with their pyramid to double check score later. Tie strings to rubber bands ahead of time. Supplies: Paper or plastic cups String Rubber bands Still required: Experiment to see if scoring needs adjusted to allow for a large range of scores and the optimum rubber band type and string length.
Score = 15 pt 1 1 1 1 1 1 1
2 2 2
3 ! - ½
! - ½
Lisa Tarman – Baylor University CASPER RET Summer Program 2014
39
7. PhET Event
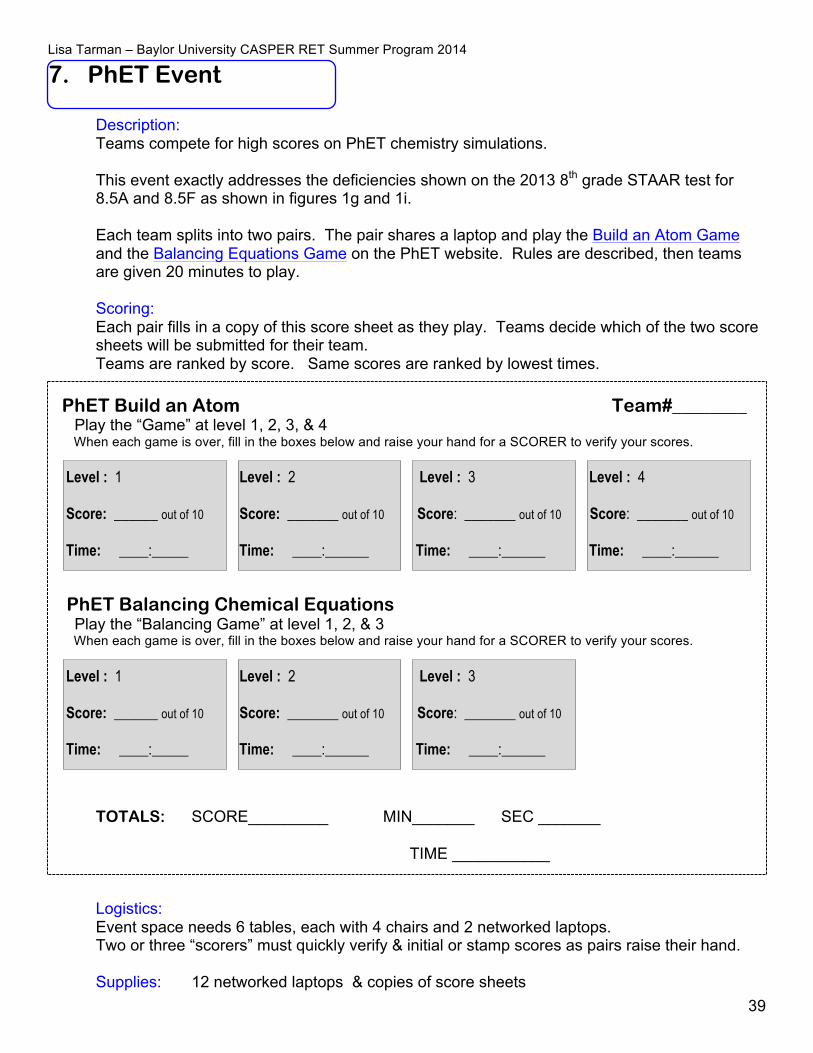
Description: Teams compete for high scores on PhET chemistry simulations. This event exactly addresses the deficiencies shown on the 2013 8th grade STAAR test for 8.5A and 8.5F as shown in figures 1g and 1i. Each team splits into two pairs. The pair shares a laptop and play the Build an Atom Game and the Balancing Equations Game on the PhET website. Rules are described, then teams are given 20 minutes to play. Scoring: Each pair fills in a copy of this score sheet as they play. Teams decide which of the two score sheets will be submitted for their team. Teams are ranked by score. Same scores are ranked by lowest times.
PhET Build an Atom Team#________ Play the “Game” at level 1, 2, 3, & 4 When each game is over, fill in the boxes below and raise your hand for a SCORER to verify your scores.
Level : 1 Level : 2 Level : 3 Level : 4 Score: ______ out of 10 Score: _______ out of 10 Score: _______ out of 10 Score: _______ out of 10
Time: ____:_____ Time: ____:______ Time: ____:______ Time: ____:______ PhET Balancing Chemical Equations Play the “Balancing Game” at level 1, 2, & 3 When each game is over, fill in the boxes below and raise your hand for a SCORER to verify your scores.
Level : 1 Level : 2 Level : 3 Score: ______ out of 10 Score: _______ out of 10 Score: _______ out of 10
Time: ____:_____ Time: ____:______ Time: ____:______ TOTALS: SCORE_________ MIN_______ SEC _______ TIME ___________
Logistics: Event space needs 6 tables, each with 4 chairs and 2 networked laptops. Two or three “scorers” must quickly verify & initial or stamp scores as pairs raise their hand. Supplies: 12 networked laptops & copies of score sheets

Lisa Tarman – Baylor University CASPER RET Summer Program 2014
40
8. Earth Science Pictionary
Description: This event is similar to Pictionary. Each team will randomly pull 5 Earth & Space Vocabulary words from STAAR eligible content. One member of the team draws all five words, while the other team members guess. There will be a 3 minute time limit. Teams are disqualified if they write letters or numbers. The drawer will see all 5 words and may draw them in any order. The list of 57 eligible vocabulary words will be provided at the camp:
1 1st Quarter Moon 21 High Pressure (weather) 41 Solstice 2 3rd Quarter Moon 22 Hurricane 42 Spiral Galaxy 3 Asthenosphere 23 Igneous Rocks 43 Spring Tide 4 Chemical Weathering 24 Irregular Galaxy 44 Star 5 Cold Front 25 Land Breezes 45 Subduction Zone 6 Comet 26 Lithosphere 46 Sun 7 Continental Drift Theory 27 Local Wind 47 Surface Ocean Currents 8 Convection Currents 28 Low Pressure (weather) 48 Tectonic Plates 9 Convergent Boundary 29 Mantle 49 Tides
10 Crust 30 Mechanical Weathering 50 Topographic Maps 11 Deep Ocean Currents 31 Metamorphic Rocks 51 Waning Crescent 12 Divergent Boundary 32 Neap Tide 52 Waning Gibbous 13 Electromagnetic Spectrum 33 Nebula 53 Warm Front 14 Elliptical Galaxy 34 New Moon 54 Waxing Crescent 15 Equinox 35 Planets 55 Waxing Gibbous 16 Erosion 36 Plate Boundaries 56 Weathering 17 Full Moon 37 Revolution 57 Wind 18 Galaxy 38 Rotation
19 Global Wind 39 Sea Breezes 20 Hertzsprung-Russell Diagram 40 Sedimentary Rocks
Scoring: Each team will be timed with a limit of 3 minutes. All teams that complete all 5 words will be ranked by shortest time, followed by all the teams that complete only 4 words tying, teams that complete only 3 words tying, teams that complete 2 word tying, and teams that complete only 1 word tying. Logistics: Events 9, 10, & 11 share one block of time and a large space – BRIC 1160 with partitions mostly closed might work well. Two teams must compete in 10 minutes. Describe rules to both teams at one time. Each drawer choses 5 word cards, but may not look at them. Flip coin to see which team draws first. Supplies: A whiteboard and dry erase markers and eraser or flip chart and markers Stopwatch or cell phone to record times. 57 words printed on cards or slips of paper Still required:
� prepare cards with words

Lisa Tarman – Baylor University CASPER RET Summer Program 2014
41
9. Rock & Block Density
Description: Each team must determine the density of two items – an irregularly shaped rock and a wooden block. Equipment but no instructions are provided. This event addresses TEKS content standard 6.6B about density. It addresses 6.2C and 7.2C about collecting and recording data in SI units, and 7.4A about equipment use. Teams must show detailed work on paper and reset the station to initial conditions within 5 minutes. Scoring: Scorers would circle 1 pt for each action observed and rate teamwork a 1, 2, or 3 pt After the event scorers would circle 1 pt for each step clearly shown and 1, 2, or 3 points depending on the degree of accuracy of the answer. Observation: Water displacement to find volume of rock 1
Ruler to measure sides of block 1 Triple Beam balance to find masses 1 Teamwork / cooperation 1 2 3
Reset station - all water in beaker 1 - all sliders set to 0 on balance 1
Work on Paper: Rock Show two volumes subtracted 1 Show equation D = m/V 1 Show values of m & V plugged in 1 Show calculated density 1 Accuracy of density value 1 2 3 Unit on density 1 Block Show 3 dimensions multiplied 1 Show equation D = m/V 1 Show values of m & V plugged in 1 Show calculated density 1 Accuracy of density value 1 2 3 Unit on density 1 TOTAL __________
Logistics: Events 9, 10, & 11 share one block of time and a large space – BRIC 1160 with partitions mostly closed might work well. Two teams each have their own lab area and compete simultaneously. A scorer observes each team. Staple Scoring rubric to team worksheet Supplies: 2 triple beam balances 2 wooden blocks with sharp corners for accurate measurements 2 rocks that fit in graduated cylinder 2 metric rulers & 2 large plastic graduated cylinders 2 large beakers or pitchers of water 2 calculators material for spill clean-up Copies of worksheet (or blank paper) & scoring rubrics Stapler Still required:
� gather lab equipment ☐ determine point cut-offs for accuracy of density & copy rubrics
Ro
ck
& B
loc
k D
en
sity
Te
am
#___
____
_

Lisa Tarman – Baylor University CASPER RET Summer Program 2014
42
Est
ima
tio
n
Te
am
#__
____
__
10. Physics Estimation Description: Each team works together to estimates 6 quantities: the mass of a pencil in grams the mass of a heavy object? in kilograms the length of a string in centimeters the force required to push a heavy box in Newtons the volume of water in a glass in ml the number of M&Ms in a large jar This event supports TEKS 6.2C, 7.2C, & 8.2C by familiarizing students with the magnitude of SI units. Scoring: SCORE mass of pencil _________g _______
mass of object _________kg _______
length of string _________cm _______
force to push box _________N _______
volume of water _________ml _______
number of M&Ms _________ _______
The team would submit their slip and a prepared scale would be used to score each value out of 8 points. For example if the mass of pencil is 25.3 grams and the number of M&Ms is 372: PENCIL SCORING: 1pt 2pt 3pt 4pt 5pt 6pt 7pt8pt7pt 6pt 5pt 4pt 3pt 2pt 1pt 10.3 ↔ 15.3 ↔ 20.3 ↔ 22.3 ↔ 23.3 ↔ 24.3 ↔ 25 ↔ 25.3 ↔ 25.6 ↔ 26.3 ↔ 27.3 ↔ 28.3 ↔ 30.3 ↔ 35.3 ↔ 40.3 M&M SCORING: 1pt 2pt 3pt 4pt 5pt 6pt 7pt 8pt 7pt 6pt 5pt 4pt 3pt 2pt 1pt 122 ↔ 172 ↔ 222 ↔ 272 ↔ 322 ↔ 362 ↔ 367 ↔ 372 ↔ 377 ↔ 382 ↔ 422 ↔ 472 ↔ 522 ↔ 572 ↔ 622 Scores outside of each range receive 0 points. Logistics: Event shares space and a block of time with events 9 & 10. Two teams would rotate through the 6 estimations simultaneously. 1 minutes of instructions + 8 minutes to turn in slip. Supplies: material for the 6 estimation stations listed above. Still required:
� prepare scoring rubric based on actual measurements

Lisa Tarman – Baylor University CASPER RET Summer Program 2014
43
☐ copy score slips 11. Science Video
Description: This event is based on an annual event at the Dallastown Physics Olympics Each team will produce a three to five-minute video which teaches some science concept/application at the middle school level.
Videos must be turned into the judges by _____date 1 week before BRIC Bowl____. Acceptable video formats are MPEG, .wma, .avi, or .mov (raw video format—not converted to DVD so that they can be put together in one file). Videos will be judged prior to the BRIC Bowl Each video lesson should begin with at statement of the lesson objective(s). Teams may use any method/style of presentation to accomplish this goal (e.g., traditional lecture, demonstration, experiment, drama, etc.). Videos containing or implying profanity of any type or inappropriate dress will be disqualified.
Scoring: technical quality (quality of props, audio/video clarity, acting ability): 25 pts. entertainment value (holds viewers attention, fun to watch): 25 pts. educational value (quantity/quality of material taught, teaching techniques): 25 pts. science value (depth and correctness of the science): 25 pts. Logistics: Someone must compile the submissions into one file with Team Name Titles A team of judges must commit 3.5+ hours to score all videos Supplies: Provide CD-ROM at camp
Three weeks prior to the BRIC Bowl Semifinals a 2-3 hour “Prep Camp” would be held. One student from each team would be required to attend. Students would be given a Semifinal handout for each member of their team and supply bag. The handout would briefly describe 8 of the events and describe in detail the prior builds: video, mousetrap car, and mailing Pringle The supply bag could contain a blank CD-ROM with prepaid mailer for the video, the list of Earth & Space vocabulary words, a snack size pack of Pringles, and a mousetrap for the mousetrap car. The camp should also include engaging fun activities and previews of prizes to encourage team representatives to sell this as time well spent on a Saturday and a worthwhile expenditure of effort over the next 3 weeks. There could be a chance to try the cup stack and one leg of the Team Science Relay. It would be an excellent forum to get feedback and suggestions on the Science Gateway and advice for prizes. A short workshop on using Windows MovieMaker or Apple iMovie could round out the morning.
Lisa Tarman – Baylor University CASPER RET Summer Program 2014
44
BRIC Bowl – Finals The BRIC Bowl Finals will be a more spectator friendly experience than the semi-finals with only three events to reduce the field to three teams that will battle it out in a championship quiz game. It will also not require as much manpower to lead events and be in the know. These two events will occur simultaneously with 4 teams each and then participants will swap places:
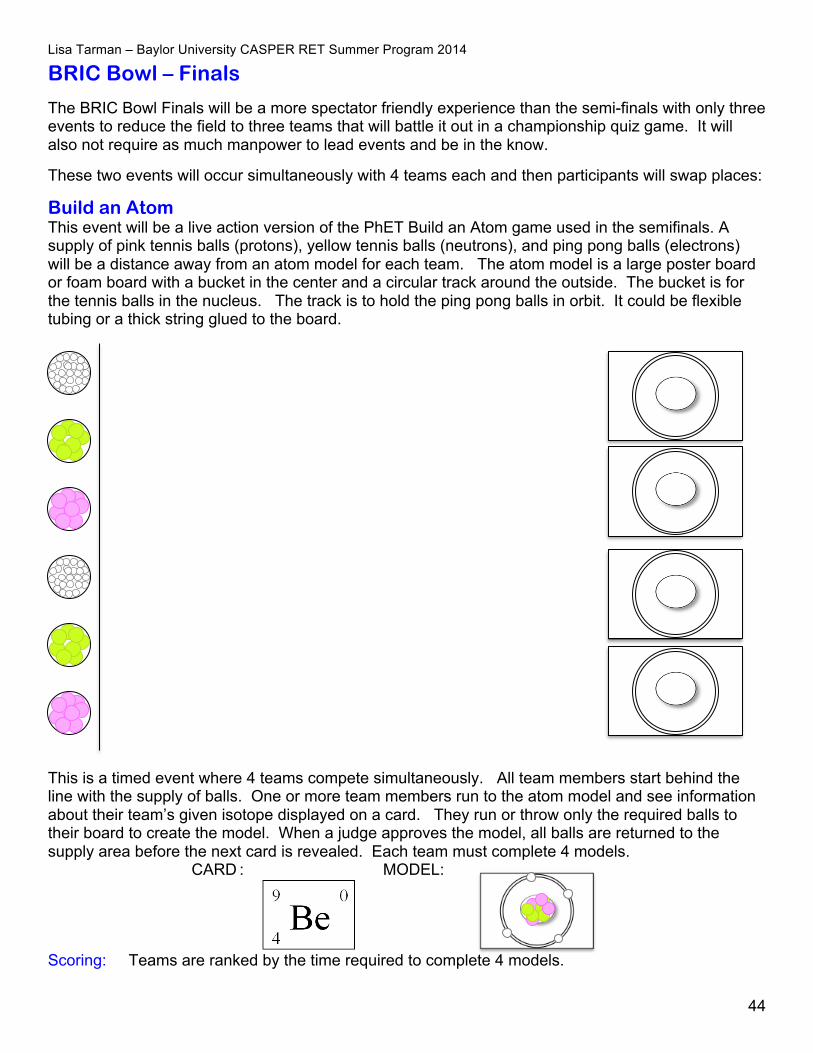
Build an Atom This event will be a live action version of the PhET Build an Atom game used in the semifinals. A supply of pink tennis balls (protons), yellow tennis balls (neutrons), and ping pong balls (electrons) will be a distance away from an atom model for each team. The atom model is a large poster board or foam board with a bucket in the center and a circular track around the outside. The bucket is for the tennis balls in the nucleus. The track is to hold the ping pong balls in orbit. It could be flexible tubing or a thick string glued to the board.
This is a timed event where 4 teams compete simultaneously. All team members start behind the line with the supply of balls. One or more team members run to the atom model and see information about their team’s given isotope displayed on a card. They run or throw only the required balls to their board to create the model. When a judge approves the model, all balls are returned to the supply area before the next card is revealed. Each team must complete 4 models. CARD : MODEL:
Scoring: Teams are ranked by the time required to complete 4 models.

Lisa Tarman – Baylor University CASPER RET Summer Program 2014
45
Biology Pictionary This event is like the semifinals Pictionary, except it uses vocabulary terms from TEKS for Organisms and Environments and it is more spectator friendly. The eligible words are:
1 unicellular 23 food chain 45 circulatory system 2 multicellular 24 food web 46 respiratory system 3 homeostasis 25 succession 47 digestive system 4 adaptations 26 primary succession 48 integumentary system 5 extinction 27 secondary succession 49 skeletal system 6 chromosome 28 tissue 50 muscular system 7 inherited trait 29 organ 51 nervous system 8 asexual reproduction 30 organ system 52 endocrine system 9 sexual reproduction 31 organism 53 reproductive system 10 ecosystem 32 cells 54 excretory system 11 community 33 prokaryote 55 biome 12 population 34 eukaryote 56 tundra 13 habitat 35 organelles 57 rainforest 14 biotic 36 plant cell 58 marine biome 15 abiotic 37 animal cell 59 desert 16 producers 38 cytoplasm 60 predator 17 primary consumers 39 nucleus 61 prey 18 secondary consumers 40 cell membrane 62 parasite 19 herbivores 41 cell wall 63 runoff 20 carnivores 42 chloroplast 64 artificial reef 21 omnivores 43 mitochondria 65 overfishing 22 decomposers 44 vacuole
Prior to the event 15 words will be strategically or randomly selected. Three teams are isolated without phone communication while one team performs in front of spectators. Room 1160 would be ideal to use. One teammate draws on a tablet. This drawing is projected on all 4 screens while his 3 teammates guess at the microphone. The team gets 5 minutes to draw as many words as possible in any order that the drawer chooses. He shows a judge which word he is working on so that the judges know what answer is correct. To be fair, each of the other three teams in the heat has the same words. Scoring: The team rank will be determined by how many words are completed in a 5 minute limit or the time if all 15 words are completed.

Lisa Tarman – Baylor University CASPER RET Summer Program 2014
46
Real Life Word Problem In this event, students will utilize different processes to determine a weight, volume, and length to use on a trebuchet to project the weight a precise distance. To determine the weight that is to be projected, the student teams will be given the sum weight of pairs or greater of six objects. Students must determine what collection of objects will yield the correct weight to be projected. For example, objects A and B together weigh 12 pounds; A and C together weigh 16 pounds; B and C together weigh 20 pounds; D, E and F together weigh 59 pounds; D and F together weigh 39 pounds; and B and D together weigh 25 pounds. What collection of objects together will yield 33 pounds? To determine the volume of water that will act as the counter balance, Students will be given two buckets of different volumes and the desired numerical volume. For example, given a 5-gallon and 3-gallon bucket and a supply of water, precisely measure out 4 gallons of water. A similar process will be used to determine the length of string for the trebuchet. Students will be given two dowel rods of known length and the desired length of rope. Scoring: Each team’s 3 quantities will be used for a trebuchet launch. In addition to a rubric to score each of the three component quantities (volume of water, length of rope, weight of object), a point value from rings of a bulls-eye where the projectile lands comprise the event score. Championship Quiz Show The scores from the 3 events will narrow the field to 3 teams. If the 3rd and 4th place teams are tied, a tiebreaker would determine which advances. The quiz show would involve all 4 members of each team either taking turns or buzzing in to answer questions related to the Science TEKS.
Acknowledgements A huge thank-you to Dr. Truell Hyde, Jorge Carmona Reyes, Dr. Li Wang, Dr. Lorin Matthews, and CASPER 2014 REUs. This work was supported by NSF grant No. 1262031 About the Authors
Matt R. Menefee received his B.S. in Psychology from Sam Houston State University in Huntsville, TX in 2007. From 1997 through 2007 he worked in Outdoor Education and Professional Camping serving students and children in a wilderness setting. Matt began teaching science in 2008, and has served in Title 1 education in grade levels from K-12th. Mr. Menefee is a member of the Region 12 Science Collaborative, and recipient of the 2013-2014 Teacher of the Year from that organization.
Gary R. Stark received his B.A. degree from Winona State University, MN in 1983, majoring in mathematics and physical science. Mr. Stark received the M.A. degree from the University of Northern Colorado in mathematics in 1997, and is two courses shy of a second M.A. in physics from the University of Virginia. He began his teaching career in 1983 at Lac Courtes Oreilles – Ojibwa Schools in northern Wisconsin, teaching math, science, and computer programming. He moved to Estes Park, CO in 1985, where he taught at Estes Park and Longmont High Schools. From 2001 to 2003 he directed a
GEAR UP grant at Adams City High School in Commerce City, CO where he also was the math coach and initiated the AVID program in the district. From 2003 to 2013 he taught mathematics and science at Estes Park High School. He is currently teaching mathematics at Greeley Central High School in Greeley, CO. Mr. Stark has participated in the Research Experience for Teachers (RET) programs at Cornell University, NY and Baylor University, TX. He has also participated in the Academy Creating Teacher Scientists (ACTS) program at Princeton University, NJ. He has been a member of the National Council of Teachers of Mathematics, National Council of Supervisors of Mathematics, National Science Teachers Association, American Association of Physics Teachers, and the National Education Association.
Lisa M. Tarman received a B.A. degree in physics from Lycoming College, Williamsport, PA in 1990, a M.A. degree in curriculum and instruction from Gratz College, Melrose Park, PA in 2002, and a M.A. degree in physics education from University of Virginia, Charlottesville, VA in 2008. From 1993 to 1995 she taught physics, earth science, physical science, and applied science at Shenandoah Valley Jr Sr High, Shenandoah, PA. From 1995 to present she teaches physics and serves in school leadership at William Penn Senior High York, PA. Mrs. Tarman is a member of the American Association of Physics Teachers, the National
Science Teachers Association, and the National Council of Teachers of Mathematics. She has spent four summers in Research Experiences for Teachers (RET), two summers in the Academy Creating Teacher Scientists (ACTS), and one sabbatical semester in Penn State’s Research Experience for Urban Science Teachers.