Embed Size (px)
Citation preview

Part IIIThe Genetic Diversity of
Forest Tree Species in French Guiana

147
Ecology and Management of a Neotropical Rainforest
© 2004 Elsevier SAS. All rights reserved
The genetic diversity of forest tree species in French Guiana
Antoine Kremer
In the early 1990s, INRA initiated a research project to describe and study theevolution of genetic diversity in the Guianan tropical forest. CIRAD joined theproject shortly after it began. The basic objective of this project is to establish ageneral knowledge of the level and distribution of genetic diversity in tropical forestsand its future dynamics. It is then planned to use this basic information to predictthe future evolution of diversity as a response to various anthropic or non anthropicfactors. The knowledge of the diversity within a species in terms of its differentcomponents (populations, trees..) is a prerequisite to the development ofconservation strategies. In temperate zone forests, trees show reduced variation inlife history traits, whereas there is an important variation in dispersion mechanismsand ecophysiological traits in the tropics. The INRA-CIRAD project has identifieda set of 15 species exhibiting contrasting life history traits (pollen and seeddispersion, flowering phenology, succession, spatial distribution, etc.). For each ofthese species, the level and the spatial distribution of diversity within the Paracoustand are being described. Furthermore, genetic processes such as the mating system,the phenology of flowering, and gene flow are being monitored. Finally, we alsointend to obtain insight into the evolutionary history of the species. The ultimategoal is to identify significant determinants of genetic diversity in tropical ecosystemsthat could be used in the future for a model of the evolution of diversity to serve asa basis for practical or more fundamental applications. The project is subdivided intothree major steps.
Description and inventory of genetic diversity
The level and spatial distribution of genetic diversity are estimated for nuclear andcytoplasmic genetic markers for the 15 studied species within the Paracou stand.Methods are being developed that allow comparisons across species.
Dynamics and evolution of diversity
Basic genetic processes such as mating system, pollen and seed flow are beingmonitored in the Paracou stand by parentage analysis. These data are completed byfurther indirect measurements inferred from the spatial distribution of nuclear andcytoplasmic markers. Observations of floral and pollination biology and phenology
03-Chap01.fm Page 147 Mardi, 3. août 2004 4:32 16

The genetic diversity of forest tree species in French Guiana
148
are made in addition to genetic analysis. Investigations are also underway that willallow to retrace the recent migration routes and colonisation dynamics of thedifferent species.
Modelling of genetic diversity
The information gained during the two first steps will be introduced into a modelpredicting the evolution of genetic diversity under different scenarios. The modelwill also take into account the particular features of tropical trees: multispecies(competition, status in succession) overlapping generations, metapopulation(extinction-colonisation).We report here on the data and results for 10 of the 15 sampled species concerningthe first two steps of the project.
03-Chap01.fm Page 148 Mardi, 3. août 2004 4:32 16

149
Ecology and Management of a Neotropical Rainforest
© 2004 Elsevier SAS. All rights reserved
Chapter 1
Reproductive phenology and mating system of six tree species in Paracou stands
Henri Caron, Cyril Dutech, Eric Bandou
Abstract
– The reproductive phenology of six tree species,
Dicorynia guianensis
,
Vouacapoua americana
,
Eperua grandiflora
,
Carapa procera,
Virola michelii
and
Chrysophyllum sanguinolentum,
has been monitored in the Paracou stands overseveral years. A large variation of flowering rates exists among the species and fromyear to year. The tallest trees bloom and fruit more frequently than the smallest.The allozyme analysis of parent trees and progenies showed that the studied speciesare largely outcrossed. However, the individual outcrossing rate is variable amongboth trees and years in mixed mating species.Although the reproductive success of a logged population can be affected by the lossof effective reproductive trees, changes in flowering pattern, inbreeding and adecrease in seedling viability, impacts of silvicultural treatments were found only in
C. procera
.This information can be of great interest for the forest manager who must maintaina minimal number of reproductive trees to ensure the regeneration of logged stands.
Keywords
: Outcrossing rate, Flowering rate, Logging, Tropical forest tree, FrenchGuiana
1. Introduction
Among the different biological traits of species, themating system is of major importance in thedetermination of within-population genetic variations,especially in long lived woody species. As shown in thesurvey of genetic diversity of forest trees by Hamrick etal. (1992), selfing species exhibit significantly lowergenetic diversity than do outcrossing species. Intropical rain forests, many tree species occur in lowdensity and are unevenly distributed (Hubbel andFoster, 1983, Condit et al., 2000). These demographictraits can contribute to increasing self-fertilization.
However, most tropical tree species possessmechanisms which encourage outcrossing (dioecy,monoecy, self-incompatibility) (Bawa and Krugman,1986; Bawa, 1992). Of the 37 tropical tree species inwhich the mating system has been studied, about 50%were strictly allogamous and only 12% had anoutcrossing rate lower than 0.80 (Murawski, 1995;Nason and Hamrick, 1997 for a review).
The outcrossing rate of mixed mating tropical treesis highly variable spatially and temporally at both thepopulation and the individual tree level (Hamrick andMurawski, 1990; Rocha and Lobo, 1998). Indeed, ithas been shown to vary according to the density of
03-Chap01.fm Page 149 Mardi, 3. août 2004 4:32 16
The genetic diversity of forest tree species in French Guiana
150
flowering trees (
Cavanillesia platanifolia,
Murawski etal.
,
1991, 1992;
Shorea siamensi
s, Ghazoul et al.,1998), the pollinator foraging behaviour (
Tabebuiaheterophylla,
Torregrossa et al., 1996;
Neobalanocarpusheimii,
Konuma
et al.,
2000), the impacts of humanactivities such as logging (
Shorea megistophylla,
Murawski et al., 1994;
Carapa procera,
Doligez andJoly, 1997) or landscape fragmentation (
Pinus merkusii,
Changtragoon and Finkerley, 1995;
Symphoniaglobulifera,
Aldrich et al., 1998;
Pterocarpusmacrocarpus,
Liengsiri et al., 1998). Furthermore,individual fertilities are generally unevenly distributedwithin tree populations: between male trees forcontribution to pollination (
Gleditsia triacanthos
,Schnabel and Hamrick, 1995;
Pithecellobium elegans,
Chase et al., 1996;
Cecropia obtusifolia,
Kaufman et al.,1998), as well as between female trees in reproductivesuccess, as illustrated by many experimental results(
Gleditsia triacanthos,
Schnabel et al., 1998;
Symphoniaglobulifera,
Aldrich et al., 1998). In addition, thenumber and the spatial distribution of flowering trees,the intensity of flowering, the degree of synchrony inthe flowering periods are factors which can modify theeffective pollen flow within populations. Finally, thefruiting success depends on the viability and thecompatibility of the received pollen, on the nutrientand water uptake of the trees and on the intensity ofpredation during the maturation period. All theseparameters are highly variable at both individual andpopulation levels (Sabatier, 1983; Sampson et al.,1990; Newstrom et al., 1991; Ter Steege and Persaud,1991; House, 1992 and 1993; Loubry, 1993 and1994; Ghazoul et al., 1998).
In French Guiana, data about the mating systems offorest trees are scarce (Doligez and Joly, 1997, Caronet al.
,
1998). This lack of information is a serious gapin understanding the biological causes which shapethe dynamics of genetic diversity. In addition,sufficient knowledge of the reproductive behaviour ofspecies is essential to develop any plan of sustainablemanagement. Since 1993, we have been studying themating system of six tree species in the Paracou naturalrainforest stands. These species belong to a panelchosen to represent a large range of life history traitswhich are known to influence the genetic diversity andthe mating system of trees (Hamrick et al., 1992). Inparallel to this study of the mating system,phenological observations were carried out to measureannual flowering variation, intensity of bloomingamong individuals, and synchrony of flowering
periods within the populations. We tried tounderstand how these factors may influence thereproduction and especially the outcrossing rates inthe different species. In some cases, we evaluated theimpact of logging on phenology and its consequenceson the mating system.
2. Material and methods
2.1. Species studied
The six species are canopy or subcanopy trees(Table 1). The spatial distribution of
Dicoryniaguianensis
(Caesalpiniaceae),
Vouacapoua americana
(Caesalpiniaceae) and
Eperua grandiflora
(Caesalpiniaceae) is clumped. The other three species,
Carapa procera
(Meliaceae)
,
Virola michelii
(Myristicaceae) and
Chrysophyllum sanguinolentum
(Sapotaceae), tend to be randomly or regularlydistributed, although
C. procera
can be aggregated inlowlands (Doligez and Joly, 1997; Forget et al., 1999;and see the results in Part IV, Chapter 1, Table 1).The local density of trees with a trunk diameter atbreast height (DBH) larger than 10 cm variedbetween 2.4 individuals per ha (
V. michelii
) to 8.4individuals per ha (
V. americana
) on the Paracouplots. According to the floral syndrome, the species arelikely to be pollinated by different kinds of insects.
C.sanguinolentum
could be additionally pollinated bybats.
V. michelii
is dioecious and the other five specieshave a bisexual breeding system.
2.2. Sampling
To determine the phenological status of trees, randomsamples of 50 to 500 individuals of each species wereexamined twice or three times during floweringperiods for several consecutive years over the entireplots of Paracou (see Part I for a general presentationof the plots).
To study the synchronism of flowering, wemonitored the development of flowers on all thepotential reproductive trees in
D. guianensis
(DBH
>
18 cm) and in
C. procera
(DBH
>
14 cm).These observations were made in plot 16, once ortwice a week during the reproductive period in 1995and 1996. The presence or absence of flowers wasassessed on each sampled tree using binoculars(8
×
40).
03-Chap01.fm Page 150 Mardi, 3. août 2004 4:32 16

Reproductive phenology and mating system of six tree species in Paracou stand
151
Tab
le 1
Life
his
tory
trai
ts o
f stu
died
spe
cies
in P
arac
ou s
tand
s: d
istr
ibut
ion
area
, loc
al d
ensi
ty in
Par
acou
(tr
ees/
ha),
hei
ght c
lass
(C
: can
opy
tree
; SC
: sub
can
opy
tree
), lo
cal s
pati
al d
istr
ibut
ion,
sex
ual s
yste
m, f
low
erin
g ph
enol
ogy,
pol
linat
ion
agen
ts, s
eed
disp
ersa
l mod
e
Spec
ies
Dist
ribu
tion
area
Den
sity
(DB
H
>
10 c
m)
Hei
ght
clas
sSp
atia
l di
strib
utio
nSe
xual
sy
stem
Flow
erin
g ph
enol
ogy
Polli
natio
n ag
ents
Seed
disp
ersa
l m
ode
Vou
acap
oua
amer
ican
a
Gui
ana
shie
ld8.
4C
Larg
e pa
tch
(
>
10 h
a)H
erm
aphr
odit
icIr
regu
lar
sync
hron
ous
Inse
cts
(?)
Rod
ents
<
30 m
Eper
ua g
rand
iflor
a
Gui
ana
shie
ld6.
2C
Patc
hH
erm
aphr
odit
icIr
regu
lar
sync
hron
ous
Inse
cts
(?)
Gra
vity
<
20 m
Dic
oryn
ia g
uian
ensis
Gui
ana
shie
ld6.
2C
Smal
l pat
ch
(0.5
ha)
Her
map
hrod
itic
Reg
ular
sy
nchr
onou
sIn
sect
sW
ind
<
50 m
Car
apa
proc
era
Afr
ica,
Am
azon
ia
Gui
ana
shie
ld6.
4SC
Ran
dom
Mon
oeci
ous
Reg
ular
sp
read
Inse
cts
Rod
ents
<
30 m
Chr
ysop
hyllu
m
sang
uino
lent
um
Gui
ana
shie
ld
Am
azon
ia3.
2SC
Ran
dom
Her
map
hrod
itic
Reg
ular
sp
read
Inse
cts,
bat
sM
onke
ys
>
50 m
Vir
ola
mic
helii
Gui
ana
shie
ld
Am
azon
ia2.
4C
Ran
dom
Dio
ecio
usR
egul
ar
spre
adIn
sect
s (?
)B
ats,
mon
keys
ki
nkaj
ou
>
50 m
03-Chap01.fm Page 151 Mardi, 3. août 2004 4:32 16

The genetic diversity of forest tree species in French Guiana
152
2.3. Evaluation of the mating system
The estimation of the outcrossing rate was based onthe comparison of multilocus arrays among adult treesand their offspring. Eighteen to 47 adult “trap” treeswere sampled throughout the Paracou plots for eachspecies. On each “trap” tree, 10 to 63 seeds collectedon the ground under the maternal tree were sown inthe greenhouse or laboratory. Three to nine isozymescoding for 3 to 10 gene loci were scored. Totalproteins were extracted from cotyledons on offsprings,and from fresh leaves for adult trees. Protocols forextraction were adapted from Liengsiri et al. (1990).Standard starch gel electrophoresis and stainingmethods were used to separate and identify allelicproducts (Zanetto et al., 1996).
Outcrossing and selfing rates were estimated at thepopulation and individual tree level using themultilocus mixed mating model (Ritland and Jain,1981; Ritland’s MLT software 1990). This model isbased on several assumptions: independent segregationof alleles at each marker locus, no allele selection ormutation between fertilization and progeny assay,homogeneity of pollen pool composition overmaternal trees, random mating for outcrosses. Despitemany biases to these assumptions in naturalpopulations, simulations have shown that the model isquite robust.
This maximum-likelihood method allowed calculationof the multilocus estimates of outcrossing rate
t
m
, themean of the monolocus outcrossing rate
t
s
, andestimates of pollen and ovule allele frequencies,
p
and
q
respectively.
3. Results
3.1. The studied species exhibit a high variability of flowering and fruiting behaviour for different years and individual trees
The mean population flowering and fruiting rates of5 out of 6 species varied widely over the years. Incontrast, the flowering rate in
C. procera
was of similarmagnitude in 1995 and 1996 (Fig. 1, 2).
The percentage of flowering trees and the diameterof the smallest flowering tree increased in the largestdiameter classes, particularly in low flowering years
such as 1996 and 2000 (Table 2). In addition, a clearrelationship between regularity of flowering anddiameter can be observed in the data sets (i.e
C. procera
,Fig. 3): the biggest trees flowered most often.
For all species, the minimal diameter of floweringtrees was smaller than the minimal diameter offruiting trees. The difference between flowering andfruiting diameter depends on species, from less than1 cm for
V. americana
to 7 cm for
V. michelii
. Theseobservations allowed a preliminary estimate of thedensity of potential reproductive trees in Paracou(Table 3).
In 1995, significant differences between floweringrate and fruiting rate were observed in every speciesexcept
V. americana
(Table 4).No relationship was found between the intensity of
flowering and tree diameter in
D. guianensis
in 1996
Fig. 1.
Yearly variation of flowering rate (%) of
D. guianensis,V. americana, V. michelii
and
C. procera
for a five year period.
Fig. 2.
Yearly variation of fruiting rate (%) of
D. guianensis,V. americana, E. grandiflora, V. michelii
and
C. sanguinolentum
for a five year period.
100
80
60
40
20
0D.g V.a V.m C.p
species
% fl
ower
ing
82
55
0 0
21
45
58
74
46
11
42
3329
59
6964
19931994199519961997
100
80
60
40
20
0D.g V.a V.m C.p
species
% fr
uiti
ng
82
55
0 0
21
45
58
74
46
11
42
3329
59
6964
19931994199519961997
03-Chap01.fm Page 152 Mardi, 3. août 2004 4:32 16

Reproductive phenology and mating system of six tree species in Paracou stand
153
and 2000 (unpublished data), but in
C. procera,
themost intense production of flowers was observedamong the largest trees in 1995 and 1996.
The flowering and fruiting rates did not show anyspatial pattern across the Paracou plots. There were nosignificant differences between silvicultural treatmentsdespite the variability of tree density (Table 5). Weonly observed that the smallest flowering trees grewunder the most open conditions.
Table 2
Flowering rate (%) according to diameter classes in
V. americana
and
D. guianensis
Year Flowering rate (%) Minimal DBH (cm) DBH
<
40 DBH
>
40
V. americana
1995 74 19.4 70 78.8
1996 5.3 40.6 0 10
D. guianensis40
<
DBH
<
60 DBH
>
60
1995 46 26.7 25 62 67
1996 16 33.7 7 25 25
1997 50 25 34 65 100
2000 28 31 15 52 73
Fig. 3.
Number of individual flowering events according todiameter classes in
C. procera
in 1995 and 1996 ((
n
): samplesize in the diameter class).
100
80
60
40
20
0
(51)
(45)(32)
(8)
0
1
2
10-20 20-30 30-40 >40
Diameter classes (cm)
Number of flowering events
Table 3
Minimal diameters of flowering and fruiting trees which were observed in Paracou
Minimum flowering DBH (cm)
Minimum fruiting DBH (cm)
Mean density of potential fruiting tree (tree/ha)
V. michelii
15.5 23.8 0.9
C. sanguinolentum
* 25 1.6
E. grandiflora
28 30.7 2.1
D. guianensis
18.3 22 3.9
C. procera
12.5 16.8
a
5.1
V. americana
19.4 20 6.2
a
after Doligez (1996).
03-Chap01.fm Page 153 Mardi, 3. août 2004 4:32 16

The genetic diversity of forest tree species in French Guiana
154
3.2. The within-population synchronyof flowering is very different in
D. guianensis
and
C. procera
The flowering behaviour of C. procera andD. guianensis trees was observed in detail, in plot 16(25 ha).
The floral phenology of C. procera was studiedduring 1995 and 1996. Two-thirds of those treeshaving a DBH > 14 cm bloomed. The floweringspread over a long period from September toFebruary, with two “peaks”: the first occurred inNovember, when the majority of trees bloomed. Thesecond occurred in January and was less pronounced.
During this period, some trees bloomed for the firsttime during the season and a few large trees bloomeda second time. The spikes lived during two to threeweeks, but on a given tree the different spikes bloomedat different times. Our observations showed that treesat the beginning (less than 5% of the observed trees inplot 16 flowered in September 1996) and at the end(February) of the reproduction period were few: thesetrees probably received pollen from only a fewconspecifics which bloomed at the same time.
The proportion of flowering trees increased withdiameter classes in C. procera: only 35 to 45% ofindividuals with a DBH < 20 cm bloomed in 1996and 1995, respectively. In contrast, almost 90% of
Table 4Flowering and fruiting rate (%) in Paracou in 1995
1995 D. guianensis V. americana V. michelii E. grandiflora C. procera
Flowering 46 (314) 74 (424) 28.6 (56) 83 (188) 69 (139)
Fruiting 33 (297) 71 (107) 8 (96) 23.2 (99) *
(n): sample size.
Table 5Flowering rate (%) according to increased logging intensity (T1 < T2 < T3) in 1995
Control plots All logged plots T1 T2 T3
D. guianensis
Density (DBH > 18 cm) (tree/ha) 5.5 3.9 3.9 2.7 5
Flowering 1995 34.9 (63) 44 (159) 35.3 (51) 54.5 (33) 45.3 (75)
V. americana
Density (DBH > 19 cm) 6 6.1 8.5 7.1 0.7
Flowering 1995 75.8 (78) 70.8 (274) 63.2 (125) 77.6 (147) *
E. grandiflora
Density (DBH > 28 cm) 5.4 2.4 2.4 2.4 2.4
Flowering 1995 85 (118) 73.2 (71) 65 (23) 89.6 (29) 57.9 (19)
(n): sampling size.
03-Chap01.fm Page 154 Mardi, 3. août 2004 4:32 16

Reproductive phenology and mating system of six tree species in Paracou stand
155
trees with a DBH < 30 cm bloomed, and all theindividuals with a DBH < 40 cm bloomed each year.
In 1996, the flowering rate of the D. guianensispopulation was low (26 out of 72 trees with a diametergreater than 30 cm). Only one flowering time wasobserved from the beginning of January until thebeginning of February; all trees but one bloomedsimultaneously; one tree produced flowers two weekslater. The intensity of flowering (number of flowersper tree) was variable between individuals and therewas no clear relationship between tree diameter andthe flowering rate.
3.3. All studied tree species are largely outcrossed
E. grandiflora, V. michelii and C. sanguinolentum werestrictly allogamous. Only V. americana had anoutcrossing rate estimation below 0.8 (tm = 0.63 in1993). For D. guianensis and C. procera, the meanpopulation selfing rate estimates were significantly
different from 0, and remarkably stable in 1993 and1995 despite different flowering rates (Table 6).
In C. procera, the difference between multilocus (tm)and single locus (ts ) estimations of the populationoutcrossing rate was significantly different from 0( p < 0.01) probably due to positive assortativematings (Doligez and Joly, 1997). Our fieldexamination of flowering periods in 1995 and 1996supported the hypothesis of a temporal structure dueto phenological groups in this species.
For the outcrossing species C. sanguinolentum(7 trees) and E. grandiflora (4 trees), all individualoutcrossing estimates were not significantly differentfrom 1. In contrast, for the mixed mating studiedspecies, individual outcrossing rates less than 1 werefound in one tree out of the five C. procera and in15 trees out of the 21 D. guianensis analyzed.However, no relationship was found between theoutcrossing rate and the density of neighbouringflowering trees (see Dutech, 1995; Caron et al., 1998).
Table 6Multilocus (tm) and monolocus (ts) population outcrossing rates of six tree species in Paracou
Species Year Nf Ns No loci Populationflowering rate
tm (S.E) ts (S.E)
D. guianensis 1993 37 680 4 82 0.83 (0.04) 0.79 (0.04)
D. guianensis 1995 32 729 4 55 0.83 (0.05) 0.84 (0.06)
D. guianensis1 2000 18 300 4 28.5 0.95 (0.04) 0.99 (0.06)
C. procera2 1993 47 483 10 * 0.78 (0.05) 0.69 (0.05)
C. procera3 1995 30 520 5 * 0.80 (0.03) 0.73 (0.03)
V. michelii 1994 21 343 4 32 0.93 (0.05) 0.93 (0.05)
C. sanguinolentum 1995 31 682 3 * 1.03 (0.05) 1.02 (0.05)
V. americana 1993 18 184 3 58 0.63 (0.09) 0.63 (0.11)
E. grandiflora 1995 18 272 3 83 1.11 (0.16) 1.14 (0.17)
Nf , Ns : number of open pollinated progenies and total number of analysed seedlings.1Latouche-Hallé unpublished data.2Doligez 1996.3Dutech 1995.
03-Chap01.fm Page 155 Mardi, 3. août 2004 4:32 16

The genetic diversity of forest tree species in French Guiana
156
Logging intensity did not seem to affect theoutcrossing rate of D. guianensis; in contrast, inC. procera, the outcrossing rate clearly decreased inlogged plots compared to unlogged plots (Table 7).
4. Discussion
4.1. An irregular flowering and fruiting schedule is a common trait of tropical tree species
Data recorded from the investigated species show largevariations of flowering and fruiting rates among years.For example, the percentage of flowering trees ofD. guianensis and V. americana was high in 1993 and1995 while it was nul or low in 1994 and 1996. Thiscould be the result of environmental effects: the highflowering rates observed can be linked to the severedrought that occurred during October and Novemberof the previous year. Reciprocally, the lack of dryseason was followed by the absence of flowering inD. guianensis and V. americana in 1994. However, in1995, the reduced rainfall observed from December toFebruary had a negative impact on fruiting of species,with a long period of fruit maturation in D. guianensis,V. michelii, E. grandiflora, but not in V. americana inwhich flowering and fruiting occurred in a very shortperiod in March and April.
4.2. Flowering and fruiting are subjected to size effects
In all observed species, the percentage of flowering andfruiting trees increases as a function of diameter class,especially in low flowering years. As a result, thecontribution to reproduction is uneven among trees,
as was already shown in Gleditsia triacanthos (Schnabeland Hamrick, 1995; Schnabel et al., 1998). Thedensity and the spatial distribution of the tallest treeswould be of capital importance for the reproductivesuccess of the population: too low a density of big treescan decrease the number of flowering trees andincrease mating among relatives. The increase of thesecrossings may induce the expression of recessive lethalalleles, resulting in a higher mortality and decreasingthe reproductive success in the overall population.
Furthermore, the consequences of the size effect onreproductive success may be more pronounced forspecies which exhibit asynchronous flowering, such asC. procera (Doligez and Joly, 1997) or for species suchas V. michelii, Cecropia obtisufolia (Alvarez-Buylla andGaray, 1994) or Brosimum alicastrum (Hamrick andMurawski, 1990), which are dioecious.
4.3. Tropical species exhibit low variations of their mating system
Among the six studied species, three were strictlyoutcrossing, whereas the remaining species exhibitedmixed mating. The life history traits of outcrossingspecies contributing to allogamy, are dioecy (V. michelii),synchrony of flowering times (V. americana, D. guianensis,E. grandiflora) and self-incompatibility mechanisms(D. guianensis, C. sanguinolentum and E. grandiflora).Outbreeding contributes to maintaining geneticdiversity in spite of low density of potentialreproductive trees and/or the aggregated spatialdistribution of trees in these species.
In C. procera and D. guianensis, which exhibited amixed mating system, we did not find a significantrelationship between the density of neighbouringflowering trees and the outcrossing rate, either at the
Table 7Outcrossing rate in logged and control plots in Paracou stand (1993)
D. guianensis C. procera*
Nf tm (e.t) Nf tm (e.t)
Logged plots 15 0.84 (0,07) 14 0.63 (0.08)
Unlogged plots 23 0.85 (0,04) 33 0.85 (0.05)
Nf : number of progenies.*: after Doligez and Joly (1997).
03-Chap01.fm Page 156 Mardi, 3. août 2004 4:32 16

Reproductive phenology and mating system of six tree species in Paracou stand
157
population level or at the individual level. The meanpopulation outcrossing rate seems to be stable in spiteof different flowering rates, in contrast withtheoretical models which predict that the outcrossingrate is equal to 0 or to 1 for panmictic populations(Charlesworth and Charlesworth, 1987). This couldbe explained on one hand by the structure of thepopulations: the C. procera population is divided intophenological groups, and in D. guianensis, trees arepatchily distributed and, on the other hand, by thegenetic load which induces early elimination of inbredprogenies (Caron, 2000).
4.4. Logging can induce a lower effective population size and disturbance in pollination mechanisms
The effective population size can decrease due to thedeath of reproductive trees during or afterexploitation, in addition to the extracted trees. Somespecies are more sensitive to the indirect effects oflogging, such as Sextonia rubra in the Paracou stand(Durrieu de Madron, 1994). Too low a number ofbig trees can prevent any reproductive event for a longtime, because the tallest trees are the maincontributors to regeneration. Furthermore, the spatialpattern of the remaining reproductive trees must alsobe taken into account to ensure the maintenance of aneffective population size. Big trees should bemaintained close enough to allow pollen exchanges.However, White et al. (2002) recently found that insome tropical angiosperm tree species, such asSwietenia humilis, increased pollen flow cancounteract the spatial isolation of reproductive trees.
The disturbance of the forest ecosystem can alter thephenological rhythms, the flowering rates, or thepollination biology of the species. The impact ofhabitat destruction should be variable according to thespecies ecological traits, as shown by the comparisonof C. procera and D. guianensis. In C. procera,silvicultural treatments affected the mating system, asshown by Doligez and Joly (1997). They hypothesizedthat opening of the canopy was unfavorable topollinator movements and reduced inter-treepollination efficiency and the outcrossing rate. Theseconsequences were not observed in D. guianensis,which seems to be adapted to low density.
In French Guiana today, the minimal logging treediameter is 55-60 cm. Considering our results, thismanagement rule seems to be correct, all the more so
because the logging intensity applied at Paracou washigher than standard procedures. However, theseresults must be considered with caution as the thephenomena observed at Paracou may not be fullyrepresentative of what happens in the entire forest-managed area.
5. ConclusionThis work has taught us two things. On one hand, weneed more discriminant tools in order to study morefinely the mechanisms of genetic diversity dynamicssuch as the mating system, pollen flow or seeddispersal, and to know the effective contributors to theregeneration cohorts. As a result, we are currentlydeveloping hypervariable genetic markers for severalspecies. On the other hand, the impact of logging onthe genetic diversity of tree species will have to beinvestigated elsewhere, in forests that had beenexploited on a larger spatial scale and over a longertime than on the Paracou stands.
AcknowledgementsThis study was partially supported by two projects of the European
Union (program INCO: TS3*CT94-0316, STD3 project) andtwo French grants: one from BRG (Bureau des RessourcesGénétiques) and the other from the French Ministry ofEnvironment (SOFT-project 1995). We would like to thankN. Frascaria and J.M. Favre for helpful comments on themanuscript.
ReferencesAldrich P.R., Hamrick J.L., Chavarriaga P., Kochert G., 1998.
Microsatellite analysis of demographic genetic structure infragmented populations of the tropical tree Symphoniaglobulifera. Mol. Ecol. 7, 933–944.
Alvarez-Buylla E.R., Garay A.A., 1994. Population geneticstructure of Cecropia obtusifolia, a tropical pioneer tree species.Evolution 48(2), 437–453.
Bawa KS, Krugman S., 1986. Reproductive biology and geneticsof tropical forest trees in Rain forest regeneration andmanagement. In: Hadley (Ed.), Biology International specialissue 18 (IUBS), 22–28.
Bawa K.S., 1992. Mating systems, genetic differentiation andspeciation in tropical rain forest plants. Biotropica 24(2), 250–255.
Caron H., Dutech C., Bandou E., 1998. Variations spatio-temporelles du régime de reproduction de Dicorynia guianensisAmshoff (Caesalpiniaceae) en forêt guyanaise. Genet. Sel. Evol.30, S153–S166.
Caron H., 2000. Organisation et dynamique de la diversitégénétique de cinq espèces arborées de la forêt Guyanaise. Thèsede l’Université Montpellier II, Sciences et Techniques duLanguedoc.
03-Chap01.fm Page 157 Mardi, 3. août 2004 4:32 16

The genetic diversity of forest tree species in French Guiana
158
Changtragoon S., Finkerley R., 1995. Patterns of geneticvariation and characterization of the mating system of Pinusmerkusii in Thaïland. For. Gen. 2(2), 87–97.
Charlesworth D., Charlesworth, B., 1987. Inbreeding depressionand its evolutionary consequences. Ann. Rev. Ecol. Syst. 18,237–268.
Chase M.R., Moller C., Kesseli R., Bawa K., 1996. Distant geneflow in tropical trees. Nature 383, 398–399.
Condit R., Asthon P.S., Baker P. et al., 2000. Spatial patterns inthe distribution of tropical tree species. Science (Washington)288 (5470), 1414–1418.
Doligez A., 1996. Évolution de la diversité génétiqueintrapopulation et de sa structure : étude d’un modèle desimulation spatialisé en vue de la gestion des ressourcesgénétiques forestières tropicales. Thèse de doctorat de l’InstitutNational Agronomique de Paris Grignon.
Doligez A., Joly H.I., 1997. Mating system of Carapa procera(Meliaceae) in the French Guiana tropical forest. Am.J. Bot. 84, 461–470.
Durrieu de Madron L., 1994. Mortalité des arbres en forêtprimaire de Guyane Française. Bois For. Trop. 239, 43–57.
Dutech C., 1995. Étude du système de reproduction de deuxespèces d’arbres en forêt tropicale guyanaise : Carapa procera etDicorynia guianensis. Mémoire de DEA « Biodiversité,génétique et évolution ». Université Paris VI.
Forget P.M., Mercier F., Collinet F., 1999. Spatial patterns of tworodent-dispersed rain forest trees Carapa procera (Meliaceae)and Vouacapoua americana (Caesalpiniaceae) at Paracou FrenchGuiana. J. Trop. Ecol. 15, 301–313.
Ghazoul J., Liston K.A., Boyles T.J.B., 1998. Disturbance-induced density-dependent seed set in Shorea siamensis(Dipterocarpaceae), a tropical forest tree. J. Ecol. 86, 462–473.
Hamrick J.L., Godt M.J., Sherman-Broyles S.L., 1992. Factorsinfluencing levels of genetic diversity in woody plant species.New Forests 6, 95–124.
Hamrick J.L., Murawski D.A., 1990. The breeding structure oftropical tree populations. Plant Species Biol. 5, 157–165.
House S.M., 1992. Population density and fruit set in threedioecious tree species in Australian tropical rain forest. J. Ecol.80, 57–69.
House S.M., 1993. Pollination success in a population ofdioecious rain forest trees. Oecologia 96, 555–561.
Hubbel S.P., Foster R.B., 1983. Diversity of canopy trees in aneotropical forest and implications for conservation. In: SuttonS.L., Whitmore T.C., Chadwick A.C. (Eds). Tropical RainForest: Ecology and Management. Blackwell ScientificPublications, 25–41.
Kaufman S.R., Smouse PE., Alvarez-Buylla E.R., 1998. Pollen-mediated gene flow and differential male reproductive successin a tropical pioneer tree, Cecropia obtusifolia Bertol.(Moraceae): a paternity analysis. Heredity 81, 164–173.
Konuma A., Tsumura Y., Lee C.T., Lee S.L., Okuda T., 2000.Estimation of gene flow in the tropical – rainforest treeNeobalanocarpus heimii (Dipterocarpaceae), inferred frompaternity analysis. Mol. Ecol. 9, 1843–1852.
Liengsiri C., Piewluang C., Boyle T.J.B., 1990. Starch GelElectrophoresis of Tropical Trees. ASEAN–Canada Forest TreeSeed Centre, Saraburi.
Liengsiri C., Boyle T.J.B., Yeh F.C., 1998. Mating system inPterocarpus macrocarpus Kurz in Thailand. Journal of Heredity89, 216–221.
Loubry D., 1993. Les paradoxes de l’angélique (Dycoryniaguianensis Amshoff ) : dissémination et parasitisme des grainesavant dispersion chez un arbre anémochore de forêt guyanaise.Rev. Écol. (Terre et Vie) 48 : 353–363.
Loubry D., 1994. Déterminisme du comportement phénologiquedes arbres en forêt tropicale humide de Guyane française(5° lat. N.). Thèse de doctorat, Université Paris VI.
Murawski D.A., 1995. Reproductive biology and genetics oftropical trees from a canopy perspective. In: Loman M. andNadkarni N. (Eds.), Forest canopies. Academic Press, New-York, pp. 457-492.
Murawski D.A., Gunatilleke I.A.U., Bawa K., 1994. The effectsof selective logging on inbreeding in Shorea megistophylla(Dipterocarpaceae) from Sri Lanka. Conservation Biology 8,997–1002.
Murawski D.A., Hamrick J.L., 1991. The effect of the density offlowering individuals on the mating systems of nine tropicaltree species. Heredity 67, 167–174.
Murawski D.A., Hamrick J.L., 1992. The mating system ofCavanillesia platanifolia under extremes of flowering treedensity : a test of predictions. Biotropica 24, 99–101.
Nason J.D., Hamrick J.L., 1997. Reproductive and geneticconsequences of forest fragmentation: two case studies ofneotropical canopy trees. Journal of Heredity 88, 264–276.
Newstrom L.E., Frankie G.W., Baker G., 1991. Survey of longterm flowering patterns in lowland tropical rain forest trees atLa Silva. Costa Rica. In: Edelin C. (Ed.) « L’arbre, Biologie etDéveloppement » Naturalia Monspeliensia. France, pp. 345–366.
Ritland K., 1990. A series of FORTRAN computer programs forestimating plant mating system. Journal of Heredity 81, 235–237.
Ritland K., Jain S.K., 1981. A model for the estimation ofoutcrossing rate and gene frequencies based on n independentloci. Heredity 47, 37–54.
Rocha O.J., Lobo J.A., 1998. Genetic diversity and outcrossingrates in the guanacaste tree (Enterolobium cyclocarpum Jacq.) inthe dry forests of Costa Rica. Recent advances in biotechnologyfor tree conservation and management. Proceedings of an IFSworkshop, Floranopolis, Brazil, 15–19 september 1997. IFSStockholm, Sweden, 65–81.
Sampson J.F., Hopper S.D., James S.H., 1990. Temporalvariation in allele frequencies in the pollen pool of Eucalyptusrhodantha. Heredity 65, 189–199.
Sabatier D., 1983. Fructification et dissémination en forêtguyanaise. L’exemple de quelques espèces ligneuses. Thèse dedoctorat, Université STL, Montpellier.
Schnabel A., Hamrick J.L., 1995. Understanding the populationgenetic structure of Gleditsia triacanthos L.: The scale andpattern of pollen gene flow. Evolution 49, 921–931.
Schnabel A., Nason J.D., Hamrick J.L., 1998. Understanding thepopulation genetic structure of Gleditsia triacanthos L.: seeddispersal and variation in female reproductive success. Mol.Ecol. 7, 819–832.
03-Chap01.fm Page 158 Mardi, 3. août 2004 4:32 16

Reproductive phenology and mating system of six tree species in Paracou stand
159
Ter Steege H., Persaud C.A., 1991. The phenology of Guyanesetimber species: a compilation of a century of observations.Vegetatio 95, 177–198.
Torregrossa J.P., Labbé P., Flereau C., Cousin M., Bonnier S.,1996. Données sur la biologie florale et la pollinisation deTabebuia heterophylla (Bignoniaceae), « poirier pays » de laGuadeloupe. INRA. internal report.
White G.M., Boshier D.H., Powell W., 2002. Increased pollenflow counteracts fragmentation in a tropical dry forest: anexample from Swietenia humilis Zuccarini. Proc. Natl. Acad.Sci. USA 99(4), 2038–2042.
Zanetto A., Kremer A., Müller-Starck G., Hattemer H.H., 1996.Inheritance of isozymes in pedunculate oak (Quercus robur L.).Journal of Heredity 87, 364–370.
03-Chap01.fm Page 159 Mardi, 3. août 2004 4:32 16

Ecology and Management of a Neotropical Rainforest
© 2004 Elsevier SAS. All rights reserved
160
Chapter 2
Multilocus assessment of levels of genetic diversity in tropical trees in Paracou stands
Henri Caron, Eric Bandou, Antoine Kremer
Abstract
– The level of the within-population genetic diversity was assessed usingdominant genetic markers for 10 tropical tree species in the Paracou plots in FrenchGuiana. Simulations were conducted on experimental data sets in order to estimatethe phenotypic and the genetic diversity, their associated sampling variance andoptimal sample sizes. There was a wide range of variation of the level of geneticdiversity between the species and pairwise differences were significant, using eitherRAPDs or AFLPs markers. Among the life history traits considered, the size of thedistribution area was clearly an indication of the level of diversity: species with largedistributions exhibited higher levels of diversity than did endemic species. Amongthe biological characteristics of species, the distribution area was the only obviousfactor which discriminated groups of species at the local scale. Additional biologicaland demographic data have to be assessed in order to identify the determinants ofgenetic diversity and its dynamics.
Keywords: Dominant markers, Sample size, Sampling variance, RAPDs, AFLPs,Rainforest, French Guiana
1. Introduction
The level and the distribution of genetic diversity innatural plant populations have been recognized asprerequisite information for conservation strategiesand sustainable management of forests (Namkoong etal., 1996). Surveys of genetic diversity have beenconducted in numerous temperate species, and similarefforts are currently ongoing for tropical trees (Boyle,1996).
Hamrick et al. (1992) demonstrated the significantrelationship which exists between genetic diversity andthe ecological characteristics of woody plant species:woody species with large geographic ranges, that areout-crossing and that disperse their seeds by wind,
harbor more genetic diversity within populations thando species with other combinations of traits. Similarconclusions were obtained for tropical species byLoveless (1992). However, tropical tree species exhibita wider range of diversity in life history traits, habitats,demographic structures and spatial distributions thatmay result in different patterns of genetic diversity.
During the last decade, there has been an increasinginterest in the study of population genetics of tropicaltrees. Surveys of genetic diversity were conducted indifferent parts of the tropics (Forgen news, 1997).Investigations were also extended to the study ofgenetic processes which shape diversity such as asmating system (Lee et al., 2000) and gene flow (Chaseet al., 1996; Konuma et al., 2000). Finally, there have
03-Chap02.fm Page 160 Mardi, 3. août 2004 2:51 14

Multilocus assessment of levels of genetic diversity in tropical trees in Paracou stands
161
also been attempts to evaluate human interference suchas logging (Gillies et al., 1999; Lowe et al., 2002;Murawski et al., 1994) or fragmentation (Aldrich et al.,1998; Cardoso et al., 1998; Collevatti et al., 2001;White et al., 2002) on the level and structure of geneticdiversity. Unfortunately, the methodologies (samplingdesign, tools and data analysis) were often toodiscordant to allow easy comparisons of within-population diversity.
Nevertheless, some general trends stand out.The tree species which exhibit the lowest diversity
levels have narrow or fragmented distribution areasand/or are subjected to overcollecting (
Prunus africana
,Dawson and Powell, 1999;
Tabebuia heterophylla
,Roux, 1999;
Pinus merkusii
, Changtragoon andFinkerley, 1995) or to domestication (
Calliandracalothyrsus
, Chamberlain, 1998) as opposed to otherspecies, such as
Pentaclethra macroloba
(Hall et al.,1994), which is widespread from Nicaragua toAmazon basin and still locally abundant.
The species with the highest level of diversity arewidespread (
Dryobalanops aromatica
, Lee et al., 2000;
Caryocar brasilense
, Collevatti et al., 2001;
Caesalpiniaechinata
, Cardoso et al., 1998
and
Eugenia uniflora
,Margis et al., 2002), and are preferentially out-crossed.However, there is no consistent trend betweendiversity and pollination or seed dispersal modes. Forinstance,
D. aromatica
is pollinated by honey bees,which are known to forage over long distances and thespecies exhibits a high diversity; however
C. brasiliense
,which is pollinated by small bats that forage withinrestricted areas, also exhibits a high level of diversity.Other examples of species with contrasted dispersiondistances and similar levels of diversity are
E. uniflora
or
C. echinata
. In contrast to previous results (Loveless,1992), recent data indicate that species with highpopulation densities (
D. aromatica
) or patchydistribution (
C. brasiliense
,
C. echinata
and
E. uniflora
)may harbor high levels of diversity.
The initial hypothesis of the genetic project ofINRA and CIRAD was that in complex tropicalecosystems, a large range of diversity levels among treespecies was expected in regard to the high variabilityof life history traits. Thus, the aim of the survey ofgenetic diversity in Paracou was to identify keybiological or demographic attributes responsible forinter-specific differences in genetic diversity. A set of15 species, representing as much as possible thediversity of breeding systems, of dispersal mechanismsand of distribution patterns, was sampled in the
Paracou stands to identify the relationship betweenlife history traits and genetic diversity.
The levels of genetic diversity have been monitored,using dominant markers, on these 15 species. The treespecies that are present in the Paracou stands exhibit alarge variation in their distribution range, fromwidespread species such as
Symphonia globulifera
and
Carapa procera
, which are distributed in tropicalAfrica and in tropical Americana, to endemic species,
Dicorynia guianensis
,
Moronobea coccinea
and
Vouacapoua americana
, which are restricted to theGuyana shield. More than half of the studied speciesare obligate out-breeders (Caron, 2000). Some speciesare locally randomly distributed
(Virola michelii
and
Sextonia rubra)
or show clear aggregation in clusters(
Cecropia sciadophylla
,
V. americana
and
D. guianensis
)(see Part IV, Chapter 1). The seed dispersal distancescan vary from a few meters (
Eperua grandiflora
,Forget, 1992) to several hundred meters(
Chrysophyllum sp
, Julliot, 1997).We chose to monitor diversity with multilocus
molecular techniques such as RAPDs (Williams et al.,1990) and AFLPs (Vos et al., 1995). RAPDs markershave been widely used to study patterns of geneticdiversity in plant species (see Nybom and Bartish,2000, for a review). AFLPs have been more recentlyused to analyze the genetic structure of populations oftropical trees (Cardoso et al., 2000; Lowe et al., 2002;Muluvi et al., 1999; Russel et al., 1999). Bothtechniques have the advantage of assessing thediversity at the whole genome level, and can beimplemented on any species without additionalsequence information, but they suffer from a majordrawback: they behave generally as dominant markers,which hampers the distinction of dominanthomozygotes from heterozygotes. Hence wedeveloped a technique inspired by Lynch and Milligan(1994) that allows to estimate the genetic diversitybased on allelic frequencies instead of restricting theanalysis of the phenotypic diversity based solely on thefrequencies of bands.
The aims of the present work are to:(i) compare the phenotypic
and genetic diversity foreach species and to compare the results among species;
(ii) compare the level of diversity for each species,obtained with the two different marker techniques,RAPDs and AFLPs. There is no backgroundinformation on the genomic regions that are sampledby the two marker techniques. Our objective is
03-Chap02.fm Page 161 Mardi, 3. août 2004 2:51 14

The genetic diversity of forest tree species in French Guiana
162
therefore to test whether the two methods rank thespecies for their diversity in a similar way;
(iii) investigate whether the levels of within-population diversity were related to life history andecological characteristics of tree species.
2. Materials and methods
2.1. Tree species
A long-term genetic project on the description andevolution of genetic diversity has been undertaken on15 so-called “model-species”. The species wereselected according to several life history traits(distribution, flowering phenology and dispersion),and demographic attributes (spatial distribution anddensities). The species were sampled within the rangeof variation of these traits and attributes. We reporthere on the results that have been obtained so far on aset of 10 species (see Table 1 and Chapter 1, Part III).
2.2. Sampling
In the absence of any information on the spatialdistribution of the genetic diversity, trees weresampled within each of the four subgroups of plots(T
0
, T
1
, T
2
and T
3
, see Part I for the description of theParacou stands) according to the density of the species.Depending on the species and its density, a subset ofeach population was collected. The sample size variedfrom 36 to 91 individuals. For all species but
S. rubra
,adult trees were sampled. As it was impossible toextract DNA from adult tissues in
S. rubra
, collectionswere made on seedlings growing next to adult trees.
2.3. Molecular analysis
DNA was extracted from cambial tissue, except for
C. procera
and
S. rubra
for which leaves were used.The procedure of cambium collection is described inDegen et al. (2001). Extraction methods were appliedfollowing a modified CTAB procedure (Doyle andDoyle, 1987).
Amplification, migration and staining protocols forRAPDs are described in Bodénès et al. (1997).Amplification reactions were carried out using 6–14 primers per species, from Operon technologies. Apreliminary survey permitted to select primers whichgave reproducible and informative marker patterns (fordetails, see Degen et al., 2001).
AFLP markers were obtained following the protocolof Vos et al. (1995). Total genomic DNA was digestedwith the restriction enzymes
EcoRI
and
MseI
. A selectivepre-amplification was carried out using a
EcoRI
primerwithout additional nucleotide and a
MseI
primercarrying two selective nucleotides. Final selective PCRreactions used
EcoRI
primers with two nucleotides and
MseI
primers with four nucleotides (Table 2).
2.4. Data analysis
RAPD and AFLP fragments were scored as presence(1) or absence of a band (0), and a matrix ofphenotypes was assembled. The level of diversitywithin a population can therefore be estimated at twodifferent levels:
1. The phenotypic level. For a given RAPD or AFLPfragment (locus), the phenotypic diversity (
H
p
) is theprobability that two trees (phenotypes) taken atrandom within the population are different.
2. The genetic level. For a given RAPD or AFLPfragment, the genetic diversity (
H
g
) is the probabilitythat two alleles controlling the expression of a bandand taken at random within the population aredifferent.
Let
P
and
Q
be the frequency of the presence and theabsence of the fragment in a population, then thephenotypic diversity is:
Similarly the genetic diversity can be written as:
where
p
and
q
are the frequencies of the allelesresponsible for the presence or the absence of theRAPD or AFLP fragment.
The genetic diversity
H
g
can be calculated fromobserved frequencies
P
and
Q
as shown in Mariette etal. (2002):
where
F
is the fixation index in the population. Thedifference between
H
g
and
H
p
can be inferred from theprevious equations (Caron, 2000):
Hp 1 p2 Q2––=
Hg 1 p2 q2––=
Hg1–
1 F–( )----------------- F F 2 4 1 F–( )Q+–( )=
1 12 1 F–( )--------------------+ F F 2 4 1 F–( )Q+–( )
Hg Hp–1–
1 F–( )----------------- F F 2 4 1 F–( )Q+–( )=
1 12 1 F–( )--------------------+ F F 2 4 1 F–( )Q+–( ) 2Q 1 Q–( )–
03-Chap02.fm Page 162 Mardi, 3. août 2004 2:51 14

Multilocus assessment of levels of genetic diversity in tropical trees in Paracou stands
163
Tab
le 1
Eco
logi
cal c
hara
cter
isti
cs o
f the
spe
cies
stu
died
at P
arac
ou
Spec
ies
Fam
ilies
Dist
ribu
tion
area
Spat
ial
distr
ibut
ion
Flor
al
phen
olog
yPo
llina
tion
agen
tsSe
ed d
isper
sion
agen
ts
Eper
uagr
andi
flora
Cae
salp
inia
ceae
Gui
ana
shie
ldSm
all c
lum
pIr
regu
lar
sync
hron
yIn
sect
sG
ravi
ty
<
30 m
Vou
acap
oua
amer
ican
a
Cae
salp
inia
ceae
Gui
ana
shie
ldB
ig c
lum
pIr
regu
lar
sync
hron
yIn
sect
sR
oden
ts
<
30 m
Dic
oryn
iagu
iane
nsis
Cae
salp
inia
ceae
Gui
ana
shie
ldSm
all c
lum
pR
egul
arsy
nchr
ony
Inse
cts
Win
d
<
50 m
Chr
isoph
yllu
msa
ngui
nole
ntum
Sapo
tace
aeG
uian
a sh
ield
Clu
mp
Reg
ular
spre
adIn
sect
sM
onke
ys
>
50 m
Car
apa
proc
era
Mel
iace
aeA
fric
a; A
maz
onia
Clu
mp
Reg
ular
spre
adIn
sect
sR
oden
ts
<
30 m
Vir
ola
mic
helii
Myr
isti
cace
aeG
uian
a sh
ield
Dis
pers
edR
egul
arsp
read
Inse
cts
Bir
ds, k
inka
jou
>
50 m
Sext
onia
rubr
aLa
urac
eae
Gui
ana
shie
ldD
ispe
rsed
Irre
gula
rsy
nchr
ony
Inse
cts
Gra
vity
<50
m
Sym
phon
iagl
obul
ifera
Clu
siac
eae
Afr
ica;
Mes
o-A
mér
ica
Am
azon
iaC
lum
pR
egul
arsp
read
Hum
min
gbir
dspe
rchi
ng b
irds
Gra
vity
+ r
oden
ts>3
0 m
Mor
onob
eaco
ccin
eaC
lusi
acea
eG
uian
a sh
ield
Dis
pers
edR
egul
arH
umm
ingb
irds
Gra
vity
+ r
oden
ts<5
0 m
Cec
ropi
a sc
iado
phyl
laM
orac
eae
Am
azon
iaC
lum
pC
onti
nuou
sW
ind
Bat
s>5
0 m
03-Chap02.fm Page 163 Mardi, 3. août 2004 2:51 14

The genetic diversity of forest tree species in French Guiana
164
For the estimation of Hg and its sampling variance,we considered the formulae of the expected valueand variance of a function of several variates(Kendall and Stuart, 1977). In doing so, weconsidered that Hg depended on only one variate Q,and consequently that the value of F was known foreach species, and constant among the differentloci. For 7 out of the 10 investigated species, F couldbe estimated from codominant markers (eitherisozymes or microsatellites). In our study, F valueswere available for all species except M. coccinea,S. rubra and C. sciadophylla. We assumed that theestimated value was the true value.
For L loci, the estimator over all loci is:
As Lynch and Milligan (1994) showed that the biasintroduced in the estimation of q due to a small samplesize was substantial when the null allele was rare, wecalculated the genetic diversity restricted to the subsetof fragments that showed an observed frequencysmaller than (1–(3/N)), where N is the populationsample size. Any fragment that exhibited a higherfrequency than (1–(3/N)) in a species was removedfrom the whole data set. Hg2 is the genetic diversitycomputed on this subset of fragments.
The two molecular techniques (RAPD and AFLP)allow to randomly sample markers throughout thegenome. A number of markers (DNA fragments) aredetected in the genome and amplified by PCR if the
recognition site of the primers used in each techniquecorresponds to the template DNA. Polymorphism isscored at each fragment and a mean estimate iscalculated over all fragments. Since the markers arerandomly selected within the genome, the meanestimate is expected to provide an unbiased estimate atthe whole genome level, regardless of the fragmentsthat were amplified in each species.
However, comparisons of levels of diversity betweenspecies require to estimate the sampling varianceincluding the sampling within the genome. Thesampling variances of the phenotypic and geneticdiversity (Hg and Hg2) were estimated usingresampling methods. Since comparisons amongspecies are made, the sampling variances werecalculated so that they comprise the two samplingprocesses: sampling of loci within the genome andsampling of trees within the population, respectivelyinter- and intra-locus variance (Vinter and Vintra, Neiand Roychoudhury, 1974). The two variances wereestimated by resampling methods: Vinter was estimatedby bootstrapping over loci and Vintra by bootstrappingover individuals.
As a result the total sampling variance V is:
V = Vinter + Vintra
Comparisons of Hp and Hg among species weremade using the Z-test (Zhang and Allard, 1986). Theestimates of the phenotypic, genetic diversities andtheir associated sampling variances were computedwith a home-made software package (Haploid,Hapdom, Boot; Kremer and Labbé, unpublished).
Table 2Additional nucleotides used in the primer-enzyme combinations (EcoRI+2, MseI+4)
V. michelii V. americana E. grandiflora D. guianensis C. sanguinolentum
CG/ACAACG/TACCCG/ACAGGC/TACCGC/ACAAGT/ACAA
AC/ACACAC/ ACAGAC/ACATAC/ACAACC/ACAGCC/ACAACC/ACACCC/ACAT
GC/ACACAC/TACCCC/ACAGCC/TACCGT/ACAGGT/TACCCG/TGTC
AC/ACACAC/ACAGAC/ACATAC/ACAACC/ACAGCC/ACAACC/ACACCC/ACAT
TG/CGGACG/CTTATG/CTTGCT/CGGACG/GCGTGT/CGGAAC/CGGAGC/CGGA
H 1 L⁄( ) Hgii 1=
L
∑=
03-Chap02.fm Page 164 Mardi, 3. août 2004 2:51 14

Multilocus assessment of levels of genetic diversity in tropical trees in Paracou stands
165
3. Results
3.1. Phenotypic vs. genetic diversity
We analyzed graphically the equation giving thedifference (Hg–Hp), according to the value of frequencyQ and the fixation index F (Fig. 1). We considered Franging between –0.30 and +0.30, encompassingvalues usually observed in forest trees. Two majorconclusions can be drawn from Fig. 1.
● The genotypic diversity is equal to the phenotypicdiversity in a limited number of situations, when Qvaries between 0.35 and 0.45. Therefore, estimates ofHg are recommended rather than Hp. The differenceis inflated when the fixation index (F) decreases.
● The estimation of Hg is only slightly affected by F,except when Q is lower than 0.20. As a result, assumingthat all loci have the same value, F does not introducean important bias in the estimation of Hg.
3.2. The components of the sampling varianceUsing the experimental data sets, the two componentsof the variance were estimated (Fig. 2). There are
Fig. 1. Variation of the difference (Hg–Hp) as a functionof frequency of the recessive homozygote (Q) value.
0,4
0,3
0,2
0,1
0
–0,1
–0,2
0,05
0,15
0,25
0,35 0,4 0,5 0,6 0,7
50,8
50,9
50,30,2
Q
(Hg–
Hp)
–0,300,3
F
Fig. 2. Total, inter- and intra-locus variances of Hp and Hg, using RAPDs and AFLPs (Virola michelii, Moronobea coccinea,Cecropia sciadophylla, Dicorynia guianensis, Sextonia rubra, Eperua grandiflora, Chrisophyllum sanguinolentum, Vouacapouaamericana, Symphonia globulifera and Carapa procera).
800700600500400300200100
0
250
200
150
100
50
0
250
200
150
100
50
0
900
800
700
600
500
400
300
200
100
0
V.m Mc C.sc D.g Sr E.g C.s V.a Sg Cp
Va Dg Cp Vm Eg Cs Sg
Vm Eg Dg Ca Va
Vm Eg Dg Ca Va
phenotypic diversity Hpphenotypic diversity Hp
RAPD AFLP
genetic diversity Hg
genetic diversity Hg
totalinter-locusintra-locus
totalinter-locusintra-locus total
inter-locusintra-locus
totalinter-locusintra-locus
vari
ance
(×
10-6
)va
rian
ce (
× 10
-6)
vari
ance
(×
10-6
)
vari
ance
(×
10-6
)
speciesspecies
species species
03-Chap02.fm Page 165 Mardi, 3. août 2004 2:51 14

The genetic diversity of forest tree species in French Guiana
166
important differences of the total sampling varianceamong the species, as a result of the different samplingefforts that were attributed to each species. The highestintra-locus variance is for C. sciadophylla, which has alsothe lowest sample size. Interestingly, the inter-locussampling variance is the major component of the totalsampling variance in all species (except C. sciadophylla),and exceeds in some cases up to 10 times the withinlocus sampling variance. The same pattern of thesampling variance was obtained when AFLP markerswere used. As for RAPDs, the inter-locus variance ismuch higher than the intra-locus variance. However,the total variance is lower for AFLPs than for RAPDs.
We empirically tested the impact of the sample size(number of loci and number of trees) by resamplingdifferent numbers of trees and loci and computing thecoefficient of variation of the phenotypic diversity (Fig. 3).
In the RAPD data set, the coefficient of variation ofphenotypic diversity estimates decreased rapidly whenthe number of sampled trees decreased between 10 and40 and became stabilized beyond 50. The curveconstantly decreased when the number of locidecreased from 15 to 60 loci. In the same way, in theAFLP data set, the stabilization occurred beyond30 individuals and 150 loci (Fig. 3a,b). Similarobservations were made when the coefficient of geneticdiversity estimates varied as a function of the numberof trees and of the number of loci (results unshown).
3.3. Comparison of the levels of diversity among the 10 speciesThe estimates of phenotypic diversity using RAPDsexhibited a broad range of variation, ranging fromHp = 0.17 (V. americana) to Hp = 0.39 (S. globulifera)Fig. 4). Pairwise comparisons of phenotypic diversity
Fig. 3. Coefficient of variation as a function of number of samples (a) and of loci (b) in 5 species, with AFLP markers.
Fig. 4. (a) Comparison of the level of within-population phenotypic diversity of 10 species (Symphonia globulifera, Carapaprocera, Cecropia sciadophylla, Chrisophyllum sanguinolentum, Virola michelii, Sextonia rubra, Eperua grandiflora, Dicoryniaguianensis, Moronobea coccinea, Vouacapoua americana) in Paracou stand. (b) Comparison of the level of within-populationgenetic diversity of seven species (Symphonia globulifera, Virola michelii, Chrisophyllum sanguinolentum, Carapa procera,Eperua grandiflora, Dicorynia guianensis, Vouacapoua americana).
14
12
10
8
6
4
2
0
50
40
30
20
10
00 100 200 300 400 5000 10 20 30 40 50 60
coef
. var
iati
on (
%)
coef
. var
iati
on (
%)
No of lociNo of samples
Vm
Os
Eg
Dg
Va
Vm
Os
Eg
Dg
Va
(a) (b)
0,5
0,45
0,4
0,35
0,3
0,25
0,2
0,15
0,1
0,05
0
RAPD
AFLP
Sg Vm Cs Cp Eg Dg Va
Hg
Hg
0,5
0,45
0,4
0,35
0,3
0,25
0,2
0,15
0,1
0,05
0Sg Cp Cs
Vm SrEg
Dg
Mc Va
C.sc
RAPD's
AFLP's(a) (b)
03-Chap02.fm Page 166 Mardi, 3. août 2004 2:51 14

Multilocus assessment of levels of genetic diversity in tropical trees in Paracou stands
167
were calculated using the Z-test. The 10 species couldbe clustered in five groups showing significantdifferences among them (Table 3).
For seven species, we could estimate the fixationIndex (F), because codominant data were available(either microsatellites or isozymes). Consequently wecomputed for these species their genetic diversity. Forall species but C. procera, the genetic diversity wasequal or higher than the phenotypic diversity, aspredicted by the theoretical calculations (Table 3).
In addition, for these species we also calculated thegenetic diversity (Hg2) on the subset of fragmentsthat showed an observed frequency smaller than(1–(3/N )), where N is the population sample size, asrecommended by Lynch and Milligan (1994).
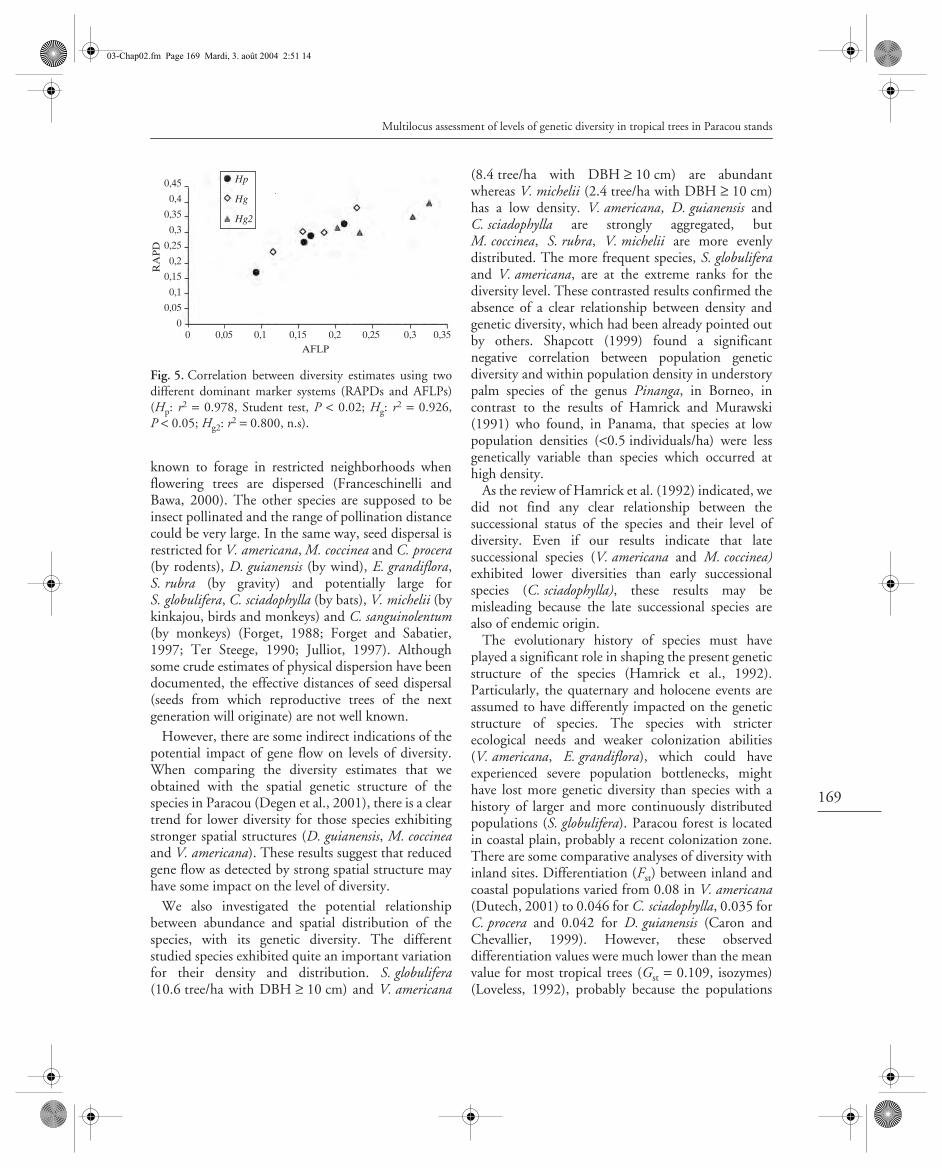
The coefficient of correlation was significant betweenHp and Hg estimates (r2 = 0.75, Student test: P < 0.02),and between Hg and Hg2 (r2 = 0.86, P < 0.001).
3.4. Comparison of AFLP and RAPD
In general the estimates of the diversity computedwith AFLP markers were lower than for RAPDmarkers, and this observation also holds for theirassociate sampling variance: the variance for AFLPswas lower than for RAPDs. However, despite thedifferences of diversity in absolute values, the twomarker systems rank the species in the same orderexcept for Chrisophyllum sanguinolentum (Table 3).This is also shown by the correlation between themeasures of diversity (either phenotypic or genetic)computed between the two marker systems (Fig. 5).
4. Discussion
4.1. Measuring diversity to compare species
Our investigations have shown that multilocus markerscan be used for comparing diversity levels across species,provided that adequate guidelines are used. First of all,a sufficient number of loci (markers) are needed. Ourempirical comparisons have shown that at least 150 lociare needed, whereas 30 individuals are sampled. Thesedifferences in sampling efforts between individuals andloci were predicted earlier by theoretical studies (Nei,1987). They were confirmed here by the differences inintra- and inter-locus sampling variances. Whatever thespecies studied, the inter-locus variance was alwayshigher than the intra-locus variance.
With a few exceptions, the two marker systems(RAPD and AFLP) ranked the two species in the sameorder. However, the diversity estimated with RAPDmarkers was always higher than for AFLP markers.The difference may be due to higher mutation rates inregions amplified by RAPDs primers; it can also resultfrom a poorer reproducibility of RAPD markers. Thesampling variance for RAPD markers is also higherthan for AFLP markers; therefore the former markersystem is less powerful for statistical comparisonsbetween species.
4.2. Genetic diversity and life history traits
As found in earlier allozyme-based studies (Loveless,1992), a closed relationship occurred in our data setbetween the geographic range and the level ofwithin population diversity. Widespread speciessuch as S. globulifera and C. procera, which have atranscontinental distribution spreading from Africa toAmerica, have a higher diversity level than do endemicspecies such as D. guianensis, M. coccinea andV. americana, which are restricted to the Guiananshield. Species exhibiting intermediate levels of diversity(V. michelii, C. sanguinolentum, C. sciadophylla) haverather large regional distribution areas. In a recentmeta analysis of diversity calculated with multilocusdominant markers, Nybom and Bartish (2001) foundno association at all between geographic range andwithin population diversity.
In contrast to the results of Hamrick et al. (1992)and of Nybom and Bartish (2001), the matingsystem was not an obvious correlate of the within-population diversity: the lowest out-crossing rateestimates (tm = 0.6) were found for S. globulifera andfor V. americana, whereas species of the intermediategroup, C. sciadophylla, C. sanguinolentum, V. michelii,S. rubra and E. grandiflora are obligated out-crossingspecies (Caron, 2000). However, this data must beinterpreted cautiously because the genetic diversity isshaped by long-term mechanisms whereas out-crossing estimates are usually observed within singleyears and usually exhibit high between-year variations.
The impact of gene flow and dispersal mechanismson diversity is less clear and requires moreinvestigations. Information about pollination distanceis scarce and imprecise for the studied species.S. globulifera and M. coccinea are pollinated by birds(Bittrich and Amaral, 1996; Gill et al., 1998). Theycan distribute pollen over long distances but are
03-Chap02.fm Page 167 Mardi, 3. août 2004 2:51 14

The genetic diversity of forest tree species in French Guiana
168
Tab
le 3
Sam
ple
size
(n)
, tot
al n
umbe
r of
ban
ds (
l), p
heno
typi
c (H
p) a
nd g
enet
ic (
Hg)
, (H
g2)
dive
rsit
y us
ing
RA
PDs
and
AFL
Ps
Spec
ies
I.A
.1. R
APD
I.A
.2. A
FLP
nl
Hp
sH
gs
Hg2
sn
lH
ps
Hg
sH
g2s
V. m
iche
lii92
370.
328
(0.0
27)
ab0.
381
(0.0
22)
ab0.
396
(0.0
22)
ab37
207
0.21
1 (0
.014
)a
0.22
8 (0
.015
)a
0.32
5 (0
.016
)a
C. s
angu
inol
entu
m75
480.
358
(0.0
22)
ab0.
357
(0.0
20)
ab0.
375
(0.0
19)
ab51
281
0.14
8 (0
.011
)b
0.14
8 (0
.011
)cd
0.21
0 (0
.017
)bc
E. g
rand
iflor
a65
600.
289
(0.0
22)
b0.
303
(0.0
21)
b0.
315
(0.0
21)
c47
236
0.16
6 (0
.013
)b
0.15
5 (0
.012
)bc
0.20
2 (0
.016
)bc
D. g
uian
ensis
9161
0.26
8 (0
.023
)bc
0.30
0 (0
.025
)bc
0.35
1 (0
.022
)bc
2544
20.
157
(0.0
12)
b0.
184
(0.0
13)
b0.
303
(0.0
16)
ab
V. a
mer
ican
a66
680.
170
(0.0
21)
c0.
237
(0.0
28)
c0.
299
(0.0
32)
c30
411
0.09
2 (0
.010
)c
0.11
5 (0
.013
)d
0.23
2 (0
.023
)b
S. g
lobu
lifer
a94
660.
390
(0.0
18)
a0.
404
(0.0
15)
a0.
404
(0.0
15)
a
C. p
roce
ra65
460.
387
(0.0
17)
ab0.
329
(0.0
23)
b0.
329
(0.0
23)
bc
M. c
occi
nea
8957
0.20
6 (0
.026
)c
S. r
ubra
4758
0.31
9 (0
.023
)b
C. s
ciad
ophy
lla36
520.
381
(0.0
26)
ab
Hg2
is th
e ge
neti
c di
vers
ity
acco
rdin
g to
Lyn
ch a
nd M
illig
an r
ecom
men
dati
ons.
s (a
,b,c
,d: s
igni
fican
tly d
iffer
ent g
roup
s at
5%
leve
l, Z
-tes
t).
03-Chap02.fm Page 168 Mardi, 3. août 2004 2:51 14
Multilocus assessment of levels of genetic diversity in tropical trees in Paracou stands
169
known to forage in restricted neighborhoods whenflowering trees are dispersed (Franceschinelli andBawa, 2000). The other species are supposed to beinsect pollinated and the range of pollination distancecould be very large. In the same way, seed dispersal isrestricted for V. americana, M. coccinea and C. procera(by rodents), D. guianensis (by wind), E. grandiflora,S. rubra (by gravity) and potentially large forS. globulifera, C. sciadophylla (by bats), V. michelii (bykinkajou, birds and monkeys) and C. sanguinolentum(by monkeys) (Forget, 1988; Forget and Sabatier,1997; Ter Steege, 1990; Julliot, 1997). Althoughsome crude estimates of physical dispersion have beendocumented, the effective distances of seed dispersal(seeds from which reproductive trees of the nextgeneration will originate) are not well known.
However, there are some indirect indications of thepotential impact of gene flow on levels of diversity.When comparing the diversity estimates that weobtained with the spatial genetic structure of thespecies in Paracou (Degen et al., 2001), there is a cleartrend for lower diversity for those species exhibitingstronger spatial structures (D. guianensis, M. coccineaand V. americana). These results suggest that reducedgene flow as detected by strong spatial structure mayhave some impact on the level of diversity.
We also investigated the potential relationshipbetween abundance and spatial distribution of thespecies, with its genetic diversity. The differentstudied species exhibited quite an important variationfor their density and distribution. S. globulifera(10.6 tree/ha with DBH ≥ 10 cm) and V. americana
(8.4 tree/ha with DBH ≥ 10 cm) are abundantwhereas V. michelii (2.4 tree/ha with DBH ≥ 10 cm)has a low density. V. americana, D. guianensis andC. sciadophylla are strongly aggregated, butM. coccinea, S. rubra, V. michelii are more evenlydistributed. The more frequent species, S. globuliferaand V. americana, are at the extreme ranks for thediversity level. These contrasted results confirmed theabsence of a clear relationship between density andgenetic diversity, which had been already pointed outby others. Shapcott (1999) found a significantnegative correlation between population geneticdiversity and within population density in understorypalm species of the genus Pinanga, in Borneo, incontrast to the results of Hamrick and Murawski(1991) who found, in Panama, that species at lowpopulation densities (<0.5 individuals/ha) were lessgenetically variable than species which occurred athigh density.
As the review of Hamrick et al. (1992) indicated, wedid not find any clear relationship between thesuccessional status of the species and their level ofdiversity. Even if our results indicate that latesuccessional species (V. americana and M. coccinea)exhibited lower diversities than early successionalspecies (C. sciadophylla), these results may bemisleading because the late successional species arealso of endemic origin.
The evolutionary history of species must haveplayed a significant role in shaping the present geneticstructure of the species (Hamrick et al., 1992).Particularly, the quaternary and holocene events areassumed to have differently impacted on the geneticstructure of species. The species with stricterecological needs and weaker colonization abilities(V. americana, E. grandiflora), which could haveexperienced severe population bottlenecks, mighthave lost more genetic diversity than species with ahistory of larger and more continuously distributedpopulations (S. globulifera). Paracou forest is locatedin coastal plain, probably a recent colonization zone.There are some comparative analyses of diversity withinland sites. Differentiation (Fst) between inland andcoastal populations varied from 0.08 in V. americana(Dutech, 2001) to 0.046 for C. sciadophylla, 0.035 forC. procera and 0.042 for D. guianensis (Caron andChevallier, 1999). However, these observeddifferentiation values were much lower than the meanvalue for most tropical trees (Gst = 0.109, isozymes)(Loveless, 1992), probably because the populations
Fig. 5. Correlation between diversity estimates using twodifferent dominant marker systems (RAPDs and AFLPs)(Hp: r2 = 0.978, Student test, P < 0.02; Hg: r2 = 0.926,P < 0.05; Hg2: r2 = 0.800, n.s).
0,45
0,4
0,35
0,3
0,25
0,2
0,15
0,1
0,05
00,050 0,1 0,15 0,2 0,25 0,3 0,35
RA
PD
AFLP
Hp
Hg
Hg2
03-Chap02.fm Page 169 Mardi, 3. août 2004 2:51 14

The genetic diversity of forest tree species in French Guiana
170
sampled in our studies were too close. Historicaltrends may only be identified from differentiationtrends observed on a large sample of populations,including widely separated populations.
5. ConclusionThe estimation of the level of the genetic diversity ofspecies is the first step in a program of sustainablemanagement of genetic resources. The multi-allelicmarkers, such as RAPDs and AFLPs, were rapid toolsto monitor diversity in different species forcomparative purposes.
As expected, the range of variation of the level ofgenetic diversity between tree species of Paracou waslarge. The only clear trend observed was the strongrelationship between diversity and distribution rangeof the species. Endemic species to the Guiana shieldexhibit lower diversity that species having a regional ora continental distribution. Other life history traits didnot indicate any clear relationship with geneticdiversity. Many life history traits probably interactwith each other.
Given the present state of knowledge for these traits,additional data concerning the demography and thereproductive biology of species are necessary.Furthermore, the genetic inventory will need to beenlarged to other populations for the same species, andto be increased to a larger number of species in orderto construct a model of prediction of genetic diversityin tropical species. We are currently conductingmonitoring of genetic diversity using AFLP markerson more than 40 species over several geographicpopulations in order to meet these goals.
AcknowledgementsThis work was funded by two EC projects, No. TS3-CT94-0316 and ERBIC18-CT97-0149, and a SOFTproject of the Ministère de l’environnement. Wewould like to thank L. Maggia, F. Sucher, A. Leveau,M.H. Chevallier, N. Colpaert, A. Meddour whoparticipated in the laboratory analysis.
ReferencesAldrich P.R., Hamrick J.L., Chavarriaga P., Kochert G., 1998.
Microsatellite analysis of demographic genetic structure infragmented populations of the tropical tree Symphoniaglobulifera. Mol. Ecol. 7, 933–944.
Bittrich V., Amaral M.C.E., 1996. Pollination biology ofSymphonia globulifera (Clusiaceae). Plant Syst. Evol. 200,101–110.
Bodénès C., Joandet S., Laigret F., Kremer A., 1997. Detection ofgenomic region differentiating two closely related oak speciesQuercus petraea (Matt.) Liebl. and Quercus robur L. Heredity78, 433–444.
Boyle,T.J.B., 1996. Effets des perturbations anthropiques sur ladiversité génétique dans les forêts tropicales. CIFOR, Ann.Report, 17–19.
Cardoso M.A., Provan J., Powell W., Ferreira P.C.G., De OliveiraD.E., 1998. High genetic differentiation among remnantpopulations of the endangered Caesalpinia echinata Lam.(Leguminosae-Caesalpinioideae). Mol. Ecol. 7, 601–608.
Cardoso S.R.S., Eloy N.B., Provan J., Cardoso M.A., FerreiraP.C.G., 2000. Genetic differentiation of Euterpe edulis Mart.Populations estimated by AFLP analysis. Mol. Ecol. 9, 1753–1760.
Caron H., 2000. Organisation et dynamique de la diversitégénétique de cinq espèces arborées de la forêt guyanaise. Thèsede l’université de Montpellier II.
Caron H., Chevallier M.H. et al., 1999. Comparaison à2 échelles locale et régionale, de l’organisation spatiale et de ladynamique de la diversité génétique chez 2 espèces guyanaises:Dicorynia guianensis et Carapa procera. Rapport final du projetSOFT 1995, Structure spatiale des écosystèmes forestiersguyanais: les mailles de la diversité et la gestion de l’espace.11 pages.
Chamberlain J.R., 1998. Isozyme variation in Calliandracalothyrsus (Leguminoseae): its implication for speciesdelimitation and conservation. Am. J. Bot. 85, 37–47.
Changtragoon S., Finkerley R., 1995. Patterns of geneticvariation and characterization of the mating system of Pinusmerkusii in Taïland. Forest Genet. 2 (2), 87–97.
Chase M., Kesseli R., Bawa,K., 1996. Microsatellite markersfor population and conservation genetics of tropical trees.Am. J. Bot. 83 (1), 51–57.
Collevatti R.G., Grattapaglia D., Hay J.D., 2001. Populationgenetic structure of the endangered tropical tree speciesCaryocar brasilense, based on variability at microsatellite loci.Mol. Ecol. 10, 349–356.
Dawson I.K., Powell W., 1999. Genetic variation in theAfromontane tree Prunus africana, an endangered medicinalspecies. Mol. Ecol. 8, 151–156.
Degen B., Caron H., Bandou E., Maggia L., Chevallier M.H.,Leveau A., et al., 2001. Fine-scale spatial genetic structure ofeight tropical tree species as analysed by RAPD’s. Heredity 87,497–507.
Doyle J.J., Doyle J.L., 1987. A rapid DNA isolation procedurefor small quantities of fresh leaf tissue. Phytochem. Bull. 19,11–15.
Dutech C., 2001. Diversité génétique et dynamique de la forêttropicale humide: le cas d’une espèce ligneuse guyanaise,Vouacapoua americana (Caeasalpiniaceae). Thèse de l’universitéde Montpellier II.
“Forgen news”, 1997. Research Update on IPGRI’s ForestGenetic Resources Projects. Informal publication. IPGRI,Rome, Italy, p. 23.
03-Chap02.fm Page 170 Mardi, 3. août 2004 2:51 14

Multilocus assessment of levels of genetic diversity in tropical trees in Paracou stands
171
Forget P.M., 1988. Dissémination et régénération naturelle dehuit espèces d’arbres en forêt guyanaise. Thèse de 3e cycle,Université Paris VI.
Forget P.M., 1992. Regeneration ecology of Eperua grandiflora(Caesalpiniaceae), a large seeded tree in French Guiana.Biotropica 24 (2), 146–156
Forget P.M., Sabatier D., 1997. Dynamics of the seedling shadowof a frugivore-dispersed tree species in French Guiana. J. Trop.Ecol. 13 (5), 767–773.
Franceschinelli E.V., Bawa K.S., 2000. The effect of ecologicalfactors on the mating system of a south American shrub species(Helicteres brevispira). Heredity 84, 116–123.
Gill G.E., Fowler R.T., Mori S.A., 1998. Pollination biology ofSymphonia globulifera (Clusiaceae) in central French Guiana.Biotropica 30, 139–144.
Gillies A.C.M., Navarro C., Lowe A.J., Newton A.C., HernandezM., Wilson J., et al., 1999. Genetic diversity in MesoAmericanpopulations of mahogany (Swietenia macrophylla), assessedusing RAPDs. Heredity 83, 722–732.
Hall P., Chase M.R., Bawa K.S., 1994. Low genetic variation buthigh population differentiation in a common tropical treespecies. Conserv.Biol. 8, 471–482.
Hamrick J.L., Murawski D.A., 1991. Levels of allozyme diversityin populations of uncommon neotropical tree species. J. Trop.Ecol. 7, 395–399.
Hamrick J.L., Godt M.J., Sherman-Broyles S.L., 1992. Factorsinfluencing levels of genetic diversity in woody plant species.New Forests 6, 95–124.
Julliot C., 1997. Impact of seed dispersal by red howler monkeysAlouatta seniculus on the seedling population in theunderstorey of tropical rain forest. J. Ecol. 85(4), 431–440
Kendall M.G., Stuart A., 1977. The Advanced Theory ofStatistics, vol. 1, 4th ed. Griffin and Co, London.
Konuma A., Tsumura Y., Lee C.T., Lee S.L., Okuda T., 2000.Estimation of gene flow in the tropical-rainforest treeNeobalanocarpus heimii (Dipterocarpaceae), inferred frompaternity analysis. Mol. Ecol. 9, 1843–1852.
Lee S.L., Ang K.C., Norwati M., 2000. Genetic diversity ofDryobalanops aromatica Gaertn. F (Dipterocarpaceae) inpeninsular Malaysia and its pertinence to genetic conservationand tree improvement. Forest Genet. 7 (3), 211–219.
Loveless M.D., 1992. Isozymes variation in tropical trees: patternof genetic organization. New Forest. 6, 67–94.
Lowe A.J., Jourde B., Breyne P., Colpaert N., Navarro C., WilsonJ., Cavers S., 2002. Fine scale genetic structure and gene flowwithin Costan Rican populations of mahogany (Swieteniamacrophylla). Heredity 90, 268-275.
Lynch M., Milligan B.G., 1994. Analysis of population geneticstructure with RAPD markers. Mol. Ecol. 3, 91–99.
Margis R., Felix D., Caldas J.F., Salgueiro F., de Araujo D.S.D.,Breyne P., et al., 2002. Genetic differentiation among three
neighboring Brazil-cherry (Eugenia uniflora L.) populationswithin the Brazilian Atlantic rain Forest. Biodivers. Conserv. 11,149–163.
Mariette S., Le Corre V., Austerlitz F., Kremer A., 2002.Sampling within the genome for measuring within populationdiversity: trade-offs between markers. Mol. Ecol. 11, 1145-1156.
Muluvi G.M., Sprent J.I., Soranzo N. et al., 1999. Amplifiedfragment length polymorphism (AFLP) analysis of geneticvariation in Moringa oleifera Lam. Mol. Ecol. 8, 463–470.
Murawski D.A., Gunatilleke I.A.U., Bawa K., 1994. The effects ofselective logging on inbreeding in Shorea megistophylla(Dipterocarpaceae) from Sri Lanka. Conserv. Biol. 8, 997–1002.
Namkoong G., Boyle T., Gregorius H.R., Joly H., Savolainen O.,Ratman W., et al., 1996. Testing criteria and indicators forassessing the sustainability of forest management: geneticcriteria and indicators. CIFOR Working Paper 10, p. 12.
Nei M., Roychoudhury A.K., 1974. Sampling variance ofheterozygosity and genetic distance. Genetics 76, 379–390.
Nei M., 1987. Molecular Evolutionary Genetics. ColombiaUniversity Press, New York.
Nybom H., Bartish I.V., 2000. Effects of life history traits andsampling strategies on genetic diversity estimates obtained withRAPD markers in plants. Perspect. Plant Ecol. Evol.System. 3 (2), 93–114.
Roux S., 1999. Variabilité de Tabebuia heterophylla sur l’arc desPetites Antilles. Rapport de stage. FIF-ENGREF, Nancy. p. 54.
Russel J.R., Weber J.C., Booth A., Sotelo-Montes C., DawsonI.K., 1999. Genetic variation of Calycophyllum spruceanum inthe Peruvian Amazon Basin, revealed by amplified fragmentlength polymorphism (AFLP) analysis. Mol. Ecol. 8, 199–204.
Shapcott A., 1999. Comparison of the population genetics anddensities of five Pinanga palm species at Kuala Belalong,Brunei. Mol. Ecol. 8, 1641–1654.
Ter Steege H., 1990. A monograph of Wallaba, Mora andGreenhart. Tropenbos Technical Series 5.
Vos P., Hogers R., Bleeker M., Reijans M. et al., 1995. AFLP: anew technique for DNA fingerprinting. Nucleic Acids Res. 23,4407–4414.
White G.M., Boshier D.H., Powell W., 2002. Increased pollenflow counteracts fragmentation in a tropical dry forest: anexample from Swietenia humilis Zuccarini. Proc. Natl. Acad.Sci. USA 99 (4), 2038–2042.
Williams J.G.K., Kubelik A.R., Livak K.J., Rafalski J.A., TingeyS.V., 1990. DNA polymorphism amplified by arbitraryprimers are useful as genetic markers. Nucleic Acid. Res. 18,6531–6535.
Zhang Q., Allard R.W., 1986. Sampling variance of the geneticdiversity index. J. Heredity 77, 54–55.
03-Chap02.fm Page 171 Mardi, 3. août 2004 2:51 14

03-Chap02.fm Page 172 Mardi, 3. août 2004 2:51 14