Embed Size (px)
Citation preview

PART III – Emissions Inventory for Other Diesel Emi ssion Sources in and
Adjacent to West Oakland (Non-Port and Non-UP Rail Yard)

[Page intentionally blank]

i
Table of Contents
PART III – Emissions Inventory for Other Diesel Emi ssion Sources in and Adjacent to West Oakland
(Non-Port and Non-UP Rail Yard)
Section Page
A. Introduction 1. Purpose and Geographic Scope .................................................................. 1 2. Use of Emission Factors in the Assessment .............................................. 4 3. Summary of Emissions and Source Categories In an d Adjacent to
the West Oakland Community .................................................................... 4
B. Emission Sources 1. Off-Port Ocean Going Vessels
a. Description of Source Category............................................................ 6 b. Location/Area of Emissions .................................................................. 7 c. Emission Estimation Methodology........................................................ 8 d. Summary of Results ........................................................................... 11 e. Limitations .......................................................................................... 13
2. Off-Port Harbor Craft
a. Description of Source Category.......................................................... 14 b. Location/Area of Emissions ................................................................ 15 c. Emission Estimation Methodology...................................................... 16 d. Summary of Results ........................................................................... 22 e. Limitations .......................................................................................... 22
3. Freeways and Roadways
a. Description of Source Category.......................................................... 25 b. Location/Area of Emissions ................................................................ 25 c. Emission Estimation Methodology...................................................... 26 d. Summary of Results ........................................................................... 31 e. Limitations .......................................................................................... 33 f. Future Work........................................................................................ 34
4. Emissions within Trucking-Based Businesses and D istribution Centers
a. Description of Source Category.......................................................... 35 b. Location/Area of Emissions ................................................................ 37 c. Emission Estimation Methodology...................................................... 38 d. Summary of Results ........................................................................... 44 e. Limitations .......................................................................................... 45

ii
5. Facilities with Diesel–Powered Cargo Handling Eq uipment a. Description of Source Category.......................................................... 46 b. Location/Area of Emissions ................................................................ 46 c. Emission Estimation Methodology...................................................... 47 d. Summary of Results ........................................................................... 50
6. Locomotive Movement (Off-Port and Off-UP Rail Ya rd) within West
Oakland a. Description of Source Category.......................................................... 51 b. Location/Area of Emissions ............................................................... 51 c. Emission Estimation Methodology...................................................... 52 d. Summary of Results ........................................................................... 56
7. Amtrak’s Oakland Maintenance Facility
a. Description of Source Category.......................................................... 58 b. Location/Area of Emissions ............................................................... 58 c. Emission Estimation Methodology...................................................... 59 d. Summary of Results ........................................................................... 63
8. Major Construction Projects
a. Description of Source ......................................................................... 65 b. Location/Area of Emissions ............................................................... 65 c. Emission Estimation Methodology...................................................... 68 d. Summary of Results ........................................................................... 71 e. Limitations .......................................................................................... 71
9. Stationary Point Sources
a. Description of Source ......................................................................... 73 b. Location/Area of Emissions ............................................................... 73 c. Emission Estimation Methodology...................................................... 75 d. Summary of Results ........................................................................... 75 e. Limitations .......................................................................................... 76
C. References ............................................................................................................. 77 Appendices Appendix A: Amtrak Maintenance Yard Supporting Mat erials ................... 80 List of Figures
Figure 1 Land-Based Emissions Domain for Part III ................................................ 3
Figure 2 Water-Based Emissions Domain for Part III............................................... 4
Figure 3 Emissions Domain for Ocean-Going Vessels in Part III ............................. 8
Figure 4 Spatial Allocation of Harbor Craft PM Emissions in the Bay Area............ 16

iii
Figure 5 West Oakland Freeway and Roadway Emissions Domain ...................... 26
Figure 6 Location of Truck-Based Businesses in West Oakland ........................... 38
Figure 7 Facilities with Diesel-Powered Cargo Handling Equipment ..................... 46
Figure 8 Main Rail Line for the BNSF, UP, and Amtrak Trains in West Oakland ...................................................................................... 52
Figure 9 Location of Amtrak’s Oakland Maintenance Facility (OMF) ..................... 59
Figure 10 Location of Major Construction Projects in West Oakland
During 2005 ............................................................................................. 66
Figure 11 Location of Stationary Point Sources of Diesel PM in West Oakland ...... 74 List of Tables
Table 1 Summary of Part III Source Categories and Estimated Diesel Emissions in 2005........................................................................... 5
Table 2 Types of Ocean-Going Vessels ................................................................. 6
Table 3 Estimated OGV Visits to the San Francisco Bay and the Port of Oakland in 2005 ....................................................................... 9
Table 4 Main Engine Emission Factors – Transit Mode (g/kW-hr)........................ 10
Table 5 Main Engine Emission Factors – Maneuvering Mode (g/kW-hr) .............. 10
Table 6 Auxiliary Engine Emission Factors: Transit, Maneuvering, and Hotelling (g/kW-hr) ............................................................................ 11
Table 7 Summary of Diesel PM Emissions from OGVs Operating within the San Francisco Bay in 2005 (tons per year).............................................. 12
Table 8 Summary of NOx Emissions from OGVs Operating within the San Francisco Bay in 2005 (tons per year).............................................. 12
Table 9 Categories of Commercial Harbor Craft Included in the Emissions Inventory................................................................................. 15
Table 10 California Commercial Harbor Craft Engine Profile by Vessel Type ........ 18
Table 11 Engine Load Factor by Vessel Type and by Engine Use......................... 19
Table 12 Fuel Correction Factor ............................................................................. 20
Table 13 Engine Deterioration Factor ..................................................................... 21
Table 14 Estimated Number of Commercial Harbor Craft and their Diesel PM and NOx Emissions (tons per year) included in Part III ........................... 22
Table 15 Heavy Duty Diesel Vehicle Categories .................................................... 25
Table 16 Activity Matrix Example............................................................................ 28

iv
Table 17 Example Emission Rate Matrix ................................................................ 28
Table 18 Part III (Non-Port) Diesel PM and NOx Emissions (tons per year) In and Adjacent to the West Oakland Community ................................... 31
Table 19 Port-Related Diesel PM and NOx Emissions (tons per year) on Freeways and Roadways in and Adjacent to the West Oakland Community............................................................................................... 32
Table 20 Summary of the Total On-Road Diesel PM and NOx Emissions (tons per year) Within the West Oakland Domain.................................... 33
Table 21 Final list of West Oakland Truck-Based Businesses and Accompanying Activity Data ............................................................. 36
Table 22 Settings Used To Run EMFAC ................................................................ 40
Table 23 Truck and Bus Emission Factors ............................................................. 41
Table 24 Example Fleet Average Horsepower Calculation..................................... 44
Table 25 Diesel-Powered Off-Road Equipment Information ................................... 48
Table 26 Diesel-Powered Equipment at the Port Maintenance Facility .................. 49
Table 27 Diesel PM Emissions (tons per year) for Facilities with Diesel-Powered Cargo Handling Equipment............................................ 50
Table 28 Locomotive Emission Sources by Track Section ..................................... 53
Table 29 Number of Amtrak Trains by Route That Stopped at the Jack London Square Station in 2005 ....................................................... 54
Table 30 Annual Number of Trains That Came to Amtrak’s Oakland Maintenance Facility in 2005 ...................................... 54
Table 31 UP Oakland Diesel PM Emission Factors................................................ 55
Table 32 Locomotive Emission by Track Section (tons per year) ........................... 57
Table 33 Total Trains and Locomotives at the Oakland Maintenance Facility in 2005..................................................................................................... 61
Table 34 Estimated Diesel PM and NOx Emissions at the Oakland Maintenance Facility.................................................................. 63
Table 35 Description of Areas Where Specific Train or Locomotive Operations Occur ............................................................. 64
Table 36 Estimated Diesel PM and NOx Emissions by Area for Oakland Maintenance Facility ................................................................................ 64
Table 37 Major Construction Projects Associated in the West Oakland Community During 2005 .......................................................................... 67
Table 38 Major Construction Projects Associated with the Port During 2005 ......... 68
Table 39 Example Fleet Average Horsepower Calculation..................................... 69

v
Table 40 Diesel PM Emissions (tons per year) from Construction Projects Associated with the Port and in the West Oakland Community During 2005 .......................................................................... 72
Table 41 Stationary Source Emissions and Stack Parameters for Sources of Diesel PM in and Adjacent to West Oakland .................... 75
Table 42 Diesel Emissions (tons per year) From Stationary Point Sources in West Oakland ...................................................................................... 76

1
PART III – Emissions Summary for Other Diesel Emiss ion Sources In and Adjacent to the West Oakland Community (Non-Port of Oakland and Non-UP Rail Yard)
A. Introduction 1. Purpose and Geographic Scope This appendix summarizes the emission inventory information and the methodologies used to estimate the diesel particulate matter (PM) emissions from various diesel sources in and adjacent to the West Oakland community. The diesel emissions from diesel-powered internal combustion engines in and adjacent to West Oakland are the third part of a three-part evaluation to assess potential health impacts of diesel exhaust in West Oakland. This third part, or Part III, generally does not include emission sources within the Port of Oakland (Port) 1 or the Union Pacific (UP) rail yard. For reference, the diesel emissions from sources within the Port, or Part I, can be found on documents on the Port’s website2 . The diesel emissions for the UP rail yard, or Part II, are discussed in Appendix C of the Preliminary Summary of Results. The emissions for all Parts of this assessment focus on the facilities and operations that existed during the calendar year for 2005. In limited cases, where it was difficult to replicate activity in 2005 (e.g., identify specific construction equipment at a specific project), emissions information from other time periods or projects were used to estimate activities for 2005. Staff from the Air Resources Board (ARB), the Bay Area Air Quality Management District (BAAQMD or District), and the Port, along with their associated consultants, worked cooperatively to prepare or review the emissions information used in this appendix. In addition, we worked with representatives from academia, industry, and the West Oakland Community to help define the scope of the assessment, identify emission sources of interest, review information, and provide input for the Part III emissions inventory. For Part III, the geographic scope of emissions, which is sometimes referred to as the “emissions domain” or “area of emissions”, includes both water and land-based emission sources. The land-based sources are primarily included within the boundaries
1 Some Port of Oakland sources were included in this Part III report, but transferred to Part I for the HRA analysis: • Port-related freeway traffic • Port-related construction • the Port’s Harbor Maintenance Facility (Port Maintenance Facility). 2 Port of Oakland website address is http://www.portofoakland.com/environm/airEmissions.asp .

2
of the major freeways that encompass the West Oakland Community. These boundaries are generally defined by the following landmarks:
• North: Bay Bridge, and Interstates 80 and 580;
• East: Interchange of Interstates 580 and 980; and Interstate 880 to Tenth Ave;
• South: Tenth Avenue and Embarcadero; and
• West: The water of the inner harbor and San Francisco Bay; excluding all property held by the Port or UP rail yard. The boundary roughly follows Interstate 880 and Maritime Street.
The emissions domain for the water-based sources is defined by the outer sea buoys on the West and the San Francisco Bay shoreline on the North, East, and South. Figures 1 and 2 illustrate the land and water-based emission domains for Part III.
In the main document, we present the individual and combined modeling results and the potential health impacts from all three Parts of this assessment. However, this appendix only discusses the emission sources included in Part III of this assessment.

3
Figure 1 Land-Based Emissions Domain for Part III

4
Figure 2 Water-Based Emissions Domain for Part III
2. Use of Emission Factors in the Assessment
The emission estimates presented in the document are the best that we have for diesel emissions. These estimates are based on emission factors that identify the rate that a substance (e.g., diesel particulate matter) is emitted from a particular type or size of engine under certain operating conditions. The emission factors used in Part III are taken from the best available data specific to each emission source. Emission factors used in other Parts of the assessment may differ due to source specific conditions. 3. Summary of Emissions and Source Categories In and Adjacent to the West
Oakland Community For Part III, the sources of diesel exhaust are grouped within nine source categories. Table 1 presents an overview of those source categories and their diesel exhaust PM emissions in tons per year (tpy) for 2005. Each of the categories presented in the table are discussed in detail in the following sections of this appendix. As Table 1 illustrates, the Off-port Ocean Going Vessels, and Off-port Harbor Craft constitute approximately 80 percent of the emissions for Part III. It is important to note that while these emission sources make up a majority of the total emission for Part III, the potential health impacts are dependant on the air dispersion modeling which considers

5
wind, weather, and the proximity of the emissions to the West Oakland community. See the Preliminary Summary of Results for more information on the modeling and risk results associated with all Part III source categories.
Table 1 Summary of Part III Source Categories and Estimated
Diesel Emissions in 2005 1
Source Categories Diesel Emissions (tons per year)
Off-Port Ocean Going Vessels 246 Off–Port Harbor Craft 238 Freeways and Roadways 892 Emissions within Trucking Based Businesses and Distribution Centers (Movement and Idling within facility)
0.63
Facilities with Diesel-Powered Cargo Handling Equipment (Typically Associated with Trucking Businesses or Distribution Centers)
4.34
Locomotive Movement (Off-Port and Off-Rail Yard) within West Oakland
1.3
Amtrak’s Oakland Maintenance Facility 3.4 Major Construction Projects 13.95 Stationary Point Sources 0.26 Total 597 1. All numbers are rounded. See the Preliminary Summary of Results for the actual emissions that
are used for air dispersion modeling. The emissions listed here may be different that those used for modeling since they are released outside of the modeling domain.
2. Includes all non-Port-related truck and bus emissions. Emissions that are Port-related within the community have been subtracted from Part III and placed with the Port emissions in Part I (approximately 2.8 TPY).
3. Excludes yard emissions from trucking companies that have Port-associated business (approximately 1.4 TPY). In the Preliminary Summary of Results, emissions from this source are included in the Part I.
4. Includes incidental Port–associated emissions from miscellaneous diesel-powered equipment at the Port Maintenance Facility (approximately 0.05 tons per year).
5. Includes emissions from construction projects that are Port-related. Port-associated construction emissions are approximately 1.2 TPY. See Section 8 and the Port of Oakland 2005 Seaport Construction Air Emissions Inventory for more discussion.
6. Includes incidental emissions from standby generators that are Port-related (<0.001 TPY).

6
B. Emission Sources 1. Off-Port Ocean-Going Vessels
a. Description of Source Category
An ocean-going vessel (OGV) is a commercial vessel greater than or equal to 400 feet in length or 10,000 gross tons; or propelled by a marine compression ignition engine with a displacement of greater than or equal to 30 liters per cylinder. OGVs can be classified into several types based on the function of the ship. OGV vessel types are listed in Table 2.
Table 2 Types of Ocean-Going Vessels
Vessel Type Description
Auto Vessels designed to carry autos and trucks.
Bulk Cargo Bulk carriers are vessels used to transport bulk items such as mineral ore, fertilizer, wood chips, or grain.
Container Container vessels are cargo vessels that carry standardized truck-sized containers.
General Cargo Vessels designed to carry cargo such as steel, palletized goods, and heavy machinery.
Passenger Passenger cruise vessels are passenger vessels used for pleasure voyages.
Reefers Vessels used to transport perishable commodities which require temperature-controlled transportation, mostly fruits, meat, fish, vegetables, dairy products, and other foods.
RORO A vessel designed to carry large wheeled cargo such as large off-road equipment, trailers or railway carriages. RORO is an acronym for “roll on/roll off”.
Tankers Vessels designed to transport liquids in bulk.
OGV emissions occur during three distinct operating modes: transit (emissions from vessel operations between ports), maneuvering (slow speed vessel operations while in-port areas), and hotelling (also known as berthing; in-port emissions while moored to a dock). Two types of engines are found on OGVs, main engines and auxiliary engines. The main engine is a very large diesel engine used mainly to propel the vessel at sea

7
during the transit and maneuvering modes. Auxiliary diesel-fueled engines on OGVs provide power for uses other than propulsion (except for diesel-electric vessels). Typically, an OGV will have a single, large main engine used for propulsion, and several smaller auxiliary “generator-set” engines. Auxiliary engines are used during all three operating modes. An exception to this configuration is diesel-electric vessels where diesel engine generator sets provide power for both propulsion and auxiliary power needs. Cruise ships are typically diesel-electric vessels. While OGVs also have auxiliary boilers that are used either during hotelling or during low-speed activities to provide steam for various ship functions, the emissions from boilers are not included in the study since the health risk assessment data applies to diesel PM from diesel-powered internal combustion engines. PM emissions from boilers are not considered diesel PM because of the differences in the combustion process between boilers and internal combustion engines. For more discussion on the methods used for carcinogenic health risk assessment, see the Preliminary Summary of Results.
b. Location/Area of Emissions Emissions were calculated for all OGVs operating in the San Francisco Bay Area in 2005 except for those covered by the Port in the Part I assessment. Ports within the San Francisco Bay that are included in Part III include, but are not limited to, Schnitzer Steel, San Francisco, Redwood City, Richmond, and Carquinez. Emissions were calculated west to the sea buoys, located about 9 to 16 miles west of the Golden Gate Bridge, east and north to near Solano County, and south to the Port of Redwood City. The ship traffic lanes used to allocate emissions were determined from nautical charts and from vessel telemetry systems. Figure 3 shows the ship traffic lanes.

8
Figure 3 Emissions Domain for Ocean-Going Vessels in Part II I
c. Emission Estimation Methodology The method for determining emissions from OGVs in Part III took the total number of vessels that enter San Francisco Bay and subtracted out the emissions from OGVs from Part I that go to the Port.
The basic equation used for estimating emissions from ocean-going vessels is:
E y, t, om, e = Σ Pop t ∗ EF e, om, f ∗ Hrs om, t ∗ VP om, t ∗ % Load om, t Where:
E = pollutant specific emissions (tons per year of NOx, HC, CO2, SO2, and diesel PM)
Pop = population of ocean-going vessels by vessel type EF = emission factor by engine type, operating mode, and fuel (units of glkw-hr)
Hrs = average annual use in hours by operating mode and vessel type
9
VP = average power by operating mode and vessel type % Load = average engine load by operating mode and vessel type y = inventory year om = operating mode (transit, maneuvering, hotelling) t = vessel type (auto, container, bulk cargo, etc.) f = fuel (HFO or MGO/MDO) e = engine type The 2005 California State Lands Commission vessel visits data was used as the primary source of vessel population information. The Lands Commission collects statewide information from the various Marine Exchanges and Port Authorities on vessel port visits and vessels transiting along the California coast. The vessel data collected includes vessel identity, arrival and departure time, port of arrival, last port, and next port. Table 3 identifies the 2005 vessel population by vessel type, number of vessels, and number of visits made by these vessels to the San Francisco Bay and the Port of Oakland. Approximately 3,600 vessels visited the San Francisco Bay in 2005. Of these, approximately 1,900 vessels called on the Port of Oakland. Almost 95 percent of the OGV visits to the Port were Container vessels.
Table 3 Estimated OGV Visits to the San Francisco Bay
and the Port of Oakland in 2005 1
Vessel Types Numbers of Vessels
Numbers of Vessel Visits to
the SF Bay
Numbers of Vessel Visits to
the Port of Oakland
Auto 59 135 17 Bulk2 212 398 0 Container 343 1812 1812 General 64 207 87 Passenger 20 75 0 Tanker 224 933 0 Totals 922 3,651 1,916
1. California State Lands Commission Data for 2005 and Port of Oakland records. 2. Schnitzer Steel had approximately 26 vessel visits in 2005.
Travel distance was determined by assessing the optimal route that would have been used for a given ship to travel from the port of arrival stated in the Lands Commission database to either the next port or the previous port. The speed of the vessel depended on the type of vessel and the location; for example, within the San Francisco Bay it was assumed that a vessel would travel at a speed of no more than 13 knots.

10
The 2005 Air Resources Board Ocean Going Vessels survey was used to assess the average vessel power (main and auxiliary engine), load factor, cruise speed, and average hotelling time by vessel type. (ARB 2005 Oceangoing Vessel Survey).
Ship anchorage data was obtained from the US Coast Guard Vessel Traffic
Service. Data obtained included vessel identity, anchorage time, and anchorage location. Vessel anchorages were reconciled with the Lands Commissions Port Call database to identify the port of arrival.
i. Emission Factors
Tables 4, 5, and 6 below present the emission factors used in the development of
the ocean-going vessel emissions inventory. Table 4 presents the emission factors for OGV main engines during transit or high load operation while at sea. A composite emission factor was developed to take into the account the differences in emissions between the slow speed (two-stroke) and medium speed (four-stroke) engine. Since the majority of the emissions were based on slow speed (two-stroke) engines, the staff weighted the emission factors by 95 percent for slow speed engines and 5 percent for medium speed engines.
Table 4 Main Engine Emission Factors – Transit Mode (g/kW-h r)
Engine Type Fuel Type 1 PM NOx SO2 HC CO CO2
Slow Speed HFO 1.5 18.1 10.5 0.6 1.4 620 Medium Speed HFO 1.5 14 11.5 0.5 1.1 677 Composite EF HFO 1.5 17.9 10.6 0.6 1.4 623
1. HFO is Heavy Fuel Oil has sulfur content of 2.5%.
Table 5 presents the emission factors for OGV main engines during maneuvering
or low load operation near ports. Again, a composite emission factor was developed to account for the differences in emission between slow speed and medium speed engines. Maneuvering factors were estimated using the same method that was used for the transit mode emission factors.
Table 5 Main Engine Emission Factors – Maneuvering Mode (g/ kW-hr)
Engine Type Fuel Type 1 PM NOx SO2 HC CO CO2
Slow Speed HFO 1.5 14.5 11.6 1.8 1.4 682 Medium Speed HFO 1.5 11.2 12.7 1.5 1.1 745 Composite EF HFO 1.5 14.3 11.7 1.8 1.4 685
1. HFO is Heavy Fuel Oil has sulfur content of 2.5%.

11
Table 6 presents the emission factors for OGV auxiliary engines, including diesel-electric vessels. As shown in the table, the emission factors for auxiliary engines vary depending on the type of fuel used. According to the 2005 ARB OGV survey, 71 percent of all ships, except cruise ships, use heavy fuel oil for auxiliary engines and 29 percent use distillate. For cruise ships, 92 percent use HFO and 8 percent use distillate.
Table 6
Auxiliary Engine Emission Factors: Transit, Maneuv ering, and Hotelling (g/kW-hr)
Engine Type Fuel Type PM NOx SO2 HC CO CO2
Medium Speed HFO1 1.5 14.7 12.3 0.4 1.1 722
Medium Speed Marine Distillate @ 0.5% Sulfur
0.38 13.9 2.1 0.4 1.1 690
Medium Speed Marine Distillate @ 0.1% Sulfur
0.25 13.9 0.4 0.4 1.1 690
1. HFO is Heavy Fuel Oil has sulfur content of 2.5%.
d. Summary of Results In 2005, ocean-going vessels operating within the San Francisco Bay emitted
over 400 tons per year (tpy) of diesel PM. Of this total, the Port accounted for approximately half of these emissions. See the Port’s website for documents discussing the emission associated with the Port in Part I. The address is http://www.portofoakland.com/environm/airEmissions.asp . After subtracting out the emission attributed to the Port, the diesel emissions associated with Part III activities is approximately 246 tons per year. This total includes the emissions from vessels stopping at Schnitzer Steel which was estimated at approximately 1.5 tpy of diesel PM. Table 7 summarizes these emissions.

12
Table 7 Summary of Diesel PM Emissions from OGVs Operating within the
San Francisco Bay in 2005 (tons per year)
Activity (Mode)
All OGV Sources within
S.F. Bay
OGV Sources Associated with the
Port of Oakland (Port) 1
OGV Sources Not Associated with the Port 2
Transiting 248.2 96.9 151.3 Maneuvering 96.3 49.8 46.5 Berthing3 97.8 59.9 37.9 Anchoring 12.5 1.9 10.6 Total (tons per year) 454.8 208.5 246.34
1. Included in Part I. 2. Includes vessels with origin or destination at Schnitzer Steel and includes emissions from auxiliary and
main engines. 3. Berthing = Hotelling. 4. Total emissions used for modeling may be different due to differences in the emissions and modeling
domains.
Table 8 summarizes the emission estimates from OGVs for the Oxides of Nitiogen (NOx) during 2005.
Table 8
Summary of NOx Emissions from OGVs Operating within the San Francisco Bay in 2005 (tons per year)
Activity (Mode)
All OGV Sources within
S.F. Bay
OGV Sources Associated with the
Port of Oakland (Port) 1
OGV Sources Not Associated with the Port 2
Transiting 2,070.1 1,233.5 836.6 Maneuvering 670.3 457.6 212.7 Berthing3 1,585.1 760.7 824.4 Anchoring 120.0 23.7 96.3 Total (tons per year) 4,445.5 2,475.5 1,970.0
1. Included in Part I. 2. Includes vessel with origin or destination at Schnitzer Steel and includes emissions from auxiliary and
main engines. 3. Berthing = Hotelling.
It is noteworthy to point out that the NOx emissions trend for “OGV Sources Not Associated with the Port” in Table 8 is inversely proportional to the Diesel PM emissions presented for that same category in Table 7. This suggests that the Port of Oakland contributes more NOx in relation to diesel PM. This result is due in part to the various

13
types of ships that visit Bay Area ports and the relationship between ship types, engine power, hotelling times, and time in mode (e.g., activity).
For example, Table 3 shows that the Port receives all of the container ships that
enter the San Francisco Bay, while a majority of the other ship types visit other Bay Area ports. Container ships spend proportionately more time transiting than hotelling, while other ships like tankers and bulk freighters will spend proportionately more time hotelling. This is important because transiting requires the use of main engines, while hotelling uses auxiliary engines that burn a mixture of heavy fuel oil and distillate fuel which burns cleaner than heavy fuel oil. This equates to emission factors for hotelling that are lower than transiting (i.e., 20 percent for NOX and 22 percent for Diesel PM).
e. Limitations This analysis assumed that ships take the shortest path between the port of
origin and the port of destination. In reality, external factors such as weather and other ship traffic may determine the path and speed taken by a ship.
This analysis also used average vessel characteristics obtained from the statewide 2005 ARB Ocean Going Vessel survey. It is possible that the survey may not be representative of the particular ship population visiting the San Francisco Bay Area in 2005.
While preparing for upcoming regulations, the ARB identified data suggesting that auxiliary boiler fuel use rates may be up to ten times greater than initially assumed for this assessment. This change in fuel use means that during hotelling activities, non-diesel PM emissions from boilers may increase by approximately 17 to 50 percent. As mentioned previously, PM emissions from boilers are not considered diesel PM because of the differences in the combustion process between boilers and internal combustion (diesel cycle) engines. Therefore, any change in boiler emissions will not impact the diesel PM emissions presented in this assessment.

14
2. Off–Port Harbor Craft
a. Description of Source Category “Commercial harbor craft” are defined as any private, commercial, government,
or military marine vessels including, but not limited to, passenger ferries, excursion vessels, tug boats, tow boats, push-boats, crew vessels, work boats, pilot vessels, supply boats, research vessels, United States Coast Guard vessels, hovercraft, emergency response vessels, and barges that do not otherwise meet the definition of ocean-going vessels or recreational vessels. Commercial harbor craft typically spend most of their time within 100 nautical miles from shore. In this inventory, non-Port of Oakland commercial harbor craft are grouped into ten vessel types based on vessel usage. Table 9 provides a listing and description of each category of commercial harbor craft. All Port of Oakland-related harbor craft were accounted for in Part I. Due to limited information currently available about the numbers of U.S. Navy and/or U.S. Coast Guard (USCG) vessels, vessel characteristics, and vessel activity, these vessels are not included in this inventory. Most commercial harbor craft are powered by marine diesel engines, including propulsion engines and auxiliary engines. Propulsion engines are the primary engines that move vessels through the water. Auxiliary engines provide power to vessel electrical systems and may also provide power to unique, essential vessel equipment (i.e. refrigeration units, net hoists) during the normal day-to-day operation of the vessel.

15
Table 9 Categories of Commercial Harbor Craft Included in t he Emissions Inventory
Vessel Type Description
Commercial Fishing Vessels used in the search and collection of fish for the purpose of sale at market.
Charter Fishing Vessels available for hire by the general public and used for the search and collection of fish for the purpose of personal consumption.
Crew and Supply Vessels used for carrying personnel and supplies to and from off-shore and in-harbor locations, including vessels at anchorage, construction sites, and off-shore platforms.
Ferry Vessels used for public use in the transportation of persons or property as a part of the public transport systems.
Excursion Vessel Non-ferry commercial passenger vessels used for sightseeing, whale watching, and dinner cruising, etc.
Pilot Vessel Vessels used to carry pilots to and from ships to provide pilot service into and out of a port or harbor.
Towboat/Pushboat
Vessels used to push barges and pontoons. Towboats are characterized by a square bow with steel knees for pushing, a shallow draft, and powerful engines. They are most often seen on inland waterways since their hull designs would make open ocean operations dangerous.
Tug Boat
Vessels primarily used to assist other vessels maneuvering in harbors, over the open sea or through rivers and canals by pushing and towing. They are also used to tow barges, or other floating structures.
Work boat Vessels used to perform duties such as fire/rescue, law enforcement, hydrographic surveys, spill/response research, training, and construction.
Other Vessels used in various commercial operations that do not fit into any other category such as vessels that are used for funeral services to dispose of cremated remains.
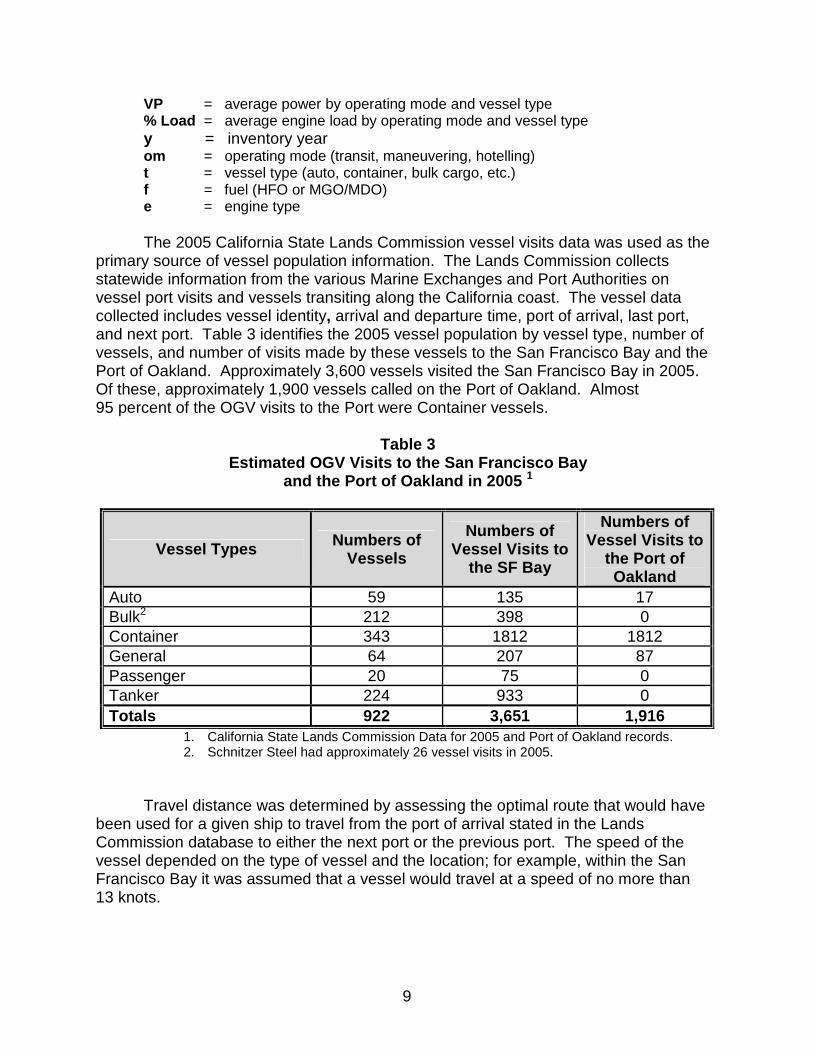
b. Location/Area of Emissions Emissions were calculated for all commercial harbor craft operating in the San Francisco Bay Area in 2005. The emissions domain for Part III includes an area in the west to the outer sea buoys, located approximately about 9 to 16 miles west of the Golden Gate Bridge, and within the San Francisco Bay shoreline on the north, east, and south. Figure 4 shows the emissions domain for commercial harbor craft covered in Part III. Any emissions associated with harbor craft activity attributed with the Port of Oakland are not included in Part III since they are covered in Part I.
16
Figure 4 Spatial Allocation of Harbor Craft PM Emissions in the Bay Area
c. Emission Estimation Methodology Staff estimated emissions from harbor craft for the Bay Area using the statewide commercial harbor craft emission estimation methodology. More detailed information can be found in the document titled, Emissions Estimation Methodology for Commercial Harbor Craft Operating in California (ARB, 2007). This document can be accessed at http://www.arb.ca.gov/regact/2007/chc07/appb.pdf .
i. Equation The basic equation for the estimating emissions from a commercial harbor craft engine is:

17
HrLFHP)UL
ADF(FEFE ××××+××= 10
Where:
E = is the amount of emissions of a pollutant (ROG, CO, NOx, or PM)
emitted during one period; 3
EF0 =is the model year, horsepower and engine use (propulsion or auxiliary) specific zero hour emission factor;
F = is the fuel correction factor which accounts for emission reduction benefits from burning cleaner fuel;
DF = is the horsepower and pollutant specific engine deterioration factor, which is the percentage increase of emission factors at the end of the useful life of the engine;
A = is the age of the engine when the emissions are estimated;
UL = is the vessel type and engine use specific useful life;
HP = is rated horsepower of the engine;
LF =is the vessel type and engine use specific load factor;
Hr = is the number of annual operating hours of the engine.
Total emissions from commercial harbor craft can be estimated by summing up the emissions from individual engines or by multiplying the emissions rates, average emissions per engine per year, with the engine population.
ii. Vessel Population
Vessel population data were collected from various sources, including the USCG documentation data, the California Department of Fish and Game registration data, the ARB Harbor Craft Survey and subsequent evaluation of this data, and information from recent emission inventory estimates generated for the Port of Los Angeles. Staff estimates there were approximately 4,030 harbor craft vessels operating in California in year 2005. Based on hailing port information, about 1,415 vessels operate in the BAAQMD. Of these, about 1,344 vessels have hailing ports inside the San Francisco Bay (Bay) and the rest are home ported on the Pacific coast outside the Bay.
3 SO2 will be estimated using the percent sulfur found in the different types of diesel fuel used statewide and estimated fuel consumption.
18
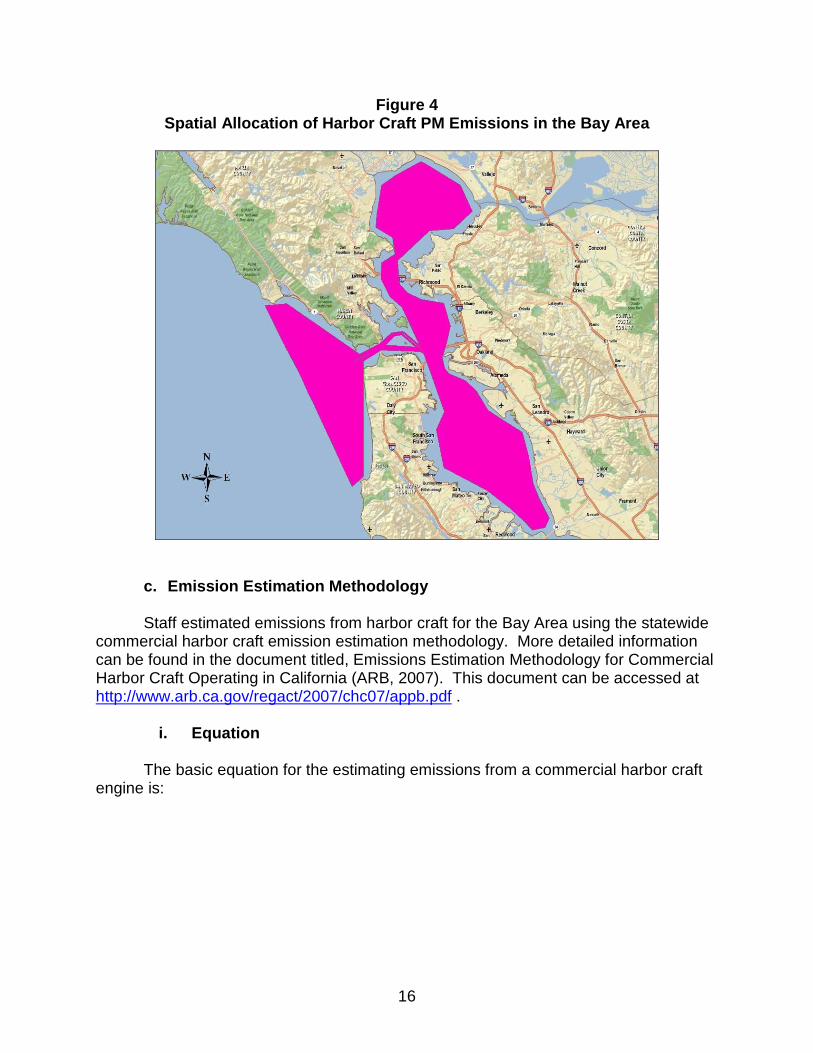
Tug boats serving the Port of Oakland also serve other ports. We estimate that about 13 percent of the hours that tug boats operate in the Bay are devoted to the Port of Oakland. In other words, about 7-8 tug boats (weighted by the percentage of time) are devoted to the Port of Oakland. We estimate that about 1,337 of the 1,344 vessels providing service within the Bay provide service not directly related to the Port of Oakland.
During the development of the inventories for this study, ARB staff obtained new information that allowed us to split the ferry/excursion category into two distinct vessel types in the Bay Area. This new data yielded emissions estimates for these vessels that are different than what was provided in previously discussed inventories (see Table 10). Comparably, excursion vessels operate at a lower horsepower and annual activity than ferries. This explains why the emissions from excursion vessels are lower than ferries despite a higher vessel population.
iii. Engine Profile Engine profile data were collected using the ARB’s Statewide Harbor Craft survey. Table 10 summarizes the statewide commercial harbor craft engine profiles developed using the vessel and engine data. This table presents the total annual hours for each type of vessel. The emissions were allocated based on spatial allocation profiles described in section viii.
Table 10 California Commercial Harbor Craft Engine Profile b y Vessel Type
Propulsion Engine Auxiliary Engine
Vessel Type
Average # of Engines per Vessel
Average Annual
Operating Hrs Useful
Life
Average # of
Engines per
Vessel
Average Annual
Operating Hrs Useful
Life
Commercial Fishing 1.12 1,250 21 0.46 1,633 15 Charter Fishing 1.77 1,622 16 0.75 2,077 15
Ferry 1.88 2,687 20 1.28 1,467 20 Excursion Vessels 1.90 1,004 20 0.98 973 20 Crew and Supply 2.5 788 22 1.1 3,036 22
Pilot Vessels 1.7 1,031 19 0.14 994 25 Tug Boats 1.92 2,274 21 1.59 2,486 23 Tow Boats 2.1 1,993 26 1.17 2,965 25 Work Boats 1.46 675 17 0.32 750 23
Others 1.11 779 23 0.46 805 22

19
iv. Engine Load The load factor is the fraction of rated brake horsepower used. Table 11 summarizes the engine load factors used to estimate commercial harbor craft emissions. This data was also taken from the ARB’s Statewide Harbor Craft survey.
Table 11 Engine Load Factor by Vessel Type and by Engine Use
Vessel Type Propulsion Engine Load 1 Auxiliary Engine Load 1
Commercial Fishing 0.27 0.43 Charter Fishing 0.52 0.43
Ferry 0.42 0.43 Excursion 0.42 0.43
Crew and Supply 0.45 0.43 Pilot Vessels 0.51 0.43
Tug Boats 0.50 0.31 Tow Boats 0.68 0.43 Work Boats 0.45 0.43
Others 0.52 0.43 1. Unitless.
v. Zero-hour Emission Factors Zero-hour emission factors are emissions factors when engines are brand new and start to operate or when the cumulative number of hours of operation is zero. Harbor craft zero-hour emission factors are based on the emission factors in the ARB’s OFFROAD emission inventory model with the following adjustments:
• For 1996 through 1999 model year engines, staff used the Tier Zero (1996) emission factors;
• For 2000 and beyond model year engines, staff used the U.S. EPA emission standards for marine engines or the NOx limits of the IMO MARPOL Annex VI, whichever is lower;4 and
• Staff adjusted the OFFROAD model emission factors to reflect an “E3” test cycle for propulsion engines and “D2” test cycle for auxiliary engines.
4 Staff compared OFFROAD emissions factors, U.S. EPA Tier I, II and proposed Tier III and Tier IV standards, and the NOx limits of the Annex VI of the International Convention for the Prevention of Pollution from Ships (MARPOL).

20
vi. Fuel Correction The ARB’s OFFROAD model’s fuel correction factors are used to account for the
benefits of cleaner diesel fuel. Engines certified using federal on- and off-road diesel fuel receive NOx and PM benefit of 7 percent and 20 percent respectively, due to the lower aromatic content of California diesel fuel. Engines certified using federal off-road diesel fuel receives an additional 5 percent PM benefit due to the lower sulfur content of California diesel fuel. A fuel correction factor of 0.72 for hydrocarbon emissions has been applied to all diesel-powered engines beginning with the 1994 calendar year. Starting in 2007, California will require the use of ultra low sulfur diesel fuel (ULSD-15 ppmw sulfur). An additional 4 percent PM benefit is assumed for all engines not certified on this fuel. Table 12 summarizes the fuel correction factors.
Table 12
Fuel Correction Factor 1
Calendar Years Horsepower Range Model Years NOx 2 PM 2
<25 Pre-1995 25-50 Pre-1999 51-100 Pre-1998
101-175 Pre-1997 176+ Pre-1996
0.930 0.750
<25 1995+ 25-50 1999-2010 51-100 1998-2010
101-175 1997-2010
1994-2006
176+ 1996-2010
0.948 0.822
<25 Pre-1995 25-50 Pre-1999 51-100 Pre-1998
101-175 Pre-1997 176+ Pre-1996
0.930 0.720
<25 1995+ 25-50 1999-2010 51-100 1998-2010
101-175 1997-2010 176+ 1996-2010
0.948 0.800
2007+
All 2011+ 0.948 0.852 1. Source: Off-road Exhaust Emissions Inventory Fuel Correction Factors. 2. Unitless.

21
vii. Engine Deterioration Staff adopted engine deterioration factors from ARB’s OFFROAD model.
Table 13 summarizes the deterioration factors used for estimating emissions from commercial harbor craft operating in California. The values represent the increase of emission factors at the end of the useful life of engines. For example, for an engine larger than 250 horsepower, the NOx, PM, HC, and CO emission factors will increase 21, 67, 44, and 25 percent, respectively, by the end of its useful life.
Table 13
Engine Deterioration Factor
Horsepower Range NOx 1 PM 1 HC 1 CO 1 25-50 0.06 0.31 0.51 0.41 51-250 0.14 0.44 0.28 0.16 >251 0.21 0.67 0.44 0.25
1. Unitless.
viii. Spatial Allocation Staff allocated statewide emission totals to counties, air districts, and air basins based on the home ports of the vessels and/or where the activities occur using our best engineering judgment. Emissions were also split between land side air basins and Outer Continental Shelf (OCS) air basins based on the ARB’s Commercial Harbor Craft Survey which collected the percent of time vessels spend at varying distances from shore, including percent of time spent in harbor, within 0-25, 25-50, 50-75, 75-100, and beyond 100 nautical miles. The land side air basins cover the area 3 nautical miles from shore and the OCS air basin cover the areas 3-100 nautical miles from shore. However, for this analysis, only 3-12 nautical miles off shore of the OCS are considered (refer to Figure 4).
The percent of time commercial harbor craft spend within land side air basins or
the Outer Continental Shelf air basins was based on the information collected in the ARB’s Commercial Harbor Craft Survey. Additional analysis was conducted to allocate emissions within the Bay Area Air Quality Management District (BAAQMD) to address the heavy marine traffic in the San Francisco air basin. We estimate that eighty-four percent of commercial fishing and charter fishing vessel emissions were allocated to the OCS air basin, and the remaining 16 percent to the San Francisco air basin. Tow boat emissions were allocated by following the statewide default to reflect the inter-port long haul activity assumption that 57 percent of the emissions were allocated to the OCS air basin, and the remaining 43 percent to the San Francisco air basin. Five percent of emissions from all the other type of vessels were allocated to the OCS air basin, and the remaining 95 percent to the San Francisco air basin.

22
Emission totals for the Bay Area were allocated to 100 meter by 100 meter grid cells based on vessel traffic intensity derived from eight months (December 2006 to August 2007) of Automatic Identification System (AIS) data. The AIS data is a system used by ship and vessel traffic services to identify and locate vessels. The Navigation Center of the USCG provides a good overview of the AIS at http://www.navcen.uscg.gov/enav/ais/default.htm . The spatially-resolved Part III emissions were generated by subtracting emissions associated with Port harbor craft activity from the area around the Port.
d. Summary of Results The estimated number of vessels and their diesel PM and NOx emissions for
Part III are summarized in Tables 14. Table 14 illustrates that ferries, excursion vessels, and tugs are responsible for approximately 65 percent of the diesel PM emissions from this source category for Part III.
Table 14
Estimated Number of Commercial Harbor Craft and the ir Diesel PM and NOx Emissions (tons per year) included in PART III 1,2
Vessel Type Number of Vessels
Diesel PM Emissions
NOx Emissions
Commercial Fishing 859 30.21 674.63 Charter Fishing 155 18.57 407.68
Crew and Supply 9 3.04 65.41 Ferries 21 36.11 852.06
Excursion Vessels 118 29.96 667.62 Pilot Vessels 4 1.01 21.29 Tow Boats 24 18.45 425.63 Tug Boats 49 87.66 2,039.45
Work Boats 35 1.93 44.09 Others 65 10.66 230.21
Total (tons per year) 1337 237.59 5,428.06 1. Table does not include any emission contributions for operations at the Port.
These are covered in Part I. 2. Includes emissions data from the San Francisco Air Basin and 3-12 miles of the
Outer Continental Shelf.
e. Limitations
The accuracy of this emissions inventory relies on the accuracy of the statewide emission estimates, the allocation of emissions to the modeling domain, and the spatial allocation of emissions within the domain.

23
The statewide inventory is limited by the following factors.
1. Commercial harbor craft include passenger ferries, tug boats, tow boats, push-boats, crew vessels, work boats, pilot vessels, supply boats, research vessels, United States Coast Guard vessels, hovercraft, emergency response vessels, and barges. ARB staff estimated emissions from harbor craft for the Bay Area using the statewide commercial harbor craft emission estimation methodology. More detailed information about the development of this emissions inventory can be found in the document titled, Emissions Estimation Methodology for Commercial Harbor Craft Operating in California (ARB, 2007). This document is available at http://www.arb.ca.gov/regact/2007/chc07/appb.pdf .
2. The ARB survey collected information for about 410 auxiliary engines and about 1,031 propulsion engines. These engines represent 16 percent and 18 percent of statewide commercial harbor craft auxiliary engine and propulsion engine population, respectively. The engine information collected in the survey may not be representative of the statewide fleet and may not reflect the uniqueness of the fleet and operation specific to the regions.
3. There are no comprehensive databases of commercial harbor craft population or activity. As described in the reference listed above (ARB 2007), we developed the inventory by compiling several incomplete population databases, and conducting a survey or commercial harbor craft operations. By necessity, the statewide inventory assumes that vessels operate only in the vicinity of their home port, whereas we believe some harbor craft transit between ports, especially in the Bay Area. As a result, inventory estimates may not accurately reflect where actual vessel operations occur. The statewide inventory also assumes engine operation parameter averages by vessel type are indicative of operations in the Bay Area. This may or may not be true. Finally, the statewide commercial harbor craft inventory provides no information on spatial allocation within regions. To develop a spatial allocation we used a limited data set of GPS-based second by second vessel traffic data that is generated as a result of national vessel safety programs. We used these data, representing a limited number of vessels, to estimate the spatial activity patterns of all commercial harbor craft in the Bay Area. The ARB is actively working on improving commercial harbor craft emissions inventories by integrating new data sources, conducting new surveys, and taking advantage of new data that will be provided as a result of the recently adopted commercial harbor craft regulation.
4. Some vessels can be used for multiple purposes. For example, tugs can be used to assist large ocean vessels as well as towing/pushing barges and other floating structures. Vessels can be grouped differently for different purposes.
5. Emission factors were developed from OFFROAD engine emission factors and MARPOL and EPA standards. These emission factors may not reflect the emission factors of in-use engines.
6. The statewide emissions were allocated to regions based on where the vessel hailing ports are. However, the locations of hailing ports may not represent the locations of where activities occur.

24
7. Allocation of emissions within the domain was based on eight months of AIS data. The representation of the AIS data is limited by the short data collection time, and the percentage of vessels captured by the land-side receiver.

25
3. Freeways and Roadways a. Description of Source Category
This section focuses on the emissions from heavy duty diesel trucks and buses since they constitute more than 90 percent of the diesel PM emissions from all on-road diesel vehicles in Alameda County. For this analysis, staff estimated emissions from both running exhaust and idling of all heavy duty diesel trucks and buses on the major freeways in the study area, as well as major and minor arterials in the West Oakland community. Heavy duty diesel vehicles include any truck with a gross vehicle weight rating (GVWR) of greater than 8,500 pounds. They are further broken into the four weight classes (T4 toT7) described in Table 15.
Table 15
Heavy Duty Diesel Vehicle Categories Class Description Weight (GVWR) Abbreviation Fuel
T4 Light-Heavy Duty Diesel Trucks 8,501-10,000 LHDDT1 Diesel T5 Light-Heavy Duty Diesel Trucks 10,001-14,000 LHDDT2 Diesel T6 Medium-Heavy Duty Diesel Trucks 14,001-33,000 MHDDT Diesel T7 Heavy-Heavy Duty Diesel Trucks 33,001+ HHDDT Diesel
b. Location/Area of Emissions Included in this assessment are all roadway and freeway links within the West Oakland. The emissions domain is presented in Figure 5. This domain includes portions of Interstates 80, 880, 980, and 580, as well as the major and minor arterials bounded by those expressways.

26
Figure 5 West Oakland Freeway and Roadway Emissions Domain
c. Emission Estimation Methodology
Traditionally, on-road mobile emission inventories are generated at the county scale using California’s emission factor model EMFAC and then allocated to large grid cells using the Direct Travel Impact Model (DTIM). For this study, staff enhanced the spatial resolution by estimating the emissions based on roadway specific vehicle activity data and allocated the emissions to individual roadway links. As additional work is completed to understand transportation behaviors and forecasting, access to local scale vehicle activity data has increased. For example, the various Metropolitan Planning Organizations (MPOs) develop regional transportation plans and regional transportation improvement plans (SCAG 2007). These plans are used to assess the impact of travel growth and various transportation improvement plans. Travel activity is assessed from Transportation Demand Models (TDMs) that

27
forecast traffic volumes and other characteristics of the transportation system. TDMs are used to estimate vehicle population and activity estimates such as speed and vehicle miles traveled (VMT) based on data about population, employment, surveys, income, roadway and transit networks, and transportation costs. The activity is then assigned a spatial and temporal distribution by allocating them to roadway links and time periods. A roadway link is defined as a discrete section of roadway with unique estimates for fleet specific population and average speed and is classified as a freeway, ramp, major arterial, minor arterial, collector, or centroid connector. Link based emission inventory development utilizes these enhanced spatial data and fleet and pollutant specific emission factors to estimate emissions at the neighborhood scale. Estimating emissions from on-road mobile sources for Part III is broken into three main processes that are described below. In summary, the three steps involve gathering vehicle activity data from the TDMs specific to each link on the roadway network. Each link contains activity data including vehicle miles traveled, vehicle type, and speed by period of the day. The activity is then apportioned to the various heavy duty diesel truck types listed in Table 15 where speed-specific VMT is then matched to an emission factor from EMFAC to estimate total emissions from each vehicle type for each hour of the day. The working draft of EMFAC, rather than EMFAC2007, was used for this assessment to be consistent with the emissions inventory developed for the Rail Yard Memorandum of Understanding. The EMFAC Working Draft is used for all three parts of the West Oakland assessment. The Working Draft does not include the following updates that are included in EMFAC 2007 since these were not available at the time the West Oakland inventory was developed: These differences include updated speed correction factors, speed profiles, and updated VMT.
i. Step 1: Obtain Link-Specific Activity Data The link specific activity data for heavy duty trucks necessary to estimate emissions are speed and VMT, where VMT is a product of vehicle volume (population) and link length. Link activity for West Oakland is provided by the Integrated Transportation Network (ITN) developed by Alpine Geophysics (Alpine Geophysics, 2004). The Integrated Transportation Network for the West Oakland was developed using the Metropolitan Transportation Commission’s (MTC’s) transportation demand model network. The total heavy duty truck VMT for each link is multiplied by the fraction of trucks that are diesel to assess the emissions from heavy duty diesel trucks. Once the total diesel VMT is calculated, the VMT is multiplied by the fraction of trucks that make up the four weight classifications listed in Table 15. The fuel and weight class fractions are specific to each county and are derived from EMFAC for Alameda County. The data is then assembled into an activity matrix (see example, Table 16) composed of a link identification code, hour of the day, speed, light-heavy duty diesel 1 truck (LHDDT1) VMT, light-heavy duty diesel 2 truck (LHDDT2) VMT, medium-heavy duty diesel truck (MHDDT) VMT, and heavy-heavy duty diesel truck (HHDDT) VMT.

28
Table 16 Activity Matrix Example 1
LINKID Hour Speed (mph)
LHDDT1 VMT
LHDDT2 VMT
MHDDT VMT
HHDDT VMT
54071 18 25 0.02 0.03 0.20 0.34 539342 18 10 0.15 0.20 1.33 2.31 53968 23 25 0.03 0.05 0.30 0.52 73597 20 60 0.48 0.63 4.12 7.15 1. Example data from ITN Network. 2. Bold text in table is used for the example in Step 3.
ii. Step 2: Derive Gram Per Mile Emission Rates The second step of the emission inventory process involves developing emission rates for all source categories for a specified time period, emission mode, and pollutant. Running exhaust emission rates based on vehicle type, fuel type, and speed were developed from the emfac mode of EMFAC. These are composite emission rates based on the model year distribution for each county and provided in units of grams of emissions per mile traveled. These data are compiled into a matrix of emission rates by speed and vehicle type was assembled for each county for light-heavy duty diesel trucks 1 and 2 (LHDDT1 and LHDDT2), medium-heavy duty diesel trucks (MHDDT) and heavy-heavy duty diesel trucks (HHDDT). Table 17 is an example of such a matrix.
Table 17 Example Emission Rate Matrix 1
Diesel PM Emission Rates (g/mile) Speed LHD1 LHD2 MHD HHD (mph) DSL DSL DSL DSL
102 0.109 0.144 0.614 2.454 20 0.072 0.095 0.404 1.119 45 0.037 0.049 0.209 0.638 60 0.032 0.043 0.183 0.96
1. Example data from EMFAC. 2. Bold text in table is used for the example in Step 3.
iii. Step 3: Calculate Emissions
As shown in Table 17, diesel PM emission rates are provided as grams per mile specific to each speed and heavy duty truck type. To estimate emissions, the activity for each diesel heavy duty truck type was matched to the corresponding emission rate (ER). For example, a link 0.09 miles long at 6 p.m. has 26 heavy-heavy duty diesel

29
trucks (HHDDTs) traveling at 10 miles per hour. This equates to a VMT of 2.3 miles (26 trucks*0.09 miles). EMFAC provides a gram per mile emission rate for HHDDTs traveling at 10 mph in Alameda County as 2.454 grams diesel PM/mile. In order to estimate total emissions from HHDDTs on that link during that hour of the day the following calculation is made:
VMTER)LinkLengthVolume(ERionsTotalEmiss ⋅=⋅⋅=
grams.miles.mile
grams.VMTERionsTotalEmiss 65324542 =⋅=⋅=
The steps outlined above and in Steps 1 and 2 can be represented with this single equation that provides an emissions total for each link for each hour of the day.
∑ ⋅⋅=j,i
j,ij,ilink ERFractionVMTionsTotalEmiss
Where:
Total Emissions = the total emissions in grams for each link
i = represents the individual diesel heavy duty truck types (LHDDT1, LHDDT2 – light heavy duty diesel trucks 1 and 2; MHDDT – medium-heavy duty diesel truck; and HHDDT – heavy-heavy duty diesel truck)
j = represent the hours of the day (hours 1-24)
VMTLink = total VMT for that link for all heavy duty trucks (gasoline and diesel)
Fraction = the fraction of the VMT that is attributable to each diesel heavy duty truck type The fraction is estimated based on VMT estimates in EMFAC:
Example: VMTMHDDT/VMTall heavy duty trucks (gasoline & diesel)
ER = the heavy duty diesel truck emission rates. The emission rate is vehicle type and speed specific and is thus matched according to the link specific activity parameters.
From this expression, diesel PM emissions are provided for each vehicle type, for each link and for each hour of the day. Finally, emissions are summed for all links for all hours of the day to provide a total daily emission inventory. The diesel bus link emission inventory was developed by applying a calculated fraction to the diesel heavy duty truck link emission inventory. The applied fraction was calculated from the Alameda County emission inventory by dividing the total diesel PM bus emissions by the total diesel PM heavy duty truck emissions. This fraction was applied uniformly to all roadway and freeway traffic links in the West Oakland community.

30
iv. Drayage (Port) Truck Methodology Drayage trucks are defined as any in-use on-road vehicle with a gross vehicle weight rating (GVWR) of 33,000 pounds or great operating on or transgressing through a port or intermodal rail yard property for the purpose of loading, unloading or transporting cargo, such as containerized, bulk or break-bulk goods (http://www.arb.ca.gov/msprog/onroad/porttruck/reg101107.pdf).
For Part III, emissions from on-road heavy-heavy duty diesel trucks were further evaluated to determine the emissions from trucks with an origin or destination with the Port and those trucks that do not have Port-related activity. The method below was used to estimate emissions from all drayage trucks on the freeways and roadways in Part III. The emissions from Part III drayage trucks follow the methodology used in the regulation that the ARB is developing to control emissions from in-use on-road diesel-fueled heavy duty drayage (Port) trucks. As part of this regulatory effort, ARB has developed a model to estimate emissions from drayage trucks servicing the Port and the intermodal rail yards. Using data provided to ARB by the Ports/Rail Yards, ARB surveys, and other studies, staff developed an emissions inventory based on truck-specific container movement for the Port of Oakland and neighboring rail yards. Emissions are estimated using the number of trips generated, travel distance per trip, and emissions factors specific to the age distribution used at the Port and rail yards.
To determine the fraction of trucks on the freeways that have an origin or destination at the Port, staff estimated the number of Port trips based on container throughput at the Port. To do this, staff assumed there are 1.8 twenty-foot equivalent units (TEUs) per container and that 30 percent of the trips to the Port are by bobtails and chasses. Travel distance, or length, was estimated by measuring the distance from the freeway entrance to the West Oakland boundary. Specific information related to truck trips associated with the Port and rail yard are discussed in the documents or appendices for Parts 1 and 2. The diesel emission estimates associated with Port-related trucks are presented in the emissions summary document on the Port’s website at http://www.portofoakland.com/environm/airEmissions.asp .
∑ ⋅⋅= ERLengthTripsEmissions
where: Emissions = (tons/year) Trips = number of trips (trips/year) Length = travel distance per trip (miles/trip) ER = emission rate (tons/mile) More information on the regulatory control measure to reduce emissions from heavy duty diesel-powered trucks at California's ports and rail facilities can be found at http://www.arb.ca.gov/msprog/onroad/porttruck/porttruck.htm . The emissions from drayage trucks covered in Part I are discussed in the emissions summary document on the Port’s website at http://www.portofoakland.com/environm/airEmissions.asp .

31
d. Summary of Results Emissions estimates from diesel trucks and buses on freeways and roadways in West Oakland are presented here. As discussed above, the emissions from on-road mobile sources are estimated for each roadway link based on activity data provided by a transportation demand model and emission factors from ARB’s EMFAC model (ARB, 2007). Table 18 provides the Part III emission inventory results for non-Port-related heavy duty diesel trucks and diesel buses in and adjacent to the West Oakland community. These diesel vehicles include interstate, local delivery, and diesel vehicles using the freeways and surface streets. This table does not include the emissions from trucks with their origin or destination at the Port. Table 18 shows the Part III non-Port-related diesel bus and truck emissions on the freeways and roadways in and adjacent to the West Oakland community at approximately 89.1 tons per year (tpy) of diesel PM and 2,454 tpy of Oxides of Nitrogen (NOx). Of this total, the estimated contribution from diesel buses is approximately 5.8 tpy of diesel PM and 301 tpy of NOx. Non–Port heavy-heavy duty diesel truck emissions are estimated at 44.9 tpy of diesel PM and 1,164 tpy of NOx. The balance of emissions, 38.4 tpy of diesel PM and 989 tpy of NOx, include all other non-Port heavy duty diesel trucks.
Table 18 Part III (Non-Port) Diesel PM and NOx Emissions (to ns per year)
In and Adjacent to the West Oakland Community
Non–Port Related Diesel Vehicles Diesel PM (tpy 1)
Diesel NOX (tpy 1)
Other Heavy Duty Diesel Trucks2 38.4 989 Heavy-Heavy Duty Diesel Trucks 44.9 1,164 Diesel Buses 5.8 301 Total Non-Port Related Heavy Duty Diesel Vehicles (Buses, LHDDT1/2, MHDDT & HHDDT)
89.1 2,454
1. tpy = tons per year. 2. Diesel vehicle class T4 to T6 (i.e., Light-heavy and medium–heavy duty trucks).
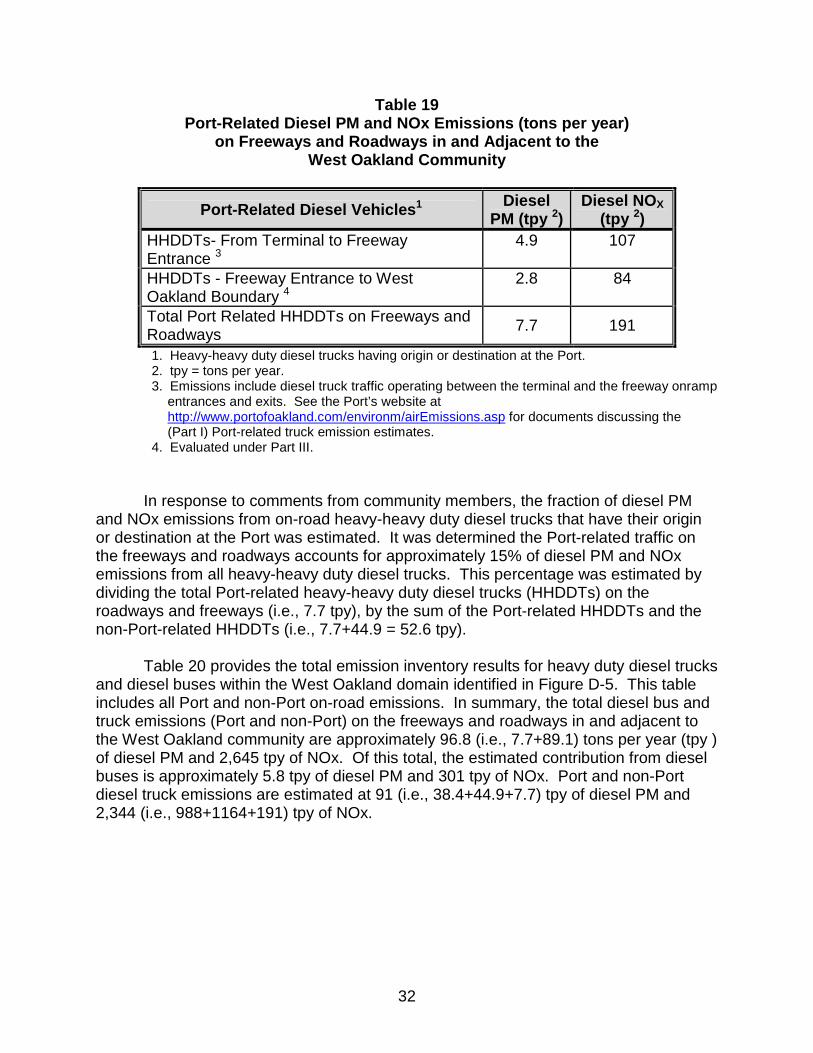
Table 19 shows the Port-related diesel truck emissions on the freeways and roadways in and adjacent to the West Oakland community at approximately 7.7 tpy diesel PM and 191 tpy NOx. The emissions calculated in Part I occurring between the terminals and the freeway entrances is estimated at 4.9 tpy diesel PM and 107 tpy NOx. The emissions estimated from Port trucks from the freeway entrances to the West Oakland community boundary is approximately 2.8 tpy diesel PM and 84 tpy NOx. The Port-related truck emissions discussed here have been combined with the Part I truck emissions. These emissions are presented with the Part I modeling the potential health impacts for the Port. See the Preliminary Summary of Results for further discussion of modeling and potential health impacts.
32
Table 19 Port-Related Diesel PM and NOx Emissions (tons per year)
on Freeways and Roadways in and Adjacent to the West Oakland Community
Port-Related Diesel Vehicles 1 Diesel PM (tpy 2)
Diesel NO X (tpy 2)
HHDDTs- From Terminal to Freeway Entrance 3
4.9 107
HHDDTs - Freeway Entrance to West Oakland Boundary 4
2.8 84
Total Port Related HHDDTs on Freeways and Roadways
7.7 191
1. Heavy-heavy duty diesel trucks having origin or destination at the Port. 2. tpy = tons per year. 3. Emissions include diesel truck traffic operating between the terminal and the freeway onramp
entrances and exits. See the Port’s website at http://www.portofoakland.com/environm/airEmissions.asp for documents discussing the (Part I) Port-related truck emission estimates.
4. Evaluated under Part III. In response to comments from community members, the fraction of diesel PM and NOx emissions from on-road heavy-heavy duty diesel trucks that have their origin or destination at the Port was estimated. It was determined the Port-related traffic on the freeways and roadways accounts for approximately 15% of diesel PM and NOx emissions from all heavy-heavy duty diesel trucks. This percentage was estimated by dividing the total Port-related heavy-heavy duty diesel trucks (HHDDTs) on the roadways and freeways (i.e., 7.7 tpy), by the sum of the Port-related HHDDTs and the non-Port-related HHDDTs (i.e., 7.7+44.9 = 52.6 tpy). Table 20 provides the total emission inventory results for heavy duty diesel trucks and diesel buses within the West Oakland domain identified in Figure D-5. This table includes all Port and non-Port on-road emissions. In summary, the total diesel bus and truck emissions (Port and non-Port) on the freeways and roadways in and adjacent to the West Oakland community are approximately 96.8 (i.e., 7.7+89.1) tons per year (tpy ) of diesel PM and 2,645 tpy of NOx. Of this total, the estimated contribution from diesel buses is approximately 5.8 tpy of diesel PM and 301 tpy of NOx. Port and non-Port diesel truck emissions are estimated at 91 (i.e., 38.4+44.9+7.7) tpy of diesel PM and 2,344 (i.e., 988+1164+191) tpy of NOx.

33
Table 20 Summary of Total On-Road Diesel PM and NOx Emission s (tons per year)
Within the West Oakland Domain
Diesel Vehicles Diesel PM (tpy 1)
Diesel NO X (tpy 1)
Port and Non-Port Related Heavy Duty Diesel Trucks (LHDDT1/2, MHDDT & HHDDT)2
91.0 2,344
Diesel Buses 5.8 301 Total Emissions from Buses and Trucks on the Freeways and Roadways 3
96.8 2,645
1. tpy = tons per year. 2. See the Port’s website at http://www.portofoakland.com/environm/airEmissions.asp for
documents discussing the (Part I) Port-related truck emission estimates. 3. Includes all class T4 to T7 diesel truck traffic from the Port terminals to the edge of
the West Oakland domain.
e. Limitations Part III on-road truck (port drayage truck and on-road non-port-related trucks) emissions were estimated for individual roadway links within the modeling domain. Developing these emissions required obtaining information about truck travel on individual roadway links, which are developed by local transportation agencies using travel demand models. We used a roadway network developed by Bay Area local transportation agencies. As with most travel demand model networks, roadway maps are accurate for freeway and major arterials, while smaller streets are represented schematically and do not necessarily follow actual travel routes. As a result, the spatial allocation of emissions from minor arterials and roadways in this risk assessment is less accurate than for freeways and major arterials. While developing the inventory we compiled estimates of total truck vehicle miles traveled based on the local agency transit network and compared those results to EMFAC2007, which is the federally accepted model for estimating regional emissions for air quality and transportation conformity assessments. For Alameda County, there was a significant difference between the estimates for total vehicle miles traveled in the network versus EMFAC2007. The local agency network contained more than twice as many truck vehicle miles traveled than EMFAC2007. To evaluate this difference we compiled available truck count data and compared results to the local agency network. Results were mixed, indicating that while for most roadways vehicle miles traveled appeared to be overestimated, some appeared to be underestimated. We considered reducing truck volumes on the roadway network for consistency with EMFAC, but ultimately decided that this would generate as much uncertainty as it would resolve. As a result, we decided to use the local agency network as provided to us. We believe the truck activity on the roadway network we used, while potentially overestimating the total vehicle miles traveled, provided the best representation of trucking operations within the modeling domain. As such, we believe it accurately characterizes all of the trucking emissions within the West Oakland community.

34
One of the questions to be addressed by this risk assessment was the allocation of responsibility for trucking emissions between Ports and Railyards, and other businesses. Very little information was available to accomplish this task. The Port of Oakland had quantified emissions on Port property, to and from port property and the freeway on-ramps. Because the Port had not conducted an origin-destination survey we had no information on the routes trucks took to and from the freeways through the modeling domain, and in the West Oakland community. ARB staff had estimated trips and emissions associated with Port of Oakland trucks for development of ARB’s 2007 Drayage Truck Rule (ARB, 2007B). Trip estimates were consistent with those developed by the Port of Oakland in the Part I inventory. ARB’s drayage truck inventory was used to estimate drayage truck emissions in the West Oakland community, assuming that all trips leaving the Port of Oakland traveled through the modeling domain on freeways through the community without using minor arterials or secondary roadways. This approach may underestimate the magnitude of emissions from trucks serving the Port of Oakland, because port-truck operations within the community are not well characterized even though clearly some are occurring. Since drayage truck emissions were subtracted from the total emissions on the network, any potential underestimate in drayage truck emissions in the Part I inventory implies an equal overestimate in Part III inventories.
In late 2007, ARB and BAAQMD began discussing the need for improved estimates of truck volumes and origins/destination within West Oakland. As a result of these discussions, the BAAQMD initiated a contract designed to count trucks and survey idling behavior. Both ARB and BAAQMD have recommended to the Port of Oakland that they conduct origin-destination studies of trucks servicing the port of Oakland in order to improve Port truck emissions estimates both within West Oakland and in the Bay Area and San Joaquin Valley. Results from these efforts were not available to refine this risk assessment, but could be used in the future to do so. The emissions inventory developed for this study only included diesel particulate matter and NOx emissions from running exhaust and idling of heavy duty diesel trucks and diesel buses. Other PM emissions occurring from tire and brake wear were excluded, as they are not relevant to the study.
f. Future Work Refining and updating the inventories developed for West Oakland will be an on-going process conducted by the BAAQMD. This process will require additional data to refine current emissions estimates. For example, the BAAQMD will be conducting a survey of truck traffic and idling in West Oakland, and assess the impact of activity changes, future construction, and mandated controls on the inventories.

35
4. Emissions within Trucking-Based Businesses and D istribution Centers a. Description of Source Category
A major U.S. Postal Service distribution center and numerous other truck-based
businesses operate within or adjacent to the West Oakland community. For purposes of this project, “truck-based businesses” were broadly defined as any business that generates significant levels of diesel truck activity (e.g., vehicle trips or extended idling). Diesel emissions for these facilities were defined as movement and idling within the facility boundaries. This is appropriate since diesel truck emissions outside of these facilities are covered in Section 3, Freeways and Roadways or in the Port of Oakland emissions inventory. The bus activity within the Greyhound Bus Depot is also included in this category. All data for this source category was obtained through joint efforts from the BAAQMD, Sonoma Technology Incorporated (STI), and the ARB.
To provide consistency, this source category also focused on truck-based
businesses that were operating in 2005. To obtain diesel PM emissions from on-road diesel trucks within these businesses, BAAQMD contracted and collaborated with STI to produce a list of West Oakland facilities that operate diesel trucks and/or equipment.
To determine which facilities would be evaluated, STI developed a preliminary list
of facilities in West Oakland that operate diesel trucks and/or equipment by using a variety of data sources, commercial databases, previous studies, and visual inspections by STI and District staff. This preliminary list was refined using the following techniques.
• Using geographic information system (GIS) tools to eliminate businesses located outside the study boundaries;
• Contacting selected businesses by phone or personal visit to eliminate operations that had closed or relocated, or that did not operate diesel vehicles/equipment;
• Adding businesses identified by the Port of Oakland, by consultation with community members, or by visual inspections of the study region. This process by STI resulted in a final list of 52 businesses to be included in their
data collection efforts.
The list of 52 truck-based business was made available to the Port of Oakland and to members of the West Oakland community in order to identify additional businesses in the region. Based both on input from the Port and community members, the trucking within four additional facilities was evaluated. These facilities include Amtrak’s Oakland Maintenance Facility (OMF), Cable Moore, Compass Container, and Schnitzer Steel. These additional facilities were evaluated by ARB staff. All 56 businesses are listed in Table 21.

36
Table 21
Final list of West Oakland Truck-Based Businesses and Accompanying Activity Data 1
No. Company Name Address Daily Truck Trips
Data Source
1 Oakland Maritime Support Services (OMSS)
11 Burma Road 1,250 Survey response
2 US Postal Service 1675 7th Street 1,034 Survey response 3 Schnitzer Steel 1101 Embarcadero West 230* Observation 4 Golden Bear Produce 315 Franklin Street 90 Observations 5 East Bay MUD 2020 Wake Avenue 84 Survey response 6 Central Concrete Co. 2400 Peralta Street 56 Observations 7 Greyhound Bus Station 2103 San Pablo Avenue 55 Survey response
8 California Waste 1819 10th Street 44 2001 Harding Study
9 Matheson Postal Service 2500 Poplar Street 30 2001 Harding Study
10 Online Trucking 1155 3rd Street 30 Survey response 11 Narayan's Trucking 1155 3rd Street #260 30 Survey response 12 Quintero Trucking 2590 Union Street 30 Survey response 13 A M & S Transportation Co. 1700 24th Street 25 Survey response 14 Roadway Express Inc. 1708 Wood Street 25 Survey response 15 Mutual Express 1700 W Grand Avenue 22 Survey response
16 Custom Alloy and Scrap 2730 Peralta Street 20 2001 Harding Study
17 Svenhard's Bakery 335 Adeline Street 16 Observations 18 Lehman Transportation 1155 3rd Street #180 12 Survey response 19 Sutta Co. 1221 3rd Street 11 Survey response 20 National Recycling Corp. 1312 Kirkham Street 10 Survey response
21 VA Transportation/Joint Intermodal
1225 Mandela Parkway 8 Observations
22 Saroni Co. 1301 26th Street 7 Survey response 23 Macy Movers Inc. 200 Victory Court 6 Observations
24 Eastshore Charter Lines 2400 Adeline Street 6 2001 Harding Study
25 Morgan Southern 425 Market Street 5 2001 Harding Study
26 JB Truck Repair 1639 18th Street 5 2001 Harding Study
27 J&O Truck/Tire 2401 Union/2236 Poplar 5 2001 Harding Study
28 J&A Truck Repair 2221 Union Street 5 2001 Harding Study
29 JAC Truck Repair Myrtle & Grand 5 2001 Harding Study
1. Includes emissions from trucking companies that have Port associated business (e.g., OMSS). * Additional businesses evaluated outside STI contract. ** Low activity site.

37
Table 21 (cont.)
Final list of West Oakland truck-based businesses and accompanying activity data
No. Company Name Address Daily Truck Trips
Data Source
30 California Cereal Products 1267 14th Street 5 Survey response
31 Amtrak’s Oakland Maintenance Facility
1303 3rd Street 5* Observation
32 Tighe Drayage Co. 2230 Willow Street 3 Survey response 33 Compass Container 2459 West 15th Street 2* Survey response 34 KMC Paper (Chang's) 2505 Poplar Street 2 Survey response 35 East Bay Resources 2430 Willow Street 1 Survey response 36 Cable Moore 1425 5th Street 1* Survey response 37 BBC Trucking 1155 3rd Street 0 Survey response 38 Kamal Trucking 526 2nd Street 0 Survey response 39 Wilson Trucking 1155 3rd Street #2 0 Survey response 40 Alberto's Trucking 2826 Myrtle Street 0 Survey response 41 Stockmyer Trucking 2799 Wood Street 0 Survey response 42 Subterranean Wine Storage 2240 Filbert Street # J 0 Survey response 43 Mason Dickson Intermodal 1724 Mandela Parkway 0 Observations 44 REM Transportation 418 3rd Street 0 Observations 45 Lange Trucking Inc. 2226 Campbell Street LA** 46 Eighteen Trucking 2230 Willow Street LA** 47 Bridge Terminal Transport 445 9th Avenue LA**
48 Modern Express & Courier Service
2525 Mandela Parkway LA**
49 Box Brothers 1001 24th Street LA** 50 Reliable Transportation Service 2799 Wood Street LA** 51 A V Trucking Co. 1155 3rd Street # 300 LA** 52 S Line Transportation Inc. 780 W Grand Avenue # B LA** 53 Sutter Transportation Inc. 780 W Grand Avenue LA** 54 Access Plastics 1301 24th Street LA** 55 American Road Lines 1155 3rd Street LA** 56 Team One 2515 Magnolia Street LA** Total Truck Trips Per Day 3175
1. Includes emissions from trucking companies that have Port associated business (e.g., OMSS). * Additional businesses evaluated outside STI contract. ** Low activity site.
b. Location/Area of Emissions
Figure 6 identifies the location of trucking-based business in and adjacent to the West Oakland community.
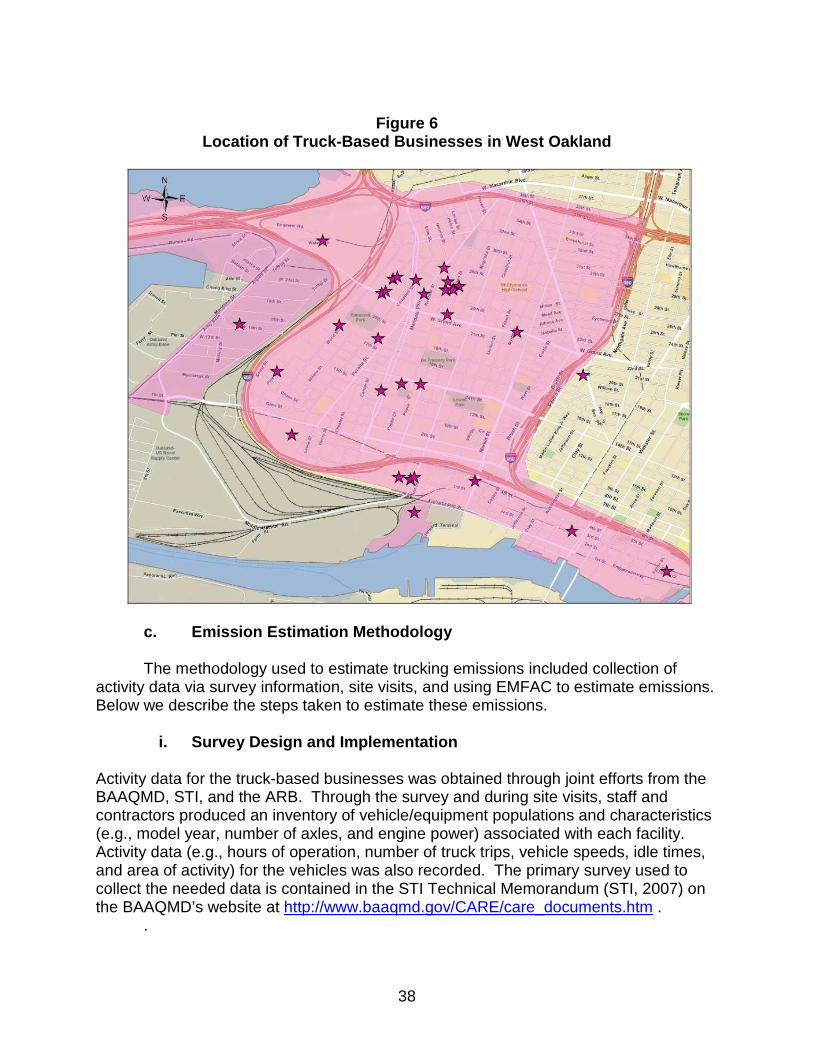
38
Figure 6
Location of Truck-Based Businesses in West Oakland
c. Emission Estimation Methodology The methodology used to estimate trucking emissions included collection of activity data via survey information, site visits, and using EMFAC to estimate emissions. Below we describe the steps taken to estimate these emissions.
i. Survey Design and Implementation
Activity data for the truck-based businesses was obtained through joint efforts from the BAAQMD, STI, and the ARB. Through the survey and during site visits, staff and contractors produced an inventory of vehicle/equipment populations and characteristics (e.g., model year, number of axles, and engine power) associated with each facility. Activity data (e.g., hours of operation, number of truck trips, vehicle speeds, idle times, and area of activity) for the vehicles was also recorded. The primary survey used to collect the needed data is contained in the STI Technical Memorandum (STI, 2007) on the BAAQMD’s website at http://www.baaqmd.gov/CARE/care_documents.htm .
.

39
The following methodology was used by STI to collect information and estimate emissions from diesel trucks or buses at all truck-based businesses. Similar collection methods and emissions estimates were completed by ARB staff for the Amtrak Maintenance Facility, Cable Moore, Compass Container, and Schnitzer Steel. More detailed information for the methods and complete activity data used by STI to estimate emissions from on-road truck activities at truck-based businesses in and adjacent to West Oakland is contained in the STI Technical Memorandum (STI, 2007) on the BAAQMD’s website at http://www.baaqmd.gov/CARE/care documents.htm .
STI identified the types of activity data required to estimate emissions from
on-road diesel sources (truck movement, truck idling, and transportation refrigeration units [TRUs]) operating at truck-based businesses in West Oakland. The required data included the following information.
• Numbers of daily truck trips, including the number of trucks with TRUs;
• Truck sizes (number of axles) and model years;
• Average distance traveled by trucks on-site;
• Average truck idle times and TRU run times (per visit); and
• Operating characteristics of diesel equipment (hours per day, days per week, etc.).
STI distributed the survey to each of the 52 sites listed in Table 21. Approximately half the sites were visited in person by STI and District staff over a two-day period, with survey forms distributed by hand. Forms were distributed by fax to the remaining sites after an initial telephone contact. Ultimately, survey forms were provided to all but five facilities. Two of the businesses (Mason Dickson Intermodal and REM Transportation) had closed or moved out of the area. STI and the BAAQMD were unable to contact the remaining three businesses (Access Plastics, American Road Lines, and Team One) within the time constraints of the study.
Twenty-four businesses responded to the survey, either by returning a completed form or by providing a verbal activity estimate when contacted by phone. For businesses that did not respond to the survey, truck activity was estimated. At nine facilities, truck activity was estimated based on findings from an earlier study (Harding, 2001). At five other facilities, truck activity was estimated based on observations made during a site visit. Of the remaining 14 facilities, it was determined that two businesses had closed or relocated out of the area and that the other 12 businesses were likely to be low-activity sites. In all, truck activities at 40 sites were accounted for, or 77 percent of the total population of truck-based businesses. A summary of the survey data and how the data was collected is shown in Table 21.
Total daily truck activities at truck-based businesses in West Oakland were estimated to be 3,175 trips per day. Of those, 2,937 trips were from the 52 facilities STI covered, and 238 were from the four additional facilities. This total is about 20 percent higher than the 2,491 truck trips per day that were estimated for 2001 (Harding, 2001).
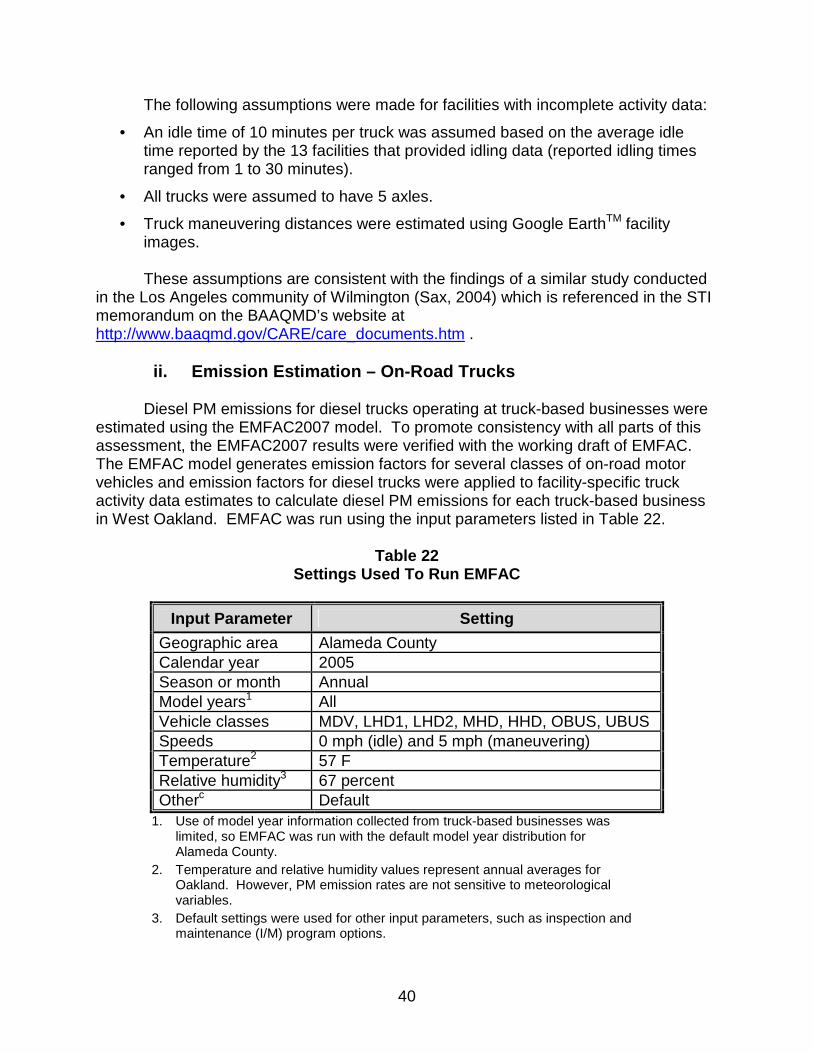
40
The following assumptions were made for facilities with incomplete activity data:
• An idle time of 10 minutes per truck was assumed based on the average idle time reported by the 13 facilities that provided idling data (reported idling times ranged from 1 to 30 minutes).
• All trucks were assumed to have 5 axles.
• Truck maneuvering distances were estimated using Google EarthTM facility images. These assumptions are consistent with the findings of a similar study conducted
in the Los Angeles community of Wilmington (Sax, 2004) which is referenced in the STI memorandum on the BAAQMD’s website at http://www.baaqmd.gov/CARE/care_documents.htm .
ii. Emission Estimation – On-Road Trucks
Diesel PM emissions for diesel trucks operating at truck-based businesses were
estimated using the EMFAC2007 model. To promote consistency with all parts of this assessment, the EMFAC2007 results were verified with the working draft of EMFAC. The EMFAC model generates emission factors for several classes of on-road motor vehicles and emission factors for diesel trucks were applied to facility-specific truck activity data estimates to calculate diesel PM emissions for each truck-based business in West Oakland. EMFAC was run using the input parameters listed in Table 22.
Table 22
Settings Used To Run EMFAC
Input Parameter Setting
Geographic area Alameda County Calendar year 2005 Season or month Annual Model years1 All Vehicle classes MDV, LHD1, LHD2, MHD, HHD, OBUS, UBUS Speeds 0 mph (idle) and 5 mph (maneuvering) Temperature2 57 F Relative humidity3 67 percent Otherc Default
1. Use of model year information collected from truck-based businesses was limited, so EMFAC was run with the default model year distribution for Alameda County.
2. Temperature and relative humidity values represent annual averages for Oakland. However, PM emission rates are not sensitive to meteorological variables.
3. Default settings were used for other input parameters, such as inspection and maintenance (I/M) program options.

41
For ease of reporting during the survey, truck-based businesses were asked to provide activity data for trucks according to the number of axles; however, EMFAC generates truck emission factors according to a gross vehicle weight (GVW) classification scheme. Data from a goods movement study in Southern California (VRPA Technologies, 2002) were used to convert weight-based emission factors from EMFAC into axle-based emission factors. Table 23 shows the final emission factors by axle category for truck idling and maneuvering (5 mph).
Table 23
Truck and Bus Emission Factors
Weighted Diesel PM Emission Factors
Axles Idle
(grams/hour) 5 mph
(grams/mile) 2 1.172 0.850 3 2.664 3.379 4 2.880 3.752 5 2.934 3.839
6+ 2.934 3.839 Bus 1.373 1.029
The emission factors in Table 23 were applied to activity data collected from
truck-based businesses to estimate PM emissions from on-road trucks. For example, Roadway Express reported an average of 25 truck trips per day (24 two-axle trucks and one three-axle truck). All trucks idle on-site for an average of 5 minutes and have an on-site travel distance of 0.25 miles. Truck emissions for this business were calculated as follows:
Idle: PM2-axle = 1.172 grams/hour x 60
5 hour/truck x 24 trucks/day =
2.34 grams/day (g/day)
PM3-axle = 2.664 g/hr x 60
5 hr/truck x 1 truck/day = 0.22 g/day
Maneuvering: PM2-axle = 0.850 grams/mile x 0.25 miles/truck x 24 trucks/day = 5.10 grams/day
PM3-axle = 3.379 g/mi x 0.25 mi/truck x 1 trucks/day = 0.84 g/day These calculations resulted in a total diesel PM (idle plus maneuvering) estimate
of 8.5 grams/day from diesel trucks at this facility, and similar calculations were performed for all other truck-based businesses.

42
Similar calculations were performed for other truck-based businesses in West Oakland. A listing of activity data and emission factors used by STI to estimate emissions from truck-based businesses in West Oakland, and TRU emissions by facility are provided in the STI Technical Memorandum (STI, 2007).
For Cable Moore, Compass Container, and Schnitzer Steel, ARB staff used a similar approach to estimate emissions to those just discussed. The only variation is it was assumed all trucks at these three facilities were idling while within the facility and all trucks are Heavy-Heavy-Duty Diesel Trucks (HHDDT) as defined in Section 2. The emission factor that was used for HHDDT is 2.932 grams/hour (EMFAC Working Draft).
The PM emissions from the on-road diesel trucks operating within truck-based
businesses in West Oakland were estimated to be approximately 2 tons per year. Of that total, approximately 1.9 tons per year were from the business evaluated by STI. For the facilities evaluated by ARB staff, approximately 0.1 ton per year of diesel emissions were estimated from Schnitzer Steel and Compass Container. The trucking emissions at Cable Moore were evaluated and determined to be already accounted for by the evaluation for Section 2, Freeways and Roadways, since trucks do not enter that facility. Trucking within Amtrak’s Oakland Maintenance Facility was not included in the calculation since those trucks do not idle while within the facility. See the STI report on the BAAQMD’s website at http://www.baaqmd.gov/CARE/care_documents.htm for a listing of estimated emissions from truck-based businesses that were evaluated by STI in West Oakland.
iii. Emission Estimation – Transport Refrigeration Unit (TRUs)
For TRUs installed on on-road trucks and for off-road equipment (such as yard
tractors and loaders) operated at truck-based businesses, emission estimates were prepared using activity data collected from individual businesses and emission factors from ARB’s OFFROAD model. The OFFROAD model generates county-level emission estimates for various types of off-road equipment based on California-specific data on equipment populations and usage patterns. The OFFROAD model also utilizes emission factors that are specific to a given equipment type, fuel type, and horsepower range and are expressed in units of grams per brake horsepower hour (g/bhp-hr). These emission factors represent new engine emissions and are adjusted within the model to account for engine deterioration that occurs with use, resulting in increasing hourly emission rates. Emissions for a specific equipment type are then calculated according to the following equation:

43
PM = PMEF x HRS x HP x LF
where:
PM = Total PM emissions from the equipment population at the specified horsepower and model-year range (grams/day)
PMEF = deterioration-adjusted PM emission factor for the specified horsepower and model-year range (grams/horse power-hour or g/hp-hr)
HRS = the aggregate daily hours of operation for the total equipment population (default values included in the OFFROAD model)
HP = average engine horsepower for the specified horsepower range
LF = average engine load factor (default values included in the OFFROAD model)
For TRUs, no data were available for model years or engine sizes, so STI ran the
OFFROAD model for Alameda County for the year 2005 using default input parameters and analyzed the resulting model outputs to identify the most likely engine size bin for TRUs operating in West Oakland. Table 24 shows how the OFFROAD model output data were weighted to calculate an average horsepower value of 31 hp for TRUs in Alameda County.
Because this fleet average value falls within the OFFROAD models largest
horsepower bin for TRU (26-50 hp), output emission rates for that range were used to calculate a fleet average PM emission factor. This calculation was performed as follows:
PMEF = 105,233.4 grams per day / (34 hp x 0.53 x 7281.7 hrs) = 0.80 g/hp-hr
where:
105,233.4 g/day = PM emissions for Alameda County TRUs in the 26-50 hp range
34 hp = average engine horsepower for TRUs in the 26-50 hp range
0.53 = average engine load factor for TRUs in the 26-50 hp range
7281.7 hrs = total daily hours of operation in Alameda County for TRUs in the 26-50 hp range
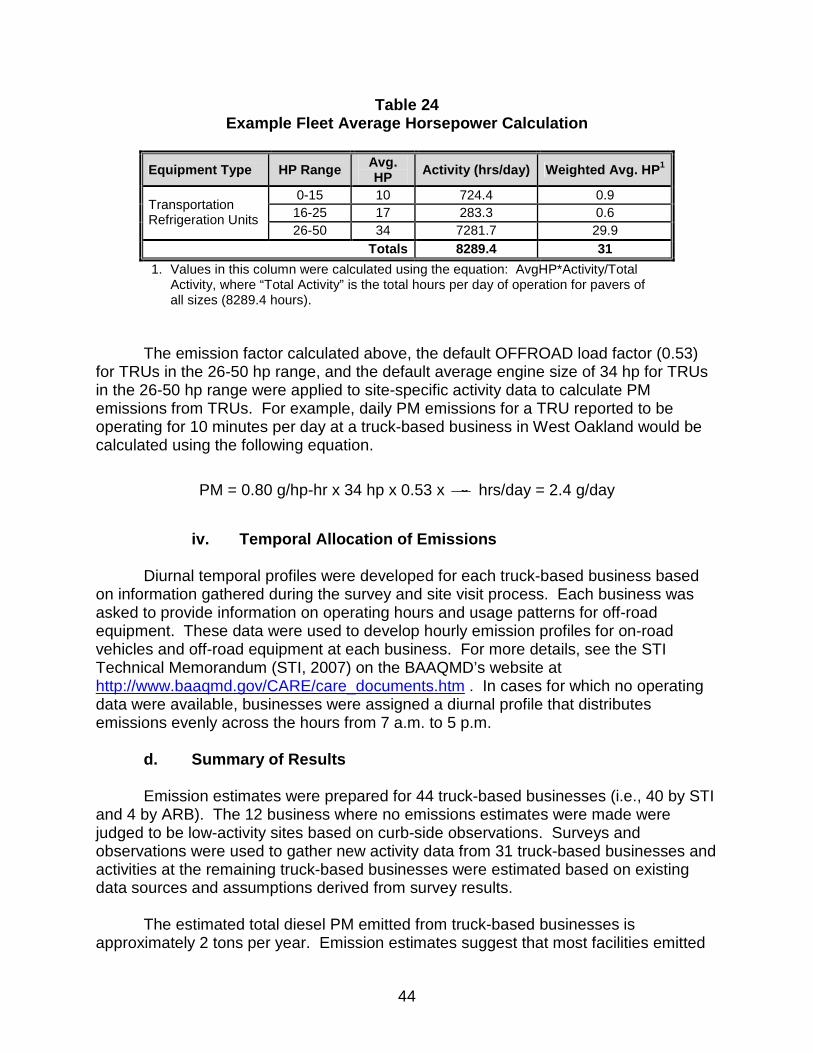
44
Table 24 Example Fleet Average Horsepower Calculation
Equipment Type HP Range Avg. HP Activity (hrs/day) Weighted Avg. HP 1
0-15 10 724.4 0.9 16-25 17 283.3 0.6
Transportation Refrigeration Units
26-50 34 7281.7 29.9 Totals 8289.4 31
1. Values in this column were calculated using the equation: AvgHP*Activity/Total Activity, where “Total Activity” is the total hours per day of operation for pavers of all sizes (8289.4 hours).
The emission factor calculated above, the default OFFROAD load factor (0.53)
for TRUs in the 26-50 hp range, and the default average engine size of 34 hp for TRUs in the 26-50 hp range were applied to site-specific activity data to calculate PM emissions from TRUs. For example, daily PM emissions for a TRU reported to be operating for 10 minutes per day at a truck-based business in West Oakland would be calculated using the following equation.
PM = 0.80 g/hp-hr x 34 hp x 0.53 x 6 01 0
hrs/day = 2.4 g/day
iv. Temporal Allocation of Emissions
Diurnal temporal profiles were developed for each truck-based business based
on information gathered during the survey and site visit process. Each business was asked to provide information on operating hours and usage patterns for off-road equipment. These data were used to develop hourly emission profiles for on-road vehicles and off-road equipment at each business. For more details, see the STI Technical Memorandum (STI, 2007) on the BAAQMD’s website at http://www.baaqmd.gov/CARE/care_documents.htm . In cases for which no operating data were available, businesses were assigned a diurnal profile that distributes emissions evenly across the hours from 7 a.m. to 5 p.m.
d. Summary of Results Emission estimates were prepared for 44 truck-based businesses (i.e., 40 by STI
and 4 by ARB). The 12 business where no emissions estimates were made were judged to be low-activity sites based on curb-side observations. Surveys and observations were used to gather new activity data from 31 truck-based businesses and activities at the remaining truck-based businesses were estimated based on existing data sources and assumptions derived from survey results.
The estimated total diesel PM emitted from truck-based businesses is
approximately 2 tons per year. Emission estimates suggest that most facilities emitted

45
fewer than 0.01 tons per year of diesel PM. The sites with the most trips and emissions were the US Postal Service (1,034 trips and 0.38 tons per year) and Oakland Maritime Support Services or OMSS (1,250 trips and 1.4 tons per year). While it is uncertain whether the diesel PM emissions at many of the distribution facilities are related to Port activities, the trucking emissions associated with OMSS can be linked to business activities at the Port of Oakland. Therefore, the emissions from OMSS are grouped with the emission associated with Port-related activities (Part I). The estimated total diesel PM emitted from truck-based businesses after subtracting emissions from OMSS is approximately 0.6 tons per year.
e. Limitations
For diesel emissions within truck-based businesses and distribution centers,
priority was given to those sites that were determined to have the greatest activity and the greatest emissions. Efforts were made to accurately characterize emissions from these businesses. Study participants attempted to estimate emissions from all truck-based business in West Oakland. However due to limited time and resources, it must be acknowledged that some on-site truck activity may have been overlooked. For example, we did not get a completed survey from Access Plastics located at 1301 - 24th St., Oakland, 94607. STI spent several hours at that facility on one of the field observation days, but never saw any trucks coming or going. Based on these observations it was decided to treat them as a "low activity/unknown site" (Table 21). A completed survey or more extensive observations could reveal activity at this facility.
During the development of emissions estimates from truck-based businesses it became clear that the on-site emissions were small in comparison to the on-road emissions estimated in Section B.3. Therefore, future efforts should focus on collecting more detailed data on diesel truck traffic patterns and idling in West Oakland. Air District and STI survey results (STI, 2007) suggested that nearly 3,000 diesel trucks are being operated in West Oakland on a given weekday, but emission estimates from that study were limited to idling and maneuvering activities occurring at truck-based businesses and distribution centers. These truck trip data could be used to identify potential high-traffic areas in the neighborhood where additional data collection efforts could be undertaken to refine existing estimates of emissions from on-road diesel truck traffic.

46
5. Facilities with Diesel–Powered Cargo Handling Eq uipment a. Description of Source Category
The facilities that are included in this category are primarily associated with the trucking-based business and distribution centers included in Section B-4 of this appendix. Additional facilities were included based on input from community representatives. These sources typically have equipment such as fork lifts and yard tractors. However, some of the sources have additional diesel-powered equipment that is unique to their operations. The operations at these facilities typically include material or cargo transport and the storage of material, equipment, or transport containers.
b. Location/Area of Emissions Figure 7 show the locations of facilities with emissions included in this category. Those facilities include Cable Moore, Compass Container, East Bay Resources, Mutual Express, Port Maintenance Facility, Roadway Express, and Schnitzer Steel.
Figure 7 Facilities with Diesel-Powered Cargo Handling Equip ment
c. Emission Estimation Methodology

47
The methodology used to estimate emissions included survey information and
site visits. This data was obtained through joint efforts from the BAAQMD, STI, and the ARB. Through the survey and during site visits, staff and contractors identified the type of equipment used at each site, including where and how it is used. The primary survey used to collect the needed data is contained in the STI Technical Memorandum (STI, 2007) on the BAAQMD’s website at http://www.baaqmd.gov/CARE/care documents.htm . Equipment and activity information for Schnitzer Steel was obtained from reporting requirements under the Regulation for Mobile Cargo Handling Equipment at Ports and Intermodal Rail Yards (2006). The information provided under this reporting requirement is covered by confidentiality provisions of that regulation; therefore, the detailed equipment and activity data for Schnitzer Steel have been kept confidential in this document.
The following methodology was used by STI for the off-road equipment at all truck-based businesses in West Oakland. STI ran the OFFROAD model using Alameda County data for the year 2005 using default input parameters and the “by model year” output option, producing annual emission rates by equipment type, horsepower range, and model year. STI then calculated deterioration-adjusted PM emission factors for equipment types and model years operating at truck-based businesses in West Oakland from the OFFROAD’s model year-specific outputs. For example, Roadway Express reported the operation of two 200-hp yard tractors—a 1996 model and a 1994 model. The deterioration-adjusted PM emission factor for the 1996 tractor was calculated from the OFFROAD model outputs as follows:
PMEF (Diesel PM Emission Factor) = 92.53 grams/day (g/day) / (249 hp x 0.55 x 3.35 hrs) = 0.20 grams/horsepower-hour (g/hp-hr)
where:
92.53 grams/day =PM emissions for Alameda County tractors of model year 1996 in the 176-250 hp range
249 hp = average engine horsepower for tractors in the 176-250 hp range
0.55 = average engine load factor for tractors in the 176-250 hp range
3.35 hrs = total daily hours of operation in Alameda County for tractors of model year 1996 in the 176-250 hp range
To calculate PM emissions, this emission factor and the default OFFROAD load factor (0.55) were then applied to activity data for this yard tractor collected from Roadway Express:
PM = 0.20 g/hp-hr x 200 hp x 0.55 x 8.8 hrs/day = 194 grams/day

48
Similar calculations were performed for other pieces of off-road equipment operating at truck-based businesses in West Oakland. A listing of activity data and emission factors used by STI to estimate emissions from off-road equipment operating at truck-based businesses in West Oakland, and TRU/off-road emissions by facility are provided in the STI Technical Memorandum (STI, 2007) on the BAAQMD’s website at http://www.baaqmd.gov/CARE/care_documents.htm .
For Cable Moore, Compass Container, and Schnitzer Steel, the ARB used a similar approach to estimate emissions to those just discussed. The only variation is a slight difference in deterioration. Table 25 lists the equipment reported for Cable Moore and Compass Container. As mentioned above, equipment information from Schnitzer Steel does not appear in this document due to confidentiality provisions of the Cargo Handling Regulation.
Table 25
Diesel-Powered Off-Road Equipment Information 1
Facility Name
Equipment Type
Number of
Pieces HP2 Engine
Year
Days Operated Per Week
Operated Avg. Hours
Per Day Cable Moore
Fork Lift 1 100 1983 5 1
Material Handling
2 180 1978 5 3.5
Fork Lifts 2 130 1982 and 1998
5 3 Compass Container
Yard Tractor Off-road Engine
1 225 1991 5 3
1. Facilities operate 52 weeks per year. 2. HP is the abbreviation for horsepower.
For the Port Maintenance Facility (PMF), an equipment list was provided by the
Port showing harbor-related maintenance equipment used in 2006. The types of equipment stored at the PMF are listed in Table 26. To calculate the potential emissions from this source, all equipment was assumed to be present in 2005 and that it averages 100 horsepower (hp). Other assumptions include a total diesel fuel usage of 8,634 gallons with a usage of 10 gallons per hour and an emission factor of 0.5 grams PM/HP-hour.

49
Table 26 Diesel-Powered Equipment at the Port Maintenance Fa cility 1
Year Make Model Description 1994 FORD TRUCK - 1 TON UTILITY VAN 1987 LCM6 BOAT - MIKE BOAT (MIC) 50
LINCOLN PORTABLE WELDER DC-225-3-AS 2000 STERLING TRUCK - 10 YARD DUMP TRUCK 1997 FORD TRUCK - 10 YARD DUMP TRUCK 1986 GMC TRUCK - 1 TON WKVN VAN 1988 GMC PICKUP - CREW CAB 1999 STERLING CRANE TRUCK 1999 FREIGHTLINER ALTEC TRUCK - DERRICK BOOM 45' 2001 VERSALIFT VST 240-I AERIAL VERSALIFT 45'
1997 FORD TRUCK - AERIAL WORK PLATFORM & CRANE
2000 INGERSOLL-RA P185WSD AIR COMPRESSOR 1994 YALE FORK LIFT 6000LB 1993 CATERPILLAR 426B BACKHOE 2006 INGERSOLL-RA LIGHT SOURCE LIGHT TOWER 2006 JOHN DEERE 210LE JOHN DEERE LANDSCAPE LOADER 2006 DAEWOO D70S DAEWOO FORKLIFT 2006 MQ DF2400V PORTABLE GENERATOR 220KVA 2007 KOMATSU FD30T-16 KOMATSU 600LB FORK LIFT
2004 FREIGHTLINER FL70 TRUCK - ELGIN BROOM BEAR SWEEPER
2001 LINDE LINDE FORK LIFT - 15000 LB 2001 BUTTERWORTH LIQUIBLASTER 10,000 PSI PRESSURE WASHER
2001 GMC SIERRA 3500 TRUCK - 1 TON WITH TRASH COMPACTOR
2003 CATERPILLAR 420D IT BACKHOE LOADER 2003 ISUZU TYMCO 453 SWEEPER 2004 GMC SIERRA 3500 TRUCK - 1 TON 2003 FREIGHTLINER FL80 TRUCK - WATER TRUCK 2000 NSTC P/O 99/20 PRESSURE WASHER UNIT 2000 INGERSOLL-RA AIR COMPRESSOR 1999 INGERSOLL-RA DK-32 ROLLER 2000 FORD ASPHALT PATCHER 2001 FORD F550 TRUCK - AERIAL VERSALIFT 1. All equipment assumed to be diesel powered and operating for 863 total hours. Blank columns
reflect missing data.

50
i. Temporal Allocation of Emissions
Each business was asked to provide information on operating hours and usage patterns for off-road equipment. This data was used to develop hourly emission profiles for off-road equipment at each business. An example can be found in STI Technical Memorandum (STI, 2007) on the BAAQMD’s website at http://www.baaqmd.gov/CARE/care_documents.htm . In cases where no operating data were available, businesses were assigned a diurnal profile that distributes emissions evenly across the hours from 7 a.m. to 5 p.m.
d. Summary of Results Table 27 lists the estimated total diesel PM emitted from all seven facilities with
miscellaneous cargo handling equipment at approximately 4.3 tons per year. Of these emissions, the Port Maintenance Facility contributes approximately 1 percent (0.05 tons per year of diesel PM). These emissions are Port-related.
Table 27
Diesel PM Emissions (tons per year) for Facilities with Diesel-Powered Cargo Handling Equipment 1
Facility Diesel PM
Emissions (tpy 2) Schnitzer Steel 3.7
Compass Container 0.3 Port Maintenance
Facility 3 0.05
Cable Moore 0.01 East Bay Resources 0.03
Mutual Express 0.02 Roadway Express 0.2
Total 4.3 1. Numbers are rounded. 2. tpy = tons per year. 3. Port-related emissions.
51
6. Locomotive Movement (Off-Port and Off-UP Rail Ya rd) within West Oakland a. Description of Source Category
This section focuses on the emissions from locomotives as they travel from the boundaries of the BNSF and UP rail yards to the edge of the West Oakland community and Amtrak trains traveling through the West Oakland community. There are two freight train rail yards in West Oakland. These are the Oakland International Gateway (OIG) operated by Burlington Northern and Santa Fe (BNSF) located within the Port boundary and the Union Pacific Oakland yard which is adjacent to OIG outside of the Port boundary. In addition, California Amtrak shares the tracks with freight trains and provides passenger/commuter train services at Jack London Square Station which is located at Second and Alice Streets. Amtrak also operates a maintenance facility to service the Amtrak locomotive fleet. The activities within the Port (BNSF) and UP Oakland rail yard boundaries are included in the emission calculations in Parts I and II, respectively. The emissions from activities within Amtrak’s Oakland Maintenance Facility are addressed in Section B-7.
b. Location/Area of Emissions The main line within West Oakland’s boundary is shown in Figure 8. All train activities on this main line, outside of all Port and UP rail property, are included in this inventory assessment. In addition, all Amtrak locomotive activity on this line is included. Locomotive emissions are estimated by track section based on the locomotive activities provided by BNSF, UP, and Amtrak. See Table 28 for a legend identifying the track sections in Figure 8.

52
Figure 8 Main Rail Line for the BNSF, UP, and Amtrak Trains in West Oakland
Note: Letters correspond to track section legend shown in Table 27. Boundary marks (slashes) for the track sections are approximate.
c. Emission Estimation Methodology
Emissions are estimated as the product of the train population, emission factor by notch setting, and hours of activity within each notch setting. Annual Emissions = ∑L,M,N (PopL) x (EFM) x (HrsN) Where:
PopL = annual number of locomotives or other diesel-fueled engines by engine model
EFM = emission factor in a specific notch setting or percent load in grams/hour by engine model

53
HrsN = annual activity in a specific notch setting or percent load in hours/year by engine model
Table 28 shows the track sections and sources covered in this assessment.
More detailed descriptions of the population, emission factors, and activity are presented in the Data Collection section below.
Table 28
Locomotive Emission Sources by Track Section
Track ID Legend 1
Track Section Emission Sources
A North of UP boundary to West Oakland boundary
BNSF, UP, Amtrak
B2 UP boundary (north) to split to OIG
BNSF, Amtrak head end power
C Track Section to OIG BNSF D2
Split to OIG to UP boundary (east)
Amtrak head end power, Amtrak trips between Jack London Square (OKJ) station and the maintenance facility
E UP boundary (east) to West Oakland boundary
UP, Amtrak (including idling at OJK station)
1. See Figure 8 for track identification notes. 2. Emissions from UP train traffic on track sections B and D are included in the Part II emission
estimates.
i. Data Collection
a). Amtrak There are three Amtrak train routes that travel on the main tracks through the West Oakland domain and stop at Jack London Square (OKJ) station in Oakland. These train routes include the Capitol Corridor, Coast Starlight, and the San Joaquin trains. Table 29 shows the number of trains for each of these routes for calendar year 2005.
After the OKJ station, these trains travel to Amtrak’s Oakland Maintenance Facility (OMF) for cleaning, maintenance, and refueling. These trains come into the OMF from the east end. Other trains that come to the OMF to fuel include the Zephyr and Reno Snow trains, which terminate at the Emeryville Station. The Zephyrs and Reno Snow trains leave the OMF from the west end and travel back to Emeryville, while all other trains exit from the east end and travel back to Jack London Square.

54
Table 29 Number of Amtrak Trains by Route That Stopped at th e
Jack London Square Station in 2005
Route Weekday Weekend/Holiday Capitol Corridor 24 18 Coast Starlight 2 2 San Joaquins 8 8
Capitol Corridor and the San Joaquin trains are pulled by one single locomotive. There are 17 locomotives in the fleets for the Capitol Corridor and San Joaquins. Of these 17 locomotives, 15 are General Motors Electromotive Division (EMD) F59PHI and two are General Electric Transportation Systems (GE) DASH 8. As described in Section B-7, the main engines on the GE DASH 8 provides head end power (HEP) while a Caterpillar 3412C provides the HEP for EMD F59 PHI. Amtrak’s Coast Starlight, Zephyr, and Reno snow trains are pulled by two GE P-42DC locomotives. The HEP for these Amtrak trains are provided by one of the locomotives operating at a notch 6 setting. Table 30 shows the annual number of trains visiting the OMF. Appendix A contains the emission factors for the locomotives and head end power engine.
Table 30 Annual Number of Trains That Came to
Amtrak’s Oakland Maintenance Facility in 2005
Route Number of Trains Capitol Corridor 2365 San Joaquins 1460 Zephyr 365 Reno Snow Trains1 26 Total Trains 1 4216 1. Total number of locomotives is 4607 since the
Reno Snow trains and Zephyr have two locomotives.
The emissions from the UP Oakland rail yard in Part II include Amtrak trains traveling on the main line next to the rail yard as part of the through trains. However, the UP inventory only reflects the emissions from power required to move the train, and not the “head end power” required to provide power for lighting and air conditioning. Therefore, the emissions from head end power were added into the Part III inventory. For emissions from head end power (HEP), the emission factor for the HEP engine was used, or, when the power was supplied by the main engine, the differences of notch settings between “with and without HEP” was used.

55
Idling time at the Jack London Square station was estimated based on the Amtrak 2005 timetable. Based on information provided by Amtrak, trains originating or terminating at the OKJ station idled at the station for 10 minutes. For train activities not captured as part of UP through trains, such as trains entering Amtrak’s Oakland Maintenance Facility (OMF) from the station, staff assumed the train moved at an average speed of 15 mph, and at 13 percent notch 8, and 87 percent notch 2, based on information provided by Amtrak.
b). Union Pacific
The train counts presented in the UP rail yard emissions inventory (Part II) covered train activities coming into and passing through the UP rail yard. In 2005, UP reported there were 13,411 through trains (including Amtrak passenger trains) that passed through the UP rail yard. Of the trains that came into and stopped at the UP rail yard, 1,332 arrived to or departed from the north end of UP rail yard, and 4,037 arrived to or departed from the east end of UP rail yard. In addition to UP’s freight train activities; the UP Oakland inventory in Part II also includes Amtrak trains traveling on the main line next to the UP rail yard as through train. The activity data and diesel PM emission factors used for the UP-related inventory in Part III were provided by Union Pacific (Sierra Research, 2006). For Part III, UP activities and emissions were extended from the edge of the rail yard to the edge of the West Oakland community. Table 31 shows the fleet average emission factors for diesel PM.
Table 31 UP Oakland Diesel PM Emission Factors
Diesel PM Emission
Factor (grams/hour per
locomotive)
Fleet Average Emission Factors at
Notch Settings Notch 2 Notch 3
Thru Trains and Power Moves
111.7 210.6
Intermodal Trains 119.7 222.1
Other Trains and Power Moves
116.5 224.0

56
c). BNSF There were 2,190 locomotives in the BNSF/OIG yard in 2005. All trains in BNSF/OIG arrive/depart through same track north of the UP yard and travel to the BNSF Richmond yard. The activity data and emission factors for BNSF/OIG were provided by BNSF and detailed in Part I. See the Port’s website at http://www.portofoakland.com/environm/airEmissions.asp for documents discussing these emission estimates. For Part III, the BNSF related inventory is using the same activity and emission factors. The activity is extended to the rail line outside of the Port (BNSF) property to the edge of the West Oakland community.
ii. Major Assumptions
a). UP and OIG have captured all the train activities coming into the rail yards and passing through the main line.
b). Speed and notch settings
For the through trains in UP Oakland inventory, the trains continued to travel at 25 mph at notch 3. For Amtrak trains traveling between the stations and the maintenance facility, they traveled at 13 percent notch 8 and 87 percent notch 2 based on information provided by Amtrak, and at an average speed of 15 mph. All other trains traveled at 50 percent notch 2, and 50 percent notch 3, at an average speed of 15 mph.
c). Idling time at Jack London Square (OKJ) station
For trains stopping at the OKJ, the idling time was estimated based on the time table. For trains originating or terminating at OKJ, staff assumed 10 minutes idling based on information provided by Amtrak.
d. Summary of Results Table 32 lists the total diesel PM emissions from all Part III associated train
movement within the West Oakland domain at 1.32 tpy of diesel PM emissions. Of these emissions, the movement of UP, BNSF and Amtrak trains constitute approximately 27.5, 8.5, and 64 percent of the diesel PM emissions from train movement, respectively. Table 32 also presents the results by track section. Approximately 75 percent of the emissions from train movement are estimated to take place on track section “E” between the eastern UP boundary and the West Oakland boundary. This track length includes emissions activity at the OKJ station.

57
Table 32 Locomotive Emission by Track Section (tons per year )
Track
Section ID 1
Track Section Emission Sources
Diesel PM (tpy 2)
A
North of UP boundary to
West Oakland boundary
BNSF, UP,
AMTRAK 0.07
B3 UP boundary (north) to split
to OIG
BNSF, AMTRAK head end
power
0.10
C Track Section
to OIG BNSF 0.03
D3
UP Mainline from Split to OIG to UP boundary
(east)
AMTRAK head end
power, AMTRAK
trips between Jack London Square (OKJ)
station and the
maintenance facility
0.14
E
UP boundary (east) to West
Oakland boundary
UP, AMTRAK (including
idling at OJK station)
0.98
Total 1.32 1. See Figure 8 and Table 27 for additional information. 2. tpy = tons per year. 3. Emissions from UP train traffic on track sections B and D are
included in the Part II emission estimates. For more information, see Appendix C of the Preliminary Summary of Results.
58
7. Amtrak’s Oakland Maintenance Facility a. Description of Source Category The Amtrak Oakland Maintenance Facility (OMF) covers 22 acres and is
comprised of two main structures, specifically, a 50,000 sq. ft. maintenance shop and a 70,000 sq. ft. service and inspection building. The site also features storage tracks, a “Y” for train turning, and a new train car wash capable of washing a 500-foot train in less than three minutes (Amtrak, 2004).
The maintenance shop features two locomotive repair tracks with a 10-ton overhead crane, a two-coach repair track with 7-ton crane, a 100-ton drop table with 30-ton overhead crane, a wheel truing shop and a materials control warehouse. As of 2004, this building allows overhauls previously done in Los Angeles and Chicago to be conducted in Oakland. Regular periodic maintenance is conducted on 17 locomotives and 78 passenger cars.
The service and inspection building is highlighted by a 1,400 foot full length underbody pit track for train inspection, plus an additional service track for at-grade train inspection, equipment to fuel multiple locomotives, sand, lubricate and water during car servicing.
Locomotives and coaches to be overhauled, maintained, and serviced will primarily come from two of Amtrak’s regional California services – the Capitol Corridor trains connecting Sacramento and the Bay Area and the San Joaquins that connect the Bay Area, Sacramento, and Central Valley cities. In addition, Amtrak provides a weekly Fun and Snow train to Reno for a 13-week period from January through March. These locomotives and coaches receive service, inspection, and unscheduled maintenance at the OMF.
b. Location/Area of Emissions Amtrak’s Oakland Maintenance Facility (OMF) is located at 1303 3rd Street. See Figure 9 for a map illustrating the facility location in West Oakland.

59
Figure 9 Location of Amtrak’s Oakland Maintenance Facility ( OMF)
c. Emission Estimation Methodology
i. Emissions Calculation Methodology
The OMF locomotive activity and population were developed from Oakland’s Jack London Square (OKJ) station arrival and departure train schedule for 2005. We assumed all locomotives, except those engines that operate the California Zephyr trains, receive routine service and inspection and scheduled or unscheduled maintenance at the OMF. The California Zephyr locomotives are serviced in Chicago, Illinois. A simplified equation representing the emissions calculation is provided followed by a brief description of the methodology used to quantify the data used as key inputs:

60
Annual Emissions by pollutant = ∑ (PopL) X (EFM) x (HrsN)
L = annual number of locomotives or other diesel-fueled engines by engine model
M = notch setting for locomotives or percent load in other engines N = annual activity for locomotive or other diesel-fueled engines
• Locomotive Population: The populations of locomotives were compiled from the
weekly (Monday through Friday) and weekend (Saturday and Sunday) Amtrak train schedules for the Capitol Corridor and the San Joaquins. The locomotive population also included the daily California Zephyr and the Reno Snow and Fun trains that operate during the months of January through March for 13 weeks in any given year. ARB staff estimated 4,607 locomotives are serviced at the OMF based on Amtrak’s 2005 train schedule.
• Activity: Activities under evaluation were the movements, idling, or pre or post
maintenance testing of trains or locomotives, including switching activities within the OMF. Movement is quantified by throttle notch setting and time spent in each notch, idling is a function of duration of event, and locomotive maintenance events were categorized within five types of standardized testing practices. Depending on the type of maintenance (scheduled or unscheduled), testing may include a pre- and/or post-test, and/or a diagnostic or load test. The notch setting, and time spent in each notch varies depending on the type of maintenance performed. The annual hours of operation for the “other diesel-fueled engines” and for locomotives by activity and location were provided by Amtrak staff that work at the OMF.
• Emission Factors: The emission rate for each locomotive is dependent on the
locomotive model and activity the locomotive is engaged in (movement, idling, or maintenance testing). The emission factors (EFs) were obtained from General Motors Electromotive Division (EMD), General Electric Transportation Systems (GE), and locomotive emissions testing conducted by Southwest Research Institute (SwRI) under contract with California Department of Transportation (Cal Trans) on two passenger locomotives (1990, EMD F59PH and 1990, GE DASH8-32 BWH) (Fritz, 1992). GE provided EFs for the DASH 8 32BWH (3300 hp) and the P-42DC (4250 hp) locomotive engines.
ii. Locomotive Engine Population
As shown in Table 33, 4,607 locomotives on 4,216 trains pass through the OMF
for service, inspection, refueling, or maintenance. This data was provided by OMF staff and was based on Amtrak’s 2005 train schedule for the Capitol Corridor, the San Joaquins, the California Zephyr, and the Reno Fun and Snow trains. Amtrak’s locomotive fleet model distribution is 95 percent EMD F59PHI, and 5 percent GE DASH 8s. The GE P-42DC locomotive model operates on California Zephyr route, but these locomotives are not owned by Amtrak.
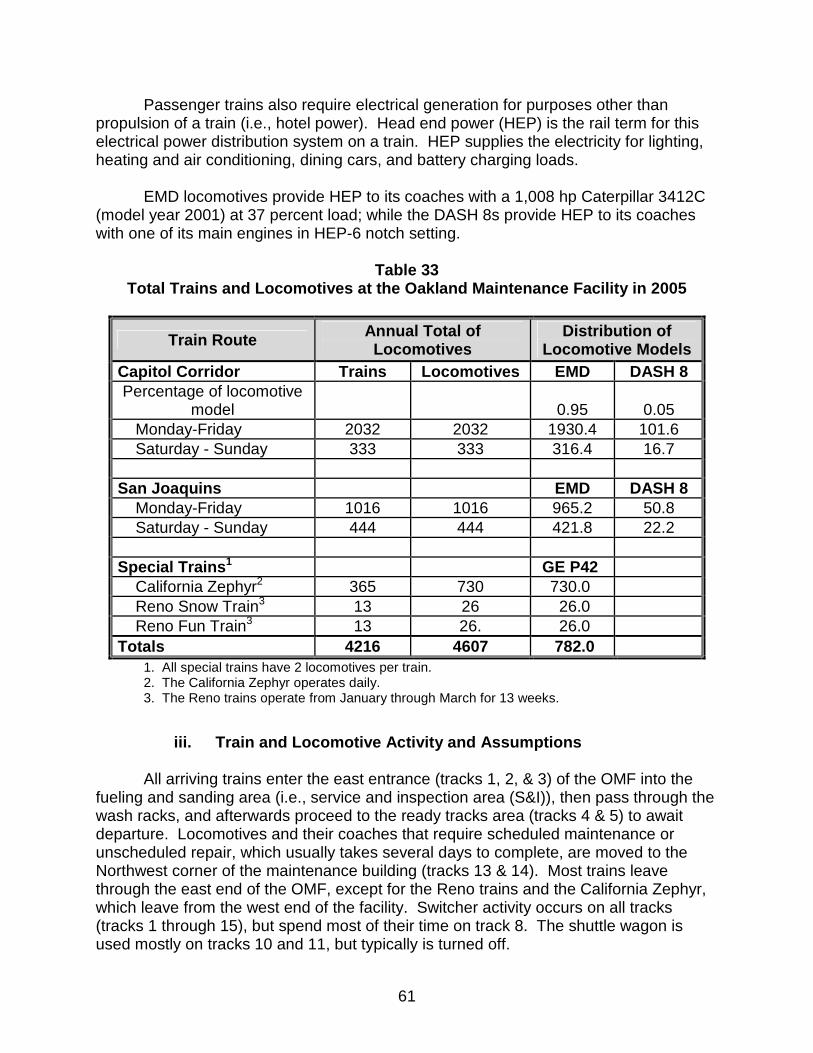
61
Passenger trains also require electrical generation for purposes other than propulsion of a train (i.e., hotel power). Head end power (HEP) is the rail term for this electrical power distribution system on a train. HEP supplies the electricity for lighting, heating and air conditioning, dining cars, and battery charging loads.
EMD locomotives provide HEP to its coaches with a 1,008 hp Caterpillar 3412C (model year 2001) at 37 percent load; while the DASH 8s provide HEP to its coaches with one of its main engines in HEP-6 notch setting.
Table 33 Total Trains and Locomotives at the Oakland Mainten ance Facility in 2005
Train Route Annual Total of Locomotives
Distribution of Locomotive Models
Capitol Corridor Trains Locomotives EMD DASH 8 Percentage of locomotive
model 0.95 0.05 Monday-Friday 2032 2032 1930.4 101.6 Saturday - Sunday 333 333 316.4 16.7 San Joaquins EMD DASH 8 Monday-Friday 1016 1016 965.2 50.8 Saturday - Sunday 444 444 421.8 22.2 Special Trains 1 GE P42 California Zephyr2 365 730 730.0 Reno Snow Train3 13 26 26.0 Reno Fun Train3 13 26. 26.0 Totals 4216 4607 782.0
1. All special trains have 2 locomotives per train. 2. The California Zephyr operates daily. 3. The Reno trains operate from January through March for 13 weeks.
iii. Train and Locomotive Activity and Assumptions
All arriving trains enter the east entrance (tracks 1, 2, & 3) of the OMF into the fueling and sanding area (i.e., service and inspection area (S&I)), then pass through the wash racks, and afterwards proceed to the ready tracks area (tracks 4 & 5) to await departure. Locomotives and their coaches that require scheduled maintenance or unscheduled repair, which usually takes several days to complete, are moved to the Northwest corner of the maintenance building (tracks 13 & 14). Most trains leave through the east end of the OMF, except for the Reno trains and the California Zephyr, which leave from the west end of the facility. Switcher activity occurs on all tracks (tracks 1 through 15), but spend most of their time on track 8. The shuttle wagon is used mostly on tracks 10 and 11, but typically is turned off.

62
OMF staff provided estimates of the number, duration, and location where locomotives idle, pre- or post-maintenance testing locations, and movement of trains on the line segments previously mentioned. Based on the information provided by OMF staff, we allocated all diesel-fueled locomotive and switcher activities into Areas 1 through 5, which are described in detail in Table 34. The following general assumptions were developed for idling, movement, or testing of locomotives for each area, including switcher activities:
Idling:
• Main engine of the EMD and DASH 8 locomotive is on continuously. • HEP is provided 70 percent of the time. • Both main engines of special trains are on continuously.
o One main engine provides HEP for 1 hour prior to departure.
Movement: • A total of 15 minutes is attributed to movement in all four areas. • Time spent in each area will be distributed evenly between notch settings 1,
2, and 3. • CA Zephyr and Reno trains operate with two GE P-42DC locomotives. • San Joaquins and Capitol Corridor trains operate with one EMD F59 PHI or
DASH 8 locomotive.
Testing: • Pre and post maintenance testing is conducted on tracks 13 and 14
(NW corner of maintenance building) and tracks 1, 2, and 3 of service and inspection area.
Switching:
• EMD switcher locomotive idles for 10 hours, operates in notch 3 for ten hours, and is turned-off for 4 hours on any given day.
• Shuttle wagon operates for 1.5 hours per day, and no idling.
Detailed descriptions of locomotive activities, including assumptions, for idling, movement, and testing are provided in Appendix A.1.
iv. Locomotive Emission Rates
Locomotive emissions rates were developed based on currently available information for Amtrak’s EMD F59 PHI, GE DASH 8 (1990 and 2001 model years), and GE P-42DC locomotive models. Because we were unable to determine when a 1990 or 2001 model year DASH 8 locomotive was passing through OMF, we determined it was appropriate to average the emission factors of the two model years. A summary of the emission factors by applicable notch setting for each locomotive engine model, including the equipment used in switching operations (i.e., the caterpillar 3412C engine

63
installed in the EMD locomotives for HEP and the shuttle wagon) are provided in Appendix A.2.
d. Summary of Results
Table 34 presents diesel PM and NOx emissions totals associated with all diesel-fueled locomotive and switcher activities at the OMF. The data illustrates that idling activities associated with the arrival, passing through, and staging of trains at Ready Tracks (prior to departure) represent approximately 80 percent of all PM and NOx emissions emitted at the OMF. As previously mentioned, the train and locomotive activities and resultant emissions are based on the 2005 train schedule for the Oakland Jack London Square Amtrak train station. A detailed description of the activities associated with the annual emissions is provided in Appendix A.3.
Table 34
Estimated Diesel PM and NOx Emissions at the Oaklan d Maintenance Facility
Activity Emissions Summary (tpy 1)
Percent of Grand Total
Arrivals / Departures 2 PM NOx PM NOx Idling 2.67 108.04 78.9 % 79.2 % Movement 0.17 8.20 5.0 % 6.0 % Subtotal 2.84 116.24 Yard Activites PM NOx PM NOx Switcher Idling 0.10 3.17 3.0 % 2.3 % Movement 0.30 12.42 8.9 % 9.1 % Shuttle Wagon3 Movement 0.01 0.2 % Subtotal 0.41 15.59 Maintenance Shop PM NOx PM NOx Pre & Post Maintenance Testing 0.14 4.59 4.1 % 3.4 % Grand Total 3.38 136.42 100.0 % 100.0 % 1. tpy = tons per year. 2. Totals include emissions from main engine plus HEP engine, where applicable. 3. Shuttle wagon NMHC+NOx emissions = 0.47 tpy.
To more easily characterize emissions of PM and NOx from diesel-fueled train and switcher activities (e.g., movement of locomotives, daily inspection, servicing, fueling, and scheduled or unscheduled maintenance) PM and NOx emissions were allocated into five areas based on specific operations. Descriptions of the areas and emissions are provided in Table 35 and Table 36, respectively.

64
Table 35 Description of Areas Where Specific Train or Locomo tive Operations Occur
Location Description
Area 1 East end of property line to and including the service and inspection (S&I) area (NW direction). Mainline connects to a lead track inside OMF that splits into tracks 1, 2, & 3. These tracks are used by the majority of arrival and departure trains. S&I area is where refueling, sanding, and minor maintenance or repair, and pre and post maintenance testing occur. For modeling purposes, we allocated 2 minutes for movement of trains and 20 minutes per train for idling in this area.
Area 2 Continuing NW from the S&I area to and including the wash racks. Tracks 1, 2, & 3 merge into tracks 4 & 5 which enter the wash racks and exit out the west end of facility or travel to the Ready Tracks. For modeling purposes, we allocated 8 minutes for movement of trains in this area.
Area 3 SE from wash racks to and including Ready Tracks area. Tracks 4 & 5 split into tracks 4 through 9, which after the split is considered the Ready Tracks area. This is the staging area for all departing trains. Tracks 4 & 5 also go NW to property line for departing trains. For modeling purposes, we allocated 2 minutes for movement of trains in this area.
Area 4 Ready Tracks area continuing SE to property line. Tracks 4 & 5 are only used for trains departing west end of OMF. Tracks 1, 2, & 3 merge into lead track, which merge into the mainline. For modeling purposes, we allocated 3 minutes for movement of trains in this area.
Area 5 Pre and post maintenance testing, including load tests, of locomotives occur outside NW corner of maintenance shop on tracks 13 & 14.
Table 36 Estimated Diesel PM and NOx Emissions by Area for
Oakland Maintenance Facility
Total Emissions (tpy 1) Percent of Total Location PM NOx PM NOx
Area 1 0.25 9.06 7.4 % 6.6 % Area 2 0.03 1.64 0.9 % 1.2 % Area 3 0.54 22.16 15.9 % 16.2 % Area 4 2.54 102.64 74.7 % 75.2 % Area 52 0.04 0.92 1.2 % 0.7 % Total 3.40 136.42 100.0 % 100.0 %
1. typ = tons per year. 2. Area 5 represents pre and post maintenance testing of locomotives at the NW end
of the maintenance shop.
65
8. Major Construction Projects a. Description of Source Category
During 2005, several major construction projects were undertaken in and adjacent to the West Oakland community; including work on the new eastern span of the Bay Bridge and various at locations within or directly related to the Port of Oakland. Bay Area Air Quality Management (BAAQMD) staff and their consultants collected activity data for the community associated construction projects to estimate the diesel PM emissions from off-road diesel equipment required for these projects. The Port of Oakland and their consultants collected information for construction work associated with the Port.
To begin the process of identifying diesel emissions from construction projects during 2005 in West Oakland, the BAAQMD staff obtained two lists of major development projects in Oakland from personnel at the City of Oakland (Oakland, 2007). The City of Oakland also provided a list of street paving projects undertaken in Oakland during 2005; however, none of these projects took place in the West Oakland study region. These lists represented projects that were at various stages of the permitting or building process during spring and fall 2005, and STI combined these lists to develop a unique list of 111 projects. Using construction project addresses and GIS tools, STI identified 31 projects that were located within the boundaries of the West Oakland study area. However, it appeared that many of these projects were still in the permit application process and not active during 2005. Therefore, BAAQMD staff worked with the City of Oakland to develop a final list of eight projects that were engaged in emission-producing activities during 2005 (see Table 37).
The Port of Oakland identified seven locations where construction activities took
place in 2005. These locations are listed in Table 38. b. Location/Area of Emissions
Figure 10 is a map of the 15 major construction projects that are included in this
section. Eight of these are located within the community of West Oakland and seven are Port-related construction projects. Figure 10 corresponds to the list of projects in Tables 37 and 38. Squares identify the general location of port-related construction projects and stars identify the location of construction projects in and adjacent to the West Oakland Community. For the Bay Bridge project, a year-2005 Google Earth image of the construction area was used to estimate the region of construction activity. See the STI report on the BAAQMD’s website at http://www.baaqmd.gov/CARE/care_documents.htm for more information on community-associated construction projects and see the Port’s website at http://www.portofoakland.com/environm/airEmissions.asp for information on Port-related construction projects in 2005.

66
Figure 10 Location of Major Construction Projects in West Oak land During 2005
Squares (7) identify the general location of port-related construction projects and stars (8) identify the location of construction projects in and adjacent to the West Oakland Community.
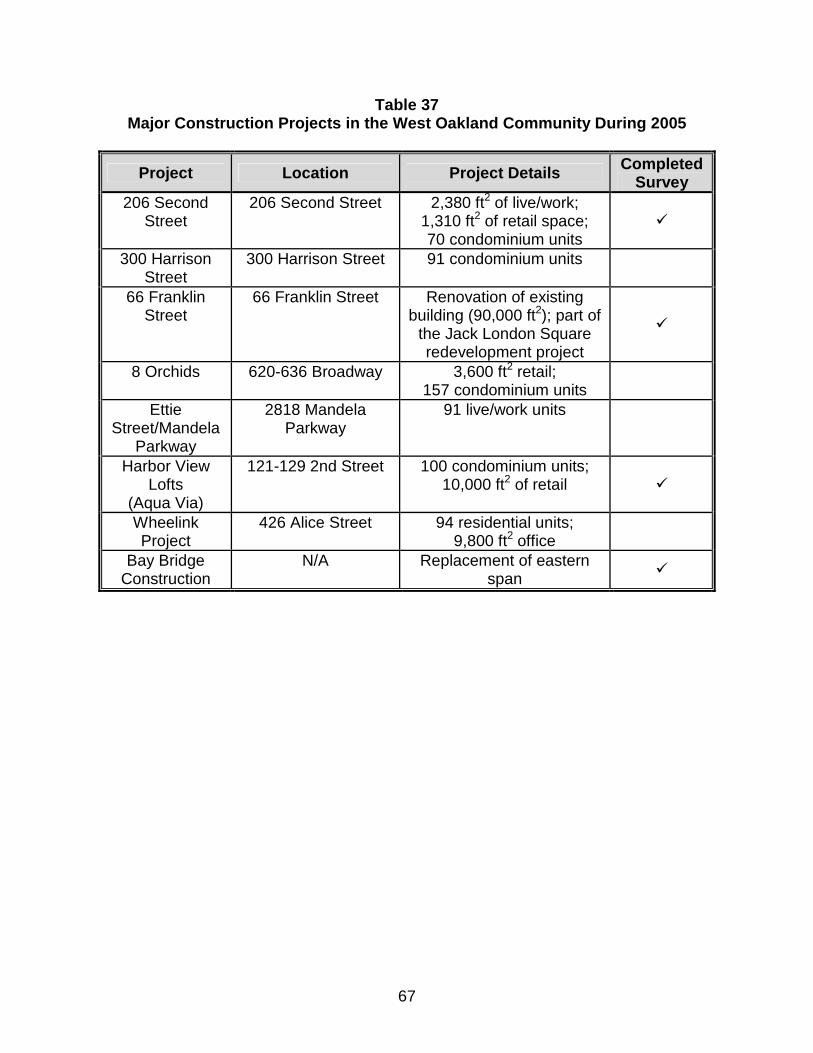
67
Table 37 Major Construction Projects in the West Oakland Com munity During 2005
Project Location Project Details Completed Survey
206 Second Street
206 Second Street 2,380 ft2 of live/work; 1,310 ft2 of retail space; 70 condominium units
�
300 Harrison Street
300 Harrison Street 91 condominium units
66 Franklin Street
66 Franklin Street Renovation of existing building (90,000 ft2); part of
the Jack London Square redevelopment project
�
8 Orchids 620-636 Broadway 3,600 ft2 retail; 157 condominium units
Ettie Street/Mandela
Parkway
2818 Mandela Parkway
91 live/work units
Harbor View Lofts
(Aqua Via)
121-129 2nd Street 100 condominium units; 10,000 ft2 of retail �
Wheelink Project
426 Alice Street 94 residential units; 9,800 ft2 office
Bay Bridge Construction
N/A Replacement of eastern span
�

68
Table 38
Major Construction Projects Associated with the Por t During 2005 1
Project Location Project Details Berth 22 Wharf Reconstruction
Berth 22 Wharf reconstruction, dike and wall construction,
paving Wharf and Embankment
Strengthen (WESP) Berth 23 Install sheet pile wall on
outer harbor, pile driving, improving berth crane
supports Berth 32/33 Rehabilitation Berths 30 to 32; Berths
32 and 33 Filling, berth extension, installation of sheet pile
wall, dredging Demolition of Building D-833 and Berth 59
Berth 59 Pavement demolition, rock crushing, filling, and paving
7 acres Berth 30 Terminal
Expansion Berth 30 Phase 1: grading and
paving Phase 2: fill, compaction,
and paving of 4 acres Container Yard at the Former Union Pacific
Roundhouse
Between Berths 63 and 67 in the backlands
Pavement demolition, excavation, grading, utility
trenching, paving of 36 acres
Dredging and Dredge Materials
Berths 22, 32-33, Oakland Navigational
Channel
Dredging
1. See the document on the Port’s website at http://www.portofoakland.com/environm/airEmissions.asp for more information on the equipment used at these construction projects.
c. Emission Estimation Methodology
i. Survey Design and Implementation STI identified the types of activity data required to estimate emissions from
off-road diesel equipment operating at construction project sites in West Oakland. This data included the following information.
• Equipment populations for the various types of equipment operating at each site.
• Model year and engine size (in horsepower) for each piece of equipment.
• Number of days of operation in 2005 for each piece of equipment.

69
• Average hours per day of operation for each piece of equipment.
• The typical start hour for daily equipment operation. The BAAQMD staff designed a one-page survey that was used to collect this
data as well as other general information such as the project’s total square footage. BAAQMD staff distributed this survey form to the construction companies responsible for the eight projects listed in Table 37. This table also shows the District received completed survey forms for four projects, including the Bay Bridge construction project.
For the four construction projects where activity data were unavailable, activity
data from the Harbor View Lofts project was used as a surrogate. The Harbor View Lofts project was selected as a surrogate because it was judged to be most similar to the four projects (STI, 2007).
ii. Emission Estimation Emission estimates for construction equipment were prepared in the same way
as the emission estimates for TRUs at truck-based businesses. To do this, activity data collected for individual construction projects was combined with “fleet-average” emission factors from the ARB’s OFFROAD model. Surveyed construction companies were not able to provide information on the model year or engine size of equipment used at construction sites in West Oakland; therefore, year-2005 OFFROAD outputs for Alameda County were analyzed to develop average emission factors and horsepower ranges for various types of construction equipment. For example, Table 39 shows how OFFROAD data were weighted to calculate an average horsepower value of 100 hp for pavers in Alameda County.
Table 39
Example Fleet Average Horsepower Calculation
Equipment Type
HP Range
Avg. HP
Activity (hrs/day)
Weighted Avg. HP1
0-25 24 1.7 0.1 26-50 36 99.6 11.6 51-120 89 117.5 33.8
121-175 165 73.0 38.9 176-250 250 8.8 7.1
Pavers
250-500 300 9.0 8.7 Totals 309.7 100
1. Values in this column were calculated using the equation: AvgHP*Activity/Total Activity, where “Total Activity” is the total hours per day of operation for pavers of all sizes (309.7 hours).

70
Because this fleet average value falls within OFFROAD’s 51-120 hp range, output emission rates for that range were used to calculate a fleet average PM emission factor (PMEF).
PMEF = 5642.7 grams/day / (89 hp x 0.62 x 117.5 hours) = 0.87 grams/horsepower-hour
where:
5642.7 grams/day = PM emissions for Alameda County pavers in the 51-120 hp range
89 hp = average engine horsepower for pavers in the 51-120 hp range
0.62 = average engine load factor for pavers in the 51-120 hp range
117.5 hrs = total daily hours of operation in Alameda County for pavers in the 51-120 hp range
To calculate PM emissions, this emission factor, the default OFFROAD load factor (0.62) for pavers in the 51-120 hp range, and the fleet average engine size of 100 hp were then applied to site-specific activity data. For example, daily PM emissions for a paver reported to be operating for 8 hours per day at the Harbor View Lofts project were calculated as follows:
PM = 0.87 grams/hp-hr x 100 hp x 0.62 x 8 hrs/day = 431.5 grams/day
Similar calculations were performed for other pieces of off-road equipment operating at construction projects in West Oakland, and a complete listing of equipment types and corresponding emission factors is provided in the STI Technical Memorandum (STI, 2007) on the BAAQMD’s website at http://www.baaqmd.gov/CARE/care_documents.htm .
Emissions estimation information for all Port–related construction projects in
2005 can be found in documents on the Port’s website at http://www.portofoakland.com/environm/airEmissions.asp .
iii. Temporal Allocation of Emissions Diurnal temporal profiles for construction activity were developed based on
information gathered during the survey process (hours per day of operation and start hour). In cases for which no temporal data were available, construction equipment was assumed to operate for 8 hours per day beginning at 7 a.m. Detailed the temporal information gathered from each construction project are provided by the STI Technical Memorandum (STI, 2007) on the BAAQMD’s website at http://www.baaqmd.gov/CARE/care_documents.htm .
71
d. Summary of Results The total PM emissions from diesel construction equipment operating at major
construction projects in the West Oakland Community and at the Port were estimated at 13.9 tons per year (tpy) for 2005. Of this total, 12.1 tpy are estimated for the Bay Bridge project, about 0.6 tpy are attributed to the remaining seven projects in the community, and approximately 1.2 tpy are estimated for the seven Port-related construction projects. Table 40 provides a summary of the diesel PM emission estimate for construction projects associated with the Port and within the West Oakland community during 2005.
e. Limitations Emissions for year 2005 from the Bay Bridge construction project were estimated
based on construction equipment deployed in year 2007 because we were not able to obtain historical records of equipment and activity within the time constraints of this project. Also, while data on Bay Bridge equipment populations were obtained, limited information was available on the temporal and spatial distribution of Bay Bridge construction activities. Therefore, conservative assumptions were applied to emission estimates for this project (e.g., assuming that equipment operated eight hours a day, 365 days a year). Improved temporal and spatial data would allow for more accurate assessments of the actual impact of this project on air quality in West Oakland.

72
Table 40
Diesel PM Emissions (tons per year) from Constructi on Projects Associated with the Port and in the West Oakland Co mmunity
During 2005 1
Project Diesel PM Emissions
(tpy 2)
Number of Diesel-Powered
Emission Sources
Projects in and Adjacent to the West Oakland Commun ity
66 Franklin Street <0.1 10 206 Second Street <0.1 9 Harbor View Lofts (Aqua Via)
0.1 9
300 Harrison Street 0.1 9 8 Orchids 0.1 9 Ettie Street-Mandela Parkway
0.1 9
Wheelink Project 0.1 9 Bay Bridge Construction 12.1 112
Port-Related Construction Projects 3
Berth 22 Wharf Reconstruction
0.15 38+
Wharf and Embankment Strengthen (WESP) at Berth 23
<0.1 4
Berth 32/33 Rehabilitation
<0.1 3
Demolition of Building D-833 and Berth 59
0.16 19
Berth 30 Terminal Expansion
0.18 Scaled3,4
Container Yard at the Former Union Pacific Roundhouse
0.49 Scaled3,4
Dredging and Dredge Materials
0.16 Undefined3
Total 13.9 240+ 1. All numbers are rounded. 2. tpy = tons per year. 3. See the document on the Port’s website at
http://www.portofoakland.com/environm/airEmissions.asp for more information on the equipment used at the 2005 Port-related construction projects.
4. Project emissions were scaled from other projects.

73
9. Stationary Point Sources
a. Description of Source Category
Stationary sources of diesel PM in and adjacent to the West Oakland community were identified and extracted from BAAQMD’s database of stationary source emissions. Most of the stationary sources that emit diesel PM in West Oakland are standby and emergency generators. These facilities tend to be operated infrequently and mostly for the purposes of testing. In addition to backup generators, however, some stationary diesel-powered engines were also identified in the database. These prime engines, because they are operated on a more routine basis than the backup generators, comprise the largest source of diesel emissions within the category of stationary sources within West Oakland.
b. Location/Area of Emissions
Figure 11 shows the nine locations for facilities with emissions included in this category. Those facilities include the East Bay Municipal Utility District (EBMUD), Unites States Postal Service (USPS), County of Alameda, BNSF railway, Duke Energy, and SSA terminal since they have standby generators that are used in backup capacities. In addition, EBMUD operates three prime engines on a regular basis as part of their operations at the sewage treatment plant. Table 41 provides a list of the facilities, their locations, emissions, and the stack parameter for these sources.

74
Figure 11 Location of Stationary Point Sources of Diesel PM i n West Oakland

75
Table 41 Stationary Source Emissions and Stack Parameters
for Sources of Diesel PM in and Adjacent to West Oa kland
Facility Emissions (lb/y) UTME (m) UTMN
(m)
Stack Height
(ft)
Diameter (m)
Flow Velocity
(m/s)
Temp (F)
EBMUD 249.7 561935 4186724 40 0.6 12 600 EBMUD 30.3 562935 4185604 10 0.1 40 347 EBMUD (portable)1 7.7 563043 4185492
– – – –
County of Alameda 22.6 563746 4183849 10 0.2 40 347 County of Alameda 22.6 563839 4183589 10 0.2 40 347 USPS-Vehicle Maintenance. 41.6 561681 4184390 16 0.1 40 347 Duke Energy 20.1 563286 4183502 10 0.1 40 347 BNSF railway2 1.1 560701 4185320 10 0.1 40 890 SSA terminals2 0.7 561228 4183434 12 0.2 89 872
1. Portable generators were not modeled and no stack parameters are listed. The UTM coordinates identify the storage location for the portable generator.
2. Emissions from stationary sources at BNSF railway and SSA terminals are related to activities at the Port of Oakland. Since stationary sources were not included in Part I, they are included here for completeness.
c. Emission Estimation Methodology
In year 2005, there were 5,918 stationary source facilities and 22,829 sources in
the BAAQMD. From this set of facilities and sources, stationary sources located within West Oakland that emit diesel PM were extracted for use in this study. As noted above, these extracted sources were mainly standby and emergency generators located at EBMUD, USPS, County of Alameda, BNSF railway, Duke Energy, and SSA terminal. Prime engines for a cogeneration unit at EBMUD comprised the majority of the diesel PM emissions from stationary sources in West Oakland, about 0.12 tons per year. The prime engines operate continuously while other (mostly backup generators) are operated infrequently and on an irregular schedule. Stack parameters, flow rates, and stack temperatures for these stationary sources are listed in Table 41. The EBMUD facility in the table with no stack parameters represents a portable generator whose UTM coordinates specify the location where the generator is stored.
d. Summary of Results
Table 42 lists facilities in West Oakland that emit diesel PM, the amount of diesel PM emitted from each, and the number of sources associated with each facility. Most of the emissions listed are minimal and were not modeled in this study. The cogeneration

76
unit at EBMUD is the exception. With less than 0.2 tons per year it is not a large source compared to others in West Oakland, however, it was included among the modeled sources.
Table 42 Diesel Emissions (tons per year) From
Stationary Point Sources in West Oakland
Facility Diesel PM Emissions
(tpy 1) Number of Sources
EBMUD (3 locations) < 0.2 3 prime engines; 8 standby;
2 reciprocating engines USPS minimal 2 standby
County of Alameda (2 locations)
minimal 3 standby
BNSF minimal 1 standby SSA terminal minimal 1 standby Duke Energy minimal 1 standby
Total Emissions <0.2 21 1. tpy = tons per year.
e. Limitations The emissions from boilers that burn distillate oil are not included in the study
since the health risk assessment data applies to diesel PM from diesel-powered internal combustion engines. PM emissions from boilers are not considered diesel PM because of the differences in the combustion process between boilers and internal combustion engines. For more discussion on the methods used for carcinogenic health risk assessment, see the Preliminary Summary of Results.

77
C. References : PART III – Emissions Summary Report for Other Die sel Emission Sources In and Adjacent to the West Oaklan d Community (Non-POAK and Non-UP Rail Yard)
Off-Port Ocean Going Vessels
1. ARB, 2005. Air Resources Board, Planning and Technical Support Division, Emissions Estimation Methodology for Ocean-Going Vessels, 2005 (Appendix D of ISOR for Auxiliary Engine Regulation)
2. ARB, 2005. Air Resources Board, Stationary Source Division, Ocean Going Vessel Survey, 2005
3. Starcrest Consulting Group, 2004. Starcrest Consulting Group, Port-Wide Baseline Air Emissions Inventory, 2004, prepared for the Port of Los Angeles
4. ARB, 2007. Air Resources Board, Planning and Technical Support Division, Air Resources Board, Ocean-Going Vessel PM Emission Factors for Heavy Fuel Oil - White Paper, 2007 (in press)
5. SLC, 2005. State Lands Commission Vessel Data.
Off–Port Harbor Craft
1. ARB, 2007. Emissions Estimation Methodology for Commercial Harbor Craft Operating in California. http://www.arb.ca.gov/regact/2007/chc07/appb.pdf .
Freeways and Roadways
1. SCAG, 2007. “SCAG Transportation Modeling”, http://www.scag.ca.gov/modeling/ (Accessed January 2007).
2. Alpine Geophysics, 2004. Wilkinson, James (Alpine Geophysics); et al. “Development of the California Integrated Transportation Network (ITN),” Alpine Geophysics – Atmospheric and Hydrologic Sciences, La Honda, CA (2004). http://www.arb.ca.gov/airways/CCOS/docs/III3_0402_Jun06_fr.pdf
3. ARB, 2007. “On-Road Emissions Inventory Programs,” (Accessed July 2007). http://www.arb.ca.gov/msei/onroad/onroad.htm .
4. ARB, 2007B. Staff Report: Initial Statement of Reasons for Proposed Rulemaking – Proposed Regulation for Drayage Trucks, Appendix B: Emissions Estimation Methodology for On-Road Diesel-Fueled Heavy Duty Drayage Trucks at California’s Ports and Intermodal Railyards, California Air Resources Board, 2007. Available at: http://www.arb.ca.gov/regact/2007/drayage07/appbf.pdf .
5. TIAX LLC. “Container Truck Traffic Assessment and Potential Mitigation Measures for the West Oakland Diesel Truck Emission Reduction Initiative,” TR-03-176, September 2003.

78
6. Freeway Performance Measurement System (PeMS); (Accessed July 2007). https://pems.eecs.berkeley.edu/ .
7. Caltrans. ”Truck Traffic,” [Accessed July 2007] http://www.dot.ca.gov/hq/traffops/saferesr/trafdata/.
Trucking-Based Businesses and Distribution Centers
1. Sonoma Technology Inc. (2007). “Documentation of emission estimation techniques for sources of diesel particulate matter (DPM) associated with truck-based businesses and construction projects in West Oakland, California”. Bay Area Air Quality Management District Contract No. 2006-144. July 20, 2007. STI-907006-3174-TM.
2. Harding ESE (2001). “West Oakland diesel particulate emissions study. Prepared for the City of Oakland, California, by Harding ESE, Project No. 48168-005, September.
3. Sax T. (2004). “Development and critical evaluation of air pollution emissions inventoried representing industrial and commercial facilities: a case study of Wilmington, California”. Doctoral thesis, University of California, Los Angeles.
4. VRPA Technologies (2002). Goods movement truck count study. Prepared for the Southern California Association of Governments, Los Angeles, CA, by VRPA Technologies, San Diego, CA, and Cambridge Systematics, Inc., Oakland, CA. Available on the Internet at http://www.scag.ca.gov/goodsmove/pdf/truckcnt_rpt.pdf . September.
Locomotive Movement (Off-Port and Off-UP Rail Yard) within West Oakland
1. Sierra Research (2006). “Toxic Air Contaminant Emissions Inventory for the Oakland Rail Yard, Oakland, California”. Prepared for Union Pacific Railroad by Sierra Pacific (Draft – November 2006).
Amtrak Maintenance Facility
1. Amtrak, 2004. ATK 04-131 press release dated 10/12/04 “Dedication Ceremony for new state- of-the-Art Maintenance Facility in Oakland.
2. Fritz, 1992. Fritz, S. G., “Exhaust Emissions From Two Intercity Passenger Locomotives,” SwRI Final Report No. 08-4976 for Cal Trans - Division of Rail, Nov.1992.

79
Construction Activities
1. Oakland, 2007. Personal Communications with Heather Klein and Tawfic N. Halaby from the City of Oakland and Phil Martien of the Bay Area Air Quality Management District. For a list of active major construction projects in the City of Oakland, see http://www.oaklandnet.com/government/ceda/revised/planningzoning/majorprojectssection/MajorProjectsList-Oct-Nov06.pdf .
2. Sonoma Technology Inc. (2007) Documentation of emission estimation techniques for sources of diesel particulate matter (DPM) associated with truck-based businesses and construction projects in West Oakland, California. Bay.
80
APPENDIX A
Amtrak Maintenance Yard Supporting Materials

81
(Page intentionally blank)

82
APPENDIX A-1 AMTRAK OAKLAND MAINTENANCE FACILITY
LOCOMOTIVE ACTIVITY
General Assumption for all locomotive models:Idling activity for all trains at the Oakland Maintenance Facilty (OMF), taking our assumptions into consideration, was based on the arrival/departure train schedule at Oakland's Jack London Square AMTRAK Depot.
LOCOMOTIVE IDLING ACTIVITY CombinedCapitol Corridor Locomotive Daily Daily Engine Engine1 Daily Daily Annual Annual AnnualTrain # in Train # out Model Arrival Departure Main HEP Idling (min) HEP (min) Idling (hr) HEP (hr) Totals (hr)
531 716 F59PHI 11:10 AM 1:05 PM 1 1 115.00 80.50 486.83 340.78 827.62551 532 F59PHI 11:00 PM 11:45 AM 1 1 765.00 535.50 3,238.50 2,266.95 5,505.45533 538 F59PHI 12:00 noon 3:00 PM 1 1 180.00 126.00 762.00 533.40 1,295.40527 528 F59PHI 9:40 AM 10:45 AM 1 1 65.00 45.50 275.17 192.62 467.78545 546 F59PHI 6:40 PM 8:20 PM 1 1 100.00 70.00 423.33 296.33 719.67525 526 F59PHI 8:20 AM 9:15 AM 1 1 55.00 38.50 232.83 162.98 395.82541 540 F59PHI 4:10 PM 4:50 PM 1 1 40.00 28.00 169.33 118.53 287.87549 520 F59PHI 9:00 PM 7:00 AM 1 1 600.00 420.00 2,540.00 1,778.00 4,318.00751 732 F59PHI 11:20 PM 12:00 noon 1 1 740.00 518.00 1,369.00 958.30 2,327.30745 720 F59PHI 7:00 PM 6:45 AM 1 1 705.00 493.50 1,304.25 912.98 2,217.23729 742 F59PHI 12:00 noon 5:00 PM 1 1 300.00 210.00 555.00 388.50 943.50
TOTALS 3,665.00 2,565.50 11,356.25 7,949.38 19,305.63
San Joaquins LOCOMOTIVE IDLING ACTIVITY CombinedLocomotive Daily Daily Engine Engine1 Daily Daily Annual Annual Annual
Train # in Train # out Model Arrival Departure Main HEP Idling (min) HEP (min) Idling (hr) HEP (hr) Totals (hr)717 714 F59PHI 10:30 PM 9:30 AM 1 1 660.00 462.00 2,794.00 1,955.80 4,749.80711 718 F59PHI 11:30 AM 5:15 PM 1 1 345.00 241.50 1,460.50 1,022.35 2,482.85715 712 F59PHI 8:00 PM 7:00 AM 1 1 660.00 462.00 2,794.00 1,955.80 4,749.80713 518 F59PHI 5:00 PM 5:00 AM 1 1 720.00 504.00 3,048.00 2,133.60 5,181.60717 714 F59PHI 10:30 AM 5:15 PM 1 1 405.00 283.50 749.25 524.48 1,273.73711 718 F59PHI 11:30 AM 5:15 PM 1 1 345.00 241.50 638.25 446.78 1,085.03715 712 F59PHI 8:00 PM 7:00 AM 1 1 660.00 462.00 1,221.00 854.70 2,075.70713 518 F59PHI 5:00 PM 5:00 AM 1 1 720.00 504.00 1,332.00 932.40 2,264.40
TOTALS 4,515.00 3,160.50 14,037.00 9,825.90 23,862.90Assumptions for EMD trains and locomotives
1. The Head End Power is provided by the CAT engine at 37% load and is on 70% of the time.2. 254 days weekday and 111 days weekend schedules3. Assume 20 mins/train of activity spent in S&I Area for modeling purposes
Monday -- Friday
Saturday & Sunday
Monday -- Friday
Saturday & Sunday

83
APPENDIX A-1 AMTRAK OAKLAND MAINTENANCE FACILITY
LOCOMOTIVE ACTIVITY
LOCOMOTIVE IDLING ACTIVITY CombinedCapitol Corridor Locomotive Daily Daily Engine Engine2 Daily Daily Annual Annual AnnualTrain # in Train # out Model Arrival Departure Main HEP Idling (min) HEP (min) Idling (hr) HEP (hr) Totals (hr)
531 716 GE (DASH 8)1 11:10 AM 1:05 PM 1 1 115.00 80.50 146.05 102.24 248.29551 532 GE (DASH 8)1 11:00 PM 11:45 AM 1 1 765.00 535.50 971.55 680.09 1,651.64533 538 GE (DASH 8)1 12:00 noon 3:00 PM 1 1 180.00 126.00 228.60 160.02 388.62527 528 GE (DASH 8)1 9:40 AM 10:45 AM 1 1 65.00 45.50 82.55 57.79 140.34545 546 GE (DASH 8)1 6:40 PM 8:20 PM 1 1 100.00 70.00 127.00 88.90 215.90525 526 GE (DASH 8)1 8:20 AM 9:15 AM 1 1 55.00 38.50 69.85 48.90 118.75541 540 GE (DASH 8)1 4:10 PM 4:50 PM 1 1 40.00 28.00 50.80 35.56 86.36549 520 GE (DASH 8)1
9:00 PM 7:00 AM 1 1 600.00 420.00 762.00 533.40 1,295.40
751 732 GE (DASH 8)1 11:20 PM 12:00 noon 1 1 740.00 518.00 410.70 958.30 1,369.00745 720 GE (DASH 8)1 7:00 PM 6:45 AM 1 1 705.00 493.50 391.28 912.98 1,304.25729 742 GE (DASH 8)1 12:00 noon 5:00 PM 1 1 300.00 210.00 166.50 388.50 555.00
TOTALS 1 1 3,665.00 2,565.50 3,406.88 3,966.66 7,373.53
San Joaquin LOCOMOTIVE IDLING ACTIVITY CombinedLocomotive Daily Daily Engine Engine2 Daily Daily Annual Annual Annual
Train # in Train # out Model Arrival Departure Main HEP Idling (min) HEP (min) Idling (hr) HEP (hr) Totals (hr)717 714 GE (DASH 8)1 10:30 PM 9:30 AM 1 1 660.00 462.00 838.20 1,955.80 2,794.00711 718 GE (DASH 8)1 11:30 AM 5:15 PM 1 1 345.00 241.50 438.15 1,022.35 1,460.50715 712 GE (DASH 8)1 8:00 PM 7:00 AM 1 1 660.00 462.00 838.20 1,955.80 2,794.00713 518 GE (DASH 8)1
5:00 PM 5:00 AM 1 1 720.00 504.00 914.40 2,133.60 3,048.00
717 714 GE (DASH 8)1 10:30 AM 5:15 PM 1 1 405.00 283.50 514.35 1,200.15 1,714.50711 718 GE (DASH 8)1 11:30 AM 5:15 PM 1 1 345.00 241.50 191.48 446.78 638.25715 712 GE (DASH 8)1 8:00 PM 7:00 AM 1 1 660.00 462.00 366.30 854.70 1,221.00713 518 GE (DASH 8)1 5:00 PM 5:00 AM 1 1 720.00 504.00 399.60 932.40 1,332.00
TOTALS 1 1 4,515.00 3,160.50 4,500.68 10,501.58 15,002.25Assumptions for GE trains and locomotives
1: Emissions are split 50/50 between GE DASH 8 model years 1990 and 2003.2. The main engine provides Head End Power (HEP) in HEP-6 and is on 70% of the time.3. DASH 8 trains makeup 5.0 percent of the total emissions at the S&I Area4. 254 days weekday and 111 days weekend schedules5. Assume 20 mins/train of activity spent in S&I Area for modeling purposes
Monday -- Friday
Saturday & Sunday
Monday -- Friday
Saturday & Sunday

84
APPENDIX A-1 AMTRAK OAKLAND MAINTENANCE FACILITY
LOCOMOTIVE ACTIVITY
CA Zephyr LOCOMOTIVE IDLING ACTIVITY Combined2 locomotives per train Engine1 Engine2 Daily Daily Annual Annual AnnualTrain # in Train # out Model Arrival Departure Main HEP Idling (min) HEP-6(min) Idling (hr) HEP-6(hr) Totals (hr)
5 6 GE P42 6:00 PM 8:30 AM 2 1 1,680.00 60.00 10,220.00 365.00 10,585.00TOTALS 1,680.00 60.00 10,220.00 365.00 10,585.00
LOCOMOTIVE IDLING Reno Snow and Fun Trains ACTIVITY Combined
(January through March, 13 WKS) Engine1 Engine2 Daily Daily 13 weeks 13 weeks AnnualModel Arrival Departure Main HEP Idling (min) HEP-6(min) Idling (hr) HEP-6(hr) Totals (hr)
2 locomotives/train GE P42 9:00 PM 9:00 AM 2 1 1,380.00 60.00 2,093.00 91.00 2,184.002 locomotives/train GE P42 7:00 PM 9:00 AM 2 1 1,620.00 60.00 2,457.00 91.00 2,548.00
Reno Snow Train Tuesday ThursdayReno Fun Train Friday Sunday
TOTALSAssumptions for CA Zephyr and Reno trains and locomotives
1. Both main engines idle continuously until one engine is set to HEP-6 2. One of the main engines provide Head End Power (HEP) in HEP-6 (notch 5) for one hour.3. Assume 20 mins/train of activity spent in S&I Area for modeling purposes
DAILY
WEEKLY
SCHEDULE

85
APPENDIX A-1 AMTRAK OAKLAND MAINTENANCE FACILITY
LOCOMOTIVE ACTIVITY
TRAIN MOVEMENT THROUGH OMF ACTIVITY Total AnnualLocomotive Model Locomotives Annual Total Activity/locomotive or HEP unit (hrs) Activity (hrs)
% of Fleet per Train of Locomotives Area 1 Area 2 Area 3 Area 40.95 EMD F59PHI 1 3,633.75 0.03 0.13 0.03 0.05 908.440.05 GE DASH 8 1 191.25 0.03 0.13 0.03 0.05 47.81
P42 2 782.00 0.03 0.13 0.03 0.05 195.50Totals 4,607.00 0.10 0.40 0.10 0.15 1,151.75
1. DASH 8 locomotives are split 50/50 between 1990 & 2001 model years 2. Trains using EMD locomotives have a CAT engine that provides HEP. 3. HEP is provided continuously during arrival up to when train stops and during departureArea 1 = 2 mins; Area 2 = 8 mins; Area 3 = 2 mins; Area 4 = 3; total of 15 minsArea 1 is distance from property line entering OMF to and including the S&I area (1 to 3 minutes).Area 2 is distance from S&I area to and including the Wash Racks ( 8 mins).Area 3 is distance from Wash Racks to and including the Ready Tracks ( 2 mins).Area 4 is distance from Ready Tracks to exiting property line (3 mins)Area 5 is outside the NW corner of main. Shop & is where pre & post maintenance testing, including load testing occurs. Emissions from the movement of locomotives to this area were considererd insignificant.

86
APPENDIX A-1 AMTRAK OAKLAND MAINTENANCE FACILITY
LOCOMOTIVE ACTIVITY
SCHEDULED AND UNSCHEDULED MAINTENANCE TESTING
Testing Types and Time Spent in Each Notch (min) Total TotalIdle TN-1 TN-8 (min) (hrs)
Planned Maintenance (PM) 10-min. Pretests 2 8 10 0.17Planned Maintenance (PM) 30-min. Load Tests 10 10 10 30 0.50Quarterly Maintenance (QM)10-min. Load Tests 2 8 10 0.17Unscheduled (US) Maint. 15-min. DiagnosticTests 5 10 15 0.25Unscheduled (US) Maint. 30-min. Load Tests 10 10 10 30 0.50
Annual Locomotive Servicing Events 1
Test Type Tracks 13 & 14Service & Inspection Area 3
NW Corner ShopFueling & Sanding Area Tracks 2 & 3 TotalsPM 10-Minute Pretest 72 72
PM 30-minute Load Test 72 72QM 10-Minute Load Test 72 72US 15-Minute Diagnostic 4 4 4 12US 30-Minute Load Test 4 4 4 12
TOTALS 216 8 8 8 2401. 95 % of all locomotve models arriving at AMTRAK Facility are EMD and 5% are GE 2. Six locomotives per month receive preventive maintenance at shop.3. Five percent of all arriving locomotives receive unscheduled maintenance in this area.4. NW corner of Maintenance shop is considered Area 5 for modeling purposes.
General Assumption: All locomotive models are refueled, receive scheduled or unscheduled service, or scheduled or unscheduled maintenance or repair at the OMF (exception, Zephr trains receive scheduled maintenance in Chicago).
The following table presents the type of maintenance and time spent in each notch setting for each type of maintenance activity performed.
The following table presents the number and location of service or maintenance events performed at the OMF.
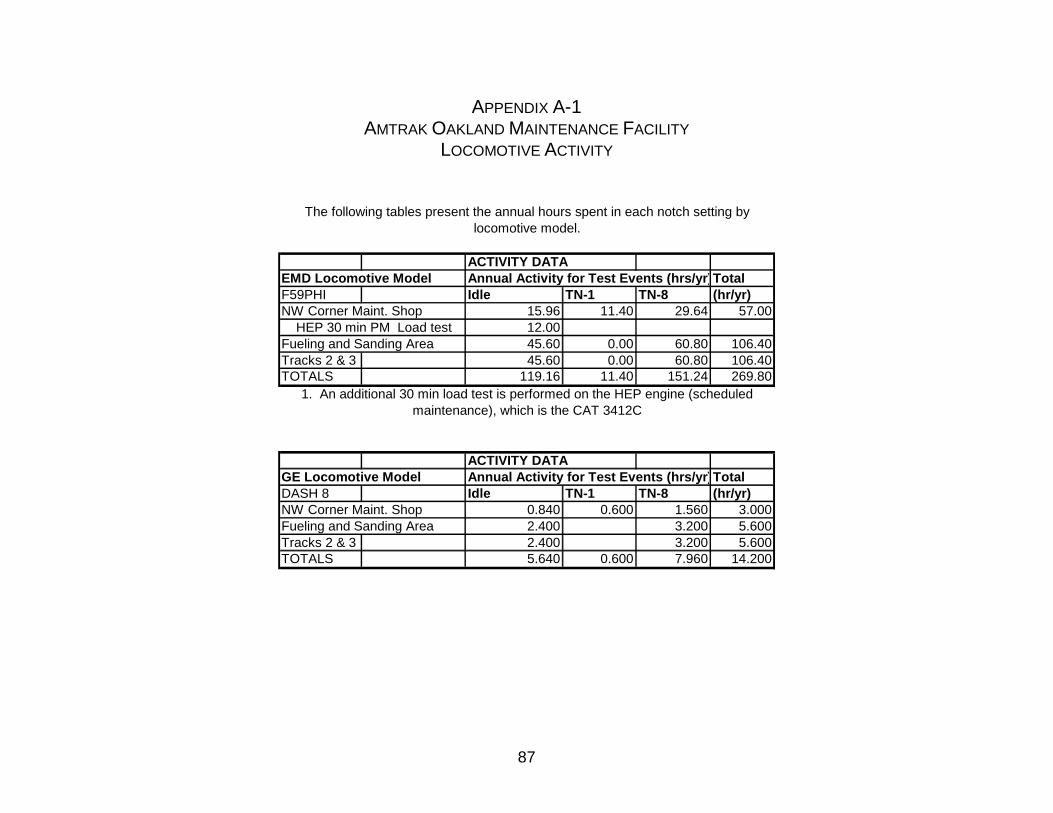
87
APPENDIX A-1 AMTRAK OAKLAND MAINTENANCE FACILITY
LOCOMOTIVE ACTIVITY
ACTIVITY DATA EMD Locomotive Model Annual Activity for Test Events (hrs/yr) TotalF59PHI Idle TN-1 TN-8 (hr/yr)NW Corner Maint. Shop 15.96 11.40 29.64 57.00 HEP 30 min PM Load test 12.00Fueling and Sanding Area 45.60 0.00 60.80 106.40Tracks 2 & 3 45.60 0.00 60.80 106.40TOTALS 119.16 11.40 151.24 269.80
ACTIVITY DATA GE Locomotive Model Annual Activity for Test Events (hrs/yr) TotalDASH 8 Idle TN-1 TN-8 (hr/yr)NW Corner Maint. Shop 0.840 0.600 1.560 3.000Fueling and Sanding Area 2.400 3.200 5.600Tracks 2 & 3 2.400 3.200 5.600TOTALS 5.640 0.600 7.960 14.200
The following tables present the annual hours spent in each notch setting by locomotive model.
1. An additional 30 min load test is performed on the HEP engine (scheduled maintenance), which is the CAT 3412C

88
APPENDIX A-2 AMTRAK OAKLAND MAINTENANCE FACILITY
LOCOMOTIVE EMISSION FACTORS
EMD F59PHIEMD Engine 12-710 G3A NOx PM
Notch BHP (g/hr) (g/hr)High Idle 14.00 993.00 40.00
1 209.00 2,405.00 45.002 366.00 4,526.00 78.003 708.00 8,052.00 208.004 1,050.00 9,807.00 263.005 1,380.00 11,641.00 331.006 1,680.00 14,583.00 395.007 2,520.00 21,513.00 538.008 3,190.00 25,234.00 781.00
1. (40 Retarded Timing Test date = 5-8-92)
EMD Number Model year HpSwitcher 794 1954 1200Engine 12-645 NOx PMNotch BHP (g/hr) (g/hr)Idle 12.00 789.60 24.841 57.60 990.72 18.432 186.40 2220.02 61.513 352.00 4572.48 109.124 535.20 7835.33 128.455 708.00 11306.76 162.846 887.20 14399.26 248.427 1097.60 17517.70 274.408 1268.80 19222.32 355.26
General Motors Electro-Motive Division (EMD) Locomo tives
This EMD locomotive does most of the switching operations within OMF
This locomotive model operates on all routes except the CA Zephyr & Reno fun & snow routes
1. (emissions data ratio'ed 1200/1500 of EMD 12-645 1500 hp switcher EFs)

89
APPENDIX A-2 AMTRAK OAKLAND MAINTENANCE FACILITY
LOCOMOTIVE EMISSION FACTORS
Locomotive Model P-42DCEngine Family: 3GETK0668EPCEngine Model: 7FDL HP: 4250
Notch BHP NOx PM(g/hr) (g/hr)
High Idle 11 774 141 164 2285 182 373 4922 373 882 12626 1274 1324 18944 1335 1979 14470 2706 2655 20026 3227 3354 24904 3958 4161 35356 281
DASH 8 - 32BWH Model year 1990GE 7FDL 12 cylinder 3250 HP
Notch BHP NOx PM(g/hr) (g/hr)
High Idle 34 847 56HEP Idle 190 2440 3811 - HEP 324 4970 3442 - HEP 431 5270 3103 - HEP 712 8380 3234 - HEP 1021 12900 3755 - HEP 1773 19100 5136 - HEP 2257 23400 548
8=7 - HEP2 2775 29900 5838-FREIGHT1 3250 30400 514
(40 Retarded Timing Test date = 5-18-92)
GENERAL ELECTRIC (GE) LOCOMOTIVES
This locmotive model operates the Special trains, i.e., CA Zephy, Reno fun and snow trains
1. Notch 8 Freight represents throttle Notch 8 in non-HEP opreating mode (i.e., 1050 rpm)2. Notch 8 power equals Notch 7 power in HEP mode

90
APPENDIX A-2 AMTRAK OAKLAND MAINTENANCE FACILITY
LOCOMOTIVE EMISSION FACTORS
Locomotive Model: 2001 Dash 8-32BWHEngine Family: 3GETK0668EPDEngine Model: 7FDL HP: 4250
Notch BHP NOx PM(g/hr) (g/hr)
High Idle 17 512 161 124 1425 422 233 2539 883 505 5499 2274 823 10372 1745 1534 15966 2416 2020 21083 2317 2633 21624 2288 3163 22215 230
Average EF of GE DASH 8 1990 & 2003 Model Years Notch BHP NOx PM
(g/hr) (g/hr)High Idle 25 679 36
1 224 3197 1932 332 3904 1993 609 6939 2754 922 11636 2745 1654 17533 3776 2138 22242 3907 2704 25762 4068 3207 26308 372
GENERAL ELECTRIC (GE) LOCOMOTIVES
This locomotive model operates on all routes except the CA Zephyr & Reno fun & snow routes
1. EFs used to calculate emissions during movement of arrival and departure trains.

91
APPENDIX A-2 AMTRAK OAKLAND MAINTENANCE FACILITY
LOCOMOTIVE EMISSION FACTORS
This engine is installed on th EMD locomotives to provide HEP for hoteling
HEAD-END POWER ENGINECaterpillar Head End Power Engine Operational hp
Year Model Engine Family Hp Load (Hp)2001 3412C 2CPXL270MRT 1080 0.37 399.60
Head End Power EngineEXHAUST (g/bhp-hr) EXHAUST (g/hr)
NOx PM NOx PM5.97 0.12 2385.61 47.68
conversion of kW to bhpNOx PM
kW 8 0.16bhp 5.97 0.12
The shuttle wagon moves locomotives within the OMF
Shop Diesel EquipmentShuttle WagonMake/Year Model hpCummins/2004 QSB 5.9 185
Shuttle Wagon Engine Certification DataCERT DATA from E.O. U-R-002-0244-2 CERT DATA from E.O. U-R-002-0244-2
EXHAUST (g/hr) EXHAUST (g/Kw-hr)NMHC+NOx PM NMHC+NOx PM786.35 13.80 5.70 0.10

92
APPENDIX A-3 AMTRAK OAKLAND MAINTENANCE FACILITY
SUMMARY OF ANNUAL ACTIVITIES & EMISSIONS
ARRIVALS & DEPARTURES
Annual Idling Emissions within OMFCapitol Corridor (Main engine + HEP engine)
Schedule NOx (tpy) PM (tpy) Monday - Friday 24.59 0.67 Saturday & Sunday 11.48 0.30San Joaquin Monday - Friday 35.90 0.93 Saturday & Sunday 14.76 0.38CA Zephyr Daily 14.53 0.26Special Trains Reno Snow Train 3.23 0.06 Reno Fun Train 3.55 0.06TOTALS 108.04 2.67
a. One locomotive per train.
3. The GE locomotive models use their main engine to provide HEP.
5. 254 days weekday and 111 days weekend schedulesAnnual Emissions During Movement of Trains within O MF
(Main engine)Locomotives NOx (tpy) PM (tpy)EMD 4.947 0.109GE 0.146 0.007GE 0.845 0.008Sub-Totals 5.939 0.124HEP ModelCATEPILLAR 1.432 0.029GE N/A N/AGE 1.432 0.029Sub-Totals 2.263 0.044Grand Totals 8.201 0.168
4. The CA Zephyr & Special trains are 100% GE P42 locomotive models and have two locomotives per train.
1. The Capitol Corridor and San Joaquin locomotives are 95% EMD and 5% GE DASH 8 models.
2. The EMD locomotive model has a separate engine that provides head-end power (HEP) to the train.
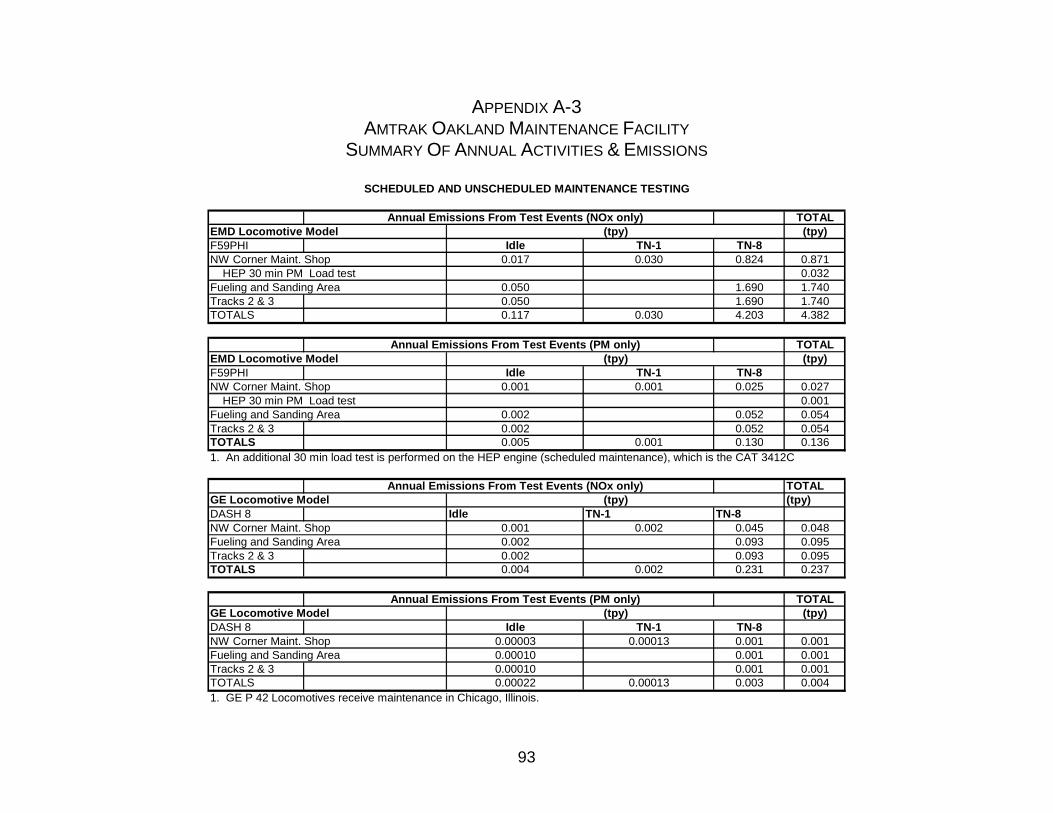
93
APPENDIX A-3 AMTRAK OAKLAND MAINTENANCE FACILITY
SUMMARY OF ANNUAL ACTIVITIES & EMISSIONS
Annual Emissions From Test Events (NOx only) TOTALEMD Locomotive Model (tpy)F59PHI Idle TN-1 TN-8NW Corner Maint. Shop 0.017 0.030 0.824 0.871 HEP 30 min PM Load test 0.032Fueling and Sanding Area 0.050 1.690 1.740Tracks 2 & 3 0.050 1.690 1.740TOTALS 0.117 0.030 4.203 4.382
Annual Emissions From Test Events (PM only) TOTALEMD Locomotive Model (tpy)F59PHI Idle TN-1 TN-8NW Corner Maint. Shop 0.001 0.001 0.025 0.027 HEP 30 min PM Load test 0.001Fueling and Sanding Area 0.002 0.052 0.054Tracks 2 & 3 0.002 0.052 0.054TOTALS 0.005 0.001 0.130 0.1361. An additional 30 min load test is performed on the HEP engine (scheduled maintenance), which is the CAT 3412C
Annual Emissions From Test Events (NOx only) TOTALGE Locomotive Model (tpy)DASH 8 Idle TN-1 TN-8NW Corner Maint. Shop 0.001 0.002 0.045 0.048Fueling and Sanding Area 0.002 0.093 0.095Tracks 2 & 3 0.002 0.093 0.095TOTALS 0.004 0.002 0.231 0.237
Annual Emissions From Test Events (PM only) TOTALGE Locomotive Model (tpy)DASH 8 Idle TN-1 TN-8NW Corner Maint. Shop 0.00003 0.00013 0.001 0.001Fueling and Sanding Area 0.00010 0.001 0.001Tracks 2 & 3 0.00010 0.001 0.001TOTALS 0.00022 0.00013 0.003 0.0041. GE P 42 Locomotives receive maintenance in Chicago, Illinois.
SCHEDULED AND UNSCHEDULED MAINTENANCE TESTING
(tpy)
(tpy)
(tpy)
(tpy)

94
APPENDIX A-3 AMTRAK OAKLAND MAINTENANCE FACILITY
SUMMARY OF ANNUAL ACTIVITIES & EMISSIONS
TABLE 1ANNUAL EMISSIONS FROM SWITCHING ACTIVITIES WITHIN O MFEQUIPMENT TYPESWITCHER (EMD)POLLUTANT NOx PMIDLING 3.17 0.10MOVEMENT (track 8) 12.42 0.30SHUTTLE WAGON PMIDLING N/AMOVEMENT 0.01TOTALS (idling) 3.17 0.10TOTALS (movement) 12.42 0.311. Idling and movement of truck deliveries not quantified.2. The shuttle is either moving or turned-off. Assume 1.5 hrs per day
TABLE 2
Area of Activity NOx (tpy) PM (tpy)NW Corner Maint. Shop 0.92 0.03
Fueling and Sanding Area 1.83 0.06Tracks 2 & 3 1.83 0.06
Total 4.59 0.14
TABLE 3
Location NOx (tpy) PM (tpy)Area 1 9.06 0.25Area 2 1.64 0.03Area 3 22.16 0.54Area 4 102.64 2.54Area 5 0.92 0.04Total 136.42 3.4
Area 5 is outside the NW corner of maintenance Shop & is where pre & post maintenance testing, including load testing occurs.
ANNAL EMISSIONS FROM TEST EVENTS WITHIN OMF
POLLUTANT (tpy)
TOTAL ANNUAL EMISSIONS BY LOCATION WITHIN OMF