Embed Size (px)
Citation preview

Part II: Turbulence Signature and Platform Limitations
Dan Weber, Frank W. Gallagher, Ken Howard
©2000 Frank W. Gallagher III

Another Look at the Data and the Platform Capabilities
• How much of the boundary layer turbulence can be captured?
• Can we use the data in a numerical model (3-D usefulness)?
• What are the system limitations?

Outline
• Generate a 3-D picture
• Discuss turbulence features
• Investigate the current limitations of the platform: – Resolution– Sampling space
• Summary and future efforts
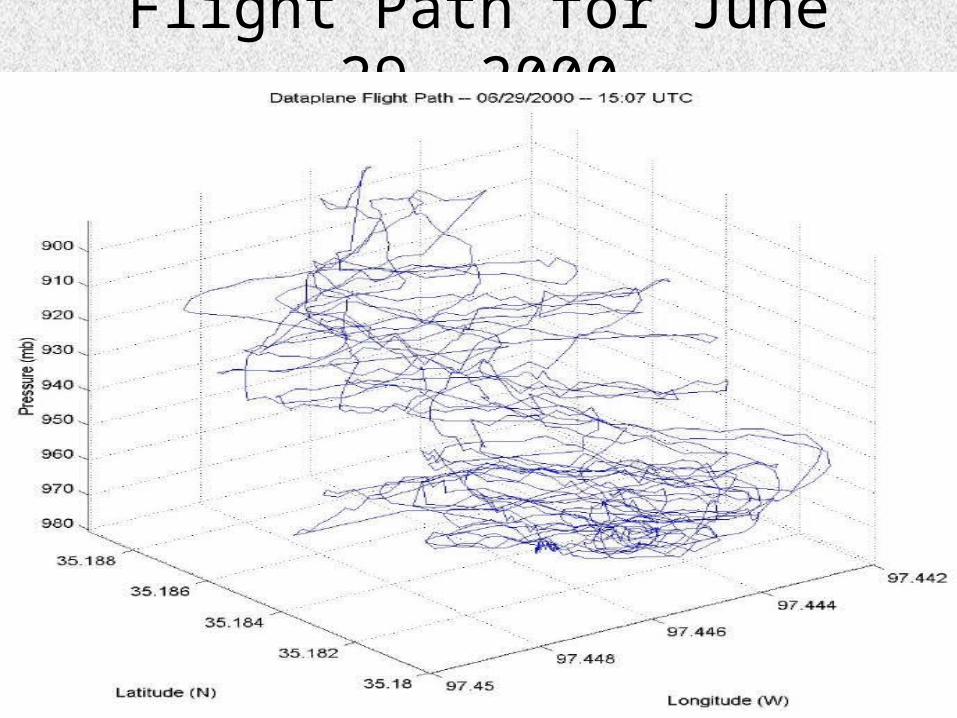
Flight Path for June 29, 2000

ADAS Analysis• Generate a 3-D data set via ADAS
analysis from point measurements.
• Use MCDRS (aircraft option) to bring in the observations.
• High-resolution (20m) grid.
• Barnes analysis– 4 passes– Horizontal range influence 90,80,70,60m– Vertical range influence 60,50,40,30m

ADAS Analysis Continued
• Background field, Norman OK 12Z sounding, 3-D and horizontally homogeneous
• Data collected from 15:07 to 15:33Z
• Analyzed variables:– Temperature– Pressure– Mixing ratio

ADAS Results
North-South Slice X-Y Slice at 800m
Mixing Ratio

ADAS Analysis Discussion
• Analysis shows small convective elements (order 100-200m).
• High-moisture regions are 600-800m removed from the source region (surface).
• Complex structure exists.
• More data is needed to “fill in our volume”.
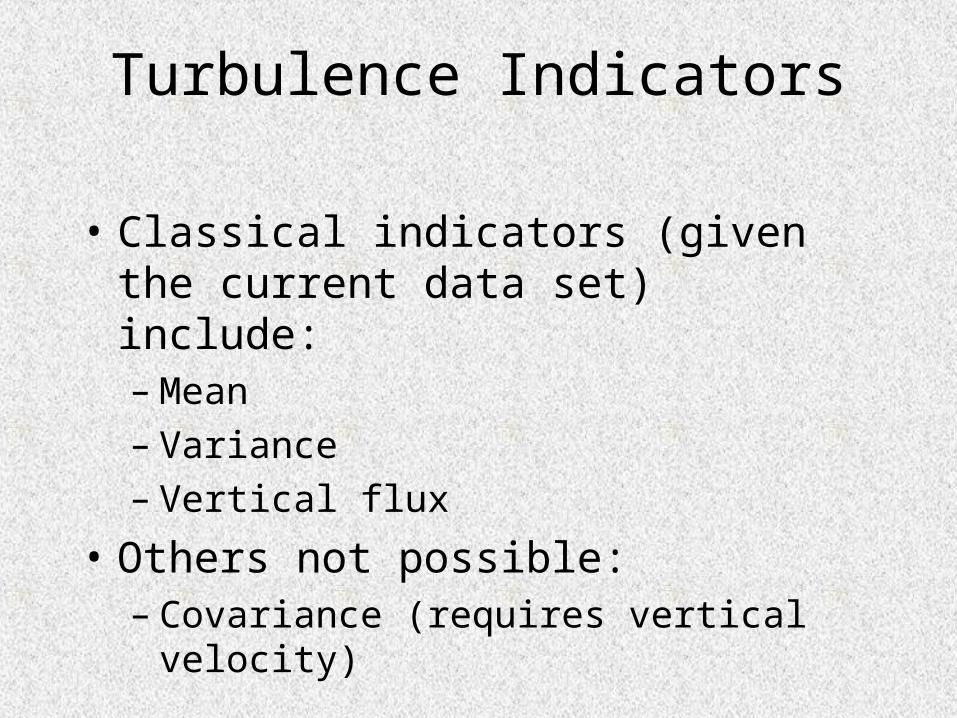
Turbulence Indicators
• Classical indicators (given the current data set) include:– Mean– Variance– Vertical flux
• Others not possible:– Covariance (requires vertical velocity)

Turbulence Results
• Horizontally Averaged Mean (analysis points with data only)
• Variance
Potential Temperature Mixing Ratio

Turbulence Results
Potential Temperature Mixing Ratio
Normalized Vertical Flux

Turbulence Summary
• Horizontally averaged means and variances follow convective boundary layer theory.
• Vertical moisture flux vary widely but the trend follows the expected result for a heated boundary layer.
• Entrainment is strong at the top of the mixed layer.
• A larger data set is needed to increase the averaging space and produce a clearer turbulence picture.

Platform Limitation Analysis
• Need to address the following:– Observation resolution is a function of:
• Instrument sampling rate• Aircraft flight characteristics
• Flight path analysis– Reference frame/source region
• Can we use the data to initialize a numerical model?

Resolution Issues• Function of airspeed and sampling rate
– Instrument sampling rate: 1 hertz– Aircraft airspeed: function of wind loading
• sampling resolution = airspeed/sampling rate
PayloadMass
(kg)
WingLoading
(oz/ft)
RequiredAirspeed
(m/s)
SamplingResolution
(m)
0 15.5 8.5 8.5
1 19.0 9.4 9.4
2 22.86 10.3 10.3
3 26.67 11.2 11.2
4 30.48 12.1 12.1

Observation Point Source Region• Function of the ambient wind speed
tVVxx wa *)(0
Earth Frame Atmosphere (source)
Wind
Model Initialization
• Need a coherent volume of data.
• Strongly coupled features.
• More data is needed than collected in the June Field study.
• Platform resolution is sufficient for LES studies.

Summary• Sampling resolution on the order of 10m
is sufficient for observing boundary layer structures and turbulence.
• Difficulty remains in regards to the source region. A moderate to strong mean wind will hinder detailed studies as the source region continues to vary w.r.t the earth and a numerical model domain.
• ***Age old sampling problem***
Future Efforts• Pre-storm environment and severe
weather observations, dust devils and more turbulence studies.
• New platform may be required to expand capabilities into high-wind environments.
• Redundant sensors using smaller components.
• Expand the sensor array to include wind speeds and insert data into a numerical model.


![Classical Mechanics | [Tom W B Kibble, Frank H Berkshire]](https://img.pdfslide.us/doc/110x75/545fd019b1af9f16598b4ea7/classical-mechanics-tom-w-b-kibble-frank-h-berkshire.jpg)