Embed Size (px)
Citation preview

United States De part mentof Ag ri cul ture
Ani mal andPlant HealthIn spec tionServ ice
Vet eri naryServ ices
Part II: Ref er ence of1999 Ta ble Egg Layer Man age ment
in the U.S.
Na tional Ani mal Health Moni tor ing Sys tem January 2000

Ac knowl edg ments
This report has been prepared from material received and analyzed by the U.S. Department ofAgriculture (USDA), Animal and Plant Health Inspection Service (APHIS), Veterinary Services (VS)during a nationwide study of management and flock health on layer operations.
The Layers ‘99 study was a cooperative effort between State and Federal agricultural statisticians,animal health officials, university researchers, extension personnel, and table egg layer operators. Wewant to thank the industry members who helped determine the direction and objectives of this studyby participating in focus groups.
Thanks to the National Agricultural Statistics Service (NASS) enumerators and State and FederalVeterinary Medical Officers (VMO’s) and Animal Health Technician’s (AHT’s) for their hard workvisiting the operations and collecting the data and for their dedication to the National Animal HealthMonitoring System (NAHMS). The roles of the producer, Area Veterinarian in Charge (AVIC),NAHMS Coordinator, VMO, AHT, and NASS enumerator were critical in providing quality data forLayers ‘99 reports. Special recognition goes to the following individuals for their guidance andadvice:
• Dr. Charles Beard, U.S. Poultry & Egg Ass’n. • Dr. Kenton Kreager, Hy-Line International
• Mr. Don Bell, University of California • Dr. John Mason, Food Safety Consultant Services
• Dr. Dave Castellan, California Dept. of Food & Ag. • Dr. Martin Smeltzer, USDA:APHIS:VS
• Dr. Richard Gast, USDA:Ag. Research Service • Dr. Chuck Strong, Grove River Mills
• Mr. Doug Hoffer, Creighton Brothers
Thanks also to the Centers for Epidemiology and Animal Health (CEAH) for their efforts ingenerating and distributing reports from Layers ‘99 data.
All participants are to be commended for their efforts, particularly the producers whose voluntaryefforts made the Layers ‘99 study possible.
Dr. Nora Wineland, NAHMS Program Leader
Con tacts for Fur ther In for ma tion:
Ques tions or com ments on Lay ers ‘99 study meth od ol ogy or data analy sis:................Dr. Lind sey Gar berIn for ma tion on re prints or other NAHMS re ports:.........................................................Ms. Nina Stan ton Tele phone: (970) 490- 8000 E- mail: NAHM [email protected]
Ta ble of Con tents
In tro duc tion . . . . . . . . . . . . . . . . . . . . . . . . . . . . . . . . . . . . . . . . . . . . . . . . . . 1
Terms used in this re port . . . . . . . . . . . . . . . . . . . . . . . . . . . . . . . . . . . . . . . . . . 2
Sec tion I: Popu la tion Es ti mates . . . . . . . . . . . . . . . . . . . . . . . . . . . . . . . . . . . . . . . . 5
A. Fa cili ties and fa cil ity management. . . . . . . . . . . . . . . . . . . . . . . . . . . . . . . . . . . 5
1. Farm sites with pul lets . . . . . . . . . . . . . . . . . . . . . . . . . . . . . . . . . . 52. Layer houses. . . . . . . . . . . . . . . . . . . . . . . . . . . . . . . . . . . . . . . . 5
B. Gen eral Man age ment . . . . . . . . . . . . . . . . . . . . . . . . . . . . . . . . . . . . . . . . . 13
1. Egg gathering . . . . . . . . . . . . . . . . . . . . . . . . . . . . . . . . . . . . . . 132. Egg processing . . . . . . . . . . . . . . . . . . . . . . . . . . . . . . . . . . . . . . 143. Molting. . . . . . . . . . . . . . . . . . . . . . . . . . . . . . . . . . . . . . . . . . 174. Feed ing practices. . . . . . . . . . . . . . . . . . . . . . . . . . . . . . . . . . . . . 195. Wa ter management . . . . . . . . . . . . . . . . . . . . . . . . . . . . . . . . . . . . 206. Hen den sity (cages) for the last com pleted flock . . . . . . . . . . . . . . . . . . . . 22
C. Pro duc tion Cy cle of Last Com pleted Flock . . . . . . . . . . . . . . . . . . . . . . . . . . . . . 23
1. Age at placement. . . . . . . . . . . . . . . . . . . . . . . . . . . . . . . . . . . . . 232. Ages dur ing the first pro duc tion cycle . . . . . . . . . . . . . . . . . . . . . . . . . . 243. Peak hen- day egg production . . . . . . . . . . . . . . . . . . . . . . . . . . . . . . 264. Egg pro duc tion at 60 weeks of age . . . . . . . . . . . . . . . . . . . . . . . . . . . 275. End of pro duc tion . . . . . . . . . . . . . . . . . . . . . . . . . . . . . . . . . . . . 296. Mor bid ity. . . . . . . . . . . . . . . . . . . . . . . . . . . . . . . . . . . . . . . . . 307. Mor tal ity . . . . . . . . . . . . . . . . . . . . . . . . . . . . . . . . . . . . . . . . . 328. Dis posal of dead and spent hens . . . . . . . . . . . . . . . . . . . . . . . . . . . . . 34
D. Sal mo nella and Myco plasma . . . . . . . . . . . . . . . . . . . . . . . . . . . . . . . . . . . . . 36
1. Test ing for Salmonella . . . . . . . . . . . . . . . . . . . . . . . . . . . . . . . . . . 362. Sal mo nella qual ity as sur ance pro grams . . . . . . . . . . . . . . . . . . . . . . . . . 393. Myco plasma . . . . . . . . . . . . . . . . . . . . . . . . . . . . . . . . . . . . . . . 40
E. Ma nure Handling . . . . . . . . . . . . . . . . . . . . . . . . . . . . . . . . . . . . . . . . . . . 42
1. Ma nure han dling method . . . . . . . . . . . . . . . . . . . . . . . . . . . . . . . . 422. Ma nure disposal . . . . . . . . . . . . . . . . . . . . . . . . . . . . . . . . . . . . . 44

F. Pest Control . . . . . . . . . . . . . . . . . . . . . . . . . . . . . . . . . . . . . . . . . . . . . . 45
1. Ac cess to feed . . . . . . . . . . . . . . . . . . . . . . . . . . . . . . . . . . . . . . 452. Fly control . . . . . . . . . . . . . . . . . . . . . . . . . . . . . . . . . . . . . . . . 463. Ro dent con trol . . . . . . . . . . . . . . . . . . . . . . . . . . . . . . . . . . . . . . 47
G. Biosecurity . . . . . . . . . . . . . . . . . . . . . . . . . . . . . . . . . . . . . . . . . . . . . . 49
1. Non- business visitors . . . . . . . . . . . . . . . . . . . . . . . . . . . . . . . . . . 492. Busi ness visitors . . . . . . . . . . . . . . . . . . . . . . . . . . . . . . . . . . . . . 513. Visi tors in layer house(s) . . . . . . . . . . . . . . . . . . . . . . . . . . . . . . . . . 534. Bar ri ers to farm site ac cess . . . . . . . . . . . . . . . . . . . . . . . . . . . . . . . 535. Em ploy ees/crews. . . . . . . . . . . . . . . . . . . . . . . . . . . . . . . . . . . . . 546. Prox im ity to poul try . . . . . . . . . . . . . . . . . . . . . . . . . . . . . . . . . . . 567. Down time . . . . . . . . . . . . . . . . . . . . . . . . . . . . . . . . . . . . . . . . 58
Sec tion II: Meth od ol ogy . . . . . . . . . . . . . . . . . . . . . . . . . . . . . . . . . . . . . . . . . . . 61
A. Needs assessment . . . . . . . . . . . . . . . . . . . . . . . . . . . . . . . . . . . . . . . . . . . 61B. Sam pling and es ti ma tion . . . . . . . . . . . . . . . . . . . . . . . . . . . . . . . . . . . . . . . 61C. Data col lec tion . . . . . . . . . . . . . . . . . . . . . . . . . . . . . . . . . . . . . . . . . . . . 62D. Data analy sis . . . . . . . . . . . . . . . . . . . . . . . . . . . . . . . . . . . . . . . . . . . . . 63
Appendix I: Sam ple Profile . . . . . . . . . . . . . . . . . . . . . . . . . . . . . . . . . . . . . . . . . 64
A. Re spond ing op era tions . . . . . . . . . . . . . . . . . . . . . . . . . . . . . . . . . . . . . . . . 64
Ap pen dix II: U.S. Table Egg Layers . . . . . . . . . . . . . . . . . . . . . . . . . . . . . . . . . . . . 65

In tro duc tion
The Na tional Ani mal Health Moni tor ing Sys tem’s (NAHMS) Lay ers ‘99 study was de signed toprovide both par tici pants and the in dus try with in for ma tion on the na tion’s ta ble egg layer popu la tionfor edu ca tion and re search. NAHMS is spon sored by the USDA:APHIS:Vet eri nary Serv ices (VS).
Lay ers ‘99 is the first NAHMS na tional study of the layer in dus try. NAHMS de vel oped study ob jec -tives by ex plor ing ex ist ing lit era ture and con tact ing in dus try mem bers and re search ers about theirin for ma tional needs and pri ori ties. The ob jec tives are listed in side the back cover of this re port.
The US DA’s Na tional Ag ri cul tural Sta tis tics Serv ice (NASS) col labo rated with VS to se lect astatistically- valid sam ple from 15 states for Lay ers ‘99 (see map below). The 15- state tar get popu la -tion ac counted for over three- quarters of the ta ble egg lay ers in the U.S. on December 1, 1998.
NASS enu mera tors col lected data for Part I: Ref er ence of 1999 Ta ble Egg Layer Man age ment in theU.S. from 208 sin gle and mul ti ple- farmcompanies via a ques tion naire ad min is teredFeb ru ary 1-26, 1999. These re spon dents pro -vided in for ma tion on 526 farm sites whichformed the ba sis of that re port.
The sec ond phase of data col lec tion was done by Fed eral and state Vet eri nary Medi cal Of fi -cers (VMO’s) and Ani mal HealthTech ni cians (AHT’s) in the 15 states. Datawere col lected on 252 farm sites for Part II:Ref er ence of 1999 Ta ble Egg Layer Man age -ment in the U.S. Via a ques tion nairead min is tered from March 22 through April30, 1999.
In for ma tion in both Parts I and II is operator- reported re flect ing the op era tor’s im pres sion, which may or may not be based on labo ra tory re sults or vet eri nary ad vice. (See meth od ol ogy in for ma tion in Sec -tion II be gin ning on page 61.)
Re sults of the Lay ers ‘99 and other NAHMS stud ies are ac ces si ble on the World Wide Web athttp://www.aphis.usda.gov/vs/ceah/cahm.
For ques tions about this re port or ad di tional Lay ers ‘99 and NAHMS re sults, please con tact:
Cen ters for Epi de mi ol ogy and Ani mal HealthUSDA:APHIS:VS, attn. NAHMS
555 South Howes; Fort Col lins, CO 80521Tele phone: (970) 490- 8000
E- mail: NAHM [email protected]://www.aphis.usda.gov/vs/ceah/cahm
* Iden ti fi ca tion num bers are as signed to each graph of this re port for pub lic ref er ence.
USDA:APHIS:VS 1 Layers ‘99
In tro duc tion
States Participating in the Layers '99 Study
#3950*

Terms Used in This Report
Busi ness visi tor: Any one who had a busi ness rea son for vis it ing the op era tion, such as a sales man,re pair man, feed serv ice per son nel, vet eri nar ian, and com pany per son nel who did not nor mally workon the op era tion.
Com pany owned farm: A cate gory that in cluded in de pend ent pro duc ers.
Con tract farm: A farm site that pro duces eggs for an other com pany. Gen er ally, the con trac tee ownsthe farm and pro vides the la bor.
Con trac tor: A com pany that con tracts with a farm to pro duce eggs for them. Usu ally the con trac torowns the lay ers and sup plies the feed.
Farm site: A con tigu ous land unit that makes up a sin gle prem ises. A farm site may have one ormore layer houses on it.
Flock: A group of birds of simi lar age (may vary sev eral weeks from the me dian age of the flock)con sid ered as a pro duc tion unit. A flock usu ally fills only one layer house, but it may take up more or less than one house.
Hen- day egg pro duc tion: The number of eggs pro duced on the par ticu lar day di vided by the number of hens alive that day in that flock. (Pro duc ers usu ally cal cu late this pa rame ter over a week.)
Hen- housed egg pro duc tion at 60 weeks: The cu mu la tive number of eggs pro duced by the flockun til the birds are 60 weeks of age di vided by the number of birds origi nally placed in the flock.
Last com pleted flock: The most re cent flock that com pleted its pro duc tion cy cle and was then re -moved from the farm.
Layer: A chicken that pro duces eggs for ta ble use or egg products.
Molt: That pe riod of time when birds are taken out of pro duc tion (usu ally around 65 weeks of age)un til they re turn ap proxi mately to their 18- week weight. Af ter a rest pe riod, they are re turned to pro -duc tion for an other lay ing cy cle.
N/A: Not ap pli ca ble.
Non- business visi tor: Any one who did not have a busi ness rea son for vis it ing the op era tion, such asfriends, fam ily mem bers, and tours.
Popu la tion es ti mates: Av er ages and pro por tions weighted to rep re sent the popu la tion. For this re -port, the ref er ence popu la tion was all company- owned and con tract farms as so ci ated with(com pa nies) op era tions that had 30,000 or more lay ers on De cem ber 1, 1998, in the 15 par tici pat ingstates. Most of the es ti mates in this re port are pro vided with a meas ure of pre ci sion called the stan -dard er ror. If the only er ror is sam pling er ror, chances are 95 out of 100 that the in ter val cre ated bythe es ti mate plus or mi nus two stan dard er rors will con tain the true popu la tion value. In the ex am pleil lus trated, an es ti mate of 7.5 with a stan dard er ror of 1.0 re sults in a range of 5.5 to 9.5 (two times the stan dard er ror above and be low the es ti mate). The sec ond es ti mate of 3.4 shows a stan dard er ror of
Equine ‘98 2 USDA:APHIS:VS
Terms Used in This Report In tro duc tion

0.3 and re sults in a range of 2.8 to 4.0. Simi larly, the 90 per centcon fi dence in ter val would be cre ated by mul ti ply ing the stan darder ror by 1.65 in stead of two. Where dif fer ences be tween groupsare noted in this re port, the 90% con fi dence in ter vals do not over -lap. Most es ti mates in this re port are rounded to the near est tenth. If rounded to 0, the stan dard er ror was re ported. If there were nore ports of the event, no stan dard er ror was re ported.
Pul let: A fe male chicken less than 20 weeks of age. A pul letplaced in the lay ing house is called a layer.
Re gions:Great Lakes: In di ana, Ohio, and Penn syl va nia.South east: Ala bama, Flor ida, Geor gia, and North Caro lina.
Cen tral: Ar kan sas, Iowa, Min ne sota, Mis souri, and Ne braska.West: Cali for nia, Texas, and Wash ing ton.
Sam ple pro file: In for ma tion that de scribes char ac ter is tics of theop era tions from which Lay ers ‘99 data were col lected.
Size of farm site: Size group ings based on number of lay ers 20 weeks of age or older pres ent on De -cem ber 1, 1998. For this re port, sizes of farm sites were less than 100,000 and 100,000 or more.
Spent hen: A layer that has completed its egg pro duc tion cy cle.
USDA:APHIS:VS 3 Layers ‘99
In tro duc tion Terms Used in This Report
Examples of a 95% Confidence Interval
(1.0) (0.3)Standard Errors
0
2
4
6
8
10
#2360
95% Confidence
Intervals

Layers ‘99 4 USDA:APHIS:VS
Terms Used in This Report In tro duc tion

Sec tion I: Popu la tion Es ti mates
A. Fa cili ties and Fa cil ity Management
1. Farm sites with pullets
A to tal of 11.5 per cent of layer farm sites had pul let rais ing fa cili ties on the farm site.
a. Percent of layer farm sites with pullet facilities on the same farm site:
Per centFarm Sites
Stan dardEr ror
11.5 (2.8)
2. Layer houses
About one- third (34.5 per cent) of farm sites had only one layer house.
NOTE: Only op era tions with 30,000 or more lay ers were in cluded in the study. Had smaller op era tionsbeen in cluded, the per cent age of farm sites with only one house would likely have been higher.
a. Percent of farm sites by number of layer houses on the farm site:
Num ber Layer HousesPer cent
Farm SitesStan dard
Er ror
1 34.5 (7.0)
2 24.5 (3.8)
3 - 5 24.5 (3.9)
6 or more 16.5 (2.4)
Total 100.0
USDA:APHIS:VS 5 Layers ‘99
Sec tion I: Popu la tion Es ti mates A. Fa cili ties and Fa cil ity Management

All to gether, 76.8 per cent of houses were 10 years old or older, and about half of those (38.7 per cent) were 20 years old or older. Nearly one- half (45.4 per cent) of farm sites had at least one house that was 20 years old or older. Data on age of houses were col lected only by cate gory.
b. Percent of farm sites (and percent of layer houses) by age of layer houses:
Layer HouseAge Category
Per centFarm Sites
Stan dard Er ror
Per centLayer
HousesStan dard
Er ror
Less than 5 years 18.9 (3.6) 9.7 (1.9)
5 - 9 years 17.4 (3.5) 13.5 (3.4)
10 - 19 years 47.2 (4.0) 38.1 (4.3)
20 or more years 45.4 (4.6) 38.7 (4.1)
Total -- 100.0
The West re gion had the larg est per cent age of farm sites with at least one house that was 20 years old or older (71.2 per cent).
i. Percent of farm sites by age of layer houses and by region:
Per cent Farm Sites by Region
Great Lakes Southeast Central West
Layer HouseAge Category Percent
Stan dardEr ror Percent
Stan dardEr ror Per ce nt
Stan dardEr ror Per ce nt
Stan dardEr ror
Less than 5 years 21.9 (8.2) 16.1 (4.0) 32.7 (10.1) 7.2 (1.9)
5 - 9 years 16.8 (8.0) 21.6 (7.3) 17.2 (4.6) 14.4 (2.9)
10 - 19 years 60.6 (8.1) 50.4 (5.7) 31.0 (5.9) 37.0 (6.1)
20 or more years 29.6 (9.0) 36.8 (6.2) 51.7 (8.8) 71.2 (6.2)
Layers ‘99 6 USDA:APHIS:VS
A. Fa cili ties and Fa cil ity Management Sec tion I: Popu la tion Es ti mates
Percent of Farm Sites by Age of Layer Houses and by Region
#4167
71.2
51.7
29.6 36.837 31
60.650.4
14.4 17.2 16.8 21.67.2
32.721.9 16.1
West Central Great Lakes Southeast
Region
0
25
50
75
100
Percent Farm Sites
<5 years5 - 9 years10 - 19 years20+ years
West
Central
Southeast
Great Lakes

The larg est per cent age of houses (39.5 per cent) had a maxi mum ca pac ity of less than 30,000 lay ers.Only 1.3 per cent of houses could hold 200,000 or more lay ers.
c. Percent of farm sites (and percent of layer houses) by house capacity (maximum number of layershoused):
House Ca pac ity(Maximum Lay ers
Housed)Per cent
Farm SitesStan dard
Er ror
Per centLayer
HousesStan dard
Er ror
Less than 30,000 40.2 (5.5) 39.5 (4.4)
30,000 - 69,999 39.0 (3.8) 24.7 (3.3)
70,000 - 119,999 31.8 (4.5) 22.3 (3.1)
120,000 - 199,999 12.2 (4.3) 12.2 (2.9)
200,000 or more 1.7 (1.1) 1.3 (0.8)
Total -- 100.0
The Great Lakes re gion was the only re gion with layer houses that could hold 200,000 or more lay ers.No farm sites in the South east re gion had houses with a ca pac ity of 120,000 or more. In the otherre gions, the per centage of farm sites with at least one house that could hold 120,000 to 199,999 lay ersranged from a low of 4.0 per cent of farm sites in the West re gion to a high of 23.6 per cent of farm sites in the Great Lakes re gion.
i. Percent of farm sites by house capacity (maximum number of layers housed) and by region:
Per cent Farm Sites by Region
Great Lakes Southeast Central West
House Ca pac ity(Num ber Lay ers
Housed) PercentStan dard
Er ror PercentStan dard
Er ror Per ce ntStan dard
Er ror Per ce ntStan dard
Er ror
Less than 30,000 30.0 (13.2) 40.6 (8.4) 33.2 (8.7) 59.3 (7.7)
30,000 - 69,999 42.9 (8.8) 34.3 (5.9) 48.5 (6.4) 30.9 (5.4)
70,000 - 119,999 30.2 (8.6) 46.6 (10.3) 31.4 (7.2) 20.8 (6.7)
120,000 - 199,999 23.6 (12.3) 0.0 (--) 17.1 (4.8) 4.0 (1.3)
200,000 or more 4.8 (3.1) 0.0 (--) 0.0 (--) 0.0 (--)
USDA:APHIS:VS 7 Layers ‘99
Sec tion I: Popu la tion Es ti mates A. Fa cili ties and Fa cil ity Management
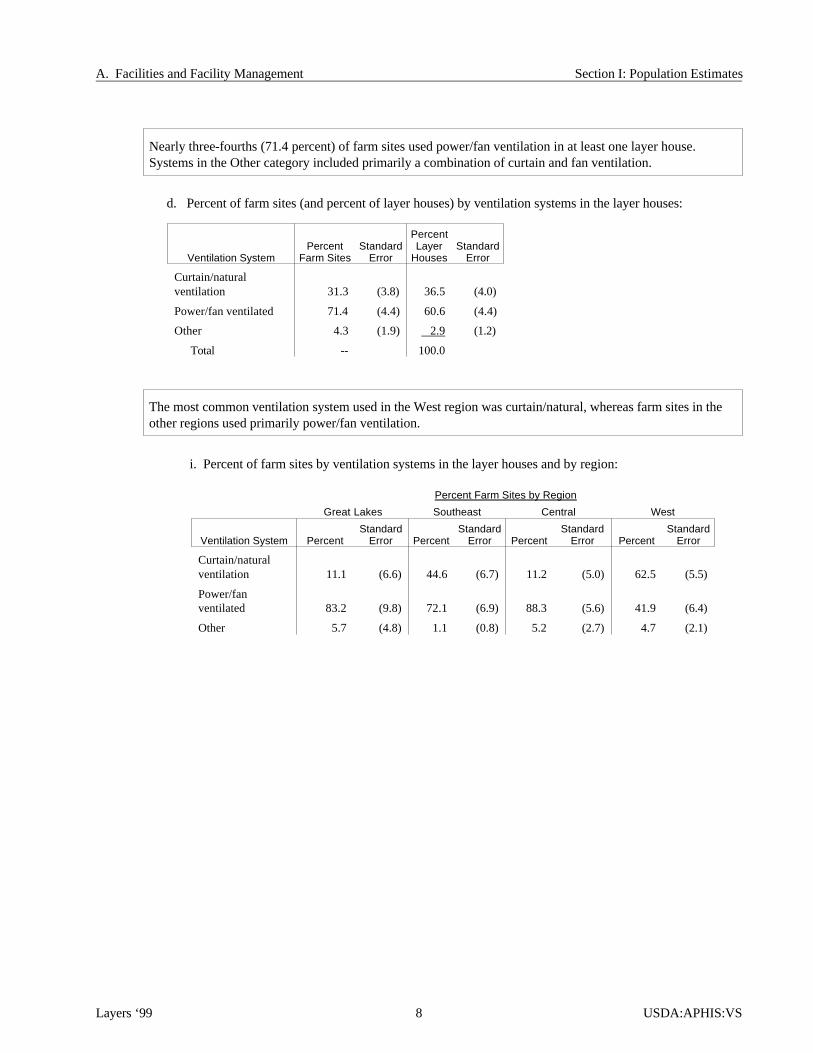
Nearly three-fourths (71.4 per cent) of farm sites used power/fan ven ti la tion in at least one layer house.Sys tems in the Other cate gory included primar ily a com bination of cur tain and fan ven ti la tion.
d. Percent of farm sites (and percent of layer houses) by ventilation systems in the layer houses:
Ventilation Sys temPer cent
Farm SitesStan dard
Er ror
Per centLayer
HousesStan dard
Er ror
Curtain/naturalventilation 31.3 (3.8) 36.5 (4.0)
Power/fan ventilated 71.4 (4.4) 60.6 (4.4)
Other 4.3 (1.9) 2.9 (1.2)
Total -- 100.0
The most com mon ven ti la tion system used in the West re gion was cur tain/natu ral, whereas farm sites in theother re gions used pri mar ily power/fan ven ti lation.
i. Percent of farm sites by ventilation systems in the layer houses and by region:
Per cent Farm Sites by Region
Great Lakes Southeast Central West
Ventilation Sys tem PercentStan dard
Er ror PercentStan dard
Er ror Per ce ntStan dard
Er ror Per ce ntStan dard
Er ror
Curtain/naturalventilation 11.1 (6.6) 44.6 (6.7) 11.2 (5.0) 62.5 (5.5)
Power/fanventilated 83.2 (9.8) 72.1 (6.9) 88.3 (5.6) 41.9 (6.4)
Other 5.7 (4.8) 1.1 (0.8) 5.2 (2.7) 4.7 (2.1)
Layers ‘99 8 USDA:APHIS:VS
A. Fa cili ties and Fa cil ity Management Sec tion I: Popu la tion Es ti mates
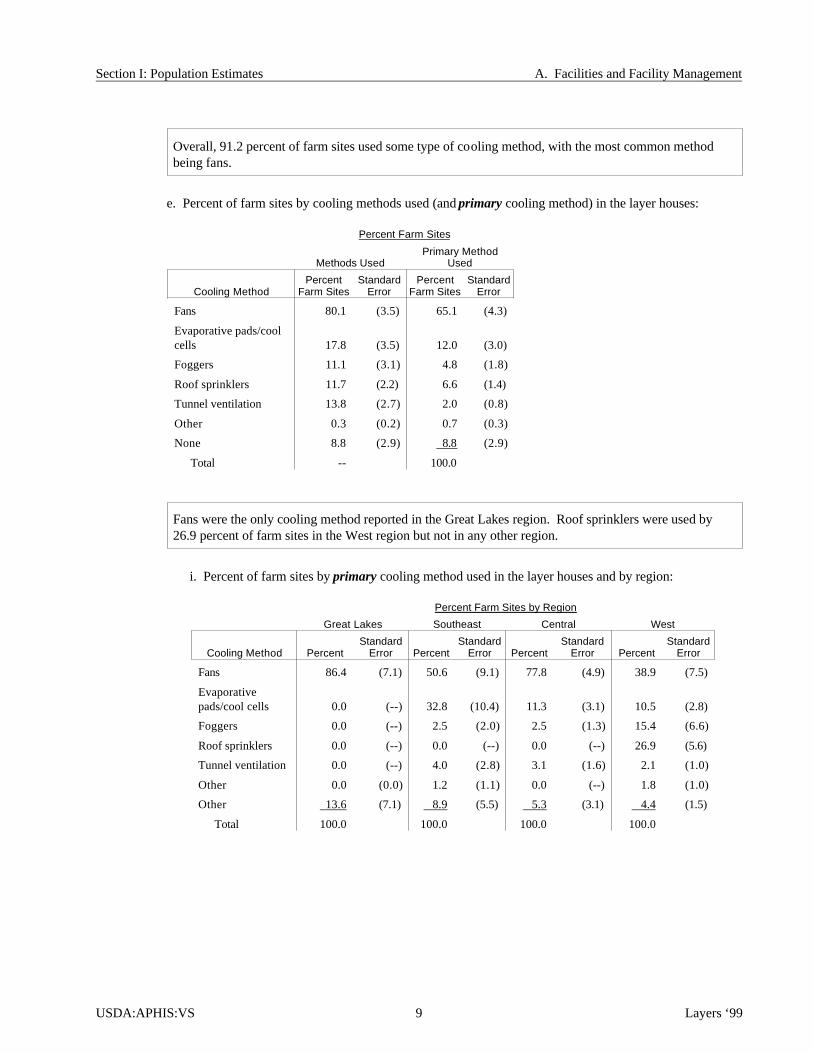
Over all, 91.2 per cent of farm sites used some type of cool ing method, with the most com mon methodbe ing fans.
e. Percent of farm sites by cooling methods used (and primary cooling method) in the layer houses:
Per cent Farm Sites
Meth ods UsedPri mary Method
Used
Cool ing MethodPer cent
Farm SitesStan dard
Er rorPer cent
Farm SitesStan dard
Er ror
Fans 80.1 (3.5) 65.1 (4.3)
Evaporative pads/coolcells 17.8 (3.5) 12.0 (3.0)
Foggers 11.1 (3.1) 4.8 (1.8)
Roof sprinklers 11.7 (2.2) 6.6 (1.4)
Tunnel ventilation 13.8 (2.7) 2.0 (0.8)
Other 0.3 (0.2) 0.7 (0.3)
None 8.8 (2.9) 8.8 (2.9)
Total -- 100.0
Fans were the only cool ing method re ported in the Great Lakes re gion. Roof sprin klers were used by26.9 per cent of farm sites in the West re gion but not in any other re gion.
i. Percent of farm sites by primary cooling method used in the layer houses and by region:
Per cent Farm Sites by Region
Great Lakes Southeast Central West
Cool ing Method PercentStan dard
Er ror PercentStan dard
Er ror Per ce ntStan dard
Er ror Per ce ntStan dard
Er ror
Fans 86.4 (7.1) 50.6 (9.1) 77.8 (4.9) 38.9 (7.5)
Evaporativepads/cool cells 0.0 (--) 32.8 (10.4) 11.3 (3.1) 10.5 (2.8)
Foggers 0.0 (--) 2.5 (2.0) 2.5 (1.3) 15.4 (6.6)
Roof sprinklers 0.0 (--) 0.0 (--) 0.0 (--) 26.9 (5.6)
Tunnel ventilation 0.0 (--) 4.0 (2.8) 3.1 (1.6) 2.1 (1.0)
Other 0.0 (0.0) 1.2 (1.1) 0.0 (--) 1.8 (1.0)
Other 13.6 (7.1) 8.9 (5.5) 5.3 (3.1) 4.4 (1.5)
Total 100.0 100.0 100.0 100.0
USDA:APHIS:VS 9 Layers ‘99
Sec tion I: Popu la tion Es ti mates A. Fa cili ties and Fa cil ity Management

Al though rare, there were some houses (0.8 per cent) that re lied on natu ral light only, with no sup ple men talar ti fi cial light.
f. Percent of layer houses by type of lighting used:
Type of Lighting
Per centLayer
HousesStan dard
Er ror
Artificial only 47.5 (5.3)
Both natural andartificial (bracketedday length) 51.7 (5.3)
Natural light only 0.8 (0.5)
Total 100.0
Fluo res cent light ing was used alone in 56.8 per cent of layer houses and in combi na tion with in can des centlight ing in 12.1 per cent of houses.
i. For layer houses in which artificial light was used, percent of layer houses by type of artificiallighting used:
Type of Ar ti fi cial Lighting
Per centLayer
HousesStan dard
Er ror
Fluorescent 56.8 (5.3)
Incandescent 31.1 (5.3)
Both fluorescent andincandescent 12.1 (3.5)
Total 100.0
Layers ‘99 10 USDA:APHIS:VS
A. Fa cili ties and Fa cil ity Management Sec tion I: Popu la tion Es ti mates
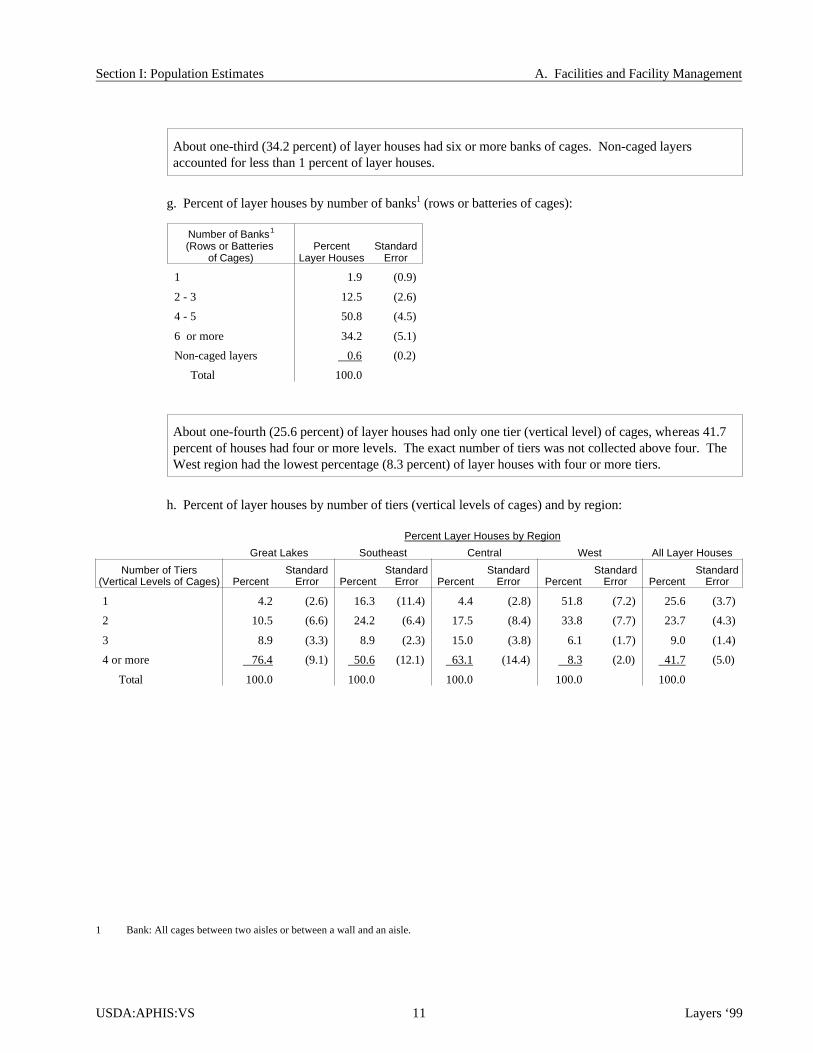
About one- third (34.2 per cent) of layer houses had six or more banks of cages. Non- caged lay ersac counted for less than 1 per cent of layer houses.
g. Percent of layer houses by number of banks1 (rows or batteries of cages):
Num ber of Banks1
(Rows or Bat ter ies of Cages)
Per centLayer Houses
Stan dardEr ror
1 1.9 (0.9)
2 - 3 12.5 (2.6)
4 - 5 50.8 (4.5)
6 or more 34.2 (5.1)
Non-caged layers 0.6 (0.2)
Total 100.0
About one-fourth (25.6 per cent) of layer houses had only one tier (ver ti cal level) of cages, whereas 41.7per cent of houses had four or more lev els. The ex act number of tiers was not col lected above four. TheWest re gion had the low est per cent age (8.3 per cent) of layer houses with four or more tiers.
h. Percent of layer houses by number of tiers (vertical levels of cages) and by region:
Per cent Layer Houses by Region
Great Lakes Southeast Central West All Layer Houses
Num ber of Tiers(Ver ti cal Lev els of Cages) Percent
Stan dardEr ror Percent
Stan dard Er ror Per ce nt
Stan dardEr ror Per ce nt
Stan dardEr ror Per ce nt
Stan dard Er ror
1 4.2 (2.6) 16.3 (11.4) 4.4 (2.8) 51.8 (7.2) 25.6 (3.7)
2 10.5 (6.6) 24.2 (6.4) 17.5 (8.4) 33.8 (7.7) 23.7 (4.3)
3 8.9 (3.3) 8.9 (2.3) 15.0 (3.8) 6.1 (1.7) 9.0 (1.4)
4 or more 76.4 (9.1) 50.6 (12.1) 63.1 (14.4) 8.3 (2.0) 41.7 (5.0)
Total 100.0 100.0 100.0 100.0 100.0
USDA:APHIS:VS 11 Layers ‘99
Sec tion I: Popu la tion Es ti mates A. Fa cili ties and Fa cil ity Management
1 Bank: All cages between two aisles or between a wall and an aisle.

Nearly one- half (47.8 per cent) of layer houses used a chain feed de liv ery sys tem. A hand cart feed ing sys temwas used for 12.6 per cent of layer houses.
i. Percent of layer houses by system used to deliver feed to layers:
Feed Sys temPer cent
Layer HousesStan dard
Er ror
Chain 47.8 (4.4)
Auger, cable, or paddle system 28.3 (4.1)
Traveling hopper system 7.8 (3.6)
Hand cart system 12.6 (3.1)
Other 3.5 (1.8)
Total 100.0
Layers ‘99 12 USDA:APHIS:VS
A. Fa cili ties and Fa cil ity Management Sec tion I: Popu la tion Es ti mates
Percent of Layer Houses by System Used to Deliver Feed to Layers
Chain47.8%
Auger/cable/paddle28.3%
Traveling hopper7.8%
Hand cart12.6%
Other3.5%
#4168

B. General Management
1. Egg gathering
Gath er ing eggs by hand was most com mon in the West re gion where over one- half (58.3 per cent) of farm sites gath ered eggs only by hand, and an other 9.7 per cent of farm sites used both belt and hand gath er ing.
a. Percent of farm sites by method of gathering eggs in December 1998 and by region:
Per cent Farm Sites by Region
Great Lakes Southeast Central West All Farm Sites
Pri mary Method ofGathering Eggs Percent
Stan dardEr ror Percent
Stan dard Er ror Per ce nt
Stan dardEr ror Per ce nt
Stan dardEr ror Per ce nt
Stan dard Er ror
Hand gathered only 16.8 (9.8) 19.5 (6.8) 22.6 (7.8) 58.3 (7.0) 28.6 (4.5)
Belt gathered only 77.9 (10.1) 79.5 (6.7) 74.1 (8.1) 32.0 (6.8) 66.3 (4.6)
Both hand and belt 5.3 (5.0) 1.0 (0.7) 3.3 (3.3) 9.7 (2.3) 5.1 (1.9)
Total 100.0 100.0 100.0 100.0 100.0
The per centage of eggs gathered by hand ranged from 2.2 per cent in the Cen tral re gion to 38.7 per cent inthe West re gion.
i. Percent of eggs gathered in December 1998 by method and by region:
Per cent Eggs by Region
Great Lakes Southeast Central West All Farm Sites
Method Used to Gather PercentStan dard
Er ror PercentStan dard
Er ror Per ce ntStan dard
Er ror Per ce ntStan dard
Er ror Per ce ntStan dard
Er ror
Hand 3.5 (2.9) 4.2 (2.4) 2.2 (0.9) 38.7 (5.9) 10.6 (2.1)
Belt 96.5 (2.9) 95.8 (2.4) 97.8 (0.9) 61.3 (5.9) 89.4 (2.1)
Total 100.0 100.0 100.0 100.0 100.0
USDA:APHIS:VS 13 Layers ‘99
Sec tion I: Popu la tion Es ti mates B. General Management
38.7
2.2 3.5 4.2
West Central Great Lakes Southeast
Region
0
10
20
30
40
50
Percent Eggs
West
Central
Southeast
Great Lakes
Percent Eggs Gathered by Hand in December 1998 by Region
#4169

2. Egg proc ess ing
Over three-fourths of farm sites in every re gion proc essed eggs off farm.
a. Percent of farm sites by primary egg processing location and by region:
Per cent Farm Sites by Region
Great Lakes Southeast Central West All Farm Sites
Pri mary Egg Proc ess ing Location Percent
Stan dardEr ror Percent
Stan dardEr ror Per ce nt
Stan dardEr ror Per ce nt
Stan dardEr ror Per ce nt
Stan dard Er ror
On farm in-line 17.8 (8.4) 13.1 (4.3) 9.0 (3.2) 10.9 (2.4) 13.5 (3.0)
On farm off-line 6.7 (5.4) 0.6 (0.6) 3.3 (3.3) 9.3 (2.4) 5.3 (2.1)
Off farm 75.5 (8.1) 86.3 (4.4) 87.7 (4.5) 79.8 (3.6) 81.2 (3.2)
Total 100.0 100.0 100.0 100.0 100.0
Layers ‘99 14 USDA:APHIS:VS
B. General Management Sec tion I: Popu la tion Es ti mates
Percent of Farm Sites by Primary Egg Processing Location and by Region
#4170
79.8 87.775.5
86.3
9.3 3.3 6.7 0.610.9 9
17.8 13.1
West Central Great Lakes Southeast
Region
0
25
50
75
100
Percent Farm Sites
On farm in-lineOn farm off-lineOff farm
West
Central
Southeast
Great Lakes

Only 6.4 per cent of farm sites had an av er age of 6 or more days be tween egg pick ups. Over one-third(38.8 per cent) of farm sites did not know the humid ity at which eggs were stored on farm. (Less than 5per cent of farm sites did not report the other pa rame ters in this ta ble.) Eggs from over three-fourths (77.1 per cent) of farm sites trav eled 10 or more miles to a proc ess ing plant. Pre wash ing of eggs be foreproc ess ing was re la tively un com mon (4.9 per cent of farm sites).
b. For farm sites that primarily processed eggs off farm, percent of farm sites by on-farm eggmanagement characteristics:
Man age ment CharacteristicPer cent
Farm SitesStan dard
Er ror
Average number days between egg pickups:
1 - 2 48.5 (7.4)
3 - 5 45.1 (7.5)
6 - 9 6.2 (2.7)
10 or more 0.2 (0.1)
Total 100.0
Usual temperature for egg storage on farm:
Less than 50 degrees 21.2 (5.2)
50 - 59 degrees 51.0 (8.2)
60 or more degrees 27.8 (5.7)
Total 100.0
Usual humidity level for egg storage on farm:
Less than 50 percent 2.6 (1.3)
50 - 74 percent 29.4 (5.5)
75 percent or higher 29.2 (5.8)
Didn’t know 38.8 (6.6)
Total 100.0
Distance (miles) to the processing plant where themajority of eggs were processed:
Less than 5 miles 12.0 (3.1)
5 - 9 miles 10.9 (2.5)
10 or more miles 77.1 (4.5)
Total 100.0
Prewashed eggs before sending them to beprocessed:
Yes 4.9 (2.3)
No 95.1 (2.3)
Total 100.0
USDA:APHIS:VS 15 Layers ‘99
Sec tion I: Popu la tion Es ti mates B. General Management

The ma jor ity of farm sites (71.6 per cent) used re us able plas tic flats that were cleaned and dis in fected be tween uses. Racks were re turned to the same farm site on 29.2 per cent of farm sites.
c. For farm sites that primarily processed eggs off farm, percent of farm sites by:
Man age ment CharacteristicPer cent
Farm SitesStan dard
Er ror
Primary types of flats used for storage/transportation:
Disposable fiber 18.5 (8.1)
Reusable plastic, cleaned and disinfected 71.6 (8.0)
Reusable plastic, not cleaned and disinfected 9.9 (2.5)
Total 100.0
Usual handling of racks:
Returned to the same farm site 29.2 (8.8)
Cleaned before reuse 35.4 (6.2)
Disinfected before reuse 24.8 (6.9)
About three- fourths (78.6 per cent) of eggs pro duced by the last com pleted flocks (one flock per farm site)were size large or above.
d. For the last completed flock, percent of eggs that were size large and above:
Per centEggs
Stan dardEr ror
78.6 (1.4)
A to tal of 5.8 per cent of eggs pro duced at 60 weeks of age by the last com pleted flocks (one flock per farmsite) were bro ken or cracked.
e. For the last completed flock, percent of eggs that were broken/cracked at 60 weeks of age:
Per centEggs
Stan dardEr ror
5.8 (0.4)
Layers ‘99 16 USDA:APHIS:VS
B. General Management Sec tion I: Popu la tion Es ti mates

3. Molt ing
Rou tine molt ing was most com mon in the South east and West re gions (97.0 per cent and 94.9 per cent offarm sites re spec tively).
a. Percent of farm sites by routine molting method used and by region:
Per cent Farm Sites by Region
Great Lakes Southeast Central West All Farm Sites
Rou tine Molt ing Method PercentStan dard
Er ror PercentStan dard
Er ror Per ce ntStan dard
Er ror Per ce ntStan dard
Er ror Per ce ntStan dard
Er ror
Do not usually molt 22.1 (10.1) 3.0 (1.9) 43.1 (9.0) 5.1 (1.6) 17.4 (4.2)
Withhold or restrict feed a set number of days 7.6 (5.7) 12.5 (5.0) 13.9 (5.4) 24.7 (6.7) 14.0 (3.3)
Withhold or restrict feeduntil a certain weight isachieved (monitor weight) 70.3 (10.0) 84.5 (5.8) 43.0 (9.9) 70.2 (6.3) 68.6 (4.6)
Other 0.0 (--) 0.0 (--) 0.0 (--) 0.0 (--) 0.0 (--)
Total 100.0 100.0 100.0 100.0 100.0
While 17.4 per cent of farm sites usu ally did not molt (Ta ble B.3.a), 25.8 per cent of farm sites did notmolt their last com pleted flock. In the West, 32.1 per cent of last com pleted flocks were molted twice.
b. Percent of farm sites by number of times the last completed flock was molted by region:
Per cent Farm Sites by Region
Great Lakes Southeast Central West All Farm Sites
Num berTimes Molted Percent
Stan dard Er ror Percent
Stan dardEr ror Per ce nt
Stan dardEr ror Per ce nt
Stan dardEr ror Per ce nt
Stan dardEr ror
0 30.0 (9.5) 7.3 (3.0) 48.8 (7.9) 17.9 (3.5) 25.8 (4.1)
1 65.2 (8.7) 80.2 (8.1) 51.2 (7.9) 50.0 (6.1) 62.1 (4.2)
2 4.8 (4.4) 12.5 (6.4) 0.0 -- 32.1 (7.8) 12.1 (3.0)
Total 100.0 100.0 100.0 100.0 100.0
USDA:APHIS:VS 17 Layers ‘99
Sec tion I: Popu la tion Es ti mates B. General Management
32.1
0 4.812.5
50 51.265.2
80.2
17.9
48.8
30
7.3
West Central Great Lakes Southeast
Region
0
25
50
75
100
Percent Farm Sites
0 Times1 Time2 Times
Percent of Farm Sites by Number of Times the Last Completed Flock Was Molted and by Region
#4171
West
Central
Southeast
Great Lakes

For last com pleted flocks that were molted, 7.9 per cent of flocks molted at less than 62 weeks of age, and18.1 per cent molted at 72 weeks of age or older.
c. For farms where the last completed flock was molted, percent of farms by age (weeks) at which flockstarted first molt:
Age (Weeks)Per cent
Farm SitesStan dard
Er ror
Less than 62 7.9 (3.1)
62 - 66 32.6 (4.9)
67 - 71 41.4 (5.4)
72 or more 18.1 (3.9)
Total 100.0
Layers ‘99 18 USDA:APHIS:VS
B. General Management Sec tion I: Popu la tion Es ti mates

4. Feed ing prac tices
Dur ing peak pro duc tion, about one-third (35.5 per cent) of farm sites nor mally fed lay ers five or moretimes per day, and an other 5.6 per cent fed con tinuously.
a. Percent of farm sites by number of times per day layers are normally fed during peak production and byregion:
Per cent Farm Sites by Region
Great Lakes Southeast Central West All Farm Sites
Num ber of Feed ings per Day Dur ing
Peak Production PercentStan dard
Er ror PercentStan dard
Er ror Per ce ntStan dard
Er ror Per ce ntStan dard
Er ror Per ce ntStan dard
Er ror
1 - 2 16.8 (9.8) 14.2 (6.9) 21.2 (7.4) 26.3 (5.6) 19.3 (4.1)
3 32.1 (13.3) 11.6 (4.7) 10.2 (4.2) 8.0 (3.3) 17.6 (5.6)
4 12.9 (7.4) 27.5 (8.9) 30.8 (6.5) 23.4 (7.3) 22.0 (4.2)
5 or more 27.8 (13.8) 46.7 (6.8) 37.8 (8.9) 34.5 (4.6) 35.5 (5.7)
Continuously fed 10.4 (7.1) 0.0 (--) 0.0 (--) 7.8 (2.8) 5.6 (2.5)
Total 100.0 100.0 100.0 100.0 100.0
Less than 1 per cent of farm sites fed their lay ers pel leted or crumbled feed (0.9 per cent each).
b. Percent of farm sites by type of feed fed to layers:
Type of Feed FedPer cent
Farm SitesStan dard
Er ror
Mash/ground 98.2 (0.8)
Pelleted 0.9 (0.7)
Crumbled 0.9 (0.5)
Total 100.0
USDA:APHIS:VS 19 Layers ‘99
Sec tion I: Popu la tion Es ti mates B. General Management

5. Wa ter management
Cup drinkers were the most com mon wa ter de liv ery sys tem used in the West (75.2 per cent of farm sites),whereas nip ple drink ers were more com mon in the other re gions.
a. Percent of farm sites by water delivery systems used and by region:
Per cent Farm Sites by Region
Great Lakes Southeast Central West All Farm Sites
Wa ter De liv ery System PercentStan dard
Er ror PercentStan dard
Er ror Per ce ntStan dard
Er ror Per ce ntStan dard
Er ror Per ce ntStan dard
Er ror
Nipple drinkers 70.2 (13.5) 65.5 (8.9) 73.5 (10.4) 37.8 (6.7) 61.7 (5.8)
Cup drinkers 25.9 (8.9) 30.1 (9.6) 29.5 (9.3) 75.2 (5.5) 39.6 (5.1)
Troughs (includesbasin, and bell Plasson) 24.3 (9.9) 9.2 (2.7) 4.1 (2.5) 0.7 (0.6) 11.5 (3.9)
About one-half (43.4 per cent) of farm sites had an av erage of six to nine lay ers per drinker.
i. For farm sites that used nipple or cup drinkers, percent of farms by average number of layers perdrinker:
Av er age Num ber LayersPer cent
Farm SitesStan dard
Er ror
Less than 6 37.1 (5.2)
6 - 9 43.4 (5.4)
10 or more 19.5 (3.1)
Total 100.0
Layers ‘99 20 USDA:APHIS:VS
B. General Management Sec tion I: Popu la tion Es ti mates
Percent of Farm Sites by Water Delivery Systems Used and by Region
#4172
0.7 4.124.3
9.2
75.2
29.5 25.9 30.137.8
73.5 70.2 65.5
West Central Great Lakes Southeast
Region
0
25
50
75
100
Percent Farm Sites
Nipple drinkersCup drinkersTroughs*
West
Central
Southeast
Great Lakes
*Includes basin and bell plasson.

About two-thirds (66.0 per cent) of farm sites used wells less than 300 feet deep as their pri mary wa tersource. A mu nici pal wa ter source was most commonly used in the W est re gion (16.7 per cent of farmsites).
b. Percent of farm sites by primary source of drinking water for layers and by region:
Per cent Farm Sites by Region
Great Lakes Southeast Central West All Farm Sites
Pri mary Source PercentStan dard
Er ror PercentStan dard
Er ror Per ce ntStan dard
Er ror Per ce ntStan dard
Er ror Per ce ntStan dard
Er ror
Well water less than 300feet deep 83.8 (8.8) 47.2 (7.7) 68.6 (4.7) 56.4 (7.4) 66.0 (4.3)
Well water 300 feet deep or more 16.2 (8.8) 48.2 (7.4) 21.7 (4.6) 25.6 (6.9) 26.8 (4.2)
Municipal water 0.0 (--) 4.6 (2.1) 5.3 (2.9) 16.7 (4.0) 6.1 (1.4)
Other 0.0 (--) 0.0 (--) 4.4 (2.7) 1.3 (0.7) 1.1 (0.5)
Total 100.0 100.0 100.0 100.0 100.0
For farm sites that did not use a mu nici pal wa ter source, 15.0 per cent of farm sites chlo rin ated the wa ter,7.6 per cent of farm sites used wa ter sof ten ers, and 9.9 per cent of farm sites used ion iz ers for drinkingwa ter for lay ers.
i. For farm sites where the primary source of drinking water for layers was not municipal, percent offarm sites that used the following water treatments on drinking water for layers:
Wa ter Treat ments UsedPer cent
Farm SitesStan dard
Er ror
Chlorination 15.0 (3.5)
Water softeners 7.6 (3.2)
Ionizers 9.9 (4.2)
Any of the above 28.1 (5.0)
USDA:APHIS:VS 21 Layers ‘99
Sec tion I: Popu la tion Es ti mates B. General Management
Percent of Farm Sites by Primary Source of Drinking Water for Layers
300 or more ft deep26.8%
Municipal water6.1%
Other1.1%
<300 ft deep66.0%
#4173
Well Water
Well Water
Percent of Farm Sites Where the Primary Source of Drinking Water for Layers Was from a
Well Less than 300 Feet Deep by Region
56.4
68.6
83.8
47.2
West Central Great Lakes Southeast
Region
0
25
50
75
100
Percent Farm Sites
#4207

6. Hen den sity (cages) for the last com pleted flock
For flocks in cages, an av er age of 5.6 lay ers was placed per cage.
a. Average number hens placed per cage:
Av er age Num berHens per Cage
Stan dard Er ror
5.6 (0.2)
The av er age floor space for flocks in cages was 53.4 square inches per layer placed.
b. Average number of square inches of floor space per hen placed:
Av er age Num berSquare Inches
Stan dardEr ror
53.4 (0.7)
A to tal of 83.4 per cent of farm sites provided 48 square inches or more of cage floor space per layer placed.
c. Percent of farm sites by number of square inches of floor space per hen placed:
Num ber Square InchesPer cent
Farm SitesStan dard
Er ror
Less than 48.0 16.6 (3.6)
48.0 - 53.9 45.1 (5.3)
54.0 or more 38.3 (6.2)
Total 100.0
Over one- half (59 per cent) of farm sites pro vided three inches or more of feeder space per layer.
d. Percent of farm sites by average length (inches) of feeder space per layer:
Av er age Length (Inches)Per cent
Farm SitesStan dard
Er ror
Less than 3 41.0 (6.0)
3 40.9 (4.0)
4 12.3 (2.9)
More than 4 5.8 (3.8)
Total 100.0
Layers ‘99 22 USDA:APHIS:VS
B. General Management Sec tion I: Popu la tion Es ti mates

C. Production Cycle of Last Completed Flock
1. Age at placement
On 4.7 per cent of farm sites, the last flock to com plete pro duc tion was placed in the layer house at over60 weeks of age (re cy cled flocks).
a. Percent of farm sites (and percent of layers placed) where the last completed flock was over 60 weeks ofage when placed (recycled flocks):
Per centFarm Sites
Stan dard Er ror
Per centLayers
Stan dardEr ror
4.7 (2.2) 3.9 (1.9)
The av er age age at which flocks were placed for their first pro duc tion cy cle was 17.5 weeks. Thises ti mate is for the last flock placed per farm and ex cludes flocks that were placed for a sec ond cy cle, e.g., re cy cled flocks over 60 weeks of age.
b. For layer flocks in their first production cycle, average age (weeks) at which the last completed flockwas moved into the layer house:
Av er age FlockAge (Weeks)
Stan dardEr ror
17.5 (0.1)
Nearly one- half (43.3 per cent) of the last completed flocks (ex cluding re cy cled flocks) were placed at 18weeks of age, while nearly one- third (30.8 per cent) were placed at 17 weeks of age.
c. For layer flocks in their first production cycle, percent of farm sites by average age (weeks) at which thelast completed flock was moved into the layer house by pullet source:
Per cent Farm Sites by Pul let Source
Any Pul lets Raised on This Farm Site
No Pul lets Raisedon this Farm Site All Farm Sites
Av er age Flock Age (Weeks) Percent
Stan dardEr ror Percent
Stan dardEr ror Per ce nt
Stan dardEr ror
Less than 17 5.1 (3.1) 15.8 (3.2) 14.7 (2.9)
17 43.8 (10.8) 29.2 (4.1) 30.8 (3.9)
18 15.5 (6.7) 46.6 (4.9) 43.3 (4.5)
19 or more 35.6 (13.1) 8.4 (2.7) 11.2 (3.0)
Total 100.0 100.0 100.0
USDA:APHIS:VS 23 Layers ‘99
Sec tion I: Popu la tion Es ti mates C. Production Cycle of Last Completed Flock

2. Ages dur ing the first pro duc tion cycle
For flocks in their first pro duc tion cy cle, the av er age age at the time the flock reached 5 per cent, 50 per cent,and peak pro duc tion was 20.0, 22.6, and 28.6 weeks re spec tively.
a. For flocks in their first production cycle, average age (weeks) at which the last completed flock reached5 percent hen-day egg production, 50 percent hen-day egg production, and peak egg production:
Av er age Flock Age (Weeks) By Hen- Day Egg Pro duc tion Level
5% 50% Peak
Age(Weeks)
Stan dardEr ror
Age(Weeks)
Stan dardEr ror
Age(Weeks)
Stan dardEr ror
20.0 (0.1) 22.6 (0.2) 28.6 (0.2)
About two-thirds (67.0 per cent) of last com pleted flocks reached 5 per cent pro duc tion (5 eggs per 100 hensper day) be tween 19 and 20 weeks of age.
b. For flocks in their first pro duc tion cy cle, percent of farm sites by average age (weeks) at which the flock reached 5 percent hen-day egg production:
Av er age Flock Age (Weeks)
Per centFarm Sites
Stan dard Er ror
Less than 19 5.1 (1.3)
19 25.3 (4.0)
20 41.7 (3.9)
21 or more 27.9 (5.3)
Total 100.0
Layers ‘99 24 USDA:APHIS:VS
C. Production Cycle of Last Completed Flock Sec tion I: Popu la tion Es ti mates

About one- half (48.2 per cent) of last completed flocks reached 50 per cent pro duc tion (50 eggs per 100hens per day) be tween 22 and 23 weeks of age.
c. For flocks in their first pro duc tion cy cle, percent of farm sites by average age (weeks) at which the lastcompleted flock reached 50 percent hen-day egg production:
Av er age FlockAge (Weeks)
Per centFarm Sites
Stan dard Er ror
Less than 22 27.1 (4.2)
22 21.1 (3.5)
23 27.1 (4.2)
24 or more 24.7 (7.0)
Total 100.0
About one- half (46.9 per cent) of last com pleted flocks reached peak pro duc tion be tween 27 and 29weeks of age.
d. For flocks in their first pro duc tion cy cle, percent of farm sites by average age (weeks) at which the lastcompleted flock reached peak egg production:
Av er age FlockAge (Weeks)
Per centFarm Sites
Stan dard Er ror
Less than 27 19.0 (3.3)
27 - 29 46.9 (3.4)
30 - 31 20.8 (3.7)
32 or more 13.3 (3.3)
Total 100.0
USDA:APHIS:VS 25 Layers ‘99
Sec tion I: Popu la tion Es ti mates C. Production Cycle of Last Completed Flock
Percent of Farm Sites* by Average Age (in Weeks) at Which the Flock Reached Peak Egg
Production
Less than 27 weeks19.0%
27 - 29 weeks46.9%
30 - 31 weeks20.8%
32 or more weeks13.3%
#4174* For flocks in their first production cycle.

3. Peak hen- day egg production
Over all, the av er age peak hen- day egg production for the last com pleted flock was 90.1 (av er age maxi mumpro duc tion of 90.1 eggs per 100 hens per day).
a. Average peak hen-day egg production for the last completed flock by region:
Av er age Num ber Eggs per 100 Hens per Day by Region
Great Lakes Southeast Central West All Farm Sites
Num berEggs
Stan dardEr ror
Num ber Eggs
Stan dardEr ror
Num berEggs
Stan dardEr ror
Num berEggs
Stan dardEr ror
Num berEggs
Stan dardEr ror
89.6 (0.8) 90.5 (0.5) 90.9 (0.4) 89.7 (0.7) 90.1 (0.4)
Larger farms (100,000 or more lay ers) had a higher peak hen- day egg pro duc tion than smaller farms.
i. Average peak hen-day egg production for the last completed flock by farm site size (number oflayers):
Av er age Num ber Eggs per 100 Hens per Day by Farm Size (Num ber Lay ers)
Less than 100,000 100,000 or More
Num berEggs
Stan dardEr ror
Num ber Eggs
Stan dardEr ror
89.5 (0.5) 91.0 (0.3)
Peak hen- day egg pro duc tion for the last com pleted flock did not dif fer sig nifi cantly by flock size.
ii. Average peak hen-day egg production for the last completed flock by flock size (number of layers in flock):
Av er age Num ber Eggs per 100 Hens perDay by Flock Size (Num ber Lay ers in Flock)
Less than 100,000 100,000 or More
Num berEggs
Stan dardEr ror
Num berEggs
Stan dardEr ror
89.8 (0.5) 90.8 (0.4)
Layers ‘99 26 USDA:APHIS:VS
C. Production Cycle of Last Completed Flock Sec tion I: Popu la tion Es ti mates

Overall, 17.2 percent of last completed flocks (one flock per farm site) had a peak production of less than 88 eggs per 100 hens per day, and 10.8 percent peaked at 94 or more eggs per 100 hens per day.
b. Percent of farm sites by peak hen-day egg production for the last completed flock:
Number Eggs per 100Hens per Day
Per centFarm Sites
Stan dard Er ror
Less than 88 17.2 (4.1)
88 - 90 24.1 (3.8)
91 - 93 47.9 (4.1)
94 or more 10.8 (2.0)
Total 100.0
4. Egg pro duc tion at 60 weeks of age
The number of eggs pro duced by 60 weeks of age per hen placed ranged from 211.0 in the Great Lakesre gion to 225.6 in the Cen tral re gion.
a. Average hen-housed egg production at 60 weeks of age for the last completed flock by region:
Av er age Hen- Housed Egg Pro duc tion by Region
Great Lakes Southeast Central West All Farm Sites
Num berEggs
Stan dardEr ror
Num ber Eggs
Stan dardEr ror
Num berEggs
Stan dardEr ror
Num berEggs
Stan dardEr ror
Num berEggs
Stan dardEr ror
211.0 (6.9) 223.1 (2.2) 225.6 (1.5) 218.5 (2.8) 218.1 (2.7)
USDA:APHIS:VS 27 Layers ‘99
Sec tion I: Popu la tion Es ti mates C. Production Cycle of Last Completed Flock
Percent of Farm Sites by Peak Hen-Day Egg Production for the Last Completed Flock
Less than 8817.2%
88 - 9024.1%
91 - 9347.9%
94 or more10.8%
Number Eggs per 100 Hens per Day #4208
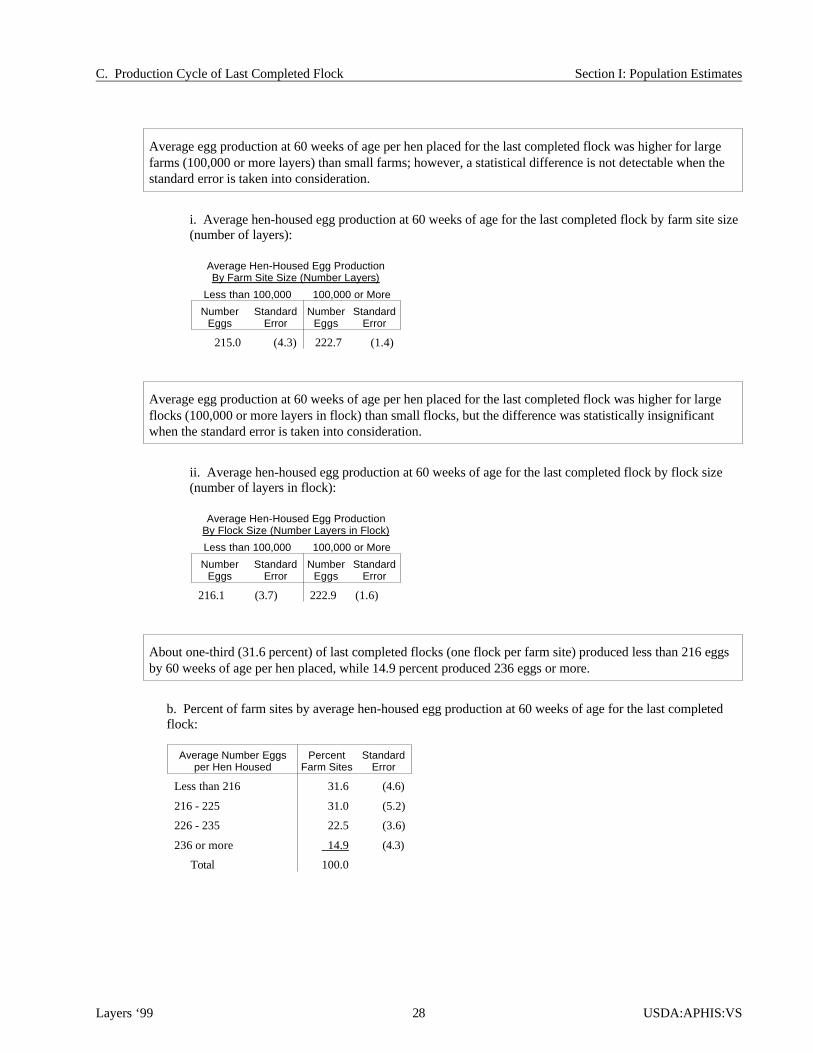
Average egg pro duc tion at 60 weeks of age per hen placed for the last com pleted flock was higher for largefarms (100,000 or more lay ers) than small farms; how ever, a sta tis ti cal dif fer ence is not detectable when thestan dard er ror is taken into con sid era tion.
i. Average hen-housed egg production at 60 weeks of age for the last com pleted flock by farm site size(number of layers):
Av er age Hen- Housed Egg Pro duc tionBy Farm Site Size (Num ber Lay ers)
Less than 100,000 100,000 or More
Num berEggs
Stan dardEr ror
Num ber Eggs
Stan dardEr ror
215.0 (4.3) 222.7 (1.4)
Average egg pro duc tion at 60 weeks of age per hen placed for the last com pleted flock was higher for largeflocks (100,000 or more lay ers in flock) than small flocks, but the dif fer ence was statistically in sig nifi cantwhen the stan dard er ror is taken into con sid era tion.
ii. Average hen-housed egg production at 60 weeks of age for the last com pleted flock by flock size(number of layers in flock):
Av er age Hen- Housed Egg Pro duc tionBy Flock Size (Num ber Lay ers in Flock)
Less than 100,000 100,000 or More
Num berEggs
Stan dardEr ror
Num ber Eggs
Stan dardEr ror
216.1 (3.7) 222.9 (1.6)
About one-third (31.6 per cent) of last com pleted flocks (one flock per farm site) pro duced less than 216 eggsby 60 weeks of age per hen placed, while 14.9 per cent produced 236 eggs or more.
b. Percent of farm sites by average hen-housed egg production at 60 weeks of age for the last com pletedflock:
Av er age Num ber Eggsper Hen Housed
Per centFarm Sites
Stan dardEr ror
Less than 216 31.6 (4.6)
216 - 225 31.0 (5.2)
226 - 235 22.5 (3.6)
236 or more 14.9 (4.3)
Total 100.0
Layers ‘99 28 USDA:APHIS:VS
C. Production Cycle of Last Completed Flock Sec tion I: Popu la tion Es ti mates

5. End of production
Three-fourths (74.2 per cent) of last com pleted flocks were molted (Ta ble B.3.b). Molted flocks werere moved on av er age at 111.4 weeks of age, while the last com pleted flocks that were not molted werere moved from produc tion at an av er age of 73.7 weeks of age.
a. Average age (weeks) at which the last com pleted flock was removed by molting practice:
Molt ing PracticeAv er age Age
(Weeks)Stan dard
Er ror
Molted 111.4 (1.4)
Not molted 73.7 (1.7)
All flocks 101.5 (2.4)
About one- half (47.7 per cent) of the last com pleted flocks were re moved from pro duc tion at 100 to 119weeks of age. About two-thirds (64.4 per cent) of molted flocks ended pro duc tion at 100 to 119 weeks ofage, and two-thirds (68.7 per cent) of non- molted flocks ended pro duc tion before 80 weeks of age.
b. Percent of farm sites by age (weeks) at which the last completed flock was removed by molting practice:
Per cent Farm Sites by Molt ing Practice
Molted Not Molted All Farm Sites
Age (Weeks) PercentStan dard
Er ror PercentStan dard
Er ror Per ce ntStan dard
Er ror
Less than 80 0.2 (0.1) 68.7 (7.1) 18.3 (4.3)
80 - 99 12.7 (5.9) 29.9 (6.8) 17.3 (4.0)
100 - 119 64.4 (6.5) 1.4 (1.1) 47.7 (6.3)
120 or more 22.7 (4.2) 0.0 (--) 16.7 (3.3)
Total 100.0 100.0 100.0
USDA:APHIS:VS 29 Layers ‘99
Sec tion I: Popu la tion Es ti mates C. Production Cycle of Last Completed Flock
Percent of Farm Sites by Molting Practice and by Age (in Weeks) at Which the Last Completed Flock
Was Removed
#4177
0.2%
12.7%
64.4%
22.7%
68.7%
29.9%
1.4%
Less than 80 weeks80 - 99 weeks100 - 119 weeks120 or more weeks
Molted Not Molted

6. Morbidity
Gen er ally, few pro duc ers had any se vere or mod er ate mor bid ity prob lems. In fact, less than 3 per cent offarms sites had se vere or mod er ate prob lems with the in fec tious dis eases listed be low.
About one- half (53.2 percent) of the last completed flocks experienced prolapse problems, and 16.2 percent of flocks had moderate or severe prolapse problems. About one-third (32.8 percent) of last completed flocks had problems with cage layer fatigue, and 7.4 percent of flocks had moderate or severe problems. Mor bid ityes ti mates were based on pro ducer per cep tion with no fur ther con fir ma tion.
a. Percent of farm sites by severity of problem the last completed flock had with the followingdiseases/conditions:
Per cent Farm Sites by Se ver ity of Problem
Severe Moderate Minor No Problem Never Heard of It
Dis ease/Condition Per centStand.Er ror Per cent
Stand.Er ror Per cent
Stand.Er ror Per cent
Stand.Er ror Percent
Stand.Er ror Total
Cage layer fatigue 0.8 (0.3) 6.6 (1.8) 25.4 (4.1) 63.5 (4.8) 3.7 (1.4) 100.0
Fatty liver syndrome 0.0 (--) 1.9 (0.8) 15.7 (3.4) 77.8 (3.9) 4.6 (1.5) 100.0
Prolapse (blow out) andcannibalism 2.4 (0.9) 13.8 (3.4) 37.0 (4.5) 46.1 (5.3) 0.7 (0.6) 100.0
Marek’s disease 0.5 (0.4) 1.7 (0.6) 16.0 (3.2) 80.2 (3.4) 1.6 (0.9) 100.0
Lymphoid leukosis 0.0 (--) 2.0 (1.2) 10.2 (2.4) 84.1 (3.0) 3.7 (1.3) 100.0
Fowl pox 0.0 (--) 0.5 (0.3) 10.3 (3.3) 88.1 (3.4) 1.1 (0.7) 100.0
Mycotoxicosis 0.0 (--) 0.2 (0.2) 9.4 (2.7) 87.4 (3.0) 3.0 (1.9) 100.0
Avian encephalomyelitis 0.0 (--) 0.0 (--) 2.4 (1.8) 93.0 (2.4) 4.6 (1.9) 100.0
Newcastle disease 0.9 (0.7) 1.0 (0.6) 2.1 (1.8) 95.0 (2.2) 1.0 (0.7) 100.0
Infectious bronchitis 1.1 (0.7) 1.3 (0.6) 12.5 (2.9) 84.5 (3.2) 0.6 (0.4) 100.0
Laryngotracheitis 0.4 (0.3) 1.8 (1.1) 3.2 (1.8) 92.6 (2.4) 2.0 (1.1) 100.0
Infectious coryza 0.2 (0.2) 0.3 (0.2) 3.2 (1.8) 92.1 (2.7) 4.2 (2.1) 100.0
Mycoplasmagallisepticum (MG) 0.0 (--) 1.1 (0.5) 5.0 (2.2) 92.2 (2.4) 1.7 (0.9) 100.0
Respiratory disease (no specific diagnosis) 0.0 (--) 0.4 (0.3) 7.1 (2.3) 92.3 (2.3) 0.2 (0.2) 100.0
Other diseases 2.1 (1.8) 0.6 (0.3) 4.0 (2.8) 93.3 (3.3) 0.0 (--) 100.0
Layers ‘99 30 USDA:APHIS:VS
C. Production Cycle of Last Completed Flock Sec tion I: Popu la tion Es ti mates
Percent of Farm Sites Where the Last Completed Flock Had Moderate and Severe Problems with the Following
Diseases/Conditions
#4179
7.4
1.9
16.2
2.2
2
1.9
2.4
2.2
1.1
Cage layer fatigue
Fatty liver syndrome
Prolapse & cannibalism
Marek's disease
Lymphoid leukosis
Newcastle disease
Infectious bronchitis
Laryngotracheitis
M. gallisepticum
Disease/Condition
0 5 10 15 20
Percent Farm Sites
ModerateSevere

Over all, more pro duc ers in the West re gion ob served dis ease prob lems in their last com pleted flocks than in other re gions. Prob lems with avian en cepha lo mye li tis, New cas tle dis ease, and in fec tious co ryza werere ported only in the Great Lakes and West re gions. Mor bid ity es ti mates were based on pro ducerper cep tion with no fur ther con fir ma tion.
b. Percent of farm sitesin which the last completed flock had a minor, moderate, or severe problem with the following diseases/conditions by region:
Per cent Farm Sites by Region
Great Lakes Southeast Central West
Dis ease/Condition Per centStand.Er ror Per cent
Stand.Er ror Per cent
Stand.Er ror Per cent
Stand.Er ror
Cage layer fatigue 27.6 (9.3) 22.4 (7.5) 31.8 (6.6) 49.8 (6.6)
Fatty liver syndrome 13.6 (6.9) 11.0 (5.4) 16.9 (7.4) 41.8 (7.7)
Prolapse (blow out) andcannibalism 51.5 (12.3) 27.0 (6.8) 60.8 (5.2) 72.3 (5.2)
Marek’s disease 17.3 (7.5) 12.1 (4.4) 20.4 (5.1) 22.7 (5.2)
Lymphoid leukosis 9.8 (5.8) 5.2 (3.2) 23.8 (5.6) 13.1 (3.7)
Fowl pox 5.3 (5.0) 15.7 (9.1) 2.2 (1.1) 20.7 (6.6)
Mycotoxicosis 10.7 (6.6) 7.4 (3.5) 5.4 (2.9) 12.9 (3.9)
Avian encephalomyelitis 5.3 (5.0) 0.0 (--) 0.0 (--) 2.2 (1.2)
Newcastle disease 5.3 (5.0) 0.0 (--) 0.0 (--) 8.1 (4.0)
Infectious bronchitis 12.7 (6.9) 14.7 (5.3) 4.0 (2.8) 26.1 (5.1)
Laryngotracheitis 10.5 (6.3) 1.7 (1.5) 2.8 (1.6) 3.1 (1.6)
Infectious coryza 5.3 (5.0) 0.0 (--) 0.0 (--) 7.0 (2.2)
Mycoplasma gallisepticum (MG) 5.3 (5.0) 2.0 (1.3) 3.7 (2.2) 12.4 (5.0)
Respiratory disease (no specific diagnosis) 10.1 (6.1) 5.8 (2.8) 10.7 (3.4) 2.9 (1.2)
Other diseases 8.8 (7.9) 0.7 (0.5) 5.0 (2.0) 10.0 (6.8)
USDA:APHIS:VS 31 Layers ‘99
Sec tion I: Popu la tion Es ti mates C. Production Cycle of Last Completed Flock

7. Mor tal ity
A to tal of 6.5 per cent of hens placed in the last com pleted flock (one flock per farm site) died by 60 weeks ofage.
a. Percent of hens placed in the last completed flock that died by 60 weeks of age:
Per cent Hens Placed
Stan dardEr ror
6.5 (0.3)
The 60-week mor tal ity was less than 4 per cent for 24.0 per cent of last com pleted flocks (one flock per farmsite). The 60-week mor tal ity was 10 per cent or higher for 19.2 per cent of last com pleted flocks.
i. Percent of farm sites by 60-week mortality for the last completed flock:
Mor tal ity (Per cent that Died)
Per centFarm Sites
Stan dard Er ror
Less than 4.0 24.0 (3.1)
4.0 - 6.9 35.2 (3.6)
7.0 - 9.9 21.6 (2.9)
10.0 or more 19.2 (3.7)
Total 100.0
Layers ‘99 32 USDA:APHIS:VS
C. Production Cycle of Last Completed Flock Sec tion I: Popu la tion Es ti mates
Percent of Farm Sites by 60-Week Mortality for the Last Completed Flock
24
35.2
21.619.2
Less than 4.0 4.0 - 6.9 7.0 - 9.9 10.0 or more
60-Week Mortality (Percent that Died)
0
10
20
30
40
50
Percent Farm Sites
#4209

Over all, the av er age cu mu la tive mortality (per cent of hens placed that died dur ing pro duc tion) was 14.6per cent. As might be ex pected, the cu mu la tive mor tal ity was somewhat higher for flocks re moved at 90weeks of age or older (15.1 per cent) than for flocks re moved at less than 90 weeks of age (12.6 per cent).
b. Percent of hens that died during the life of the flock by age at which the flock was removed:
Age RemovedPer centHens
Stan dard Er ror
Less than 90 weeks 12.6 (0.6)
90 weeks or older 15.1 (0.9)
All hens 14.6 (0.7)
The cu mu la tive mor tal ity was less than 8 per cent for 14.3 per cent of last com pleted flocks (one flock perfarm site). The cu mu la tive mor tal ity was 18.0 per cent or higher for 23.2 per cent of last com pleted flocks.
i. Percent of farm sites by cumulative mortality:
Mor tal ity (Per cent that Died)
Per centFarm Sites
Stan dardEr ror
Less than 8.0 14.3 (2.4)
8.0 - 12.9 36.3 (4.0)
13.0 - 17.9 26.2 (4.3)
18.0 or more 23.2 (4.6)
Total 100.0
USDA:APHIS:VS 33 Layers ‘99
Sec tion I: Popu la tion Es ti mates C. Production Cycle of Last Completed Flock
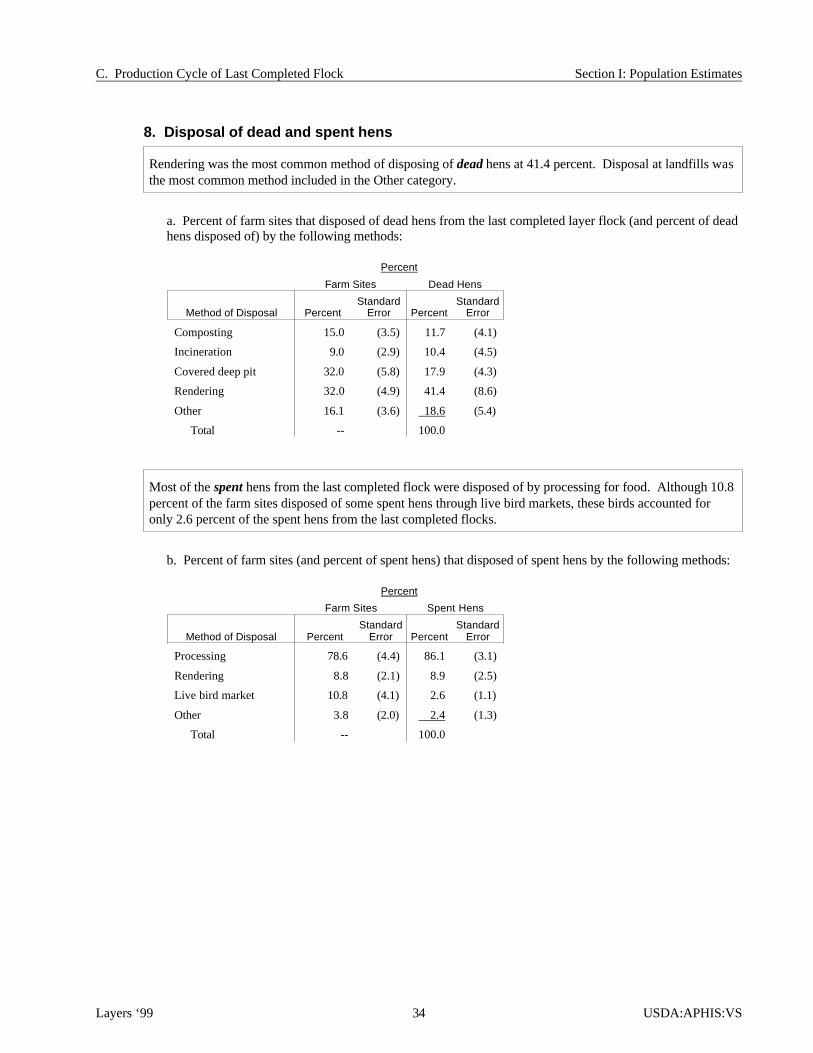
8. Dis posal of dead and spent hens
Ren der ing was the most com mon method of dis pos ing of dead hens at 41.4 per cent. Dis posal at land fills wasthe most com mon method in cluded in the Other cate gory.
a. Percent of farm sites that disposed of dead hens from the last completed layer flock (and percent of deadhens disposed of) by the following methods:
Per cent
Farm Sites Dead Hens
Method of Disposal Per centStan dard
Er ror PercentStan dard
Er ror
Composting 15.0 (3.5) 11.7 (4.1)
Incineration 9.0 (2.9) 10.4 (4.5)
Covered deep pit 32.0 (5.8) 17.9 (4.3)
Rendering 32.0 (4.9) 41.4 (8.6)
Other 16.1 (3.6) 18.6 (5.4)
Total -- 100.0
Most of the spent hens from the last com pleted flock were dis posed of by proc ess ing for food. Al though 10.8 per cent of the farm sites dis posed of some spent hens through live bird mar kets, these birds ac counted foronly 2.6 per cent of the spent hens from the last com pleted flocks.
b. Percent of farm sites (and percent of spent hens) that disposed of spent hens by the following methods:
Per cent
Farm Sites Spent Hens
Method of Disposal Per centStan dard
Er ror Per centStan dard
Er ror
Processing 78.6 (4.4) 86.1 (3.1)
Rendering 8.8 (2.1) 8.9 (2.5)
Live bird market 10.8 (4.1) 2.6 (1.1)
Other 3.8 (2.0) 2.4 (1.3)
Total -- 100.0
Layers ‘99 34 USDA:APHIS:VS
C. Production Cycle of Last Completed Flock Sec tion I: Popu la tion Es ti mates

Dis posal of spent hens via ren der ing was most com mon in the West (18.9 per cent of farm sites). Theper centage of farm sites that dis posed of any spent hens from their last com pleted flock via the live birdmar ket ranged from 0.6 per cent of farm sites in the South east re gion to 19.5 per cent of farm sites in theGreat Lakes re gion.
i. Percent of farm sites that disposed of spent hens by the following methods and by region:
Per cent Farm Sites by Region
Great Lakes Southeast Central West
Method of Disposal PercentStan dard
Er ror PercentStan dard
Er ror Per ce ntStan dard
Er ror Per ce ntStan dard
Er ror
Processing 77.9 (10.0) 87.8 (4.1) 82.9 (7.7) 68.4 (6.6)
Rendering 2.6 (2.3) 10.2 (3.8) 5.4 (3.4) 18.9 (5.3)
Live bird market 19.5 (10.1) 0.6 (0.6) 11.7 (7.5) 6.5 (2.3)
Other 5.3 (5.0) 1.3 (1.3) 0.0 (--) 6.5 (3.0)
USDA:APHIS:VS 35 Layers ‘99
Sec tion I: Popu la tion Es ti mates C. Production Cycle of Last Completed Flock
Percent of Farm Sites that Disposed of Spent Hens by Method and by Region
#4178
6.5 0 5.3 1.36.5 11.7 19.50.6
18.95.4 2.6 10.2
68.482.9 77.9 87.8
West Central Great Lakes Southeast
Region
0
25
50
75
100
Percent Farm Sites
ProcessingRenderingLive bird marketOther West
Central
Southeast
Great Lakes

D. Salmonella and Myco plasma
1. Test ing for Salmonella
A to tal of 58.0 per cent of farm sites rou tinely tested for Salmonella enteri ti dis (S.e.), an in crease from 15.7per cent in 1994. Per cent of farm sites with a Salmonella enteri ti dis (S.e.) test ing program ranged from 25.6per cent of farm sites in the Cen tral re gion to 83.8 per cent of farm sites in the South east re gion.
Re sults of tests were not re corded for the Lay ers ‘99 study.
a. Percent of farm sites that were routinely testing for Salmonella enteritidis (S.e.) in the layer houses at the time of the Layers ‘99 interview and in 1994 (5 years earlier) by region:
Per cent Farm Sites by Region
Great Lakes Southeast Central West All Farm Sites
Time Frame PercentStan dard
Er ror PercentStan dard
Er ror Per ce ntStan dard
Er ror Per ce ntStan dard
Er ror Per ce ntStan dard
Er ror
Time of interview 57.3 (12.3) 83.8 (6.2) 25.6 (6.2) 58.8 (9.2) 58.0 (5.7)
In 1994* 23.4 (13.3) 1.6 (1.5) 13.7 (5.0) 18.5 (6.6) 15.7 (5.1)
* Excluded farm sites that were less than 5 years old at the time of the Layers ‘99 interview.
Layers ‘99 36 USDA:APHIS:VS
D. Salmonella and Myco plasma Sec tion I: Popu la tion Es ti mates
Percent of Farm Sites that Routinely Tested for Salmonella enteritidis in the Layer
Houses by Time Frame and by Region
#4180
18.513.7
23.4
1.6
58.8
25.6
57.3
83.8
West Central Great Lakes Southeast
Region
0
25
50
75
100
Percent Farm SitesTime of Layers '99interview
In 1994*
* Excluded farm sites that were less than 5 years old at the time of the Layers '99 interview..

NOTE: The fol low ing ta bles describe those farm sites that tested for Salmonella enteri ti dis (S.e.) at thetime of the Lay ers ‘99 in ter view and those farm sites that tested for Sal mo nella enteri ti dis (S.e.) in 1994. Less than one in five farm sites tested in 1994, whereas nearly three in five farm sites tested dur ingLay ers ‘99 (Ta ble D.1.a).
The most com mon method of test ing for Salmonella enteri ti dis (S.e.) was by ma nure cul ture (89.7per cent of farm sites that tested). Ap proxi mately one- half of the farm sites that tested for Sal mo nellaenteri ti dis (S.e.) cul tured swabs from egg belts and ele va tor equip ment. More than one test method mayhave been used on a farm site.
i. For farm sites that tested for Salmonella enteritidis (S.e.) in the layer houses for each time period,percent of farm sites that used the following methods to test for Salmonella enteritidis (S.e.) in thelayer houses at the time of the Layers ‘99 interview and in 1994:
Per cent Farm Sites by Time Frame
Time of In ter view In 1994
Method of Testing Per centStan dard
Er ror PercentStan dard
Er ror
Manure culture (swab) 89.7 (3.6) 84.2 (11.1)
Egg belts culture (swab)* 52.6 (9.2) 41.3 (18.2)
Elevator/equipment culture (swab)* 42.0 (8.7) 34.7 (16.7)
Egg culture 10.4 (3.5) 26.8 (12.1)
Serology 12.7 (3.9) 27.7 (13.0)
Other 0.6 (0.4) 0.0 (--)
* For those farm sites that had such equipment.
Com pany or farm per son nel col lected sam ples for Salmonella enteri ti dis (S.e.) test ing in 1999 on nearlythree out of four farm sites (70.1 per cent). A pri vate vet eri nar ian was the most fre quent sam ple col lec torin cluded in the Other cate gory.
ii. For farm sites that tested for Salmonella enteritidis (S.e.) in the layer houses, percent of farm sitesby primary sample collector for Salmonella enteritidis (S.e.) testing at the time of the Layers ‘99interview and in 1994:
Per cent Farm Sites by Time Frame
Time of In ter view In 1994
Pri mary Sam ple Col lec tor PercentStan dard
Er ror Per centStan dard
Er ror
Company or farm personnel 70.1 (6.3) 59.1 (15.3)
State or Federal personnel 8.5 (2.4) 17.2 (10.9)
Other 21.4 (5.4) 23.7 (13.0)
Total 100.0 100.0
USDA:APHIS:VS 37 Layers ‘99
Sec tion I: Popu la tion Es ti mates D. Salmonella and Myco plasma

In 1999, approxi mately equal percentages of farm sites tested (by any method) for Salmonella enteri ti dis(S.e.) be fore and dur ing the last 4 weeks of pro duc tion. Test ing dur ing the last 4 weeks of pro duc tion wasmore com mon in 1999 than in 1994 for farm sites that tested for Salmonella enteri ti dis (S.e.). About one inthree farm sites in each time frame tested be fore lay ers were placed. Farm sites may have tested more thanonce dur ing a production cy cle.
iii. For farm sites that tested for Salmonella enteritidis (S.e.) in the layer houses, percent of farm sitesby when testing for Salmonella enteritidis (S.e.) was usually performed at the time of the Layers ‘99interview and in 1994:
Per cent Farm Sites by Time Frame
Time of In ter view In 1994
Time Test ing Was Performed Per centStan dard
Er ror Per centStan dard
Er ror
Before layers were placed 29.4 (6.7) 33.7 (12.8)
After layers were placed butbefore the last 4 weeks ofproduction 59.8 (8.1) 62.1 (15.1)
During the last 4 weeks ofproduction 59.2 (9.0) 24.5 (9.9)
Layers ‘99 38 USDA:APHIS:VS
D. Salmonella and Myco plasma Sec tion I: Popu la tion Es ti mates
2. Sal mo nella qual ity assur ance pro grams
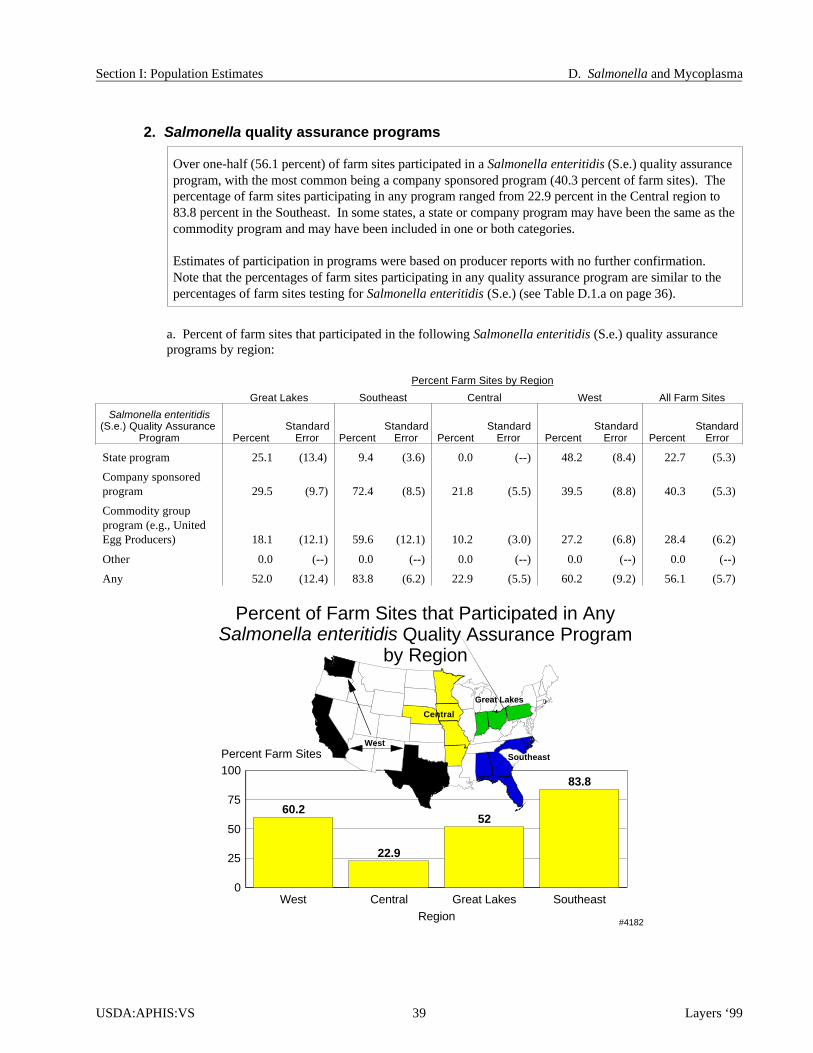
Over one- half (56.1 per cent) of farm sites par tici pated in a Salmonella enteritidis (S.e.) qual ity as sur ancepro gram, with the most com mon be ing a com pany spon sored pro gram (40.3 per cent of farm sites). Theper centage of farm sites par tici pat ing in any pro gram ranged from 22.9 per cent in the Cen tral re gion to83.8 per cent in the South east. In some states, a state or company pro gram may have been the same as the com mod ity pro gram and may have been in cluded in one or both cate go ries.
Esti mates of par tici pa tion in pro grams were based on pro ducer re ports with no fur ther con fir ma tion. Note that the per cent ages of farm sites par tici pat ing in any qual ity as sur ance pro gram are simi lar to theper cent ages of farm sites test ing for Salmonella enteritidis (S.e.) (see Ta ble D.1.a on page 36).
a. Percent of farm sites that participated in the following Salmonella enteritidis (S.e.) quality assuranceprograms by region:
Per cent Farm Sites by Region
Great Lakes Southeast Central West All Farm Sites
Salmonella enteritidis(S.e.) Quality As sur ance
Pro gram PercentStan dard
Er ror PercentStan dard
Er ror Per ce ntStan dard
Er ror Per ce ntStan dard
Er ror Per ce ntStan dard
Er ror
State program 25.1 (13.4) 9.4 (3.6) 0.0 (--) 48.2 (8.4) 22.7 (5.3)
Company sponsoredprogram 29.5 (9.7) 72.4 (8.5) 21.8 (5.5) 39.5 (8.8) 40.3 (5.3)
Commodity groupprogram (e.g., UnitedEgg Producers) 18.1 (12.1) 59.6 (12.1) 10.2 (3.0) 27.2 (6.8) 28.4 (6.2)
Other 0.0 (--) 0.0 (--) 0.0 (--) 0.0 (--) 0.0 (--)
Any 52.0 (12.4) 83.8 (6.2) 22.9 (5.5) 60.2 (9.2) 56.1 (5.7)
USDA:APHIS:VS 39 Layers ‘99
Sec tion I: Popu la tion Es ti mates D. Salmonella and Myco plasma
Percent of Farm Sites that Participated in Any Salmonella enteritidis Quality Assurance Program
by Region
#4182
60.2
22.9
52
83.8
West Central Great Lakes SoutheastRegion
0
25
50
75
100Percent Farm Sites
West
Central
Southeast
Great Lakes

Over one- half (55.0 per cent) of farm sites that par tici pated in a Salmonella enteritidis (SE) qual ity as sur ancepro gram had an in spec tion by some one not as so ci ated with the farm.
i. For farm sites that participated in a Salmonella enteritidis (SE) quality assurance program, percent of farm sites that had an inspection by someone not associated with the farm site or company to verifycompliance with the Salmonella enteritidis (SE) quality assurance program:
Per centFarm Sites
Stan dard Er ror
55.0 (8.2)
3. Myco plasma
About two-thirds (66.4 per cent) of farm sites con sid ered them selves free of Mycoplasma gallisepticum (MG), while 22.8 per cent of farm sites did not have an opin ion about their Mycoplasma gallisepticum (MG) status. Note that this in for ma tion was ob tained from farm site man ag ers who may not have been aware of theirMycoplasma gallisepticum (MG) status, whereas cor po rate staff may have had more in for ma tion.
a. Percent of farm sites that considered their farm sites to be Mycoplasma gallisepticum (MG) free:
Per cent Farm Sites by MG Status
Free Don’t Know Not Free To tal
PercentStan dard
Er ror PercentStan dard
Er ror Per ce ntStan dard
Er ror Per ce nt
66.4 (5.1) 22.8 (4.8) 10.8 (2.7) 100.0
(See the graph on page 41.)
About two-thirds (67.0 per cent) of farm sites used some method to de ter mine Mycoplasma gallisepticum(MG) status. Vac ci na tion was the most com mon method in cluded in the Other cate gory.
i. Percent of farm sites by method of determining Mycoplasma gallisepticum (MG) status:
Method of De ter min ingMG Sta tus
Per centFarm Sites
Stan dard Er ror
Serology 58.5 (5.4)
Culture 13.7 (5.2)
Other 2.2 (1.0)
Any 67.0 (5.2)
Layers ‘99 40 USDA:APHIS:VS
D. Salmonella and Myco plasma Sec tion I: Popu la tion Es ti mates

Slightly less than one- half (45.1 per cent) of farm sites considered themselves free of Mycoplasmasynoviae (MS) , while 23.8 percent of farm sites did not have an opinion about their Mycoplasmasynoviae (MS) status.
b. Percent of farm sites that considered their farm sites to be Mycoplasma synoviae (MS) free:
Per cent Farm Sites by MS Status
Free Don’t Know Not Free
PercentStan dard
Er ror PercentStan dard
Er ror Per ce ntStan dard
Er ror Total
45.1 (4.7) 23.8 (4.8) 31.1 (6.2) 100.0
(See also Ta ble D.3.a on the pre vi ous page.)
About two-thirds (64.8 per cent) of farm sites used some method to de ter mine Mycoplasma synoviae(MS) status.
i. Percent of farm sites by method of determining Mycoplasma synoviae (MS) status:
Method of De ter min ingMS Sta tus
Per centFarmSites
Stan dard Er ror
Serology 58.0 (5.4)
Culture 11.9 (4.9)
Other 1.7 (1.0)
Any 64.8 (5.4)
USDA:APHIS:VS 41 Layers ‘99
Sec tion I: Popu la tion Es ti mates D. Salmonella and Myco plasma
Percent of Farm Sites by Considered Mycoplasma gallisepticum and Mycoplasma synoviae Status
66.4%
22.8%
10.8%
M. gallisepticum
45.1%
23.8%
31.1%
M. synoviae
FreeDidn't knowNot Free
#4183

E. Manure Handling
1. Ma nure handl ing method
Ma nure han dling sys tems var ied by re gion. High rise housing was the most com mon method used in theGreat Lakes and Central re gions (63.0 per cent and 48.1 per cent of farm sites, re spec tively). In the South eastre gion, the most com mon method was flushing to a la goon (41.9 per cent of farm sites). Scraper sys tems (notflush) were the most com mon method used in the West re gion (43.6 per cent of farm sites).
a. Percent of farm sites by primary manure handling method and by region:
Per cent Farm Sites by Region
Great Lakes Southeast Central West All Farm Sites
Pri mary Ma nure Han dlingMethod Percent
Stan dardEr ror Percent
Stan dardEr ror Per ce nt
Stan dardEr ror Per ce nt
Stan dardEr ror Per ce nt
Stan dard Er ror
High rise (pit at groundlevel with house above) 63.0 (12.3) 31.4 (6.0) 48.1 (6.0) 7.8 (2.1) 39.7 (4.4)
Deep pit (below ground) 0.0 (--) 0.0 (--) 6.4 (3.9) 7.3 (2.5) 2.9 (1.0)
Shallow pit (pit atground level with raisedcages) 23.4 (9.6) 19.9 (7.3) 1.6 (1.2) 24.1 (7.2) 18.9 (4.4)
Flush system to a lagoon 0.0 (--) 41.9 (5.9) 0.0 (--) 12.0 (3.6) 12.5 (2.5)
Manure belt 13.6 (6.7) 4.3 (2.1) 20.2 (4.9) 5.2 (1.5) 10.6 (2.7)
Scraper system (notflush) 0.0 (--) 2.5 (2.1) 23.7 (8.7) 43.6 (6.4) 15.4 (2.6)
Total 100.0 100.0 100.0 100.0 100.0
Layers ‘99 42 USDA:APHIS:VS
E. Manure Handling Sec tion I: Popu la tion Es ti mates
Percent of Farm Sites by Primary ManureHandling Method by Region
#4184
31.4
0
19.9
41.9
4.3 2.5
63
0
23.4
0
13.6
0
48.1
6.41.6 0
20.223.7
7.8 7.3
24.1
125.2
43.6
High Rise*Deep Pit
Shallow Pit*Flush System
Manure BeltScraper System
0
25
50
75
Percent Farm Sites
WestCentral
Great LakesSoutheast
* High rise: pit at ground level with house above. Shallow pit: pit at ground level with raised cages.
(Below Ground) to a Lagoon (Not Flush)

Nearly all (96.6 per cent) of farm sites that had a high rise, deep, or shal low pit re moved ma nure be tweeneach flock or more fre quently.
i. For farm sites that used a high rise, deep, or shallow pit, percent of farm sites by frequency ofmanure disposal:
Fre quency of Ma nure Disposal
Per cent Farm Sites with
Ma nure PitsStan dard
Er ror
After each flock removed ormore frequently 96.6 (1.6)
After 2 - 3 flocks 3.4 (1.6)
After 4 or more flocks 0.0 --
The la goon was at least 100 feet away from the near est layer house on about one- half (49.9 per cent) offarm sites that used a flush sys tem.
ii. For farm sites that used a flush system, percent of farm sites by minimum distance (in feet) from the lagoon to the nearest layer house:
Dis tance (Feet)Per cent
Farm SitesStan dard
Er ror
Less than 50 23.0 (6.9)
50 - 99 27.1 (5.8)
100 or more feet 49.9 (9.5)
Total 100.0
Most (71.0 per cent) of the farm sites that used a scraper sys tem or ma nure belt dis posed of the ma nurewithin 7 days, while 14.9 per cent com posted the ma nure on farm.
iii. For farm sites that used a scraper system or manure belt, percent of farm sites by disposition of themanure once it was removed from the layer house:
DispositionPer cent
Farm SitesStan dard
Er ror
Disposed of within 7 days (spread onfields or removed from the farm) 71.0 (5.6)
Stored in a manure pile on farm formore than 7 days 14.1 (3.5)
Composted on farm (aerated and/orstirred) or dehydrated on farm 14.9 (5.0)
Total 100.0
USDA:APHIS:VS 43 Layers ‘99
Sec tion I: Popu la tion Es ti mates E. Manure Handling
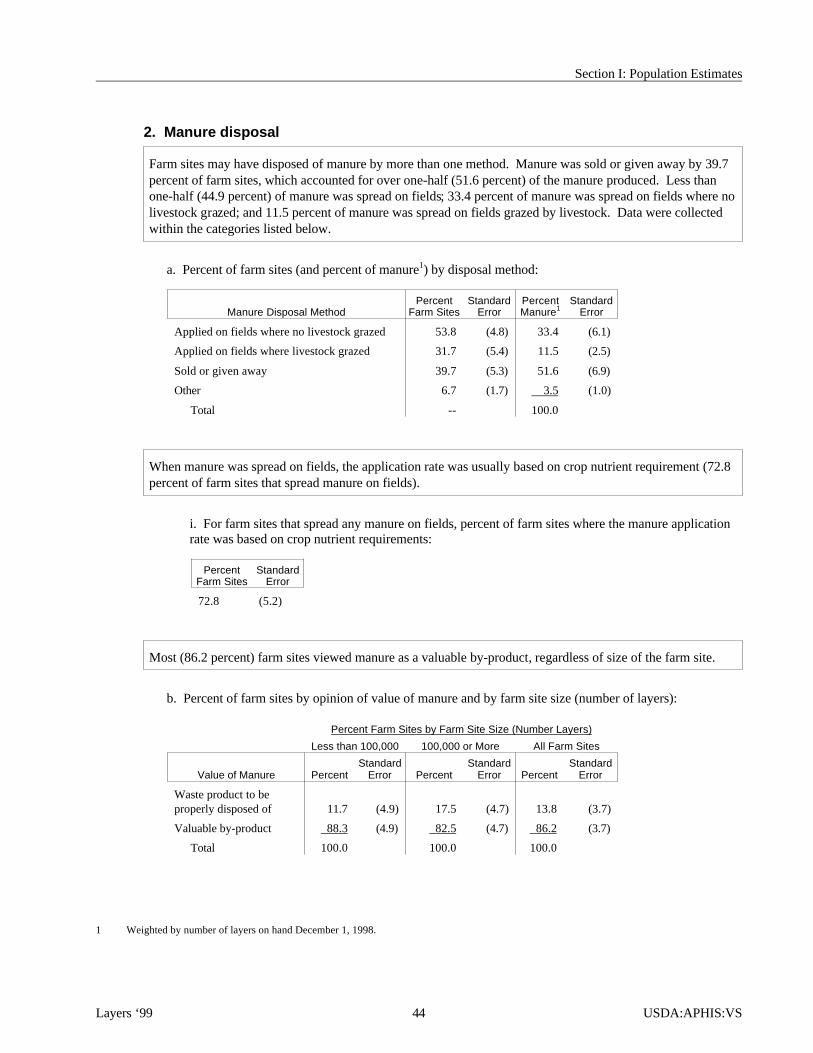
2. Ma nure dis posal
Farm sites may have dis posed of ma nure by more than one method. Ma nure was sold or given away by 39.7per cent of farm sites, which ac counted for over one- half (51.6 per cent) of the ma nure pro duced. Less thanone- half (44.9 per cent) of ma nure was spread on fields; 33.4 per cent of ma nure was spread on fields where no live stock grazed; and 11.5 per cent of ma nure was spread on fields grazed by livestock. Data were col lectedwithin the cate go ries listed below.
a. Per cent of farm sites (and per cent of ma nure1) by dis posal method:
Ma nure Disposal MethodPer cent
Farm SitesStan dard
Er rorPer centManure1
Stan dardEr ror
Applied on fields where no livestock grazed 53.8 (4.8) 33.4 (6.1)
Applied on fields where livestock grazed 31.7 (5.4) 11.5 (2.5)
Sold or given away 39.7 (5.3) 51.6 (6.9)
Other 6.7 (1.7) 3.5 (1.0)
Total -- 100.0
When ma nure was spread on fields, the ap pli ca tion rate was usu ally based on crop nu tri ent re quire ment (72.8per cent of farm sites that spread ma nure on fields).
i. For farm sites that spread any manure on fields, percent of farm sites where the manure applicationrate was based on crop nutrient requirements:
Per centFarm Sites
Stan dard Er ror
72.8 (5.2)
Most (86.2 per cent) farm sites viewed ma nure as a valu able by- product, re gard less of size of the farm site.
b. Per cent of farm sites by opinion of value of manure and by farm site size (number of layers):
Per cent Farm Sites by Farm Site Size (Num ber Lay ers)
Less than 100,000 100,000 or More All Farm Sites
Value of Manure PercentStan dard
Er ror PercentStan dard
Er ror Per ce ntStan dard
Er ror
Waste product to beproperly disposed of 11.7 (4.9) 17.5 (4.7) 13.8 (3.7)
Valuable by-product 88.3 (4.9) 82.5 (4.7) 86.2 (3.7)
Total 100.0 100.0 100.0
Layers ‘99 44 USDA:APHIS:VS
Sec tion I: Popu la tion Es ti mates
1 Weighted by number of layers on hand December 1, 1998.

F. Pest control
1. Ac cess to feed
Most likely, if ani mals or in sects have ac cess to the layer house, they have ac cess to the feed trough. Ro dents and flies had ac cess to feed in the feed troughs on nearly all farm sites (89.9 and 91.3 per cent,re spec tively) but had ac cess to feed prior to it be ing fed to the birds on 21.4 and 31.4 percent of farmsites, respectively.
a. Percent of farm sites where the following animals and insects had access to: 1) feed in tanks, bins, lines,hoppers, etc., prior to the feed being fed to layers and 2) feed in the layer feed troughs (i.e., in front ofbirds):
Per cent Farm Sites by Location
Tanks, Bins, Lines,Hop pers, Etc.
Layer Feed Troughs (In Front of Birds)
Ani mal/Insect PercentStan dard
Er ror PercentStan dard
Er ror
Rodents 21.4 (4.3) 89.9 (4.1)
Wild birds 7.6 (2.1) 23.5 (3.9)
Flies 31.4 (4.9) 91.3 (3.9)
Cats 5.0 (2.0) 19.6 (3.6)
Dogs 1.6 (0.9) 4.0 (1.2)
Any of the above 32.6 (4.8) 92.8 (3.9)
USDA:APHIS:VS 45 Layers ‘99
Sec tion I: Popu la tion Es ti mates F. Pest control

2. Fly con trol
Use of baits was the most com mon form of fly con trol, used on 72.1 per cent of farm sites (pri mary method on 34.5 per cent of farm sites). Bio logical preda tors (e.g., wasps) were used on 13.8 per cent of farm sites and this was the pri mary fly con trol method for 8.9 per cent of farm sites.
a. Percent of farm sites by fly control methods (and primary fly control method) used in the layer housesin 1998:
Per cent Farm Sites by Fly Con trol Method
Meth ods UsedPri mary
Method Used
Fly Con trol Method Per centStan dard
Er ror Per centStan dard
Er ror
Residual spray 58.2 (5.5) 20.0 (4.4)
Baits 72.1 (4.4) 34.5 (5.5)
Larvicide (spot treatment) 20.6 (5.2) 0.5 (0.3)
Larvicide in feed 36.5 (5.3) 15.1 (4.1)
Space sprays/foggers 39.0 (6.2) 8.6 (2.5)
Biological predators 13.8 (3.5) 8.9 (3.2)
Other 7.1 (1.9) 3.0 (1.0)
None 9.4 (2.5) 9.4 (2.5)
Total -- 100.0
Layers ‘99 46 USDA:APHIS:VS
F. Pest control Sec tion I: Popu la tion Es ti mates

3. Ro dent con trol
Nearly all (99.2 per cent) farm sites used some method of ro dent con trol. Chemi cals or baits were by farthe most com mon method of ro dent con trol. Traps or sticky tape were used by almost one- half (46.0per cent) of farm sites but was the pri mary method of ro dent con trol for only 6.7 per cent of farm sites.
a. Percent of farm sites by rodent control methods (and primary rodent control method) used in the layerhouses in 1998:
Per cent Farm Sites by Rodent Con trol Method
Meth ods UsedPri mary
Method Used
Ro dent Con trol Method Per centStan dard
Er ror Per centStan dard
Er ror
Chemicals or bait including thoseused by an exterminator 92.7 (2.3) 84.3 (3.1)
Traps or sticky tape 46.0 (6.5) 6.7 (2.4)
Cats 25.6 (4.3) 7.8 (2.3)
Other 1.2 (0.4) 0.4 (0.2)
None 0.8 (0.5) 0.8 (0.5)
Total -- 100.0
A pro fes sional ex ter mi na tor was used on 14.1 per cent of farm sites that used at least one method ofro dent con trol.
i. For farm sites that used at least one rodent control method during 1998, percent of farm sites thatused a professional exterminator for rodent control in any of the layer houses during 1998:
Per centFarm Sites
Stan dardEr ror
14.1 (3.0)
USDA:APHIS:VS 47 Layers ‘99
Sec tion I: Popu la tion Es ti mates F. Pest control

Larger per cent ages of farm sites in the West (30.8 per cent) and South east (20.8 per cent) re gions con sid eredrats to be the ma jor ro dent prob lem com pared to the Great Lakes (5.3 per cent) and Cen tral (8.7 per cent)regions, where over 90.0 per cent of farm sites each con sid ered mice to be the great est ro dent prob lem.
b. Percent of farm sites by rodent that caused the greatest on-going problems in the layer houses during1998 and by region:
Per cent Farm Sites by Region
Great Lakes Southeast Central West All Farm Sites
Rodent PercentStan dard
Er ror PercentStan dard
Er ror Per ce ntStan dard
Er ror Per ce ntStan dard
Er ror Per ce ntStan dard
Er ror
Mice 94.7 (5.0) 79.2 (7.2) 91.3 (4.3) 66.7 (8.1) 84.0 (3.6)
Rats 5.3 (5.0) 20.8 (7.2) 8.7 (4.3) 30.8 (8.2) 15.4 (3.6)
Other 0.0 (--) 0.0 (--) 0.0 (--) 2.5 (1.4) 0.6 (0.3)
Total 100.0 100.0 100.0 100.0 100.0
A total of 27.9 percent of farm sites considered their farms to have a moderate or severe problem with mice,and 8.5 percent considered their farms to have a moderate or severe problem with rats. The most commonro dent speci fied in the Other category was squirrels. These es ti mates were based on pro ducer in ter pre ta tionsof se vere, mod er ate, and slight prob lem lev els.
i. Percent of farm sites by level of on-going problems with rodents in the layer houses during 1998 and by rodent type:
Per cent Farm Sites by Level of Problem
Severe Mod er ate Slight None
Ro dent Type PercentStan dard
Er ror PercentStan dard
Er ror Per ce ntStan dard
Er ror Per ce ntStan dard
Er ror Total
Mice 2.4 (1.7) 25.5 (4.5) 62.4 (5.3) 9.7 (3.5) 100.0
Rats 1.6 (0.6) 6.9 (2.1) 43.7 (5.8) 47.8 (6.1) 100.0
Other 0.0 (--) 0.8 (0.3) 1.2 (0.4) 98.0 (0.5) 100.0
Layers ‘99 48 USDA:APHIS:VS
F. Pest control Sec tion I: Popu la tion Es ti mates

G. Biosecurity
A non-busi ness visi tor was de fined as any one who did not have a busi ness rea son for vis it ing theop era tion, such as friends, fam ily mem bers, and tours.
1. Non- business visitors
About two-thirds (68.1 per cent) of farm sites did not al low non- business visi tors in the layer houses.This per cent age was simi lar across re gions.
a. Percent of farm sites by policy for non-business visitors in the layer houses and by region:
Per cent Farm Sites by Region
Great Lakes Southeast Central West All Farm Sites
Policy PercentStan dard
Er ror PercentStan dard
Er ror Per ce ntStan dard
Er ror Per ce ntStan dard
Er ror Per ce ntStan dard
Er ror
Visitors were requiredto sign in 15.5 (11.6) 11.7 (4.4) 5.0 (2.0) 11.2 (4.2) 11.7 (4.3)
Visitors were notrequired to sign in 16.0 (7.5) 28.1 (9.6) 22.6 (6.6) 17.2 (5.1) 20.2 (3.9)
No visitors wereallowed 68.5 (14.1) 60.2 (9.2) 72.4 (6.7) 71.6 (6.3) 68.1 (5.7)
Total 100.0 100.0 100.0 100.0 100.0
(See graph on page 51.)
USDA:APHIS:VS 49 Layers ‘99
Sec tion I: Popu la tion Es ti mates G. Biosecurity

The percentage of farm sites that al lowed non- business visi tors into the layer houses did not dif fer by size offarm site. How ever, visi tors were more likely to be re quired to sign in on large farm sites.
i. Percent of farm sites by policy for non-business visitors in the layer houses and by farm site size:
Per cent Farm Sites by Farm Site Size (Num ber Lay ers)
Less than 100,000 100,000 or More
Policy PercentStan dard
Er ror PercentStan dard
Er ror
Visitors were required to sign in 5.6 (1.8) 22.0 (8.9)
Visitors were not required to sign in 24.8 (6.1) 12.5 (3.5)
No visitors were allowed 69.6 (6.5) 65.5 (8.3)
Total 100.0 100.0
About two-thirds (62.9 per cent) of farm sites that al lowed non-busi ness visi tors re quired the visi tors’ ve hi clesnot to have been on an other poultry farm that day. A to tal of 7.6 per cent of farm sites that al lowednon-busi ness visi tors re quired the ve hi cle to be cleaned and disin fected upon en ter ing, and 30.3 per centre quired the ve hi cle to be parked in a re stricted area.
ii. For farm sites where non-business visitors were allowed to enter the production area, percent offarm sites by requirements for vehicles:
Policy
Per centFarmSites
Stan dardEr ror
Cleaned and disinfected upon entering 7.6 (3.7)
Park in a restricted area away from chicken housing 30.3 (8.1)
Not to have been on another poultry farm that day 62.9 (8.9)
Any of the above 65.6 (8.7)
All of the above 7.6 (3.7)
Layers ‘99 50 USDA:APHIS:VS
G. Biosecurity Sec tion I: Popu la tion Es ti mates
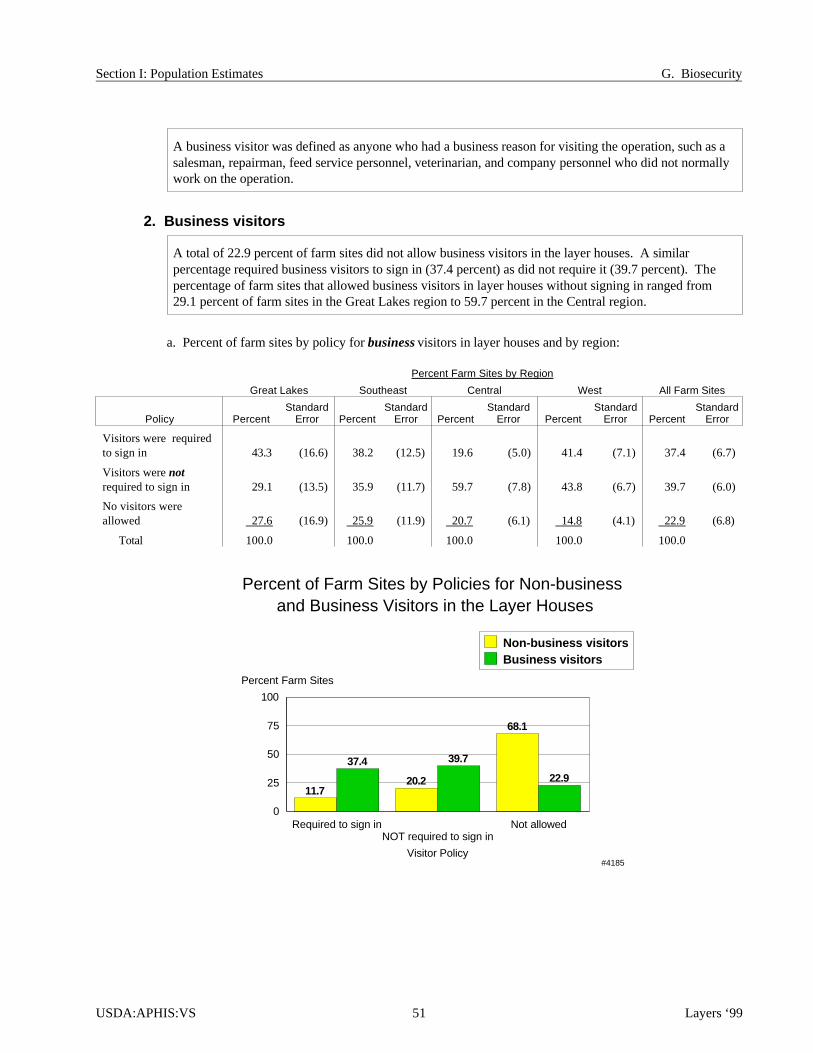
A busi ness visi tor was de fined as any one who had a busi ness rea son for vis it ing the op era tion, such as asales man, re pair man, feed serv ice per son nel, vet eri nar ian, and com pany per son nel who did not nor mallywork on the op era tion.
2. Busi ness visitors
A to tal of 22.9 per cent of farm sites did not al low busi ness visi tors in the layer houses. A simi larper cent age required busi ness visitors to sign in (37.4 per cent) as did not re quire it (39.7 per cent). Theper cent age of farm sites that al lowed busi ness visi tors in layer houses with out sign ing in ranged from29.1 per cent of farm sites in the Great Lakes re gion to 59.7 per cent in the Cen tral re gion.
a. Percent of farm sites by policy for business visitors in layer houses and by region:
Per cent Farm Sites by Region
Great Lakes Southeast Central West All Farm Sites
Policy PercentStan dard
Er ror PercentStan dard
Er ror Per ce ntStan dard
Er ror Per ce ntStan dard
Er ror Per ce ntStan dard
Er ror
Visitors were requiredto sign in 43.3 (16.6) 38.2 (12.5) 19.6 (5.0) 41.4 (7.1) 37.4 (6.7)
Visitors were notrequired to sign in 29.1 (13.5) 35.9 (11.7) 59.7 (7.8) 43.8 (6.7) 39.7 (6.0)
No visitors wereallowed 27.6 (16.9) 25.9 (11.9) 20.7 (6.1) 14.8 (4.1) 22.9 (6.8)
Total 100.0 100.0 100.0 100.0 100.0
USDA:APHIS:VS 51 Layers ‘99
Sec tion I: Popu la tion Es ti mates G. Biosecurity
Percent of Farm Sites by Policies for Non-business and Business Visitors in the Layer Houses
#4185
37.4 39.7
22.911.7
20.2
68.1
Required to sign inNOT required to sign in
Not allowed
Visitor Policy
0
25
50
75
100
Percent Farm Sites
Non-business visitorsBusiness visitors

About one- half (50.3 per cent) of farm sites with 100,000 or more lay ers al lowed busi ness visi tors in the layerhouses but re quired them to sign in, while smaller farm sites most com monly al lowed busi ness visi tors en tryto the layer houses without sign ing in (42.0 per cent).
i. Percent of farm sites by policy for business visitors in layer houses and by farm site size:
Per cent Farms Sites by Farm Size(Num ber Lay ers)
Less than 100,000 100,000 or More
Policy PercentStan dard
Er ror PercentStan dard
Er ror
Visitors were required to sign in 29.7 (7.2) 50.3 (8.1)
Visitors were not required to sign in 42.0 (8.4) 35.8 (6.6)
No visitors were allowed 28.3 (9.5) 13.9 (4.0)
About two-thirds (61.6 per cent) of farm sites that al lowed busi ness visi tors re quired the visi tors’ vehicles notto have been on an other poultry farm that day. A to tal of 15.9 per cent of farm sites that al lowed busi nessvisi tors re quired the ve hi cle to be cleaned and disin fected, and 27.2 per cent re quired the ve hi cle to be parkedin a re stricted area.
ii. For farm sites where business visitors were allowed to enter the production area, percent of farmsites by requirements for vehicles:
PolicyPer cent
Farm SitesStan dard
Er ror
Cleaned and disinfected upon entering 15.9 (4.0)
Park in a restricted area away from chicken housing 27.2 (4.4)
Not to have been on another poultry farm that day 61.6 (6.4)
Any of the above 69.5 (6.1)
All of the above 7.8 (2.7)
Layers ‘99 52 USDA:APHIS:VS
G. Biosecurity Sec tion I: Popu la tion Es ti mates

3. Visi tors in layer house(s)
Clean boots were re quired for visi tors on 76.1 per cent of farm sites, and foot baths were used by 34.0per cent of farm sites. Show ers were re quired on 2.9 per cent of farm sites.
a. For farm sites that allowed any visitors to enter layer houses, percent of farm sites by requirements forvisitors before entering the layer houses:
PolicyPer cent
Farm SitesStan dard
Er ror
Shower 2.9 (1.5)
Clean boots 76.1 (4.8)
Clean coveralls 64.5 (5.9)
Footbaths 34.0 (6.6)
Any of the above 80.1 (4.3)
Foot baths were used an av er age of 5.1 days be fore be ing changed.
i. For farm sites that required footbaths of visitors before entering layer houses, average number ofdays the footbath solution was used before it was changed:
Av er ageNum ber(Days)
Stan dardEr ror
5.1 (0.9)
4. Bar ri ers to farm site access
Over three-fourths (77.7 per cent) of farm sites used some type of bar rier to restrict ac cess to the farm,with the most com mon being signs posted (72.9 per cent). The most com mon method in cluded in theOther category was lock ing the layer build ings.
a. Percent of farm sites by barriers that restricted or limited visitor access to the farm site:
BarrierPer cent
Farm SitesStan dard
Er ror
Gated entrance 16.5 (2.3)
Fencing surrounding the farm 26.7 (4.3)
Signs posted (i.e., no trespassing) 72.9 (4.1)
Other 7.0 (1.6)
Any of the above 77.7 (3.8)
USDA:APHIS:VS 53 Layers ‘99
Sec tion I: Popu la tion Es ti mates G. Biosecurity

5. Em ploy ees/crews
NOTE: Com pany or con tract crews were not used on 16.8 per cent of farm sites. These farm sites were notin cluded in the es ti mates for re quire ments for crews.
Over one- half the farm sites re quired em ploy ees and crews not to be around other poul try and not to ownbirds, al though more farm sites had these re quire ments for em ploy ees than for crews. A change of clotheswas re quired for em ploy ees by 17.6 per cent of farm sites and for crews by 32.0 per cent of farm sites.
a. Percent of farm sites by requirements for employees and company or contract crews1 who worked in thelayer houses:
Per cent Farm Sites by Type of Worker
EmployeesCom pany or
Con tract Crews1
Re quire ment PercentStan dard
Er ror PercentStan dard
Er ror
Different personnel for different houses 19.2 (5.1) 17.2 (5.3)
Footbaths 24.5 (5.4) 24.6 (6.4)
Shower 3.9 (1.4) 4.8 (1.7)
Change clothes/coveralls 17.6 (3.7) 32.0 (5.6)
Not be around other poultry (e.g., other farms, markets, slaughter plants) 85.2 (3.2) 74.0 (6.6)
Cannot own their own poultry or birds 75.7 (4.5) 55.2 (6.5)
Any of the above 88.4 (2.8) 80.8 (6.3)
Most (72.3 per cent) farm sites had fewer than 10 em ploy ees, while 2.3 per cent of farm sites had 50 or more.
b. Percent of farm sites by the highest number of paid and unpaid workers (including family members)who worked on the farm site on any one day during 1998:
Num ber WorkersPer cent
Farm SitesStan dard
Er ror
Less than 10 72.3 (5.3)
10 - 49 25.4 (5.3)
50 or more 2.3 (1.0)
Total 100.0
Layers ‘99 54 USDA:APHIS:VS
G. Biosecurity Sec tion I: Popu la tion Es ti mates
1 Excludes those operations that did not use company and contract crews.
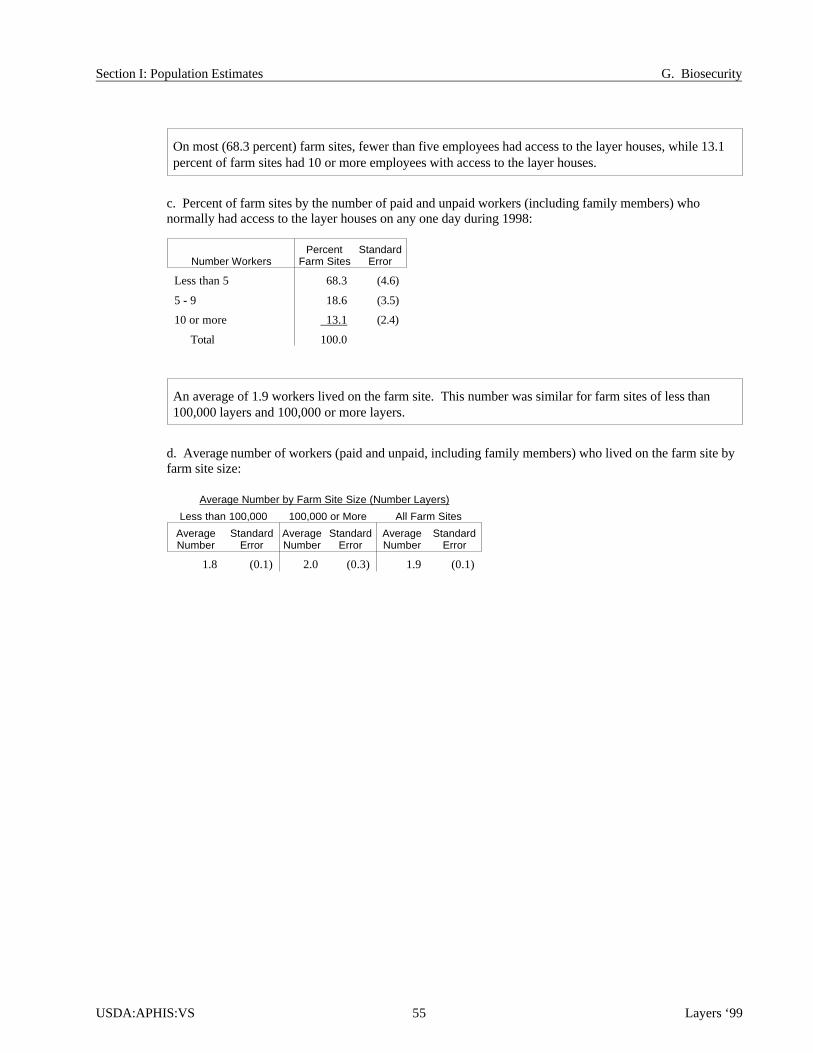
On most (68.3 per cent) farm sites, fewer than five em ploy ees had ac cess to the layer houses, while 13.1per cent of farm sites had 10 or more em ploy ees with ac cess to the layer houses.
c. Percent of farm sites by the number of paid and unpaid workers (including family members) whonormally had access to the layer houses on any one day during 1998:
Num ber WorkersPer cent
Farm SitesStan dard
Er ror
Less than 5 68.3 (4.6)
5 - 9 18.6 (3.5)
10 or more 13.1 (2.4)
Total 100.0
An av er age of 1.9 work ers lived on the farm site. This number was simi lar for farm sites of less than100,000 lay ers and 100,000 or more layers.
d. Average number of workers (paid and unpaid, including family members) who lived on the farm site byfarm site size:
Av er age Number by Farm Site Size (Num ber Lay ers)
Less than 100,000 100,000 or More All Farm Sites
Av er ageNumber
Stan dardEr ror
Av er age Number
Stan dardEr ror
Av er ageNumber
Stan dardEr ror
1.8 (0.1) 2.0 (0.3) 1.9 (0.1)
USDA:APHIS:VS 55 Layers ‘99
Sec tion I: Popu la tion Es ti mates G. Biosecurity

6. Prox im ity to poul try
Over all, 25.7 per cent of farm sites were within one mile of an other prem ises with poul try. The per cent age offarm sites within one-quar ter mile of an other prem ises with poul try ranged from 2.8 per cent of farm sites inthe Cen tral re gion to 15.6 per cent of farm sites in the West.
a. Percent of farm sites by distance (miles) to the nearest premises with poultry and by region:
Per cent Farm Sites by Region
Great Lakes Southeast Central West All Farm Sites
Dis tance (Miles) PercentStan dard
Er ror PercentStan dard
Er ror Per ce ntStan dard
Er ror Per ce ntStan dard
Er ror Per ce ntStan dard
Er ror
Less than 0.25 7.6 (5.9) 5.9 (3.5) 2.8 (1.6) 15.6 (4.7) 8.4 (2.6)
0.25 - 0.9 9.8 (5.8) 29.6 (8.5) 10.1 (3.5) 21.9 (4.1) 17.3 (3.3)
1.0 - 4.9 58.7 (13.9) 30.7 (6.3) 48.8 (10.2) 44.7 (6.3) 47.2 (6.0)
5.0 or more 23.9 (13.1) 33.8 (10.3) 38.3 (10.0) 17.8 (4.0) 27.1 (5.6)
Total 100.0 100.0 100.0 100.0 100.0
Layers ‘99 56 USDA:APHIS:VS
G. Biosecurity Sec tion I: Popu la tion Es ti mates
Percent of Farm Sites Within 1 Mile of Another Premise with Poultry by Region
#4186
37.5
12.917.4
35.5
West Central Great Lakes Southeast
Region
0
25
50
75
100
Percent Farm Sites
West
Central
Southeast
Great Lakes

Over all, less than 2 per cent of farm sites had broil ers, other poul try, or other do mes tic birds on the farmsite. About one-third (34.1 per cent) of farm sites had cat tle. Cat tle were most com mon on farm sites inthe South east (44.2 per cent) and West (42.8 per cent) re gions. One- half of the farm sites had cats (50.2per cent) and dogs (50.4 per cent).
b. Percent of farm sites with the following domestic animals present on the farm site by region:
Per cent Farm Sites by Region
Great Lakes Southeast Central West All Farm Sites
Animal PercentStan dard
Er ror PercentStan dard
Er ror Per ce ntStan dard
Er ror Per ce ntStan dard
Er ror Per ce ntStan dard
Er ror
Broilers 0.0 (--) 3.7 (2.2) 0.0 (--) 0.7 (0.6) 1.0 (0.6)
Other poultry (e.g.,turkeys, ducks, geese) 0.0 (--) 2.2 (1.2) 0.0 (--) 4.9 (1.6) 1.7 (0.5)
Other domestic birds(ratites, peacocks, etc.) 0.0 (--) 0.0 (--) 0.0 (--) 0.7 (0.6) 0.2 (0.1)
Cattle 26.1 (9.8) 44.2 (9.4) 25.1 (5.4) 42.8 (8.3) 34.1 (5.0)
Horses or other equids 19.0 (9.5) 7.0 (2.9) 8.6 (3.1) 10.8 (3.9) 12.4 (3.7)
Sheep/goats 10.7 (6.8) 1.5 (0.8) 3.8 (1.7) 11.1 (2.8) 7.5 (2.5)
Pigs 10.3 (5.4) 3.8 (1.8) 22.6 (4.3) 6.9 (1.9) 10.2 (2.2)
Cats 44.2 (10.0) 41.9 (8.9) 65.8 (8.0) 55.2 (7.4) 50.2 (4.8)
Dogs 47.0 (9.1) 42.0 (9.2) 67.5 (5.6) 50.6 (6.6) 50.4 (4.4)
Any of the above 68.5 (7.8) 65.8 (11.4) 88.2 (3.2) 80.3 (5.4) 74.3 (4.2)
USDA:APHIS:VS 57 Layers ‘99
Sec tion I: Popu la tion Es ti mates G. Biosecurity

7. Down timea. Usual farm site management
The av er age usual down time be tween flocks ranged from 10.5 days for farm sites in the Cen tral re gion to20.4 days in the Great Lakes re gion.
i. Average number of days layer houses were usually empty between flocks by region:
Num ber Days Empty by Region
Great Lakes Southeast Central West All Farm Sites
Num ber Days
Stan dardEr ror
Num berDays
Stan dardEr ror
Num berDays
Stan dardEr ror
Num berDays
Stan dardEr ror
Num berDays
Stan dardEr ror
20.4 (2.8) 15.2 (1.8) 10.5 (1.6) 18.8 (1.8) 17.1 (1.2)
About one-third (35.1 per cent) of farm sites usu ally had a down time of 18 days or longer, while 8.6 per centof farm sites usu ally had a down time of less than 4 days. The me dian (mid point) down time was 14 days(not shown in ta ble).
ii. Percent of farm sites by number of days layer houses were usually empty between flocks:
Num ber DaysPer cent
Farm SitesStan dard
Er ror
Less than 4 8.6 (2.7)
4 -10 21.1 (4.7)
11 -17 35.2 (5.9)
18 or more 35.1 (5.7)
Total 100.0
Layers ‘99 58 USDA:APHIS:VS
G. Biosecurity Sec tion I: Popu la tion Es ti mates
Percent of Farm Sites by Number of Days Layer Houses Were Usually Empty Between Flocks
#4187
8.6
21.1
35.2 35.1
Less than 4 4 - 10 11 - 17 18 or More
Number Days
0
10
20
30
40
Percent Farm Sites
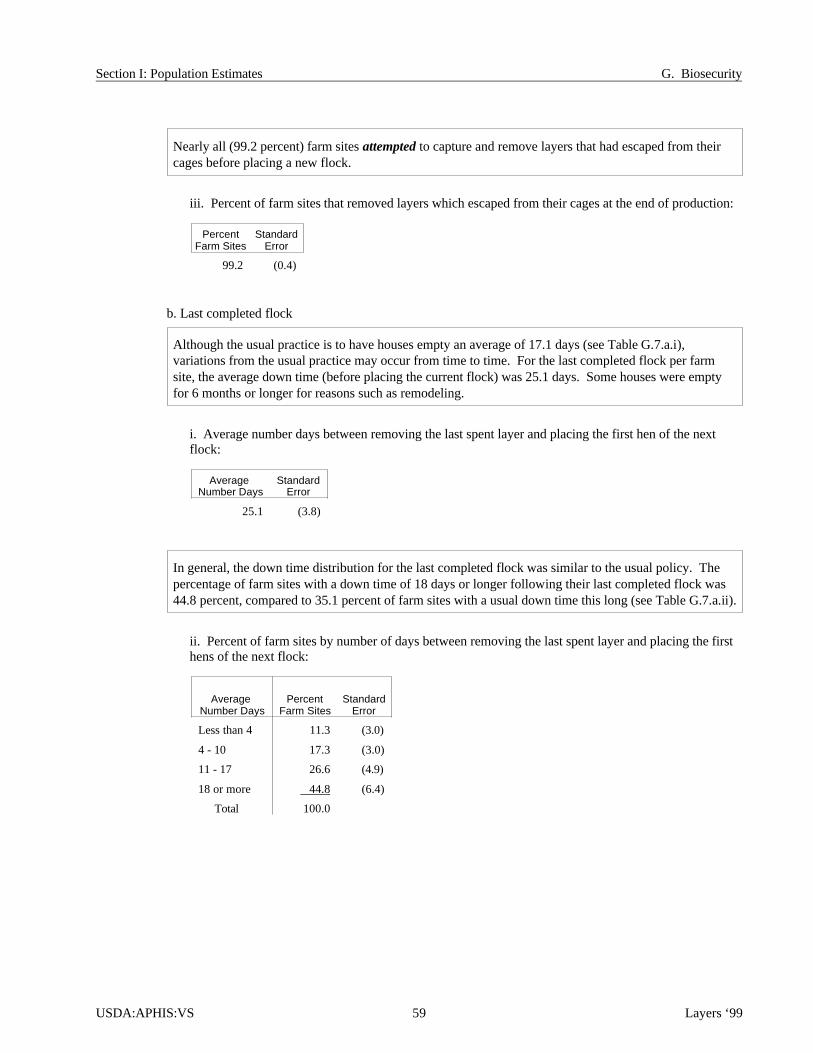
Nearly all (99.2 per cent) farm sites at tempted to cap ture and re move lay ers that had es caped from theircages be fore plac ing a new flock.
iii. Percent of farm sites that removed layers which escaped from their cages at the end of production:
Per centFarm Sites
Stan dardEr ror
99.2 (0.4)
b. Last completed flock
Although the usual practice is to have houses empty an average of 17.1 days (see Table G.7.a.i),variations from the usual practice may occur from time to time. For the last completed flock per farmsite, the average down time (before placing the current flock) was 25.1 days. Some houses were emptyfor 6 months or longer for reasons such as remodeling.
i. Average number days between removing the last spent layer and placing the first hen of the nextflock:
Av er age Num ber Days
Stan dardEr ror
25.1 (3.8)
In gen eral, the down time dis tri bu tion for the last com pleted flock was simi lar to the usual pol icy. Theper centage of farm sites with a down time of 18 days or longer following their last completed flock was44.8 per cent, com pared to 35.1 per cent of farm sites with a usual down time this long (see Ta ble G.7.a.ii).
ii. Percent of farm sites by number of days between removing the last spent layer and placing the firsthens of the next flock:
Av er age Num ber Days
Per centFarm Sites
Stan dardEr ror
Less than 4 11.3 (3.0)
4 - 10 17.3 (3.0)
11 - 17 26.6 (4.9)
18 or more 44.8 (6.4)
Total 100.0
USDA:APHIS:VS 59 Layers ‘99
Sec tion I: Popu la tion Es ti mates G. Biosecurity
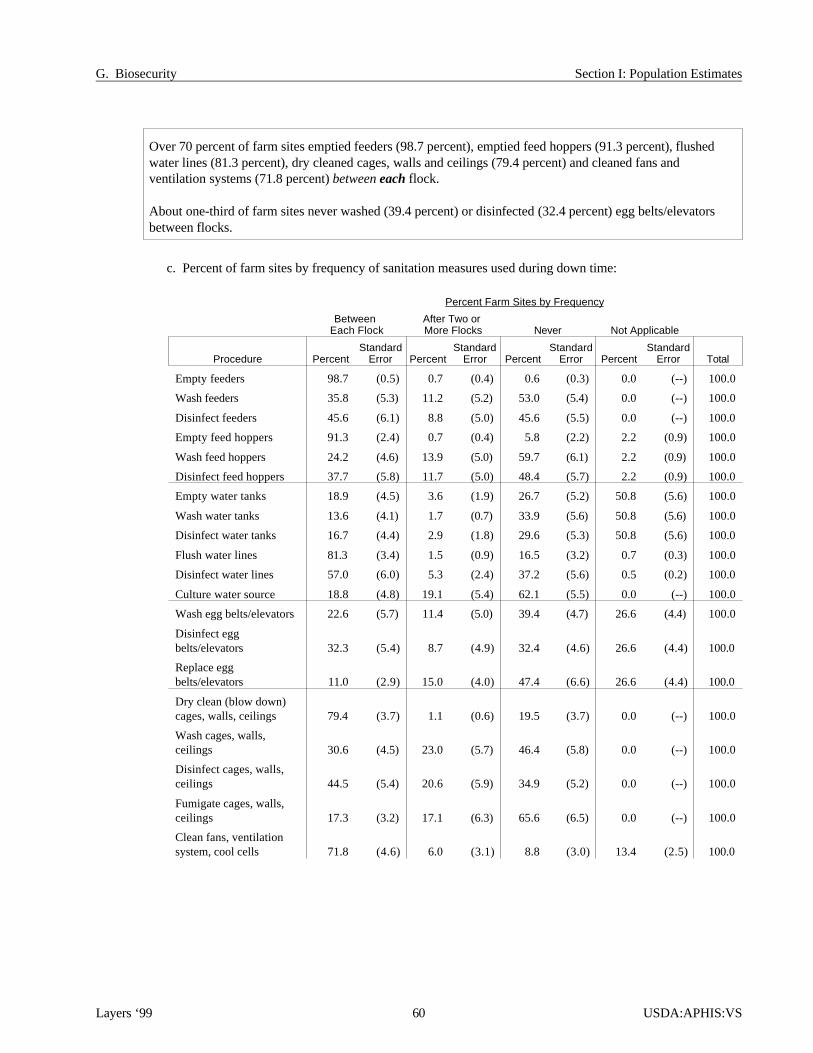
Over 70 per cent of farm sites emp tied feed ers (98.7 per cent), emp tied feed hop pers (91.3 per cent), flushedwa ter lines (81.3 per cent), dry cleaned cages, walls and ceil ings (79.4 per cent) and cleaned fans andven ti la tion systems (71.8 per cent) be tween each flock.
About one- third of farm sites never washed (39.4 per cent) or disinfected (32.4 per cent) egg belts/ele va torsbetween flocks.
c. Percent of farm sites by frequency of sanitation measures used during down time:
Per cent Farm Sites by Frequency
Be tween Each Flock
Af ter Two or More Flocks Never Not Applicable
Procedure PercentStandard
Er ror PercentStandard
Er ror Per ce ntStandard
Er ror Per ce ntStandard
Er ror Total
Empty feeders 98.7 (0.5) 0.7 (0.4) 0.6 (0.3) 0.0 (--) 100.0
Wash feeders 35.8 (5.3) 11.2 (5.2) 53.0 (5.4) 0.0 (--) 100.0
Disinfect feeders 45.6 (6.1) 8.8 (5.0) 45.6 (5.5) 0.0 (--) 100.0
Empty feed hoppers 91.3 (2.4) 0.7 (0.4) 5.8 (2.2) 2.2 (0.9) 100.0
Wash feed hoppers 24.2 (4.6) 13.9 (5.0) 59.7 (6.1) 2.2 (0.9) 100.0
Disinfect feed hoppers 37.7 (5.8) 11.7 (5.0) 48.4 (5.7) 2.2 (0.9) 100.0
Empty water tanks 18.9 (4.5) 3.6 (1.9) 26.7 (5.2) 50.8 (5.6) 100.0
Wash water tanks 13.6 (4.1) 1.7 (0.7) 33.9 (5.6) 50.8 (5.6) 100.0
Disinfect water tanks 16.7 (4.4) 2.9 (1.8) 29.6 (5.3) 50.8 (5.6) 100.0
Flush water lines 81.3 (3.4) 1.5 (0.9) 16.5 (3.2) 0.7 (0.3) 100.0
Disinfect water lines 57.0 (6.0) 5.3 (2.4) 37.2 (5.6) 0.5 (0.2) 100.0
Culture water source 18.8 (4.8) 19.1 (5.4) 62.1 (5.5) 0.0 (--) 100.0
Wash egg belts/elevators 22.6 (5.7) 11.4 (5.0) 39.4 (4.7) 26.6 (4.4) 100.0
Disinfect eggbelts/elevators 32.3 (5.4) 8.7 (4.9) 32.4 (4.6) 26.6 (4.4) 100.0
Replace eggbelts/elevators 11.0 (2.9) 15.0 (4.0) 47.4 (6.6) 26.6 (4.4) 100.0
Dry clean (blow down)cages, walls, ceilings 79.4 (3.7) 1.1 (0.6) 19.5 (3.7) 0.0 (--) 100.0
Wash cages, walls,ceilings 30.6 (4.5) 23.0 (5.7) 46.4 (5.8) 0.0 (--) 100.0
Disinfect cages, walls,ceilings 44.5 (5.4) 20.6 (5.9) 34.9 (5.2) 0.0 (--) 100.0
Fumigate cages, walls,ceilings 17.3 (3.2) 17.1 (6.3) 65.6 (6.5) 0.0 (--) 100.0
Clean fans, ventilationsystem, cool cells 71.8 (4.6) 6.0 (3.1) 8.8 (3.0) 13.4 (2.5) 100.0
Layers ‘99 60 USDA:APHIS:VS
G. Biosecurity Sec tion I: Popu la tion Es ti mates

Sec tion II: Meth od ol ogy
A. Needs assessment
NAHMS was approached by United Egg Producers and U.S. Poultry and Egg with a request for anational table egg layer study addressing the issue of Salmonella enteritidis (S.e.). To further identify information needs, four focus groups were assembled to represent a broad spectrum of informationusers. These focus groups represented researchers/academia, industry, state and federal government,and West coast interests. Conference calls were held to brainstorm potential study topics. Focusgroup members then voted on topics to set the study objectives. Key participants from each focusgroup continued to provide advice on the study objectives and to provide guidance throughout thestudy design, implementation, and analysis. These individuals met twice in person andcommunicated regularly via telephone and e-mail discussions.
B. Sampling and estimation
1. State se lec tion
The goal for NAHMS national studies is to include states that account for at least 70 percent of theanimal and farm population in the U.S. The National Agricultural Statistics Service (NASS) Layersand Egg Production, 1997 Summary (released January 1998) was used to determine state ranking fortable egg layers. All states with 4.0 percent or more of the U.S. table egg layers were included in thestudy. In addition, five states were added to provide better geographic coverage (Missouri,Washington, North Carolina, Arkansas, Alabama), resulting in a total of 15 states participating,representing 82 percent of 1997 U.S. table egg layers. NASS does not publish the total number oflayer farms (some data were received from the 1992 Census of Agriculture), and therefore, number of layer farms per state did not contribute to state selection for this study.
2. Op era tion se lec tion
NASS maintains a list of all egg-laying operations with 30,000 or more laying hens which is the basis for estimating monthly egg production. An operation may have one farm or multiple farms. Farmsfrom multiple-farm operations may be company owned or contract farms. The individual farms mayhave fewer than 30,000 layers, but the total layers for all farms associated with a company must equal or exceed 30,000. All operations (companies) that had 30,000 or more laying hens (20 weeks of ageor older) in the 15 selected states were eligible to participate.
3. Farm se lec tionNASS enumerators made the first personal contact to the operations. Enumerators visited companyheadquarters except for single-farm operations, where the farm was visited. If a company had farmsin more than one state, each state was treated as a separate operation (assigned a unique operationidentification code), and the NASS enumerator contacted the person who reported for the company in that state. The NASS enumerator selected a random sample of farms to participate. All farms wereselected for operations with 10 or fewer farms. If the operation had 11 to 29 farms, 10 farms wereselected. If there were 30 or more farms, 15 farms were selected.
USDA:APHIS:VS 61 Layers ‘99
Sec tion II: Meth od ol ogy A. Needs assessment

4. Popu la tion in fer ences
All operations (companies) that had 30,000 or more laying hens (20 weeks of age or older) in the 15selected states were eligible to participate in the NAHMS Layers ’99 study. Therefore, theprobability of selection (selection weight) was one for all operations. This selection weight wasadjusted for non-response within state and size group strata. For each participating farm, a farm-level weight was created, equal to the operation weight multiplied by an expansion factor (number of farms in the operation divided by number of the operation’s farms participating). This weight was adjustedagain for non-response at the VS phase.
C. Data collection
1. Mar ket ingNASS mailed a pre-survey letter, letters of support from the U.S. Poultry & Egg Association andUnited Egg Producers, and information on the NAHMS Layers ’99 study to each eligible operation(company). Additional information about NAHMS and the Layers ’99 study were delivered at thetime of the first personal contact. Some focus group participants made additional contacts toencourage participation.
2. Lay ers Man age ment Re port, Febru ary 1 - 26, 1999
The NASS enumerator administered a Layers Management Report. This questionnaire was limited to items that could more readily be answered by company headquarters than by personnel on farm (e.g.,pullet sources, feed sources). Practices that were expected to be the same on every farm were askedonce of the operation, whereas a separate questionnaire for each farm was completed for thosepractices that may differ among farms. If an operation was willing to continue to the next stage of the study, a consent form was signed. The Layers ’99 Part I report is from this phase of the Layers ’99study.
3. Ini tial VS Visit, March 22 - April 30, 1999
Farms for which the operation had signed a consent form were contacted by Veterinary Services (VS)for the second phase (on-farm) of the study. Veterinary Medical Officers (VMO’s) contacted eachfarm for participating operations, explained the program, and administered a questionnaire that couldmost readily be answered by farm personnel (e.g., housing, biosecurity). Although thesequestionnaires were scheduled to be completed by April 30, some states were given an extension inorder to increase the number of participants. The last questionnaire was completed July 14, 1999.Layers ’99 Part II reports results of this phase of the Layers ’99 study.
4. En vi ron men tal sam pling, May 3 - Septem ber 30, 1999
Environmental culturing was offered to all farms. Up to two houses per farm were randomly selected for culturing, including manure (five samples per house), egg belts (five samples per house), elevators (five samples per house), and walkways (two samples per house). If the house did not have egg beltsor elevators, then 10 samples were collected from cage floors. Each sample consisted of two swabs.Samples were placed in whirl-pak bags containing skim milk, and shipped overnight on ice to theAgriculture Research Service in Athens, GA, for culture and serogrouping. Group D isolates werethen sent to National Veterinary Services Laboratories (NVSL) in Ames, IA, for serotyping.Information about the flocks and houses being sampled was recorded on a Clinical EvaluationRecord. Results of environmental sampling are expected to be released in the Fall of 2000.
Layers ‘99 62 USDA:APHIS:VS
C. Data collection Sec tion II: Meth od ol ogy

5. Ro dent col lec tion
Rodent collection was offered to 150 farms that also participated in environmental sampling. Twelvetraps were placed per house. VMO’s returned 4 to 7 days later to count the number of rodents caught. Rodents were euthanized using dry ice. House mice were placed in large whirl-pak bags and shippedovernight on ice to NVSL for culture. The number of rodents trapped, number submitted, traplocation, and whether the trap had functioned properly were recorded on a rodent submission form.Results of rodent testing are expected to be released in the Fall of 2000.
6. Egg yolk anti bodyEgg yolk collection was offered to 100 farms that also participated in environmental sampling androdent collection. There were 150 eggs collected per farm. The egg yolks were aspirated from theeggs and shipped overnight on ice to the University of Minnesota for testing for presence of antibodyto Salmonella enteritidis (S.e.). Results of testing for egg yolk antibodies are expected to be released in the Fall of 2000.
D. Data analysis
1. Ed it ing and es ti ma tion
Initial data entry and editing for the Layers ’99 Part I report were performed in each individual NASS state office. Data were entered into a SAS data set. NAHMS personnel performed additional dataedits on the entire data set after data from all states were combined.
Data entry and editing for Part II were done by the NAHMS national staff in Fort Collins, CO. VSfield staff followed up with producers where necessary. Summarization and estimation for Part I andPart II were performed by NAHMS national staff using SUDAAN software (1996. Research TrianglePark, NC).
2. Re sponse rates
The sample for Part I included 341 operations, of which 328 were considered eligible to participate.Thirteen operations in the sample were ineligible (e.g., broiler operations, or pullet growers). Of the328 eligible operations, 208 operations agreed to participate (63 percent). These 208 operationsprovided information on 526 individual farms (see Farm selection on page 61). Consent was given to contact 393 of these farms for the second phase of the study (75 percent). Of the 393 farms contacted by VS, 11 were ineligible (no longer in business). Of the 382 eligible farms, 252 participated in theVS phase of the study (66 percent).
USDA:APHIS:VS 63 Layers ‘99
Sec tion II: Meth od ol ogy D. Data analysis
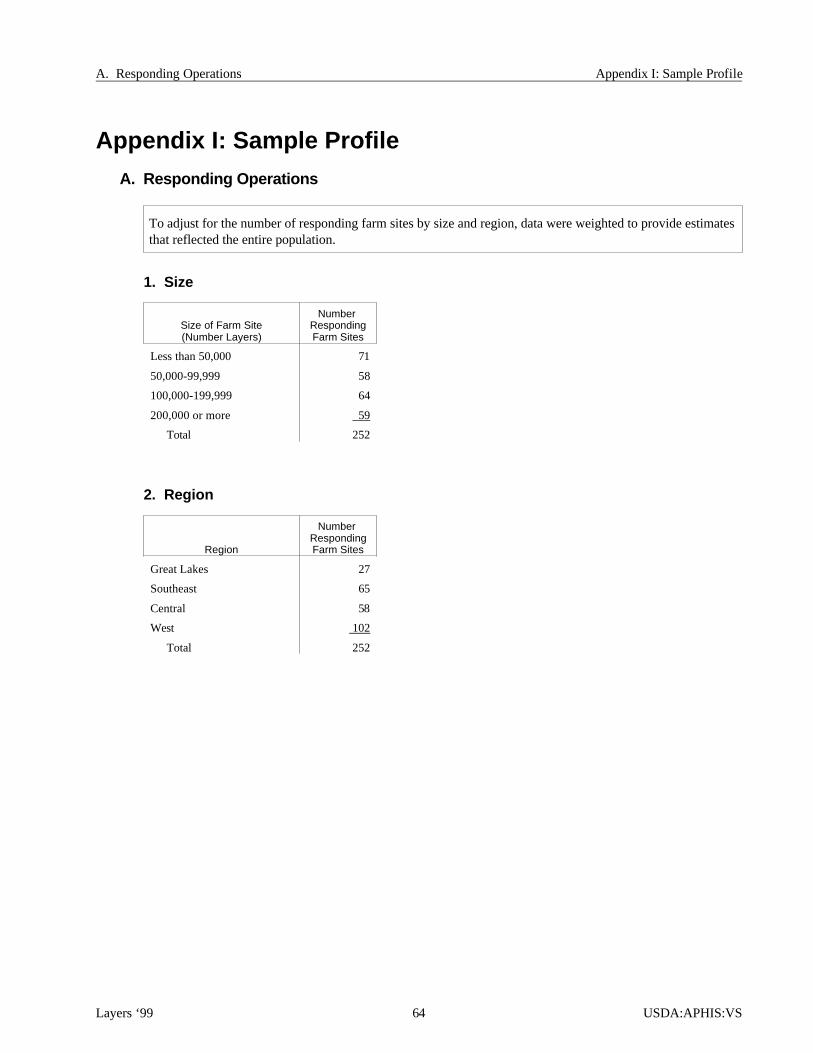
Ap pen dix I: Sam ple Pro file
A. Responding Operations
To ad just for the number of re spond ing farm sites by size and re gion, data were weighted to pro vide es ti mates that re flected the en tire popu la tion.
1. Size
Size of Farm Site(Num ber Lay ers)
Num ber Re spond ingFarm Sites
Less than 50,000 71
50,000-99,999 58
100,000-199,999 64
200,000 or more 59
Total 252
2. Re gion
Region
Num ber Re spond ingFarm Sites
Great Lakes 27
Southeast 65
Central 58
West 102
Total 252
Layers ‘99 64 USDA:APHIS:VS
A. Responding Operations Ap pen dix I: Sam ple Pro file

Ap pen dix II: U.S. Ta ble Egg Lay ers
Dur ing the Month of De cem ber 1998 in Flocks with 30,000 and Above*
Re gion StateTa ble Egg Layers
(Thou sand)
Central Arkansas 4,565
Iowa 24,261
Minnesota 11,403
Missouri 5,179
Nebraska 10,522
Total 55,930
Great Lakes Indiana 21,265
Ohio 28,839
Pennsylvania 21,389
Total 71,493
Southeast Alabama 4,325
Florida 9,893
Georgia 11,892
North Carolina 3,847
Total 29,957
West California 25,657
Texas 13,719
Washington 4,893
Total 44,269
Total (15 states) 201,649 (78.5% of US)
Total U.S. (50 states) 256,867
* There were 262,935,000 table egg layers during December 1998 in flocks of all sizes.
Source: National Agricultural Statistics Service (NASS), Chickens and Eggs, February 23, 1999.
USDA:APHIS:VS 65 Layers ‘99
Ap pen dix II: U.S. Ta ble Egg Lay ers
Layers ‘99 66 USDA:APHIS:VS
Ap pen dix II: U.S. Ta ble Egg Lay ers

Out puts and Re lated Study Ob jec tives
1. De scribe base line health and man age ment prac tices used by the U.S. layer in dus try, such asdis posal meth ods for ma nure/waste/dead birds/spent hens, pest con trol (ro dents, birds, flies), molt ingprac tices, vac ci na tion/pre ven tive prac tices, and hous ing/ven ti la tion.
• Part I: Ref er ence of 1999 Ta ble Egg Layer Man age ment in the U.S., October 1999
• Part II: Ref er ence of 1999 Table Egg Layer Man age ment in the U.S., January 2000
2. Es timate the na tional preva lence of Sal mo nella en teritidis in layer flocks by test ing the en vi ron -ment and other sources of con tami na tion on layer op era tions.
• In ter pre tive re port, ex pected Fall 2000
3. Iden tify po ten tial risk fac tors as so ci ated with the pres ence of S. enteri ti dis to sup port and en -hance qual ity as sur ance pro grams.
• In ter pre tive re port, ex pected Fall 2000
4. De scribe bio se cu rity prac tices used in the layer in dus try and how they bene fit flock health.
• Part II: Ref er ence of 1999 Table Egg Layer Man age ment in the U.S., January 2000

Cen ters for Epi de mi ol ogy and Ani mal HealthUSDA:APHIS:VS, attn. NAHMS
2150 Centre Ave., Bldg. B, MS 2E7Fort Col lins, CO 80526-8117
(970) 494-7000NAHM [email protected]
http://www.aphis.usda.gov/vs/ceah/cahm
#N323.0100