Embed Size (px)
Citation preview

PART I WORLD

WORLD
1999 Annual Energy Review20
PART I
ENERGY OUTLOOK
Total gross energy consumption growth fell to 1.1% in 1997 after the
rebound registered in 1995 and 1996…
Total gross energy consumption in the world as a whole increa-
sed by about 1.6% per year from 1980 to 1997, but by only 1.4%
annually since 1990. The developments in the period are charac-
terised by a faster growth in the non-OECD area during the 1980’s
(2.9% per year against 0.9% per year in the OECD) driven by the
Middle East (+5.9% per year on average), Asia (+4.2%) and Africa
(3.4%). However, while the OECD area continued to increase its
energy needs by 1.5% per year on average since 1990, the non-
OECD world had a slower growth in demand limited to 1.3%
annually. This drop in the non-OECD demand resulted from the
significant decreases in Central and Eastern Europe (-2% per year
on average) and the former USSR (-5.4% per year on average)
which was just about compensated by the buoyant demand in
the Middle East (+4.8% per year on average), Asia (+4.5%) and
Latin America (+3.6%). As a consequence of the stabilisation of
consumption since 1994 in CEEC and CIS considered as a whole,
world energy consumption rebounded in 1995 and 1996 to reach
a growth of about 2.7% per year, contrasting with a limited increa-
se by only 0.7% between 1990 and 1994. In 1997 the increase was
limited to only 1.2% despite growth of the world economy by
3.3%. This resulted from the favourable climatic conditions in the
western hemisphere and from the impacts of the financial crisis
that affected South East Asia, major countries in Latin America and
CIS but with a rebound effect on Central and Eastern countries.
Structurally, the weight of Asia has increased substantially since
1980 to represent 24.5% of world consumption in 1997 against
only 15.8% in 1980. On the other hand, the share of CIS declined
from 15.6% to 9.5%, and of Central and Eastern Europe from 4.9%
to 3.0%; while the contribution of OECD as a whole to world ener-
gy consumption decreased from 52.9% in 1980 to 49.1% in 1997.
The future evolution of gross energy consumption will be heavily
influenced by the restructuring of eastern economies that will
lead to the resumption of industrial growth and of these econo-
mies as a whole with, as a consequence, increasing consumption
of energy. On the other hand, the economic crisis in East Asia
which began in the summer of 1997 and continued to deepen
into the winter of 1998 with some extensions to Latin America
and CIS, will certainly, in the short term, affect GDP and energy
consumption growth in Asia, the most buoyant region over the
last fifteen years. The preliminary estimate for 1998 indicated that
world gross energy consumption will remain constant overall, but
with a marked reduction in Central and Eastern Countries, Asia
and OECD Pacific region. These recent economic events highlight
the uncertainties attached to economic growth both in the short
and long term.
WORLD: Major trends (1980-1997)
• Total gross energy consumption growth fell to 1.1% in 1997 after the rebound registered in 1995 and 1996• Final energy consumption, driven by transport and domestic sectors, has increased by 1.3% annually since 1980• World primary energy production marked by a 28% reduction in CIS since 1990• World energy production still dominated by oil, representing 37% of energy production in 1997• NAFTA region contributed 24% of world primary energy production• Market share of OPEC increased from 1990 to meet 41% of world oil production in 1997• Stabilisation of oil prices resulting from sustained demand in developing countries• Gas production, marked by the fall in CIS production in the early 90s, increased by only 0.2% in 1997• Lack of infrastructure is the major barrier to increased gas consumption• Solid production, driven by the United States and China, accounted for 24% of world energy supply • Prospects for an increasing nuclear contribution, which fell for the first time in 1997, are dimming• Asia accounted for 55% of world biomass production• Electricity’s share in final energy consumption increased by one third since 1980• World power market characterised by privatisation, integration and foreign investment • Power production remained largely dominated by thermal production even though its share declined slowly • Inputs for electricity generation increasingly dominated by solid fuels• Refinery capacities have increased only in non-OECD region since 1985• World GDP growth accelerated since 1994, driven by the developing regions• World energy consumption per capita stable but Asia grew by 52% since 1980• World energy intensity improved on average by 0.9% per year since 1980• World CO2 emissions grew by 8% since 1990• The contribution of CO2 emissions from power generation increased from 28% in 1980 to 34% in 1996 • The OECD absorbed about 80% of world interregional exchanges of energy

WORLD
1999 Annual Energy Review 21
PART I
0
1000
2000
3000
4000
5000
6000
7000
8000
9000
10000
Africa
Latin America
Middle East
Central and Eastern Europe
CIS
Asia
Other OECD
Western Europe
NAFTA
199719961995199019851980
Gross Energy Consumption by Region
Mtoe
Mtoe 1980 1985 1988 1990 1995 1996 1997 85/80 90/85 95/90 96/95 97/96
Annual % Change
World 7273.2 7795.1 8534.1 8686.1 9178.2 9470.3 9579.4 1.4% 2.2% 1.1% 3.2% 1.2%
Bunkers 109.0 94.7 104.1 117.6 127.1 129.3 131.9 -2.8% 4.4% 1.6% 1.7% 2.1%Western Europe 1282.0 1285.9 1338.2 1362.7 1413.5 1462.6 1459.7 0.1% 1.2% 0.7% 3.5% -0.2%
European Union 1240.8 1240.8 1291.9 1314.2 1362.6 1411.1 1406.9 0.0% 1.2% 0.7% 3.6% -0.3%EFTA 41.2 45.1 46.3 48.6 50.9 51.5 52.8 1.9% 1.5% 0.9% 1.3% 2.4%
Rest of OECD 2565.2 2577.8 2800.3 2852.2 3123.6 3207.4 3246.2 0.1% 2.0% 1.8% 2.7% 1.2%NAFTA 2103.6 2086.5 2259.8 2259.6 2454.4 2511.9 2541.7 -0.2% 1.6% 1.7% 2.3% 1.2%OECD Pacific 430.4 452.4 493.8 540.1 607.0 627.8 633.2 1.0% 3.6% 2.4% 3.4% 0.9%
Central and Eastern Europe 354.2 370.5 381.3 333.4 279.7 293.9 289.5 0.9% -2.1% -3.5% 5.1% -1.5%CIS (1) 1131.9 1272.4 1389.1 1347.8 955.7 932.9 911.1 2.4% 1.2% -6.6% -2.4% -2.3%Africa 260.2 321.6 356.7 363.8 407.6 412.7 425.2 4.3% 2.5% 2.3% 1.2% 3.0%Middle East 133.5 191.3 228.6 237.2 295.6 315.8 329.3 7.5% 4.4% 4.5% 6.8% 4.3%Asia 1148.4 1378.3 1601.0 1732.2 2174.5 2291.8 2350.7 3.7% 4.7% 4.7% 5.4% 2.6%Latin America 288.8 302.4 334.9 339.1 400.9 423.9 435.8 0.9% 2.3% 3.4% 5.7% 2.8%
of which (%)European Union 17.1 15.9 15.1 15.1 14.8 14.9 14.7 -1.4% -1.0% -0.4% 0.4% -1.4%OECD 52.9 49.6 48.5 48.5 49.4 49.3 49.1 -1.3% -0.4% 0.4% -0.2% -0.4%
(1) Including Baltic countries for statistical reasons
TOTAL GROSS ENERGY CONSUMPTION : TOTAL BY REGION
Final energy consumption, driven by transport and domestic sectors,
increased by 1.3% annually since 1980…
The final energy consumption by sector was very varied. Energy
consumption for transport, still the minor contributor, has increa-
sed regularly since 1980 by about 2% per annum in the OECD
region and 2.3% in the non-OECD region as a whole, the share of
OECD still achieving about 69% in 1996. Since 1990 major deve-
lopments occurred in Asia (+7.6% per year on average), the
Middle East (+6.7%) and Latin America (+5.1%). The near future
will be marked by two majors elements: the increasing contribu-
tion of transport in final energy demand (from 22.2% in 1980 to
25.1% in 1996); and the very sustained growth in emerging
regions where the potential for development remained enormous
with an average energy consumption per inhabitant ranging from
58 kgoe in Africa to 71 kgoe in Asia and 242 kgoe in Latin America,
compared to 1076 kgoe for the OECD as a whole and a maximum
of 1650 kgoe in the NAFTA region. Energy consumption by the
tertiary and domestic sector depends heavily on climatic condi-
tions. It increased on average by 1.8% since 1980 with a contras-
ted evolution between the OECD region (+1.1% per year on ave-
rage) and the non-OECD region (+2.2% per year) due to increasing
living standards and growing urbanisation in emerging regions.
As a consequence, the share of the OECD region declined from
44% in 1980 to 40% in 1996. Nevertheless this evolution was not
uniform. Between 1990 and 1996, substantially warmer in the
Western Hemisphere, energy consumption by the tertiary-domes-
tic sector increased faster in the OECD region (2.3% per year on
average) than in the rest of the world (+1.8%). Energy consump-
tion by industry was only 2.6% higher in 1996 than in 1980 and
still 3.3% below the peak reached in 1988. Even if this is the conse-
quence of the sharp decline in Eastern Countries, the long-term
evolution reflects all the efforts made by industrialists to reduce
specific energy consumption per unit produced. Although
consumption declined in the OECD region by 0.9% on average per
year since 1980, it grew by 0.9% in non-OECD regions. The latter
increased its share from 52% in 1980 to 60% in 1996. The growth
was spectacular in Asia, driven by China and South East Asia, rea-
ching 4.4% per year on average since 1980. In 1996, Asia, exclu-
ding Japan and New Zealand, absorbed 33% of world energy
consumption by industry. As a result of this, it is clear that the evo-
lution in non-OECD regions will be the leading force for the futu-
re.

WORLD
1999 Annual Energy Review22
PART I
Mtoe 1980 1985 1988 1990 1995 1996 1997 85/80 90/85 95/90 96/95 97/96
Annual % Change
World 1919.4 1907.6 2036.9 1983.2 1937.3 1969.3 na -0.1% 0.8% -0.5% 1.7% naWestern Europe 321.4 275.4 278.7 274.7 268.7 271.3 272.9 -3.0% -0.1% -0.4% 0.9% 0.6%
European Union 310.7 264.1 268.5 264.9 258.4 261.1 262.6 -3.2% 0.1% -0.5% 1.0% 0.6%EFTA 10.7 11.3 10.2 9.9 10.3 10.2 10.3 1.0% -2.7% 0.9% -1.3% 1.8%
Rest of OECD 583.6 541.1 566.1 509.6 519.4 526.3 531.0 -1.5% -1.2% 0.4% 1.3% 0.9%NAFTA 465.3 423.1 442.8 378.6 383.0 385.7 388.3 -1.9% -2.2% 0.2% 0.7% 0.7%OECD Pacific 111.8 110.4 113.9 120.2 124.2 125.9 126.8 -0.2% 1.7% 0.7% 1.3% 0.7%
Central and Eastern Europe 123.9 119.8 111.1 98.2 68.8 70.5 na -0.7% -3.9% -6.9% 2.4% naCIS (1) 399.7 386.1 413.5 413.5 233.7 226.5 na -0.7% 1.4% -10.8% -3.1% naAfrica 49.4 52.3 56.2 56.9 54.1 55.4 na 1.2% 1.7% -1.0% 2.3% naMiddle East 35.4 39.0 38.3 26.0 44.8 49.1 na 2.0% -7.8% 11.5% 9.6% naAsia 328.2 410.6 482.1 514.1 638.7 658.9 na 4.6% 4.6% 4.4% 3.2% naLatin America 77.8 83.3 90.7 90.1 108.9 111.5 na 1.4% 1.6% 3.9% 2.3% na
of which (%)European Union 16.2 13.8 13.2 13.4 13.3 13.3 na -3.1% -0.7% 0.0% -0.6% naOECD 47.2 42.8 41.5 39.6 40.7 40.5 na -1.9% -1.6% 0.6% -0.5% na
TOTAL ENERGY CONSUMPTION BY INDUSTRY : TOTAL BY REGION
Mtoe 1980 1985 1988 1990 1995 1996 1997 85/80 90/85 95/90 96/95 97/96
Annual % Change
World 1132.2 1211.4 1358.9 1408.3 1526.6 1572.9 na 1.4% 3.1% 1.6% 3.0% naWestern Europe 197.1 211.7 244.8 264.6 286.8 294.7 300.4 1.4% 4.6% 1.6% 2.8% 1.9%
European Union 189.2 202.8 234.7 253.8 275.7 283.3 288.6 1.4% 4.6% 1.7% 2.8% 1.9%EFTA 7.8 8.9 10.1 10.8 11.1 11.5 11.7 2.5% 4.0% 0.6% 2.8% 2.4%
Rest of OECD 583.5 602.2 669.4 687.8 757.8 776.2 792.4 0.6% 2.7% 2.0% 2.4% 2.1%NAFTA 502.2 515.5 570.2 577.8 629.3 642.7 656.9 0.5% 2.3% 1.7% 2.1% 2.2%OECD Pacific 75.7 80.1 90.4 100.5 116.3 120.5 123.3 1.1% 4.7% 3.0% 3.6% 2.3%
Central and Eastern Europe 25.4 23.9 26.9 28.0 23.2 26.8 na -1.2% 3.2% -3.7% 15.2% naCIS (1) 123.8 134.1 144.6 139.9 67.6 62.0 na 1.6% 0.9% -13.5% -8.2% naAfrica 30.6 35.4 37.0 37.1 40.7 41.8 na 3.0% 0.9% 1.9% 2.7% naMiddle East 30.1 42.1 44.8 41.1 59.4 60.8 na 7.0% -0.5% 7.6% 2.4% naAsia 77.8 99.5 122.7 139.7 200.4 216.2 na 5.0% 7.0% 7.5% 7.9% naLatin America 63.8 62.5 68.5 70.0 90.7 94.3 na -0.4% 2.3% 5.3% 4.0% na
of which (%)European Union 16.7 16.7 17.3 18.0 18.1 18.0 na 0.0% 1.5% 0.0% -0.3% naOECD 68.9 67.2 67.3 67.6 68.4 68.1 na -0.5% 0.1% 0.2% -0.5% na
TOTAL ENERGY CONSUMPTION BY TRANSPORT : TOTAL BY REGION
Mtoe 1980 1985 1988 1990 1995 1996 1997 85/80 90/85 95/90 96/95 97/96
Annual % Change
World 2045.3 2236.8 2394.1 2406.1 2609.9 2709.5 na 1.8% 1.5% 1.6% 3.8% naWestern Europe 359.3 370.6 365.2 358.8 381.8 410.8 396.1 0.6% -0.6% 1.2% 7.6% -3.6%
European Union 344.9 355.0 349.2 342.6 364.7 392.9 379.0 0.6% -0.7% 1.3% 7.7% -3.5%EFTA 14.4 15.5 16.0 16.2 17.1 17.9 17.0 1.5% 0.9% 1.1% 4.7% -4.8%
Rest of OECD 549.1 564.8 607.4 593.9 653.0 679.5 670.9 0.6% 1.0% 1.9% 4.0% -1.3%NAFTA 464.7 467.0 496.0 476.7 516.6 539.7 530.6 0.1% 0.4% 1.6% 4.5% -1.7%OECD Pacific 70.9 82.6 94.2 100.3 117.0 119.7 119.2 3.1% 3.9% 3.1% 2.3% -0.4%
Central and Eastern Europe 98.7 101.5 105.6 88.7 77.2 81.4 na 0.6% -2.7% -2.7% 5.4% naCIS (1) 266.2 318.9 339.7 338.6 363.4 358.6 na 3.7% 1.2% 1.4% -1.3% naAfrica 122.6 140.8 153.3 161.7 188.1 191.1 na 2.8% 2.8% 3.1% 1.6% naMiddle East 22.4 37.4 58.8 76.8 83.9 89.0 na 10.8% 15.5% 1.8% 6.1% naAsia 554.7 628.4 684.9 706.6 770.9 804.9 na 2.5% 2.4% 1.8% 4.4% naLatin America 72.4 74.6 79.2 81.0 91.5 94.3 na 0.6% 1.7% 2.5% 3.0% na
of which (%)European Union 16.9 15.9 14.6 14.2 14.0 14.5 na -1.2% -2.1% -0.4% 3.8% naOECD 44.4 41.8 40.6 39.6 39.7 40.2 na -1.2% -1.1% 0.0% 1.5% na
(1) Including Baltic countries for statistical reasons
TOTAL ENERGY CONSUMPTION BY TERTIARY-DOMESTIC SECTOR : TOTAL BY REGION

WORLD
1999 Annual Energy Review
PART I
World energy production still dominated by oil, representing 37% of
total energy production in 1997…
In 1997, oil was still the most important fuel with 37% of world pri-
mary energy production (43% in 1980). Its production and
consumption, however, grew three times slower than total energy
since 1980 even though they have accelerated significantly since
1995. The second most important fuel remained solid fuels which
kept a share of about one-quarter, slowly declining since 1985 and
losing about 1% market share every five years. Natural gas ranks
third in meeting world needs with 20% in 1997 (17% in 1980). Gas
experienced accelerating growth since 1980, excluding a relative
slowdown between 1990 and 1995 due to the particular econo-
mic situation in the CIS where gas production was reduced by
18% since 1990. Renewable energy sources (hydro, geothermal,
biomass and wind) come fourth in satisfying world energy
consumption with almost 13% in 1997, as in 1980, growing glo-
bally at the same rate as total primary energy. Finally, nuclear
energy grew the fastest in the period, mainly up to 1988 (13% per
year). Its rate of growth has slowed down progressively since then
and, for the first time since 1980, nuclear production diminished in
1997.
Between 1980 and 1997, OECD and non-OECD areas had approxi-
mately the same growth in total energy production (about 1.6%
per year), but the evolution was slightly different over time and by
regions. While between 1986 and 1990 the non-OECD world
increased its production about three times faster than the OECD,
on the contrary, between 1990 and 1995, primary energy produc-
tion increased twice as fast in the OECD region as in the non-
OECD area.
World primary energy production marked by a 27% reduction in CIS
since 1990…
World primary energy production (equivalent to gross energy
consumption aside from some stock variations and statistical
errors) increased from 1980 to 1997 by about 1.6% per year, with
a contrasted evolution in the 1990's. Growth was limited to 0.6%
per annum for the first four years but jumped by 2.3% per year on
average since then. The most recent evolution is marked by the
impressive reduction of energy production in CIS (-456 Mtoe or a
reduction by 28% between 1990 and 1997) and CEEC (-26 Mtoe or
a reduction by 11%) compensated by increases in all other regions
of the world, mainly in Asia (+420 Mtoe or +25%), the Middle East
(+246 Mtoe or +26%), Latin America (+173 Mtoe or +43%), NAFTA
(+153 Mtoe or +7%), Africa (+132 Mtoe or +20%) and EFTA (+94
Mtoe or +72%).
In recent years, the vision of many citizens, analysts and poli-
cy makers has shifted increasingly to the global level. This
change in focus has reflected much improved global com-
munication and transportation; greater economic inter-
dependence via trade and overseas direct investment; and,
perhaps above all, the growing recognition of the many man-
made impacts which are influencing the natural environ-
ment. Huge inequalities remain. For many millions of people
the vision is much more limited: for them survival remains the
dominant imperative given inadequate access to basic essen-
tials such as food, water and shelter. One-third of the global
population still has no access to the commercial energy sup-
plies seen as a fundamental necessity by the more fortunate.
Despite recent financial crises in some regions, continued
economic growth is leading to a steady rise in global energy
consumption - particularly in the developing countries.
Energy use in central and eastern Europe has fallen as these
regions adjust their economies through a difficult process of
market reforms and structural change. Particularly rapid
growth in electricity demand and transport is a feature of
most regions, reflecting rising standards of living and higher
consumer aspirations. World energy use remains heavily
dependent (some 82%) upon the major fossil fuels, with the
carbon-free sources - renewables and nuclear power - satis-
fying the balance. Whilst there is growing recognition of the
need to reduce global reliance upon fossil fuels, the shift
away from this heavy dependence will take very many
decades. Nevertheless, as the Kyoto Protocol and other simi-
lar international agreements reveal, there is now clear evi-
dence that concern with sustainability is achieving greater
prominence in both public attitudes and policy responses.
Main items
0
1000
2000
3000
4000
5000
6000
7000
8000
9000
10000
Other
Geothermal
Hydro & Wind
Nuclear
Gas
Oil
Solids
199719961995199019851980
Primary Production
Mtoe
23

WORLD
1999 Annual Energy Review
PART I
NAFTA region contributed 24% of world primary energy production...
In 1997, to cover the requirements, energy production increased
by 1.9%. The production continued to decline in CIS and CEEC to
be close to 14% of world production in 1997 against 22% in 1980.
On the other hand, sustained growth was observed in Latin
America, the Middle East, Africa and OECD Pacific. In 1997 the
European Union’s production slowed down by 0.3% following the
trend of gross inland consumption marked by warm weather
conditions. The main contributor to energy production in 1997
remained the NAFTA region with about 24% of total world prima-
ry energy production (26% in 1980), followed by Asia with 22%
(15% in 1980), the Middle East with 12% (14% in 1980), the CIS
with 12% (18% in 1980) and Western Europe with 10% (9% in
1980).
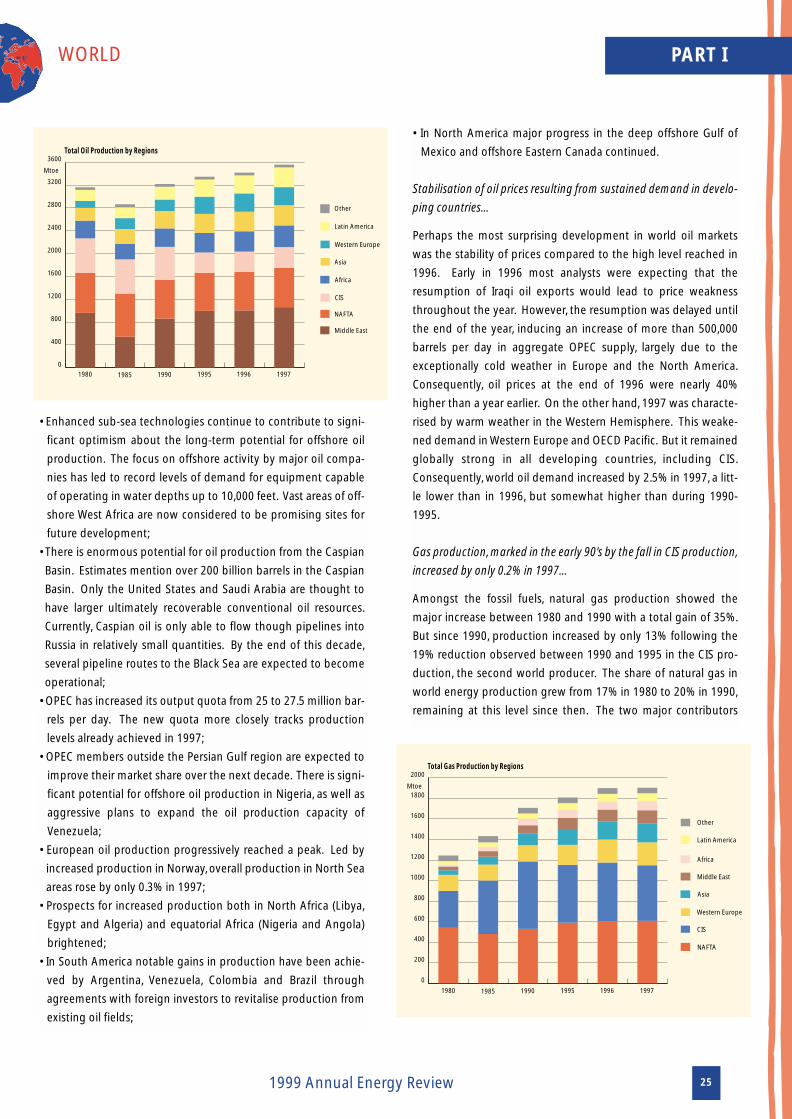
Market share of OPEC increased from 1990 to meet 41% of world oil
production in 1997…
Oil remains the dominant fuel in world production and consump-
tion although, as stated above, it has lost share in total energy pro-
duction despite a sustained growth in 1996 (+2.2%) and 1997
(+4.1%). OPEC as a whole remains the major oil producer, but its
weight in total world oil production fell from 44% in 1980 (54% in
1973) to 41% in 1997, with a minimum share of 29% in 1985. Since
1990, the share of Western Europe has sharply increased (from 6%
in 1990 to 9% in 1997) driven by rising North Sea production.
Since 1990 production losses in CIS and Eastern countries, (about
214 Mtoe), have been compensated mainly by the Middle East
(+199 Mtoe), Latin America (+121 Mtoe) and Western Europe
(+118 Mtoe), although the NAFTA region, the second world pro-
ducer, remained stable.
Some key supply developments in 1997 included1 :
• While the economies of developing Asian countries are current-
ly experiencing a downturn, it is not expected to last long. The
mid- to long-term trend appears to be for continued economic
growth with resultant increases in oil demand. Oil consumption
in developing countries of Asia is projected to grow by 3.8% per
year to about 730 Mtoe in 2000;
0
200
400
600
800
1000
1200
1400
1600
Algeria
Libya
Nigeria
Indonesia
Iraq
Venezuela
Iran
GCC countries19
97
1996
1995
1994
1993
1992
1991
1990
1989
1988
1987
1986
1985
1984
1983
1982
1981
1980
OPEC Crude Oil Production
Mtoe
1 International Energy Outlook 1998, Energy Information Administration, US Department of Energy, 1998.
Mtoe 1980 1985 1988 1990 1995 1996 1997 85/80 90/85 95/90 96/95 97/96
Annual % Change
World 7353.7 7767.8 8520.1 8775.6 9213.2 9466.7 9646.1 1.1% 2.5% 1.0% 2.8% 1.9%Western Europe 671.9 818.7 845.9 834.5 932.9 984.1 986.6 4.0% 0.4% 2.3% 5.5% 0.3%
European Union 608.3 735.2 740.5 703.3 738.2 763.6 761.5 3.9% -0.9% 1.0% 3.4% -0.3%EFTA 63.6 83.4 105.4 131.2 194.7 220.5 225.1 5.6% 9.5% 8.2% 13.2% 2.1%
Rest of OECD 2066.3 2229.1 2325.1 2388.1 2539.3 2590.1 2617.5 1.5% 1.4% 1.2% 2.0% 1.1%NAFTA 1910.0 2005.5 2081.5 2117.5 2215.0 2257.7 2269.6 1.0% 1.1% 0.9% 1.9% 0.5%OECD Pacific 139.1 201.9 219.1 244.9 298.2 305.7 320.3 7.7% 3.9% 4.0% 2.5% 4.8%
Central and Eastern Europe 268.2 287.1 288.8 237.5 212.4 215.9 210.9 1.4% -3.7% -2.2% 1.7% -2.3%CIS (1) 1357.8 1512.9 1677.0 1624.6 1194.8 1198.0 1167.9 2.2% 1.4% -6.0% 0.3% -2.5%Africa 532.2 566.2 606.6 661.6 722.7 748.9 793.9 1.2% 3.2% 1.8% 3.6% 6.0%Middle East 999.8 599.0 835.7 949.7 1107.7 1127.3 1196.3 -9.7% 9.7% 3.1% 1.8% 6.1%Asia 1137.5 1404.0 1556.6 1675.8 1989.9 2063.1 2096.0 4.3% 3.6% 3.5% 3.7% 1.6%Latin America 319.9 350.8 384.4 403.8 513.5 539.4 577.0 1.9% 2.9% 4.9% 5.0% 7.0%
of which (%)European Union 8.3 9.5 8.7 8.0 8.0 8.1 7.9 2.7% -3.3% 0.0% 0.7% -2.1%OECD 37.2 39.2 37.2 36.7 37.7 37.8 37.4 1.1% -1.3% 0.5% 0.2% -1.0%
(1) Including Baltic countries for statistical reasons
TOTAL PRIMARY ENERGY PRODUCTION : TOTAL BY REGION
24
WORLD
1999 Annual Energy Review 25
PART I
• Enhanced sub-sea technologies continue to contribute to signi-
ficant optimism about the long-term potential for offshore oil
production. The focus on offshore activity by major oil compa-
nies has led to record levels of demand for equipment capable
of operating in water depths up to 10,000 feet. Vast areas of off-
shore West Africa are now considered to be promising sites for
future development;
• There is enormous potential for oil production from the Caspian
Basin. Estimates mention over 200 billion barrels in the Caspian
Basin. Only the United States and Saudi Arabia are thought to
have larger ultimately recoverable conventional oil resources.
Currently, Caspian oil is only able to flow though pipelines into
Russia in relatively small quantities. By the end of this decade,
several pipeline routes to the Black Sea are expected to become
operational;
• OPEC has increased its output quota from 25 to 27.5 million bar-
rels per day. The new quota more closely tracks production
levels already achieved in 1997;
• OPEC members outside the Persian Gulf region are expected to
improve their market share over the next decade. There is signi-
ficant potential for offshore oil production in Nigeria, as well as
aggressive plans to expand the oil production capacity of
Venezuela;
• European oil production progressively reached a peak. Led by
increased production in Norway, overall production in North Sea
areas rose by only 0.3% in 1997;
• Prospects for increased production both in North Africa (Libya,
Egypt and Algeria) and equatorial Africa (Nigeria and Angola)
brightened;
• In South America notable gains in production have been achie-
ved by Argentina, Venezuela, Colombia and Brazil through
agreements with foreign investors to revitalise production from
existing oil fields;
• In North America major progress in the deep offshore Gulf of
Mexico and offshore Eastern Canada continued.
Stabilisation of oil prices resulting from sustained demand in develo-
ping countries…
Perhaps the most surprising development in world oil markets
was the stability of prices compared to the high level reached in
1996. Early in 1996 most analysts were expecting that the
resumption of Iraqi oil exports would lead to price weakness
throughout the year. However, the resumption was delayed until
the end of the year, inducing an increase of more than 500,000
barrels per day in aggregate OPEC supply, largely due to the
exceptionally cold weather in Europe and the North America.
Consequently, oil prices at the end of 1996 were nearly 40%
higher than a year earlier. On the other hand, 1997 was characte-
rised by warm weather in the Western Hemisphere. This weake-
ned demand in Western Europe and OECD Pacific. But it remained
globally strong in all developing countries, including CIS.
Consequently, world oil demand increased by 2.5% in 1997, a litt-
le lower than in 1996, but somewhat higher than during 1990-
1995.
Gas production, marked in the early 90's by the fall in CIS production,
increased by only 0.2% in 1997…
Amongst the fossil fuels, natural gas production showed the
major increase between 1980 and 1990 with a total gain of 35%.
But since 1990, production increased by only 13% following the
19% reduction observed between 1990 and 1995 in the CIS pro-
duction, the second world producer. The share of natural gas in
world energy production grew from 17% in 1980 to 20% in 1990,
remaining at this level since then. The two major contributors
0
200
400
600
800
1000
1200
1400
1600
1800
2000
Other
Latin America
Africa
Middle East
Asia
Western Europe
CIS
NAFTA
199719961995199019851980
Total Gas Production by Regions
Mtoe
0
400
800
1200
1600
2000
2400
2800
3200
3600
Other
Latin America
Western Europe
Asia
Africa
CIS
NAFTA
Middle East
199719961995199019851980
Total Oil Production by Regions
Mtoe

WORLD
1999 Annual Energy Review26
PART I
during this period were the CIS (360 Mtoe in 1980 and 541 Mtoe
in 1997, with a peak of 656 Mtoe in 1990) and the NAFTA region
(540 Mtoe in 1980, compared to 608 Mtoe in 1997). Their global
share in total gas production slowed down from 72% in 1980 to
60% in 1997. Production is increasing fastest in Asia with an
annual growth of almost 9% per year on average since 1980. All
the other developing regions are also increasing their production
at sustained rates. In 1997, production declined in the European
Union, a reaction of the Netherlands playing the role of swing pro-
ducer on the European market, faced with a slight slowdown of
internal consumption. Since 1990, the bulk of the consumption
increase occurred in power generation.
Lack of infrastructure is the major barrier to increased gas consump-
tion...
Throughout the world, major efforts to reduce production, trans-
mission and distribution constraints are proceeding. Worldwide
there is a great deal of construction activity to develop gas distri-
bution and transmission systems. According to the International
Pipeline and Offshore Contractors Association, 34,000 miles of
natural gas pipelines are expected to be installed between 1998
and 2000. The survey included only firm projects that have secu-
red financing and did not include projects in the former Soviet
Union and China.
Some key developments supporting the world's natural gas mar-
kets in 1997 include2 :
• Installation of Norfra, the world’s longest sub-sea pipeline, was
completed in August 1997. The pipeline extends more than 520
miles from Daupner, offshore Norway, to Dunkirk, France. Gas
delivery to France was scheduled to begin in October 1998;
• Vibrant growth in Central and South America was demonstrated
by the completion of the Gas-Andes pipeline. Completed in
August 1997, it provided the first natural gas supplies to
Santiago, Chile. Progress was also made in 1997 on other major
pipeline projects, including the Bolivia-Brazil pipeline and the
Atacama pipeline;
• Development of Iran’s South Par natural gas field moved closer to
reality as Total, Gazprom and Petrogas signed a $2 billion
contract to develop 2 billion cubic feet per day from the field;
• Substantial planned increases in pipeline capacity between the
United States and Canada are underway. Most of the capacity
expansion needed to support the consumption increase bet-
ween now and 2000 is either already under construction or in
the final planning stages.
• Planning proceeded for the development of a trans-Asian gas
pipeline system to connect Indonesia with Malaysia, Myanmar,
Thailand, Singapore and the Philippines. This pipeline is likely to
become operational as early as 2002;
• Several major projects to expand liquefied natural gas trade
went to contract. New LNG facilities will soon be under
construction in Oman, Qatar, Nigeria and Trinidad. Japan, South
Korea,Taiwan and Thailand are the largest customers committed
to purchase the output from these new facilities.
Solid production driven by the United States and China accounted
for 24% of world energy supply…
Coal's role in energy use worldwide has shifted substantially over
the decades, from a fuel used extensively in all sectors of the eco-
nomy to one that is now used primarily for electricity generation
and in a few key industrial sectors, such as steel, cement and che-
micals. Although coal has lost market share to petroleum pro-
ducts and natural gas, it continues to be a key source of energy
because of the dominant role it has maintained in its core markets
and its success in penetrating markets in emerging economies. In
1997, coal accounted for 23.5% of the world's primary energy pro-
duction, a slow decline already started in 1985. The largest pro-
ducer in 1997 remained Asia (40% of the total compared to 22%
in 1980), followed by NAFTA (27% in 1997, almost the same contri-
bution as in 1980). Increased production in these two regions
compensated for a slowdown in CIS and Eastern countries due to
economic and political reforms and mine closures in the European
Union as a consequence of the restructuring of the coal sector. In
1997, the two biggest producers were China (705 Mtoe) and the
United States (562 Mtoe), followed by India (139 Mtoe), Australia
(130 Mtoe) and Russia (100 Mtoe). The two major producers
accounted for 56% of total world production.
0
500
1000
1500
2000
2500
Others
Africa
OECD Pacific
Western Europe
Central and Eastern Europe
CIS
NAFTA
Asia
199719961995199019851980
Total Solid Production by Regions
Mtoe
2 International Energy Outlook 1998, Energy Information Administration, US Department of Energy, 1998.

WORLD
1999 Annual Energy Review 27
PART I
Mtoe 1980 1985 1988 1990 1995 1996 1997 85/80 90/85 95/90 96/95 97/96
Annual % Change
World 1806.3 2023.7 2165.6 2189.8 2210.4 2249.5 2271.2 2.3% 1.6% 0.2% 1.8% 1.0%Western Europe 257.8 239.8 230.8 210.1 138.2 131.5 126.5 -1.4% -2.6% -8.0% -4.9% -3.8%
European Union 257.6 239.4 230.6 209.9 138.0 131.3 126.3 -1.5% -2.6% -8.0% -4.9% -3.8%EFTA 0.2 0.4 0.2 0.2 0.2 0.2 0.3 11.9% -10.6% -0.7% -21.4% 68.2%
Rest of OECD 541.0 605.2 647.7 704.8 722.1 741.5 766.3 2.3% 3.1% 0.5% 2.7% 3.3%NAFTA 470.2 502.5 537.1 580.2 576.7 593.6 609.9 1.3% 2.9% -0.1% 2.9% 2.8%OECD Pacific 64.6 92.1 99.2 112.3 133.4 135.7 143.3 7.3% 4.0% 3.5% 1.7% 5.6%
Central and Eastern Europe 189.6 200.4 202.1 164.8 146.3 150.0 145.2 1.1% -3.8% -2.4% 2.6% -3.2%CIS (1) 338.7 312.5 331.8 300.5 190.5 180.4 174.1 -1.6% -0.8% -8.7% -5.3% -3.5%Africa 69.8 103.8 109.3 105.7 115.8 115.8 123.1 8.3% 0.4% 1.8% 0.0% 6.3%Middle East 0.6 0.8 0.8 0.8 0.7 0.6 0.6 6.8% 1.5% -3.7% -11.4% 5.2%Asia 402.6 550.7 627.5 684.8 874.2 905.3 907.6 6.5% 4.5% 5.0% 3.6% 0.3%Latin America 6.2 10.5 15.5 18.3 22.6 24.4 27.7 11.2% 11.6% 4.3% 8.3% 13.3%
of which (%)European Union 14.3 11.8 10.6 9.6 6.2 5.8 5.6 -3.7% -4.1% -8.2% -6.5% -4.8%OECD 43.9 41.2 40.0 41.2 38.4 38.3 38.7 -1.2% 0.0% -1.4% -0.3% 1.2%
TOTAL SOLID PRODUCTION : TOTAL BY REGION
Mtoe 1980 1985 1988 1990 1995 1996 1997 85/80 90/85 95/90 96/95 97/96
Annual % Change
World 3160.7 2862.2 3134.1 3218.7 3343.7 3416.4 3556.3 -2.0% 2.4% 0.8% 2.2% 4.1%Western Europe 119.4 190.4 201.5 201.3 302.0 320.3 319.1 9.8% 1.1% 8.4% 6.1% -0.4%
European Union 94.4 150.9 143.5 117.0 159.7 159.2 158.3 9.8% -5.0% 6.4% -0.3% -0.6%EFTA 25.0 39.5 57.9 84.4 142.3 161.1 160.8 9.6% 16.4% 11.0% 13.2% -0.2%
Rest of OECD 721.8 789.0 758.1 715.0 703.7 711.2 724.3 1.8% -1.9% -0.3% 1.1% 1.8%NAFTA 697.2 757.1 724.9 680.1 669.4 676.9 688.9 1.7% -2.1% -0.3% 1.1% 1.8%OECD Pacific 22.2 29.7 30.6 31.2 30.6 30.7 31.8 6.0% 1.0% -0.3% 0.3% 3.5%
Central and Eastern Europe 20.7 18.9 16.8 14.6 13.2 12.6 12.8 -1.9% -5.0% -1.9% -4.6% 1.6%CIS (1) 606.2 598.2 627.4 573.5 353.7 353.0 361.6 -0.3% -0.8% -9.2% -0.2% 2.5%Africa 310.5 270.0 282.4 323.8 340.7 357.6 381.4 -2.8% 3.7% 1.0% 5.0% 6.7%Middle East 961.4 542.4 753.0 862.7 994.7 1003.5 1061.9 -10.8% 9.7% 2.9% 0.9% 5.8%Asia 226.8 261.4 283.1 304.9 335.9 341.4 351.2 2.9% 3.1% 2.0% 1.6% 2.9%Latin America 194.0 192.0 211.7 222.9 299.9 316.8 344.0 -0.2% 3.0% 6.1% 5.6% 8.6%
of which (%)European Union 3.0 5.3 4.6 3.6 4.8 4.7 4.5 12.0% -7.2% 5.6% -2.4% -4.5%OECD 26.5 34.1 30.5 28.4 30.0 30.1 29.2 5.2% -3.6% 1.1% 0.4% -2.8%
TOTAL OIL PRODUCTION : TOTAL BY REGION
Mtoe 1980 1985 1988 1990 1995 1996 1997 85/80 90/85 95/90 96/95 97/96
Annual % Change
World 1243.4 1432.1 1613.3 1707.4 1808.5 1899.2 1902.9 2.9% 3.6% 1.2% 5.0% 0.2%Western Europe 156.1 155.3 150.6 157.0 194.8 226.0 223.2 -0.1% 0.2% 4.4% 16.0% -1.2%
European Union 133.3 131.9 124.7 132.9 166.6 188.6 182.2 -0.2% 0.2% 4.6% 13.2% -3.4%EFTA 22.8 23.4 25.9 24.1 28.3 37.4 41.0 0.6% 0.6% 3.2% 32.2% 9.8%
Rest of OECD 549.9 496.2 522.4 553.1 620.9 634.8 640.2 -2.0% 2.2% 2.3% 2.2% 0.9%NAFTA 539.7 480.0 503.6 530.1 590.0 602.6 607.8 -2.3% 2.0% 2.2% 2.1% 0.9%OECD Pacific 10.2 16.2 18.8 22.8 30.8 32.0 32.3 9.7% 7.1% 6.2% 4.0% 0.8%
Central and Eastern Europe 43.6 44.2 41.8 32.0 24.3 23.1 20.9 0.3% -6.2% -5.4% -4.8% -9.5%CIS (1) 359.6 520.1 622.7 656.3 562.9 572.7 540.7 7.7% 4.8% -3.0% 1.7% -5.6%Africa 20.4 42.5 52.1 61.5 74.8 79.6 88.7 15.8% 7.7% 4.0% 6.5% 11.4%Middle East 36.2 53.9 79.4 83.7 109.6 120.3 131.0 8.3% 9.2% 5.5% 9.8% 8.8%Asia 44.8 76.8 96.6 111.7 153.9 170.5 181.5 11.4% 7.8% 6.6% 10.8% 6.4%Latin America 32.8 43.1 47.6 52.0 67.3 72.2 76.7 5.6% 3.9% 5.3% 7.4% 6.2%
of which (%)European Union 10.7 9.2 7.7 7.8 9.2 9.9 9.6 -3.0% -3.3% 3.4% 7.8% -3.6%OECD 56.8 45.5 41.7 41.6 45.1 45.3 45.4 -4.3% -1.8% 1.6% 0.5% 0.1%
(1) Including Baltic countries for statistical reasons
TOTAL GAS PRODUCTION : TOTAL BY REGION

WORLD
1999 Annual Energy Review28
PART I
Prospects for an increasing nuclear contribution, which fell for the
first time in 1997, are dimming...
Even as the performance of nuclear reactors improves worldwide,
the prospects for increased reliance on nuclear power for electri-
city generation are dimming. Public concern about the safety of
nuclear reactor operations and the disposal of nuclear waste
makes the siting of new nuclear facilities difficult. In 1996 Japan
joined the ranks of countries in which local voting initiatives
recorded strong public opposition to the construction of nuclear
facilities. In 1997, reflecting some plant closures in the United
States and Canada, nuclear production fell for the first time since
1980. An equally important barrier to additions of nuclear power
capacity in the industrialised countries is market competition, pri-
marily from natural gas, which can be used to supply highly effi-
cient low-cost combined cycle gas turbine power plants. In addi-
tion, the trend towards utility deregulation and privatisation has
been a parallel force undermining the competitive potential of
nuclear power. In developing countries, meanwhile, reliance on
nuclear power was increasing, especially in Asia. China, India,
South Korea and Taiwan all have sizeable construction projects
planned or underway.
Asia accounted for 55% of world biomass production…
The contribution of renewable energy sources (hydro, biomass,
geothermal, wind…) must be analysed from two perspectives:
commercial and non-commercial energy sources. The bulk of bio-
mass production and consumption concerned non-commercial
uses mainly located in Asia (55% of total biomass production),
Africa (18%), NAFTA (8%) and Latin America. Since 1980, the
contribution of biomass to world energy production has remai-
ned stable at about 11%. With the exception of Africa where bio-
mass production increased faster, the average growth rate since
1980 was relatively similar amongst the major contributors.
Low fossil fuel prices continue to constrain development of the
world's renewable energy sources dedicated to commercial uses.
While the costs of installing and generating electricity with rene-
wable resources continue to decline, and technological advances
improve generating efficiencies, they have not been able to keep
pace with the declining costs of energy from fossil fuels.
Nevertheless, in Western Europe, for environmental reasons, and
in rural areas of developing countries where populations live far
from institutional electricity grids, there is sustained interest in
increasing the use of renewable energy sources. In particular,
wind energy is experiencing some of the strongest growth among
the renewable energy sources, the five top markets being located
in Germany (2,000 MWe installed at end 1997), the United States
(1646 MWe), Denmark (1135 MWe) India (870 MWe) and Spain
(449 MWe)3. The share of hydro in world energy production remai-
ned stable at around 2.3% with major developments in non-OECD
countries where the main potential for growth is located for geo-
graphic reasons.
Electricity’s share in final energy consumption increased by one third
since 1980…
Throughout the world, electricity is - and will continue to be - the
fastest growing component of final energy demand. In the OECD
region, electricity showed strong growth between 1980 and 1997,
at 2.7% per year on average, in contrast to 0.8% annual growth in
total final energy demand. In the industrialised world, where elec-
trification has been fully achieved throughout all economic sec-
tors, increased demand was driven by economic growth and gro-
wing electrical applications in industry as well as for computers,
communications, and other electronic applications for home and
business uses. This demand growth is tempered by increases in
energy efficiency encouraged by both regulation and technologi-
cal innovation. Electricity consumption in the rest of the world
grew by 3.9% per year on average since 1980 although total final
energy demand increased by only 1.8% in the same period. In the
developing world, there are many opportunities for the expansion
of electrical applications. The marginal benefit of introducing
electricity into a rural village is considerable. High value-added
applications such as refrigeration and communication are the rea-
sons that providing electricity to the wider population is a priori-
ty for most political leaders in the developing world.
World power market characterised by privatisation, integration and
foreign investment…
Highlights of recent developments in electricity markets around
the world are:
• Privatisation and electricity reform measures continued apace in
1997. Central and South America has led the developing world
in the privatisation of electricity and the implementation of elec-
tricity reform. In 1997, Brazil followed the path, commenced first
by Chile and later by Argentina, in aggressively selling off state-
owned electricity assets to the public;
• Financial crises in Southeast Asia slowed down the development
of the power industry. In mid-1997, several Southeast Asia
nations experienced financial difficulties characterised by steep
currency depreciation and sharp drops in domestic asset values.
The crisis was in part precipitated by the accumulation of exces-
sive levels of foreign debt, trade imbalances and speculative
3 Wind Energy: The Facts, European Commission, 1999.

in Japan (+58%). Hydro power, depending on hydraulic condi-
tions, grew regularly on average by 2.3% per year since 1980. The
installed capacity reached 3134 GWe in 1996, compared with 1973
GWe in 1980, or an average increase of about 2.9% per year since
1980. Thermal units, which represented 59% of additional capaci-
ty since 1980 (70% since 1990), grew by about 2.6% per year over
this period. Since 1990 the expansion of nuclear capacity slowed
down, and hydro capacity expanded a little slower than thermal
capacity.
Inputs for electricity generation increasingly dominated by solid
fuels…
Solid fuels increasingly dominated inputs for electricity genera-
tion. While these represented 54% of total input in 1980, they rea-
ched 58% in 1996. The consumption was mainly located in NAFTA
(increasing by 58% since 1980), Asia growing more than fourfold,
and the European Union almost stable since 1980. However, since
1990, coal consumption in the Union was declining due to the
restructuring of coal industries and growing environmental
concerns. It was the only part of the world, except for the CIS for
other reasons, in which this trend was observed. Despite the gro-
wing consumption of developing regions, the OECD region still
represents 54% of solid fuels consumption for power generation.
Oil use has declined slowly since 1985. Consequently its market
share was only 13% in 1996 against 19% in 1985 and 27% in 1980.
The utilisation of gas has more than doubled since 1980 as power
generation technologies have evolved to favour natural gas use.
The main gas consumers are respectively: CIS (221 Mtoe or 38% of
world gas consumption for power generation), NAFTA (130 Mtoe)
and the European Union (64 Mtoe). Almost all regions of the
world were showing increases in the use of natural gas to genera-
te electricity.
WORLD
1999 Annual Energy Review 29
PART I
financial investments. Consequently, the near-term power pros-
pects for Malaysia, Thailand, Indonesia, South Korea and the
Philippines have been affected;
• European electricity markets are becoming increasingly integra-
ted. From the perspective of the future liberalisation of electrici-
ty markets, the European Parliament adopted a directive whose
intent was to provide independent producers with greater
access to other countries’ power networks. At the same time, the
United Kingdom has become the largest target of foreign direct
investment in electricity and, consequently, a substantial portion
of the United Kingdom electricity industry is owned by US com-
panies. Integration of national electricity industries has progres-
sed furthest in the Scandinavian countries. Sweden and Norway
operated a joint electricity pool and Finland is scheduled to join
the pool in early 1998;
• The pace of foreign investment in developing nations’ electricity
sectors hinged strongly on the implementation of electricity
reform and the application of transparent and consistent regu-
latory and investment policies. Economic growth in several
developing countries was restrained by a shortage of electricity
capacity. Facilitating the contract negotiation phase of electric
power developments will be crucial to the successful realisation
of their full economic growth potential.
Power production remained largely dominated by thermal produc-
tion even though its share declined slowly…
Thermal production continued largely to dominate total electrici-
ty generation, although its share decreased from 70% in 1980 to
64% in 1996. Nuclear’s share doubled from 9% in 1980 to 18% in
1996. This growth occurred principally during the 1980's. After
1990, the increase in nuclear production has slowed down consi-
derably due to lack of investment mainly in Western Europe and
North America, increases being mainly located in Asia (+50%) and
0%
10%
20%
30%
40%
50%
60%
70%
80%
90%
100%
Thermal
Hydro & Wind
Nuclear
19961995199019851980
Electricity Production by Main Source in %
0
500
1000
1500
2000
2500
Other
Geothermal
Gas
Oil
Solids
19961995199019851980
Inputs for Thermal Power Generation
Mtoe
WORLD
1999 Annual Energy Review30
PART I
Refinery capacities have increased only in non-OECD region since
1985…
The refinery capacities increased slowly by 0.7% per year on ave-
rage since 1985 but in fact they remained relatively stable bet-
ween 1985 and 1992, and increased by 1.4% per year on average
since then. In the OECD region, in-depth restructuring led to a sta-
bilisation of installed capacity since 1985 but the capacity utilisa-
tion rate increased regularly from 72% in 1985 to 94% in 1997.
This has increased profitability of the refinery sector and enabled
further costly investment in conversion units to adapt production
to changing oil product demand and to provide cleaner fuels. In
the non-OECD region refinery capacity grew by about 20% since
1985, the main investment being located in the Middle East
(+52%) to increase the value-added of crude production, China
(+100%) driven by buoyant internal demand, and Southeast Asia.
At the same time, the utilisation rate in the non-OECD region fell
from 80% in 1985 to only 74% in 1997 with very contrasted expe-
rience by region. Although capacities were quite saturated in the
Middle East and Asia, on the other hand utilisation rates remained
too low in Latin America to ensure profitability and an urgent
restructuring was needed in the CIS where utilisation rates fell
below 45%.
COMPETITIVENESS
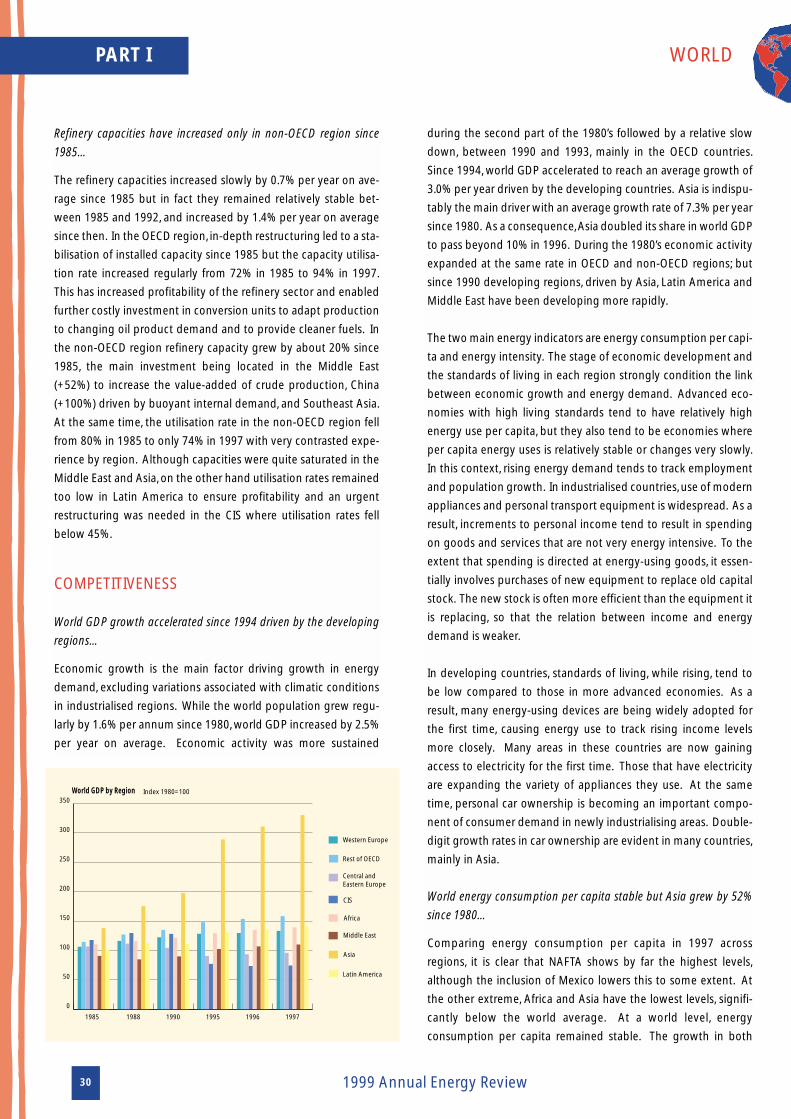
World GDP growth accelerated since 1994 driven by the developing
regions…
Economic growth is the main factor driving growth in energy
demand, excluding variations associated with climatic conditions
in industrialised regions. While the world population grew regu-
larly by 1.6% per annum since 1980, world GDP increased by 2.5%
per year on average. Economic activity was more sustained
during the second part of the 1980’s followed by a relative slow
down, between 1990 and 1993, mainly in the OECD countries.
Since 1994, world GDP accelerated to reach an average growth of
3.0% per year driven by the developing countries. Asia is indispu-
tably the main driver with an average growth rate of 7.3% per year
since 1980. As a consequence, Asia doubled its share in world GDP
to pass beyond 10% in 1996. During the 1980’s economic activity
expanded at the same rate in OECD and non-OECD regions; but
since 1990 developing regions, driven by Asia, Latin America and
Middle East have been developing more rapidly.
The two main energy indicators are energy consumption per capi-
ta and energy intensity. The stage of economic development and
the standards of living in each region strongly condition the link
between economic growth and energy demand. Advanced eco-
nomies with high living standards tend to have relatively high
energy use per capita, but they also tend to be economies where
per capita energy uses is relatively stable or changes very slowly.
In this context, rising energy demand tends to track employment
and population growth. In industrialised countries, use of modern
appliances and personal transport equipment is widespread. As a
result, increments to personal income tend to result in spending
on goods and services that are not very energy intensive. To the
extent that spending is directed at energy-using goods, it essen-
tially involves purchases of new equipment to replace old capital
stock. The new stock is often more efficient than the equipment it
is replacing, so that the relation between income and energy
demand is weaker.
In developing countries, standards of living, while rising, tend to
be low compared to those in more advanced economies. As a
result, many energy-using devices are being widely adopted for
the first time, causing energy use to track rising income levels
more closely. Many areas in these countries are now gaining
access to electricity for the first time. Those that have electricity
are expanding the variety of appliances they use. At the same
time, personal car ownership is becoming an important compo-
nent of consumer demand in newly industrialising areas. Double-
digit growth rates in car ownership are evident in many countries,
mainly in Asia.
World energy consumption per capita stable but Asia grew by 52%
since 1980…
Comparing energy consumption per capita in 1997 across
regions, it is clear that NAFTA shows by far the highest levels,
although the inclusion of Mexico lowers this to some extent. At
the other extreme, Africa and Asia have the lowest levels, signifi-
cantly below the world average. At a world level, energy
consumption per capita remained stable. The growth in both
0
50
100
150
200
250
300
350
Latin America
Asia
Middle East
Africa
CIS
Central and Eastern Europe
Rest of OECD
Western Europe
199719961995199019881985
World GDP by Region Index 1980=100

WORLD
1999 Annual Energy Review 31
PART I
developing regions (mainly located in Asia and the Middle East)
and the OECD region (mainly the OECD Pacific region) was com-
pensated since 1988 by the slowdown in CIS (-36%) and CEEC
(-23%). To appreciate future trends it must be stressed that Asia,
which represented more than 50% of the world population in
1997, has seen its consumption per capita grow by 52% since
1980.
World energy intensity improved on average by 0.9% per year since
1980...
Total world energy intensity showed a slight but continuous
downward trend by 0.9% a year since 1980; but the improvement
was limited to 0.8% annually since 1990, and stabilised between
1994 and 1996. In 1997, world energy intensity improved by 2.1%
with significant contributions from major parts of the world. The
Thousand 1990 MEUR / inhabitant 1980 1985 1988 1990 1995 1996 1997 85/80 90/85 95/90 96/95 97/96
Annual % Change
World 2.94 3.01 3.17 3.24 3.29 3.35 3.41 0.5% 1.5% -0.2% 1.8% 1.9%Western Europe 12.25 12.98 14.17 14.87 15.57 15.79 16.16 1.2% 2.8% -1.0% 1.4% 2.3%
European Union 11.99 12.69 13.89 14.58 15.27 15.48 15.85 1.1% 2.8% -1.1% 1.4% 2.4%EFTA 20.73 22.39 23.25 24.36 24.99 25.42 25.97 1.6% 1.7% 0.0% 1.7% 2.2%
Rest of OECD 11.51 12.42 13.30 13.80 14.35 14.72 15.06 1.5% 2.1% 0.8% 2.6% 2.3%NAFTA 12.18 12.94 13.67 13.93 14.47 14.80 15.27 1.2% 1.5% 1.2% 2.3% 3.2%OECD Pacific 13.18 14.97 16.65 18.05 19.10 19.77 19.90 2.6% 3.8% 0.3% 3.5% 0.7%
Central and Eastern Europe 1.85 1.92 1.98 1.84 1.61 1.67 1.72 0.7% -0.7% -5.5% 3.6% 2.9%CIS (1) 2.12 2.38 2.56 2.49 1.48 1.42 1.43 2.4% 0.9% -10.5% -4.4% 1.0%Africa 0.71 0.68 0.65 0.65 0.61 0.62 0.62 -0.9% -0.9% -1.8% 1.8% 0.5%Middle East 4.08 3.09 2.62 2.60 2.54 2.58 2.59 -5.4% -3.4% 0.5% 1.7% 0.3%Asia 0.27 0.34 0.41 0.45 0.61 0.64 0.67 4.7% 5.5% 6.2% 6.0% 4.7%Latin America 2.16 1.97 2.07 1.97 2.14 2.17 2.23 -1.8% -0.1% 2.7% 1.5% 2.9%
(1) Including Baltic countries for statistical reasons
GROSS DOMESTIC PRODUCT PER CAPITA : TOTAL BY REGION
toe/inhabitant 1980 1985 1988 1990 1995 1996 1997 85/80 90/85 95/90 96/95 97/96
Annual % Change
World 1.63 1.60 1.67 1.64 1.60 1.63 1.63 -0.3% 0.4% -0.5% 1.8% -0.3%Western Europe 3.51 3.48 3.59 3.63 3.68 3.80 3.78 -0.2% 0.8% -0.4% 3.2% -0.5%
European Union 3.50 3.46 3.57 3.61 3.66 3.78 3.76 -0.2% 0.8% -0.5% 3.3% -0.6%EFTA 3.85 4.13 4.16 4.30 4.34 4.38 4.48 1.4% 0.8% 1.2% 0.9% 2.2%
Rest of OECD 5.15 4.87 5.11 5.09 5.27 5.36 5.38 -1.1% 0.9% 1.1% 1.7% 0.4%NAFTA 6.59 6.15 6.43 6.27 6.40 6.48 6.51 -1.4% 0.4% 1.0% 1.2% 0.4%OECD Pacific 3.20 3.24 3.47 3.75 4.12 4.25 4.27 0.2% 3.0% 1.2% 3.0% 0.5%
Central and Eastern Europe 3.01 3.07 3.12 2.72 2.30 2.42 2.39 0.4% -2.4% -0.9% 5.2% -0.9%CIS (1) 4.26 4.58 4.87 4.66 3.27 3.20 3.12 1.5% 0.4% -8.5% -2.3% -2.3%Africa 0.56 0.60 0.61 0.59 0.58 0.57 0.57 1.4% -0.3% -2.2% -1.4% 0.4%Middle East 1.45 1.74 1.88 1.83 1.95 2.03 2.07 3.7% 1.0% 3.6% 4.2% 1.5%Asia 0.50 0.54 0.60 0.62 0.72 0.75 0.76 1.8% 2.7% 3.8% 3.9% 1.1%Latin America 1.00 0.94 0.99 0.96 1.04 1.09 1.10 -1.1% 0.4% 0.3% 4.1% 1.1%
(1) Including Baltic countries for statistical reasons
GROSS INLAND ENERGY CONSUMPTION PER CAPITA : TOTAL BY REGION
OECD regions, which had by far the lowest energy intensity,
improved their performance by 1.8% per year on average during
the 1980s. But the gains have remained marginal since the begin-
ning of the 1990's, reaching only 0.4% per year on average. Inside
the OECD the best performances were achieved by NAFTA and
the European Union whilst energy intensity increased in the OECD
Pacific region since 1990. It must be stressed that in the indus-
trialised countries, major improvements of energy intensity were
in all cases associated with sustained economic growth. On the
other hand, the non-OECD part of the world was characterised by
a stabilisation of its energy intensity during the 1980s, followed by
a sustained reduction since then (-1.8% per annum on average
since 1990). This is despite the marked increase in the CIS (+2.2%
per year) and the Middle East (+1.8% per year). It must be stressed
that Asia demonstrated the best improvement since 1980, at
about 2.8% per year and intensity was falling regularly. In the case

WORLD
1999 Annual Energy Review32
PART I
of the Middle East, gross domestic product is directly dependent
on oil market revenues. Fluctuations in export volumes and oil
prices induced a GDP growth of only 10% since 1980. As a result,
observed increases in energy intensity resulted in fact from this
particular evolution of GDP, which does not reflect less efficient
use of energy by final consumers. In 1997, energy intensity was
three times higher in the non-OECD region than in the OECD
region, excluding the CIS and CEEC where energy intensity rea-
ched five times the OECD level.
Looking at energy intensity by sector at the world level, it must be
stressed that improvements occurred in all final sectors but at dif-
ferent rates. The major improvement was observed in industry
with a reduction of one third since 1980. The transport sector
slowly but regularly reduced its energy intensity by 0.2% since
1985, demonstrating that the development of improved vehicles
is partly able to offset rapid motorization in developing regions.
Finally the energy intensity of the tertiary-domestic sector, which
improved about 1% per year on average during the 1980s, has
remained stable since then. This is the result of a contrasted evo-
lution: a relative stability in the OECD, slow decline - less than
10% - in CEEC and Middle East, slow increase - less than 10% - in
Latin America and Africa, a marked fall in Asia (-28%) and an incre-
dible increase in CIS where energy consumption in the tertiary-
domestic sector grew slowly to cover basic needs while GDP decli-
ned by 42% since 1990.-10%
-8%
-6%
-4%
-2%
0%
2%
4%
97/95
95/90
90/85
85/80
Lati
n A
mer
ica
Asi
a
Mid
dle
Eas
t
Afr
ica
CIS
Cen
tral
an
d
East
ern
Eu
rop
e
Rest
of O
ECD
Wes
tern
Eu
rop
e
Annual Average Rates of Improvement in Energy Intensity
toe/1990 MEUR 1980 1985 1988 1990 1994 1995 1996 1997 85/80 90/85 95/90 96/95 97/96
Annual % Change
World 553 532 525 505 489 488 488 477 -0.8% -1.0% -0.3% 0.0% -2.1%Western Europe 286 268 253 244 237 237 241 234 -1.3% -1.9% 0.6% 1.8% -2.8%
European Union 291 272 257 247 240 240 244 237 -1.3% -1.9% 0.6% 1.9% -2.9%EFTA 186 184 179 177 178 174 172 172 -0.1% -0.9% 1.2% -0.8% 0.0%
Rest of OECD 447 392 385 369 369 368 364 357 -2.6% -1.2% 0.3% -0.9% -1.8%NAFTA 541 476 471 450 447 443 438 426 -2.6% -1.1% -0.2% -1.1% -2.7%OECD Pacific 242 216 208 208 214 216 215 214 -2.3% -0.8% 0.9% -0.4% -0.2%Mediterranean 440 430 433 444 439 449 456 447 -0.4% 0.6% -2.2% 1.6% -2.0%
Central and Eastern Europe 1630 1600 1573 1472 1444 1424 1446 1392 -0.4% -1.7% 4.9% 1.6% -3.7%CIS (1) 2010 1921 1903 1869 2157 2205 2254 2180 -0.9% -0.5% 2.2% 2.3% -3.3%Africa 790 883 936 909 960 957 927 926 2.3% 0.6% -0.4% -3.2% -0.1%Middle East 356 563 719 704 764 769 788 797 9.6% 4.6% 3.1% 2.5% 1.2%Asia 1813 1578 1441 1382 1221 1188 1164 1124 -2.7% -2.6% -2.3% -2.0% -3.5%Latin America 462 478 476 490 477 489 502 493 0.7% 0.5% -2.3% 2.5% -1.8%
(1) Including Baltic countries for statistical reasons
ENERGY INTENSITY : TOTAL BY REGION
90
92
94
96
98
100
102
104
106
108
110
CO per unit of GDP (tn of CO /1990 MECU)
CO per Capita (tn of CO /inhabitant)
Carbon Intensity (tn of CO /toe)
CO Emissions (Mt of CO )
1997
1996
1995
1994
1993
1992
1991
1990
1989
1988
1987
1986
1985
CO Indicators 2
2
2
2
2
2
2
2
(1990 = 100)

WORLD
1999 Annual Energy Review 33
PART I
ENVIRONMENT
World emissions grew by 8% since 1990…
CO2 emission indicators are of prime importance in the post-
Kyoto debate as the Kyoto Protocol adopted on 11 December
1997 may signal a significant change in the level of effort among
industrialised countries to reduce greenhouse gas emissions. The
agreed objectives, if realised, will markedly reduce or change ener-
gy use among the signatory participants. Substantial shifts in the
composition of energy supply away from high-carbon fuels, sub-
stantial reductions in energy intensity, or some combination of
both, will have to be achieved in developed countries.
CO2 emissions are given on an indicative basis, being calculated
using common emission factors by energy aggregates across all
countries in the world. Worldwide emissions of CO2 increased
steadily by 1.3% per year during the 1980’s and by 1.1% per year
since then, leading to a global increase by 8% in 1997 compared
to the 1990 level. Since 1990, CO2 emissions have been increasing
in almost all regions in the world, in some cases by more than 5%
per year (Asia and the Middle East), with the exception of former
Centrally Planned Economies due to the drastic reduction of ener-
gy consumption observed, mainly in the CIS, since 1990. The
European Union stabilised its emissions, benefiting from energy
efficiency improvements as the climatic conditions of 1990 and
1997 were similar. Inside the OECD region the European Union
was by far the best performer as CO2 emissions increased by 11%
in the NAFTA region, 12% in the OECD Pacific region and 13% in
EFTA since 1990. At the same time, CO2 emissions per capita sho-
wed a reduction of 0.4% a year on average since 1990 (3.8 tons of
CO2 per capita in 1997 compared to 4.0 in 1980). Carbon intensi-
ty (tn of CO2 emitted per toe of energy consumed) declined regu-
larly over the whole period, the main improvements being obser-
ved in industry (-18% since 1990) and the tertiary-domestic sector
(-15%). Both were benefiting from the increasing contribution of
electricity and the substitution of high CO2 content energy fuels
by natural gas.
Mt of CO2 1980 1985 1988 1990 1995 1996 1997(3) 85/80 90/85 95/90 96/95 97/96
Annual % Change
World 18099 18699 20350 20656 21432 22161 22312 0.7% 2.0% 0.7% 3.4% 0.7%Western Europe 3504 3156 3207 3262 3236 3331 3261 -2.1% 0.7% -0.2% 2.9% -2.1%
European Union 3431 3081 3131 3184 3153 3244 3174 -2.1% 0.7% -0.2% 2.9% -2.1%EFTA 73 75 76 77 83 87 87 0.5% 0.6% 1.5% 4.9% -0.2%
Rest of OECD 6598 6536 7025 7138 7630 7872 7973 -0.2% 1.8% 1.3% 3.2% 1.3%NAFTA 5455 5359 5745 5746 6093 6280 6375 -0.4% 1.4% 1.2% 3.1% 1.5%OECD Pacific 1074 1086 1175 1268 1387 1426 1423 0.2% 3.2% 1.8% 2.8% -0.2%Mediterranean 69 91 105 123 151 166 175 5.7% 6.3% 4.1% 10.3% 5.6%
Central and Eastern Europe 1060 1095 1094 957 776 805 787 0.7% -2.7% -4.1% 3.7% -2.2%CIS (2) 3267 3395 3641 3553 2318 2255 2213 0.8% 0.9% -8.2% -2.7% -1.9%Africa 431 504 547 566 624 634 653 3.2% 2.3% 2.0% 1.6% 3.0%Middle East 387 546 639 658 860 909 947 7.1% 3.8% 5.5% 5.8% 4.1%Asia 2288 2913 3579 3906 5237 5569 5672 5.0% 6.0% 6.0% 6.3% 1.8%Latin America 565 554 619 616 750 786 806 -0.4% 2.2% 4.0% 4.8% 2.6%
of which (%)European Union 19.0 16.5 15.4 15.4 14.7 14.6 14.2 -2.8% -1.3% -0.9% -0.5% -2.8%OECD 55.4 51.3 49.8 49.7 50.0 49.8 49.6 -1.5% -0.6% 0.1% -0.4% -0.5%
(1) in this table emissions from each region include those resulting from bunker fuels(2) Including Baltic countries for statistical reasons(3) estimated values for non-OECD regions
CO2 EMISSIONS (1) : TOTAL BY REGION
0%
5%
10%
15%
20%
25%
30%
35%
Transport
Tertiary-Domestic
Industry
Electricity production
Other
19961995199019851980
CO Emissions by Sector2

WORLD
1999 Annual Energy Review34
PART I
The contribution of CO2 emissions from power generation increased
from 28% in 1980 to 34% in 1997…
Looking at worldwide CO2 emissions by sector, the first conclu-
sion is that the power generation sector remained by far the lar-
gest sector in terms of emissions. CO2 emissions from the power
sector grew by 2.4% on average since 1980, with a relative slow-
down since 1990, to represent about 34% of total world emissions
in 1997. This is a consequence of rapid electrification in develo-
ping regions, a trend which will continue in the near future. The
growing share of solid fuels for thermal power generation accen-
tuated this trend. Within the final demand sectors, CO2 emissions
from transport have increased since 1980 at an average growth
rate of 1.5% despite a relative stability between 1990 and 1994
resulting from the particular situation in CIS and CEEC. Their share
at the level of final energy consumption increased from 30% in
1980 to 36% in 1996. The domestic and tertiary sectors showed a
limited upward trend (+0.8% per year since 1980, excluding any
correction for climatic conditions) due to the penetration of natu-
ral gas and distributed heat in heating markets in place of heating
oil and solids. Industry presented the greatest fall in CO2 emis-
sions between 1980 and 1996 (-1.1% per year) but a marked rever-
se trend appeared since 1992 (+1.8% per year on average over the
last four years) in parallel with the increasing energy consumption
of this sector.
Mt of CO2 1980 1985 1990 1995 1996 1997 85/80 90/85 95/90 95/94 96/95 96/90
Annual % Change
Total 18075 18676 20603 21361 22126 22158 0,7% 2,0% 0,7% 1,9% 3,6% 1,2%
Bunkers 314 270 312 322 366 na -3,0% 2,9% 0,7% 2,3% 13,4% 2,7%
Transformation 6307 7473 8475 9250 9694 na 3,5% 2,5% 1,8% 1,2% 4,8% 2,3%Power Generation 5075 5527 6451 7149 7472 na 1,7% 3,1% 2,1% 2,0% 4,5% 2,5%Energy sector 1232 1947 2024 2101 2222 na 9,6% 0,8% 0,8% -1,4% 5,8% 1,6%
Final Demand sectors 11454 10932 11817 11788 12067 na -0,9% 1,6% 0,0% 2,4% 2,4% 0,3%Industry 4665 3979 4171 3863 3911 na -3,1% 0,9% -1,5% 2,2% 1,2% -1,1%Transport 3472 3681 4070 4292 4408 na 1,2% 2,0% 1,1% 3,8% 2,7% 1,3%Domestic and Tertiary 3317 3272 3576 3633 3748 na -0,3% 1,8% 0,3% 1,1% 3,2% 0,8%
WORLD : CO2 Emissions by sector
Mtoe 1980 1985 1988 1990 1995 1996 1997 85/80 90/85 95/90 96/95 97/96
Annual % Change
Western Europe 671.9 487.9 519.4 563.4 508.3 512.3 519.1 -6.2% 2.9% -2.0% 0.8% 1.3%European Union 688.4 526.3 578.2 643.7 651.3 678.8 690.7 -5.2% 4.1% 0.2% 4.2% 1.8%EFTA -21.4 -38.5 -58.9 -80.4 -142.9 -166.6 -171.6 12.4% 15.9% 12.2% 16.5% 3.0%
Rest of OECD 565.9 343.2 481.6 550.0 605.6 645.7 675.0 -9.5% 9.9% 1.9% 6.6% 4.5%NAFTA 246.0 68.9 185.1 215.4 249.4 274.3 307.4 -22.5% 25.6% 3.0% 10.0% 12.1%OECD Pacific 305.7 257.1 272.8 306.8 318.9 330.0 324.3 -3.4% 3.6% 0.8% 3.5% -1.7%
Central and Eastern Europe 71.5 66.9 76.5 77.6 57.8 68.5 65.0 -1.3% 3.0% -5.7% 18.4% -5.1%CIS (1) -212.2 -219.2 -272.9 -260.0 -244.5 -276.6 -256.6 0.6% 3.5% -1.2% 13.1% -7.2%Africa -260.6 -241.7 -245.8 -295.8 -310.8 -328.4 -366.1 -1.5% 4.1% 1.0% 5.7% 11.5%Middle East -854.8 -394.6 -593.6 -701.3 -796.7 -798.9 -853.9 -14.3% 12.2% 2.6% 0.3% 6.9%Asia 19.5 0.9 54.8 85.4 213.5 252.7 283.6 -45.9% 148.2% 20.1% 18.4% 12.2%Latin America -22.6 -38.8 -42.7 -51.7 -103.7 -103.5 -132.8 11.4% 5.9% 14.9% -0.2% 28.4%
of which (%)OECD 1237.8 831.1 1001.0 1113.3 1114.0 1158.0 1194.1 -7.7% 6.0% 0.0% 4.0% 3.1%
(1) Including Baltic countries for statistical reasons
NET ENERGY IMPORT : TOTAL BY REGION

WORLD
1999 Annual Energy Review 35
PART I
-1000
-800
-600
-400
-200
0
200
400
600
800
1997
1990
1980
Lati
n A
mer
ica
Asi
a
Mid
dle
Eas
t
Afr
ica
OEC
D P
acifi
c
NA
FTA
CIS
Cen
tral
an
d
East
ern
Eu
rop
e
EFT
A
Eu
rop
ean
U
nio
n
Net Energy Imports by Region
Mtoe
GLOBAL MARKETS
The OECD absorbed about 80% of world interregional exchanges of
energy…
The world energy trade between the main regions considered in
this study (net energy imports) shows that the European Union is
by far the largest net importer with a steady annual growth of
2.3% since 1985, achieving a 1997 level comparable to 1980.
OECD Pacific is the second ranking with a relatively stable level
since 1980, except for the drop observed in mid-1980’s. NAFTA is
also an important importer with a similar profile to that of the
European Union, although with a faster growth rate between
1985 and 1997 (+13% per year). As a consequence of these trends,
the OECD absorbed about 80% of world net energy exchanges in
1997. Amongst the non-OECD regions, although Central and
Eastern Europe stabilised their level of imports at about 65 Mtoe,
mainly oil and gas from CIS, Asia was continuously increasing its
imports starting from a negligible level in 1980 to reach 284 Mtoe
in 1997, a level comparable with NAFTA. The net exporters remai-
ned the Middle East (854 Mtoe in 1997), Africa (366 Mtoe), CIS (257
Mtoe) and EFTA (172 Mtoe), all four mainly exporters of hydrocar-
bons. Oil, both crude and oil products, accounted for 81% of inter-
regional energy exchanges in 1997, natural gas for 11% and solids
for 8%. Although OPEC continued to dominate the oil market, it
must be stressed that Russia accounted for 40% of the trade in
natural gas in 1997. Finally interregional exchanges of energy
represented in 1997 only 19.5% of total world energy consump-
tion, about the same level as in 1980.

WORLD
1999 Annual Energy Review36
PART I
Mtoe 1980 1985 1990 1995 1996 1997(3) 85/80 90/85 95/90 96/95 97/96
Annual % Change
Primary Production 7352 7768 8776 9213 9467 9646 1.1% 2.5% 1.0% 2.8% 1.9%Solids 1806 2024 2190 2210 2250 2271 2.3% 1.6% 0.2% 1.8% 1.0%Oil 3161 2862 3219 3344 3416 3556 -2.0% 2.4% 0.8% 2.2% 4.1%Natural gas 1243 1432 1707 1809 1899 1903 2.9% 3.6% 1.2% 5.0% 0.2%Nuclear 187 387 519 598 618 613 15.6% 6.0% 2.9% 3.2% -0.7%Hydro & Wind 150 171 186 216 219 219 2.7% 1.7% 3.0% 1.6% 0.2%Geothermal 12 20 32 34 36 36 11.1% 9.7% 1.4% 6.0% -1.1%Other renewable energy sources 793 871 923 1002 1028 1047 1.9% 1.2% 1.7% 2.6% 1.8%
Net Imports(1) -11 20 -13 -62 -16 -53 - - 35.8% -74.2% 232.2%Solids 2 3 -1 -12 -8 2 4.6% - 60.3% -29.7% -Oil -11 22 -9 -44 -5 -47 - - 38.0% -88.9% 850.7%
Crude oil 22 71 51 25 59 na 26.4% -6.4% -13.6% 140.8% na Oil products -33 -49 -60 -69 -64 na 7.9% 4.2% 2.7% -6.6% na
Natural gas -2 -5 -4 -6 -3 -9 13.9% -4.1% 8.9% -48.1% 197.1%Electricity 0 0 0 0 0 1 - - - - 417.8%
Gross Inland Consumption 7164 7700 8568 9051 9341 9447 1.5% 2.2% 1.1% 3.2% 1.1%Solids 1789 2027 2162 2203 2259 2270 2.5% 1.3% 0.4% 2.5% 0.5%Oil 2995 2798 3072 3199 3289 3373 -1.4% 1.9% 0.8% 2.8% 2.5%Natural gas 1239 1426 1675 1797 1891 1889 2.8% 3.3% 1.4% 5.2% -0.1%Other (2) 1141 1449 1660 1851 1901 1916 4.9% 2.7% 2.2% 2.7% 0.8%
Electricity Generation in Twh 8308 9815 11830 13244 13666 na 3.4% 3.8% 2.3% 3.2% naNuclear 713 1492 2013 2332 2418 na 15.9% 6.2% 3.0% 3.7% naHydro & wind 1747 2004 2177 2519 2559 na 2.8% 1.7% 3.0% 1.6% naThermal 5847 6318 7640 8393 8689 na 1.6% 3.9% 1.9% 3.5% na
Generation Capacity in GWe 1973 2426 2757 3069 3134 na 4.2% 2.6% 2.2% 2.1% naNuclear 142 253 330 349 354 na 12.2% 5.5% 1.1% 1.5% naHydro & wind 466 564 647 720 733 na 3.9% 2.8% 2.2% 1.8% naThermal 1365 1610 1781 2000 2046 na 3.4% 2.0% 2.3% 2.3% na
Average Load Factor in % 48.1 46.2 49.0 49.3 49.8 na -0.8% 1.2% 0.1% 1.0% na
Fuel Inputs for Thermal Power Generation 1557 1695 2030 2259 2345 na 1.7% 3.7% 2.2% 3.8% naSolids 838 984 1147 1291 1356 na 3.3% 3.1% 2.4% 5.1% naOil 426 327 322 308 302 na -5.2% -0.3% -0.9% -1.9% naGas 272 353 477 565 587 na 5.3% 6.2% 3.5% 3.9% naGeothermal 11 19 31 33 35 na 11.3% 9.7% 1.3% 6.1% naBiomass 9 12 54 62 65 na 5.7% 34.2% 2.8% 4.5% na
Average Thermal Efficiency in % 32.3 32.1 32.4 32.0 31.9 na -0.2% 0.2% -0.3% -0.3% na
Non-Energy Uses 340 353 427 467 488 na 0.8% 3.9% 1.8% 4.5% na
Total Final Energy Demand 5127 5394 5842 6131 6309 na 1.0% 1.6% 1.0% 2.9% naSolids 780 843 840 732 728 na 1.6% -0.1% -2.7% -0.5% naOil 2054 1993 2183 2286 2352 na -0.6% 1.8% 0.9% 2.9% naGas 804 846 938 967 1026 na 1.0% 2.1% 0.6% 6.1% naElectricity 586 693 830 934 967 na 3.4% 3.7% 2.4% 3.5% naHeat 120 161 178 270 273 na 6.1% 2.1% 8.7% 1.1% naRenewable energy sources 783 859 872 942 963 na 1.9% 0.3% 1.6% 2.2% na
CO2 Emissions in Mt of CO2 17761 18406 20291 21038 21761 21907 0.7% 2.0% 0.7% 3.4% 0.7%
IndicatorsPopulation (Million) 4409 4801 5232 5640 5720 5801 1.7% 1.7% 1.5% 1.4% 1.4%GDP (index 1985=100) 89.6 100.0 117.2 128.3 132.4 136.7 2.2% 3.2% 1.8% 3.2% 3.3%Gross Inl Cons./GDP (toe/1985 MEUR) 552.8 532.1 505.3 487.6 487.5 477.4 -0.8% -1.0% -0.7% 0.0% -2.1%Gross Inl Cons./Capita (toe/inhabitant) 1.62 1.60 1.64 1.60 1.63 1.63 -0.3% 0.4% -0.4% 1.8% -0.3%Electricity Generated/Capita (kWh/inhabitant) 1884 2044 2261 2348 2389 na 1.6% 2.0% 0.8% 1.8% naCO2 Emissions/Capita (t of CO2/inhabitant) 4.03 3.83 3.88 3.73 3.80 3.78 -1.0% 0.2% -0.8% 2.0% -0.7%
(1) corresponds to statistical errors(2) Includes nuclear, hydro and wind, net imports of electricity, and other energy sources.(3) Estimates
WORLD : SUMMARY ENERGY BALANCE

WORLD
1999 Annual Energy Review 37
PART I
1980 1985 1990 1995 1996 1997 85/80 90/85 95/90 96/95 97/96
Annual % Change
Gross Inland Consumption (Mtoe) 7164.2 7700.3 8568.5 9051.1 9341.0 9447.4 1.5% 2.2% 1.1% 3.2% 1.1%Power Generation 1534.4 1824.3 2182.6 2429.6 2524.8 na 3.5% 3.7% 2.2% 3.9% naEnergy Branch 399.0 458.1 538.2 530.2 561.3 na 2.8% 3.3% -0.3% 5.9% naFinal Energy Consumption 5097.7 5355.9 5797.6 6073.7 6251.7 na 1.0% 1.6% 0.9% 2.9% na
Industry 1919.4 1907.6 1983.2 1937.3 1969.3 na -0.1% 0.8% -0.5% 1.7% naTransport 1132.2 1211.4 1408.3 1526.6 1572.9 na 1.4% 3.1% 1.6% 3.0% naTertiary-Domestic 2045.3 2236.8 2406.1 2609.9 2709.5 na 1.8% 1.5% 1.6% 3.8% na
Energy Intensity (toe/1990 MEUR) 552.8 532.1 505.3 487.6 487.5 477.4 -0.8% -1.0% -0.7% 0.0% -2.1%Power Generation 118.4 126.1 128.7 130.9 131.8 na 1.3% 0.4% 0.3% 0.7% naFinal Energy Consumption 393.3 370.1 341.9 327.2 326.3 na -1.2% -1.6% -0.9% -0.3% na
Industry 148.1 131.8 117.0 104.4 102.8 na -2.3% -2.4% -2.3% -1.5% naTransport 87.4 83.7 83.0 82.2 82.1 na -0.9% -0.2% -0.2% -0.2% naTertiary-Domestic 157.8 154.6 141.9 140.6 141.4 na -0.4% -1.7% -0.2% 0.6% na
Energy per capita (Kgoe/inhabitant) 1625 1604 1638 1605 1633 1629 -0.3% 0.4% -0.4% 1.8% -0.3%Power Generation 348 380 417 431 441 na 1.8% 1.9% 0.6% 2.5% naFinal Energy Consumption 1156 1115 1108 1077 1093 na -0.7% -0.1% -0.6% 1.5% na
Industry 435 397 379 343 344 na -1.8% -0.9% -2.0% 0.2% naTransport 257 252 269 271 275 na -0.4% 1.3% 0.1% 1.6% naTertiary-Domestic 464 466 460 463 474 na 0.1% -0.3% 0.1% 2.4% na
Electricity Share (%)Final Energy Consumption 11.5% 12.9% 14.3% 15.4% 15.5% na 2.4% 2.1% 1.4% 0.6% naIndustry 15.5% 17.5% 19.4% 20.7% 21.0% na 2.4% 2.1% 1.3% 1.1% naTransport 1.2% 1.3% 1.3% 1.2% 1.2% na 1.1% -0.5% -0.7% -2.0% naTertiary-Domestic 13.4% 15.3% 17.8% 19.7% 19.8% na 2.7% 3.0% 2.1% 0.4% na
Total Renewable consumption (Mtoe) 954.1 1062.6 1140.5 1252.5 1283.3 na 2.2% 1.4% 1.9% 2.5% naHydro 149.6 171.0 185.5 214.2 217.4 na 2.7% 1.6% 2.9% 1.5% naBiomass 792.6 871.1 922.1 1002.4 1027.7 na 1.9% 1.1% 1.7% 2.5% naOther renewable energy source 11.9 20.5 32.9 35.9 38.2 na 11.5% 9.9% 1.7% 6.5% na
Renewable Intensity (toe/1990 MEUR) 73.6 73.4 67.3 67.5 67.0 na -0.1% -1.7% 0.1% -0.7% naRenewable per capita (kgoe/inhabitant) 216.4 221.3 218.0 222.0 224.4 na 0.4% -0.3% 0.4% 1.0% na
CO2 Emissions (Mt of CO2) 17761 18406 20291 21038 21761 21907 0.7% 2.0% 0.7% 3.4% 0.7%Power Generation 5075 5527 6451 7149 7472 na 1.7% 3.1% 2.1% 4.5% naEnergy Branch 897 900 1051 1031 1105 na 0.1% 3.1% -0.4% 7.2% naFinal Energy Consumption 11454 10932 11817 11788 12067 na -0.9% 1.6% 0.0% 2.4% na
Industry 4665 3979 4171 3863 3911 na -3.1% 0.9% -1.5% 1.2% naTransport 3472 3681 4070 4292 4408 na 1.2% 2.0% 1.1% 2.7% naTertiary-Domestic 3317 3272 3576 3633 3748 na -0.3% 1.8% 0.3% 3.2% na
Carbon (tn of CO2/toe) 2.5 2.4 2.4 2.3 2.3 2.3 -0.7% -0.2% -0.4% 0.2% -0.5%Power Generation 3.3 3.0 3.0 2.9 3.0 na -1.7% -0.5% -0.1% 0.6% naEnergy Branch 2.2 2.0 2.0 1.9 2.0 na -2.6% -0.1% -0.1% 1.3% naFinal Energy Consumption 2.2 2.0 2.0 1.9 1.9 na -1.9% 0.0% -1.0% -0.6% na
Industry 2.4 2.1 2.1 2.0 2.0 na -3.0% 0.2% -1.1% -0.4% naTransport 3.1 3.0 2.9 2.8 2.8 na -0.2% -1.0% -0.6% -0.3% naTertiary-Domestic 1.6 1.5 1.5 1.4 1.4 na -2.0% 0.3% -1.3% -0.6% na
CO2 per capita (kg of CO2/inhabitant) 4028 3833 3878 3730 3804 3777 -1.0% 0.2% -0.8% 2.0% -0.7%Final Energy Consumption 2598 2277 2258 2090 2110 na -2.6% -0.2% -1.5% 0.9% na
Industry 1058 829 797 685 684 na -4.8% -0.8% -3.0% -0.2% naTransport 787 767 778 761 771 na -0.5% 0.3% -0.4% 1.3% naTertiary-Domestic 752 682 683 644 655 na -2.0% 0.1% -1.2% 1.7% na
CO2 per unit of GDP (tn of CO2/1990 MEUR) 1370 1272 1197 1133 1136 1107 -1.5% -1.2% -1.1% 0.2% -2.5%Power Generation 392 382 380 385 390 na -0.5% -0.1% 0.2% 1.3% naPublic Thermal Power Generation 370 359 357 353 358 na -0.6% -0.1% -0.2% 1.4% naAutoprod. Thermal Power Generation 22 23 23 32 32 na 0.9% 0.4% 6.3% -0.6% naEnergy Branch 69 62 62 56 58 na -2.1% -0.1% -2.2% 3.8% naFinal Energy Consumption 884 755 697 635 630 na -3.1% -1.6% -1.8% -0.8% na
Industry 360 275 246 208 204 na -5.2% -2.2% -3.3% -1.9% naTransport 268 254 240 231 230 na -1.0% -1.2% -0.7% -0.5% naTertiary-Domestic 256 226 211 196 196 na -2.4% -1.4% -1.5% 0.0% na
WORLD : MAIN INDICATORS