Embed Size (px)
Citation preview
Part I Wellhead Protection Plan Wellhead Protection Area Delineation
Drinking Water Supply Management Area Delineation Well and Drinking Water Supply Management Area Vulnerability Assessments
City of Mora, Minnesota SEH No. MORA 109696
July 2012
Part I Wellhead Protection Plan City of Mora, MN
SEH No. MORA 109696
July 2012
I hereby certify that this report was prepared by me or under my direct supervision, and that I am a duly Licensed Professional Geologist under the laws of the State of Minnesota.
Short Elliott Hendrickson Inc. 3535 Vadnais Center Drive Saint Paul, MN 55110 Source Water Solutions, LLC 213 4th St. E, Suite 418 St. Paul, MN 55101
Erik J. Tomlinson, PG, LEED AP
Date: 7/23/2012 Lic. No.: 46739
Reviewed by: Gail Haglund, MDH Date
Distribution List
No. of Copies Sent to
1 Ms. Gail Haglund Minnesota Department of Health Freeman Building 625 Robert St. N. P.O. Box 64975 St. Paul, MN 55164-0975
SEH is a registered trademark of Short Elliott Hendrickson Inc. Part I Wellhead Protection Plan - WHPA and DWSMA Delineations and Vulnerability Assessments City of Mora, Minnesota Page i
Table of Contents
Table of Contents Page
1.0 Public Water Supply Profile .......................................................................................... 1 1.1 Wellhead Protection Manager .............................................................................. 1 1.2 Wellhead Protection Plan Consultant .................................................................... 1
2.0 Introduction ............................................................................................................... 2 2.1 Data Elements .................................................................................................... 2 2.2 Geological Setting ............................................................................................... 5 2.3 Hydrogeologic Setting ......................................................................................... 7
3.0 Delineation of the Wellhead Protection Area ................................................................ 8 3.1 Criteria Used to Delineate the Wellhead Protection Area ......................................... 8 3.2 Method Used to Delineate the Wellhead Protection Area ...................................... 10 3.3 Conjunctive Delineation ..................................................................................... 13 3.4 Results of Model Calibration and Sensitivity Analysis............................................. 11
4.0 Delineation of the Drinking Water Supply Management Area ....................................... 13 5.0 Vulnerability Assessments ......................................................................................... 14
5.1 Assessment of Well Vulnerability ........................................................................ 14 5.2 Vulnerability Assessment for the Drinking Water Supply Management Area ............ 15
6.0 Recommendations .................................................................................................... 15
7.0 Standard of Care ....................................................................................................... 16 8.0 References ............................................................................................................... 16
Table of Contents (Continued)
Part I Wellhead Protection Plan - WHPA and DWSMA Delineations and Vulnerability Assessments City of Mora, Minnesota Page ii
List of Tables
Table 1 – Municipal Well Details Table 2 – Municipal Well Production and Use Table 3 – Local and Regional High Capacity Wells Table 4 – Precipitation Data Table 5 – Groundwater Flow Model Parameters
List of Figures
Figure 1 – Mora Wellhead Protection Area Figure 2 – Mora DWSMA Figure 3 – Surficial Geology Figure 4 – Bedrock Geology Figure 5 – Water Resources Figure 6 – Land Cover Figure 7 – SSURGO Soils Figure 8 – Model Boundary Conditions Figure 9 – Recharge Zones Figure 10 – Layer 1 Hydraulic Conductivity Figure 11 – Layer 2 Hydraulic Conductivity Figure 12 – Modeled Head (2 Meter Contours) Figure 13 – Modeled Head and Pathlines Figure 14 – DWSMA Vulnerability
List of Appendices
Appendix A - MDH Scoping 1 Decision Notice Appendix B - Geologic Cross Sections Appendix C - MDH Water Quality Data Appendix D- Aquifer Test Plan and Pump Test Data Appendix E- Model Files (CD) Appendix F - GIS Files (CD) Appendix G - MDH Well Vulnerability Sheets
July 2012
Part I Wellhead Protection Plan - WHPA and DWSMA Delineations and Vulnerability Assessments City of Mora, Minnesota Page 1
Part I Wellhead Protection Plan
Prepared for the City of Mora, Minnesota
1.0 Public Water Supply Profile The following persons are the contacts for the Mora Wellhead Protection Plan.
1.1 Wellhead Protection Manager Mike Kroon Water Superintendant City of Mora 101 Lake Street South Mora, Minnesota 55051
Telephone: 320.679.1511 Fax: 320.679.3862
1.2 Wellhead Protection Plan Consultant Erik J. Tomlinson, PG Source Water Solutions, LLC 213 4th St. E., Suite 418 St. Paul, MN 55101
Telephone: 612.354.2549 Email: [email protected]
Part I Wellhead Protection Plan - WHPA and DWSMA Delineations and Vulnerability Assessments City of Mora, Minnesota Page 2
2.0 Introduction
This Part I Wellhead Protection Plan (WHPP) presents the technical discussion of the delineation of the Wellhead Protection Area (WHPA) and Drinking Water Supply Management Area (DWSMA) and the assessments of well and DWSMA vulnerability. This work was performed by Source Water Solutions, LLC and Short Elliott Hendrickson, Inc. (SEH) at the request of the City of Mora (the City) and meets WHP planning requirements that are specified in Minnesota Rules 4720.5100-4720.5590.
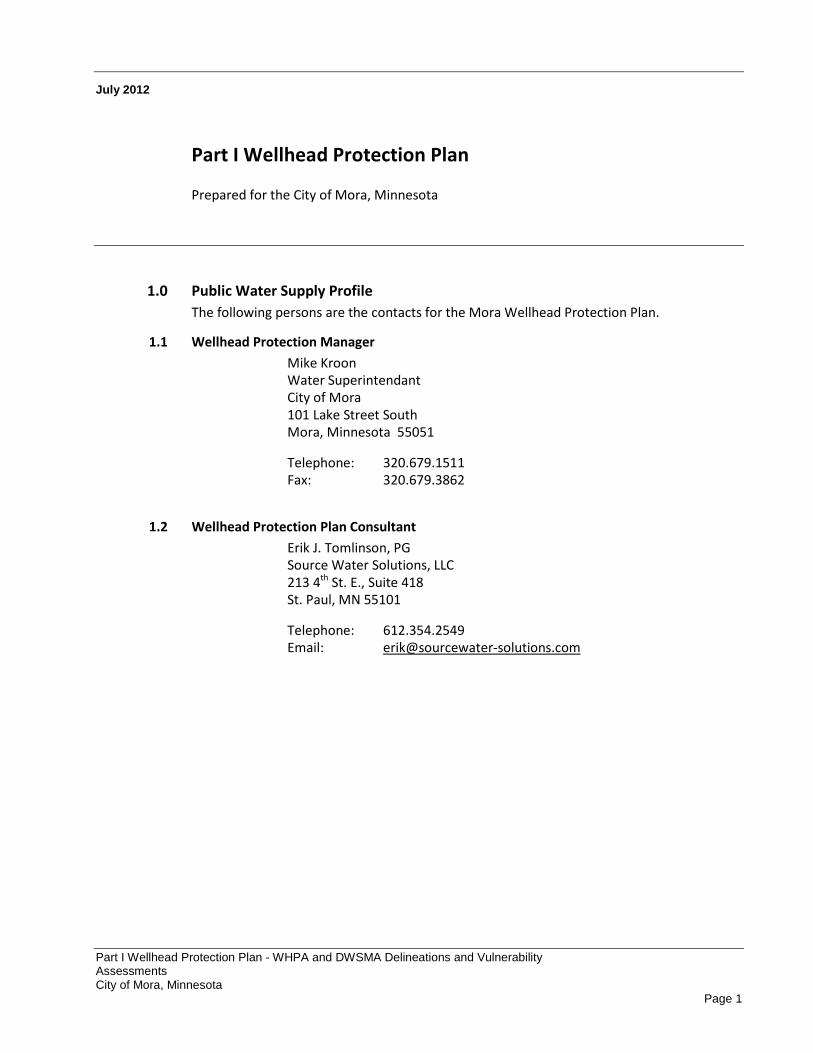
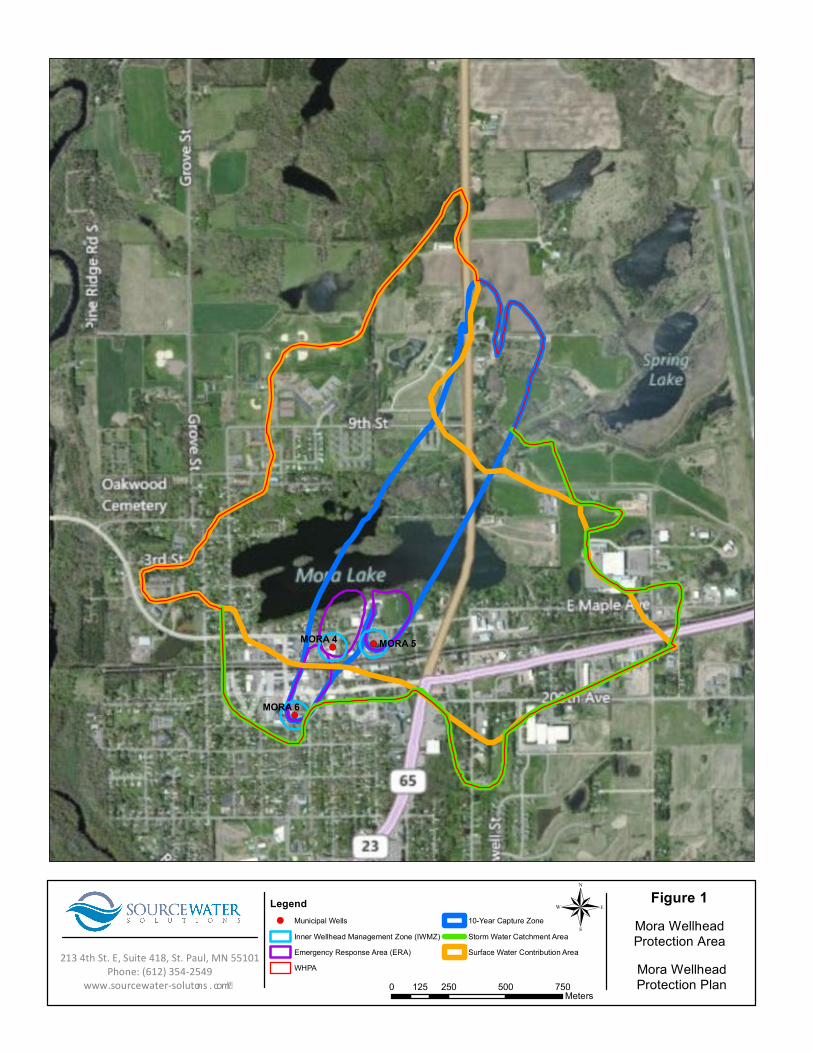
A computer groundwater model was created using the MODFLOW finite-difference flow model and was used to calculate the subsurface capture area for the primary water supply wells used by the City of Mora. Municipal well details are provided in Table 1. The WHPA delineation is provided in Figure 1. Discussion of the WHPA delineation is presented in Section 2 of this Plan.
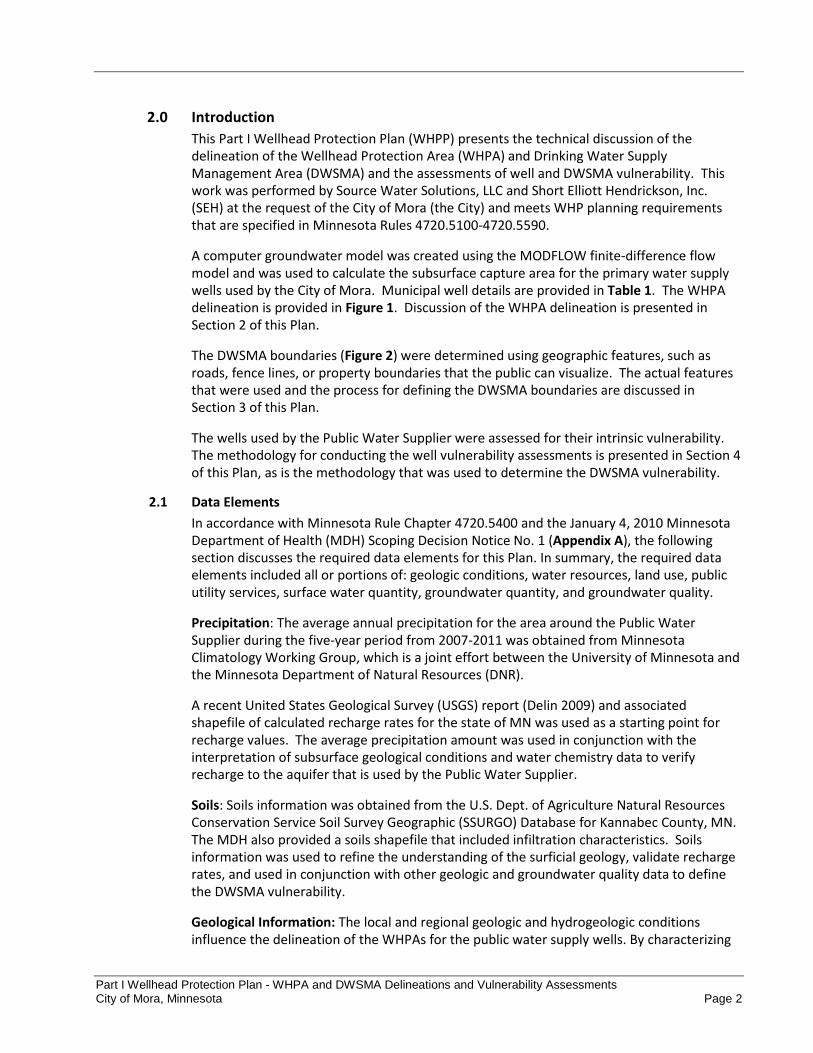
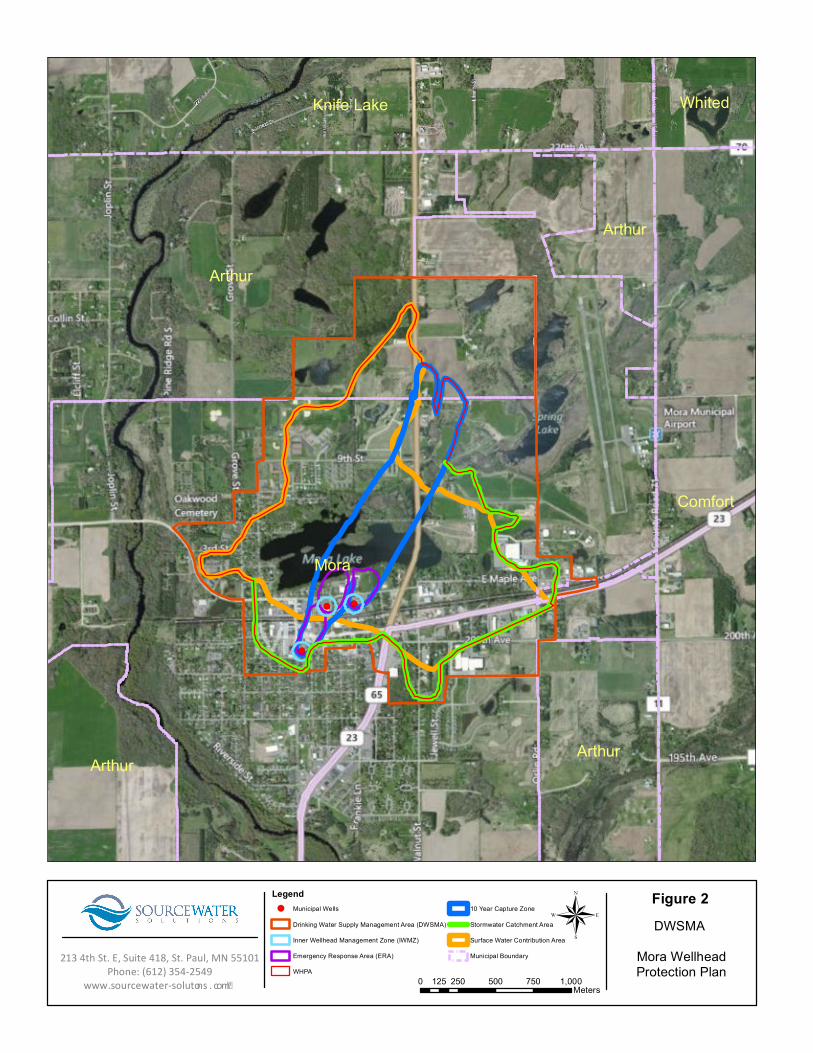
The DWSMA boundaries (Figure 2) were determined using geographic features, such as roads, fence lines, or property boundaries that the public can visualize. The actual features that were used and the process for defining the DWSMA boundaries are discussed in Section 3 of this Plan.
The wells used by the Public Water Supplier were assessed for their intrinsic vulnerability. The methodology for conducting the well vulnerability assessments is presented in Section 4 of this Plan, as is the methodology that was used to determine the DWSMA vulnerability.
2.1 Data Elements In accordance with Minnesota Rule Chapter 4720.5400 and the January 4, 2010 Minnesota Department of Health (MDH) Scoping Decision Notice No. 1 (Appendix A), the following section discusses the required data elements for this Plan. In summary, the required data elements included all or portions of: geologic conditions, water resources, land use, public utility services, surface water quantity, groundwater quantity, and groundwater quality.
Precipitation: The average annual precipitation for the area around the Public Water Supplier during the five-year period from 2007-2011 was obtained from Minnesota Climatology Working Group, which is a joint effort between the University of Minnesota and the Minnesota Department of Natural Resources (DNR).
A recent United States Geological Survey (USGS) report (Delin 2009) and associated shapefile of calculated recharge rates for the state of MN was used as a starting point for recharge values. The average precipitation amount was used in conjunction with the interpretation of subsurface geological conditions and water chemistry data to verify recharge to the aquifer that is used by the Public Water Supplier.
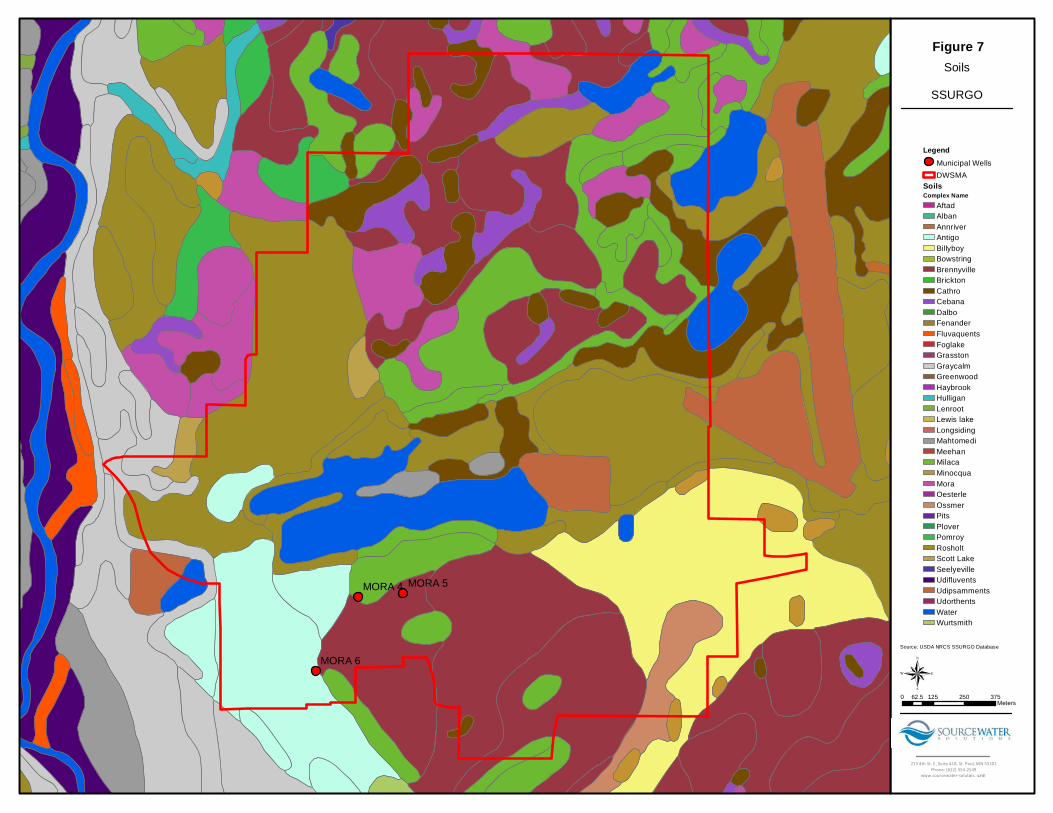
Soils: Soils information was obtained from the U.S. Dept. of Agriculture Natural Resources Conservation Service Soil Survey Geographic (SSURGO) Database for Kannabec County, MN. The MDH also provided a soils shapefile that included infiltration characteristics. Soils information was used to refine the understanding of the surficial geology, validate recharge rates, and used in conjunction with other geologic and groundwater quality data to define the DWSMA vulnerability.
Geological Information: The local and regional geologic and hydrogeologic conditions influence the delineation of the WHPAs for the public water supply wells. By characterizing
Part I Wellhead Protection Plan - WHPA and DWSMA Delineations and Vulnerability Assessments City of Mora, Minnesota Page 3
these conditions, the geometry, location, and magnitude of groundwater recharge and discharge areas, and the groundwater flow direction of the source water aquifer could be determined or estimated.
Existing geological maps, reports, and studies that were used are listed in the References section of the plan. Through the use of public-domain well records and local and regional geologic studies and publications, the geology and hydrogeology of the area have been evaluated and reviewed to aid in the WHPA delineations and vulnerability assessments. These resources were provided by the City, the MDH, the Minnesota Geological Survey (MGS), and the USGS. Geologic Cross Sections were created and provided by the MDH and are presented as Appendix B.
These resources provided the basis for defining local geologic and hydrologic conditions, but this interpretation was refined using soils data, exposures of geological materials, and the records of wells, borings, exploration test holes, and excavations. The City has no additional geologic information from logs or borehole geophysical records of wells, borings, or exploration test holes, nor additional information from surface geophysical studies.
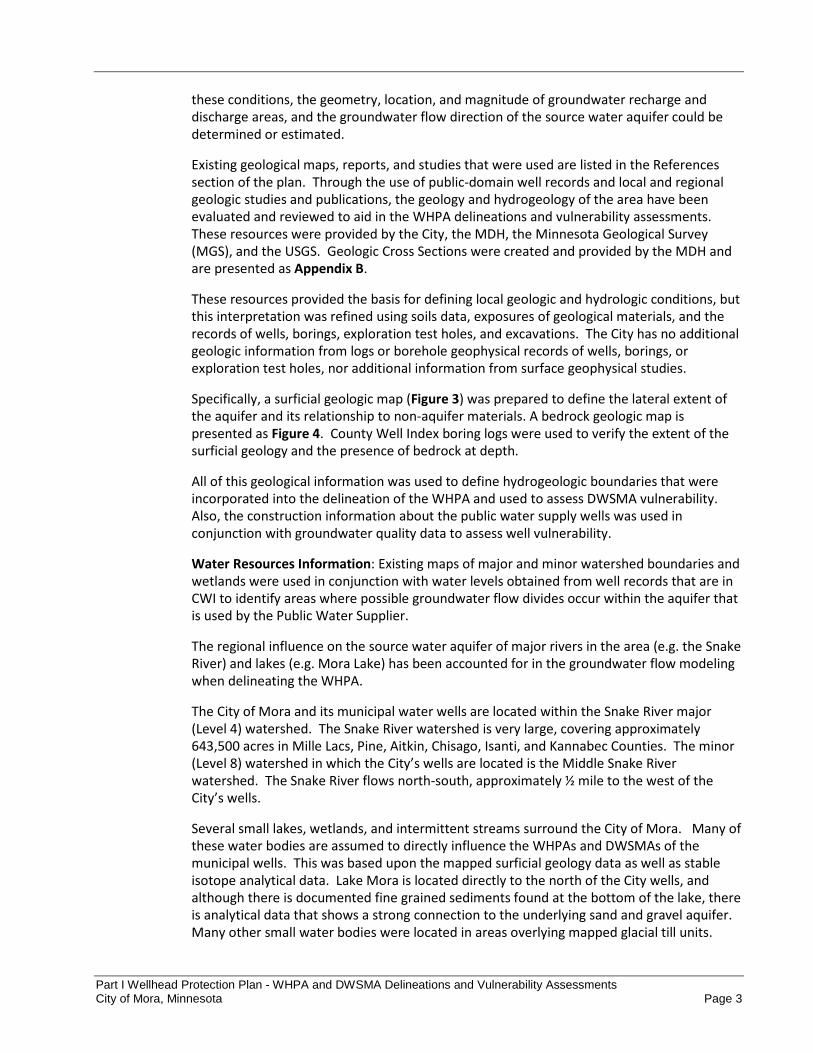
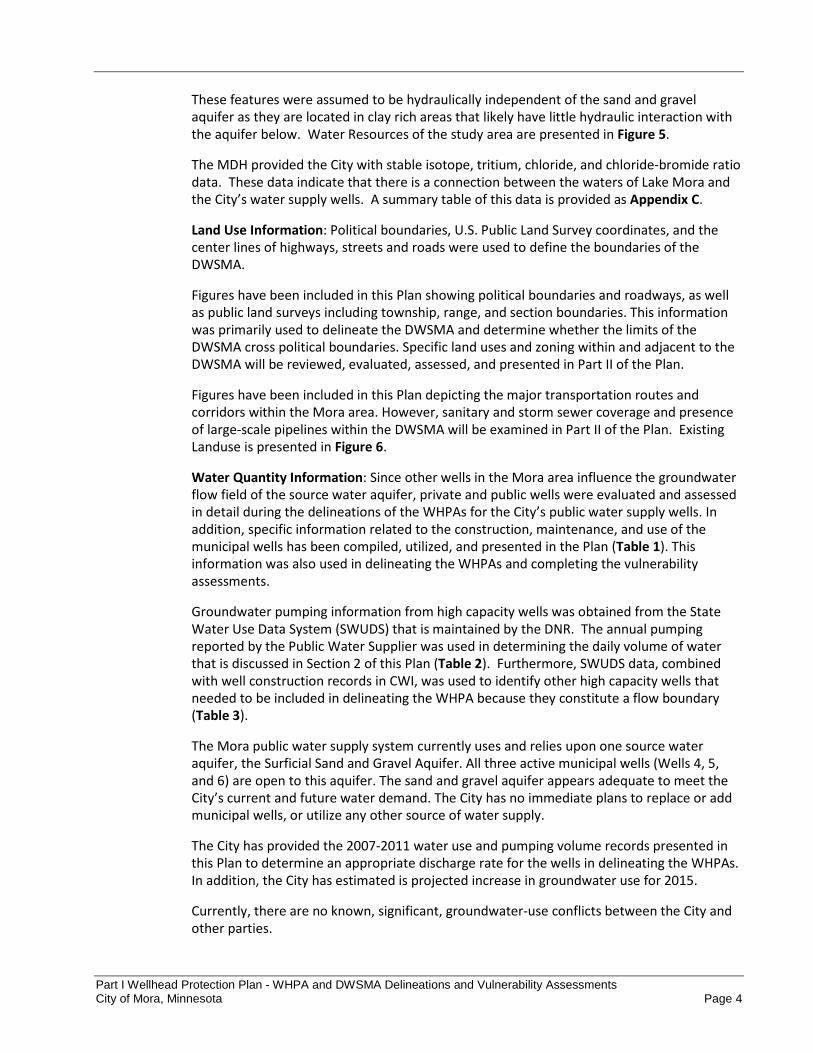
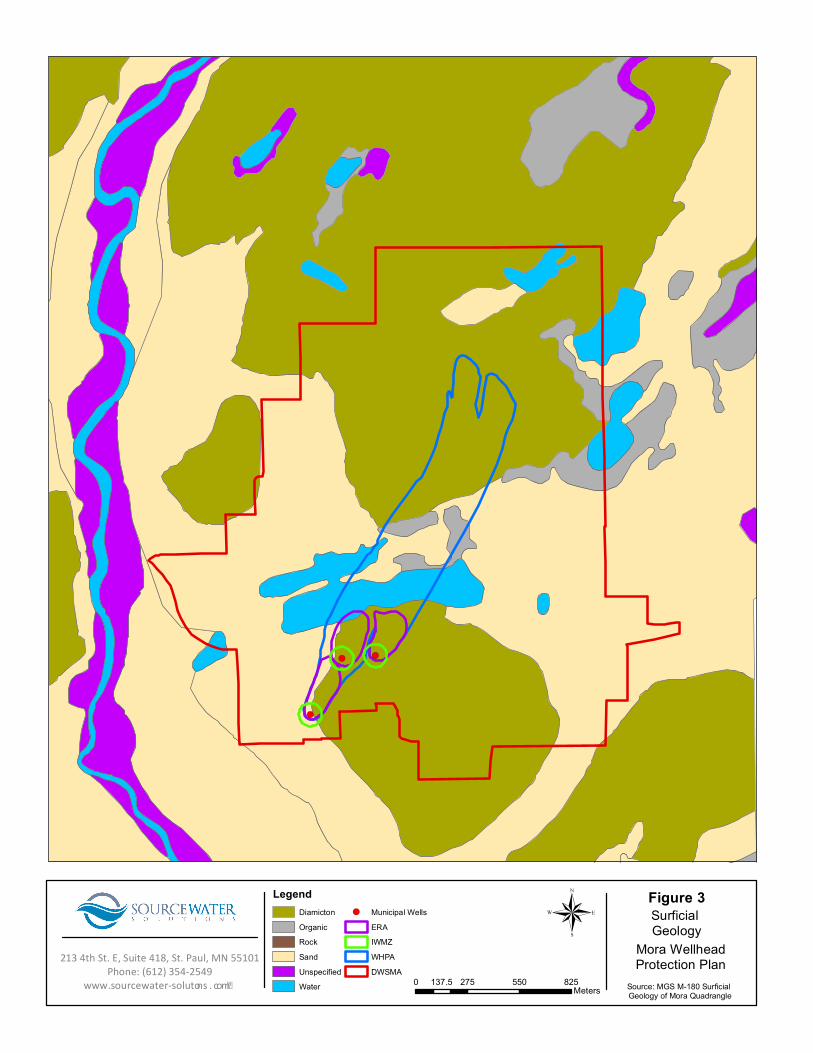
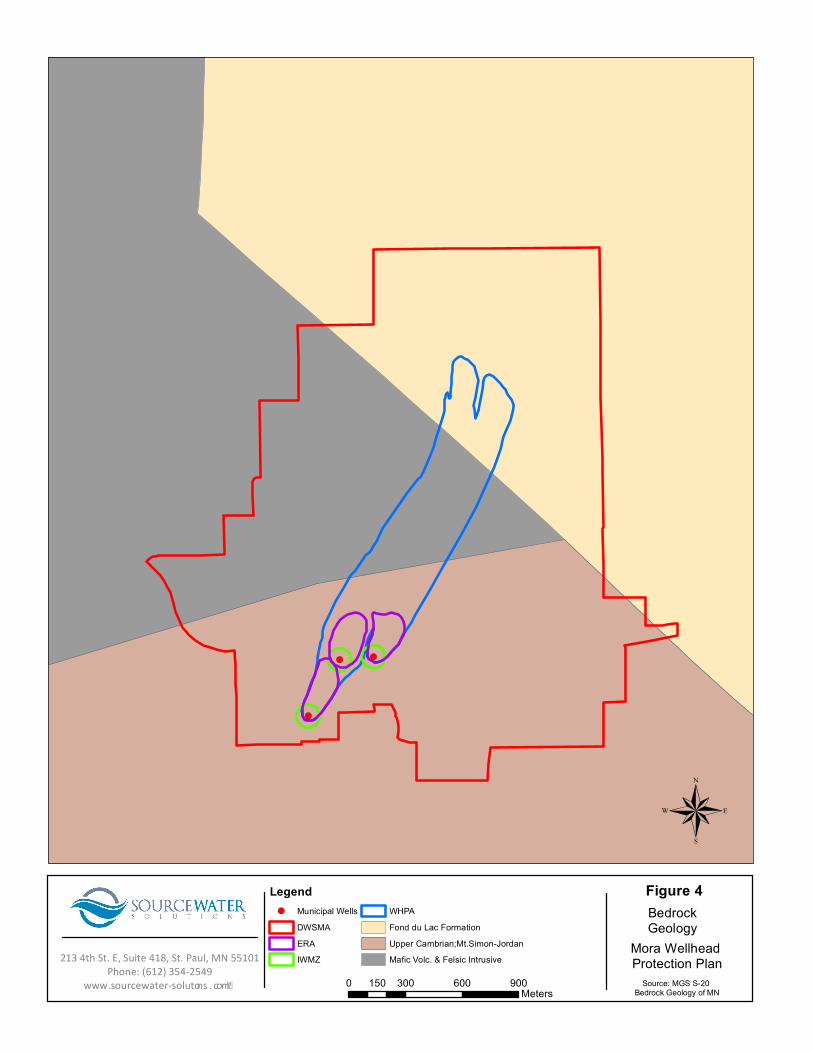
Specifically, a surficial geologic map (Figure 3) was prepared to define the lateral extent of the aquifer and its relationship to non-aquifer materials. A bedrock geologic map is presented as Figure 4. County Well Index boring logs were used to verify the extent of the surficial geology and the presence of bedrock at depth.
All of this geological information was used to define hydrogeologic boundaries that were incorporated into the delineation of the WHPA and used to assess DWSMA vulnerability. Also, the construction information about the public water supply wells was used in conjunction with groundwater quality data to assess well vulnerability.
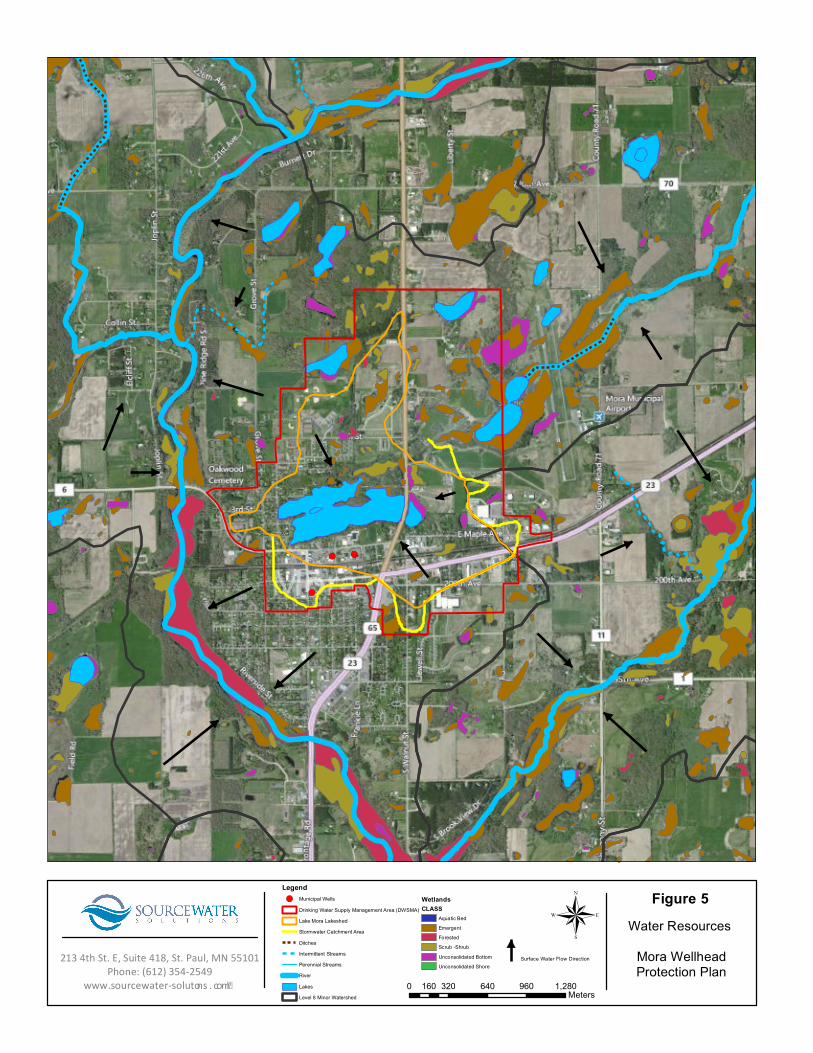
Water Resources Information: Existing maps of major and minor watershed boundaries and wetlands were used in conjunction with water levels obtained from well records that are in CWI to identify areas where possible groundwater flow divides occur within the aquifer that is used by the Public Water Supplier.
The regional influence on the source water aquifer of major rivers in the area (e.g. the Snake River) and lakes (e.g. Mora Lake) has been accounted for in the groundwater flow modeling when delineating the WHPA.
The City of Mora and its municipal water wells are located within the Snake River major (Level 4) watershed. The Snake River watershed is very large, covering approximately 643,500 acres in Mille Lacs, Pine, Aitkin, Chisago, Isanti, and Kannabec Counties. The minor (Level 8) watershed in which the City’s wells are located is the Middle Snake River watershed. The Snake River flows north-south, approximately ½ mile to the west of the City’s wells.
Several small lakes, wetlands, and intermittent streams surround the City of Mora. Many of these water bodies are assumed to directly influence the WHPAs and DWSMAs of the municipal wells. This was based upon the mapped surficial geology data as well as stable isotope analytical data. Lake Mora is located directly to the north of the City wells, and although there is documented fine grained sediments found at the bottom of the lake, there is analytical data that shows a strong connection to the underlying sand and gravel aquifer. Many other small water bodies were located in areas overlying mapped glacial till units.
Part I Wellhead Protection Plan - WHPA and DWSMA Delineations and Vulnerability Assessments City of Mora, Minnesota Page 4
These features were assumed to be hydraulically independent of the sand and gravel aquifer as they are located in clay rich areas that likely have little hydraulic interaction with the aquifer below. Water Resources of the study area are presented in Figure 5.
The MDH provided the City with stable isotope, tritium, chloride, and chloride-bromide ratio data. These data indicate that there is a connection between the waters of Lake Mora and the City’s water supply wells. A summary table of this data is provided as Appendix C.
Land Use Information: Political boundaries, U.S. Public Land Survey coordinates, and the center lines of highways, streets and roads were used to define the boundaries of the DWSMA.
Figures have been included in this Plan showing political boundaries and roadways, as well as public land surveys including township, range, and section boundaries. This information was primarily used to delineate the DWSMA and determine whether the limits of the DWSMA cross political boundaries. Specific land uses and zoning within and adjacent to the DWSMA will be reviewed, evaluated, assessed, and presented in Part II of the Plan.
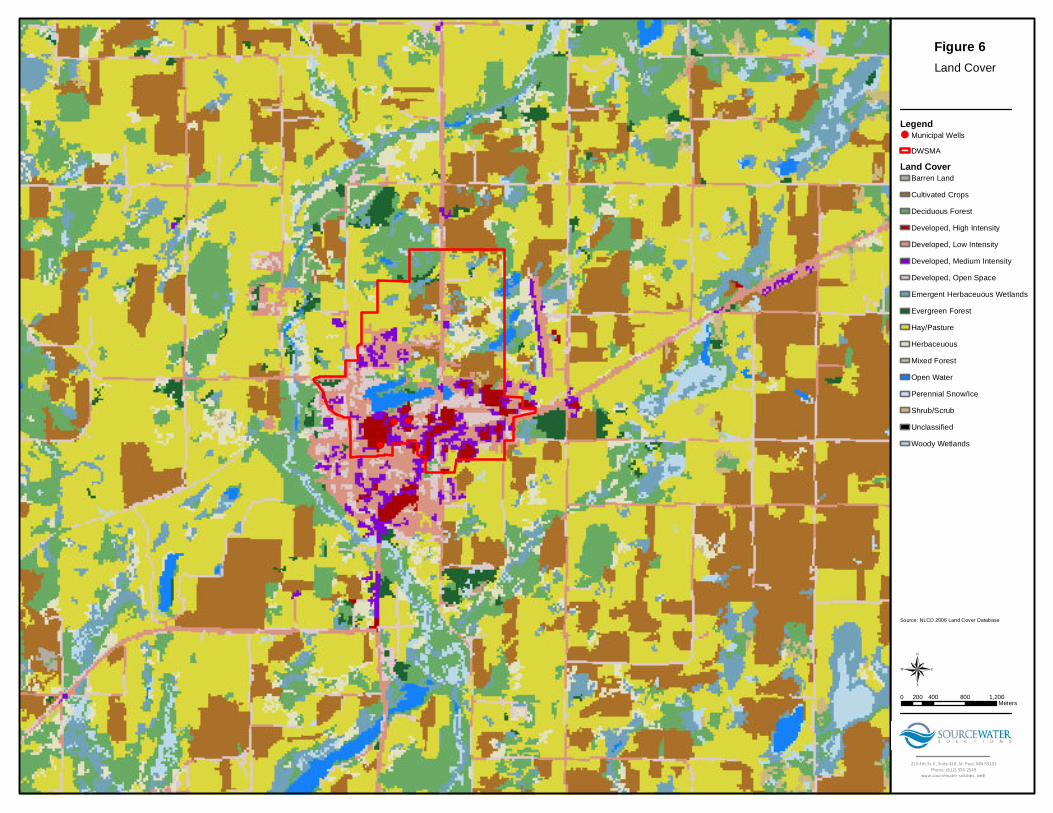
Figures have been included in this Plan depicting the major transportation routes and corridors within the Mora area. However, sanitary and storm sewer coverage and presence of large-scale pipelines within the DWSMA will be examined in Part II of the Plan. Existing Landuse is presented in Figure 6.
Water Quantity Information: Since other wells in the Mora area influence the groundwater flow field of the source water aquifer, private and public wells were evaluated and assessed in detail during the delineations of the WHPAs for the City’s public water supply wells. In addition, specific information related to the construction, maintenance, and use of the municipal wells has been compiled, utilized, and presented in the Plan (Table 1). This information was also used in delineating the WHPAs and completing the vulnerability assessments.
Groundwater pumping information from high capacity wells was obtained from the State Water Use Data System (SWUDS) that is maintained by the DNR. The annual pumping reported by the Public Water Supplier was used in determining the daily volume of water that is discussed in Section 2 of this Plan (Table 2). Furthermore, SWUDS data, combined with well construction records in CWI, was used to identify other high capacity wells that needed to be included in delineating the WHPA because they constitute a flow boundary (Table 3).
The Mora public water supply system currently uses and relies upon one source water aquifer, the Surficial Sand and Gravel Aquifer. All three active municipal wells (Wells 4, 5, and 6) are open to this aquifer. The sand and gravel aquifer appears adequate to meet the City’s current and future water demand. The City has no immediate plans to replace or add municipal wells, or utilize any other source of water supply.
The City has provided the 2007-2011 water use and pumping volume records presented in this Plan to determine an appropriate discharge rate for the wells in delineating the WHPAs. In addition, the City has estimated is projected increase in groundwater use for 2015.
Currently, there are no known, significant, groundwater-use conflicts between the City and other parties.
Part I Wellhead Protection Plan - WHPA and DWSMA Delineations and Vulnerability Assessments City of Mora, Minnesota Page 5
Water Quality Information: The sand and gravel source water aquifer appears to be in direct hydrologic connection with surface waters or the land surface. Available groundwater quality information was used to characterize; the rate of recharge to the aquifer used by the Public Water Supplier, the degree of hydraulic connection between it and surface hydrologic features, and to assess DWSMA vulnerability. It is suggested that this information in conjunction with surface water quality data be utilized when updating the City’s WHPP. Also, groundwater and surface water quality information will be able to be used to update well vulnerability.
The quality of the groundwater in the source water aquifer, and in the Mora area specifically, must be evaluated and assessed for this Plan. Groundwater contamination and undesirable groundwater quality will directly impact the public water supply system. Certain naturally-occurring constituents in the groundwater also provide information that can be used to determine the vulnerability of the source water aquifer. The City publishes an annual consumer confidence report that contains water quality data collected over the course of the year.
Due to a lack of fine-grained, clay-rich deposits directly overlying the sand and gravel aquifer in the area of Mora Well 6, as well as upgradient (north) of Wells 4 and 5, the water table sand and gravel aquifer is highly or very highly sensitive to pollution from land surface activities. As described above, there also appears to be a direct connection between Lake Mora and the sand and gravel aquifer. This indicates that contaminants released at the land surface, or to the surface waters of Lake Mora, could reach the aquifers within or hours to months.
Water samples from the public water supply system are routinely collected and analyzed by the MDH as required under the Minnesota Public Water Supply Program and the federal Safe Drinking Water Act. The samples are tested for microorganisms, inorganic compounds, organic chemicals, pesticides and herbicides, and radioactive contaminants. The MDH also provided the City with stable isotope, tritium, chloride and chloride-bromide ratio data. These data indicate that there is a connection between the waters of Lake Mora and the City’s water supply wells. A summary table of this data is provided as Appendix C.
The overall quality of groundwater in Mora is good. No contaminants were detected at levels that violated the federal drinking water standards. Some were detected in trace amounts that were below legal limits. The City of Mora’s 2010 Consumer Confidence Report is available on the City’s website at:
http://www.ci.mora.mn.us/vertical/Sites/%7B10E9A731-228C-4FE8-9EA3-018C1162BBAE%7D/uploads/2010_ccr.pdf
2.2 Geological Setting The Public Water Supplier is located in south central Kanabec County within the Middle Snake River watershed in a region of glacial, fluvial, and lacustrine sediment of the Superior provenance, deposited by the Superior lobe. The physiographic and geological conditions of the area impact the yield and vulnerability of the aquifer used by the Public Water Supplier.
The Middle Snake River watershed covers approximately 10,460 acres in Kanabec County of primarily agricultural land with scattered areas of forested and residential land uses (Figure 6).
Part I Wellhead Protection Plan - WHPA and DWSMA Delineations and Vulnerability Assessments City of Mora, Minnesota Page 6
Topography
The municipal wells are located within the city limits which is developed and generally flat sloping slightly to the north to Lake Mora and to the west to the Snake River. The greatest topography change is along the river valleys of the Snake River to the west and Spring Brook to the southeast. Both water bodies cross the quaternary sequences in the modeled area. There are also major and minor lakes that were modeled within the vicinity of the City wells.
Soils
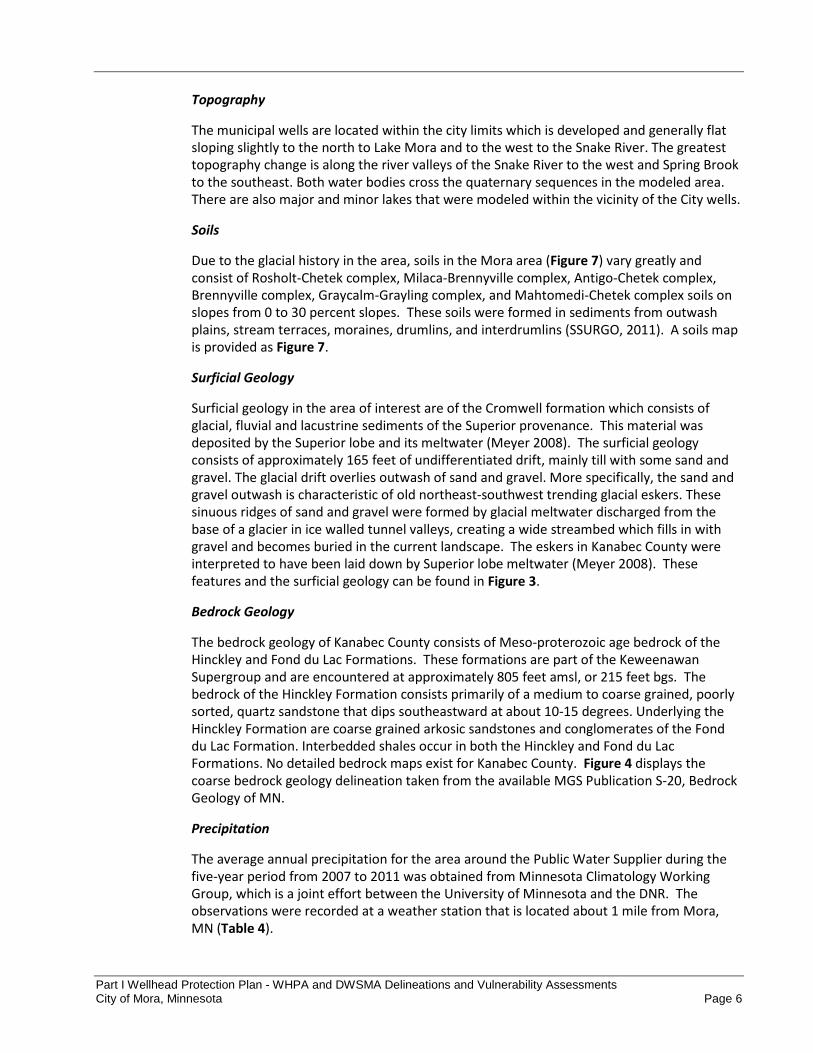
Due to the glacial history in the area, soils in the Mora area (Figure 7) vary greatly and consist of Rosholt-Chetek complex, Milaca-Brennyville complex, Antigo-Chetek complex, Brennyville complex, Graycalm-Grayling complex, and Mahtomedi-Chetek complex soils on slopes from 0 to 30 percent slopes. These soils were formed in sediments from outwash plains, stream terraces, moraines, drumlins, and interdrumlins (SSURGO, 2011). A soils map is provided as Figure 7.
Surficial Geology
Surficial geology in the area of interest are of the Cromwell formation which consists of glacial, fluvial and lacustrine sediments of the Superior provenance. This material was deposited by the Superior lobe and its meltwater (Meyer 2008). The surficial geology consists of approximately 165 feet of undifferentiated drift, mainly till with some sand and gravel. The glacial drift overlies outwash of sand and gravel. More specifically, the sand and gravel outwash is characteristic of old northeast-southwest trending glacial eskers. These sinuous ridges of sand and gravel were formed by glacial meltwater discharged from the base of a glacier in ice walled tunnel valleys, creating a wide streambed which fills in with gravel and becomes buried in the current landscape. The eskers in Kanabec County were interpreted to have been laid down by Superior lobe meltwater (Meyer 2008). These features and the surficial geology can be found in Figure 3.
Bedrock Geology
The bedrock geology of Kanabec County consists of Meso-proterozoic age bedrock of the Hinckley and Fond du Lac Formations. These formations are part of the Keweenawan Supergroup and are encountered at approximately 805 feet amsl, or 215 feet bgs. The bedrock of the Hinckley Formation consists primarily of a medium to coarse grained, poorly sorted, quartz sandstone that dips southeastward at about 10-15 degrees. Underlying the Hinckley Formation are coarse grained arkosic sandstones and conglomerates of the Fond du Lac Formation. Interbedded shales occur in both the Hinckley and Fond du Lac Formations. No detailed bedrock maps exist for Kanabec County. Figure 4 displays the coarse bedrock geology delineation taken from the available MGS Publication S-20, Bedrock Geology of MN.
Precipitation
The average annual precipitation for the area around the Public Water Supplier during the five-year period from 2007 to 2011 was obtained from Minnesota Climatology Working Group, which is a joint effort between the University of Minnesota and the DNR. The observations were recorded at a weather station that is located about 1 mile from Mora, MN (Table 4).
Part I Wellhead Protection Plan - WHPA and DWSMA Delineations and Vulnerability Assessments City of Mora, Minnesota Page 7
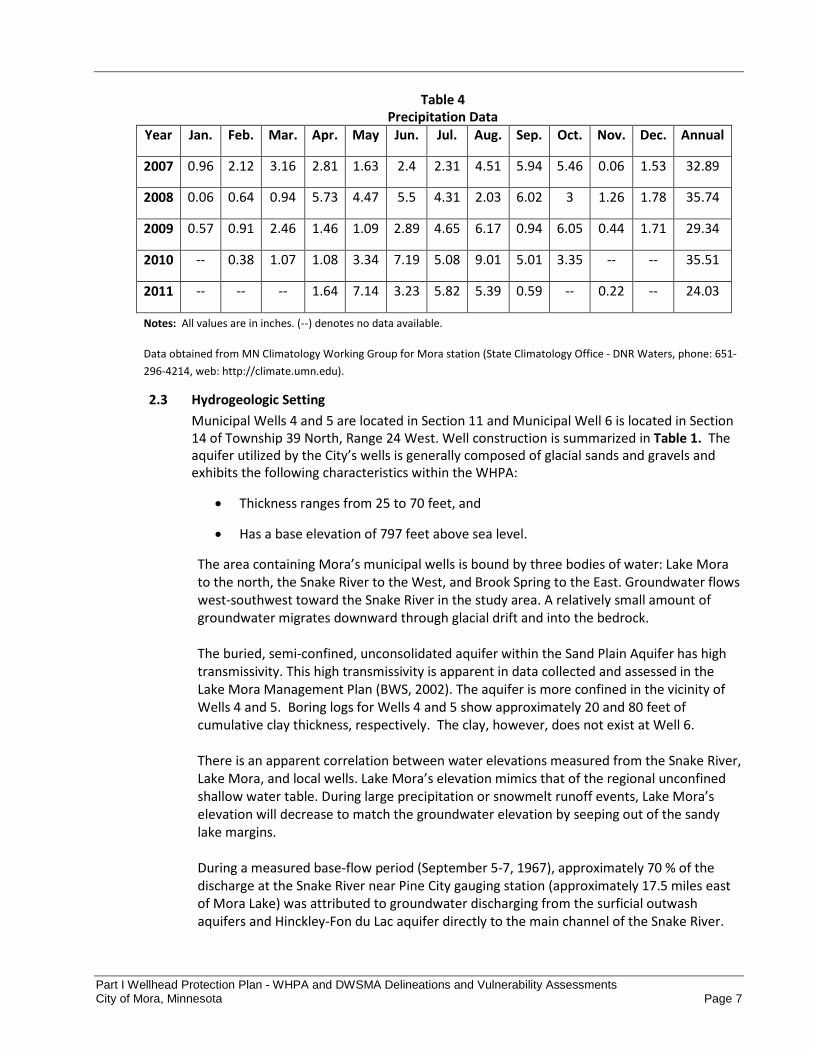
Table 4 Precipitation Data
Year Jan. Feb. Mar. Apr. May Jun. Jul. Aug. Sep. Oct. Nov. Dec. Annual
2007 0.96 2.12 3.16 2.81 1.63 2.4 2.31 4.51 5.94 5.46 0.06 1.53 32.89
2008 0.06 0.64 0.94 5.73 4.47 5.5 4.31 2.03 6.02 3 1.26 1.78 35.74
2009 0.57 0.91 2.46 1.46 1.09 2.89 4.65 6.17 0.94 6.05 0.44 1.71 29.34
2010 -- 0.38 1.07 1.08 3.34 7.19 5.08 9.01 5.01 3.35 -- -- 35.51
2011 -- -- -- 1.64 7.14 3.23 5.82 5.39 0.59 -- 0.22 -- 24.03
Notes: All values are in inches. (--) denotes no data available.
Data obtained from MN Climatology Working Group for Mora station (State Climatology Office - DNR Waters, phone: 651-296-4214, web: http://climate.umn.edu).
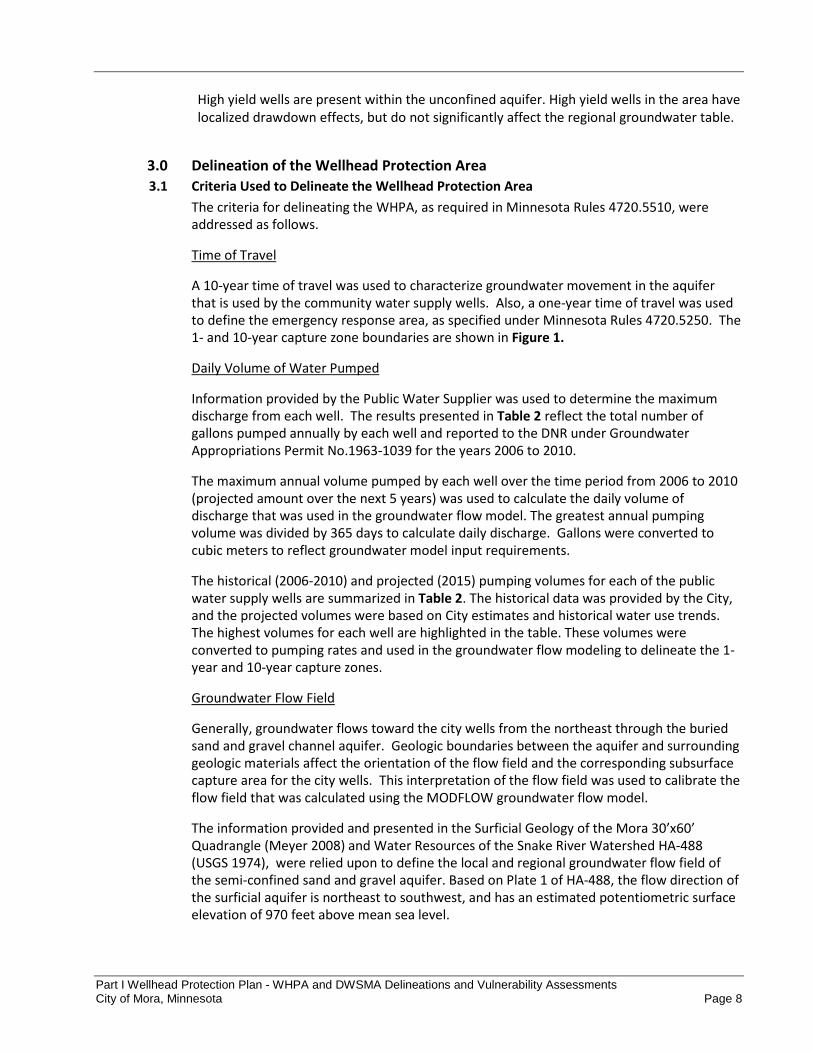
2.3 Hydrogeologic Setting Municipal Wells 4 and 5 are located in Section 11 and Municipal Well 6 is located in Section 14 of Township 39 North, Range 24 West. Well construction is summarized in Table 1. The aquifer utilized by the City’s wells is generally composed of glacial sands and gravels and exhibits the following characteristics within the WHPA:
• Thickness ranges from 25 to 70 feet, and
• Has a base elevation of 797 feet above sea level.
The area containing Mora’s municipal wells is bound by three bodies of water: Lake Mora to the north, the Snake River to the West, and Brook Spring to the East. Groundwater flows west-southwest toward the Snake River in the study area. A relatively small amount of groundwater migrates downward through glacial drift and into the bedrock. The buried, semi-confined, unconsolidated aquifer within the Sand Plain Aquifer has high transmissivity. This high transmissivity is apparent in data collected and assessed in the Lake Mora Management Plan (BWS, 2002). The aquifer is more confined in the vicinity of Wells 4 and 5. Boring logs for Wells 4 and 5 show approximately 20 and 80 feet of cumulative clay thickness, respectively. The clay, however, does not exist at Well 6. There is an apparent correlation between water elevations measured from the Snake River, Lake Mora, and local wells. Lake Mora’s elevation mimics that of the regional unconfined shallow water table. During large precipitation or snowmelt runoff events, Lake Mora’s elevation will decrease to match the groundwater elevation by seeping out of the sandy lake margins. During a measured base-flow period (September 5-7, 1967), approximately 70 % of the discharge at the Snake River near Pine City gauging station (approximately 17.5 miles east of Mora Lake) was attributed to groundwater discharging from the surficial outwash aquifers and Hinckley-Fon du Lac aquifer directly to the main channel of the Snake River.
Part I Wellhead Protection Plan - WHPA and DWSMA Delineations and Vulnerability Assessments City of Mora, Minnesota Page 8
High yield wells are present within the unconfined aquifer. High yield wells in the area have localized drawdown effects, but do not significantly affect the regional groundwater table.
3.0 Delineation of the Wellhead Protection Area 3.1 Criteria Used to Delineate the Wellhead Protection Area
The criteria for delineating the WHPA, as required in Minnesota Rules 4720.5510, were addressed as follows.
Time of Travel
A 10-year time of travel was used to characterize groundwater movement in the aquifer that is used by the community water supply wells. Also, a one-year time of travel was used to define the emergency response area, as specified under Minnesota Rules 4720.5250. The 1- and 10-year capture zone boundaries are shown in Figure 1.
Daily Volume of Water Pumped
Information provided by the Public Water Supplier was used to determine the maximum discharge from each well. The results presented in Table 2 reflect the total number of gallons pumped annually by each well and reported to the DNR under Groundwater Appropriations Permit No.1963-1039 for the years 2006 to 2010.
The maximum annual volume pumped by each well over the time period from 2006 to 2010 (projected amount over the next 5 years) was used to calculate the daily volume of discharge that was used in the groundwater flow model. The greatest annual pumping volume was divided by 365 days to calculate daily discharge. Gallons were converted to cubic meters to reflect groundwater model input requirements.
The historical (2006-2010) and projected (2015) pumping volumes for each of the public water supply wells are summarized in Table 2. The historical data was provided by the City, and the projected volumes were based on City estimates and historical water use trends. The highest volumes for each well are highlighted in the table. These volumes were converted to pumping rates and used in the groundwater flow modeling to delineate the 1-year and 10-year capture zones.
Groundwater Flow Field
Generally, groundwater flows toward the city wells from the northeast through the buried sand and gravel channel aquifer. Geologic boundaries between the aquifer and surrounding geologic materials affect the orientation of the flow field and the corresponding subsurface capture area for the city wells. This interpretation of the flow field was used to calibrate the flow field that was calculated using the MODFLOW groundwater flow model.
The information provided and presented in the Surficial Geology of the Mora 30’x60’ Quadrangle (Meyer 2008) and Water Resources of the Snake River Watershed HA-488 (USGS 1974), were relied upon to define the local and regional groundwater flow field of the semi-confined sand and gravel aquifer. Based on Plate 1 of HA-488, the flow direction of the surficial aquifer is northeast to southwest, and has an estimated potentiometric surface elevation of 970 feet above mean sea level.
Part I Wellhead Protection Plan - WHPA and DWSMA Delineations and Vulnerability Assessments City of Mora, Minnesota Page 9
Flow Boundaries
The following flow boundaries were identified and incorporated into the delineation of the WHPA:
• Geological boundaries between the channelized sand and gravel aquifer and adjacent till material (till was represented as zones with lower hydraulic conductivites).
• Leaky confining unit above the semi-confined sand and gravel aquifer used by the City wells.
• Surface hydrologic features that provide recharge to the aquifer and/or impact aquifer water quality. The Snake River, Mora Lake, and Spring Lake were included in the model as well as Spring Brook and other smaller lakes and streams. All of the above mentioned hydrologic features were represented as river boundaries.
• The high-capacity wells identified in Table 3, in addition to those operated by the Public Water Supplier may impact WHPA the boundaries.
• Vertical infiltration from the surface (recharge).
Aquifer Transmissivity
An aquifer pumping test was conducted for the City on Well No. 6 in 1988. The test was performed in accordance with the Minnesota Wellhead Protection Rules (MN Rules Chapter 4720.5320 and 4720.5520). Existing published data was also found in the USGS Hydrologic Atlas “Water Resources of the Snake River Watershed, East-Central, MN” HA-488. Aquifer tests used in this document were completed using Mora village wells (1,2,3 and 4). An Aquifer Test Plan submitted to the Minnesota Department of Health (MDH) staff in February 2011. The aquifer pumping test reports for the Mora tests are provided in Appendix D.
The aquifer transmissivity and hydraulic conductivity (K) values derived from these tests were utilized in developing and refining the groundwater flow model used to delineate the WHPA for the sand and gravel source water aquifer. However, to address uncertainties inherently related to the pumping tests and the aquifer, a range of transmissivity and K values were used in the groundwater flow modeling. A conservative K value of 86.4 m/d (1x10⁻¹ cm/s) was used for the glacial sand and gravel in the model. The values presented in the aquifer test plans were a starting point for the hydraulic conductivity values used for the sand and gravel aquifer body. As the model was calibrated, the K value used in the aquifer body was modified. Table 5 summarizes the final groundwater flow model parameters and Figures 10 and 11 show the hydraulic conductivity zones used in the model.
Part I Wellhead Protection Plan - WHPA and DWSMA Delineations and Vulnerability Assessments City of Mora, Minnesota Page 10
3.2 Method Used to Delineate the Wellhead Protection Area
A numerical groundwater model was developed to delineate the 10 year capture zones for the City’s water supply wells. Based upon the sensitivity of the aquifer and the documentation of a hydraulic connection between Lake Mora and the aquifer, a delineation of the potential surface water contribution area was also required for the City’s wellfields.
The final WHPA delineation is a composite of the numerical model delineation and the conjunctive delineation including surface water contribution areas. The WHPA delineation is shown in Figure 1.
Conceptual Groundwater Model A two layer conceptual model was developed for the sand and gravel aquifer utilized by the City. The upper layer consists of unconfined sand and gravel zones as well as silt and clay till zones. These areas were identified in the surficial geology maps and verified by boring log data (Figure 10). The second layer consists of a sand and gravel body utilized by the City’s municipal wells surrounded by a lower permeability unit similar to the silt and clay till zones in Layer 1 (Figure 11). Although the sand and gravel aquifer utilized in the areas of Wells 4 and 5 are locally confined, the two layers are hydraulically connected by the regional sand and gravel zones found in Layer 1. Aquifer thickness and bedrock surface topography were key factors in determining the groundwater flow fields. An aquiclude, or very low permeability bedrock layer, underlies both layers. The bedrock was not represented in this groundwater simulation model. The Snake River is a major groundwater discharge area and Lake Mora is a major groundwater source. These features, along with the other regional water bodies, were assigned river head boundaries. Numerical Groundwater Model MODFLOW is the name that has been given the USGS Modular Three-Dimensional Ground-Water Flow Model. Because of its ability to simulate a wide variety of systems, its extensive publicly available documentation, and its rigorous USGS peer review, MODFLOW has become the worldwide standard ground-water flow model. MODFLOW is used to simulate systems for water supply, containment remediation and mine dewatering. MODFLOW is most appropriate in those situations where a relatively precise understanding of the flow system is needed to make a decision. MODFLOW was developed using the finite-difference method. The finite-difference method permits a physical explanation of the concepts used in construction of the model Groundwater flow within the aquifer is simulated in MODFLOW using a block-centered finite-difference approach. Layers can be simulated as confined, unconfined, or a combination of both. Flows from external stresses such as flow to wells, areal recharge, evapotranspiration, flow to drains, and flow through riverbeds can also be simulated. Grid Development Because MODFLOW is a block centered finite-difference model, a grid must be defined over the model domain. The grid spacing and size of cells varies across the model domain. In areas where impact from pumping and accuracy will not impact the capture zones, cells are as large as 243 x 383 meters. In areas where the accuracy of groundwater contours and the delineation of particle pathlines require greater accuracy (around pumping wells and
Part I Wellhead Protection Plan - WHPA and DWSMA Delineations and Vulnerability Assessments City of Mora, Minnesota Page 11
sources of recharge) the grid spacing is 2.6 x 3.1 meters. The thickness of the cells vary by the aquifer thickness. Boundary Conditions River boundaries were used to represent the water bodies in the model including Lake Mora. Due to the unique connection between Lake Mora and the groundwater system, as described above, low conductivity values were used to represent the deep, mucky bottoms of Lake Mora and higher conductivity values were used to represent the sandy near shore portions of Lake Mora. Figure 8 shows the boundary conditions used to represent natural features in the model. Model files are provided as Appendix E. Upper and Lower Boundary Conditions The surface topography contours were interpolated from 2 foot contour Digital Elevation Model (DEM) data for Kanabec County. A base elevation of 846 feet msl was used for the bottom of layer 1 and a base elevation of 797 feet msl was used for the bottom of layer 2. Porosity A porosity of 0.30 was used for the surficial aquifer in both Layer 1 and 2.
Aquifer Recharge Recharge values of 0.0004071 and 0.0005644 m/d were used in the model. Recharge zones are depicted in Figure 9. The recharge values assigned to this model fall within the ranges of percent precipitation as outlined by the Delin (USGS 2009).
3.3 Results of Model Calibration and Sensitivity Analysis
Model calibration is a procedure that compares the results of a model that are based on estimated input values to measured or “known” values. It is used to define model validity over a range of input values, or the confidence with which model results may be used. As a matter of practice, groundwater flow models are usually calibrated using water elevation or flux.
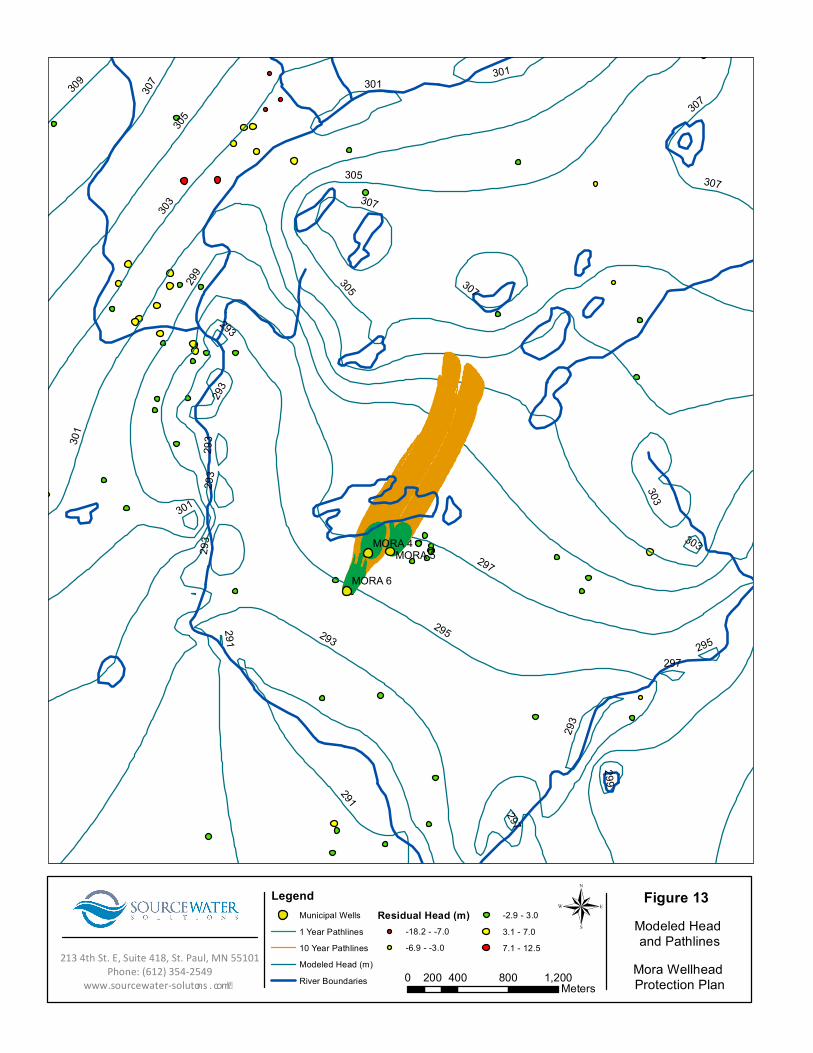
The Mora WHPP model was calibrated to hydraulic head by referencing modeled head results to the static water elevations in 237 wells that were selected from CWI. Each well was completed in the aquifer used by the Public Water Supplier wells and evaluated whether the reported static water level generally reflects the flow field (Figures 12 and 13). The calculated versus observed static water level elevations for each well were compared after each calibration run to determine how varying recharge and hydraulic conductivity produced the best match.
The best head calibration results were obtained by modifying hydraulic conductivity zones in shape and size. The best model calibration to measured heads in wells, however, produced unrealistically high flow out of the river boundary cells representing Mora Lake. This was improved by lowering the conductance values at the bottom of the lake and increasing the conductivity of the cells representing the shoreline of the lake better simulating the low permeability lake bottom sediments and high permeability near shore sediments documented in the Mora Lake study.
Model sensitivity is the amount of change in model results caused by the variation of a specific input parameter while keeping the other parameters constant. Using computer
Part I Wellhead Protection Plan - WHPA and DWSMA Delineations and Vulnerability Assessments City of Mora, Minnesota Page 12
models to simulate groundwater flow involves representing a complicated natural system in a more simplified manner. Local geologic conditions likely vary within the capture area of the wells, but existing information for the area around the Public Water Supplier is not sufficiently detailed to define this. As a result, the Mora WHPP model cannot represent the natural flow system exactly, but the results are valid when they are based upon a reasonable variation of input parameters. This is accomplished by performing an uncertainty analysis to evaluate uncertainties in the hydrogeologic data that may affect the size and shape of the capture zone for each well.
Groundwater flow direction and extent of the modeled capture zone may be sensitive to any of the model input parameters. The following discussion identifies the model input parameters that have the most significant impacts on the well capture zone.
Pumping Rate directly affects the volume of the aquifer that contributes water to the well. An increase in pumping rate leads to an equivalent increase in the volume of aquifer within the capture zone, proportional to the porosity of the aquifer materials.
Results - The pumping rate is defined by WHP rule requirements and is based on the results presented in Tables 2 and 3. Therefore, it is not a variable that will influence the delineation of the WHPA.
The direction of groundwater flow determines the orientation of the capture zone. Variations in the direction of groundwater flow will not affect the size of the capture zone but are important for defining the areas that are contributing water to the well.
Results - The potentiometric map that is produced by the Mora WHPP model closely matches that generated by contouring static water level data. Therefore, the direction of groundwater flow should not have a significant effect on the WHPA delineation given the current knowledge of hydraulic head distribution in the aquifer.
Aquifer transmissivity has a significant impact on the WHPA delineation because existing data indicate that local variability in aquifer composition may cause it to vary by as much as a factor of 10.
Results - To account for this possible variability, a sensitivity analysis was performed by varying the transmissivity over a range of plus and minus a factor of 10 of the calibrated value. Due to the relatively high hydraulic conductivity of the aquifer near the municipal wells, there was very minimal change in the size or direction of the capture zones as the K values were changed.
The thickness and porosity of the aquifer have little influence the size and shape of the capture zone because of the high hydraulic conductivity of the surficial aquifer in the vicinity of the municipal wells.
Results - Decreasing either thickness or porosity causes a nominal linear, proportional increase in the areal extent of the capture zones.
The river conductance values assigned to the river boundaries have a significant influence the size and shape of the capture zone because of the location of Lake Mora. As the conductance values are lowered for Lake Mora, the amount of surface water contributed by the lake is reduced and as the conductance values are raised, the amount of water contributed increases.
Part I Wellhead Protection Plan - WHPA and DWSMA Delineations and Vulnerability Assessments City of Mora, Minnesota Page 13
Results – Increasing the river conductance values decreases the size of the capture zone, however the volume of surface water contributed by Lake Mora becomes unrealistic. As the river conductance value decreases, the size of the capture zone increases, however the contribution of surface water from Lake Mora gets cut off.
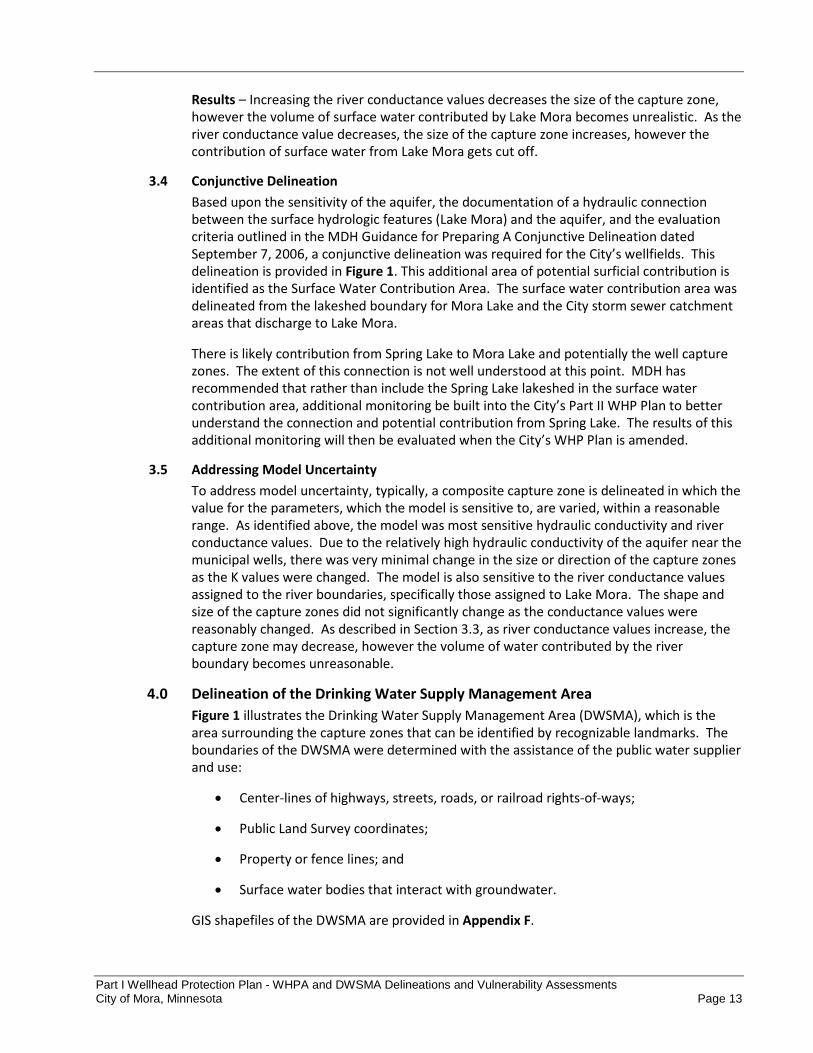
3.4 Conjunctive Delineation Based upon the sensitivity of the aquifer, the documentation of a hydraulic connection between the surface hydrologic features (Lake Mora) and the aquifer, and the evaluation criteria outlined in the MDH Guidance for Preparing A Conjunctive Delineation dated September 7, 2006, a conjunctive delineation was required for the City’s wellfields. This delineation is provided in Figure 1. This additional area of potential surficial contribution is identified as the Surface Water Contribution Area. The surface water contribution area was delineated from the lakeshed boundary for Mora Lake and the City storm sewer catchment areas that discharge to Lake Mora.
There is likely contribution from Spring Lake to Mora Lake and potentially the well capture zones. The extent of this connection is not well understood at this point. MDH has recommended that rather than include the Spring Lake lakeshed in the surface water contribution area, additional monitoring be built into the City’s Part II WHP Plan to better understand the connection and potential contribution from Spring Lake. The results of this additional monitoring will then be evaluated when the City’s WHP Plan is amended.
3.5 Addressing Model Uncertainty To address model uncertainty, typically, a composite capture zone is delineated in which the value for the parameters, which the model is sensitive to, are varied, within a reasonable range. As identified above, the model was most sensitive hydraulic conductivity and river conductance values. Due to the relatively high hydraulic conductivity of the aquifer near the municipal wells, there was very minimal change in the size or direction of the capture zones as the K values were changed. The model is also sensitive to the river conductance values assigned to the river boundaries, specifically those assigned to Lake Mora. The shape and size of the capture zones did not significantly change as the conductance values were reasonably changed. As described in Section 3.3, as river conductance values increase, the capture zone may decrease, however the volume of water contributed by the river boundary becomes unreasonable.
4.0 Delineation of the Drinking Water Supply Management Area Figure 1 illustrates the Drinking Water Supply Management Area (DWSMA), which is the area surrounding the capture zones that can be identified by recognizable landmarks. The boundaries of the DWSMA were determined with the assistance of the public water supplier and use:
• Center-lines of highways, streets, roads, or railroad rights-of-ways;
• Public Land Survey coordinates;
• Property or fence lines; and
• Surface water bodies that interact with groundwater.
GIS shapefiles of the DWSMA are provided in Appendix F.
Part I Wellhead Protection Plan - WHPA and DWSMA Delineations and Vulnerability Assessments City of Mora, Minnesota Page 14
5.0 Vulnerability Assessments The vulnerability assessments for the public water supply wells and the DWSMA are used to determine the scope of the inventory of potential contamination sources and to assign priorities for managing potential contamination sources within the DWSMA.
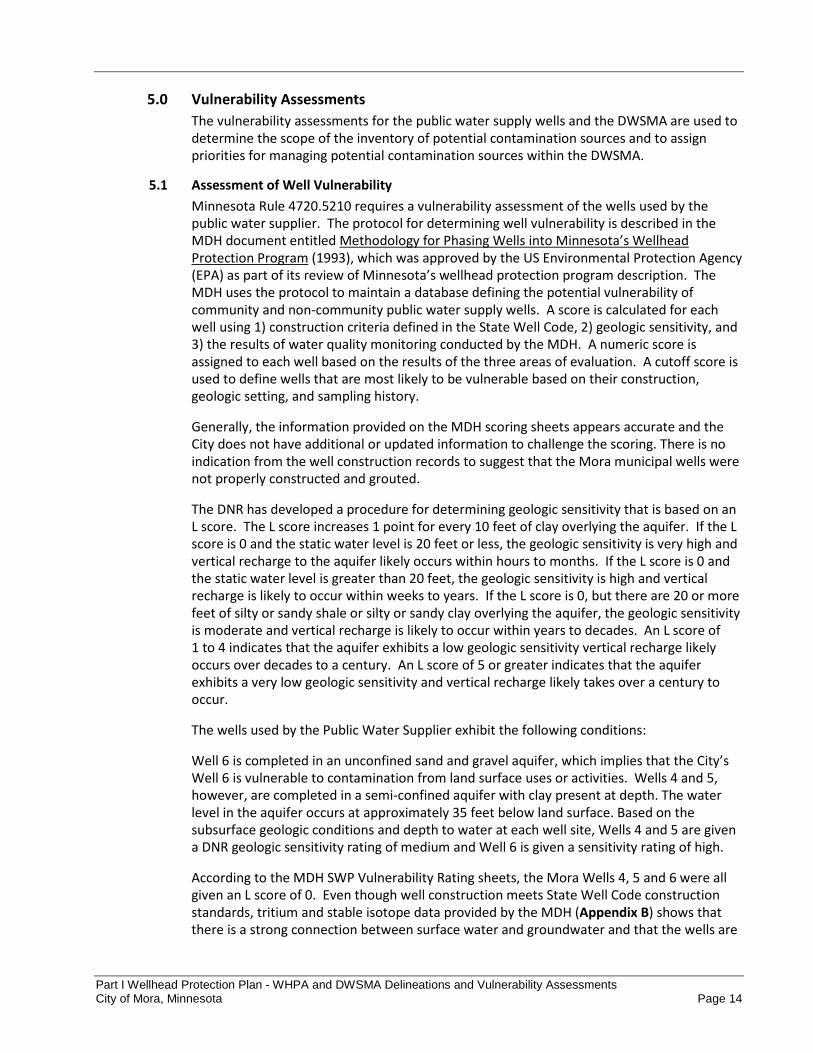
5.1 Assessment of Well Vulnerability Minnesota Rule 4720.5210 requires a vulnerability assessment of the wells used by the public water supplier. The protocol for determining well vulnerability is described in the MDH document entitled Methodology for Phasing Wells into Minnesota’s Wellhead Protection Program (1993), which was approved by the US Environmental Protection Agency (EPA) as part of its review of Minnesota’s wellhead protection program description. The MDH uses the protocol to maintain a database defining the potential vulnerability of community and non-community public water supply wells. A score is calculated for each well using 1) construction criteria defined in the State Well Code, 2) geologic sensitivity, and 3) the results of water quality monitoring conducted by the MDH. A numeric score is assigned to each well based on the results of the three areas of evaluation. A cutoff score is used to define wells that are most likely to be vulnerable based on their construction, geologic setting, and sampling history.
Generally, the information provided on the MDH scoring sheets appears accurate and the City does not have additional or updated information to challenge the scoring. There is no indication from the well construction records to suggest that the Mora municipal wells were not properly constructed and grouted.
The DNR has developed a procedure for determining geologic sensitivity that is based on an L score. The L score increases 1 point for every 10 feet of clay overlying the aquifer. If the L score is 0 and the static water level is 20 feet or less, the geologic sensitivity is very high and vertical recharge to the aquifer likely occurs within hours to months. If the L score is 0 and the static water level is greater than 20 feet, the geologic sensitivity is high and vertical recharge is likely to occur within weeks to years. If the L score is 0, but there are 20 or more feet of silty or sandy shale or silty or sandy clay overlying the aquifer, the geologic sensitivity is moderate and vertical recharge is likely to occur within years to decades. An L score of 1 to 4 indicates that the aquifer exhibits a low geologic sensitivity vertical recharge likely occurs over decades to a century. An L score of 5 or greater indicates that the aquifer exhibits a very low geologic sensitivity and vertical recharge likely takes over a century to occur.
The wells used by the Public Water Supplier exhibit the following conditions:
Well 6 is completed in an unconfined sand and gravel aquifer, which implies that the City’s Well 6 is vulnerable to contamination from land surface uses or activities. Wells 4 and 5, however, are completed in a semi-confined aquifer with clay present at depth. The water level in the aquifer occurs at approximately 35 feet below land surface. Based on the subsurface geologic conditions and depth to water at each well site, Wells 4 and 5 are given a DNR geologic sensitivity rating of medium and Well 6 is given a sensitivity rating of high.
According to the MDH SWP Vulnerability Rating sheets, the Mora Wells 4, 5 and 6 were all given an L score of 0. Even though well construction meets State Well Code construction standards, tritium and stable isotope data provided by the MDH (Appendix B) shows that there is a strong connection between surface water and groundwater and that the wells are
Part I Wellhead Protection Plan - WHPA and DWSMA Delineations and Vulnerability Assessments City of Mora, Minnesota Page 15
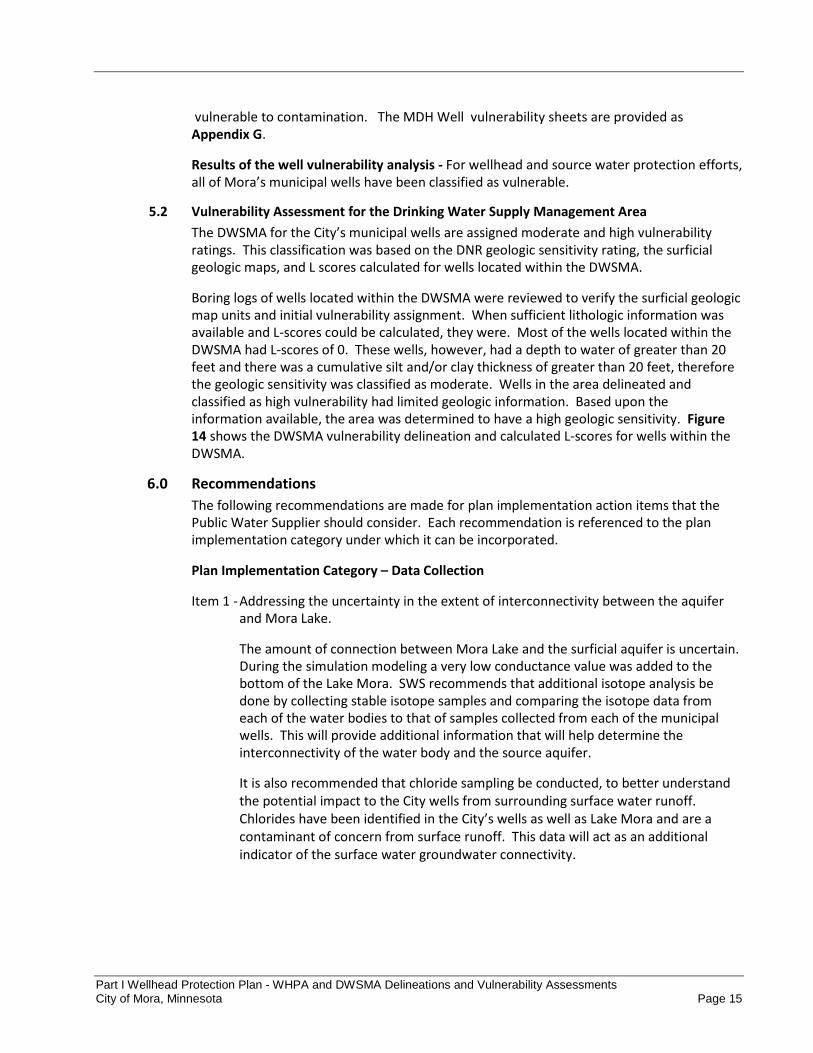
vulnerable to contamination. The MDH Well vulnerability sheets are provided as Appendix G.
Results of the well vulnerability analysis - For wellhead and source water protection efforts, all of Mora’s municipal wells have been classified as vulnerable.
5.2 Vulnerability Assessment for the Drinking Water Supply Management Area The DWSMA for the City’s municipal wells are assigned moderate and high vulnerability ratings. This classification was based on the DNR geologic sensitivity rating, the surficial geologic maps, and L scores calculated for wells located within the DWSMA.
Boring logs of wells located within the DWSMA were reviewed to verify the surficial geologic map units and initial vulnerability assignment. When sufficient lithologic information was available and L-scores could be calculated, they were. Most of the wells located within the DWSMA had L-scores of 0. These wells, however, had a depth to water of greater than 20 feet and there was a cumulative silt and/or clay thickness of greater than 20 feet, therefore the geologic sensitivity was classified as moderate. Wells in the area delineated and classified as high vulnerability had limited geologic information. Based upon the information available, the area was determined to have a high geologic sensitivity. Figure 14 shows the DWSMA vulnerability delineation and calculated L-scores for wells within the DWSMA.
6.0 Recommendations The following recommendations are made for plan implementation action items that the Public Water Supplier should consider. Each recommendation is referenced to the plan implementation category under which it can be incorporated.
Plan Implementation Category – Data Collection
Item 1 - Addressing the uncertainty in the extent of interconnectivity between the aquifer and Mora Lake.
The amount of connection between Mora Lake and the surficial aquifer is uncertain. During the simulation modeling a very low conductance value was added to the bottom of the Lake Mora. SWS recommends that additional isotope analysis be done by collecting stable isotope samples and comparing the isotope data from each of the water bodies to that of samples collected from each of the municipal wells. This will provide additional information that will help determine the interconnectivity of the water body and the source aquifer.
It is also recommended that chloride sampling be conducted, to better understand the potential impact to the City wells from surrounding surface water runoff. Chlorides have been identified in the City’s wells as well as Lake Mora and are a contaminant of concern from surface runoff. This data will act as an additional indicator of the surface water groundwater connectivity.
Part I Wellhead Protection Plan - WHPA and DWSMA Delineations and Vulnerability Assessments City of Mora, Minnesota Page 16
Plan Implementation Category – Contingency Planning
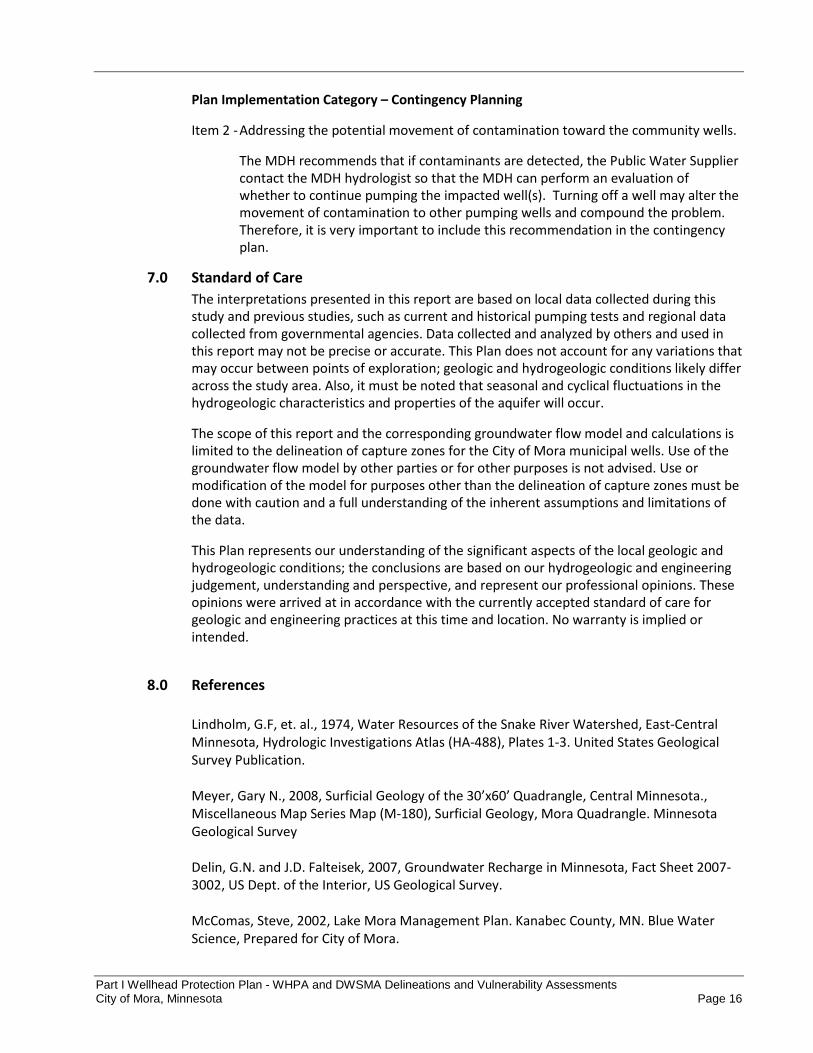
Item 2 - Addressing the potential movement of contamination toward the community wells.
The MDH recommends that if contaminants are detected, the Public Water Supplier contact the MDH hydrologist so that the MDH can perform an evaluation of whether to continue pumping the impacted well(s). Turning off a well may alter the movement of contamination to other pumping wells and compound the problem. Therefore, it is very important to include this recommendation in the contingency plan.
7.0 Standard of Care The interpretations presented in this report are based on local data collected during this study and previous studies, such as current and historical pumping tests and regional data collected from governmental agencies. Data collected and analyzed by others and used in this report may not be precise or accurate. This Plan does not account for any variations that may occur between points of exploration; geologic and hydrogeologic conditions likely differ across the study area. Also, it must be noted that seasonal and cyclical fluctuations in the hydrogeologic characteristics and properties of the aquifer will occur.
The scope of this report and the corresponding groundwater flow model and calculations is limited to the delineation of capture zones for the City of Mora municipal wells. Use of the groundwater flow model by other parties or for other purposes is not advised. Use or modification of the model for purposes other than the delineation of capture zones must be done with caution and a full understanding of the inherent assumptions and limitations of the data.
This Plan represents our understanding of the significant aspects of the local geologic and hydrogeologic conditions; the conclusions are based on our hydrogeologic and engineering judgement, understanding and perspective, and represent our professional opinions. These opinions were arrived at in accordance with the currently accepted standard of care for geologic and engineering practices at this time and location. No warranty is implied or intended.
8.0 References
Lindholm, G.F, et. al., 1974, Water Resources of the Snake River Watershed, East-Central Minnesota, Hydrologic Investigations Atlas (HA-488), Plates 1-3. United States Geological Survey Publication. Meyer, Gary N., 2008, Surficial Geology of the 30’x60’ Quadrangle, Central Minnesota., Miscellaneous Map Series Map (M-180), Surficial Geology, Mora Quadrangle. Minnesota Geological Survey Delin, G.N. and J.D. Falteisek, 2007, Groundwater Recharge in Minnesota, Fact Sheet 2007-3002, US Dept. of the Interior, US Geological Survey. McComas, Steve, 2002, Lake Mora Management Plan. Kanabec County, MN. Blue Water Science, Prepared for City of Mora.
Part I Wellhead Protection Plan - WHPA and DWSMA Delineations and Vulnerability Assessments City of Mora, Minnesota Page 17
McComas, Steve, 2002, Lake Mora Management Plan. Kanabec County, MN. Blue Water Science, Prepared for City of Mora. USGS, 2006, NLCD 2006 Land Cover, Edition 1.0, Remote Sensing Image, United States Geological Survey, Sioux Falls, SD. USDA, 2009, Soil Survey Geographic (SSURGO) Database for Kanabec County, MN, U.S. Department of Agriculture, Natural Resources Conservation Service. MN Climatology Working Group for Mora station (State Climatology Office - DNR Waters, phone: 651-296-4214, web: http://climate.umn.edu)
List of Tables
Table 1 – Municipal Well Details
Table 2 – Municipal Well Production and Use
Table 3 – Local and Regional High Capacity Wells
Table 4 – Precipitation Data
Table 5 – Regional Aquifer Pumping Test Results – Sand and Gravel
Table 6 – Groundwater Flow Model Parameters
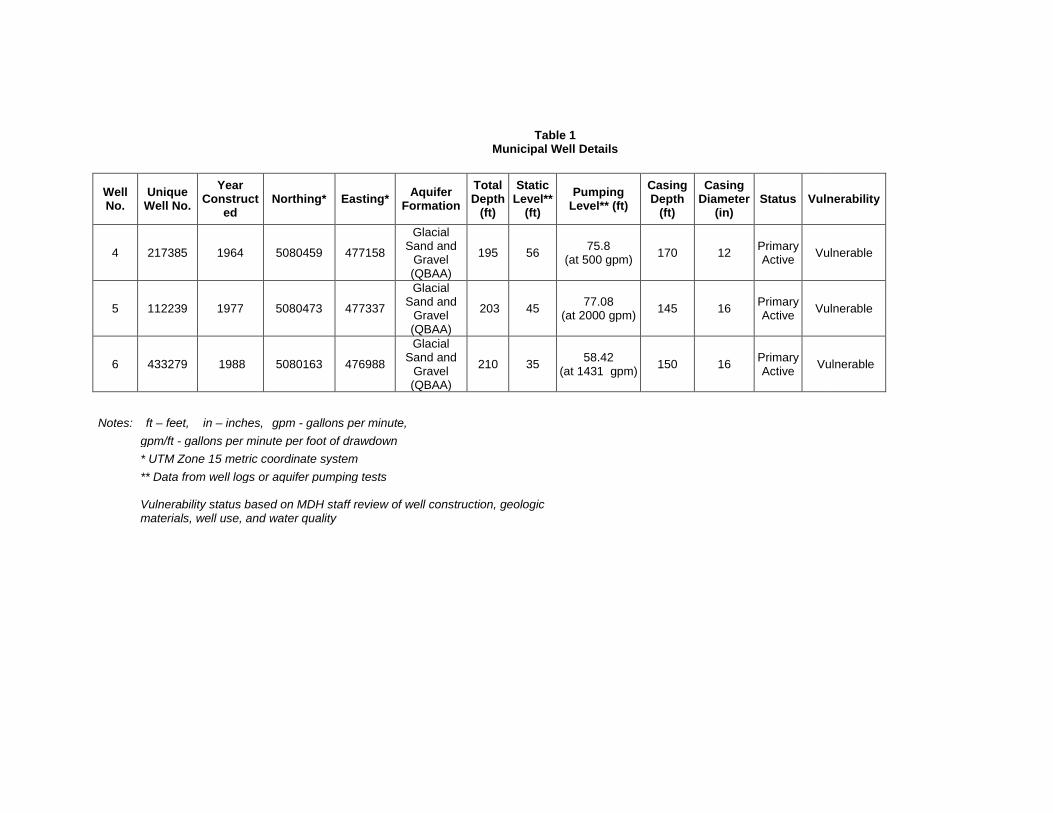
Table 1 Municipal Well Details
Well No.
Unique Well No.
Year Construct
ed Northing* Easting* Aquifer
Formation Total Depth
(ft)
Static Level**
(ft) Pumping
Level** (ft) Casing Depth
(ft)
Casing Diameter
(in) Status Vulnerability
4 217385 1964 5080459 477158
Glacial Sand and
Gravel (QBAA)
195 56 75.8 (at 500 gpm) 170 12 Primary
Active Vulnerable
5 112239 1977 5080473 477337
Glacial Sand and
Gravel (QBAA)
203 45 77.08 (at 2000 gpm) 145 16 Primary
Active Vulnerable
6 433279 1988 5080163 476988
Glacial Sand and
Gravel (QBAA)
210 35 58.42 (at 1431 gpm) 150 16 Primary
Active Vulnerable
Notes: ft – feet, in – inches, gpm - gallons per minute,
gpm/ft - gallons per minute per foot of drawdown * UTM Zone 15 metric coordinate system ** Data from well logs or aquifer pumping tests
Vulnerability status based on MDH staff review of well construction, geologic materials, well use, and water quality
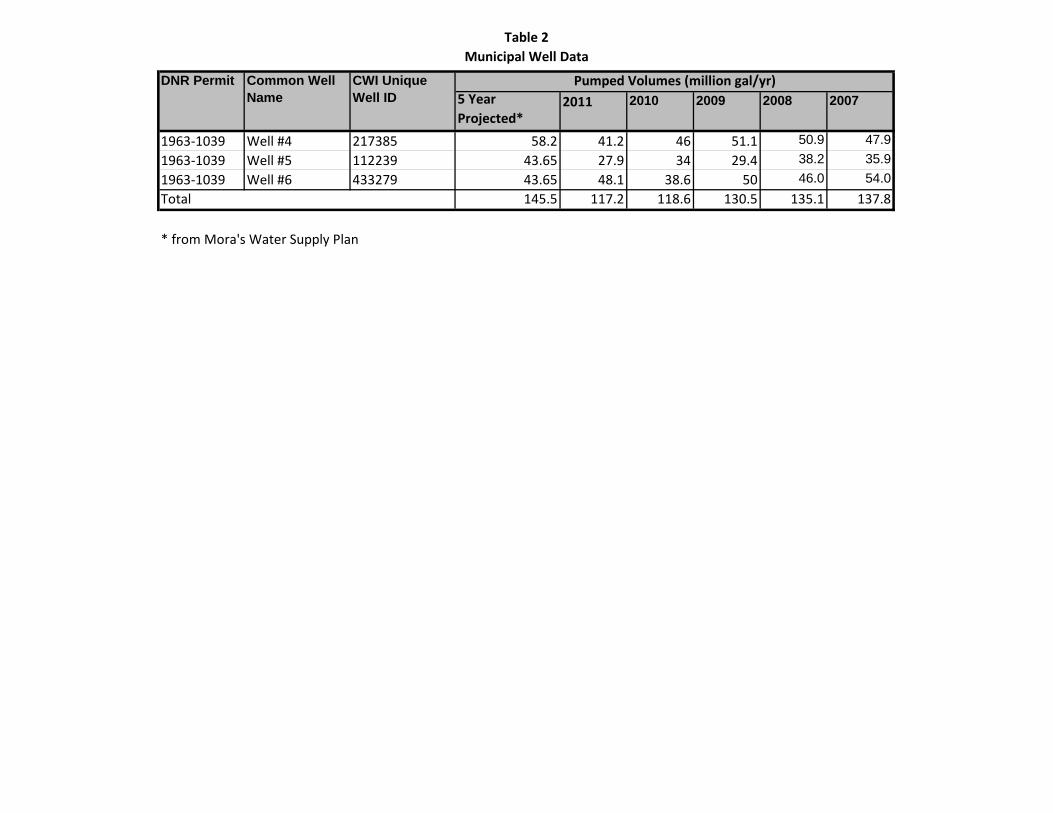
Table 2Municipal Well Data
5 Year Projected*
2011 2010 2009 2008 2007
1963-1039 Well #4 217385 58.2 41.2 46 51.1 50.9 47.91963-1039 Well #5 112239 43.65 27.9 34 29.4 38.2 35.91963-1039 Well #6 433279 43.65 48.1 38.6 50 46.0 54.0
145.5 117.2 118.6 130.5 135.1 137.8
* from Mora's Water Supply Plan
CWI Unique Well ID
Common Well Name
DNR Permit
Total
Pumped Volumes (million gal/yr)
FactilityDNR Permit
No.
Unique Well
No. Northing Easting Aquifer Use
Permitted
Volume
(MGY)
2009
Usage
(MGY)
2008
Usage
(MGY)
2007
Usage
(MGY)
2006
Usage
(MGY)
Discharge Used in
Model (m3/day)
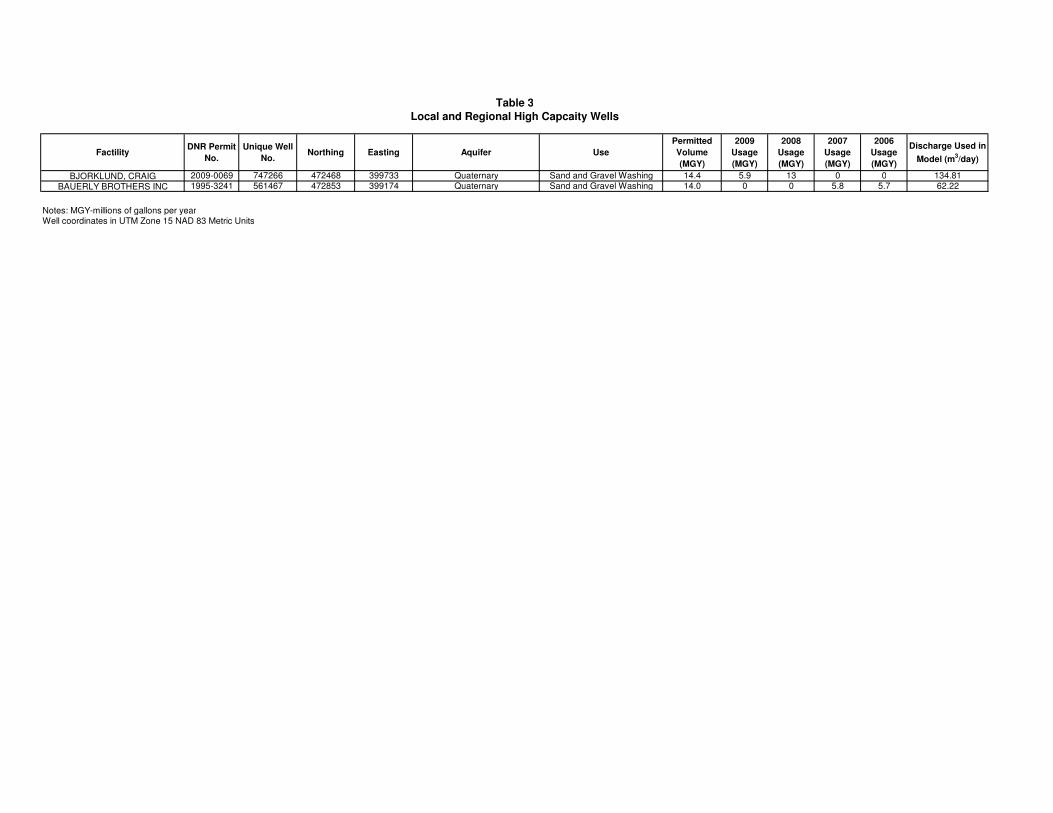
BJORKLUND, CRAIG 2009-0069 747266 472468 399733 Quaternary Sand and Gravel Washing 14.4 5.9 13 0 0 134.81
BAUERLY BROTHERS INC 1995-3241 561467 472853 399174 Quaternary Sand and Gravel Washing 14.0 0 0 5.8 5.7 62.22
Notes: MGY-millions of gallons per yearWell coordinates in UTM Zone 15 NAD 83 Metric Units
Local and Regional High Capcaity Wells
Table 3
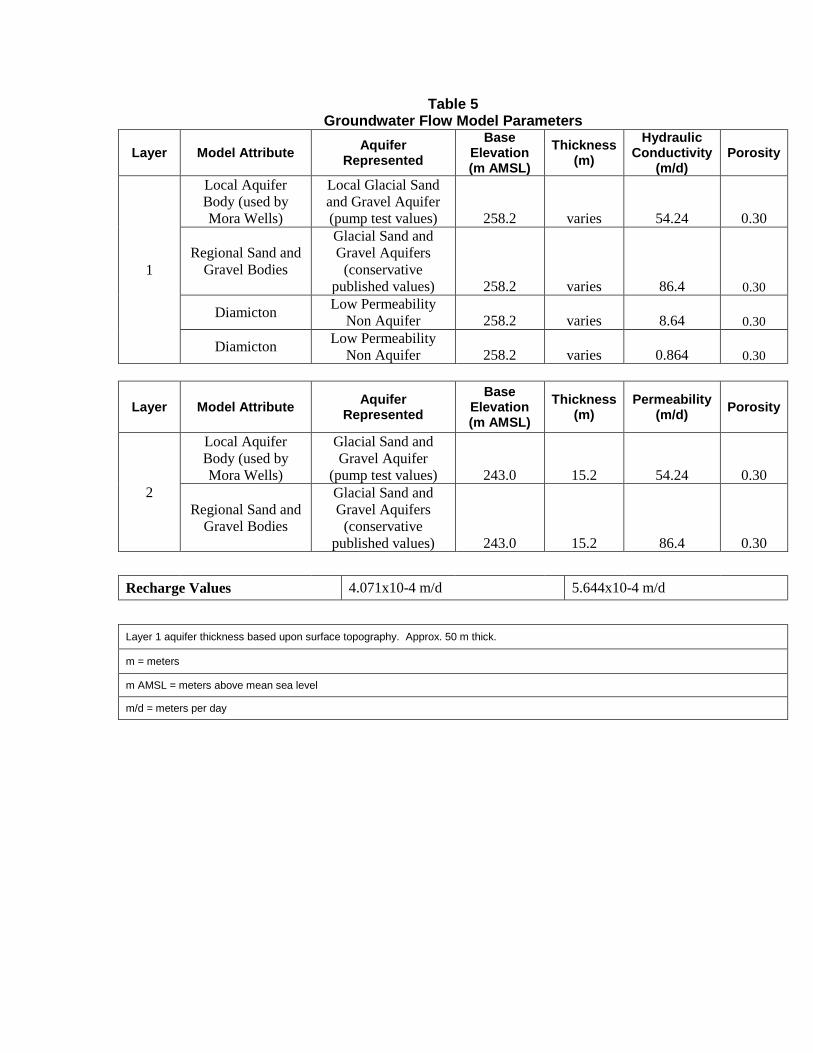
Table 5 Groundwater Flow Model Parameters
Layer Model Attribute Aquifer Represented
Base Elevation (m AMSL)
Thickness (m)
Hydraulic Conductivity
(m/d) Porosity
1
Local Aquifer Body (used by Mora Wells)
Local Glacial Sand and Gravel Aquifer (pump test values) 258.2 varies 54.24 0.30
Regional Sand and Gravel Bodies
Glacial Sand and Gravel Aquifers
(conservative published values) 258.2 varies 86.4 0.30
Diamicton Low Permeability Non Aquifer 258.2 varies 8.64 0.30
Diamicton Low Permeability Non Aquifer 258.2 varies 0.864 0.30
Layer Model Attribute Aquifer Represented
Base Elevation (m AMSL)
Thickness (m)
Permeability (m/d) Porosity
2
Local Aquifer Body (used by Mora Wells)
Glacial Sand and Gravel Aquifer
(pump test values) 243.0 15.2 54.24 0.30
Regional Sand and Gravel Bodies
Glacial Sand and Gravel Aquifers
(conservative published values) 243.0 15.2 86.4 0.30
Recharge Values 4.071x10⁻⁴ m/d 5.644x10⁻⁴ m/d
Layer 1 aquifer thickness based upon surface topography. Approx. 50 m thick.
m = meters
m AMSL = meters above mean sea level
m/d = meters per day
List of Figures
Figure 1 – Mora Wellhead Protection Area
Figure 2 – Mora DWSMA
Figure 3 – Surficial Geology
Figure 4 – Bedrock Geology
Figure 5 – Land Cover and Water Resources
Figure 6 – SSURGO Soils
Figure 7 – Model Boundary Conditions
Figure 8 – Recharge Zones
Figure 9 – Layer 1 Hydraulic Conductivity
Figure 10 – Layer 2 Hydraulic Conductivity
Figure 11 – Modeled Head (2 Meter Contours)
Figure 12 – Modeled Head and Pathlines
Figure 13 – DWSMA Vulnerability
!(
!(
!(MORA 4
MORA 6
MORA 5
®213 4th St. E, Suite 418, St. Paul, MN 55101
Phone: (612) 354-2549www.sourcewater-solutons . com
Mora WellheadProtection AreaMora WellheadProtection Plan
Figure 1Legend!( Municipal Wells
Inner Wellhead Management Zone (IWMZ)Emergency Response Area (ERA)WHPA
10-Year Capture ZoneStorm Water Catchment AreaSurface Water Contribution Area
0 250 500 750125Meters
!(
!(
!(
Mora
Arthur
Comfort
Knife Lake
ArthurArthur
Arthur
Whited
®213 4th St. E, Suite 418, St. Paul, MN 55101
Phone: (612) 354-2549www.sourcewater-solutons . com
DWSMAMora WellheadProtection Plan
Figure 2Legend!( Municipal Wells
Drinking Water Supply Management Area (DWSMA)
Inner Wellhead Management Zone (IWMZ)
Emergency Response Area (ERA)
WHPA
10 Year Capture Zone
Stormwater Catchment Area
Surface Water Contribution Area
Municipal Boundary
0 250 500 750 1,000125Meters
!(
!(
!(
®213 4th St. E, Suite 418, St. Paul, MN 55101
Phone: (612) 354-2549www.sourcewater-solutons . com
Surficial Geology
Mora WellheadProtection Plan
Figure 3LegendDiamictonOrganicRockSandUnspecifiedWater
!( Municipal WellsERAIWMZWHPA DWSMA
0 275 550 825137.5Meters Source: MGS M-180 Surficial
Geology of Mora Quadrangle
!(
!(
!(
®
213 4th St. E, Suite 418, St. Paul, MN 55101Phone: (612) 354-2549
www.sourcewater-solutons . com
BedrockGeology
Mora Wellhead Protection Plan
Figure 4Legend!( Municipal Wells
DWSMAERAIWMZ
WHPAFond du Lac FormationUpper Cambrian;Mt.Simon-JordanMafic Volc. & Felsic Intrusive
0 300 600 900150Meters
Source: MGS S-20 Bedrock Geology of MN
!(
!(
!(
®213 4th St. E, Suite 418, St. Paul, MN 55101
Phone: (612) 354-2549www.sourcewater-solutons . com
Water ResourcesMora WellheadProtection Plan
Figure 5Legend!( Municipal Wells
Drinking Water Supply Management Area (DWSMA)Lake Mora LakeshedStormwater Catchment AreaDitchesIntermittent StreamsPerennial StreamsRiverLakesLevel 8 Minor Watershed
WetlandsCLASS
Aquatic BedEmergentForestedScrub -ShrubUnconsolidated BottomUnconsolidated Shore
0 320 640 960 1,280160Meters
Surface Water Flow Direction
!(
!(
!(
213 4th St. E, Suite 418, St. Paul, MN 55101Phone: (612) 354-2549
www.sourcewater-solutons . com
Figure 6Land Cover
®
Source: NLCD 2006 Land Cover Database
0 400 800 1,200200Meters
Legend!( Municipal Wells
DWSMA
Land CoverBarren Land
Cultivated Crops
Deciduous Forest
Developed, High Intensity
Developed, Low Intensity
Developed, Medium Intensity
Developed, Open Space
Emergent Herbaceuous Wetlands
Evergreen Forest
Hay/Pasture
Herbaceuous
Mixed Forest
Open Water
Perennial Snow/Ice
Shrub/Scrub
Unclassified
Woody Wetlands
MORA 4
MORA 6
MORA 5
213 4th St. E, Suite 418, St. Paul, MN 55101Phone: (612) 354-2549
www.sourcewater-solutons . com
Figure 7Soils
SSURGO
®Source: USDA NRCS SSURGO Database
0 125 250 37562.5Meters
LegendMunicipal WellsDWSMA
SoilsComplex Name
AftadAlbanAnnriverAntigoBillyboyBowstringBrennyvilleBricktonCathroCebanaDalboFenanderFluvaquentsFoglakeGrasstonGraycalmGreenwoodHaybrookHulliganLenrootLewis lakeLongsidingMahtomediMeehanMilacaMinocquaMoraOesterleOssmerPitsPloverPomroyRosholtScott LakeSeelyevilleUdifluventsUdipsammentsUdorthentsWaterWurtsmith
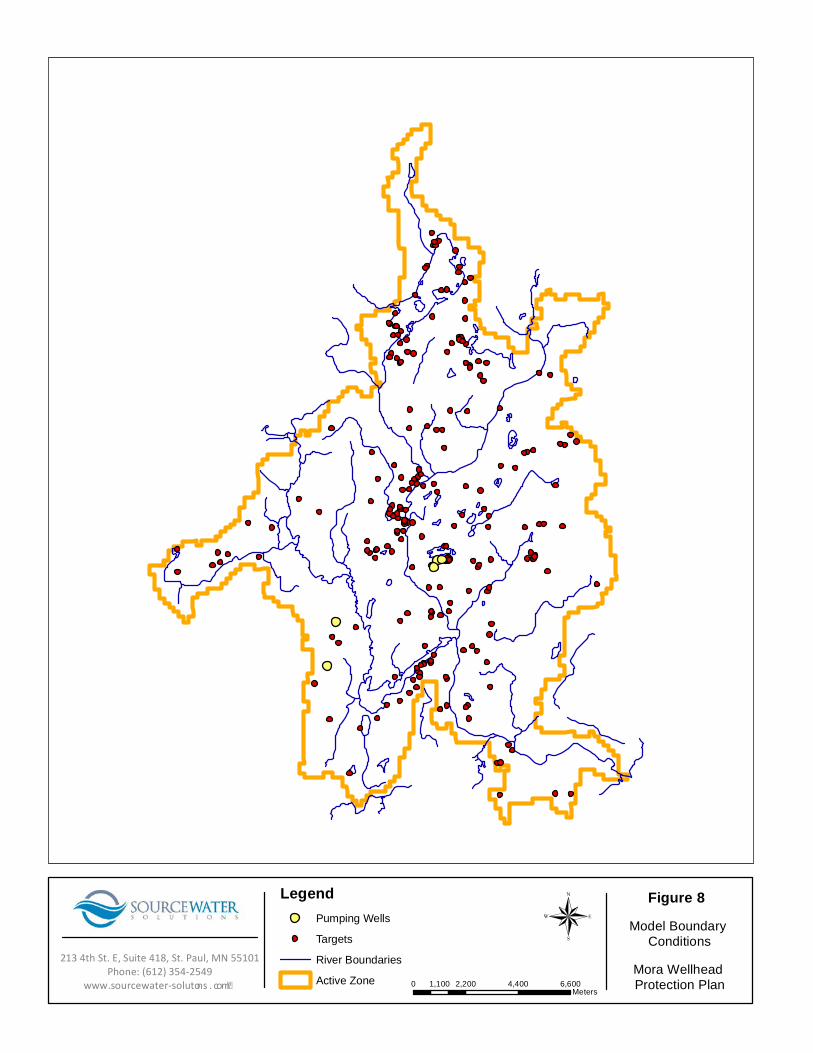
®Figure 8
Model Boundary Conditions
Mora Wellhead Protection Plan
213 4th St. E, Suite 418, St. Paul, MN 55101Phone: (612) 354-2549
www.sourcewater-solutons . com
LegendPumping Wells
Targets
River Boundaries
Active Zone 0 2,200 4,400 6,6001,100Meters
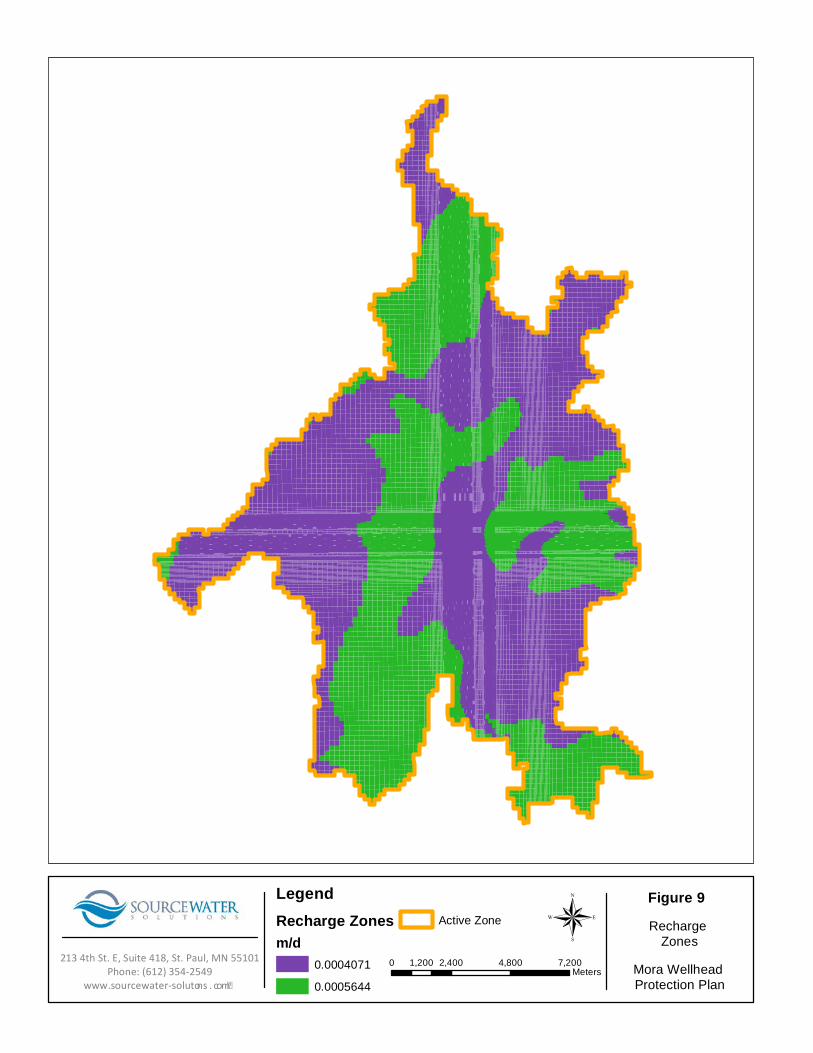
®Figure 9Recharge
Zones
Mora Wellhead Protection Plan
213 4th St. E, Suite 418, St. Paul, MN 55101Phone: (612) 354-2549
www.sourcewater-solutons . com
LegendRecharge Zonesm/d
0.0004071
0.0005644
Active Zone
0 2,400 4,800 7,2001,200Meters
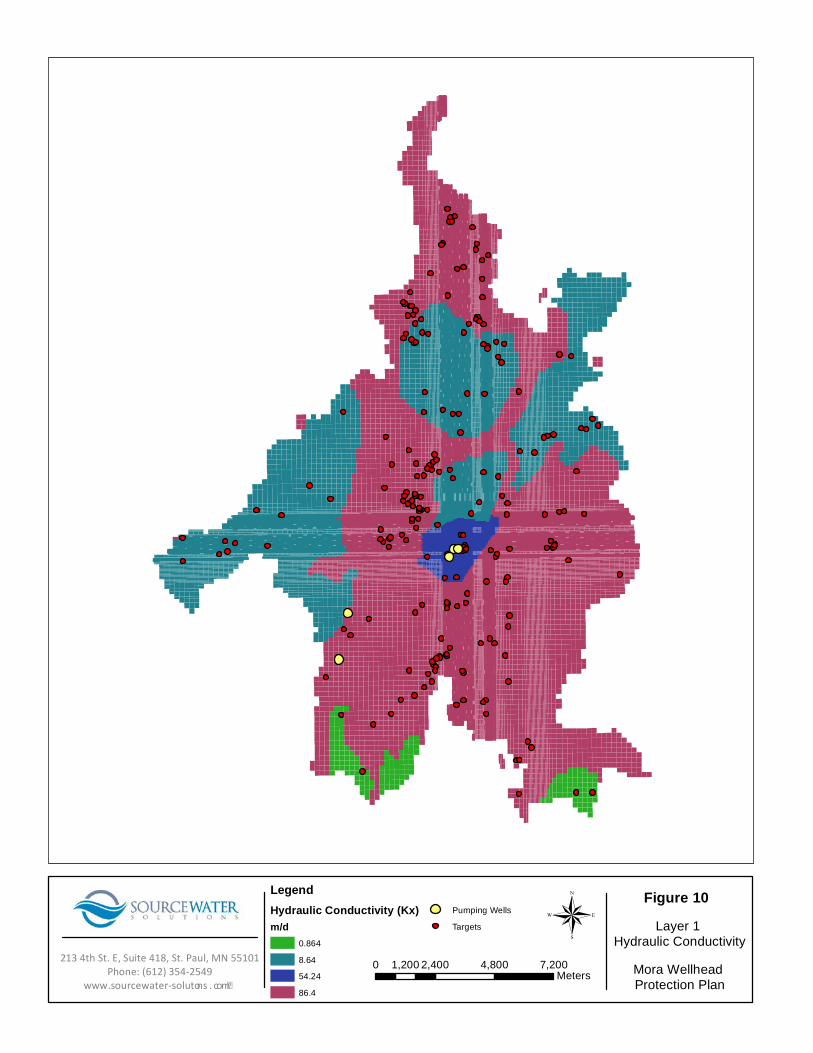
®Figure 10
Layer 1 Hydraulic Conductivity
Mora Wellhead Protection Plan
213 4th St. E, Suite 418, St. Paul, MN 55101Phone: (612) 354-2549
www.sourcewater-solutons . com
LegendHydraulic Conductivity (Kx)m/d
0.864
8.64
54.24
86.4
Pumping Wells
Targets
0 2,400 4,800 7,2001,200Meters
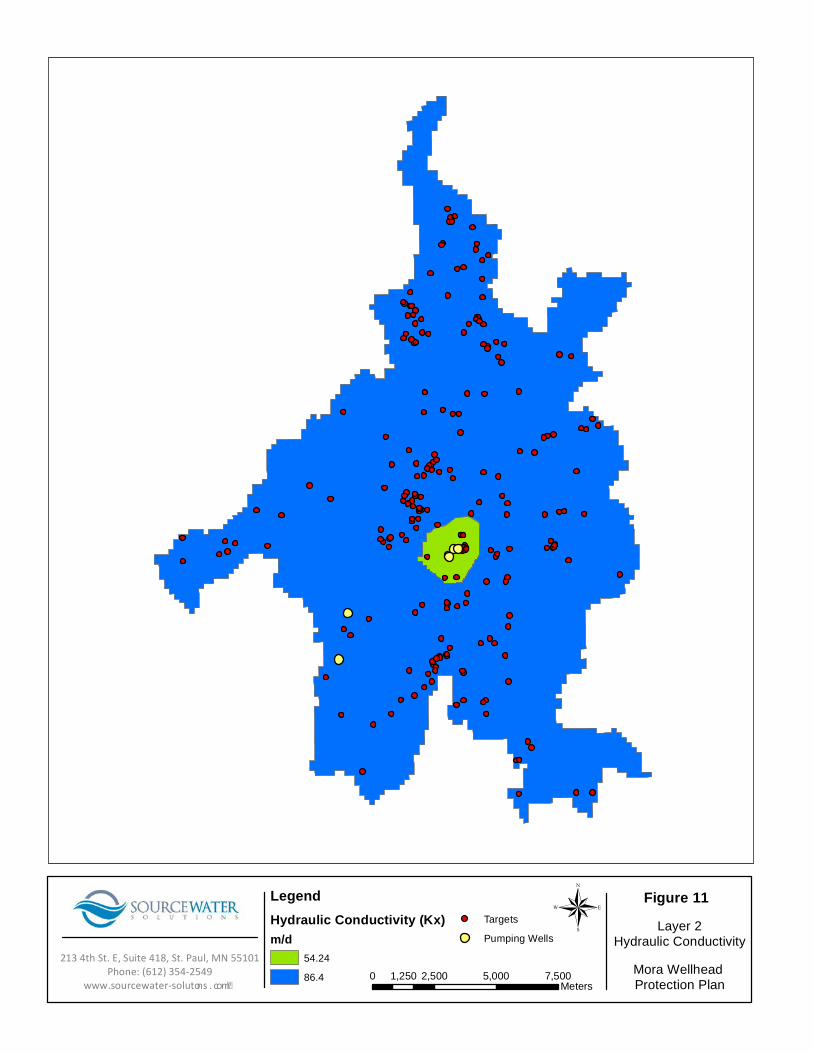
® Figure 11Layer 2
Hydraulic Conductivity
Mora Wellhead Protection Plan
213 4th St. E, Suite 418, St. Paul, MN 55101Phone: (612) 354-2549
www.sourcewater-solutons . com
LegendHydraulic Conductivity (Kx)m/d
54.24
86.4
Targets
Pumping Wells
0 2,500 5,000 7,5001,250Meters

297
299
301
295
305
303
291
293
307309
307
305299
297295
293
307
29129
3
293
293
301
307
301
305
293
303
303
297
301
293
307
MORA 4
MORA 6
MORA 5
® Figure 12Modeled Head and Pathlines
Mora Wellhead Protection Plan
213 4th St. E, Suite 418, St. Paul, MN 55101Phone: (612) 354-2549
www.sourcewater-solutons . com
LegendMunicipal Wells1 Year Pathlines10 Year PathlinesModeled Head (m)River Boundaries
Residual Head (m)-18.2 - -7.0-6.9 - -3.0
-2.9 - 3.03.1 - 7.07.1 - 12.5
0 400 800 1,200200Meters
297
299
301
295
305
303
291
293
307309
307
305299
297295
293
307
29129
3
293
293
301
307
301
305
293
303
303
297
301
293
307
MORA 4
MORA 6
MORA 5
® Figure 13Modeled Head and Pathlines
Mora Wellhead Protection Plan
213 4th St. E, Suite 418, St. Paul, MN 55101Phone: (612) 354-2549
www.sourcewater-solutons . com
LegendMunicipal Wells1 Year Pathlines10 Year PathlinesModeled Head (m)River Boundaries
Residual Head (m)-18.2 - -7.0-6.9 - -3.0
-2.9 - 3.03.1 - 7.07.1 - 12.5
0 400 800 1,200200Meters
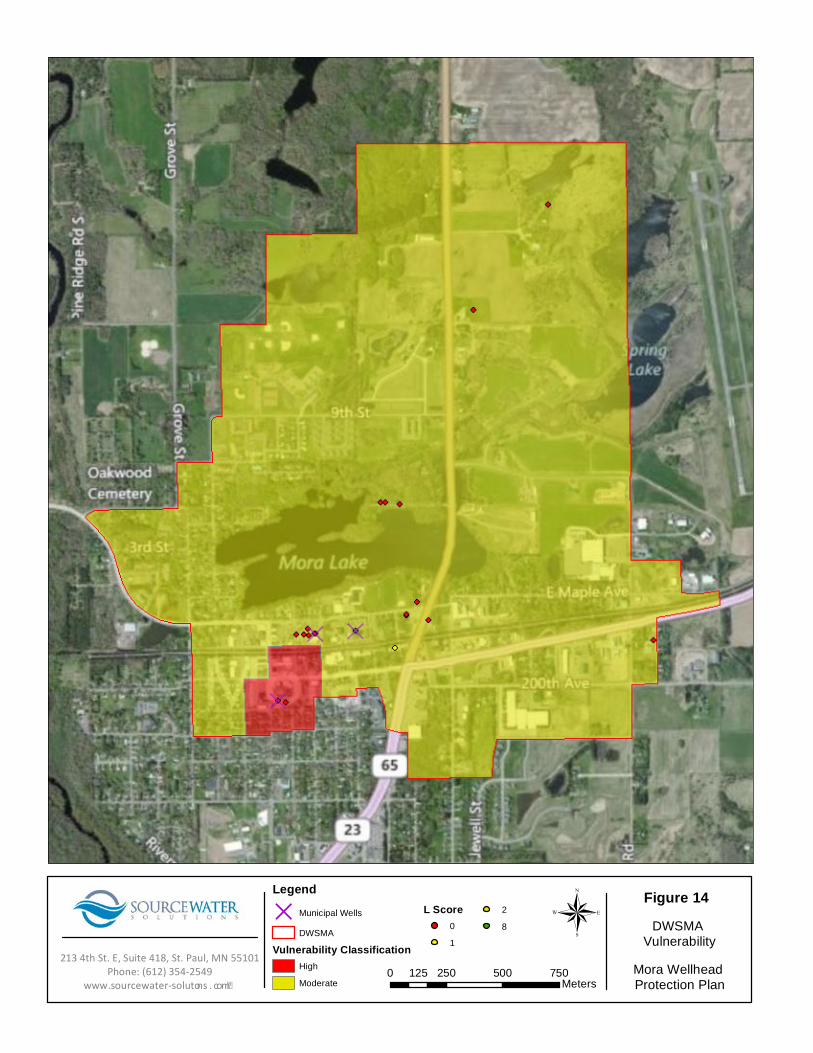
®Figure 14
DWSMA Vulnerability
Mora Wellhead Protection Plan
213 4th St. E, Suite 418, St. Paul, MN 55101Phone: (612) 354-2549
www.sourcewater-solutons . com
LegendD Municipal Wells
DWSMA
Vulnerability ClassificationHigh
Moderate
L Score0
1
2
8
0 250 500 750125Meters
Appendix A
MDH Scoping 1 Decision Notice
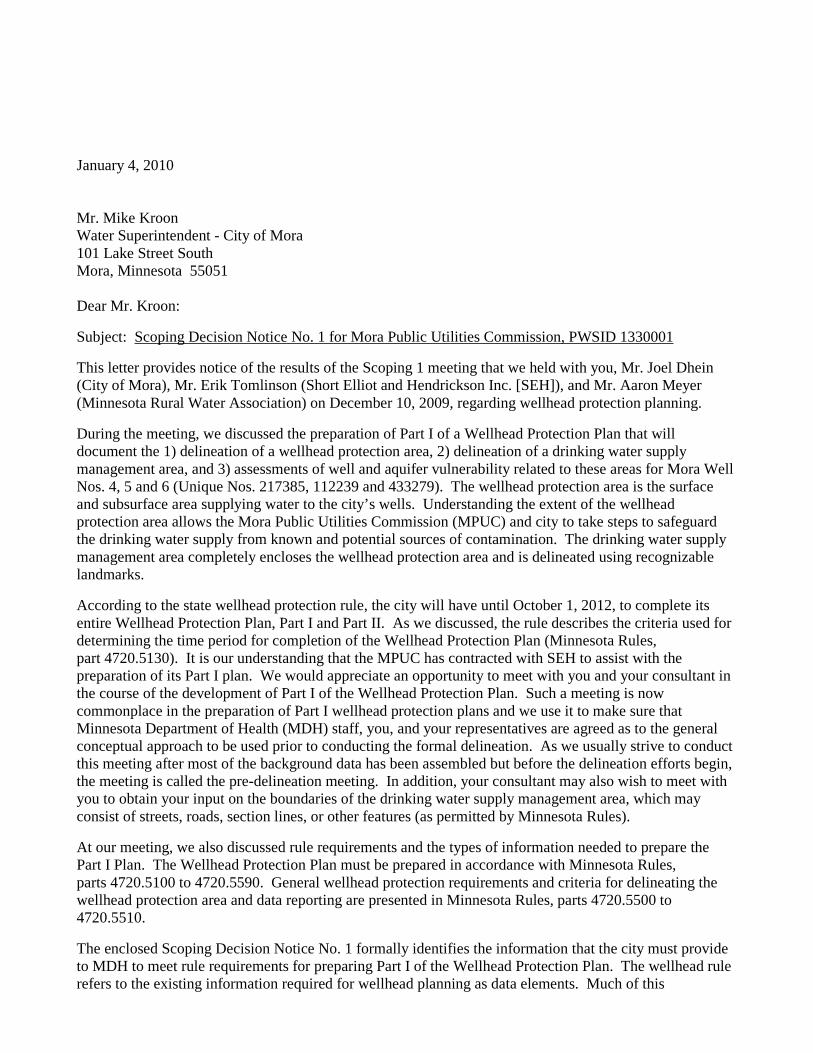
January 4, 2010 Mr. Mike Kroon Water Superintendent - City of Mora 101 Lake Street South Mora, Minnesota 55051 Dear Mr. Kroon:
Subject: Scoping Decision Notice No. 1 for Mora Public Utilities Commission, PWSID 1330001
This letter provides notice of the results of the Scoping 1 meeting that we held with you, Mr. Joel Dhein (City of Mora), Mr. Erik Tomlinson (Short Elliot and Hendrickson Inc. [SEH]), and Mr. Aaron Meyer (Minnesota Rural Water Association) on December 10, 2009, regarding wellhead protection planning.
During the meeting, we discussed the preparation of Part I of a Wellhead Protection Plan that will document the 1) delineation of a wellhead protection area, 2) delineation of a drinking water supply management area, and 3) assessments of well and aquifer vulnerability related to these areas for Mora Well Nos. 4, 5 and 6 (Unique Nos. 217385, 112239 and 433279). The wellhead protection area is the surface and subsurface area supplying water to the city’s wells. Understanding the extent of the wellhead protection area allows the Mora Public Utilities Commission (MPUC) and city to take steps to safeguard the drinking water supply from known and potential sources of contamination. The drinking water supply management area completely encloses the wellhead protection area and is delineated using recognizable landmarks.
According to the state wellhead protection rule, the city will have until October 1, 2012, to complete its entire Wellhead Protection Plan, Part I and Part II. As we discussed, the rule describes the criteria used for determining the time period for completion of the Wellhead Protection Plan (Minnesota Rules, part 4720.5130). It is our understanding that the MPUC has contracted with SEH to assist with the preparation of its Part I plan. We would appreciate an opportunity to meet with you and your consultant in the course of the development of Part I of the Wellhead Protection Plan. Such a meeting is now commonplace in the preparation of Part I wellhead protection plans and we use it to make sure that Minnesota Department of Health (MDH) staff, you, and your representatives are agreed as to the general conceptual approach to be used prior to conducting the formal delineation. As we usually strive to conduct this meeting after most of the background data has been assembled but before the delineation efforts begin, the meeting is called the pre-delineation meeting. In addition, your consultant may also wish to meet with you to obtain your input on the boundaries of the drinking water supply management area, which may consist of streets, roads, section lines, or other features (as permitted by Minnesota Rules).
At our meeting, we also discussed rule requirements and the types of information needed to prepare the Part I Plan. The Wellhead Protection Plan must be prepared in accordance with Minnesota Rules, parts 4720.5100 to 4720.5590. General wellhead protection requirements and criteria for delineating the wellhead protection area and data reporting are presented in Minnesota Rules, parts 4720.5500 to 4720.5510.
The enclosed Scoping Decision Notice No. 1 formally identifies the information that the city must provide to MDH to meet rule requirements for preparing Part I of the Wellhead Protection Plan. The wellhead rule refers to the existing information required for wellhead planning as data elements. Much of this
Mr. Mike Kroon Page 2 January 4, 2010 information is available in the public domain, as described in the Scoping Decision Notice No. 1 form. You only need to provide the information that is not in the public domain and, therefore, not available to MDH. The Scoping Decision Notice No. 1 form also 1) lists the Minnesota unique well number and well construction for each well that will be included in the Wellhead Protection Plan [Table 1], 2) lists the pumping volumes for each well [Table 2], and 3) includes a map of the well locations. A summary of the information that the city needs to provide is included at the end of the Scoping Decision Notice No.1 form.
Of particular importance to this project is any information regarding well re-construction and aquifer testing at your public wells. During our meeting, staff recalled production tests and capacity tests that were likely performed at the wells by various well contractors over the years. This type of information will be useful for characterizing aquifer parameters when delineating the wellhead protection areas. In addition, staff recalled a 2002 Lake Mora study that assessed hydraulic interactions between the lake and the groundwater aquifer serving your wells, as well as other studies that involved potential groundwater contamination issues. Information from these studies should also be assessed as part of this project.
Finally, it is our understanding that you will serve officially as the wellhead protection manager on behalf of the city. You are responsible for providing written notice to local units of government of the city's intent to develop the wellhead protection plan, as required by the wellhead protection rule (part 4720.5300, subpart 3). A copy of this notice should be forwarded to MDH and must include a list of the MPUC wells, their unique well numbers, and contact information for the Wellhead Protection Plan Manager. Mr. Aaron Meyer, Minnesota Rural Water Association, provided you with a template notification of intent letter and work plan during our meeting. If you would like additional examples or need assistance with this letter, please contact either Mr. Meyer at 320/808-7293 or me.
In closing, we look forward to working with you on completion of your Wellhead Protection Plan. If you have any questions regarding our comments, please contact me at 651/201-4691 or [email protected].
Sincerely, Gail Haglund, Hydrologist Source Water Protection Unit Environmental Health Division P.O. Box 64975 St. Paul, Minnesota 55164-0975
GLH:kmc Enclosures: Scoping Decision Notice No. 1, Summary of Data Requested, Map of Well Locations
Table 1 - Public Water Supply Well Information, Table 2 - Annual Volume of Water Pumped From City Wells, Table 3 - Permitted High-Capacity Wells
cc: Joel Dhein, Manager, City of Mora Aaron Meyer, Minnesota Rural Water Association Art Persons, MDH Planner Supervisor, Rochester District Office
bcc: Stephen C. Thompson, Water Monitoring Section, Minnesota Pollution Control Agency Laurel Reeves, Division of Waters, Minnesota Department of Natural Resources Brian Williams, Pesticide & Fertilizer Mgmt. Division, Minnesota Department of Agriculture Eric Mohring, Hydrologist, Board of Water and Soil Resources
1
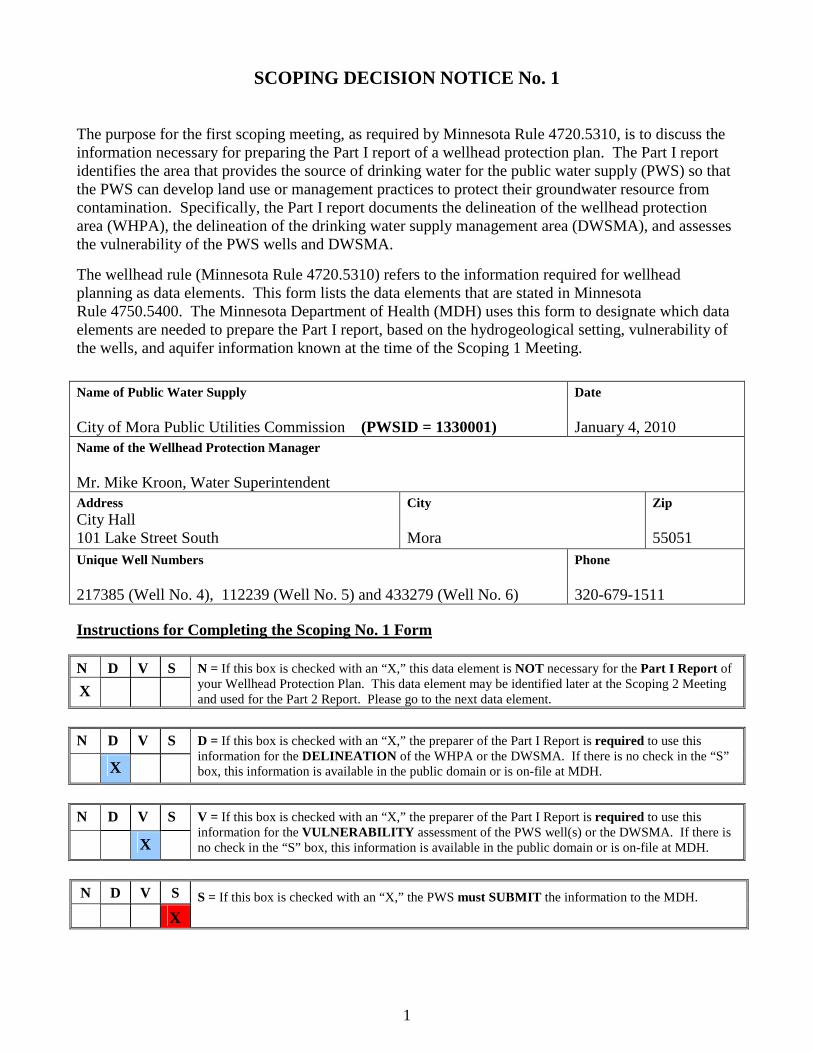
SCOPING DECISION NOTICE No. 1 The purpose for the first scoping meeting, as required by Minnesota Rule 4720.5310, is to discuss the information necessary for preparing the Part I report of a wellhead protection plan. The Part I report identifies the area that provides the source of drinking water for the public water supply (PWS) so that the PWS can develop land use or management practices to protect their groundwater resource from contamination. Specifically, the Part I report documents the delineation of the wellhead protection area (WHPA), the delineation of the drinking water supply management area (DWSMA), and assesses the vulnerability of the PWS wells and DWSMA.
The wellhead rule (Minnesota Rule 4720.5310) refers to the information required for wellhead planning as data elements. This form lists the data elements that are stated in Minnesota Rule 4750.5400. The Minnesota Department of Health (MDH) uses this form to designate which data elements are needed to prepare the Part I report, based on the hydrogeological setting, vulnerability of the wells, and aquifer information known at the time of the Scoping 1 Meeting.
Name of Public Water Supply City of Mora Public Utilities Commission (PWSID = 1330001)
Date January 4, 2010
Name of the Wellhead Protection Manager Mr. Mike Kroon, Water Superintendent Address City Hall 101 Lake Street South
City Mora
Zip 55051
Unique Well Numbers 217385 (Well No. 4), 112239 (Well No. 5) and 433279 (Well No. 6)
Phone 320-679-1511
Instructions for Completing the Scoping No. 1 Form
N D V S
X
N = If this box is checked with an “X,” this data element is NOT necessary for the Part I Report of your Wellhead Protection Plan. This data element may be identified later at the Scoping 2 Meeting and used for the Part 2 Report. Please go to the next data element.
N D V S
X
D = If this box is checked with an “X,” the preparer of the Part I Report is required to use this information for the DELINEATION of the WHPA or the DWSMA. If there is no check in the “S” box, this information is available in the public domain or is on-file at MDH.
N D V S
X
V = If this box is checked with an “X,” the preparer of the Part I Report is required to use this information for the VULNERABILITY assessment of the PWS well(s) or the DWSMA. If there is no check in the “S” box, this information is available in the public domain or is on-file at MDH.
N D V S
X S = If this box is checked with an “X,” the PWS must SUBMIT the information to the MDH.
2
DATA ELEMENTS ABOUT THE PHYSICAL ENVIRONMENT
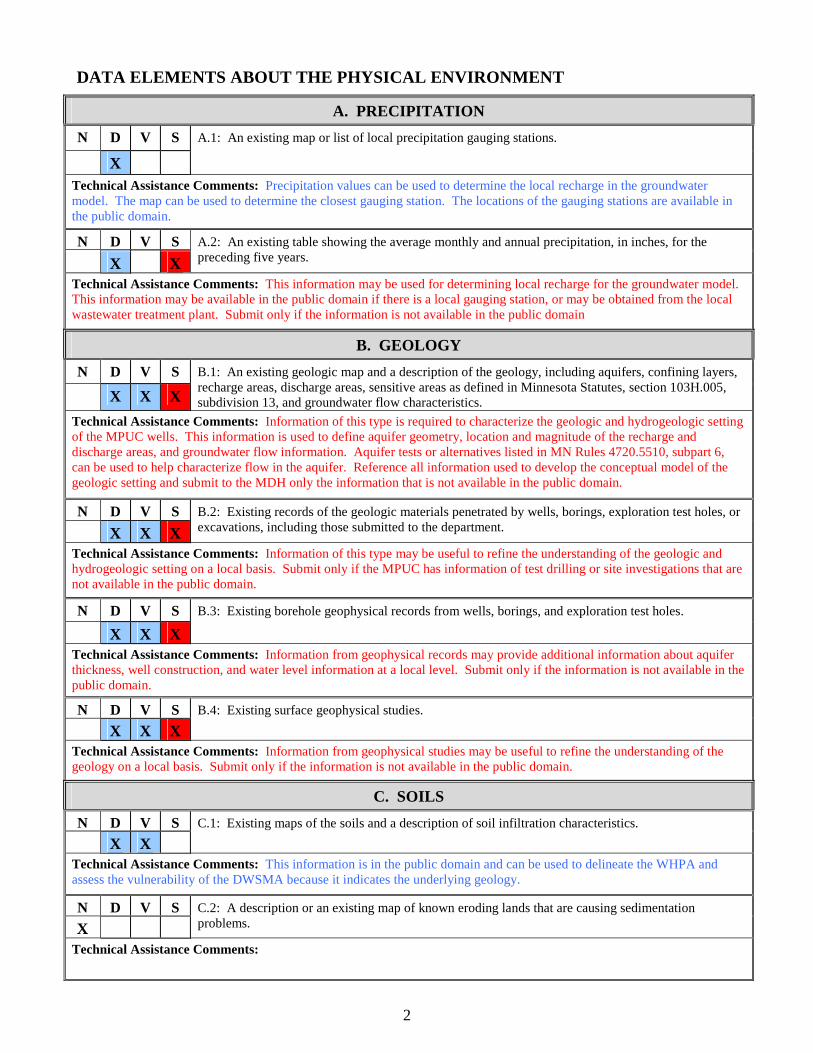
A. PRECIPITATION
N D V S
X
A.1: An existing map or list of local precipitation gauging stations.
Technical Assistance Comments: Precipitation values can be used to determine the local recharge in the groundwater model. The map can be used to determine the closest gauging station. The locations of the gauging stations are available in the public domain.
N D V S
X X A.2: An existing table showing the average monthly and annual precipitation, in inches, for the preceding five years.
Technical Assistance Comments: This information may be used for determining local recharge for the groundwater model. This information may be available in the public domain if there is a local gauging station, or may be obtained from the local wastewater treatment plant. Submit only if the information is not available in the public domain
B. GEOLOGY
N D V S
X X X
B.1: An existing geologic map and a description of the geology, including aquifers, confining layers, recharge areas, discharge areas, sensitive areas as defined in Minnesota Statutes, section 103H.005, subdivision 13, and groundwater flow characteristics.
Technical Assistance Comments: Information of this type is required to characterize the geologic and hydrogeologic setting of the MPUC wells. This information is used to define aquifer geometry, location and magnitude of the recharge and discharge areas, and groundwater flow information. Aquifer tests or alternatives listed in MN Rules 4720.5510, subpart 6, can be used to help characterize flow in the aquifer. Reference all information used to develop the conceptual model of the geologic setting and submit to the MDH only the information that is not available in the public domain.
N D V S
X X X B.2: Existing records of the geologic materials penetrated by wells, borings, exploration test holes, or excavations, including those submitted to the department.
Technical Assistance Comments: Information of this type may be useful to refine the understanding of the geologic and hydrogeologic setting on a local basis. Submit only if the MPUC has information of test drilling or site investigations that are not available in the public domain.
N D V S
X X X
B.3: Existing borehole geophysical records from wells, borings, and exploration test holes.
Technical Assistance Comments: Information from geophysical records may provide additional information about aquifer thickness, well construction, and water level information at a local level. Submit only if the information is not available in the public domain.
N D V S
X X X B.4: Existing surface geophysical studies.
Technical Assistance Comments: Information from geophysical studies may be useful to refine the understanding of the geology on a local basis. Submit only if the information is not available in the public domain.
C. SOILS
N D V S
X X C.1: Existing maps of the soils and a description of soil infiltration characteristics.
Technical Assistance Comments: This information is in the public domain and can be used to delineate the WHPA and assess the vulnerability of the DWSMA because it indicates the underlying geology.
N D V S
X C.2: A description or an existing map of known eroding lands that are causing sedimentation problems.
Technical Assistance Comments:
3
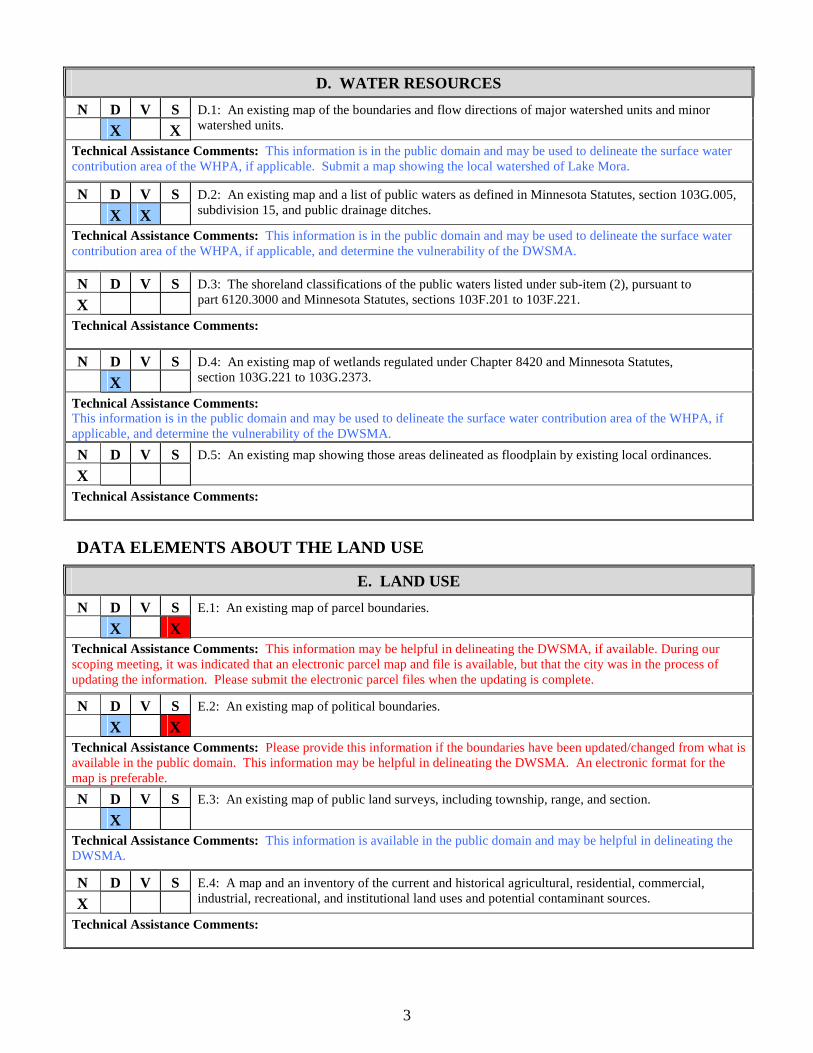
D. WATER RESOURCES
N D V S
X X D.1: An existing map of the boundaries and flow directions of major watershed units and minor watershed units.
Technical Assistance Comments: This information is in the public domain and may be used to delineate the surface water contribution area of the WHPA, if applicable. Submit a map showing the local watershed of Lake Mora.
N D V S
X X D.2: An existing map and a list of public waters as defined in Minnesota Statutes, section 103G.005, subdivision 15, and public drainage ditches.
Technical Assistance Comments: This information is in the public domain and may be used to delineate the surface water contribution area of the WHPA, if applicable, and determine the vulnerability of the DWSMA.
N D V S
X D.3: The shoreland classifications of the public waters listed under sub-item (2), pursuant to part 6120.3000 and Minnesota Statutes, sections 103F.201 to 103F.221.
Technical Assistance Comments:
N D V S
X D.4: An existing map of wetlands regulated under Chapter 8420 and Minnesota Statutes, section 103G.221 to 103G.2373.
Technical Assistance Comments: This information is in the public domain and may be used to delineate the surface water contribution area of the WHPA, if applicable, and determine the vulnerability of the DWSMA.
N D V S
X D.5: An existing map showing those areas delineated as floodplain by existing local ordinances.
Technical Assistance Comments:
DATA ELEMENTS ABOUT THE LAND USE
E. LAND USE
N D V S
X X E.1: An existing map of parcel boundaries.
Technical Assistance Comments: This information may be helpful in delineating the DWSMA, if available. During our scoping meeting, it was indicated that an electronic parcel map and file is available, but that the city was in the process of updating the information. Please submit the electronic parcel files when the updating is complete.
N D V S
X X E.2: An existing map of political boundaries.
Technical Assistance Comments: Please provide this information if the boundaries have been updated/changed from what is available in the public domain. This information may be helpful in delineating the DWSMA. An electronic format for the map is preferable.
N D V S
X E.3: An existing map of public land surveys, including township, range, and section.
Technical Assistance Comments: This information is available in the public domain and may be helpful in delineating the DWSMA.
N D V S
X E.4: A map and an inventory of the current and historical agricultural, residential, commercial, industrial, recreational, and institutional land uses and potential contaminant sources.
Technical Assistance Comments:
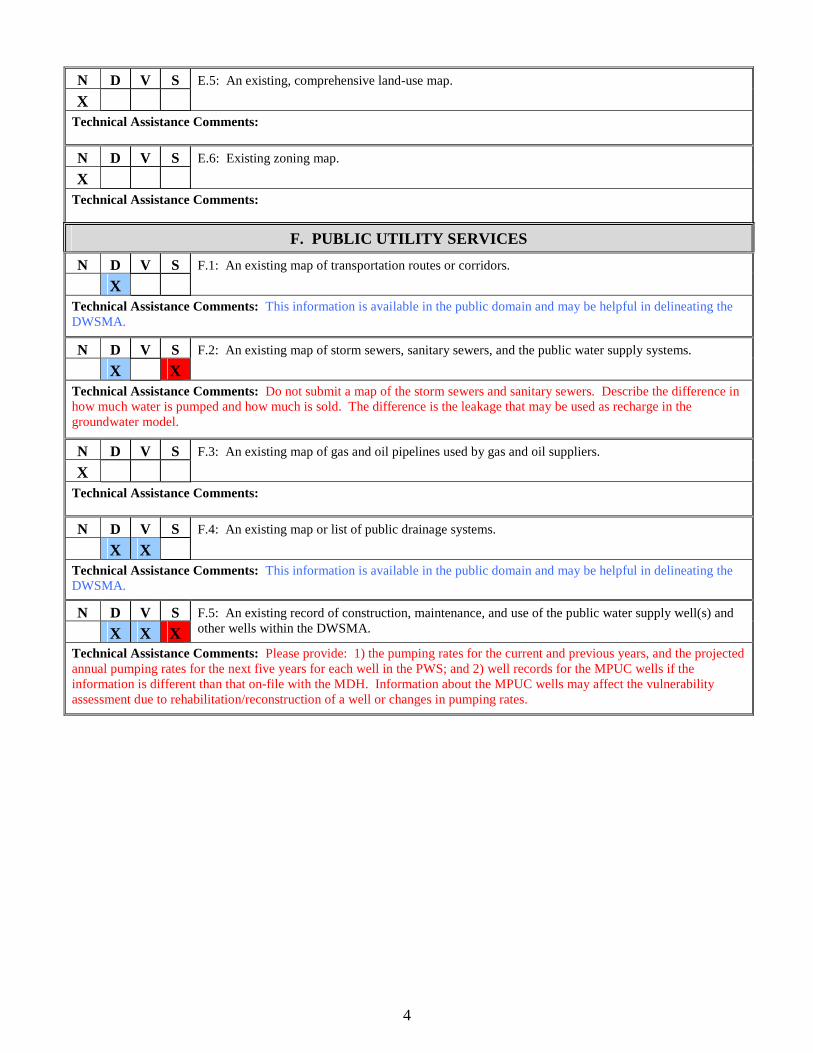
4
N D V S
X E.5: An existing, comprehensive land-use map.
Technical Assistance Comments:
N D V S
X E.6: Existing zoning map.
Technical Assistance Comments:
F. PUBLIC UTILITY SERVICES
N D V S
X F.1: An existing map of transportation routes or corridors.
Technical Assistance Comments: This information is available in the public domain and may be helpful in delineating the DWSMA.
N D V S
X X F.2: An existing map of storm sewers, sanitary sewers, and the public water supply systems.
Technical Assistance Comments: Do not submit a map of the storm sewers and sanitary sewers. Describe the difference in how much water is pumped and how much is sold. The difference is the leakage that may be used as recharge in the groundwater model.
N D V S
X F.3: An existing map of gas and oil pipelines used by gas and oil suppliers.
Technical Assistance Comments:
N D V S
X X F.4: An existing map or list of public drainage systems.
Technical Assistance Comments: This information is available in the public domain and may be helpful in delineating the DWSMA.
N D V S
X X X F.5: An existing record of construction, maintenance, and use of the public water supply well(s) and other wells within the DWSMA.
Technical Assistance Comments: Please provide: 1) the pumping rates for the current and previous years, and the projected annual pumping rates for the next five years for each well in the PWS; and 2) well records for the MPUC wells if the information is different than that on-file with the MDH. Information about the MPUC wells may affect the vulnerability assessment due to rehabilitation/reconstruction of a well or changes in pumping rates.
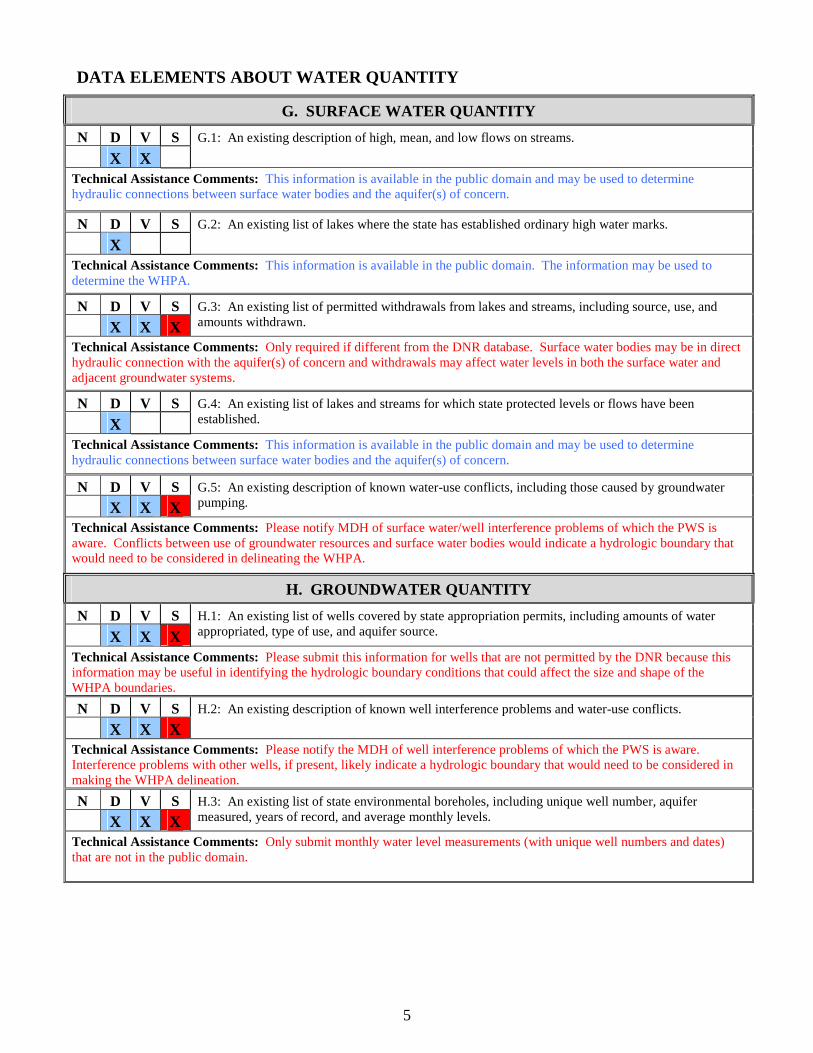
5
DATA ELEMENTS ABOUT WATER QUANTITY
G. SURFACE WATER QUANTITY
N D V S
X X G.1: An existing description of high, mean, and low flows on streams.
Technical Assistance Comments: This information is available in the public domain and may be used to determine hydraulic connections between surface water bodies and the aquifer(s) of concern.
N D V S
X G.2: An existing list of lakes where the state has established ordinary high water marks.
Technical Assistance Comments: This information is available in the public domain. The information may be used to determine the WHPA.
N D V S
X X X G.3: An existing list of permitted withdrawals from lakes and streams, including source, use, and amounts withdrawn.
Technical Assistance Comments: Only required if different from the DNR database. Surface water bodies may be in direct hydraulic connection with the aquifer(s) of concern and withdrawals may affect water levels in both the surface water and adjacent groundwater systems.
N D V S
X G.4: An existing list of lakes and streams for which state protected levels or flows have been established.
Technical Assistance Comments: This information is available in the public domain and may be used to determine hydraulic connections between surface water bodies and the aquifer(s) of concern.
N D V S X X X
G.5: An existing description of known water-use conflicts, including those caused by groundwater pumping.
Technical Assistance Comments: Please notify MDH of surface water/well interference problems of which the PWS is aware. Conflicts between use of groundwater resources and surface water bodies would indicate a hydrologic boundary that would need to be considered in delineating the WHPA.
H. GROUNDWATER QUANTITY
N D V S
X X X H.1: An existing list of wells covered by state appropriation permits, including amounts of water appropriated, type of use, and aquifer source.
Technical Assistance Comments: Please submit this information for wells that are not permitted by the DNR because this information may be useful in identifying the hydrologic boundary conditions that could affect the size and shape of the WHPA boundaries.
N D V S
X X X H.2: An existing description of known well interference problems and water-use conflicts.
Technical Assistance Comments: Please notify the MDH of well interference problems of which the PWS is aware. Interference problems with other wells, if present, likely indicate a hydrologic boundary that would need to be considered in making the WHPA delineation.
N D V S X X X
H.3: An existing list of state environmental boreholes, including unique well number, aquifer measured, years of record, and average monthly levels.
Technical Assistance Comments: Only submit monthly water level measurements (with unique well numbers and dates) that are not in the public domain.
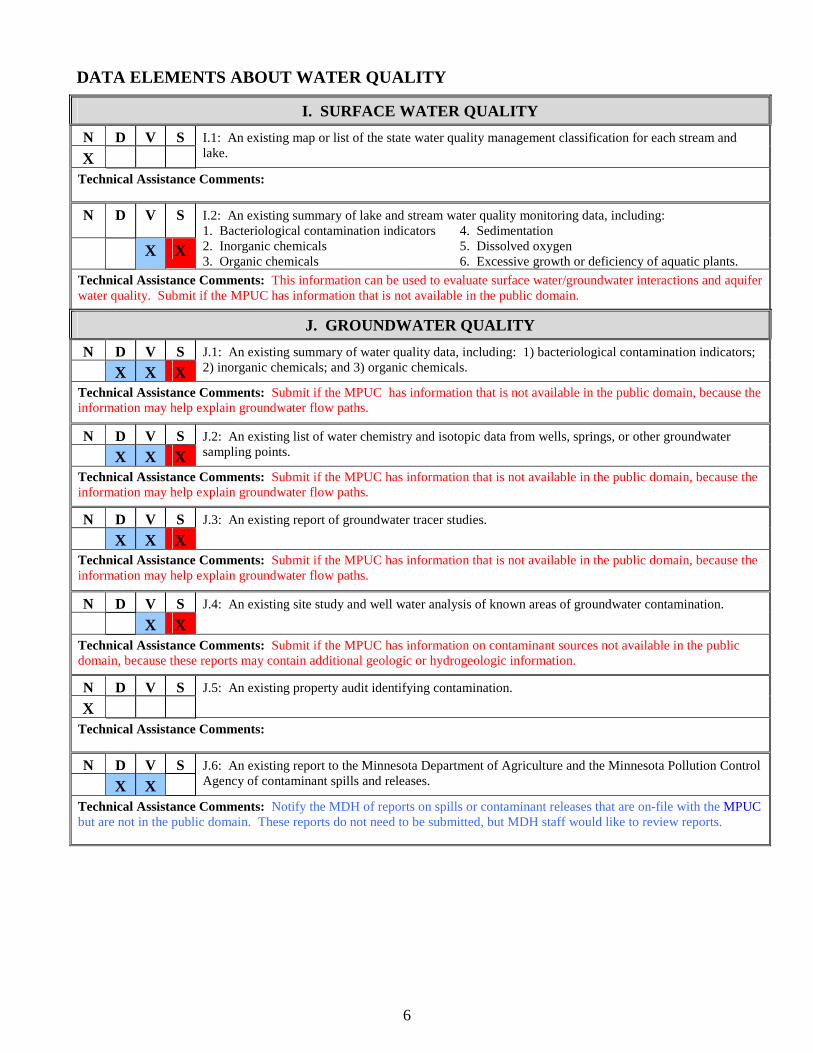
6
DATA ELEMENTS ABOUT WATER QUALITY
I. SURFACE WATER QUALITY
N D V S
X I.1: An existing map or list of the state water quality management classification for each stream and lake.
Technical Assistance Comments:
N D V S
X X
I.2: An existing summary of lake and stream water quality monitoring data, including: 1. Bacteriological contamination indicators 4. Sedimentation 2. Inorganic chemicals 5. Dissolved oxygen 3. Organic chemicals 6. Excessive growth or deficiency of aquatic plants.
Technical Assistance Comments: This information can be used to evaluate surface water/groundwater interactions and aquifer water quality. Submit if the MPUC has information that is not available in the public domain.
J. GROUNDWATER QUALITY
N D V S
X X X J.1: An existing summary of water quality data, including: 1) bacteriological contamination indicators; 2) inorganic chemicals; and 3) organic chemicals.
Technical Assistance Comments: Submit if the MPUC has information that is not available in the public domain, because the information may help explain groundwater flow paths.
N D V S
X X X J.2: An existing list of water chemistry and isotopic data from wells, springs, or other groundwater sampling points.
Technical Assistance Comments: Submit if the MPUC has information that is not available in the public domain, because the information may help explain groundwater flow paths.
N D V S
X X X J.3: An existing report of groundwater tracer studies.
Technical Assistance Comments: Submit if the MPUC has information that is not available in the public domain, because the information may help explain groundwater flow paths.
N D V S
X X J.4: An existing site study and well water analysis of known areas of groundwater contamination.
Technical Assistance Comments: Submit if the MPUC has information on contaminant sources not available in the public domain, because these reports may contain additional geologic or hydrogeologic information.
N D V S
X J.5: An existing property audit identifying contamination.
Technical Assistance Comments:
N D V S
X X J.6: An existing report to the Minnesota Department of Agriculture and the Minnesota Pollution Control Agency of contaminant spills and releases.
Technical Assistance Comments: Notify the MDH of reports on spills or contaminant releases that are on-file with the MPUC but are not in the public domain. These reports do not need to be submitted, but MDH staff would like to review reports.
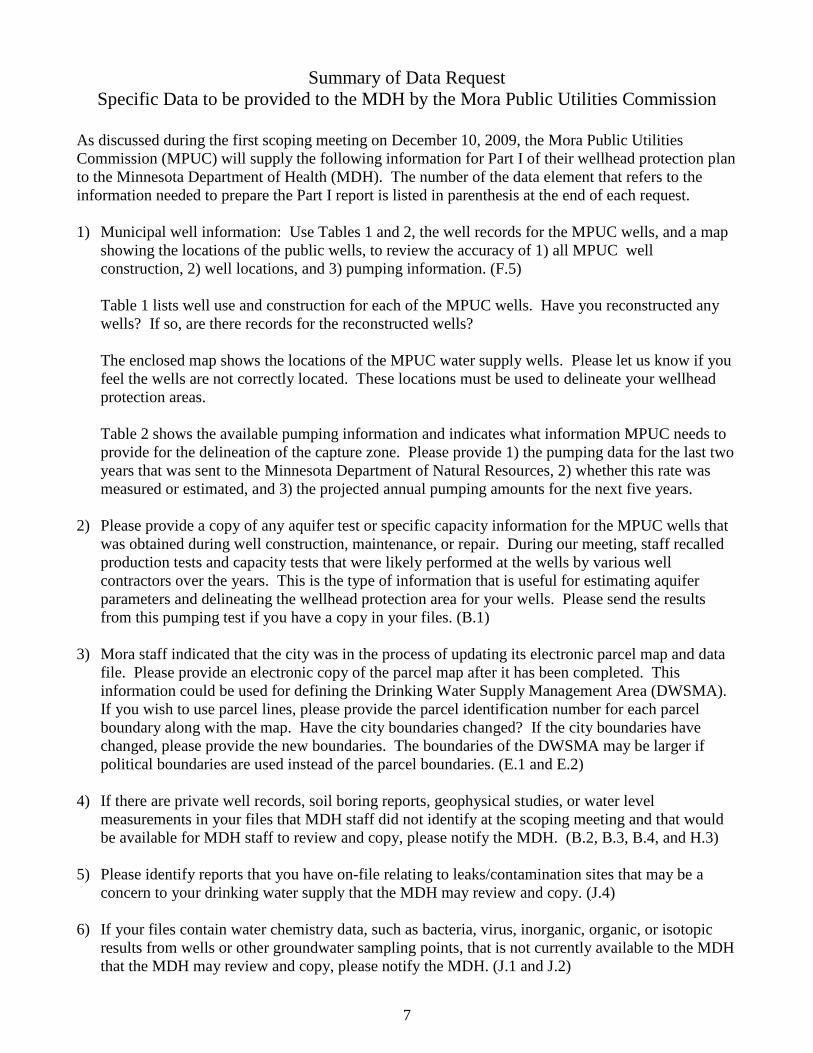
7
Summary of Data Request Specific Data to be provided to the MDH by the Mora Public Utilities Commission
As discussed during the first scoping meeting on December 10, 2009, the Mora Public Utilities Commission (MPUC) will supply the following information for Part I of their wellhead protection plan to the Minnesota Department of Health (MDH). The number of the data element that refers to the information needed to prepare the Part I report is listed in parenthesis at the end of each request. 1) Municipal well information: Use Tables 1 and 2, the well records for the MPUC wells, and a map
showing the locations of the public wells, to review the accuracy of 1) all MPUC well construction, 2) well locations, and 3) pumping information. (F.5)
Table 1 lists well use and construction for each of the MPUC wells. Have you reconstructed any wells? If so, are there records for the reconstructed wells? The enclosed map shows the locations of the MPUC water supply wells. Please let us know if you feel the wells are not correctly located. These locations must be used to delineate your wellhead protection areas. Table 2 shows the available pumping information and indicates what information MPUC needs to provide for the delineation of the capture zone. Please provide 1) the pumping data for the last two years that was sent to the Minnesota Department of Natural Resources, 2) whether this rate was measured or estimated, and 3) the projected annual pumping amounts for the next five years.
2) Please provide a copy of any aquifer test or specific capacity information for the MPUC wells that
was obtained during well construction, maintenance, or repair. During our meeting, staff recalled production tests and capacity tests that were likely performed at the wells by various well contractors over the years. This is the type of information that is useful for estimating aquifer parameters and delineating the wellhead protection area for your wells. Please send the results from this pumping test if you have a copy in your files. (B.1)
3) Mora staff indicated that the city was in the process of updating its electronic parcel map and data
file. Please provide an electronic copy of the parcel map after it has been completed. This information could be used for defining the Drinking Water Supply Management Area (DWSMA). If you wish to use parcel lines, please provide the parcel identification number for each parcel boundary along with the map. Have the city boundaries changed? If the city boundaries have changed, please provide the new boundaries. The boundaries of the DWSMA may be larger if political boundaries are used instead of the parcel boundaries. (E.1 and E.2)
4) If there are private well records, soil boring reports, geophysical studies, or water level
measurements in your files that MDH staff did not identify at the scoping meeting and that would be available for MDH staff to review and copy, please notify the MDH. (B.2, B.3, B.4, and H.3)
5) Please identify reports that you have on-file relating to leaks/contamination sites that may be a
concern to your drinking water supply that the MDH may review and copy. (J.4) 6) If your files contain water chemistry data, such as bacteria, virus, inorganic, organic, or isotopic
results from wells or other groundwater sampling points, that is not currently available to the MDH that the MDH may review and copy, please notify the MDH. (J.1 and J.2)
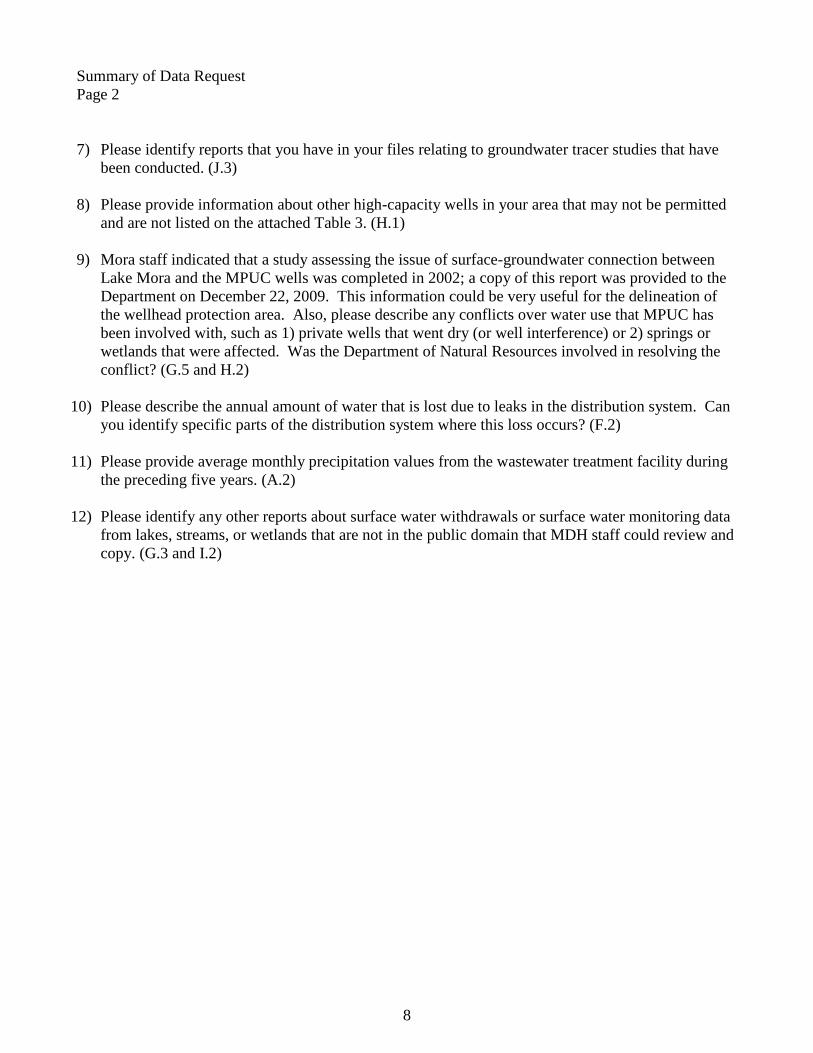
8
Summary of Data Request Page 2 7) Please identify reports that you have in your files relating to groundwater tracer studies that have
been conducted. (J.3) 8) Please provide information about other high-capacity wells in your area that may not be permitted
and are not listed on the attached Table 3. (H.1) 9) Mora staff indicated that a study assessing the issue of surface-groundwater connection between
Lake Mora and the MPUC wells was completed in 2002; a copy of this report was provided to the Department on December 22, 2009. This information could be very useful for the delineation of the wellhead protection area. Also, please describe any conflicts over water use that MPUC has been involved with, such as 1) private wells that went dry (or well interference) or 2) springs or wetlands that were affected. Was the Department of Natural Resources involved in resolving the conflict? (G.5 and H.2)
10) Please describe the annual amount of water that is lost due to leaks in the distribution system. Can
you identify specific parts of the distribution system where this loss occurs? (F.2) 11) Please provide average monthly precipitation values from the wastewater treatment facility during
the preceding five years. (A.2) 12) Please identify any other reports about surface water withdrawals or surface water monitoring data
from lakes, streams, or wetlands that are not in the public domain that MDH staff could review and copy. (G.3 and I.2)
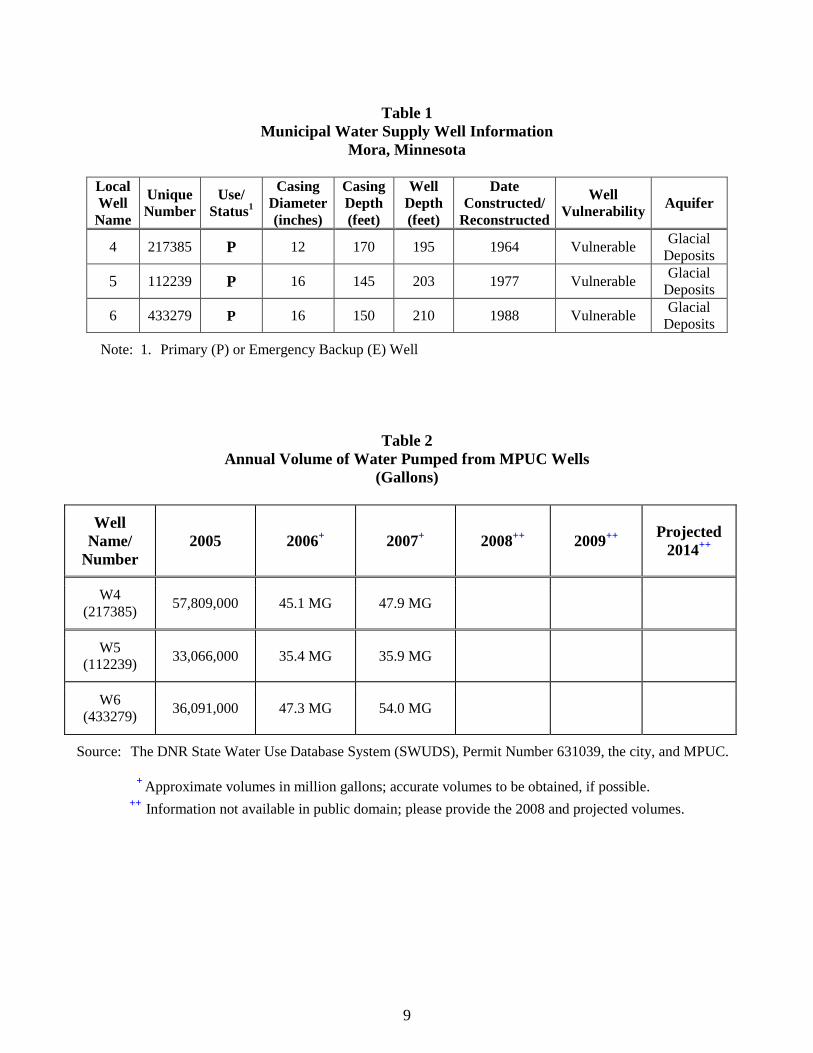
9
Table 1 Municipal Water Supply Well Information
Mora, Minnesota
Local Well
Name
Unique Number
Use/ Status1
Casing Diameter (inches)
Casing Depth (feet)
Well Depth (feet)
Date Constructed/
Reconstructed
Well Vulnerability Aquifer
4 217385 P 12 170 195 1964 Vulnerable Glacial
Deposits
5 112239 P 16 145 203 1977 Vulnerable Glacial
Deposits
6 433279 P 16 150 210 1988 Vulnerable Glacial
Deposits
Note: 1. Primary (P) or Emergency Backup (E) Well
Table 2 Annual Volume of Water Pumped from MPUC Wells
(Gallons)
Well Name/
Number 2005 2006+ 2007+ 2008++ 2009++
Projected 2014++
W4 (217385)
57,809,000 45.1 MG 47.9 MG
W5 (112239)
33,066,000 35.4 MG 35.9 MG
W6 (433279)
36,091,000 47.3 MG 54.0 MG
Source: The DNR State Water Use Database System (SWUDS), Permit Number 631039, the city, and MPUC.
+ Approximate volumes in million gallons; accurate volumes to be obtained, if possible. ++ Information not available in public domain; please provide the 2008 and projected volumes.
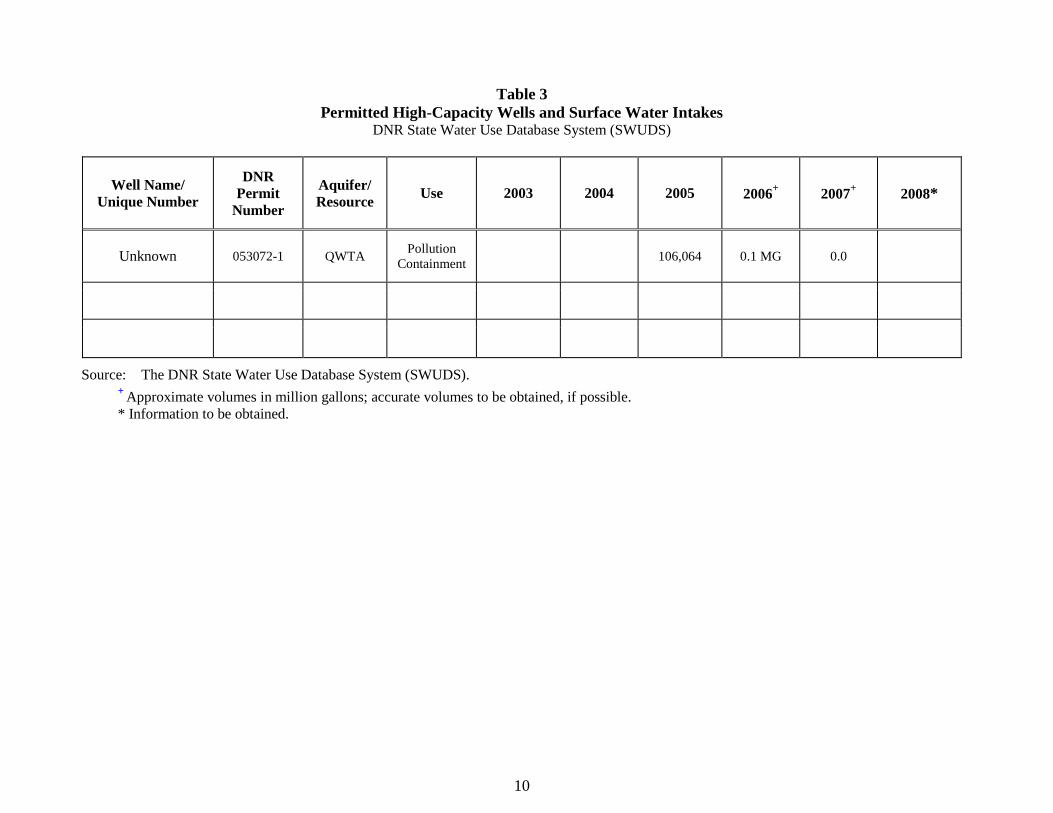
10
Table 3 Permitted High-Capacity Wells and Surface Water Intakes
DNR State Water Use Database System (SWUDS)
Well Name/ Unique Number
DNR Permit
Number
Aquifer/ Resource
Use 2003 2004 2005 2006+ 2007+ 2008*
Unknown 053072-1 QWTA Pollution
Containment 106,064 0.1 MG 0.0
Source: The DNR State Water Use Database System (SWUDS). + Approximate volumes in million gallons; accurate volumes to be obtained, if possible. * Information to be obtained.
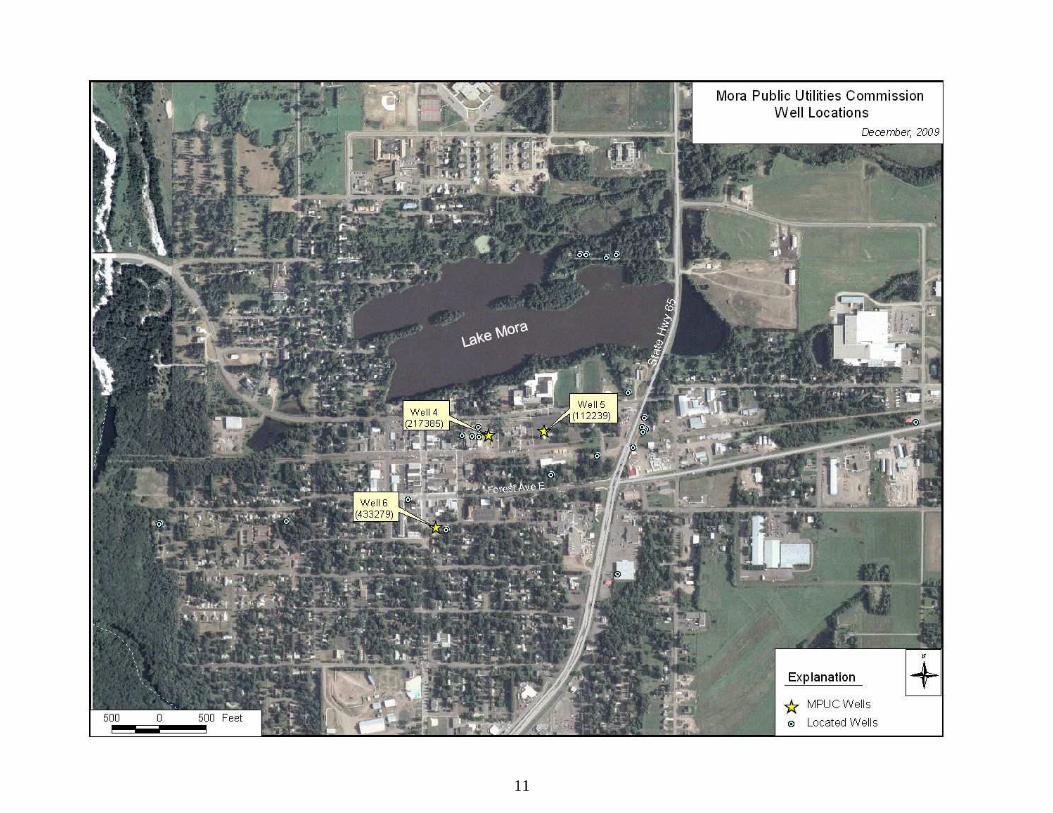
11

Appendix B
Geologic Cross Sections
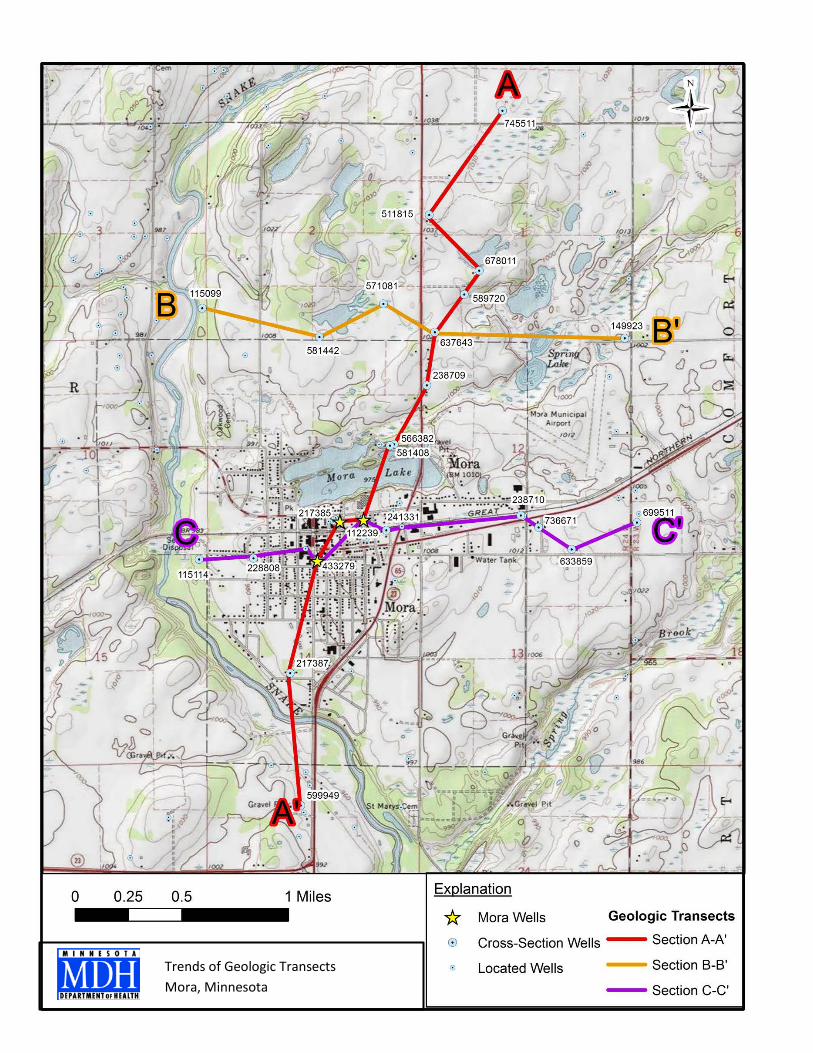
Trends of Geologic Transects Mora, Minnesota
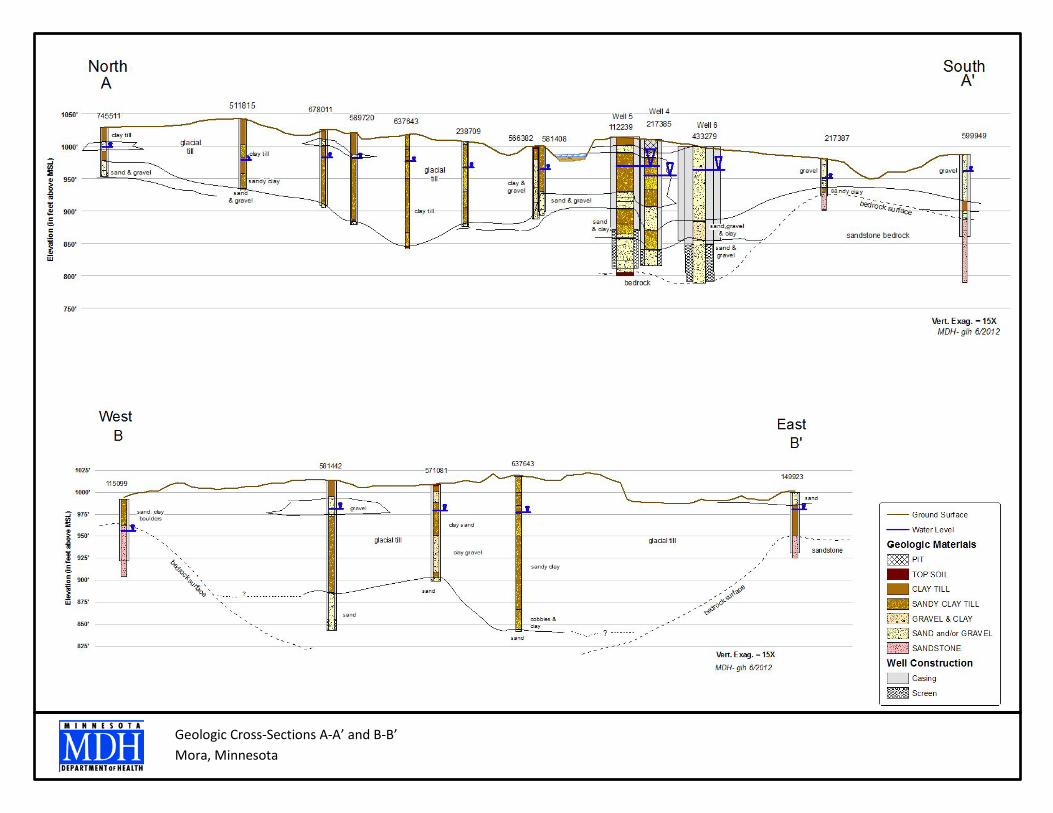
Geologic Cross-Sections A-A’ and B-B’ Mora, Minnesota
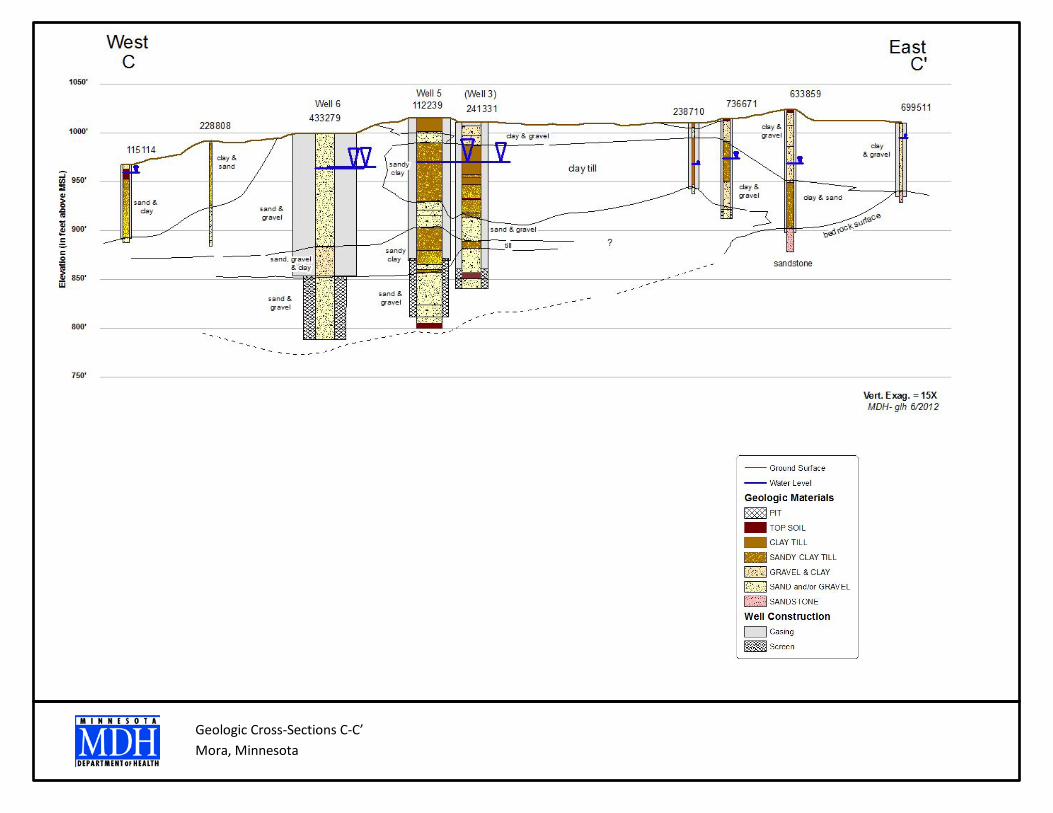
Geologic Cross-Sections C-C’ Mora, Minnesota

Appendix C
MDH Water Quality Data
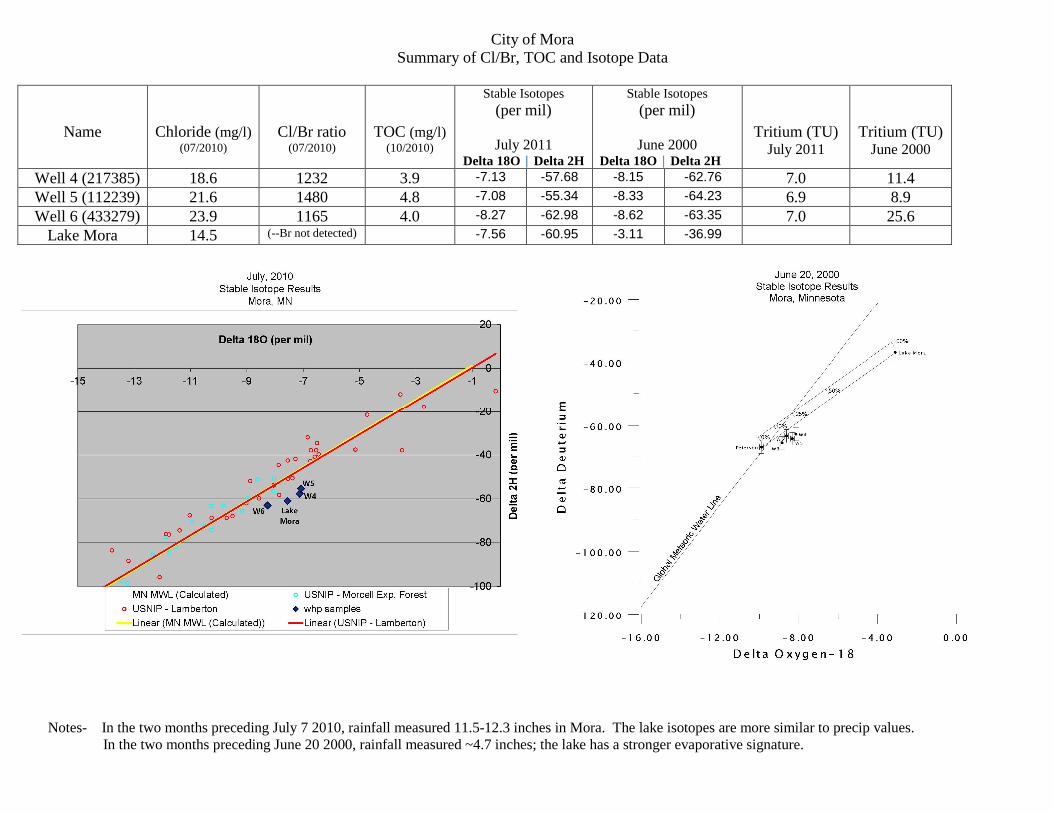
City of Mora Summary of Cl/Br, TOC and Isotope Data
Name
Chloride (mg/l) (07/2010)
Cl/Br ratio (07/2010)
TOC (mg/l) (10/2010)
Stable Isotopes (per mil)
July 2011
Delta 18O Delta 2H
Stable Isotopes (per mil)
June 2000
Delta 18O Delta 2H
Tritium (TU) July 2011
Tritium (TU) June 2000
Well 4 (217385) 18.6 1232 3.9 -7.13 -57.68 -8.15 -62.76 7.0 11.4 Well 5 (112239) 21.6 1480 4.8 -7.08 -55.34 -8.33 -64.23 6.9 8.9 Well 6 (433279) 23.9 1165 4.0 -8.27 -62.98 -8.62 -63.35 7.0 25.6
Lake Mora 14.5 (--Br not detected) -7.56 -60.95 -3.11 -36.99
Notes- In the two months preceding July 7 2010, rainfall measured 11.5-12.3 inches in Mora. The lake isotopes are more similar to precip values. In the two months preceding June 20 2000, rainfall measured ~4.7 inches; the lake has a stronger evaporative signature.

Appendix D
Aquifer Test Plan and Pump Test Data
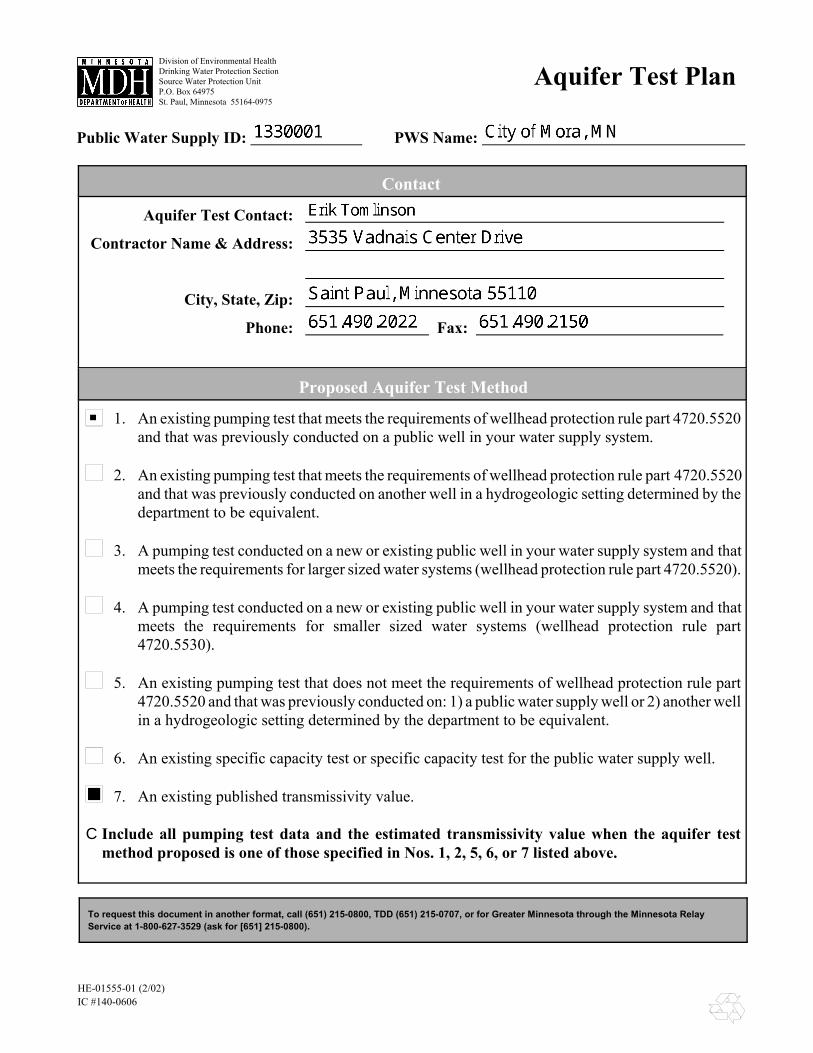
Division of Environmental HealthDrinking Water Protection SectionSource Water Protection UnitP.O. Box 64975St. Paul, Minnesota 55164-0975
To request this document in another format, call (651) 215-0800, TDD (651) 215-0707, or for Greater Minnesota through the Minnesota RelayService at 1-800-627-3529 (ask for [651] 215-0800).
Aquifer Test Plan
Public Water Supply ID: PWS Name:
Contact
Aquifer Test Contact:
Contractor Name & Address:
City, State, Zip:
Phone: Fax:
Proposed Aquifer Test Method
1. An existing pumping test that meets the requirements of wellhead protection rule part 4720.5520and that was previously conducted on a public well in your water supply system.
2. An existing pumping test that meets the requirements of wellhead protection rule part 4720.5520and that was previously conducted on another well in a hydrogeologic setting determined by thedepartment to be equivalent.
3. A pumping test conducted on a new or existing public well in your water supply system and thatmeets the requirements for larger sized water systems (wellhead protection rule part 4720.5520).
4. A pumping test conducted on a new or existing public well in your water supply system and thatmeets the requirements for smaller sized water systems (wellhead protection rule part4720.5530).
5. An existing pumping test that does not meet the requirements of wellhead protection rule part4720.5520 and that was previously conducted on: 1) a public water supply well or 2) another wellin a hydrogeologic setting determined by the department to be equivalent.
6. An existing specific capacity test or specific capacity test for the public water supply well.
7. An existing published transmissivity value.
C Include all pumping test data and the estimated transmissivity value when the aquifer testmethod proposed is one of those specified in Nos. 1, 2, 5, 6, or 7 listed above.
HE-01555-01 (2/02) IC #140-0606
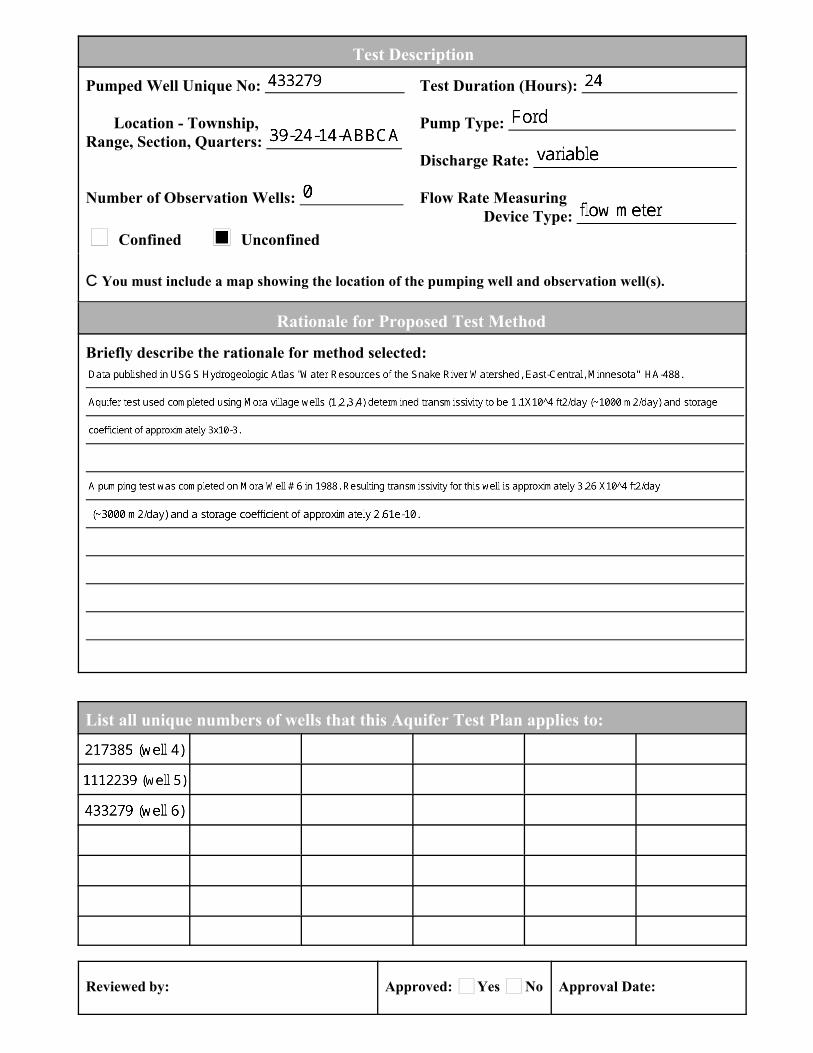
Test Description
Pumped Well Unique No:
Location - Township,Range, Section, Quarters:
Number of Observation Wells:
Confined Unconfined
Test Duration (Hours):
Pump Type:
Discharge Rate:
Flow Rate Measuring Device Type:
C You must include a map showing the location of the pumping well and observation well(s).
Rationale for Proposed Test Method
Briefly describe the rationale for method selected:
List all unique numbers of wells that this Aquifer Test Plan applies to:
Reviewed by: Approved: Yes No Approval Date:

Appendix E
Model Files (CD)

Appendix F
GIS Files (CD)

Appendix G
MDH Well Vulnerability Sheets
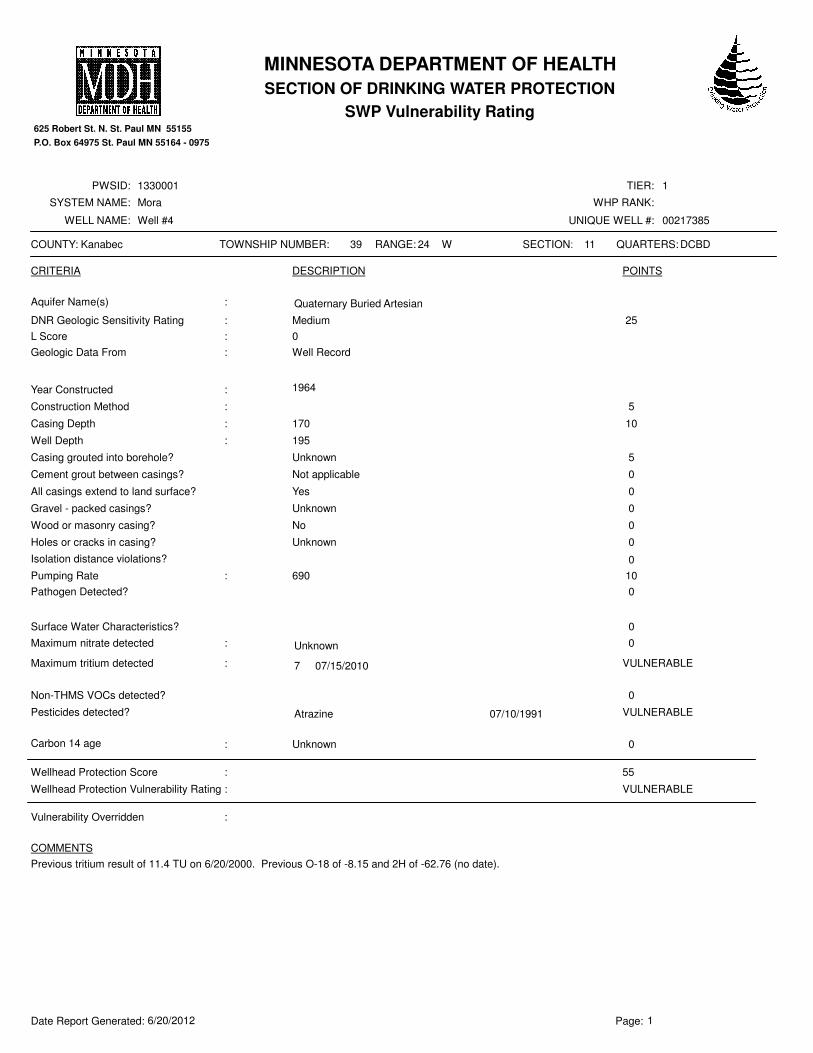
KanabecCOUNTY: 24 WRANGE: SECTION: 11 DCBD QUARTERS:39TOWNSHIP NUMBER:
1PWSID: 1330001 TIER:
SYSTEM NAME: Mora WHP RANK:
00217385WELL NAME: Well #4 UNIQUE WELL #:
625 Robert St. N. St. Paul MN 55155
P.O. Box 64975 St. Paul MN 55164 - 0975
MINNESOTA DEPARTMENT OF HEALTH
SECTION OF DRINKING WATER PROTECTION
SWP Vulnerability Rating
CRITERIA DESCRIPTION POINTS
Quaternary Buried ArtesianAquifer Name(s) :
DNR Geologic Sensitivity Rating Medium:
L Score 0:
Geologic Data From :
:
Construction Method :
Casing Depth 170:
Well Depth 195:
Casing grouted into borehole? Unknown
Cement grout between casings? Not applicable
All casings extend to land surface? Yes
Gravel - packed casings? Unknown
Wood or masonry casing? No
Holes or cracks in casing? Unknown
Isolation distance violations?
690Pumping Rate :
Pathogen Detected?
Surface Water Characteristics?
Non-THMS VOCs detected?
Atrazine 07/10/1991Pesticides detected?
Unknown:Carbon 14 age
COMMENTS
Previous tritium result of 11.4 TU on 6/20/2000. Previous O-18 of -8.15 and 2H of -62.76 (no date).
25
5
10
5
0
0
0
0
0
0
10
0
0
0
VULNERABLE
0
55
VULNERABLE
Wellhead Protection Score :
Wellhead Protection Vulnerability Rating :
Vulnerability Overridden :
Unknown:Maximum nitrate detected 0
7 07/15/2010:Maximum tritium detected VULNERABLE
Well Record
Year Constructed 1964
6/20/2012Date Report Generated: Page: 1
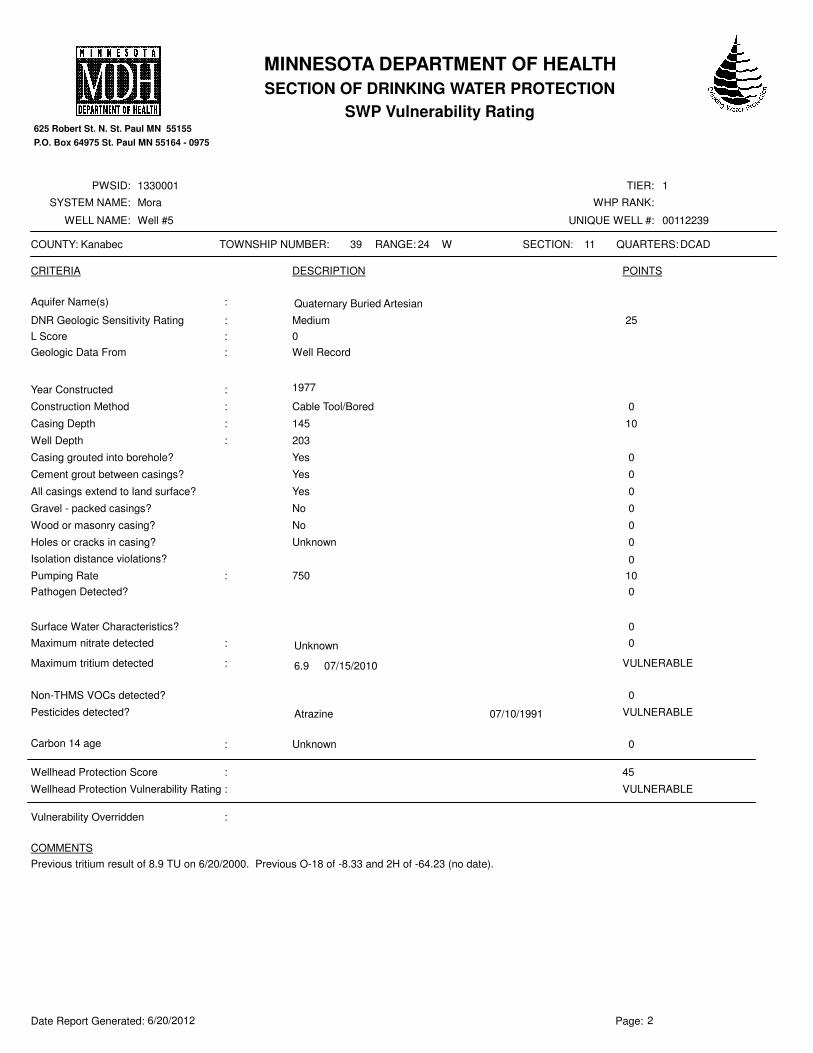
KanabecCOUNTY: 24 WRANGE: SECTION: 11 DCAD QUARTERS:39TOWNSHIP NUMBER:
1PWSID: 1330001 TIER:
SYSTEM NAME: Mora WHP RANK:
00112239WELL NAME: Well #5 UNIQUE WELL #:
625 Robert St. N. St. Paul MN 55155
P.O. Box 64975 St. Paul MN 55164 - 0975
MINNESOTA DEPARTMENT OF HEALTH
SECTION OF DRINKING WATER PROTECTION
SWP Vulnerability Rating
CRITERIA DESCRIPTION POINTS
Quaternary Buried ArtesianAquifer Name(s) :
DNR Geologic Sensitivity Rating Medium:
L Score 0:
Geologic Data From :
:
Construction Method Cable Tool/Bored:
Casing Depth 145:
Well Depth 203:
Casing grouted into borehole? Yes
Cement grout between casings? Yes
All casings extend to land surface? Yes
Gravel - packed casings? No
Wood or masonry casing? No
Holes or cracks in casing? Unknown
Isolation distance violations?
750Pumping Rate :
Pathogen Detected?
Surface Water Characteristics?
Non-THMS VOCs detected?
Atrazine 07/10/1991Pesticides detected?
Unknown:Carbon 14 age
COMMENTS
Previous tritium result of 8.9 TU on 6/20/2000. Previous O-18 of -8.33 and 2H of -64.23 (no date).
25
0
10
0
0
0
0
0
0
0
10
0
0
0
VULNERABLE
0
45
VULNERABLE
Wellhead Protection Score :
Wellhead Protection Vulnerability Rating :
Vulnerability Overridden :
Unknown:Maximum nitrate detected 0
6.9 07/15/2010:Maximum tritium detected VULNERABLE
Well Record
Year Constructed 1977
6/20/2012Date Report Generated: Page: 2
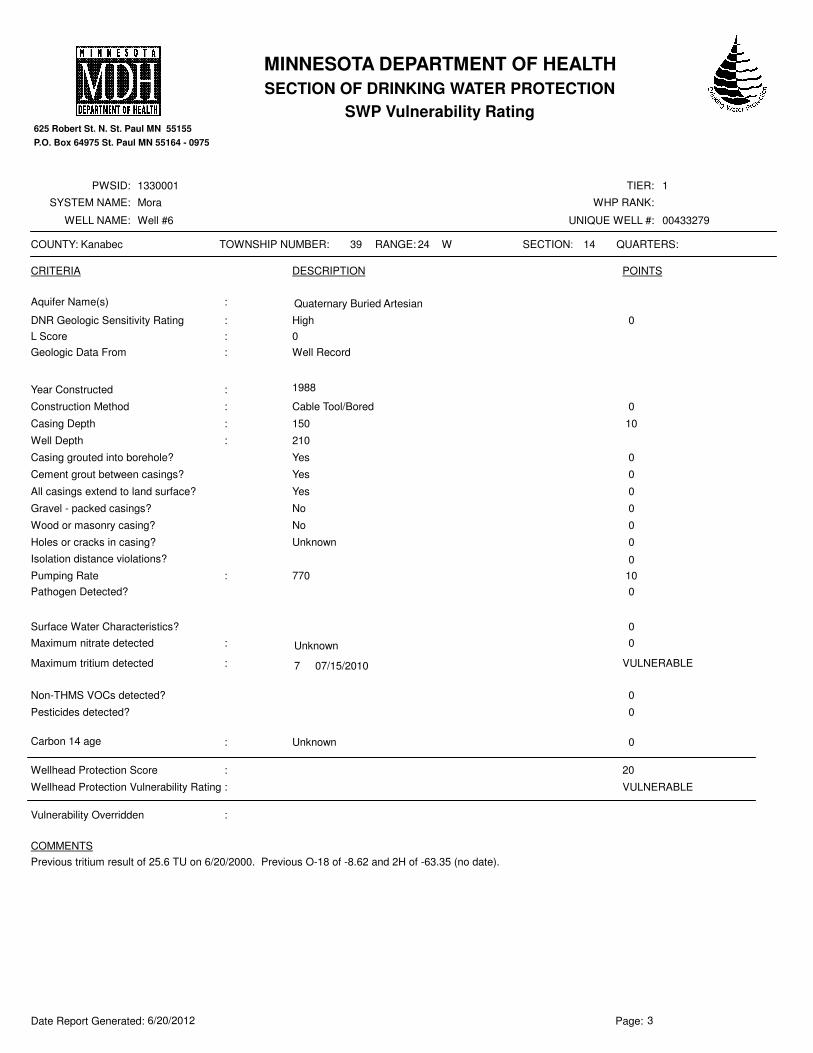
KanabecCOUNTY: 24 WRANGE: SECTION: 14 QUARTERS:39TOWNSHIP NUMBER:
1PWSID: 1330001 TIER:
SYSTEM NAME: Mora WHP RANK:
00433279WELL NAME: Well #6 UNIQUE WELL #:
625 Robert St. N. St. Paul MN 55155
P.O. Box 64975 St. Paul MN 55164 - 0975
MINNESOTA DEPARTMENT OF HEALTH
SECTION OF DRINKING WATER PROTECTION
SWP Vulnerability Rating
CRITERIA DESCRIPTION POINTS
Quaternary Buried ArtesianAquifer Name(s) :
DNR Geologic Sensitivity Rating High:
L Score 0:
Geologic Data From :
:
Construction Method Cable Tool/Bored:
Casing Depth 150:
Well Depth 210:
Casing grouted into borehole? Yes
Cement grout between casings? Yes
All casings extend to land surface? Yes
Gravel - packed casings? No
Wood or masonry casing? No
Holes or cracks in casing? Unknown
Isolation distance violations?
770Pumping Rate :
Pathogen Detected?
Surface Water Characteristics?
Non-THMS VOCs detected?
Pesticides detected?
Unknown:Carbon 14 age
COMMENTS
Previous tritium result of 25.6 TU on 6/20/2000. Previous O-18 of -8.62 and 2H of -63.35 (no date).
0
0
10
0
0
0
0
0
0
0
10
0
0
0
0
0
20
VULNERABLE
Wellhead Protection Score :
Wellhead Protection Vulnerability Rating :
Vulnerability Overridden :
Unknown:Maximum nitrate detected 0
7 07/15/2010:Maximum tritium detected VULNERABLE
Well Record
Year Constructed 1988
6/20/2012Date Report Generated: Page: 3