Embed Size (px)
Citation preview
University of Tennessee, Knoxville University of Tennessee, Knoxville
TRACE: Tennessee Research and Creative TRACE: Tennessee Research and Creative
Exchange Exchange
Doctoral Dissertations Graduate School
6-1959
Part I: The Catalytic Hydrogenation of Nitro Compounds over Part I: The Catalytic Hydrogenation of Nitro Compounds over
Supported Rhodium in Acetic Acid; Part II: The Exchange of Supported Rhodium in Acetic Acid; Part II: The Exchange of
Deuterium Gas and Methanol in the Presence of Raney Nickel Deuterium Gas and Methanol in the Presence of Raney Nickel
Burch Byron Stewart University of Tennessee - Knoxville
Follow this and additional works at: https://trace.tennessee.edu/utk_graddiss
Part of the Chemistry Commons
Recommended Citation Recommended Citation Stewart, Burch Byron, "Part I: The Catalytic Hydrogenation of Nitro Compounds over Supported Rhodium in Acetic Acid; Part II: The Exchange of Deuterium Gas and Methanol in the Presence of Raney Nickel. " PhD diss., University of Tennessee, 1959. https://trace.tennessee.edu/utk_graddiss/2964
This Dissertation is brought to you for free and open access by the Graduate School at TRACE: Tennessee Research and Creative Exchange. It has been accepted for inclusion in Doctoral Dissertations by an authorized administrator of TRACE: Tennessee Research and Creative Exchange. For more information, please contact [email protected].
To the Graduate Council:
I am submitting herewith a dissertation written by Burch Byron Stewart entitled "Part I: The
Catalytic Hydrogenation of Nitro Compounds over Supported Rhodium in Acetic Acid; Part II:
The Exchange of Deuterium Gas and Methanol in the Presence of Raney Nickel." I have
examined the final electronic copy of this dissertation for form and content and recommend
that it be accepted in partial fulfillment of the requirements for the degree of Doctor of
Philosophy, with a major in Chemistry.
Hilton A. Smith, Major Professor
We have read this dissertation and recommend its acceptance:
William T. Smith, E. Cohen, M. J. Jonnich
Accepted for the Council:
Carolyn R. Hodges
Vice Provost and Dean of the Graduate School
(Original signatures are on file with official student records.)
May 21, 1959
To the G raduate Councilt
I am submitting herewith a dissertation writ te n by Bu rch Byron Stewart entit led "Part I: The Catalytic Hydrogenation of Nitro Compounds Over Supported RhodiUJil in Acetic Acid; Part II: The Exchange of Deuterium Gas and Methanol in the Pre sence of Raney Nickel." I recommend that it be accepted in partial fulf'illment of the requirements for the degree of Doctor of Philosophy, with a major in Chemis try.
We have read th is dissertation and r ecommend its accep tance:
. ;---., r;J. '"''"'f.- f....._
Accepted far the Cou ncil:
PARr I1 THE CATALYTIC HYDROGENATION OF NITRO COMPOUNDS OVER SUPPORI'ED
RHODIUM IN ACETIC ACID
PART II: THE EXCHANG E OF DEUT ERIUM GAS AND METHANOL IN THE PRESENCE OF
RANEY NICKEL
A DISSERTATION
Submitted to The Graduate Council
of ·
The University of Te nnessee in
Partial Fulfillment of the "Requirements for the De gree o f
Docto r of Philo so phY
by
Burch Byron Ste wart
June , 1959
.� /.
ACKNCWLEDGEMENT
The author wishes to express his sincere gratitude to Dr. Hilton
A. Smith for his constant encouragement and thoughtful guidance. He
wishes to thank his wife for her patience, encouragement, and assistance.
He is a.J..so grateful to the A tomio Energy Commission for research
assistantships for the period September, 1956 through June, 1959.
CHAPI'ER
I.
II.
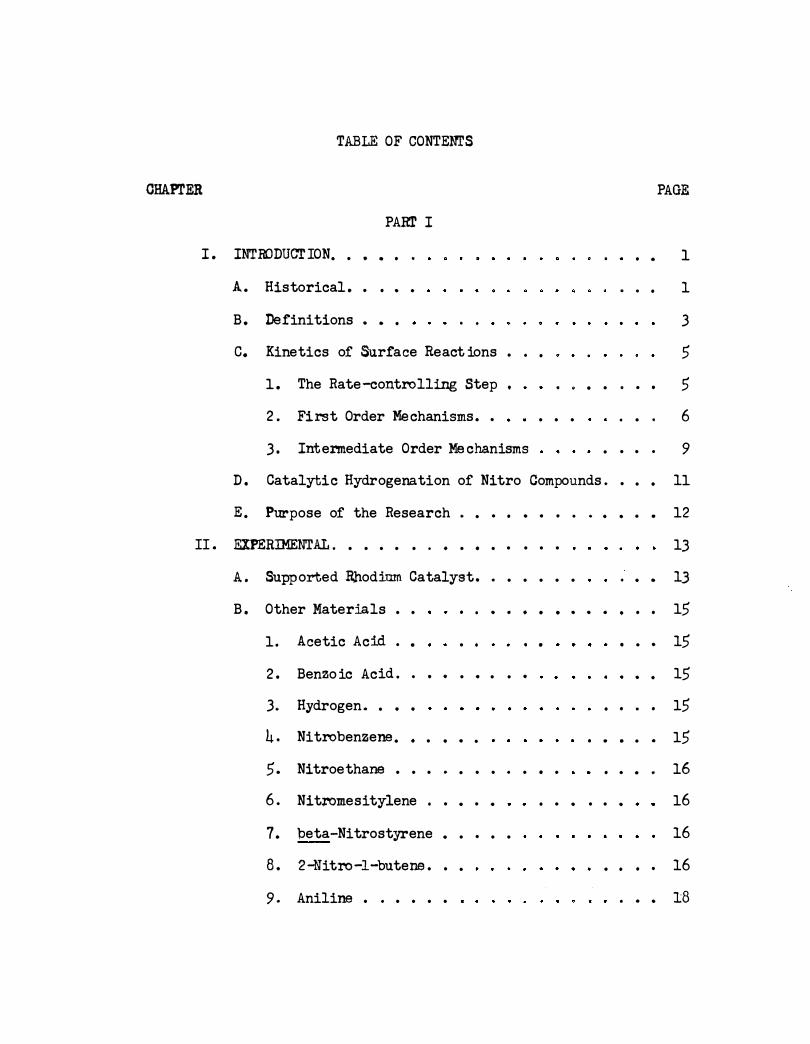
TABLE OF CONTENTS
INTRODUCTION. •
PAR!' I
. . . .
A. Historical. • . . .
B. Definitions . . . . .
c. Kinetics of Su.rface React ions •
1. The Rate -controlling Step •
. .
. .
. . .
• "' • • (I • •
PAGE
1
1
3
5
5
2. First Order Mechanisms. • • • • • • • 6
3. Intermediate Order Mechanisms • • • • 9 D. Catalytic Hydrogenation of Nitro Compounds. • • • 11
E. Purpose of the Research • • . . . . . . . . . . .
EIPERIME:NT.A.Is. • • • • • • • • • • • • • •
A. Supported R.hodium Ca talyat. • • • • • • . . .
B. Other Materials • • . . . . . . . . . . . . .
1. Acetic Acid . . • • • •
2. Benzo ic Acid. . • • • • • • •
3. Hydrogen. • • •
4. Nitrobenzene. • • • • •
5. Nitroethane • • • • • • • • • • •
6. Nitromesitylene . • • • •
7. beta-Nitrostyrene • • • • •
B. 2-Nitro-1-butene • • •
9. Aniline • • • • • •
. . .
. . .
. .
. . . .
. . . . .
. . . .
. . .
. . . .
. . .
12
13
13
15
15
15
15
15
16
16
16
16
18
iv
CHAPrER PAGE
II. (Continued)
C. Low-pressure Hydrogenations
1. Apparatus and Procedure
2. Cal:ibrati on • •
3. Calculat ions.
. .
. . . . . . .
• •
. .
D. Identification of Intennediates and Products. . •
III. RESUI:l'S AND DISCUSSION. . • . . .
A. Nitrobenzene. . . • . . . . .
B. �-Nitrostyrene . . . . .
c. Nitroethane . . . . . . . . .
D. Nitromesitylene . . .
E. 2-Nitro-1-b utene. . . .
F. Comparison of Hydrogenation Results . .
G. Comparison With Deuterium Exchanges .
IV. SUMMARY . . . .
BffiLIOGRA.PHY • . . . . • . . . . . .
INTIDDUCTION. • •
PARr II
. . . . . . .
A. General Dis cussion • • •
B. Langmuir Kinetics .
. . .
. .
. . .
.
.
. . .
. . .
. . .
. . •
. .
. . .
. . .
C. Catalytic Hydro gena tiona • 0 • • • 0 • • • • •
D. Catalytic Deuterium Exchanges . .
18
18
20
21
23
24
25 37
48
55 62
69
77
79
80
84
84
85
86
88
E. State:rrent and. Purpose of the Resear ch • . • . 89
CHAPrER
II. EXPERIMENTAL. • • • • • • • • •
A. Prepa ration of Raney Nickel
. .
. .
• • . . .
• • (j •
B. Preparation and Purification of Nit ro Compounds .
C. Pur ification of Methanol Solvent • • • • • • • • •
D. Preparation of Deuterated Methanol • • • • . . . .
E. Deuterium and Hydrogen • • . . . . . . .. . .
F. Reaction Apparatus • • • . . . . . . . . . .
1. Reaction Vessels. . . . .
2. Shaker. • • • • • • . . . . .
3. Analytical Apparatus. • . . .
G. Exchange Procedure • •
H. Calculations . • • •
. . . . .
. .
. . . . . .
. . . . . . . .
. . .
. . . . . . .
. . . . . . .
v
PAGE
90
90
91
92
92
93
93
93
94
95
97
103
1. Calibration of the Pinhole • • • • . . .
2. S tandardization With Deuterium. • •
3. Calculation of Percentage Hydrogen. •
• • • 103
• • • 104
. . loh
4. Precision and Accuracy. • • . • • • • • • • • 105
5. Calculation of Percentage Exchange . •
6. Calculation of Exchange Order • • • •
7. Calculation of Rate Constants • . . .
• • 105
. . lo6
lo6
IIl. RESUI1l'S AND DISCUSSION. . . . • • • 107
A. Catalyst Weight • •
B. Shaking Rate • • • . . . • • • b . . .
• • • • 107
. . . . . • 112
c. Effect of Deuterium Pressure. . . . . . • • 112
• • • . 117 D . Effect of Time • • • • • • . • • . . .
vi
CHAPI'ER PAGE
III . (Continued)
E. Effect of Temperature . • • • •
F . Effect of Nitro Compounds . . . .
G. Exchange of Heavy Methanol • • •
• • • • 117
• • • 121
• • 127
IV. SUMMARY . • • • • 0 • 0 0 • • • • 129
BIBLIOGRAPHY .
APPENDICES
I. DERIVATION OF EFFUSION EQUATION. • 0 • • • •
II . DERIVATION OF EXCHANGE EQUATION FOR HYDROGEN
DIRECTLY LIBERATED • • • • • • • • • • • •
III. DERIVATION OF RATE EXPRESSION . • 0 •
130
• . • • 134
• • 136
. 138
TABLE
LIST OF TABLES
PART I
I . Hydrogenation of Nitrobenzene Over Supported
Rhod.i1.m1. o • • • • • • • • • • • • • • • • •
II. Rate Constant Ratios for Nitrobenzene Hydrogenations
PAGE
3 1
at 30° and Initial Pressure of 74. 4 p.s. i.a. • • • • 35
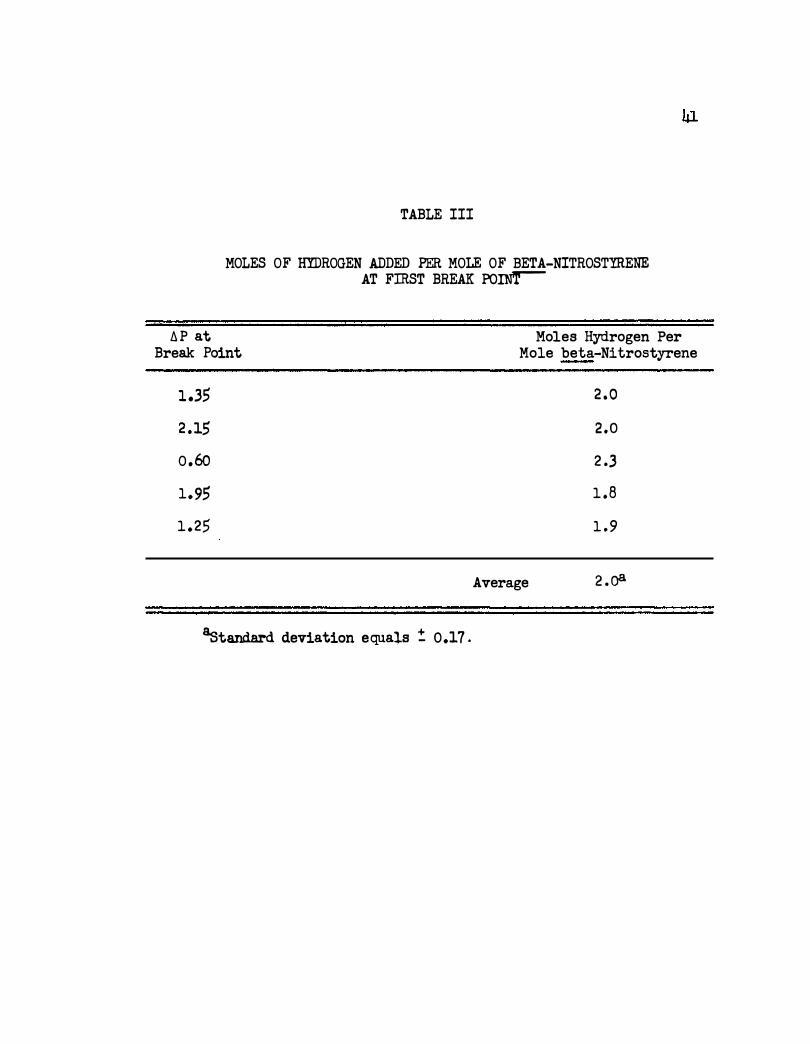
III . Moles of Hydrogen Added per Mole of �-Nitrostyrene
at First Break Point • • • • • •
IV. Hydrogenation of �-Ni trostyrene Over Supported
Rhodium. • • • . • • • • • • • o • o o o- o • • • • • 46
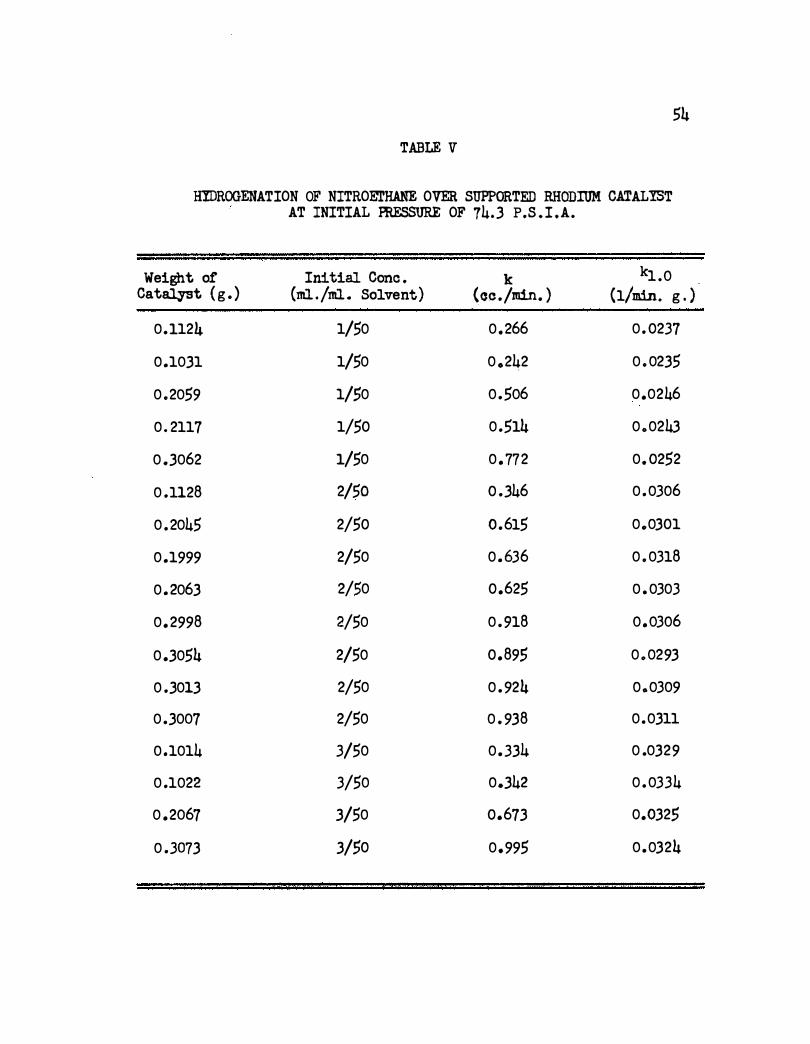
V. Hydrogenation of Ni troethane Over Supported Rhodium
Catalyst at Initial Pressure of 74.3 p.s.i.a.. • • • 54
VI. Effect of Initial Pressure Upon the Rate of Hydro
genation of Nitromesitylene at 30° Over Supported
Rhod.ilJlD. • • • • • • • • • • • • • • o • • o • o e 59
VII. Hydrogenation of Nitromesitylene Over Supported
Rhod.i1llll. Ill 0 • 0 • • 0 • 0 • • • G • • •
VIII. Effect of Initial Pressure Upon the Rate of Hydrogen
ation of 2-Nitro-1-butene at 30° Over Supported
63
Rhodi1llll. . • • • . • • • • • • • o • • • • • • • 67
IX . Hydrogenation of 2-Nitro-1-butene Over Supported
Rhod.ium • • • • •
X. Summar.r of Rate Constants for Hydrogenations a t 30°
Over Supported Rhodium Catalyst. • • • • • •
72
74
viii
TABLE PAGE
n. Comparison of Rate Constants, kJ.. o ( 1. /min. g. )
Using Platinum and Supported Rhodium Catalysts in
Acetic Acid at 30° • . • . • • • • • • • • . • • • • 75
XII . Comparison of Activation Energies ( cal./mole ) Using
Platinum and Supported Rhodium Catalysts in Acetic
Acid at 30°. • • • • • . • • • 0 • II) • 0 Q • • • • 0
PART II
I. Catalyst Weight Runs for Deuterium Methanol Ex-
76
change . • . . . • . • • . . . . . . . . . . . . . . 110
II. Comparison of Catalysts for the Deuterium-Methanol
Exchange Reaction. . • • • • • • • • • . • • • • lll
III . Zero Order Rate Constants for Deuterium-Methanol
Exchange at 35°. . . • • .. • • . • • . . , • • • . .
IV. Rate Cons tants at Various Temperatures f or Deuterium-
116
Methanol Exchange . • • • • • • • • • . • • • • • • • 119
V. The Effect of Ni tromesi tylene Upon t he Exchange of
Deuterium With Methanol Over Raney Nickel at 35°
for Ten Minutes. • • . . . • • • • • • • • .. • • . .
VI. The Effect of Some Nitro Compounds Upon the Exchange
of Deuterium With Methan ol Over Raney Nickel at 35°
122
for Ten Minutes . • • • . • • • • . • . • . • • . • • 123
FIGURE
LIST OF FIGURES
PART I
1. Plot of �P/10 min., versus Catalyst Weight for Hydro
genation of Nitrobenzene in 50 Ml. Acetic Acid at
300. • • • • • • • • • • • • • • 0 • • • • fr 0
2. Plot of �P/lOMin" (Corr.) versus p.s.i.a. for Hy-
drogenation of Nitrobenzene • • • • • • • • • • • • •
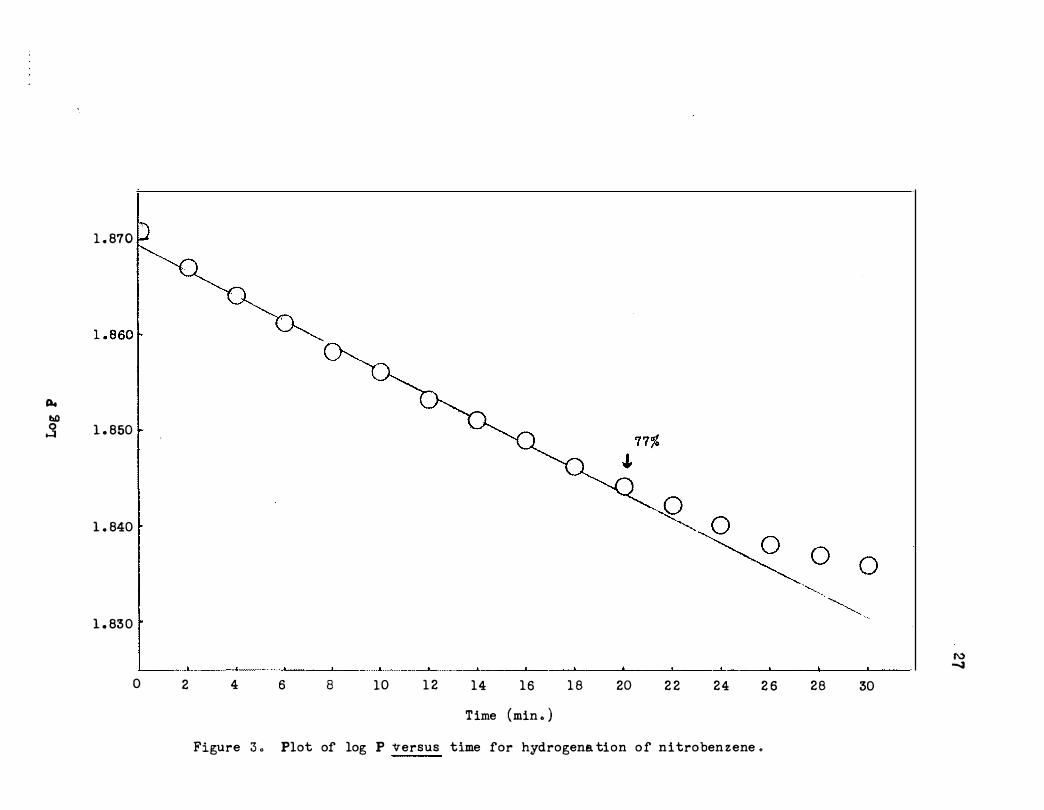
3. Plot of log P versus Time for Hydrogenation of Nitro-
PAGE
26
benzene. . . . • . . . • . . . . . . . . • . . . . . 27
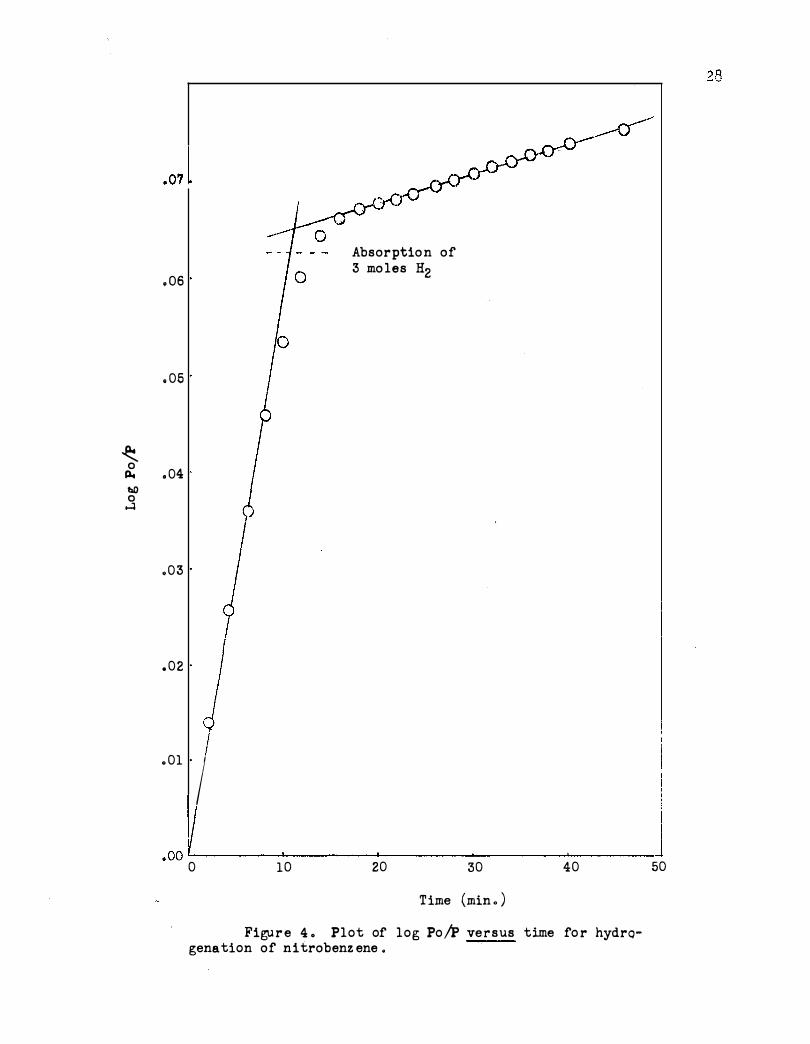
4. Plot of log P0/P versus Time for Hydrogenation of
Nitrobenzene • o o • • • • • • • • • • • • • • •
5. Activation Energy Plot for the Hydrogenation of
Nitrobenzene • • • • • • • • • • • • • • • • • •
• 0
• •
28
30
6. Plot of log P versus Time for Hydrogenation of Nitro
benzene Showing Break Points • • • • • • • • • • • • 34
7. Plot of log P versus Time Showing Lack of Poisoning,
for Hydrogenation of Nitrobenzene Over Supported
Rhodium. • • • • • • • • • 0 • • • • • • • • • •
8. Plot of �P/10 Min. (Corr.) versus Catalyst Weight
for Hydrogenation of beta-Nitrostyrene in 25 Ml.
36
Acetic Acid at 300 • . • • • • • • • • • • • • • 38
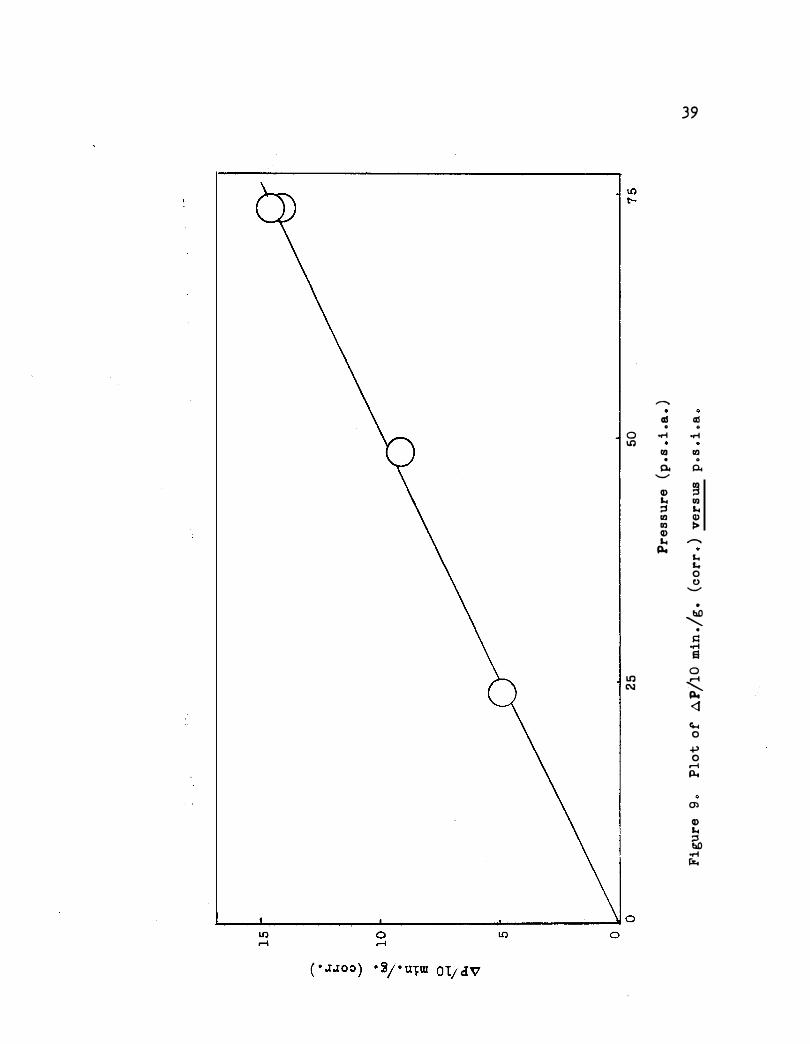
9. Plot of �P/10 Min./g. (Corr.) versus p.a.i.a. • • • 39
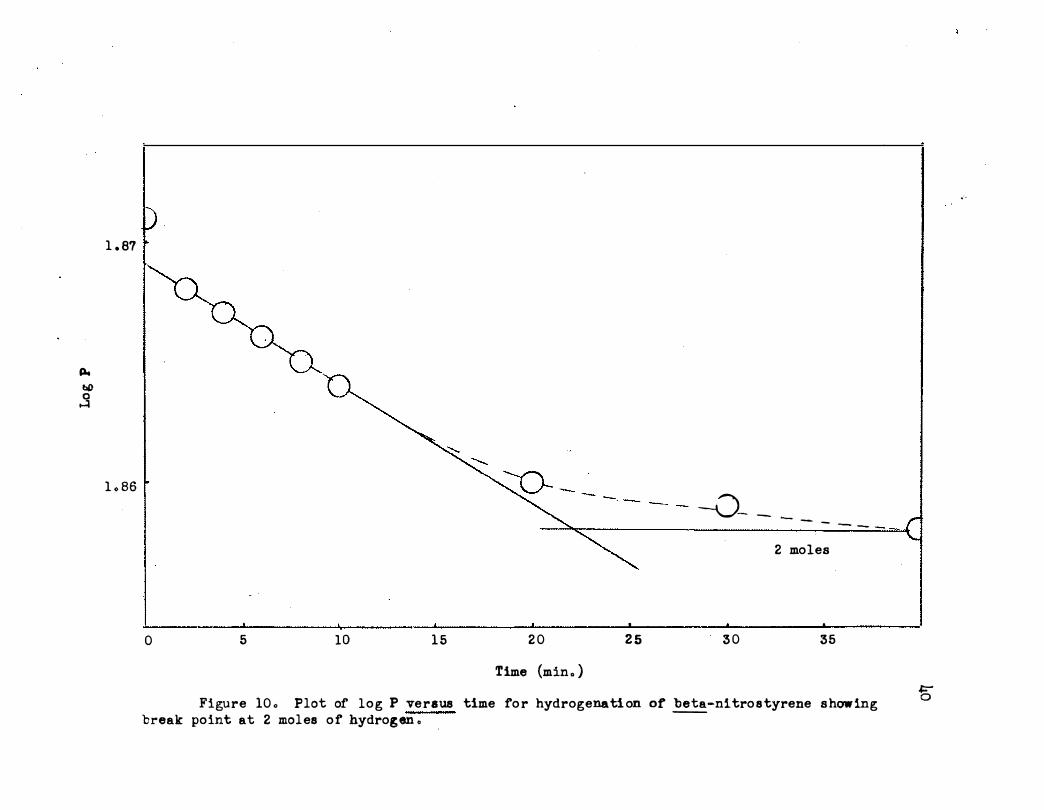
10. Plot of log P versus T.ime for Hydrogenation of beta
Nitrostyrene Showing Break Point at 2 Moles of Hydro-
gen. . . . . . . . . . . . • • . . . . . . . o o • o 40
X
FIGURE PAGE
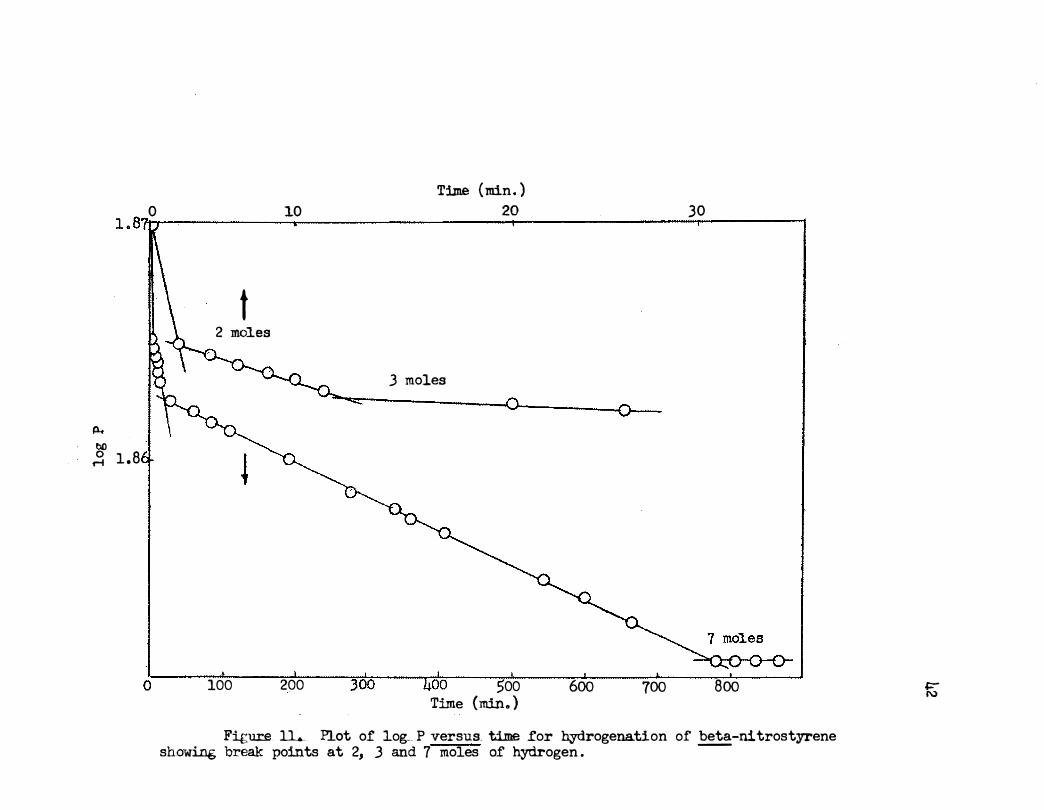
11. Plot of log P versus Time for Hydrogenation of
�-Nitrostyrene Showing Break Points at 2, 3
and 7 Moles of Hydrogen . • • • • I) 0 0 0
1� . Activation Energy Plot for the Hydrogenation of
42
beta-Ni trostyrene • • • • • • • • • • • • • • • • • 47
13 . Plot of �P/10 Min. versus Catalyst Weight for Hydro
genation of Nitroethane • • • • • • • • • • • • • • 49
14 . Plot of �P/10 Min. (Corr . ) p . s .i.a. for Hydrogena-
tion of Ni troethane • • • • • • • • • • • • • o • • 50
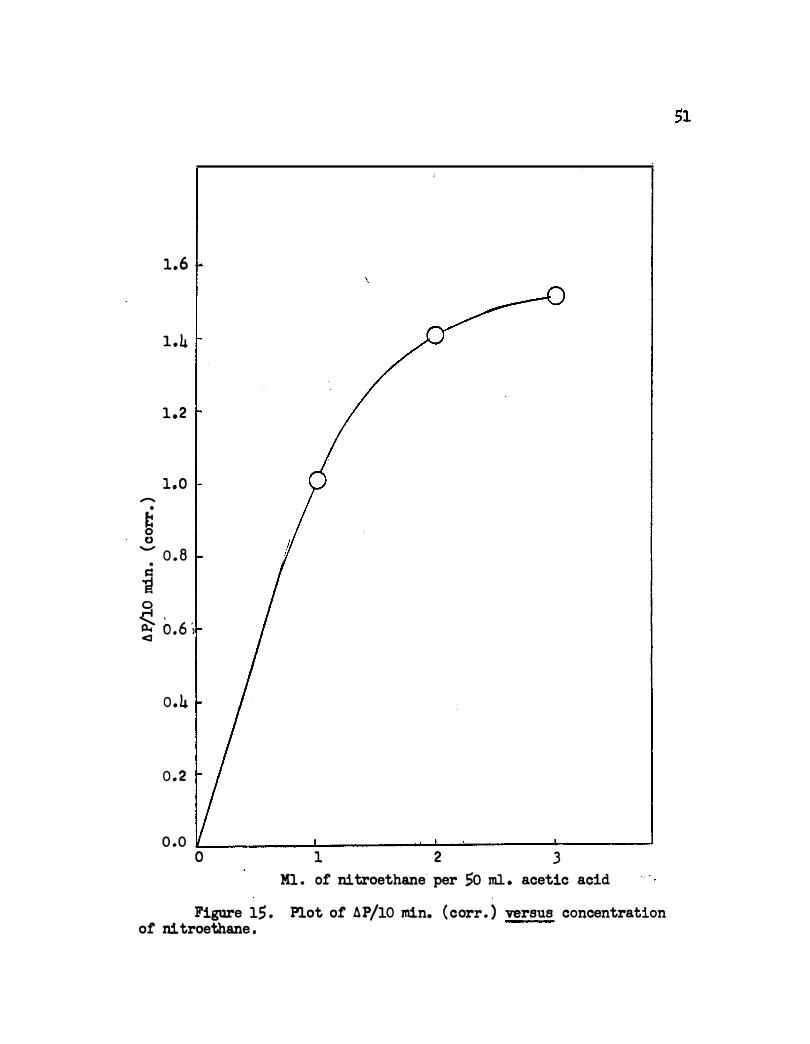
15. Plot of �P/10 Min. (Corr . ) versus Concentration of
Nitroethane • • • • • • 0 • • • • • • • • • • •
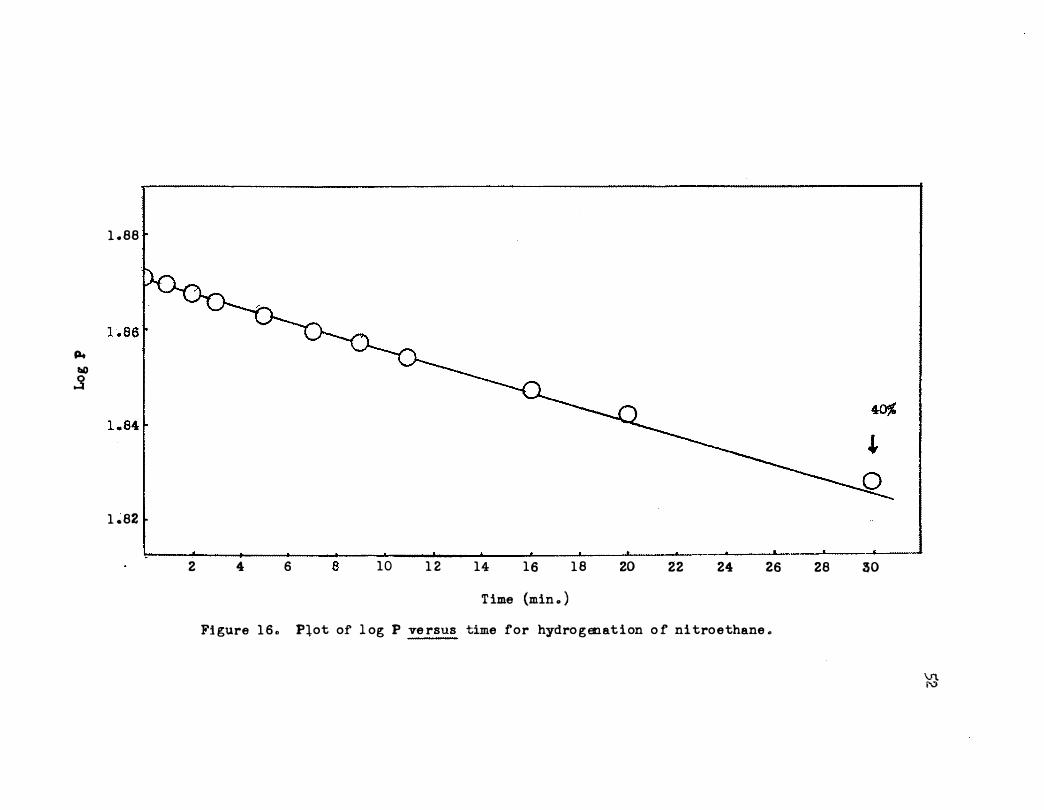
16 . Plot of log P versus Time for Hydrogenation of
Nitroethane • • • • • • • 0 • • •
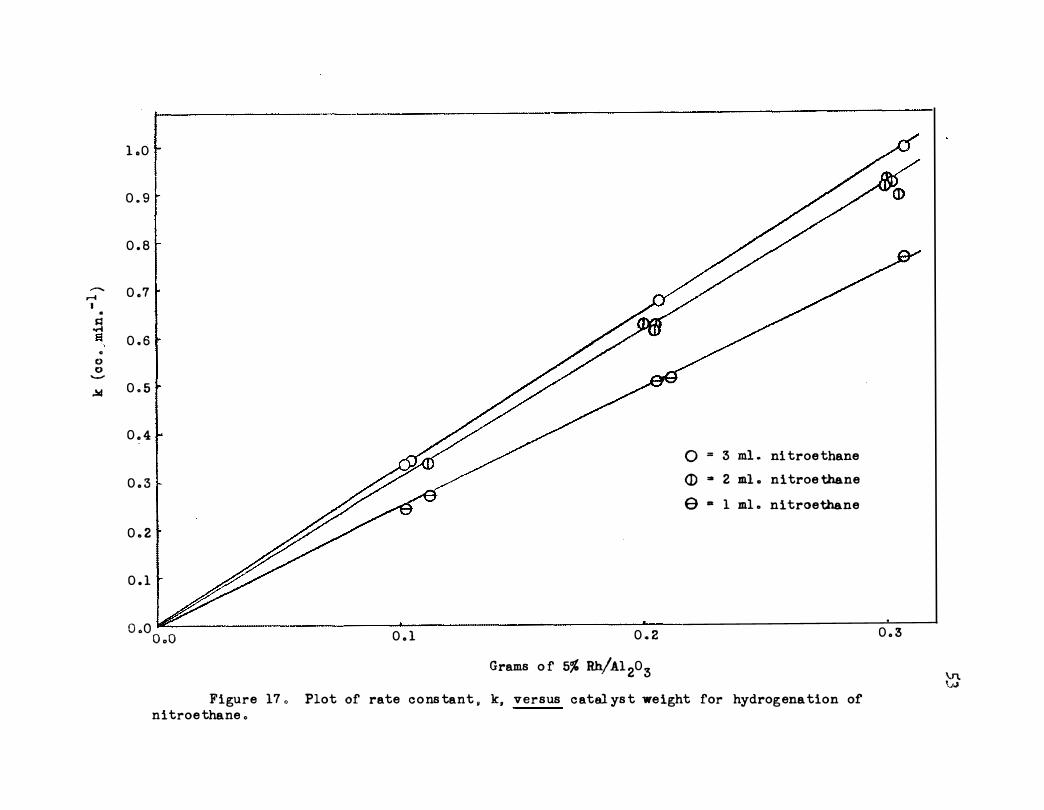
17. Plot of Rate Constant, k, versus Catalyst Weight
. .
51
52
for Hydrogenation of Nitroethane • • • • o • • • 53
18 . Activation Energy Plot for the Hydrogenation of
Nitrobenzene . • . • • • • • • • • 0 • • • 0 • • 56
19. Plot of log P versus Time for Hydrogenation of Nitro
ethane Showing Break Point at 2 Moles of Hydrogen o 57
20 . Plot of �P/10 Min . (Corr. ) versus Catalyst Weight
for Hydrogenation of Nitromesitylene . • • • • • • • 58
21. Plot of �P/10 Min./g . (Corr . ) versus Acceptor Con-
centration for Hydrogenation of Nitramesitylene 60
22 . Plot of log P versus Time for Hydrogenation of
Nitromesitylene • • • • • • • • • • • • • . • • 61
xi
FIGURE PAGE
23. Activation Energy Plot for the Hydrogenation of
Nitromesitylene. • • • • • • • • • • • • • • • • • • 64
24. Plot of log P versus Time for Hydrogenation of
Nitromesi tylene Showmg Break Points at 1, 2 and 3
Moles of Hydrogen. • • • • • • o o o o 0 o o • • 65
25. Plot of �P/10 Min. (Corr.) versus Catalyst Weight
for Hydrogenation of 2-Nit ro-1-butene • • • o o . . .
26. Plot of log P versus Time for Hydrogenation of 2-
66
Nitro-1-butene • • • • o • • o o • • • • o • • • • • 68
27. Plot of log P versus T:ilne for Hydrogenation of 2-
Nitro-1-butene Showing Break Point at 1 Mole of
Hydrogen • • • . . . . . . . . . . . . .
28. Plot of log P versus Time for Hydrogenation of 2-
Nitro-1-butene Showing Break Point at 2 Moles of
Hydrogen . . . . . • . . . . . . . . . . . ·
. .
. .
29. Activation Energy Plot far the Hydrogenation of 2-
Nitro-1-butene • . . . . .
PARI' II
70
71
73
1. Diagram of Manifold and Effusion System. • • • • • • 98
2. T he Effect of Catalyst Weight, Method of Washing,
am Aging Upon the Exchange of Deuterium With
Metllanol . . . . • . . . • . . • . • • . . . •
3. Effect of Shaking Rate Upon the Methanol-Deuterium
• 109
E:x' cllange • • • • • . • • • • • • • • • • • • • • • • 11.3
FIGURE
4 . The Effect of Initial Deuterium Pressure Upon the
Methanol-Deuterium Exchange Reaction • • • 0 • •
:xii
PAGE
114
5. Zero Order Plot of Deuterium�ethanol Exchange • 118
6. Activation Energy Plot for Deuterium�ethanol
ExcllaiJge e ct • e • • • • • • • • • . . . . . .
7. Effect of Nit romesitylene Upon tre Exchange of
Deuterium With Methanol. • • • • • . . . . . . .
120
124
8. Effect of Some Nitro Compounds Upon the Exchange of
Deuterium With Methanol. • • • • • • • • • • • • • • 125
PART I
THE CATALYTIC HYDROGENATION OF NITRO CCMPOUNDS OVER SUPPORTED RHODIUM
IN ACETIC ACID
CHAPI'ER I
INTRODUCTION
A. Historical
Interaction between gases in contact with a catalyst is a common
phenomenon and was explained in 1833 by Faraday in terms of the attrac
tion between the surface of a catalyst and the gases.1 Other investi
gators believed that the gases dissolved in the catalyst forming a solid
solution with accompanying dissociation to give particles which could
react more rapidly. Berzelius used the concept of a •catalytic forcen
which was supposed to influence the reactions . 2 The catalytic substances
were unchanged chemica.lJ.Jr at the end of the reactions that he studied .
Langmuir3 in 1916 determined the extent of dissociation of hydrogen
gas on tungsten wire by measuring the heat loss by convection from the
heated wire a:rxl showed that the reaction nmst occur on the surface of the
wire . From a consideration of the unsaturated forces holding the hydrogen
atoms on the surface, he derived the important adsorption isotherm equa
tion, which makes the assumption that adsorption is limited to a uni
molecular layer . The valence forces holding the molecules on the sur
face constitute chemical bonds .
A qnantum mechanical treatment, using for a model a metal in Which
electrons move freely through a potential field, shows that the potential
energy of the electron in the surface of the metal is lowered due to an
overlap (exchange phenomenon) giving an electron-pair; the seoond elec-
2
tron comes from the metal.4 The donor-acceptor bond type has been dis
cussed in a recent publication.5 Pollard6 believes that only one elec
tron in the bond is probable so that a stable charge distribution can
e:::x:iat. The simplest possible example might be the H2+ bond.
Roberta 7 verified Langmuir's assumption by showing that sufficient
hydrogen was adsorbed to cover a tungsten wire in a unimolecular layer,
if a reasonable roughness factor was assumed. He used the same type of
apparatus as Langmuir's. Langmuir8 described two types of bimolecular
catalytic reactions:
(1) The two gases compete for sites in the chemisorbed mono
layer, and adjacent particles react.
( 2) One chemisorbed substance reacts with another which is in
a van der Waals layer or in the gas phase.
The first is called the Langmuir-Hinshelwood meahanism;9 the second,
the Rideal-Eley mechanism.lO,ll A knowledge of the surface coverage will
tell which of these two mechanisms is more important for a given case.
Physical or van derWaals adsorption is weak and not too important
in catalytic reactions. Most surface reactions occur by means of chemi
sorbed intermediates. Four features of chemisorption are giveml2a
(1) A complete moftolayer saturates the catalyst toward further
chemisorption.
( 2 ) An appreciable activation energy may exist and thus the process
is slow.
(3) Adsorptive capacity over the catalyst surface varies widely.
(4) The heat of chemisorption is high (10 to 100 kcal. per mole).
3
B. Definitions
The rate of a reaction is usually expressed in terms of the moles
or liters of reactant consumed per unit time. Letting n be the moles of
reactant at time t, the rate is given by -dn/dt. Also the rate can be
expressed in terms of the product. If n' is the number of moles of prod
uct at time t, the rate is +dn1/dt. When concentration is used, the ex
pression for the rate of consumption of reactant is -dc/dt; for pressure,
one has -dp/dto The rates expressed in different units are related by
the definition of molar concentration9 c = n/V, and by the definition of n pressure for an ideal gas, p � -v- RT.
The order of a reaction is the sum of the powers of the concentra-
tion terms expressed in the rate of the reaction. Thus the order for the
reaction, A + B � products, is the sum of the powers, a and b9in the
rate expression�
-dc/dt • k CAa eBb
Also the reaction is of the na"th order in A and "b"th order in B. For
many reactions, such as surface reactions, the overall order may be complex
and nonintegral. The moleoularity of the reaction is the number of mole-
cules involved in the reaction and tells nothing about the experimentally
determined kinetic order.
The rate constant or specific reaction rate constant is the rate
for unit concentrations or quantities of reactants. For a surface reaction
the constant is dependent upon the surface area and the volume of the gas.12b
For a series of determinations using a catalyst with an essentially con-
stant activity, the surface area is constant per weight of catalyst and
4
the specific reaction rate constant remains the same. The rate con
stants must be corrected to the same volume as shown by Smith and Fuzek.13
The activation energy for homogeneous gas reactions has been de-
rived from statistical thermodynamics and has in many cases agreed with
the experimentally determined energy.. The significance of this energy
is that only molecules with at least this energy can react upon collision
if steric and localization factors are favorable,. The activation energy
is the energy which the reactants in their average energy state need in
order to give an activated complex, which in turn can then give products.
For heterogeneous reactions, the surface should be considered as
one of the reactants since bonds to the adsorbed reactants are due to
forces equivalent to chemical bonds. The solvent, which ma:y affect the
bonding, could also be considered as one of the reactants., The activated
complex would be composed of the usual reactants, catalyst, and solvent.
The catalyst lowers the energy of the activated complex and thus the re
actants adsorbed need less energy to react than they would without the
cat.a.lJst.
The activation energy, E, is obtained from experimental results
by means of the Arrhenius equatiom
k "" A. e-E/RT 'Where k is the rate constant, R is the gas constant, A is a proportion
ality constant, and T is the absolute temperature. A. plot of log k versus
1/r should give a straight linEt of slope m, where
m = -E/2 • .3 R •
5
Actually an apparent activation energy is usually obtained for
h$terogeneous reactions due to the heat o! adsorption of the reactants
and desorption of the products. If the surface is completely covered
with the reactant, the apparent activation energy and true activation
energy are the same. However when two reactants are involved such as
in hydrogenations, the kinetics are more complicated, and the apparent
activation energy may include the heat of adsorption of the hydrogen and/
or the acceptor plus the heat of desorption of the products.
C. Kinetics of Surface Reactions
1. �Rate-controlling Ste;e
Heterogeneous reactions at a surface are accomplished by adsorption
and activation of the reactants. Five steps can be visualized .for the
total reaction: 14
(1) Diffusion of reactant molecules to the surface.
( 2) Adsorption of reactant molecules.
(3) Reaction on the surface.
(4) Desorption of products.
(5) Diffusion of products from the surface.
For liquid-gas reactions over a catalyst, steps (1) and (5) can be the
slow rate-determining steps. This .. is prevented by sufficiently rapid
shaking of the reaction mixture so that diffusion will not be rate
controlling. Also it is necessary to use a sufficiently small amount of
catalyst so that the rate of the reaction will be directly prQportianal
6
to the catalyst weight and thus independent of the diffusion effects.
This leaves (2), (3) or (4) for the rate-controlling step. How-
ever, distinguishing these is not necessar,y for elucidating the kinetic
behavior.15 If one assumes that the rate is determined b.y the rate of
adsorption or by the surface reaction, the same expression for the rate
constant is obtained. Steps (2) or (4) would be expected to be the slow
step if the activation energy of adsorption or desorption is high, com-
pared to the activation energy of the surface reaction.
2. First Order Mechanisms -
The differential equation expressing the case in which reduction
is first order in hydrogen pressure and zero order in acceptor is given by:
dP -- = kP dt
where P is the pressure of hydrogen at time t, and k is the first order
rate constant. This should be modified, as shown by Smith and Fuzekl3
for heterogeneous reactions:
dn - crt = kP
where n is the number of moles of hydrogen. Using the ideal gas law,
and assuming constant T and V, one obtainss
dn v dP - crt = - RT • � = kP.
Including the RT in a constant, k 1 , one obtains:
_ � = + k1P dt v
Integrating between limits, one obtains:
log P0/P = k't/2.3 V
7
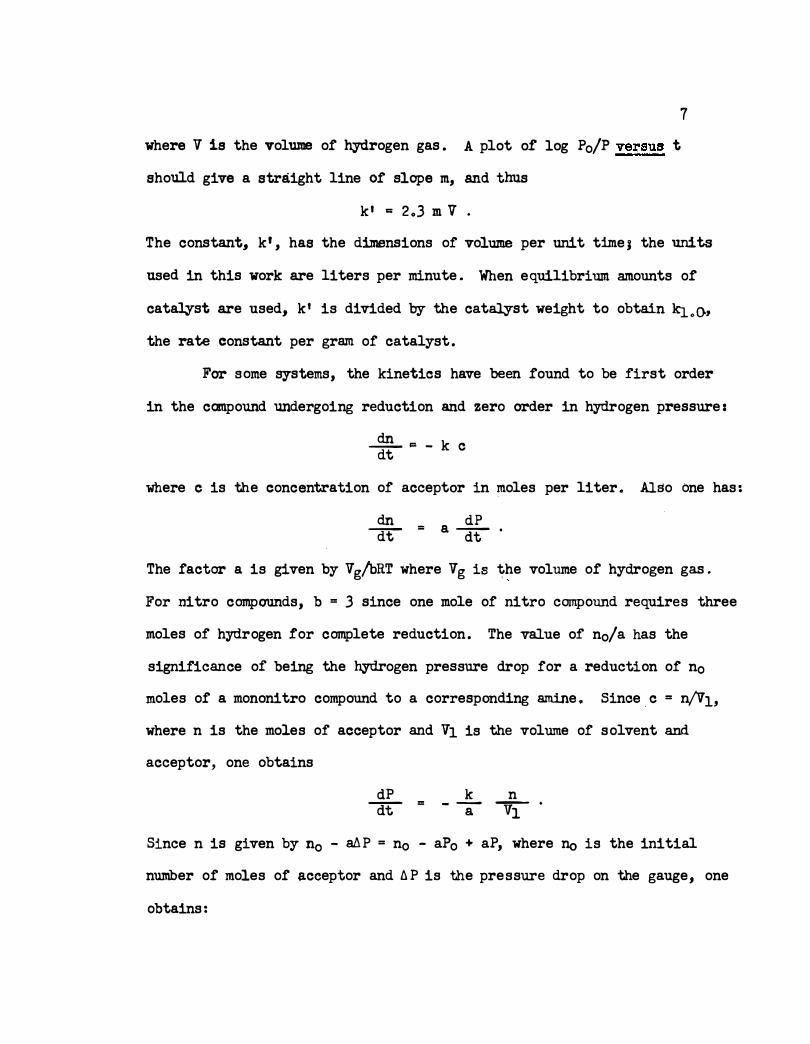
where Vis the volume of hydrogen gas. A plot of log P0/P versus t
should give a straight line of slope m, and thus
k' = 2o3 m v .
The constant, k', has the dimensions of volume per unit time, the units
used in this work are liters per minute. When equilibrium amounts of
catalyst are used, k' is divided by the cat�st weight to obtain kioo, the rate constant per gram of catalyst.
For some systems, the kinetics have been found to be first order
in the compound undergoing reduction and zero order in hydrogen pressure:
dn - �= -k c dt
where c is the concentration of acceptor in moles per liter. Also one has:
dn dP - = a - . dt dt
The factor a is given by Vg/bRT where Vg is �he volume of hydrogen gas.
For nitro compounds, b = 3 since one mole of nitro compound requires three
moles of hydrogen for complete reduction. The value of n0/a has the
significance of being the hydrogen pressure drop for a reduction of n0
moles of a mononitro compound to a corresponding amine. Since c = n/V1,
where n is the moles of acceptor and V1 is the volume of solvent and
acceptor, one obtains
dP k n ""'dt = - -a "lfl .
Since n is given by n0 -al.P = n0 - aP0 + aP, where no is the initial
number of moles of acceptor and f!P is the pressure drop on the gauge, one
obtains:
dP dt
Letting B � - k/Vl and C
= _ kno + P0k
aV1 Vl
"' -4-- {Po - ....!!9...), v1 a
�-BP + c· dt
.
Pk - '"'Vl .
one obtains:
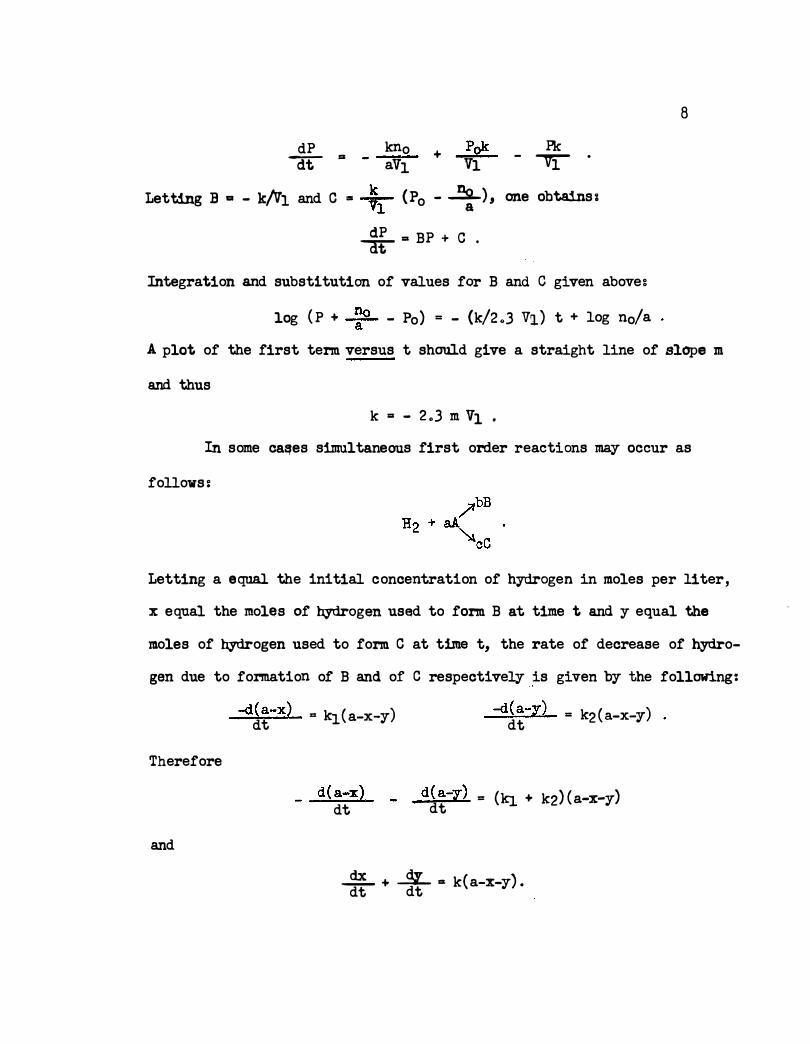
Integration and substitution of values for B and C given aboveg
log (P + � - Po) = - {k/2.3 Vl) t + log no/a
8
A plot of the first term versus t should give a straight line of slOpe m
and thus
k = - 2.3 m vl •
In some ca�es simultaneous first order reactions may occur as
follows:
Letting a equal the initial concentration of hydrogen in moles per liter,
x equal the moles of hydrogen used to form B at time t and y equal the
moles of hydrogen used to form C at time t, the rate of decrease of hydro-
gen due to formation of B and of C respectively is given by the following:
Therefore
and
-d(a-x) = ki(a-x-y) dt
d(a-x) dt
-d(a-y) = k2(a-x-y) dt
d(a-y) = (kl + k2)(a-x-y) dt
� + _3l_ = k(a-x-y). dt dt
Integrating between limits,
log a
= kt/2.3 a-x-y
9
is obtained where k is the sum of the rate constants for the simultaneous
reactions. This case applies if two groups in a reactant have been
simultaneously activated by the catalyst and simultaneously attacked by
hydrogen.
With some compounds containing two or more reducible groups, only
one is initially activated and the reaction proceeds until essentially
all of the group is reduced. Then a sudden change in rate occurs as the
second group becomes activated and begins to undergo reduction. Reaction
intermediates are thus formed and in some cases these can be.isolated.
The example of nitrobenzene giving rise to aniline as an intermediate is
an important example of this type . In the present work the complete re-
duction of �-nitrostyrene via several intermediates is a very interest-
ing example.
3. Intermediate Order Mechanisms
In some oases the kinetics are not first order in hydrogen nor first
order in acceptor but some intermediate order for a given pressure or con-
centration range. With two very different types of molecules each may be
attracted by select portions of the catalyst surface and it is possible
that the order would be intermediate with respect to both reactants.
All first order hydrogenation reactions will not follow the first
order expression throughout the reaction because, as the concentrat ion of
acceptor is reduced, the rate can become a function of the acceptor con-
centration. The reaction would thus be slowed and give devialion from
10
the first order law.
From a consideration of the Langmuir equation, it would be expected
that a reaction could be first order in hydrogen pressure at low pressures,
and zero order at high pressureso Likewise the acceptor might be expected
to follow the Langm.uir equation as was found experimentally in the present
work for some compounds. For the acceptors nitromesitylene and nitroethane,
it was found that the reactions approached first order in acceptor at low
concentrations and zero order in acceptor at high concentrations.
In the case of consecutive heterogeneous reactions, the usual mathe-
matical treatment is not valid. For two conseouti ve reactions, it is
possible that the two species will give intermediate orders for the in-
d.ividual rate constants and a very complex mathematic treatment would be
required. If the second reaction is faster than the first, no intermediate
can be isolated. The nitro group absorbs three moles of hydrogen when re-
duoed to the amine group but intermediates have not been identified chemi-
cally for the hydrogenation reactions of some nitro compounds.
For fractional order r eactions, an expression used to ascertain the
order is obtained by integrating the rate expression for an "nnth order
reaction:
to obtain:
1 1-n
( 1-n 1-n) ( ) CL -c
0 = -k t1 - t0 .
For time t2 and concentration 02, the expression is
l ( 1-n 1-n 1-n o2 - co )
= �k { t2 - to).
11
Dividing the first by the second integrated expression, one obtainsz
1-n 1-n cl - co tl - to cl-n - 0!-n
=
t2 - to 2 0
This equation gives the value for "n" when two concentrations and times
are known.
D. Catalytic Hydrogenation of Nitro Compounds
The kinetic behavior of hydrogenation for nitro compounds in
several catalyst-solvent systems has been previously elucidated.16, l7
,lB
The hydrogenation of nitrobenzene using the Adams platinum catalyst-acetic
acid s.ystem is first order in hydrogen and zero order in acceptor. For
ni troethane in the same system, the kinetics are reversed. For compounds
with a nitro group conjugated with a double bond, the kinetics are the
same as for nitrobenzene . On the basis of Langmuir kinetics, this has
been interpreted in terms of the relative strengths of adsorption on
platinum:
nitrobenzene or nitroolefin:>hydrogen:>nitroethane .
For ni tromesi tylene the kinetics were complex with an order intermediate
between zero and first for acceptor and zero and first for hydrogen.
The kinetics for reduction of aliphatic and aromatic nitro compounds
in a Raney nickel-ethanol s.rstem are first or�er in hydrogen and zero in
acceptor . Similarly for reduction in the Adams platinum catalyst-ethanol
system, the behavior is fi�rst order in hydrogen and zero order in acceptor .
12
The effects of some n1 tro compounds upon the exchange of acetic
acid with deuterium over Adams platinum catalyst were studied.l9,20 The
effects of these compounds upon the exchange rate paralleled their re
spective hydrogenation kinetics. The compounds which gave zero order
kinetics for the acceptor in hydrogenation reactions (indicating strong
adsorption) were the ones which prevented the exchange reaction in the
same catalyst-solvent systemo Other such correlations have been made
and the exchange studies are useful for elucidating the hydrogenation
kinetics.
E. Purpose of the Research
Deuterium exchange reactions have been made earlier using supported
rhodium catalyst and acetic acid solvent.21a
Compounds studied were nitramesitylene, nitroethane, aniline,
methyl ethyl ketoxime, 2-nitro-1-butene, nitrobenzene and beta-nitros�ene.
It was found that the first two gave an increase in exchange for low con-
centrations. The last four gave a decrease in exchange for all concentra-
tiona. The purpose of the present work is to elucidate the kinetics of
hydrogenation of some of these compounds in the same catalyst-solvent
system. Such kinetics coupled with the deuterium exchange data should
give some knowledge about the mechanisms involved. Also in some cases
information about the intermediates involved might be obtained directly
from the nature of the hydrogenation plots and by direct isolation.
CHAPTER II
EXPERIMENTAL
A. Supported Rhodium Catalyst
A detailed review of the function of a catalyst support is given
in the literature.22 Some of the functions are that it may reduce shrink
age, give physical strength, prevent sintering of the catalyst by heat
dissipation, take up catalyst poisons, and give increased activity per
unit w ei ght of catalyst used. Two important types of supported rhodium
catalyst are 5 per cent rhodium on carbon and 5 per cent rhodium on
alumina. The latter was used in this work.
Five per cent rhodium on alumina is effective for the reduction of
many substituted aromatic and heterocyclic compounds and has been shown
to be somewhat more active than 5 per cent platinum on alumina.23
The
activity of rhodium on asbestos appears to be about the same as platinum
on asbestos.24
It was found that with platinum, rhodium, iridium,
ruthenium, and palladium catalysts, only the first two continued to cata
lyze the hydrogenation of benzene at high temperatures.
The mechanism for rhodium catalyzed reductions has been reported to
be different from that with palladium. The rate of hydrogenation of
nitrobenzene over colloidal rhodium was sensitive to the pH whereas over
colloidal palladium it was not.25
In addition, it was found that
the rate of reduction over rhodium of nitro groups attached to aro-
14
matio rings was dependent upon the substi tutents ot the ring.*
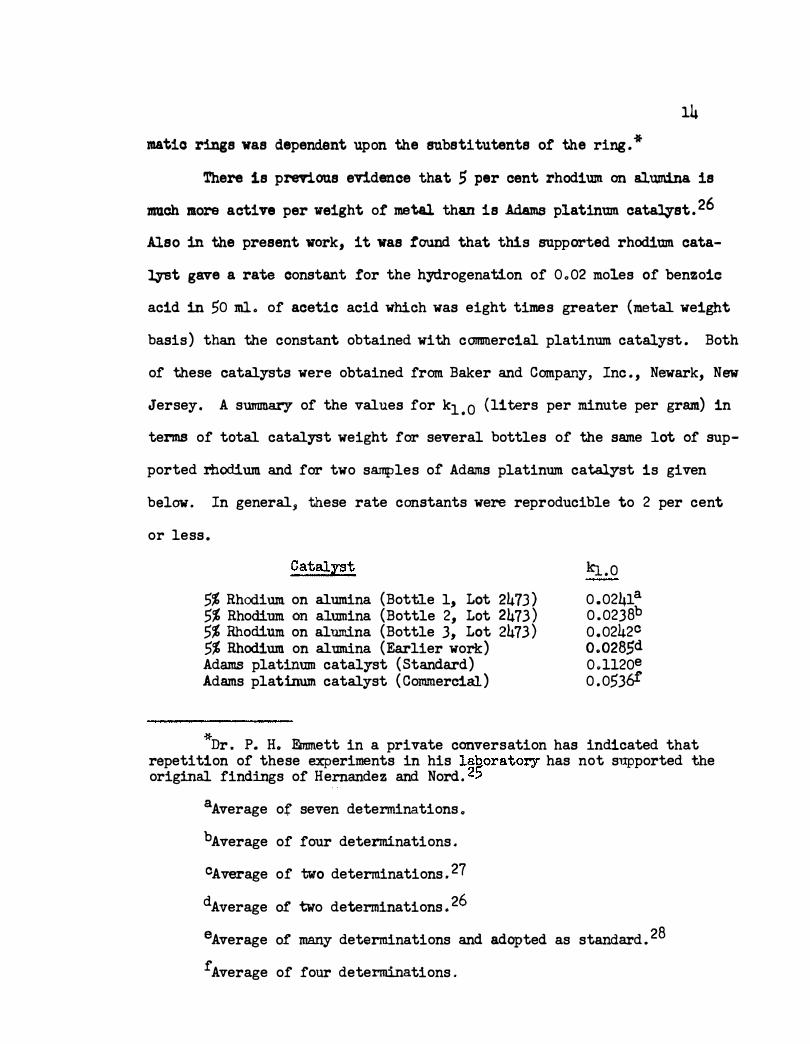
There is previous evidence that 5 per cent rhodium. on alumina is
m.uch more active per weight ot metal than is Adams platinum catalyst.26
Also in the present work, it was found that this supported rhodium cata
lyst gave a rate constant tor the hydrogenation of Oo02 moles of benzoic
acid in 50 ml. of acetic acid which was eight times greater (metal weight
basis) than the constant obtained with commercial platinum catalyst. Both
of these catalysts were obtained from Baker and Company, Inc., Newark, New
Jersey. A summary of the values for k1•0 (liters per minute per gram) in
terms of total catalyst weight for several bottles of the same lot of sup
ported rhodium and for two samples ot Adams platinum catalyst is given
below. In general, these rate constants were reproducible to 2 per cent
or less.
Catalyst
5% Rhodium on alumina (Bottle 1, Lot 2473) 5% Rhodium on alumina (Bottle 2, Lot 2473) 5% Rhodium on alumina (Bottle 3, Lot 2473) 5% Rhodium on alumina (Earlier work:) Adams platinum catalyst (Standard) Adams platinum catalyst (Commercial)
k1.0
0.0241a 0.0238b 0.0242C 0 . 0285d O .. ll20e 0.05361'
*nr. P. H. Emmett in a private conversation has indicated that repetition of these experiments in his laQoratory has not supported the original findings of Hernandez and Nord. 25
8Average of seven determinations.
bAverage of four determinations.
CAverage of two determinations.27
dAverage of two determinations.26
•Average of many determinations and adopted as standard. 28
fAverage of four determinations.
15
Since essentiallY the same rate constants were obtained with
three different bottles of this commercial catalyst over a period of
several months, it was concluded that a correction to a standard cata-
lyst vas unnecessary for the series of hydrogenations made in the present
work.
B. Other Materials
1. Acetic Acid
E. I. du Pont c. p. glacial acetic acid was fractionated through an
eight-foot Vigreux columo Constant boiling cuts were collected at renux
ratios or about 10�1. A typical cut boiled at 116.3° ( constant) at 746.0
mm. Hg.
2. Benzoic Acid �
Eastman white label benzoic acid was used without further purifica-
tion.
3 . Hydrogen
Commercial electrolytic hydrogen obtained from the National Cylinder
Gas Compa.rJY' was used without further purification. This hydrogen has been
shown to be satisfactory for catalytic hydrogenations.33
4. Nitrobenzene
Matheson, Coleman and Bell white label nitrobenzene was first steam-
distilled and dried twice over anhydrous magnesium sulfate. It was then
distilled in vacuo through a thirteen-foot helix-packed column equipped
16
with a total condensation, variable take-off head. The material was
collected at a reflux ratio of 15:1. The pressure was regulated with
a manostat using a modified magnetic relay as the flutter control. A
typical cut boiled at 95.5° (constant) at 19 mm . Hg.
5. Ni troethane
Matheson, Coleman and Bell white label nitroethane was fractionated
through a thirteen-foot helix-packed column, at a reflux ratio of 10:1.
A typical cut boiled at 113.0-113.1° at 743.7 mm . Hg.
6. Nitromesitylene
Nitromesitylene was prepared by nitration of mesitylene as given
in Organic Syntheses.29 The crude product was treated with activated
charcoal, and recrystallized three times from ethanol-water solutions to
give a pale yellow crystalline material, m.p. 43.2-43.7° {reported 43-
440).29
7. �-Nitrostyrene
beta-Nitrostyrene was prepared by the base-catalyzed condensation
of benzaldehyde with ni tromethane . 30 The crude compound was treated with
activated charcoal and recrystallized three times from absolute ethanol,
yielding a bright yellow material, with long needle-like crystals, m.p ..
57.2-57.7° (reported 57-58°).3°
8. 2-Nitro-1-butene
2-Nitro-1-butene was formed by warming 2-nitro-l-butyl acetate to
split out acetic acid.18 2-Nitro-1-butyl acetate was synthesized by
17
esterification of 2-nitro-1-butanol with acetic acid. The 2-nitro-1-
butanol, donated by Commercial Solvents Corporation, was distilled �
vacuo from a 50-ml. flask, using a two-foot Vigreux column, to yield a
clear, pale yellow liquid, b .p. 103.5-106.5°/8 mm. In a 1000-ml., round-
bottom flask equipped with a water-cooled reflux condenser were placed
50 ml. of purified 2-nitro-1-butanol, 70 ml. of c.p. acetic annydride,
and 70 ml . of c .p. acetic acid. Upon addition of one drop of sulfuric
acid the reaction began . The mixture was heated at reflux for one hour
and while warm, water was added slowly to decompose the unreacted acetic
anhydride. The mixture was cooled and 200 ml. of distilled water was
added causing the ester layer to separate. The water layer was extracted
with ether and the combined ester and ether solutions were placed in a
1000-ml . , round-bottom flask equipped with a heating mantle, stirrer, and
reflux condenser. Two hundred milliliters of 15 per cent sodium bicar
bonate solution was slowly added to the flask through the condenser. The
mixture was heated at reflux for about twenty minutes, after which time
evolution of carbon dioxide had almost ceased. The organic layer was
separated and the aqueous portion was extracted with ether. The combined
ether extracts were steam distilled under the hood. The olefin, collected
under sodium bicarbonate solution, was dissolved in ether and the solu
tion was dried over anhydrous magnesium sulfate in a refrigerator over
night. After the magnesium sulfate was removed by filtration, the ether
was allowed to evaporate yielding the crude nitroolefin. The olefin was
purified by fractional distillation in � in a two-foot Vigreux column
to yield a bright yellow, oily liquid, b.p . 34°/9 mm., n�0 1.4381 ( reported
18
60.8/46 mm., n6° 1.4382).21b 2-Nitro-1-butene is highly lachrymatory,
and polymerizes readily. The product was stored in screw-cap bottles
in the refrigerator, and was used soon after preparation. The compound
was sent for analysis since a literature search did not reveal that the
compound had been previously analyzed.
Anal.* Calcd. for C4ff7N02g C, 47.49J H, 6.98; N, 13.85.
Foundz C, 47.23; H, 6.97J N, 13.10.
9. Aniline
A sample of aniline previously fractionated by E. L. McDaniel2lb
was refractionated using a �ee-foot Vigreux column to yield a clear
colorless liquid, b.p. 106.2-106.4°/59 mm., nfiO 1.5860 (reported 101.9°/
50 31 2o 1 �8632) mm., nn ·::> •
C. Law-pressure Hydrogenations
1. Apparatus and Procedure
A low-pressure Parr apparatus containing certain modifications
allowing more precision was used. The hydrogen pressure gauge was re-
placed with an Ashcroft testing gauge, which was graduated from 0 to 60
p.s.i. in subdivisions of one-fourth p.s.i. This permits a rough esti-
mation to the nearest five-hundredths of a pound. The standard hydrogen
tanks provided were replaced with smaller tanks so that small samples
could be hydrogenated with a relatively large drop in pressure. The
*Analysis was made by Weiler and Strauss Microanalytical Laboratories, Oxford, England.
19
volumes, including reaction bottles and connections, of the two systems
used were found to be 1.16 and 1.86 liters.
All rubber hose and stoppers on the apparatus were boiled in 20
per cent caustic solution to remove any catalyst poisons. Acetic acid
attacks the rubber stopper and hose so that replacements are needed from
time to time. The bottles were cleaned with warm chromic acid solution
and rinsed ten times with tap water and ten times with distilled water.
Steam cleaning was found to be unnecessary.
When the reaction rate was a function of concentration, the liquid
acceptor and solvent were introduced into the reaction bottle by means
of pipettes. Solid materials were weighed to the nearest 0.01 g. The
solvent was added first and allowed to reach the temperature of the bath
water; then the acceptor was added followed by the catalyst. This was
followed by evacuation of the bottle and filling with hydrogen. It was
found that the usual three evacuations and fillings of the bottle were
not always adequate to prevent poisoning during a run . As a precautionary
measure, the bottles were evacuated and filled with hydrogen at least
five times. This procedure resulted in runs free from poisoning. Sub
sequently, the bath temperature, hydrogen reservoir temperature, atmos
pheric pressure and initial pressure were recorded. The shaking was
begun, and pressure readings were recorded at one to five minute inter
vals. As the rate decreased, longer time intervals were taken. At the
end of the reaction, the bottle was evacuated and removed from the
apparatus. In order to prevent impurities from entering the apparatus
while standing idle, a pipe cleaner was inserted into the hydrogen fitting
20
and the rubber stopper wrapped with absorbent tissue.
The initial hydrogen pressures for the hydrogenations were usually
60 . 0 p.s.i.g. except for the lower pressures used to study the effect of
pressure. The changes in pressure during the course of the reaction
were of the order of five to twenty pounds. The reaction bottle of the
apparatus was enclosed in a metal jacket through which water from a con
stant temperature bath was circulated. The bath was usua.l.l.y maintained
within 0. 05° of the desired temperature. Early work indicated that 0.2°
deviation gave a measurable change in the reaction rate constant. Runs
were made at 20, 30 and 40° to determine the activation energies.
For most runs, shaking of the reaction mixture and timing began
within five minutes after the vessel was filled with hydrogen. The
amount of hydrogen uptake with no shaking was negligible. Several runs
were delayed twenty minutes or more to check for leaks and the pressure
change was usually less than 0.1 p. s , i. This was not due to leaks as in
dicated by a constant pressure at the conclusion of the reaction.
The catalYst weights used were generally from 0.02 to 0.30 g.
The acceptor u� ranged from 0.5 to 2.0 g. for solids and 0.5 to
3.0 ml. for liquids. The majority of the runs were made with 1 ml. or
1 g. of acceptor and 50 ml. of glacial acetic acid.
2. Calibration
The general procedure for carrying out the hydrogenations was
essentially the same as that described previously.33 To calculate the
rate constants for the hydrogenations, it was necessary to calibrate each
apparatus by hydrogenating several weighed samples of benzoic acid, which
21
is lalown to absorb three moles of hydrogen per mole or acid. The pressure
drop is related simply by- the ideal gas law to the number of moles of ben
zoic acid, the volume of the apparatus, and the absolute temperature. A
factor of n.3u is needed since one mole of' a nitro compound requires three
moles of' hydrogen.
Values of' n0/a, where a • Vg/JRT as previously defined, were cal
culated for each compound f'or several temperatm-es so that it was p-ossible
to tell when three mol es of hydrogen had been used for the hydrogenations.
Where appropriate, other values of no/a were calculated for different
numbers of moles of' hydrogen so that other events could be ascertained.
At first it was thought necessar.y to allow for variation in cata
lyst activity- for various samples of' rhodium c atalyst. However, as ex-
plained in a previous section, it was deemed unnecessary- since three dif
ferent samples of' the same lot gave the same rate constant for the hydro-
genation of' benzoic acid in acetic acid.
For a given shaking rate the amount of catalyst can be. "Y"aried over
a limited range for which equilibrium exists and the rate of the reaction
is then proportional to the catalyst we ight. The shaking speeds used
were 216' and 282 c.p.m. It has been found that the rate constants for
several hydrogenations were virtuallY constant for shaking rates from
8 26b 200 to 2 0 c.p.m • .
3. Calculations
In order to obtain the rate constant for a reaction which is first
order in hydrogen pressure, plots of' log P versus time are made. From
22
the slope m, the rate constant is obtained: I
k' • 2.3 m V
where V is. the Tolume of hydrogen in the systemo When equilibrium weights
of catalyst are used, this constant is divided by the catalyst weight to
obtain k1. o. All compounds used in this work gaTe good plots when first
order dependence on hydrogen was assumed. Also the plots of liP/time Tersus
pressure indicate that first order dependence on hydrogen is very nearly
correct.
Other plots were made for some compounds assuming zero order be
havior in hydrogen pressure and first order in acceptor, using the ex-
pression:
log (P + n0/a - P0) = (k/2.3 V1 ) • t + log n0/a
where the symbols have been previously defined in Chapter I . HoweTer, it
was found that these plots showed a great deviation from linearity after
50 per cent reaction in the direction of increased rate. Since the first
order plots were much better, first order dependence in hydrogen is more
nearly c orrect . The activation energies f'o!' the hydrogenation of' the nitro compounds
were calculated .from the plots of log kl 0 0 versus. 1/T. The aoti vation
energy, E, is given by the following:
E = - 2.3 m R
D . Identification of Intermediates and Products
23
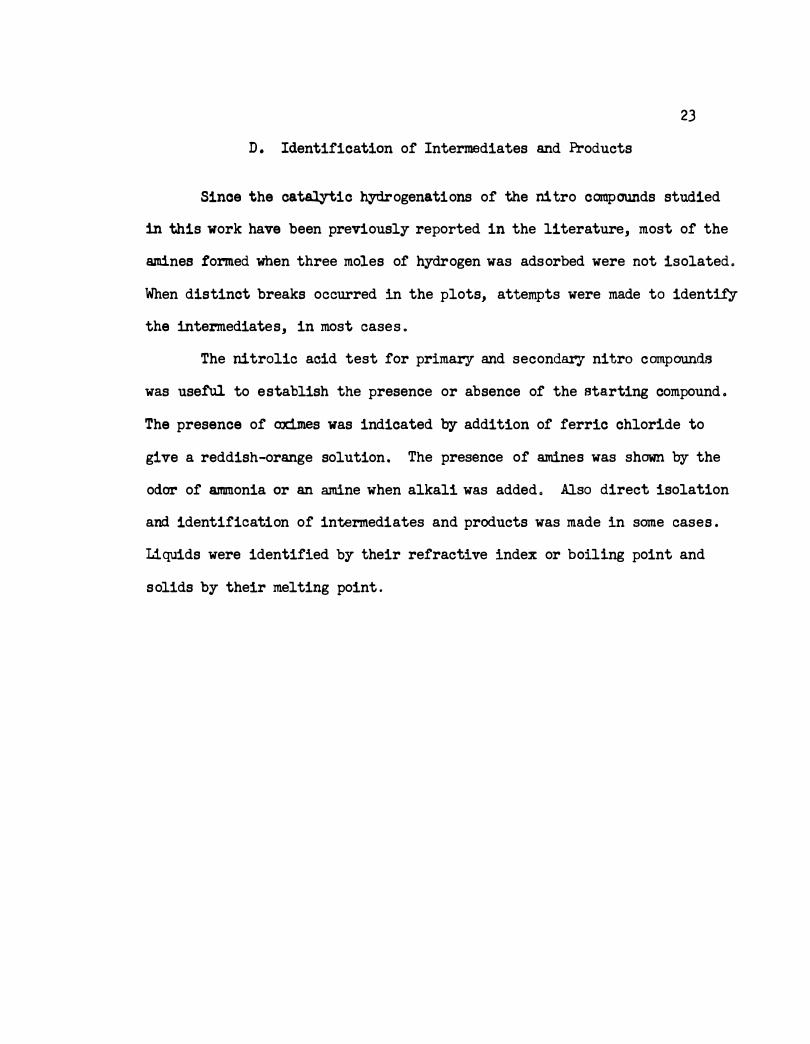
Since the catalytic hydrogenations of the nitro compounds studied
in this work have been previously reported in the literature, most of the
aminea formed when three moles of hydrogen was adsorbed were not isolated .
When distinct breaks occurred in the plots, attempts were made to identif,y
the intermediates, in most cases .
The nitrolic acid test for primary and secondary nitro compounds
was useful to establish the presence or absence of the starting compound .
The presence of aximes was indicated b,y addition of ferric chloride to
give a reddish-orange solution. The presence of amines was shown by the
odor of ammonia or an amine when alkali was added . Also direct isolation
and identification of intermediates and products was made in same cases .
Liquids were identified by their refractive index or boiling point and
solids by their melting point .
CHAPTER III
RESULTS AND DISCUSSION
A . Nitrobenzene
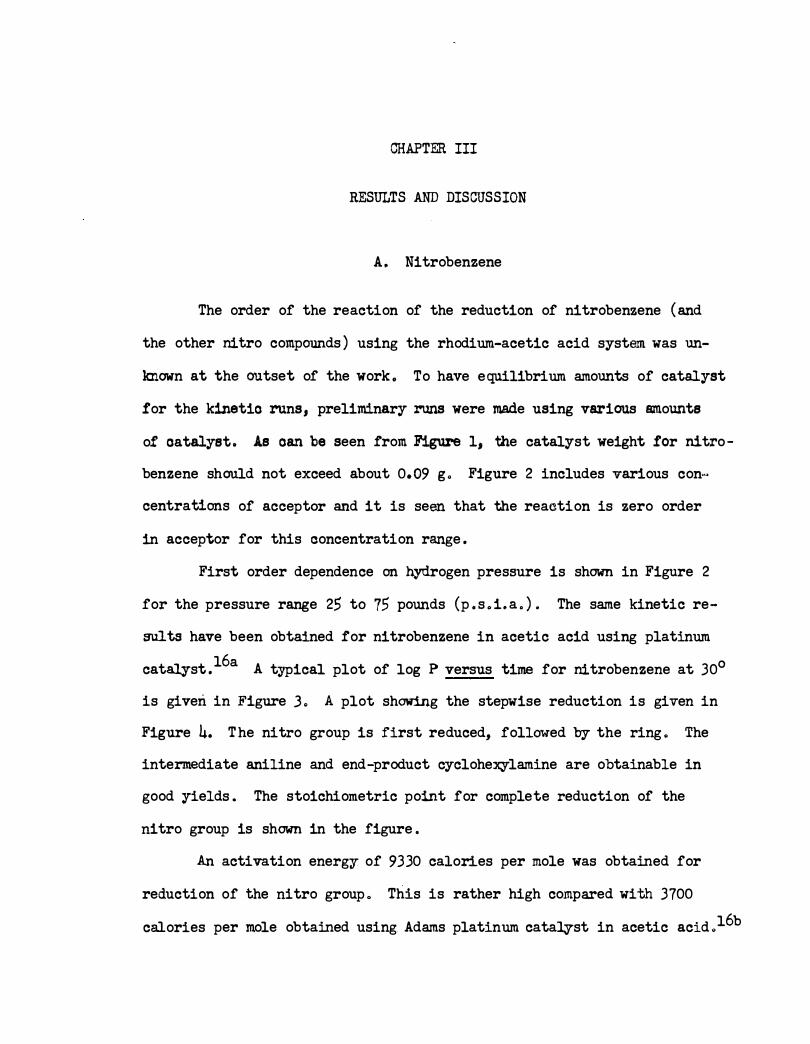
The order of the reaction of the reduction of nitrobenzene ( and
the other nitro compounds ) using the rhodium-acetic acid system was un-
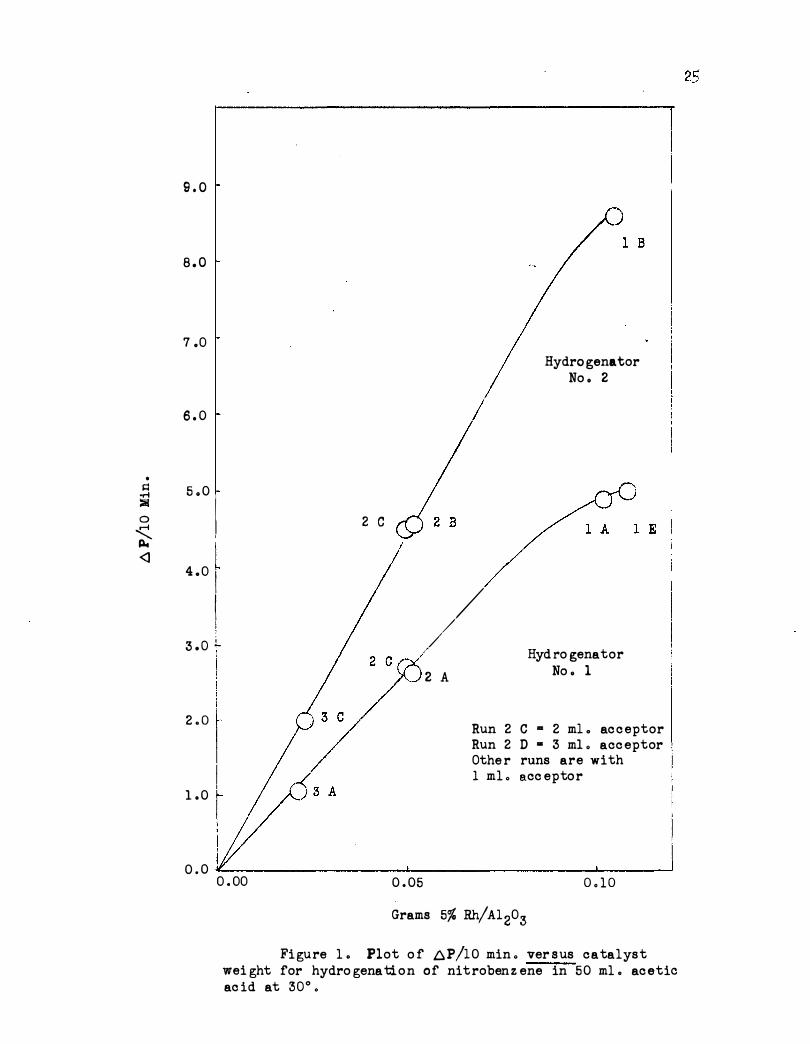
lmown at the outset of the work . To have equilibrium amounts of catalyst
for the kinetio runs, preliminary runs were made using various amounts
of catalyst. As oan be seen from Figure 1, the catalyst weight for nitro -
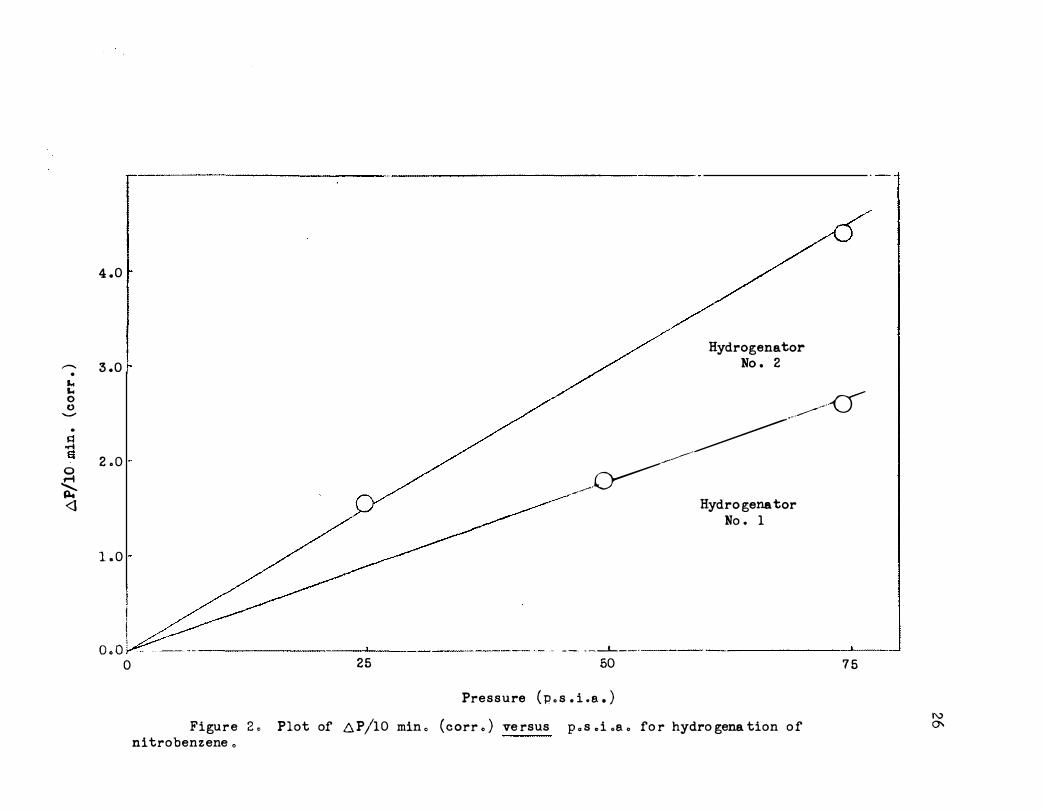
benzene should not exceed about 0.09 g. Figure 2 includes various con�
centrations of acceptor and it is seen that the reaction is zero order
in acceptor for this concentration range.
First order dependence on hydrogen pressure is shown in Figure 2
for the pressure range 25 to 75 pounds ( p . s . i. a . ) . The same kinetic re-
sults have been obtained for nitrobenzene in acetic acid using platinum
catalyst.16a A typical plot of log P versus time for nitrobenzene at 30°
is given in Figure 3 . A plot showing the stepwise reduction is given in
Figure 4. T he nitro group is first reduced, followed by the ring . The
intermediate aniline and end-product cyclohexylamine are obtainable in
good yields . The stoichiometric point for complete reduction of the
nitro group is shown in the figure .
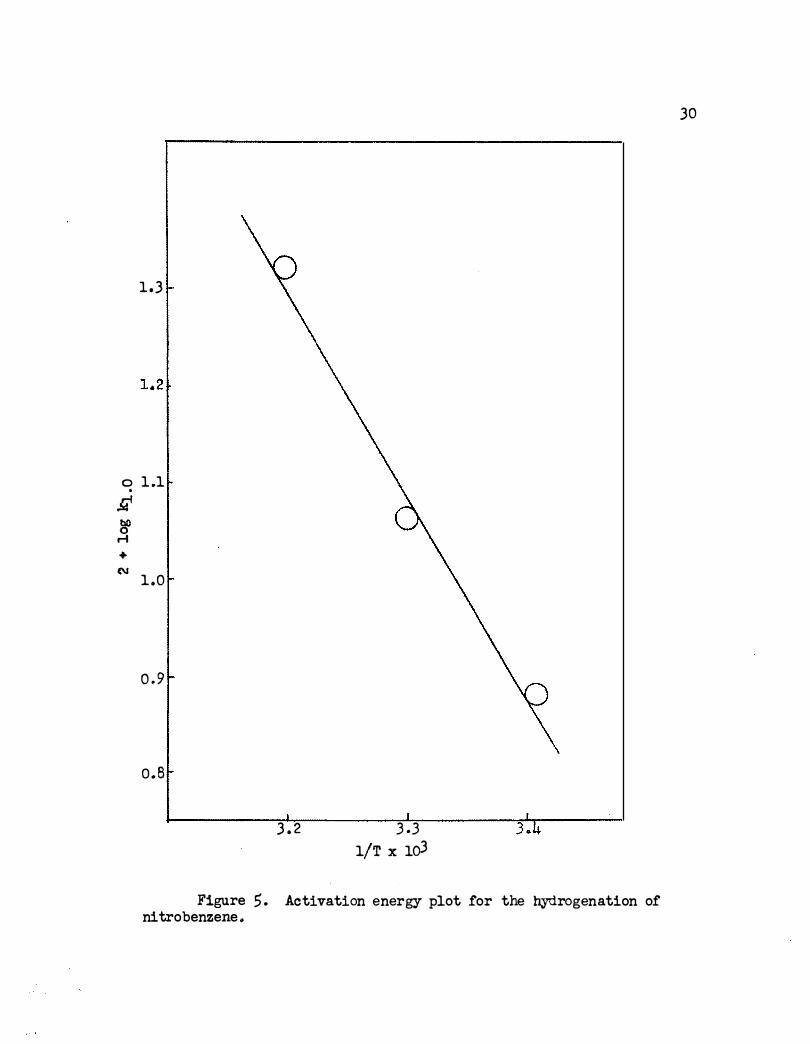
An activation energy of 9330 calories per mole was obtained for
reduction of the nitro group . This is rather high compared with 3700
calories per mole obtained using. Adams platinum catalyst in acetic acid .l6b
. �
...t :a! 0 <. Po. <l
9 . 0
8 . 0
7 .o
6 . 0
5 . 0
I 2 c I
l 4 .o I I !
3 . 0 L
2 . 0
1 . 0
// / '
2 A
Run 2 Run 2 Othe r 1 ml .
Hydro gena tor No . 2
Hyd ro gena tor No . 1
C • 2 ml . acceptor D • 3 ml . acc eptor ' runs are with acc eptor
0 . 0 L-------------------�--------------------�------�
o . oo 0 . 05 0 . 1 0
Grams 5% Rh/Al2o3
Figure l . Plot o f 6P/10 min . ver sus catalyst wei ght for hydro genation of nitrobenz ene in 50 ml . acetic ac id at 30° .
.......... •
.... .... 0 ()
-
. Q
...; a
0 r-1 � <l
4 .0
I .
3 .0 t-Hydrogenator
No . 2
2 . 0
1 . 0
O o O
I I I I
0 25
.-----0
---�� Hydro gena tor
No . 1
- -· - ---'---· __J
50 7 5
Pressure ( p . s . i . a . ) Figure 2 . Plot of 6. P/10 min . (c orr . ) ve rsus p . s .,i .a . fo r hydro gena tion o f
nitrobenzene .
rv a-
P. bl)
1 . 870
.3 1 . 850
1 . 840
1 . 830
L-------L-------L------�------J_ __ _
0 2 4 6 8
��o�o L--------L--------L �------�L-------�------�L-------
10 1 2 14 16 1 8 20 2 2 2 4 2 6 28 30
T ime (min o )
Figure 3 . Plot of log P versus time for hydrogena tion o f n itroben zene .
"' �
. os
. 05
� 0 11. . 04 t.O 0
�
. 0 3
. 0 2
Absorption of 3 mo les H2
I . 0 1 I .J
0 1 0 20 30 40
Time (min . )
Fi@Jre 4 . Plot of log Po/.P versus time fo r hydrogenation of nitrobenz ene .
50
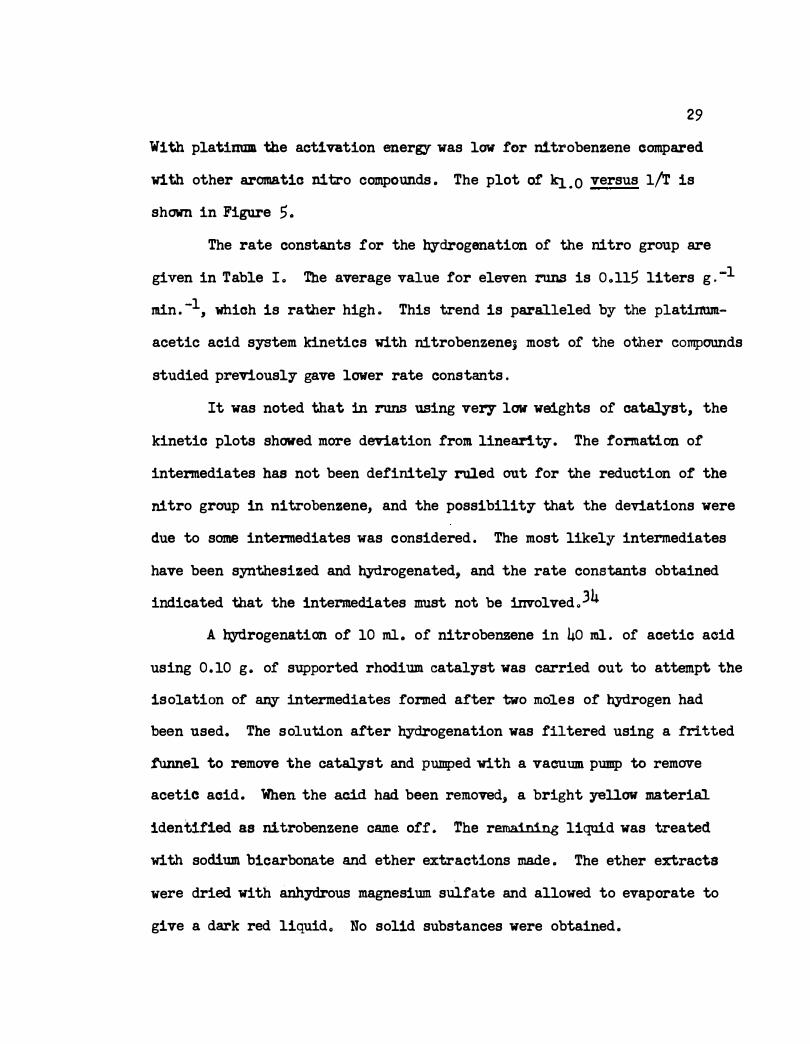
29 With platimDil the activation energy was law for nitrobenzene compared
with other aromatic nitro compounds . The plot of ki.o versus 1/T is
shown in Figure 5.
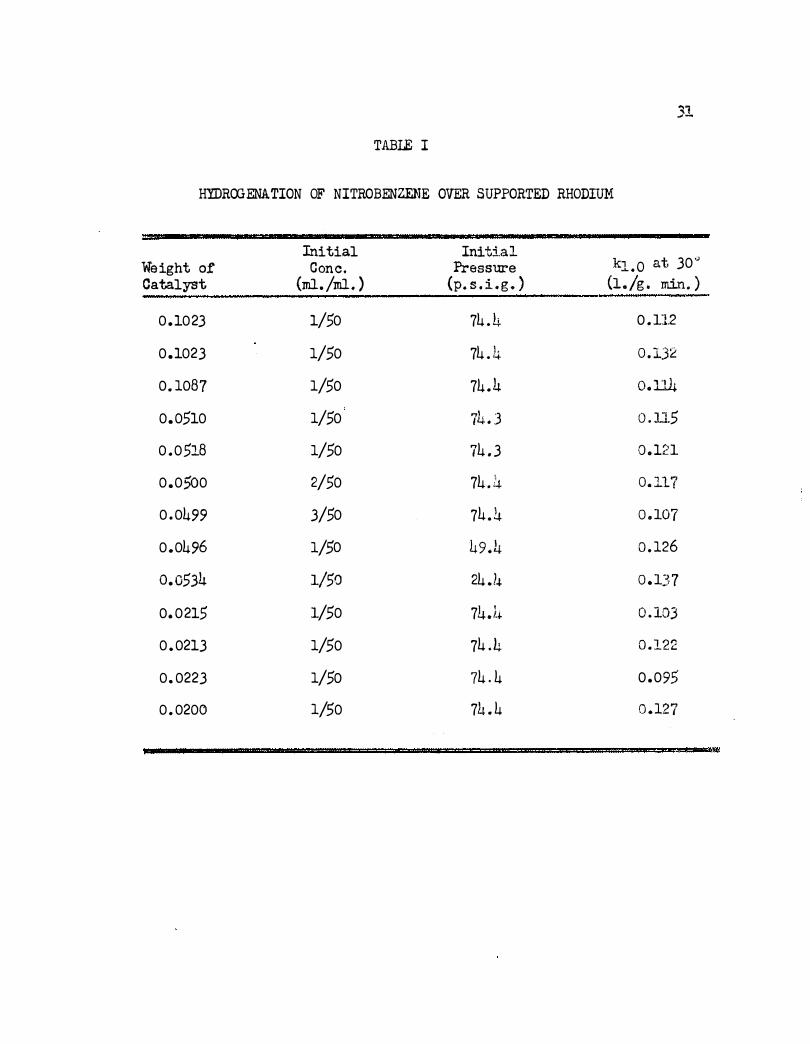
The rate constants for the hydrogenation of the nitro group are
given in Table I o The average value for eleven runs is 0.115 liters g . -l
min . -1, which is rather high . This trend is paralleled by the platin'wn-
acetic acid system kinetics with nitrobenzene; most of the other compounds
studied previously gave lower rate constants .
It was noted that in runs using very law weights of catalyst, the
kinetic plots showed more deviation from linearity. The :f'omation of
intermediates has not been definitely ruled out for the reduction o:f' the
nitro group in nitrobenzene, and the possibility that the deviations were
due to some intermediates was considered . The most likely intermediates
have been synthesized and hydrogenated, and the rate constants obtained
indicated that the intermediates must not be involved }4
A hydrogenation of 10 ml. of nitrobenzene in 40 ml. . of acetic acid
using 0 .10 g. of supported rhodium catalyst was carried out to attempt the
isolation of � intermediates formed after two moles of hydrogen had
been used. The solution after hydrogenation was filtered using a fritted
fUnnel to remove the catalyst and pumped with a vacuum pump to remove
acetic acid. When the acid had been removed, a bright yellow material
identified as nitrobenzene came off . The remaining liquid was treated
with sodium bicarbonate and ether extractions made . The ether extracts
were dried with anhydrous magnesium sulfate and allowed to evaporate to
give a dark red liquid. No solid substances were obtained.
1.3
0 1 .1 .
It � r-t + (\J 1 .0
0 . 9
o.B
3 .. 2 3 .3
1/T x 1o3
Figure 5 . Activation e ner gy plot for the hydrogenation of nitrobenzene ..
30
31
TABLE I
HYDROOENATION OF NITROBENZENE OVER SUPPORTED RHODIUM
Initial Initi.al Weight of' Cone. Pressl.U'e kl . O at. 30"' Catalyst (ml. /ml. ) (p. s . i . g . ) (1./g . min. )
0.1023 1/50 74 . 4 0 . 112
0.1023 1/50 74 . 4 0 .1)2
0. 1087 1/50 74.4 o. JJ.4
0. 0510 1/50 74 . 3 O . lJ.5
0 . 0518 1/50 74 . 3 0 .121
0.0500 2/50 74. :� 0. 1.17
0 . 0499 3/50 74. 4 0 . 107
0.0496 1/50 49.4 0 . 126
o.o5.34 1/50 24 .1� 0 . 137
0. 0215 1/50 74Jj. 0 .103
0. 0213 1/50 74 .4 0 . 122
0. 0223 1/50 74 . 4 0 .095
0. 0200 1/50 74 . 4 0 . 127
32
The red liquid was redissolved in ether and dry hydrogen chloride
gas vas passed through in order to precipitate the acid salt of � aniline
or phenyl hydroxylamine present . A tan precipitate was obtained which
after two washes vi th dry ether mel ted at 186° . After repeating the pre
cipitation process using hydrogen chloride gas, a lighter tan compound was
obtained which melted at 196° (reported for aniline hydrochloride, 198°) ).5 No phenyl hydrox.ylamine was obtained. � unreacted nitrobenzene and
aniline were isolated . The red color of the liquid was probably due to
the complex of nitrobenzene and aniline . Evidently the complex was de..:
strqyed in the presence of hydrogen chloride gas .
In previous work the presence of starting nitro compound using
platinum in acetic acid has been shown by the nitrolic acid test .160 H ow
ever the possibility of an addition complex intermediate has not been
ruled out . Complexes formed between nitro compounds and amines are very
common and some are very stable . Two physical properties of the nitro
benzene-aniline �stem that indicate the 1:1 compound are the freezing
point and refractive index.36
The red color produced by nitrobenzene w1 th aniline was probably
due to the complex but it was not destro.yed by the addition of acetic aoid o
Thus it seemed reasonable that the hydrogenation proceeded by way of the
complex or by destruction o£ the complex after same aniline was produced
by the reduction o£ the nitrobenzene.. In some preliminary attempts to
isolate the complex by vacuum distillation, it was found that the two com
ponents can be easlly separated .. However the distillate fractions were
orange-red which might have been due to some complex. Ten milliliters of'
33
:f."ractionated aniline and 20 ml . of" :f."ractionated nitrobenzene were com
bined to give the complex plus excess nitrobenzene . This mixture was
:f."ractionated and a 10 m.l . :f."raotion boiling at 6o .6-6L0°/5 mm. was col
lected. The color was almost the same as the original complex., However
log P versus 1/T data were :f."ound to be identical with that :f."or aniline.
The next fraction boiled at 56.6°/1;2 .DJI!. which checks :f."or nitrobenzene,
Continued fractionation yielded � nitrobenzene . Thus almost all of" the
complex must be destroyed at these temperatures .
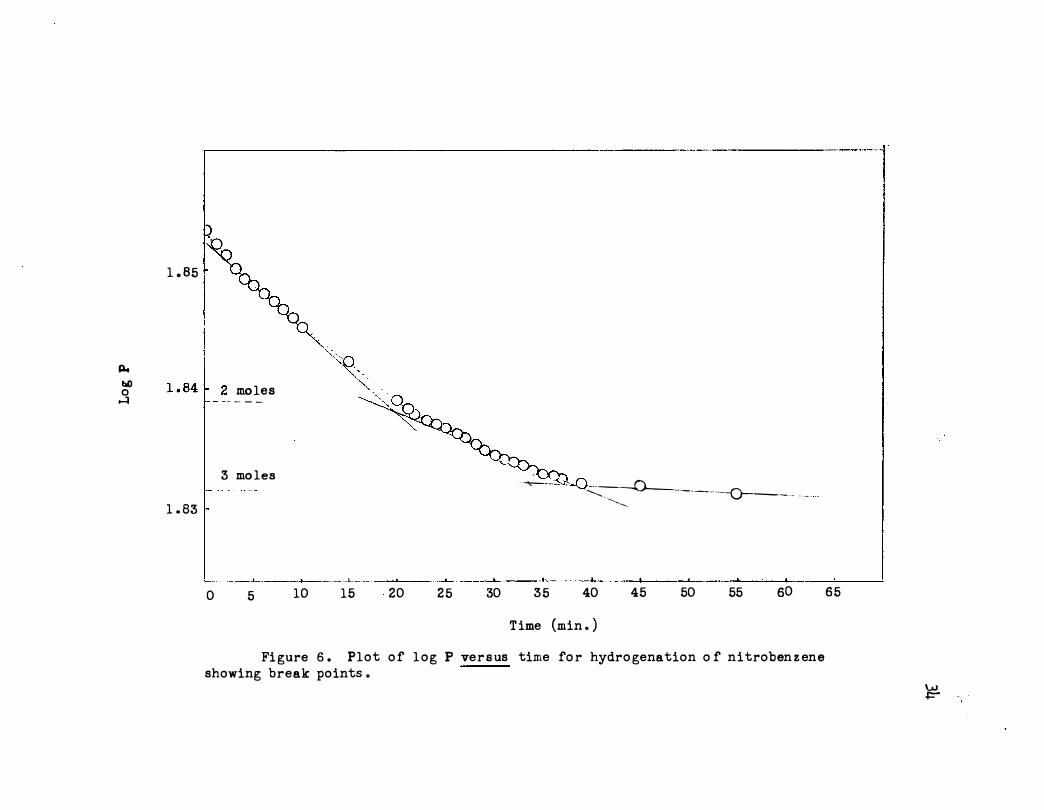
A 1:1 molar mixture of" aniline and nitrobenzene was hydrogenated
using acetic acid and a small amount of" supported rhodiwn catalyst . The
plot shown in Figure 6 is essentially identical with the usual low cata
lyst weight runs with nitrobenzene . The initial slope was the same within
experimental error as :f."or the previous rtms . Also the ratio of the :f."irst
slope to the second was 1.70 which compares :f."avorably with the average
ratio (1 .83) for six previous runs using about 0.02 g . of catalyst . The
runs are listed in Table II.
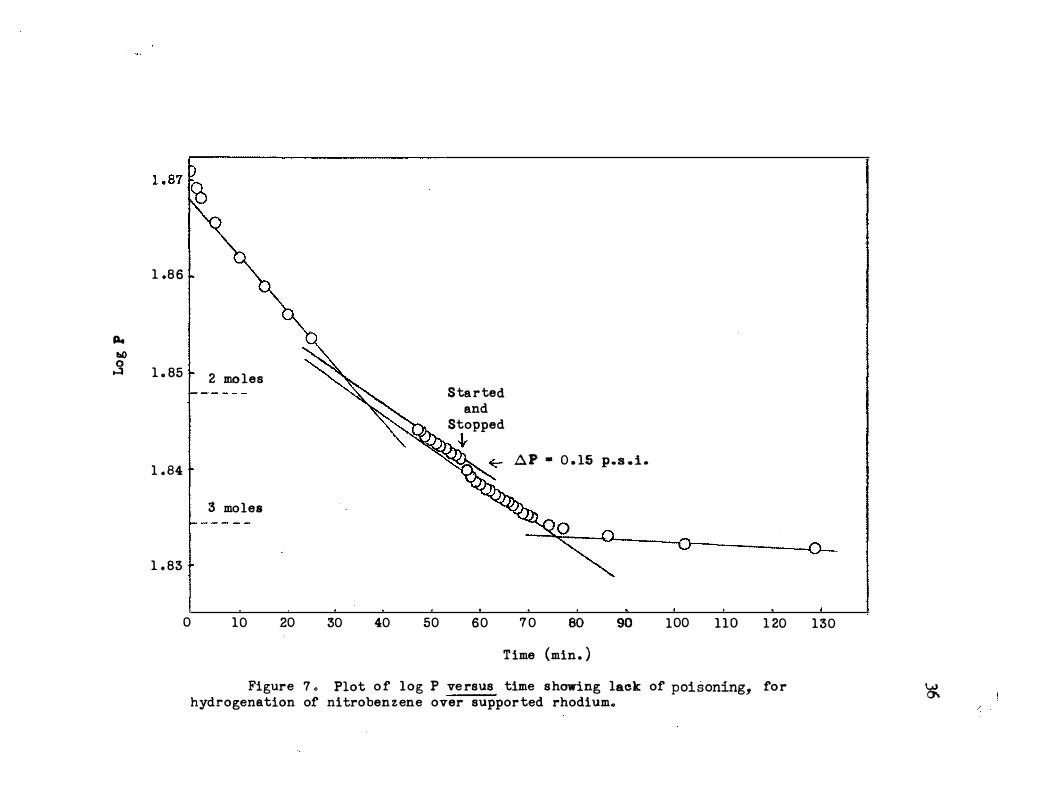
The possibili t7 that the departure from lineari t1 was due to cataly"st
poisoning was investigated by interrupting a hydrogenation of 1 ml . of
nitrobenzene in 50 ml. of acetic acid when 2 . 5 moles of hydrogen had been
consumed. The catalyst was removed with a fritted funnel and fresh cata
lyst of exactly the same amount (0 .. 0200 g . ) was added to the mixture , The
slope of" the next portion of" the hydrogenation plot thus obtained was
identical with the slope of the previous portion as shown in Figure 7 o
Thus it is concluded that . poisoning. of" the supported rhodilllll on alumina.
was very slight.
p.. bl) 0
H
1 . 85
1 . 84 � _ 2 _ _"":'�··
1 . 83
3 mo les
L _ ___ ____t__
0 5 10 15
'- '--'\ -�-l_Q._ --Q__ __ --------o----- -- . __ - ----- - ...::___� ----------
----- --·---1- -·--�-----1·--· - - ------L-- -- - _ _.. ____ .._ ___ ......�. __ '---4 20 25 30 35 40 45 50 55 60
Time (min . )
Figure 6 . Plot o f log P versus time fo r hydro genation o f nitroben z ene showing break points .
65
�
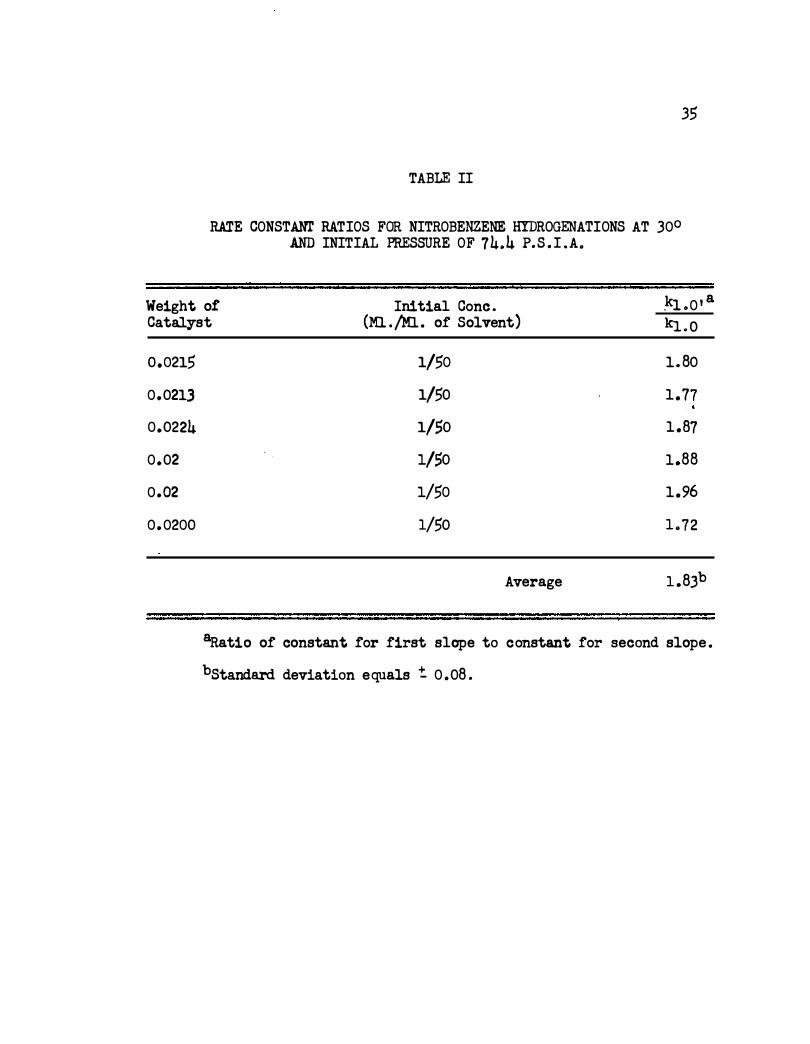
TABLE II
RATE CONSTANT RATIOS FOR NITROBENZENE HYDROGENATIONS AT 30° AND INITIAL PRESSURE OF 74�4 P. S . I .A.
35
Weight o! Initial Cone . .kl o0 1 a
Catalyst (Ml . /Ml . of Solvent) kJ..o
0.0215
0.0213
0.0224
0.02
0.02
0. 0200
1/50 1. 80
1/50 1.77 .
1/50 1.87
1/50 1.88
1/50 1.96
1/50 L72
Average 1 . 8Jb
aRatio of constant for first slope to constant for second slope .
bstandard deviation equals � 0 .08 .
Pe bO
1 .86
.s 1 . 85
1 . 84
1 . 83
0
2 mo les
3 moles
10 20 30 40 50
S ta r ted and
Stopped +
60
�p • 0 . 15 p.s . i .
7 0 eo 90
T ime (min . )
100 llO 1 20
Figure 7 o Plot o f log P ve rsus time s howing lack of poisoning, fo r hydrogenation of nitroben z ene over suppor ted rhodium.
130
�
37
The deviation from the initial linear portion of the kinetic plots
might be due to a kinetic dependence of acceptor concentration under the
conditions of the runs; namely, after formation in � of aniline and/or
addition can.plex . The fact that the preformed complex did not affect the
kinetic plot i s not conclusive evidence that the addition comp lex is not
involved in the transition state . It is possible that the order of events
involving the addition complex is important .
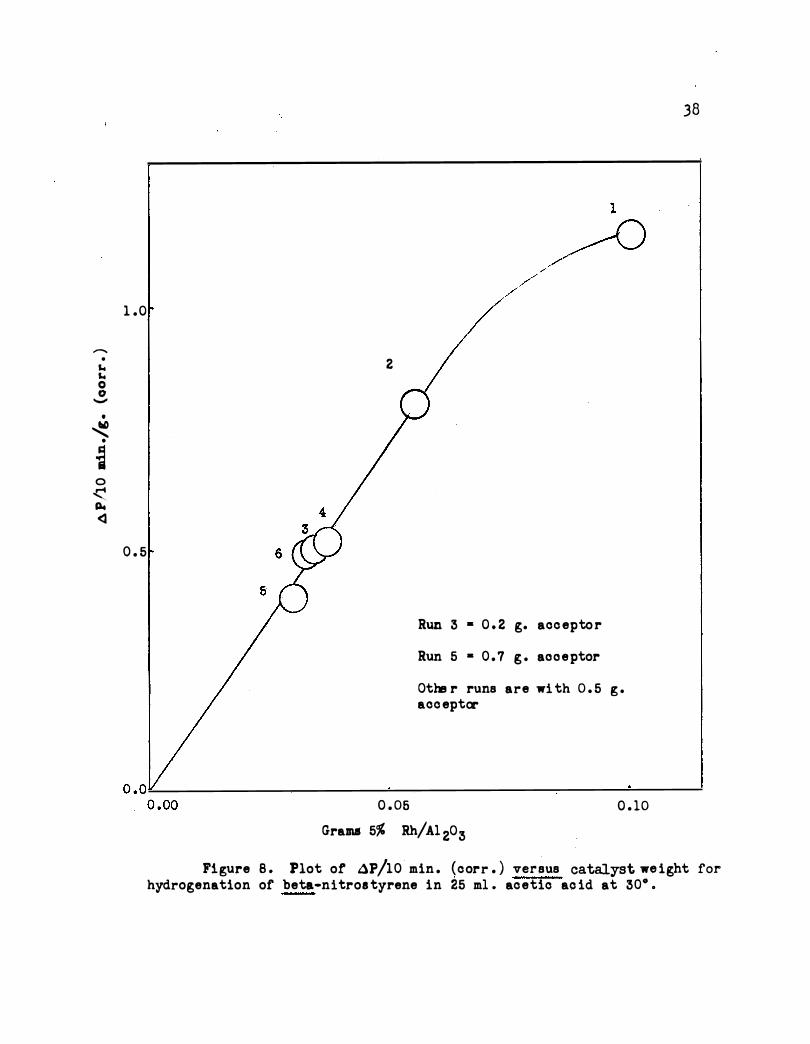
B. �-Nitrostyrene
As shown in Figure 8 the weight of catalYst should not exceed about
0.07 g . Figure 8 include s various concentrations of acceptor and i t is
seen that the reaction is zero order in acceptor for this concentration
range .
First order dependence on hydrogen pre ssure is shown in Figure 9 for
the pre ssure range 24 to 74 pounds (p . s . i . a . ). A typical p lot of log P
versus time for �-nitrostyrene at 30° is g iven in Figure 10.
It was noted in th e kinetic runs that the hydrogen uptake suddenly
decreased when approximately two moles of hydrogen had been consumed . The
average value at the break point for seven hydrogenations was two moles as
shown in Table III . Thus it was concluded that an intermediate such as
the oxime or hydroxylamine was inyolved .
A plot showing the stepwise reduction i s given i n Figure 11. The
intermediate formed after two moles of hydrogen had been consumed was ob
tainable in good yield . The final reduction product, formed by the uptake
of seven moles of hydrogen, was also obtainable in good yield .
"""" . s.. s.. 0 0 -
•
� •
� 0 -ct. Pot <l
38
1 .0
0 . 5
6
2
0 . 06
Run 3 • 0 . 2 g. acc eptor
Run 5 • 0 . 7 g . aooeptor
Othe r runs are wi th 0 . 5 g . acc epter
0 . 10
Gra� 5% Rh/Al2o3
Figure B . Plot of AP/10 min . (corr . ) versus catalyst we ight for hydrogenation of beta•nitros tyrene in 25 m1 . acetic ac id at 30° .
39
......,. o3 o3 . 0 0 � � l.t) (Q (Q . 0
0.. 0.. ........... Q) � "' (Q ::s "' (Q Q) (Q > Q) "' ......._
p,. "' .... 0 0 ...........
•
� . � � El 0 l.t) < C\:1 p,. <l co.. 0 .p 0
r-1 p.,
Ol Q) "' ::s bO � IS.
L---�--------�----------�--------� 0 0
p.. bj) j
1 . 87
1 ., 86
0 5
-Q_ - ..._. - - - -
2 moles
l --·-·-· .... ··- __.__···----------"----------'
10 1 5 2 0 2 5 3 0 35
Time {min ., ) g Figure 10 ., Plot of l o g P ve rsus time fo r hydrogenati on of be ta-nitro s tyrene show ing
break point at 2 mol es o f hydrog en ., -
-�
�p at
TABLE III
MOLES OF HYDROGEN ADDED PER MOLE OF BETA-NITROSTYRENE AT FIRST BREAK PO�
Moles Hydrogen Per Break Point Mole beta-Nitrostyrene
1 .35
2 .15
o.60
1.95
1.25
8standard deviation equals : 0.17 .
2 . 0
2 . 0
2 .3
1.8
1.9
Average 2 . oa
Time (min. ) 0 10 20 30
1 . 8�------------r-------------------r----------------r--------4
tl-t 00 � 1 .8
0
t 2 moles
100 200 .roo
3 moles
00 500 Time (mino )
600 700 800
Figure 11..... Plot of log_ P versus. time for hydrogenation of beta-ni trostyrene showing break points at 2, 3 and 7 moles of hydrogen .
----
.r:=N
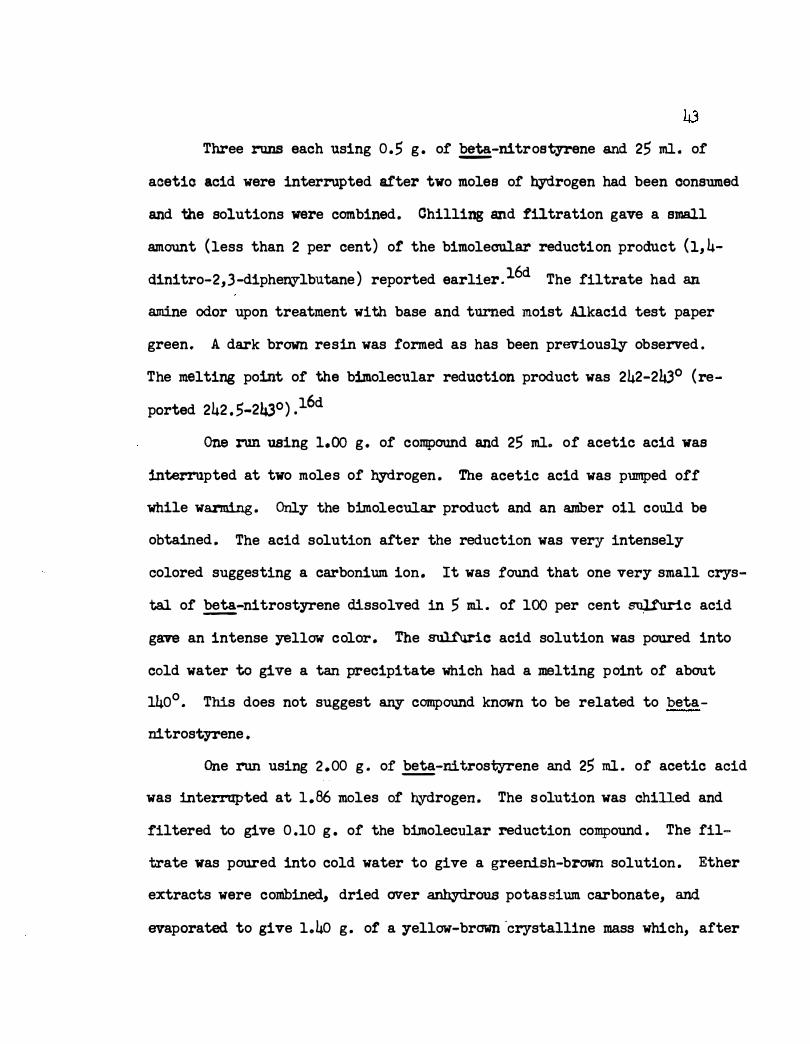
Three runs each using 0.5 g . of �-nitrostyrene and 25 ml . of
aoetio acid were interrupted after two moles of hydrogen had been consumed
and the solutions were combined. Chilling and :filtration gave a small
amount (less than 2 per cent) o£ the bimolecntl.ar reduction product (1, 4-
dinitro-2,3-dipheeylbutane ) reported earlier.16d The filtrate had an
amine odor upon treatment with base and turned moist Alkacid test paper
green. A dark brown resin was formed as has been previously observed .
The melting point of the bimolecular reduction product was 242-243° (re
ported 242 . 5-243°) .16d
One run using 1.00 g. of compound and 25 ml. of acetic acid was
interrupted at two moles of hydrogen . The acetic acid was pmnped off
while warming. Only the bimolecular product and an amber oil could be
obtained . The acid solution after the reduction was very intensely
colored suggesting a carbonium ion. It was .found that one very small crys
tal of �-nitrostyrene dissolved in 5 ml . of 100 per cent �c acid
gave an intense yellow color. The sulf'urio acid solution was poured into
cold water to give a tan precipitate which had a melting point of about
140°. This does not suggest any compound known to be related to beta-
nitrostyrene .
One run using 2 .00 g . o.f �-nitrostyrene and 25 ml . of acetic acid
was interrupted at 1.86 moles of hydrogen . The solution was chilled and
.filtered to give 0 .10 g . of the bimolecular reduction compound . The fil-
trate was poured into cold water to give a greenish-brawn solution . Ether
extracts were combined, dried aver anhydrous potassium carbonate, and
evaporated to give 1.40 g . o£ a yellow·brown ·crystalline mass which, after
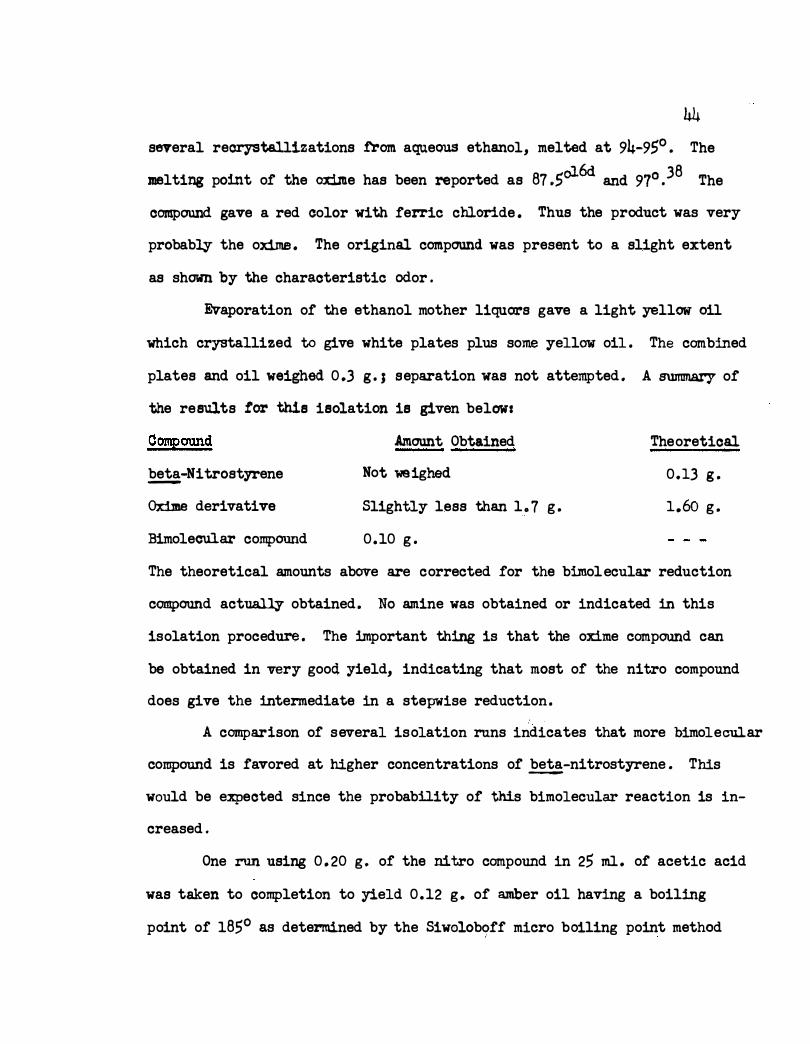
44 several reorystallizations from aqueous ethanol, mel ted at 94-9$0 • The
melting point of the oxime has been reported as 87 .$o16d and 97° .38 The
compound gave a red color with ferric chloride . Thus the product was very
probably the oxime. The original compound was present to a slight extent
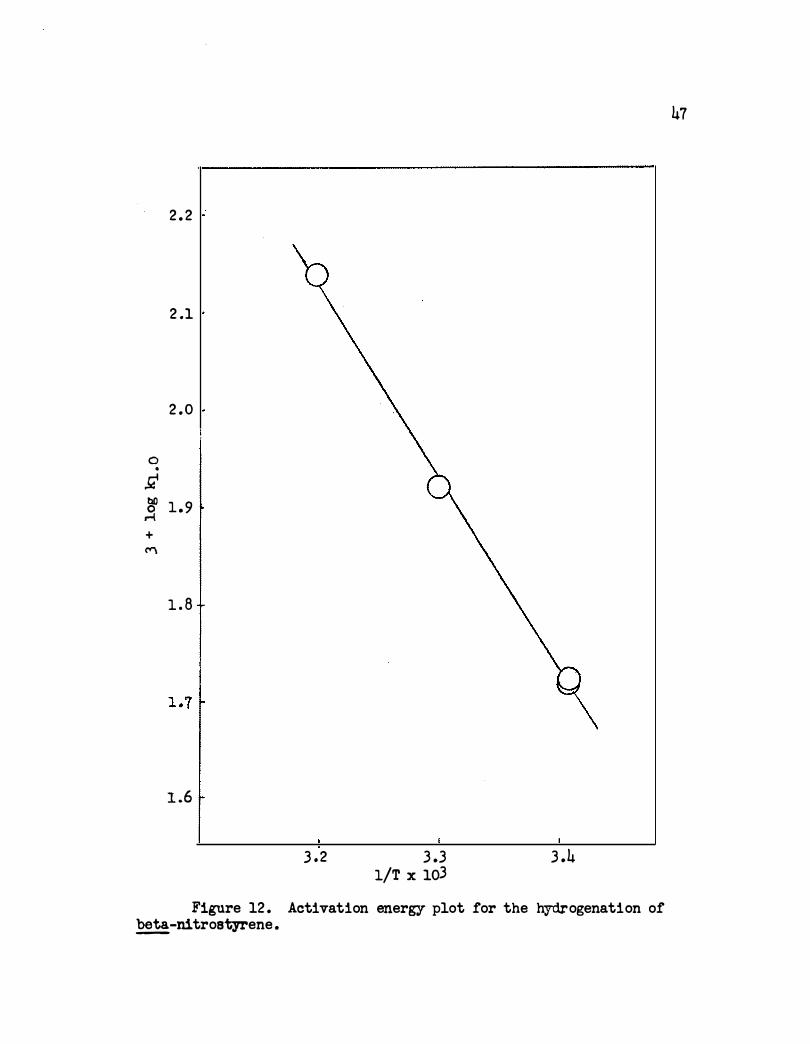
as shown by the characteristic odor .
Evaporation of the ethanol mother liquors gave a light yellow oil
which crystallized to give white plates plus some yellow oil . The combined
plates and oil weighed 0.3 g . J separation was not attempted . A summary of
the results to.r this isolation is given below:
Compound
beta-Nitrostyrene -
Oxime derivative
Bimolecular compound
.Amount Obtained
Not weighed
Slightly less than l. 7 g .
0.10 g .
Theoretical
0.13 g .
1.6o g .
The theoretical amounts above are corrected for the bimolecular reduction
compound actually obtained. No amine was obtained or indicated in this
isolation procedure . The important thing is that the oxime compound can
be obtained in very good. yield, indicating that most of the nitro compound
does give the intermediate in a stepwise reduction.
A comparison of several isolation runs indicates that more bimoleaular
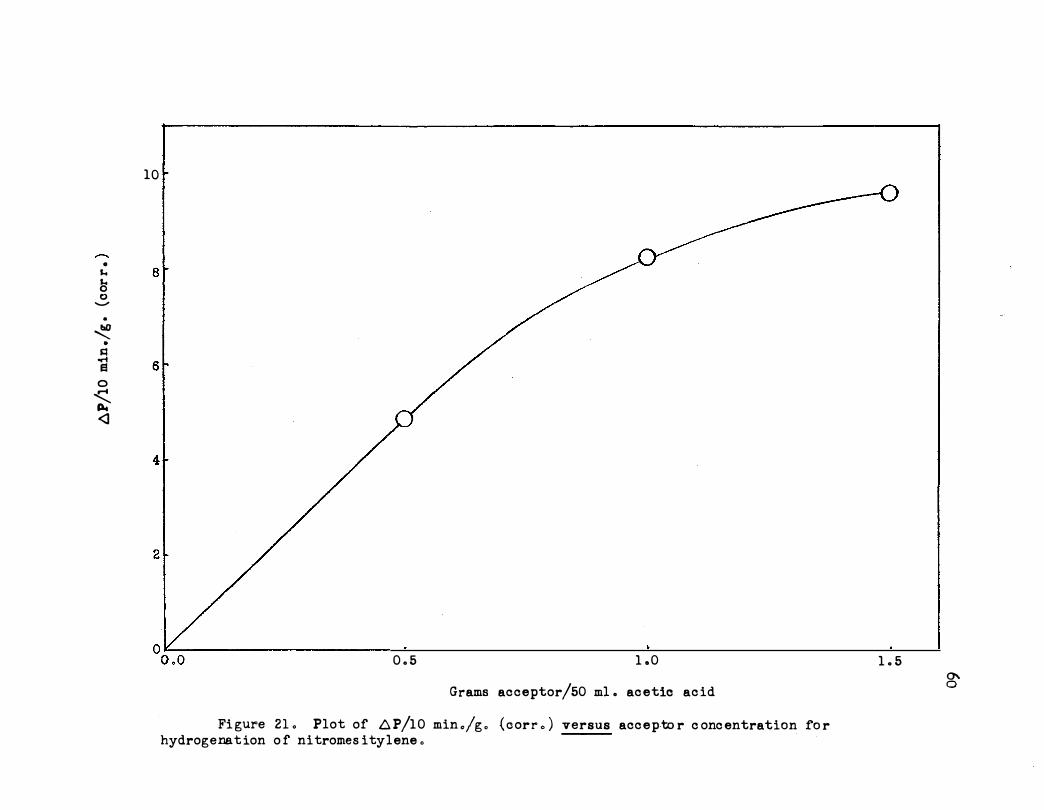
compound is favored at higher concentrations of beta-ni trostyrene . This -
would be expected since the probability of this bimolecular reaction is in-
creased .
One run using 0 . 20 g . of the nitro compound in 25 ml . of acetic acid
was taken to completion to yield 0.12 g . of amber oil having a boiling
point of 185° as determined by the Siwolob9ff micro boiling point method
45
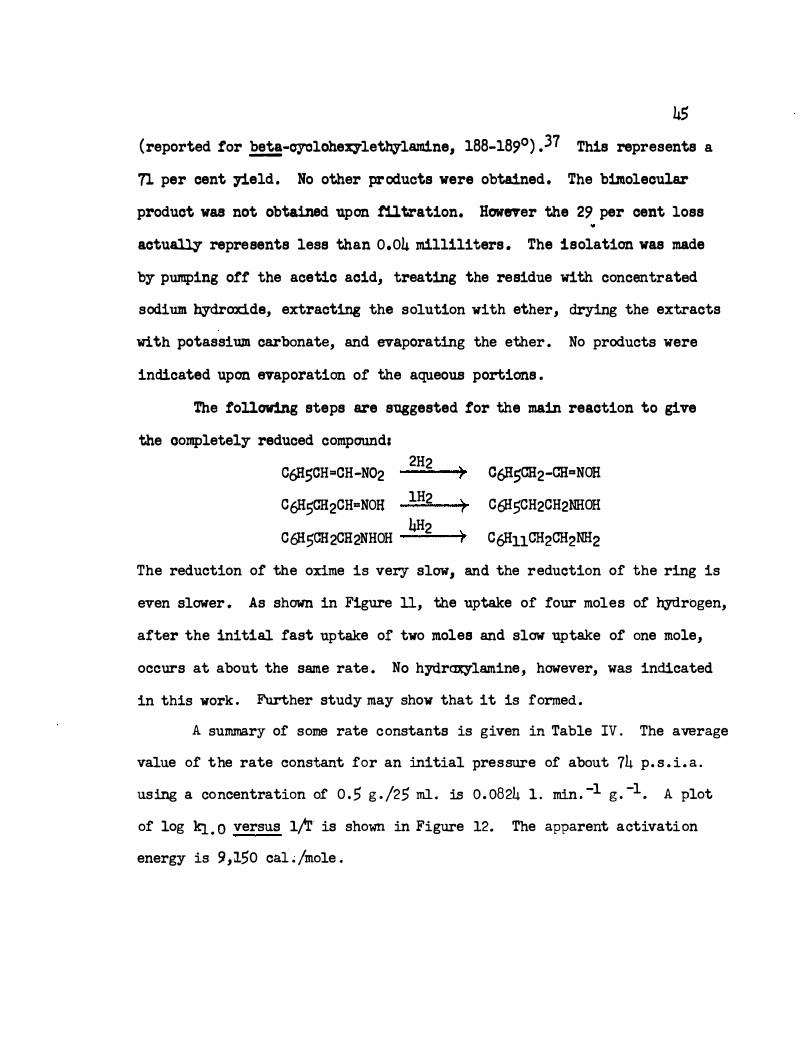
(reported for �-oyolohexyle�lamine, 188-189°) .37 This represents a
71 per cent yield . No other products were obtained, The b1J11olecular
product was not obtained upon filtration. HoweTer the 29 per cent loss
actu� represents less than 0.04 milliliters . The isolation was made
by pumping off the acetic acid, treating the residue with concentrated
sodium hydroxide, extracting the solution with ether, drying the extracts
with potassium carbonate, and evaporating the ether . No products were
indicated upon evaporation of the aqueous portions .
The following steps are suggested for the main reaction to give
the completely reduced compound:
C6}15CH=CH-N02 2H2 > C6H5CH2-CH"'NOH
C6H5ffi12CH=NOIJ 1H2 ) C6H5CH2CH2NHOH
C6H5CH2CH2NHOH 4H2 )' C6H11 CH2CH2NH2
The reduction of the oxime is very slow, and the reduction of the ring is
even slower . As shown in Figure 11, the uptake of :t'our moles of hydrogen,
a:t'ter the initial fast uptake of two moles and slow uptake of one mole,
occurs at about the same rate . No hydrc:Dcy'lamine , however, was indicated
in this work . Further study may show that it is formed.
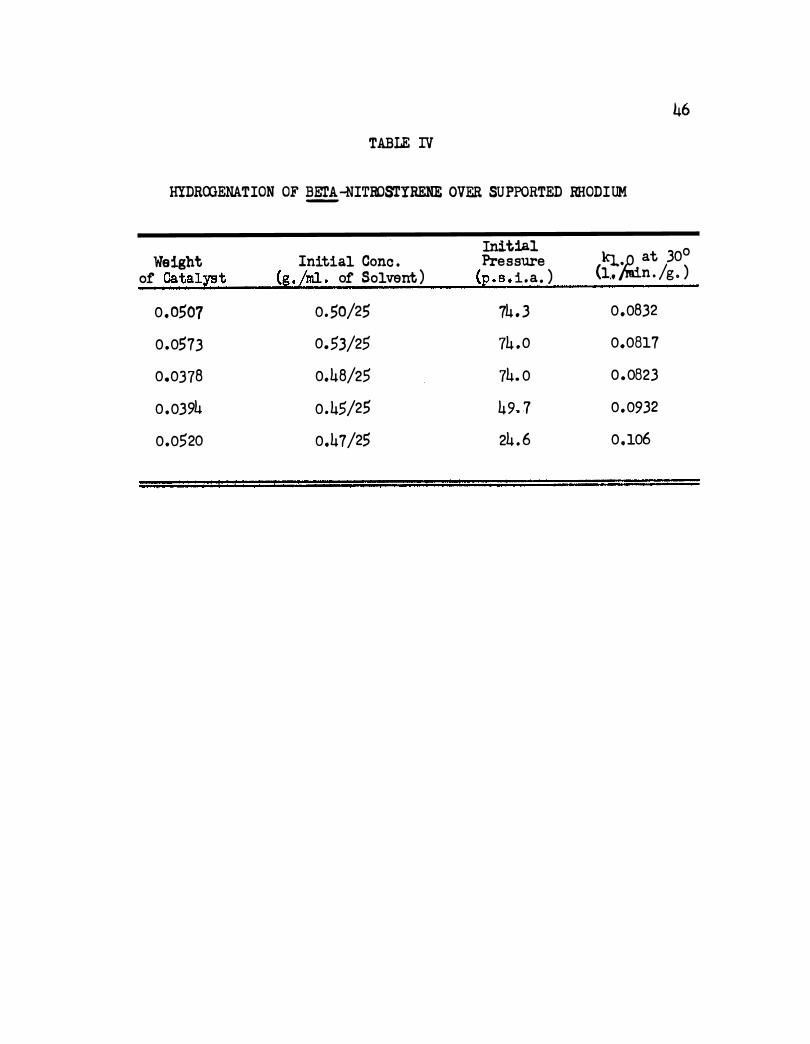
A summary of some rate constants is given in Table IV. The average
value of the rate constant for an initial pressure of about 74 p. s . i. a .
using a concentration of 0 . 5 g . /25 ml. is 0. 0824 1 . min . -1 g . -l . A plot
of log k:l. . o versus 1/.r is shown in Figure 12. The apparent activation
energy is 9,150 cal . /mole .
46
TABLE IV
HYDROOENATION OF �-NITBOSTYRENE OVER SUPPORTED RHODIUM
Initial k:r..� at 30° Weight Initial Cone . Pressure of Catalt'!t (g.Lml. of Solvent ) (E. s. i.a . ) (1,, ' n . /g . )
0 .0507 0.50/25 74 . 3 0,0832
0.0573 0.53/25 74 .0 0.0817
0.0378 0.48/25 74. 0 0 .0823
0 .0394 0.45/25 49. 7 0.0932
0.0520 0.47/25 24 . 6 0.106
2 . 2
2 .1
2 .0
0 •
Ji � 1 .9 + I"'"\
1 . 8
1 .6
3 .2 3 .3 1/T x 103
3 .4
Figure 12 . Activation energy plot for the hydrogenation of �-nitrostyrene.
47
48
C . Nitroethane
In early runs the data for nitroethane were plotted as zero order
in hydrogen pressure and first order in acceptor concentration. The rate
constants thus obtained, when plotted versus catalyst weight, gave a devia
tion fram linearity� When the reaction was treated as first order in �
drogen and zero order in acceptor, good kinetic plots were obtained for
the initial portion of the curve .
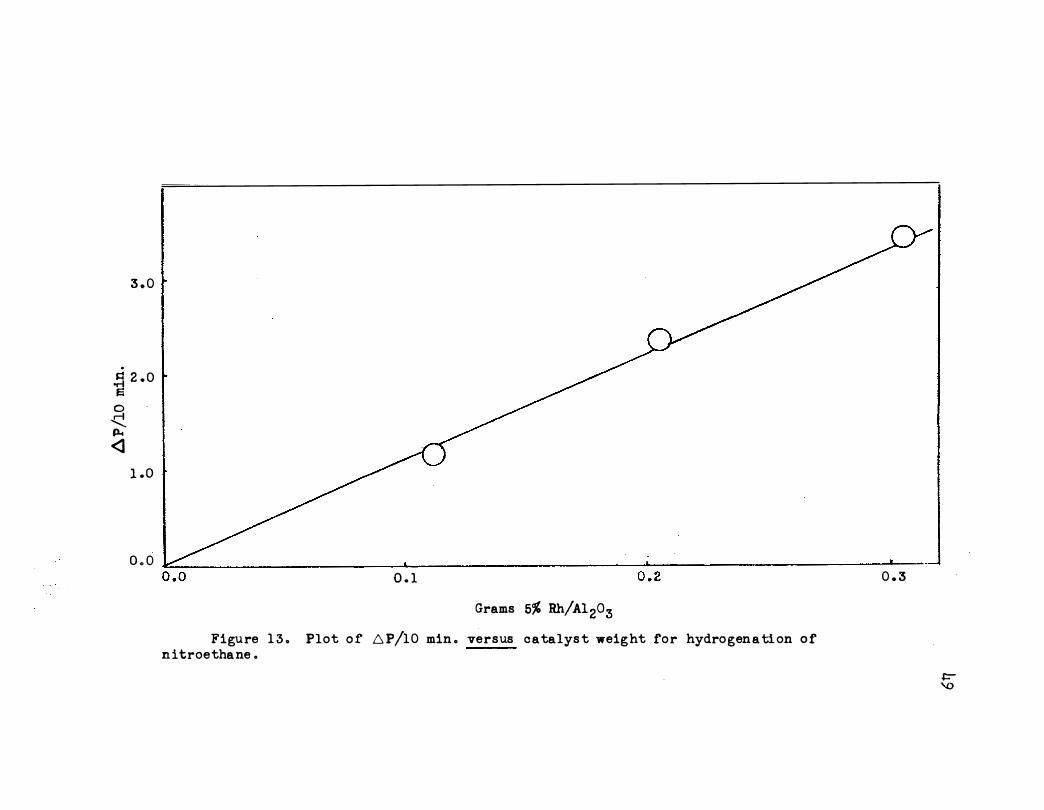
Figures 13 and 17 show the effect of catalyst weight up to 0.3 g .
Equilibrium conditions are present below this weight . The effect of
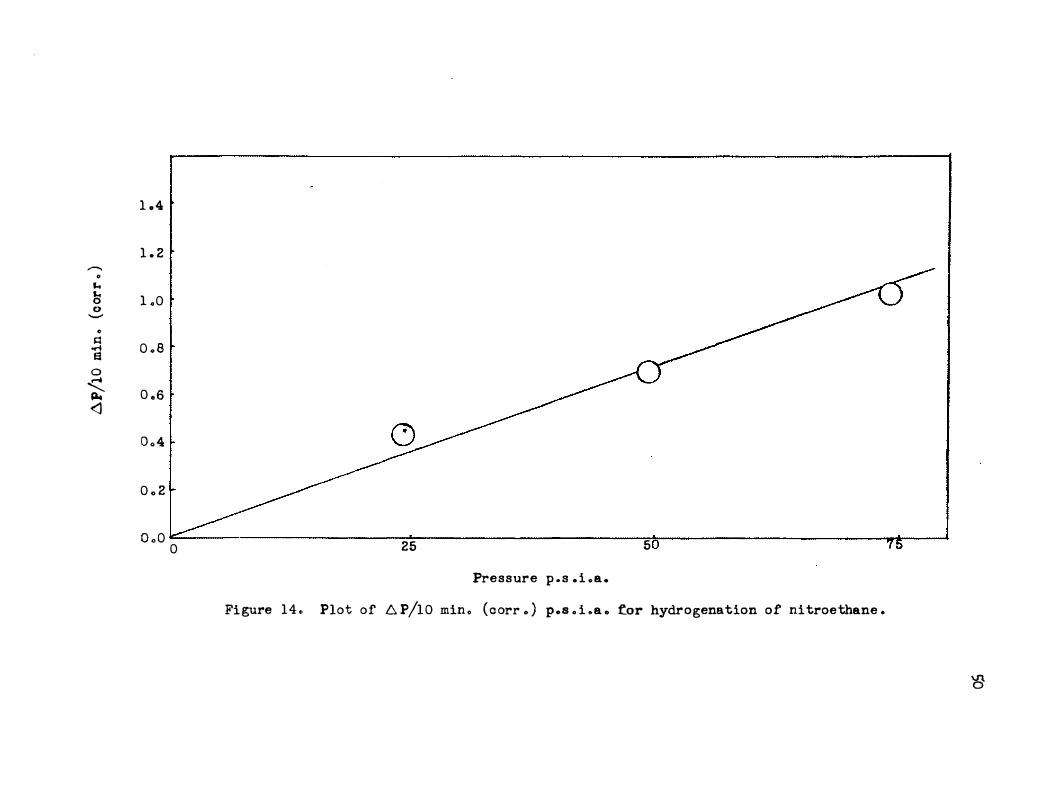
initial pressure is shown in Figure 14. The hydrogenation of nitroethane
in acetic acid using supported rhodium is first order in hydrogen pressure .
As shown in Figure 15 the reaction approaches first order in nitroethane
concentration at low concentrations and zero order at higher concentrations .
A typical plot of log P versus time is shown in Figure 16 . The
deviation at about 40 per cent reduction of the nitro group may be due to
the first order dependence of nitroethane at low concentrations . Also it
is possible that an intermediate is involved . A tabulation of runs at
74 .3 p . s .i . a . initial pressure and 30° is shown in Table V . The rate
constants for first order hydrogen dependence in terms of unit quantities
of catalyst (kl .o) are rather good and show that there is a dependence on
the acceptor concentration. This dependence is also shown very well in
Figure 17 where the rate constant, k (cc . m!n. -1) is plotted against cata
lYst weight.
The activation energy for the hydrogenation of nitroethane using
the rhodium-acetic acid system is 10, 300 cal ./mole . The plot is shown
3 . 0
. � 2 .0 0 � p., <3
1 .0
o . o �----------------------_.------------------------�------------------------L---� 0 . 1
Grams 5% Rh/Al203 Figure 1 3 . Plot of D.P/10 min . versus catalys t weight for hydrogenation of
ni troethane .
0 . 3
� '-0
.......... 0
s..
f) 0
.._..
" �
oro! s
0
< Poe
<1
1 .4
1 . 2
1 ..0
o .. a
0 .6
0.,4
0 ., 2
o .. o 0 25 5
Pressure p . s . i .. a .
Fi gure 14., Plot of 6 P/10 min ., ( c orr . ) p .. s o i .a .. �or hydrogenation of nitroethane .
'B
1.6
1.4
1.2
1 . 0 -
•
� 0
- 0 . 8 •
� 0
-s. 0 .6 ·, <l
0.4
0 .2
o .o L---------�--------��----------�------� 0 1 2 3
Ml . or ni troethane per So ml . acetic acid
Figure l.S . Plot or AP/10 min. (corr. ) versus concentration or ni troethane .
Pt tloO
.s
1 . 88
1 .82
2 4 6 8 10 1 2 14 16 18 20 22 24 26
T ime (min . )
Fi gure 1 6 o Plot of l og P ve rsus time for hydro g en at i on o f ni tro e thane o
28 30
Vl. 1"'-'
......... ......
1 .
s::: ..... El
0 () ()
.........
.!14
1 .0
0 . 9
0 . 8
0 .7
0 . 6
0 . 5
0 . 4
0 . 3
0 . 2
0 . 1
o .o o .o 0 . 1 0 . 2
Grams o f 5% Rh/A1203
0 = 3 ml . ni troe thane
<D • 2 ml . nitroe thane
� • 1 m1 . nitroethane
Figure 17 o Plot of rate c o ns tant . k, versus c atal ys t weight for hydrogena tion of ni troe thane .
0 . 3
�
54
TABLE V
HIDROOENATION OF NITROEJI'HANE OVER SUPPORTED RHODIUM CATALIST AT INITIAL PRESSURE OF 74.3 P.S . I .A.
Weight of Initial Cone . k kl .o Catalyst ( g . ) (ml./ml. Solvent) (cc ./min. ) (1/min. g . )
0.1124 1/50 0.266 0 . 0237
0.1031 1/50 0 .242 0 .0235
0 .2059 1/50 o .5o6 0 .0246
0 . 2117 1/50 0 .514 0.0243
0 .. 3062 1/50 0 . 772 0. 0252
0 .1128 2/50 0 .346 0 .0306
0 . 2045 2/50 0.615 0.0301
0 .1999 2/50 0 .636 0 .0318
0 .2063 2/$0 0.625 0 . 0303
0 . 2998 2/50 0 . 918 o .o3o6
0 .3054 2/50 0.895 0 .0293
0 .3013 2/50 0 . 924 0.0309
0 .3007 2/50 0 . 938 0 .0311
0 .1014 3/50 0 .334 0 .0329
0 .1022 3/50 0.342 0 .0334
0 .2067 3/50 0.673 0.0325
0 .3073 3/50 0.995 0 .0324
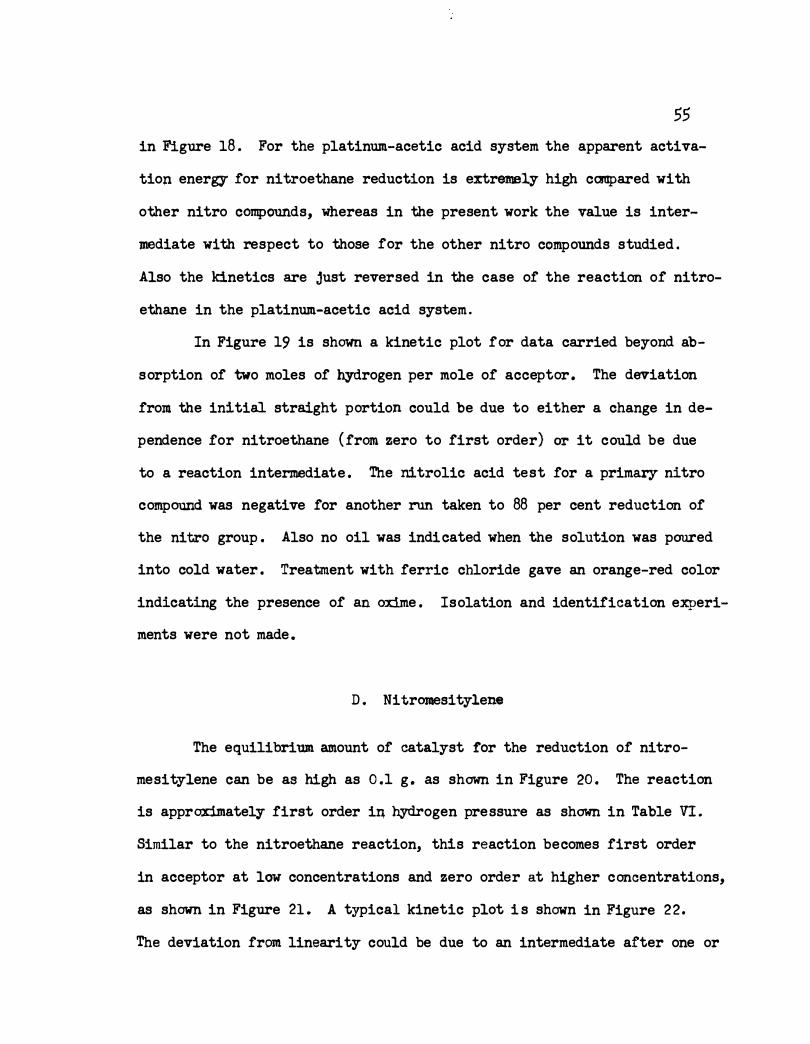
,,
in Figure 18 . For the platinum-acetic acid system the apparent activa
tion energy for ni troethane reduction is extremely high canpared with
other nitro compounds, whereas in the present work the value is inter
mediate with respect to those for the other nitro compounds studied .
Also the kinetics are just reversed in the case of the reaction of nitro
ethane in the platinum-acetic acid system.
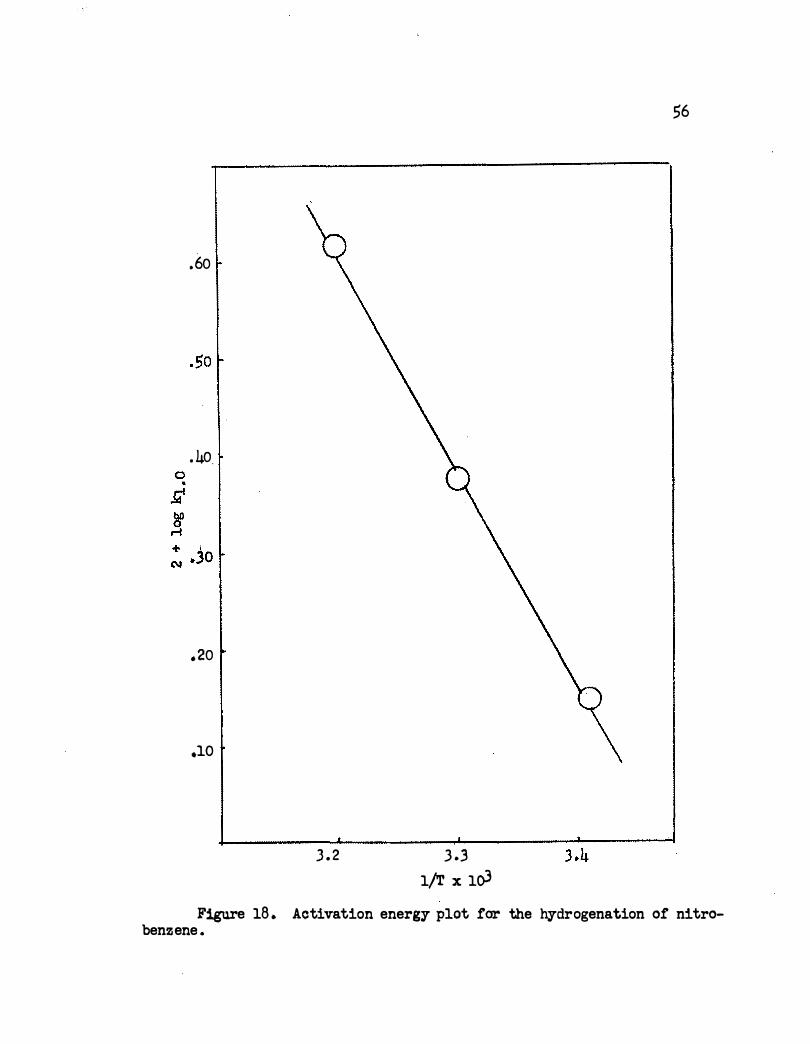
In Figure 19 is shown a kinetic plot for data carried beyond ab
sorption of two moles of hydrogen per mole of acceptor. The deviation
from the initial straight portion could be due to either a change in de
pendence for nitroethane (from zero to first order) or it could be due
to a reaction intermediate . The nitrolic acid test for a primary nitro
compound was negative for another run taken to 88 per cent reduction of
the nitro group . Also no oil was indicated when the solution was poured
into cold water . Treatment with ferric chloride gave an orange-red color
indicating the presence of an oxime . Isolation and identification experi
ments were not made .
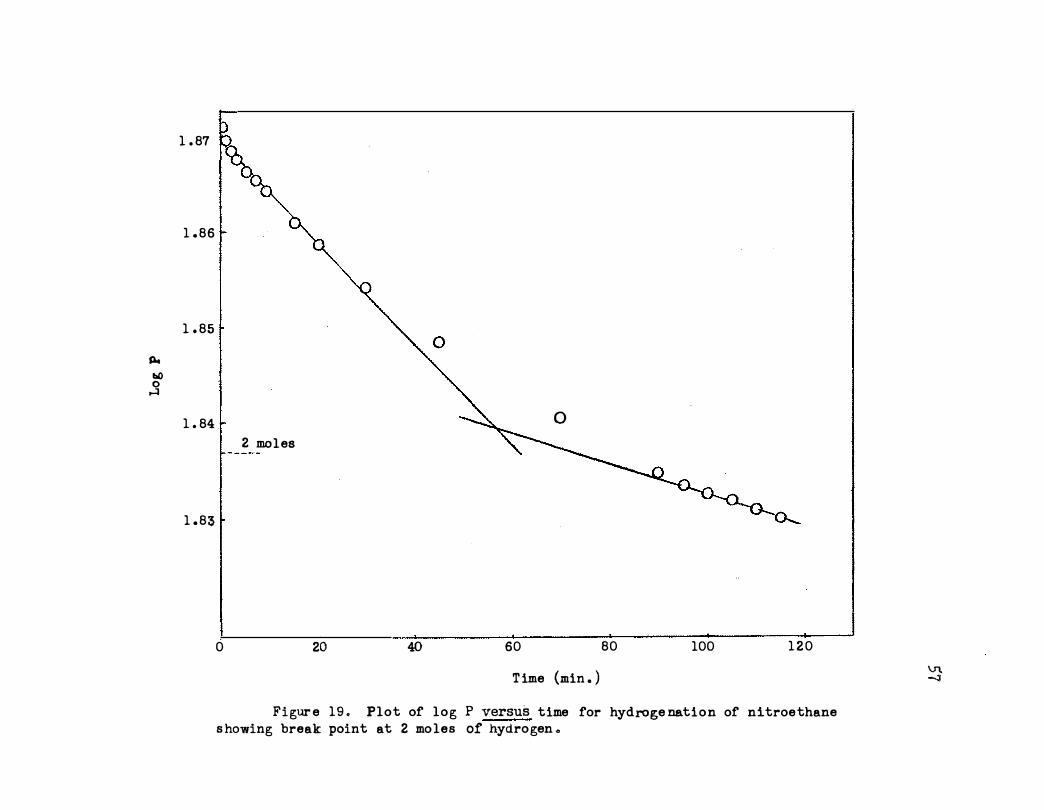
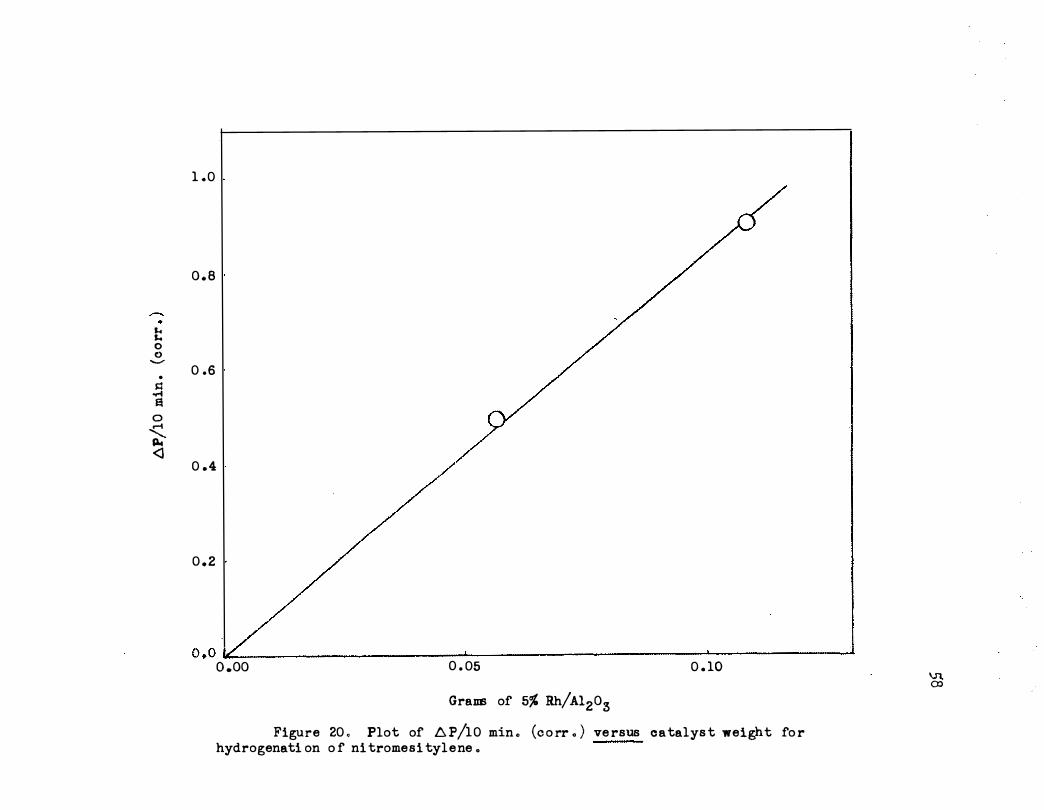
D . Ni tromesi tylene
The equilibrium amount of catalyst for the reduction of nitro
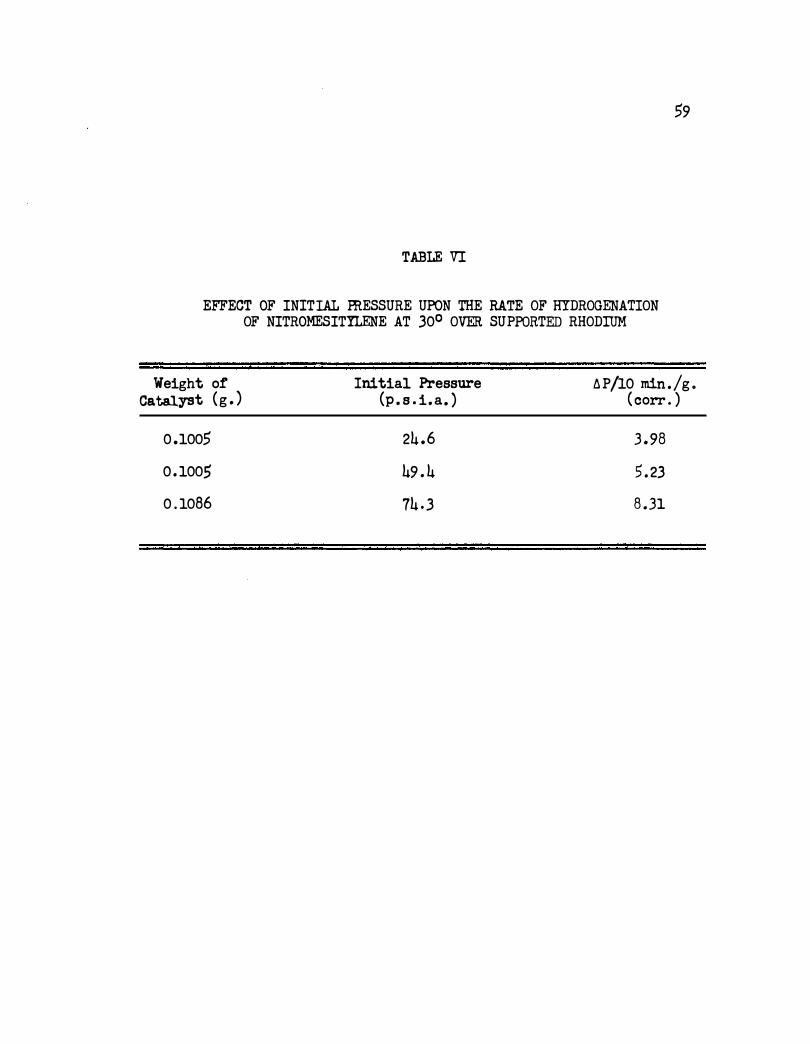
mesitylene can be as high as 0 .1 g . as shown in Figure 20 . The reaction
is approximately first order in hydrogen pressure as shown in Table VI .
Similar to the nitroethane reaction, this reaction becomes first order
in acceptor at low concentrations and zero order at higher concentrations,
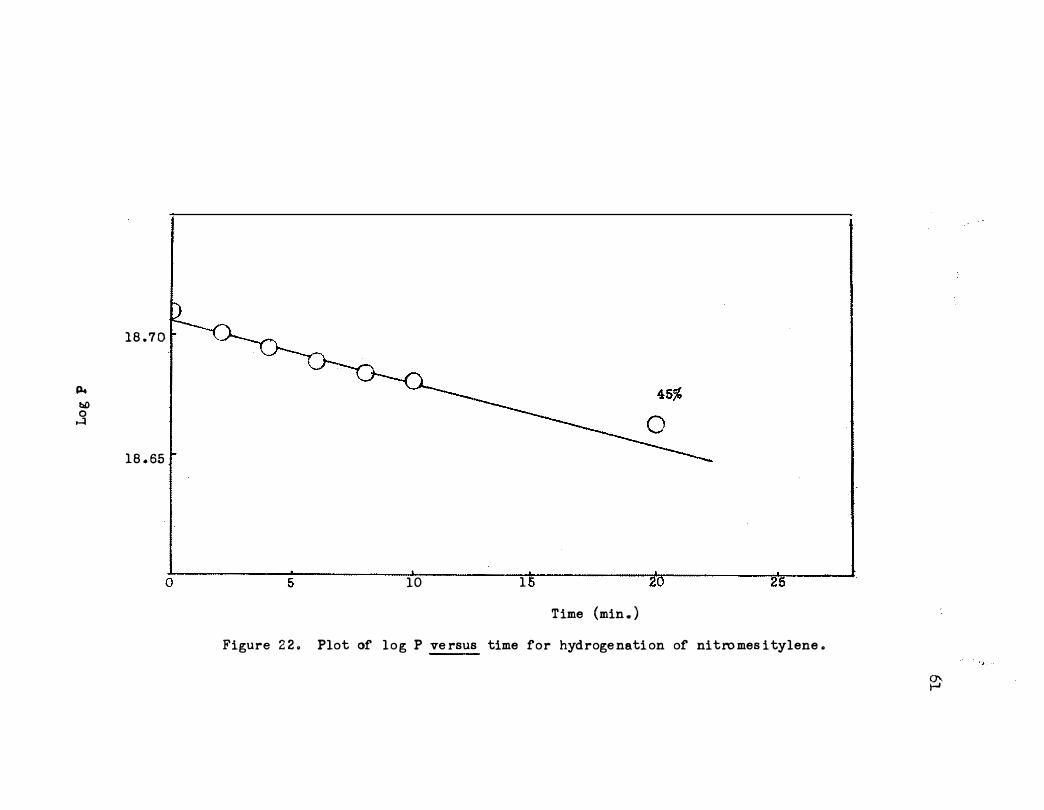
as shown in Figure 21 . A typical kinetic plot i s shown in Figure 22.
The deviation from linearity could be due to an intermediate after one or
.60
. 40 .
• 20
.10
) . 2 J .J
1/T X 1oJ
56
Figure 18 . Aetivation energy plot far the hydrogenation of nitrobenzene .
"" bO 0 ..:I
1 . 87
1 . 86
1 . 85
1 . 84 � � 0
1 . 83
2 moles
o .....
0 20 40 60 80 100 1 2 0
T ime (min . )
Figur e 19 . Plot of log P versus time for hydroge nation of nitroethane s howing break point at 2 mo les of hydrogen .
\..!'\ �
..... .
s.. s.. 0 0 -
•
s:: ...-4 a
0
� <l
1 .0
o . a
0 .6
0 .4
0 . 2
0 .0�----------------------�----------------------�------------�
o .oo 0 . 05 0 . 10
Grams of 5% Rh/A12o3
Figure 20 . Plot of .t:. P/10 min . (o o rr . ) ve rsus c a talys t weight fo r hydrogenati on o f ni trome s i tyl e ne .
'(g
59
TABLE VI
EFFECT OF INITIAL ffiESSURE UPON THE RATE OF HYDROGENATION OF NITROMESITYLENE AT 30° OVER SUPPORTED RHODIUM
Weight or Catalyst (g . )
0 .1005
0 . 1005
0 . 1086
Initial Pressure (p . s . i . a. )
24 .6
49 . 4
74 . 3
6 P /10 min./g . ( corr . )
3 . 98
5 . 23
8 . 31
• s.. ls 0 -.
� •
1"1 orl E!
0 � Pot <l
10
8
6
4
2
0 . 5 1 .0
Grams acceptor/50 ml . acetic ac id
Fi gure 2 1 . Plot of .6 P/10 min ./g . (oorr . ) versus accep-to r c onc entration fo r hydrogenat ion o f nitromes itylene .
1 . 5 � 0
114 bO 0 �
18 .70
18 . 65
0 5 10 1 2�5
T ime (min . )
Figure 2 2 . Plot of l o g P ve rsus time for hydroge nati on of nitro mes i tylene .
gi
62
two moles of hydrogen have been utilized . Also the first order dependence
on acceptor at low concentrations could give this deviation . A summary
of runs at 30° is given in Table VII .
The activation energy for the hydrogenation is 10, 700 cal . /mole as
calculated from the plot shown in Figure 23 . This value is intermediate
between those for the other nitro compounds studied and is nearly the
same as that obtained for nitroethane .
One run was taken to completion to ascertain if aQY definite breaks
in the kinetic plot were apparent . As shown in Figure 24 there appear
to be slight breaks at one, two, and three moles of hydrogen. With such
plots, other nitro compounds have shown definite breaks corresponding to
intermediate formation. However, when the breaks are not very pronounced
it is impossible to draw conclusions about the presence of intermediates .
Actual isolation and identification of the materials present before
absorption of three moles of hydrogen were not made . Calculated rate con
stants were based on the initial portion of the reduction.
E. 2-Nitro-1-butene
Equilibrium catalyst weights below 0 . 06 g . are indicated in Figure
25 . Also in the same plot, the effect of acceptor concentration is shown .
The reaction i s essentially zero order in acceptor for the concentration
range studied . The reaction is approximately first order in hydrogen
pressure as shown in Table VIII .
A typical plot is shown in Figure 26, which indicates deviation
from linearity at about 49 per cent reduction. The amount of deviation is
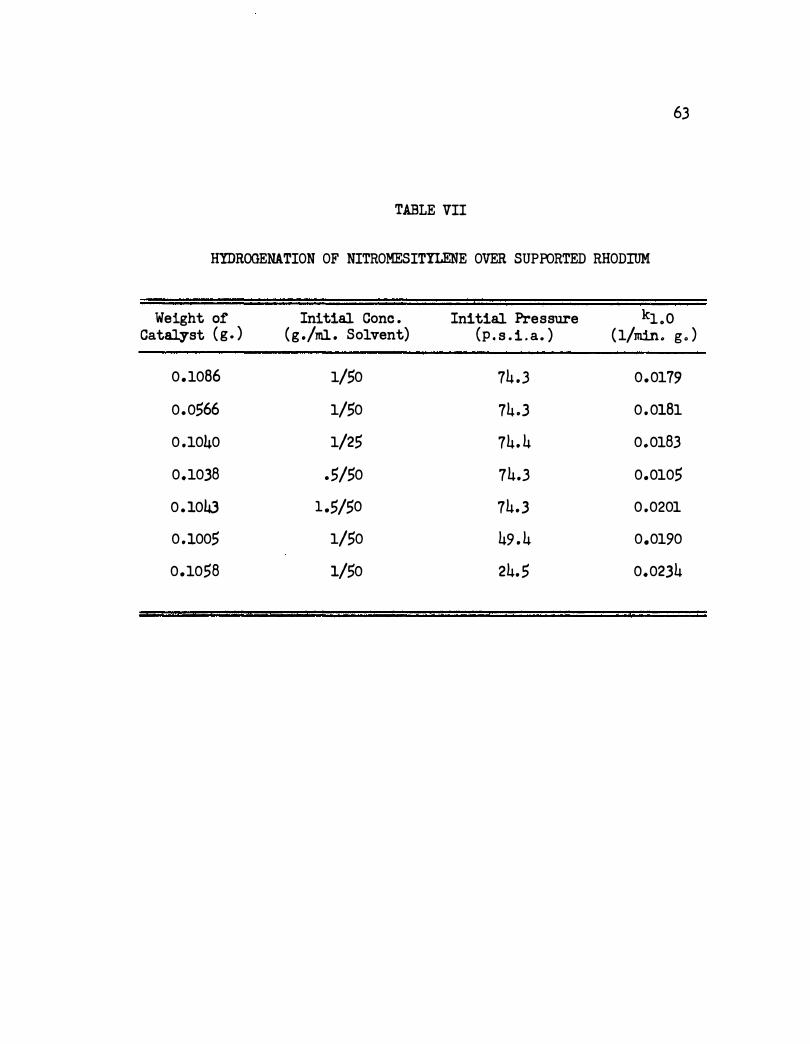
63
TABLE VII
HYDROGENATION OF NITROMESITYLENE OVER SUPPORTED RHODIUM
Weight of Initial Cone . Initial Pressure kLo Catalyst ( g . ) ( g ./ml . Solvent) (p . s . i . a . ) (1/min. g. )
0.1086 1/50 74 .3 0.0179
0.0566 1/50 74.3 0 .0181
0 .1040 1/25 74. 4 0.0183
0.1038 .5/50 74.3 0.0105
0 .1043 1 .5/50 74.3 0 .0201
0 .1005 1/50 49 . 4 0.0190
0.1058 1/50 24.5 0.0234
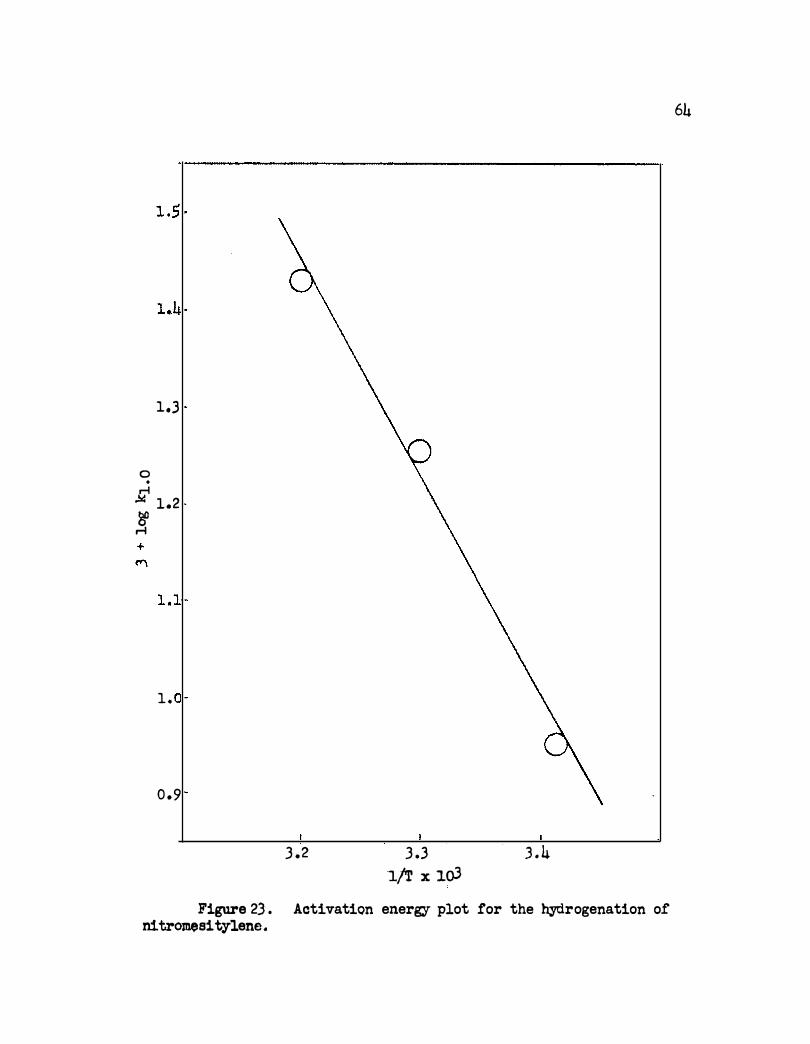
1 • .3
0 . r-l
� 1.2
!
1 . 1
l .
0.9
.3 .2 .3 • .3 .3 . 4
1./T X J.oJ Figure 2.3 . Activation energy plot for the hydrogenation or
nitram$sitylene.
64
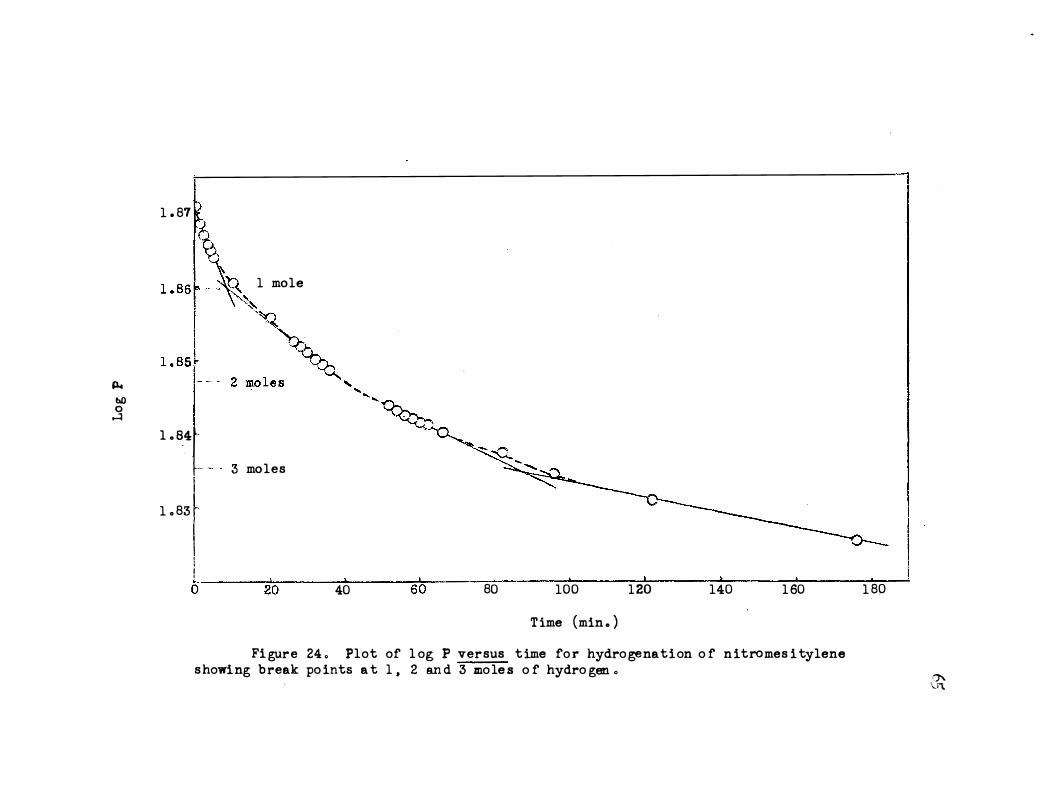
p.. bO 0
....:l
1 . 87 -.,.
-� \' 1 mole
l .J ,
, , 2 mo les
' , ,'�- -�
l . Bt . 3 mo les I
1 . 83 � I ! I \ . 0----:::2�0- 40 ti U � 80 100 1 20 140 1 60 1 80
T ime (min o ) Fi gure 24 . Plot of l og P versus t ime fo r hydro genation o f n itromes i tylene
s howing b reak po ints a t 1 , 2
an d 3 mo le s o f hydro gen .
I
I
')'. \X\
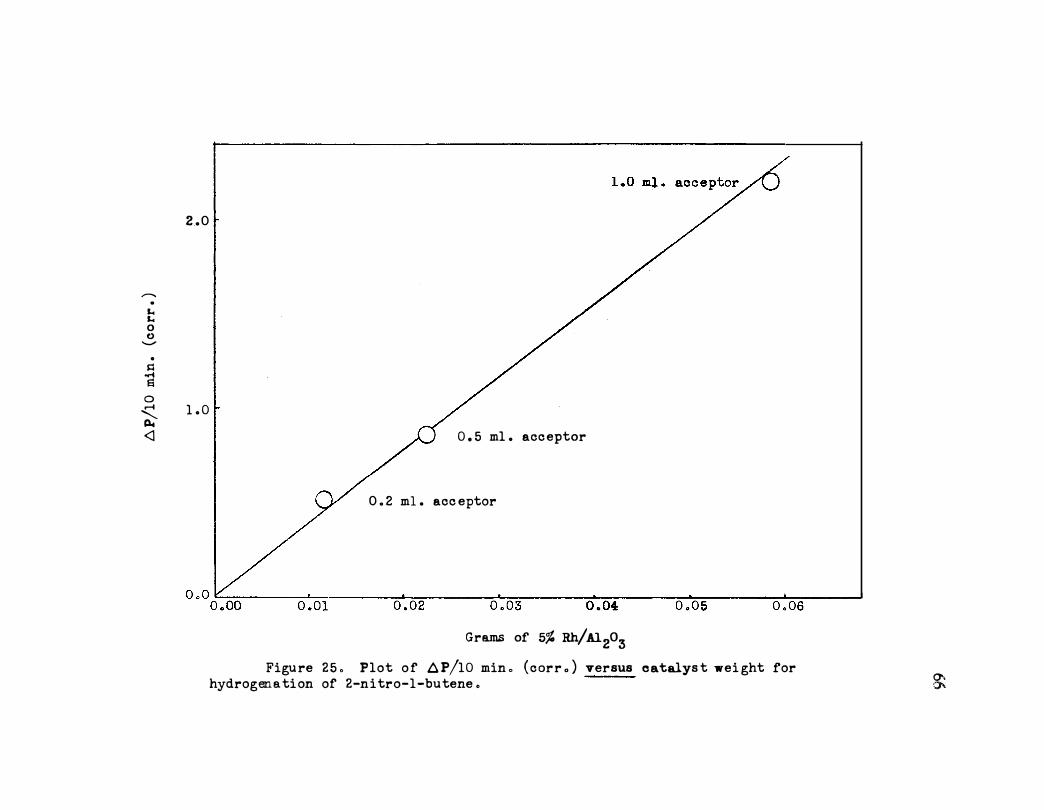
........ .
L. L. 0 () -.
s::: ori Ei
0 .--4 � <l
2 . 0
1 . 0
0 . 5 ml . acc eptor
0 . 2 ml . acc eptor
0 . 0 .��------L-�----���------��------��------��------��----� o .oo 0 . 01 0 . 02 0 . 03 0 . 04 0 . 05 0 . 06
Grams of 5% Rh/A12o3
Figu re 2 5 . Plot o f 6 P/10 min . ( c arr . ) versus catalys t wei ght for hydrogena ti on of 2-n i tro-1-butene . ()\
�
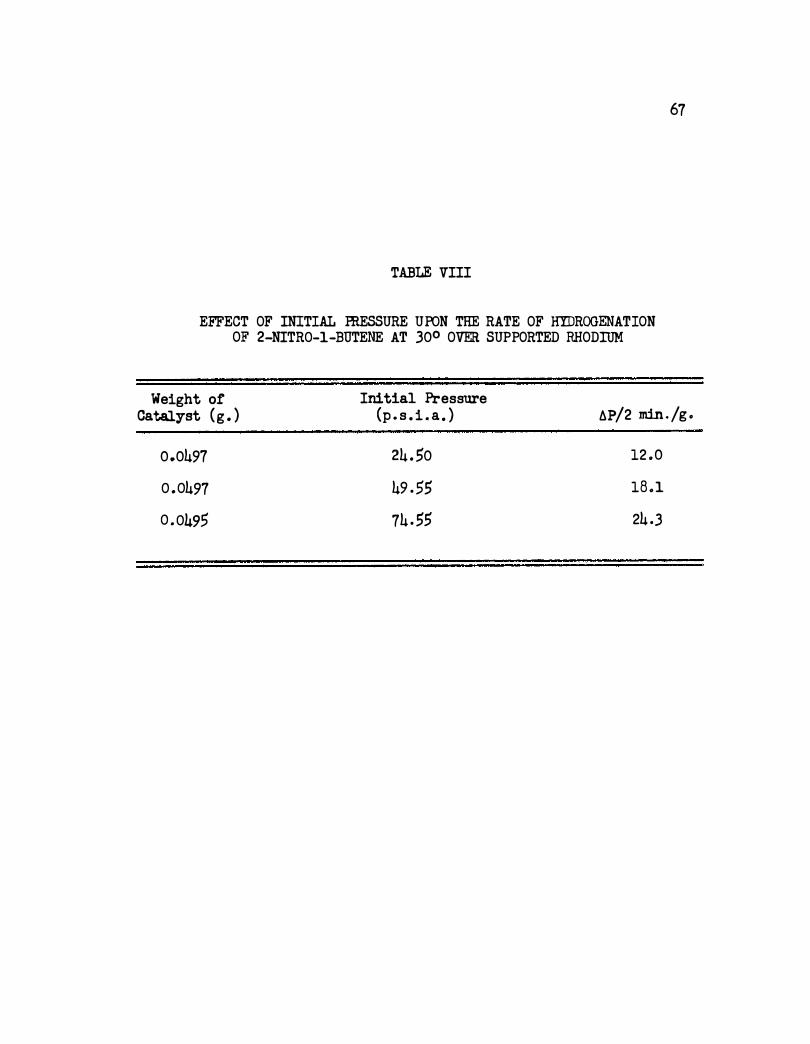
TABLE VIII
EFFECT OF INITIAL FRESSURE UPON THE RATE OF HYDROGENATION OF 2-NITR0-1-BUTENE AT 300 OVER SUPPORTED RHODIUM
Weight of Initial Pressure
67
Catalyst (g . ) (p . s . i . a . ) !J.P/2 min . /g .
0.0497 24 . 50 12 .0
0 . 0497 49 . 55 18 . 1
0 . 0495 74 . 55 24 .3
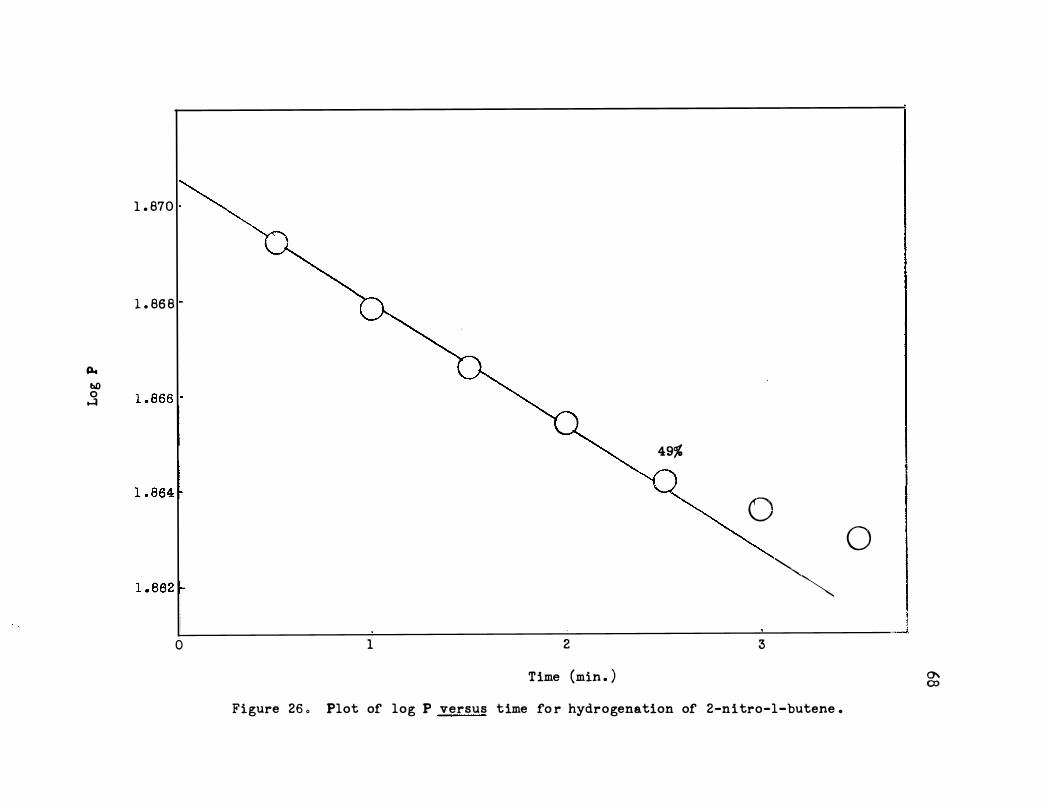
1 . 87 0
1 . 86 8
"" bO
1 . 866 1 0 �
l . 864 l
1 . 862 1-
0
� 49%
� 0
""� 1 2 3
T ime (min . ) Figure 26 . Plot of log P versus t ime fo r hydrogenation of 2-nitro-l-butene .
0
a-. (XI
69
difficult to explain by a first order dependence of acceptor since the
concentration is still in the range of zero order dependence, shown in
Figure 26. Also by using different ratios of catalyst weight to acceptor
weight for other runs, plots were obtained which indicate breaks at one
mole (Figure 27 ) a.nd two moles (Figure 28) .
A S'llli'II!1al7 of runs made at 30° is given in Table IX . The runs at
different pressures give rate constants indicating that strict first order
.dependence on hydrogen pressure does not holdq The apparent activation
energy for the hydrogenation of 2-nitro-l�butene in the rhodium-acetic
acid u,ystem is 11, 400 cal./mole which is rather high considering the
fact that the rate constant (kl.o) is higher than the rate constants for
the other nitro compounds studied . The activation energy plot is shown
in Figure 29 .
F . Comparison of Hydrogenation Results
All of the nitro compounds studied showed approximately first order
dependence on hydrogen pressure and the first order constants were there
fore calculated . Nitroethane and nitromesitylene exhibit first order
acceptor dependence at low concentrations and zero order at high concen
trations . Nitrobenzene, �-nitrostyrene, and 2-nitro-1-butene show
zero order acceptor dependence for all the concentration ranges studied .
The values for the rate constants are given in Table X. Comparison of
these constants with those obtained for the platinum�acetic acid u,yste�6e
is given in Table X L Rather constant ratios are evident . Comparison of
the apparent activation energies for the two systems is given in Table XII .
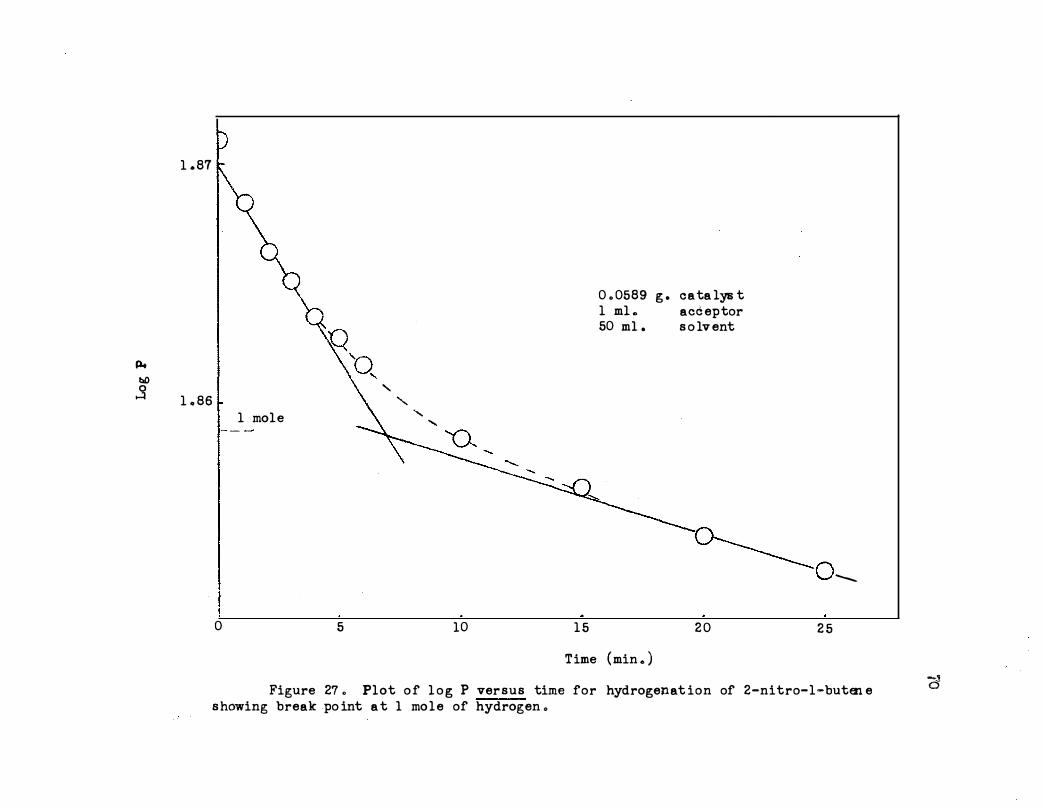
p.. bO .s
1 . 87
1 . 86 1 mole
0 5
' '
' '
10
0 . 0589 g . c a ta lys t 1 ml c acc eptor 50 ml . s o lv ent
o-_____o __
1 5 2 0 2 5
T ime (min .. )
Figure 27 .. Plot o f l o g P ver sus time for hydrogenat ion of 2-nitro- 1-buten e s howing break po int a t 1 mo l e of hydrogen o
_, d
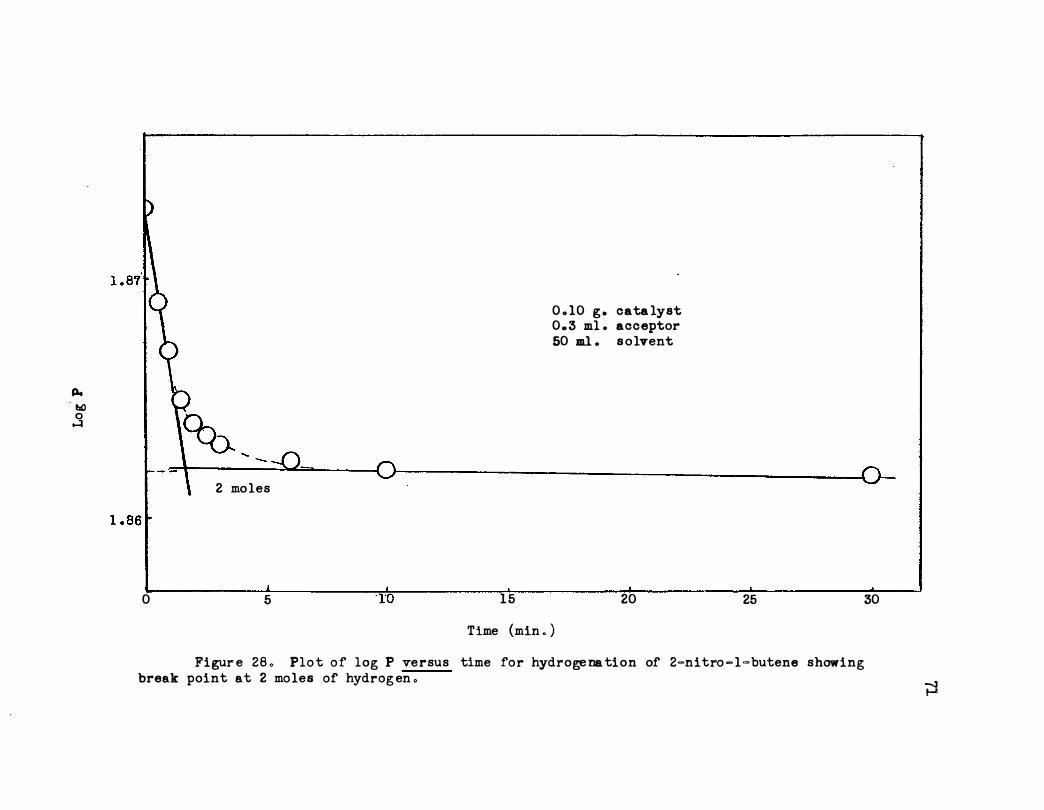
p.. bO 0
�
-2 mo les
0 5 -lo 15
0 . 10 g . cata lyst 0.3 ml . acceptor 50 m.l . s o lvent
20
Time (min o ) 25
Figur e 28 o Plo t o f log P versus time for hydro� na tion of 2�nitro � l = butene showing break point at 2 mo les of hydrog en o
30
jj
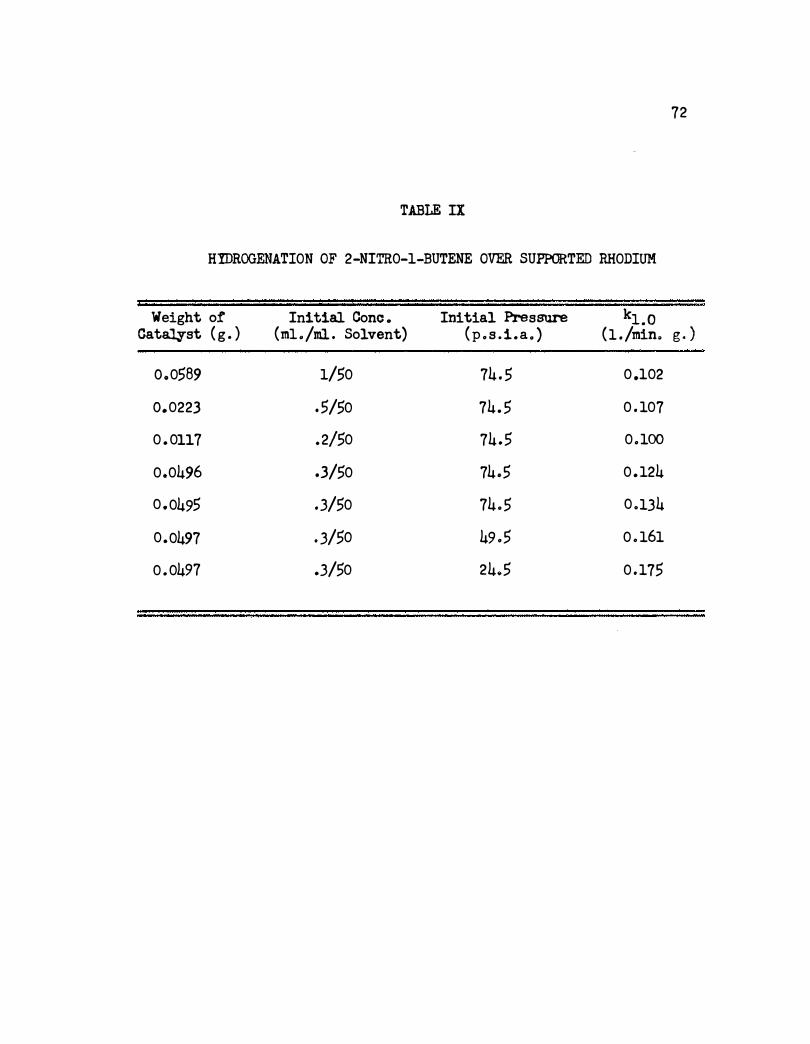
72
TABLE IX
H1DROGENATION OF 2-NITR0-1-BUTENE OVER SUPPORTED RHODIUM
Weight of Initial. Cone . Initial Pressure kl.o Oata.J.,yst ( g . ) (ml ./ml . Solvent) ( p . s .i .a . ) (1 ./min. g . )
0.0589 1/50 74. 5 0 .102
0.0223 . 5/50 74. 5 0 . 107
0 . 0117 . 2/50 74.5 0 .100
0.0496 .3/50 74 .. 5 0 .124
0 .0495 .3/50 74.5 0 .134
0.0497 . 3/50 49 .5 0 . 161
0 . 0497 .3/50 24.5 0 .175
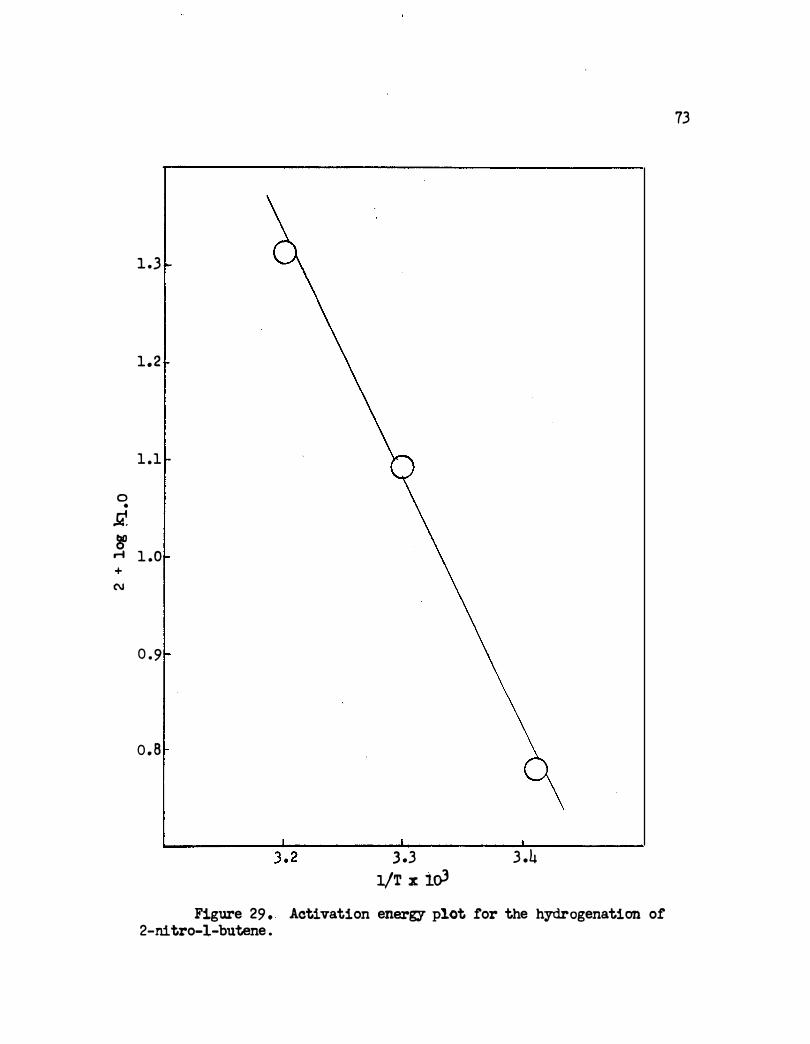
0 •
� 8'
r-f + N
1.3
1. 2
1 .1
1 .0
0 . 9
o . a
3 .3 3 .4 1/T X loJ
Figure 29 . Activation energy plot for the hydrogenation of 2-nitro-1-butene .
73
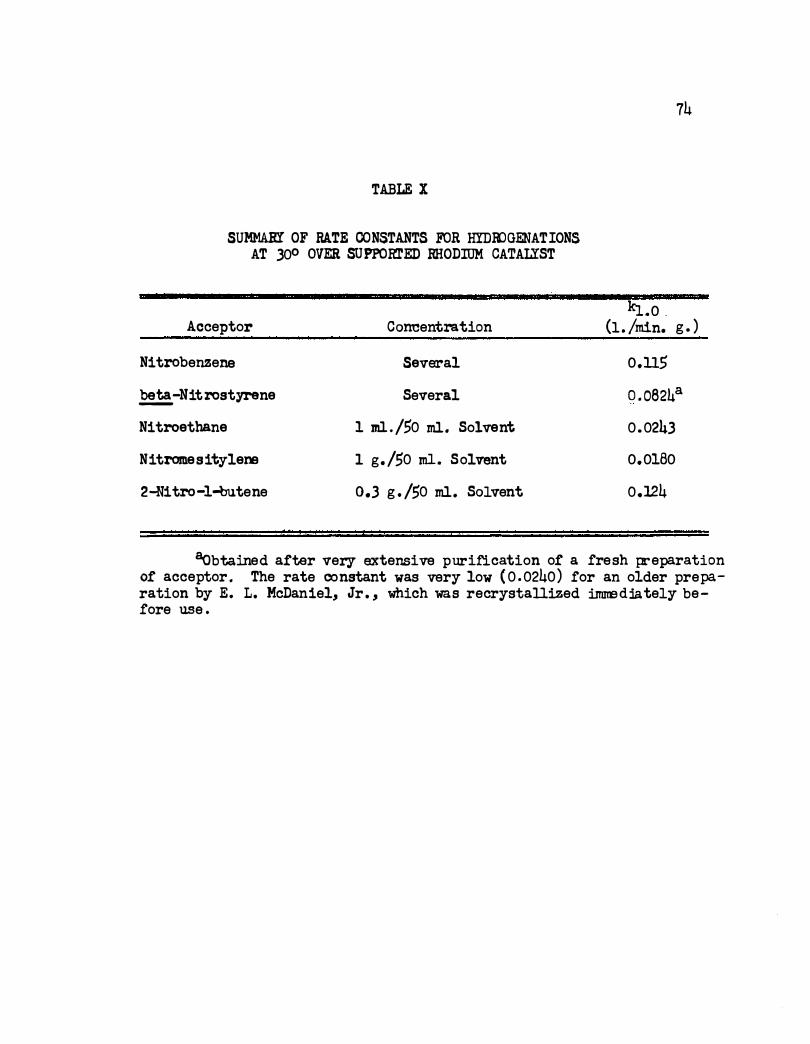
TABLE X
SUMMARY OF RATE CONSTANTS FOR HYDHDGENATIONS AT 300 OVER SUPPORl.'ED RHODIUM CATAU"ST
Acceptor Cormentration
Nitrobenzene Several
�-Nitrostyrene Several
Nitroethane 1 ml. /50 ml. Solvent
Nitromesitylene 1 g. /50 ml . Solvent
2-Ni tro-1-butene 0.3 g . /50 ml. Solvent
74
kJ..o . (1 . /min. g • )
o.n5
o . o824a
0.0243
o.olBo
0.124
Bobtained after very extensive purification of a fresh preparation of acceptor . The rate constant was very low ( 0 . 0240) for an older preparation by E. L. McDaniel, Jr . , which was recrystallized :ilnned:iately be fore use .
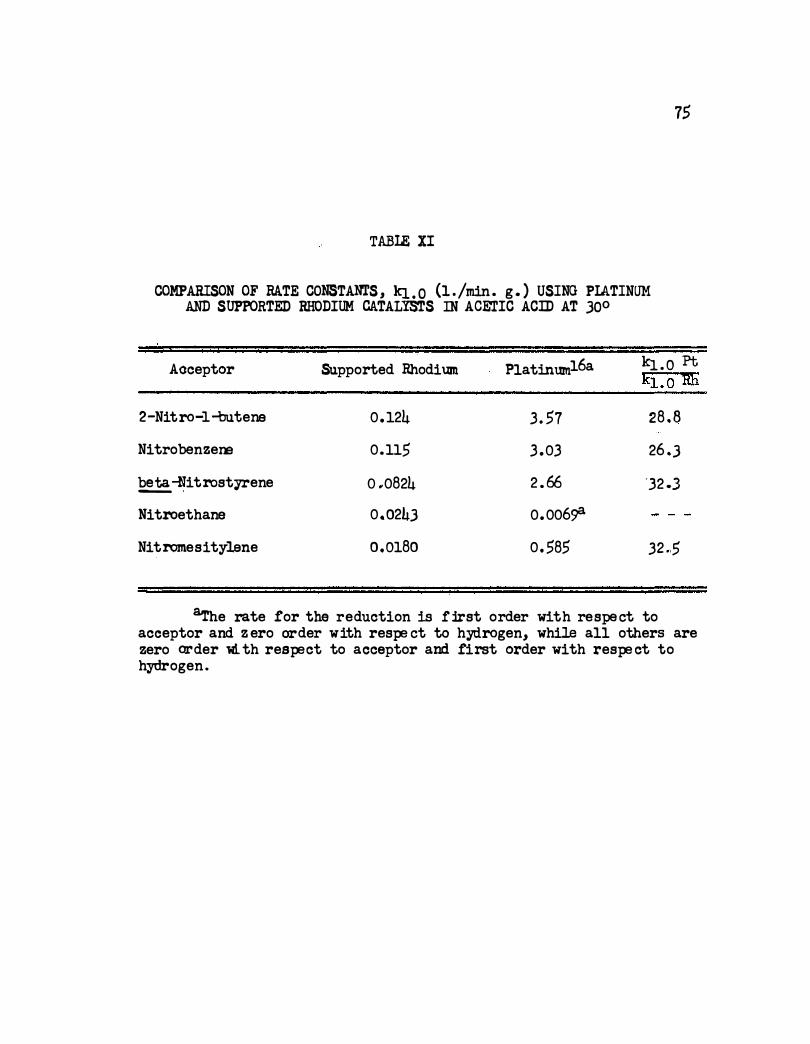
15
TABU: XI
COMPARISON OF RATE CONSTANTS, kl. o (1 . /min . g . ) USING PlATINUM AND SUPPORTED RHODIUM CATALYSTS IN ACETIC ACID AT 300
Acceptor Supported Rhodium Platinuml6a k L o Ft KL O mi
2-Nitro-1-butene 0 . 124 3. 57 28 . 8
Nitrobenzem 0.115 3 .03 26 . 3
��itrostyrene 0 .. 0824 2 . 66 ')2 .3
Nitroethane 0 .. 0243 0.006�
Nitromesi tylene o.o18o 0. 585 32 . 5
�e rate tor the reduction is first order with respect to acceptor and z ero order with respe ct to hydrogen, while all others are zero order ld. th respect to acceptor and first order with respe ct to hydrogen.
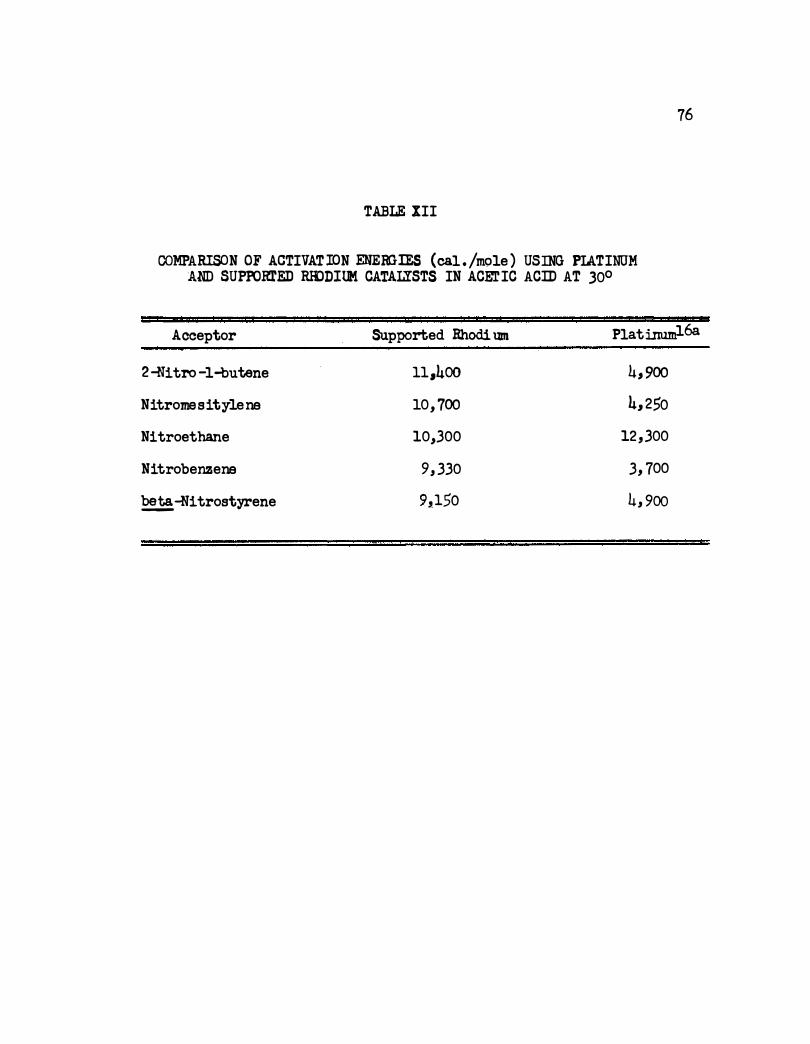
TABLE III
COMPARISON OF ACTIVATION ENEiiGIES (cal . /mc:>1e) USING PlATINUM AND SUPPORrED RI{)DIUM CATALYSTS IN ACEr IC ACID AT 30o
76
Acceptor Supported Rhodi um Platinum16a
2-Nitro -1-butene 11,400 4, 900
Nitromesity1ene 10, 700 4, 250
Nitroethane 10,300 12,300
Nitrobenzene 9, 330 3, 100
��itrostyrene 9,150 4, 900
G . Comparison With Deuterium Exchanges
77
Previous work2lc using the rhodium-acetic acid system and deuterium
has shown that low concentrations of 2-nitro-l-butene, nitrobenzene, and
�·nitrostyrene decrease the exchange of deuterium with acetic acid and
completely suppress the exchange at moderate concentrations . This fact
indicates that these compounds must be more strong� adsorbed on the
catalyst surface than is the solvent .
The present kinetic studies show that these three nitro compounds
in the same system give zero order dependence in acceptor concentration .
This must be due to strong monomolecular adsorption on the catalyst sur
face . Thus the deuterium exchange reactions would be decreased or pre�
vented by these layers of solute molecules. Of more interest is the fact
that nitromesit,ylene and nitroethane increased the exchange at low con
centrations and gradually decreased the exchange at higher concentrations .
From the kinetic results this phenomenon can be partially explained. At
low concentrations, the rates of reduction of both compounds showed first
order acceptor dependence whereas at higher concentrations zero order
dependence was approached .
The nitro compound competes with acetic acid and deuterium for
adsorption upon the catalyst. The rate of reduction of the nitro compound
will be proportional to the fraction of surface that it covers . If only
a small fraction is covered by the nitro compound, more of the surface
will be available for acetic acid and deuterium adsorption . Thus a high
exchange rate would be expected if the compound only partially covers the
surface .
78
Evidently nitromesitylene and nitroethane or their reduction
products can give some special effect with the adsorbed acetic acid,
so that the exchange is actually greater than with aeetio aeid alone .
Salt formation with hydroxylamine& or aminea might occur on the surface
s o that the hydrogen of acetic acid i s more available .
The decrease in exchange at higher concentrations of nitromesi
tylene and nitroethane is explained by the hydrogenation results . Zero
order aceept�r dependence was approached at higher c oncentrations . Thus
the fraction of surface covered by acceptor is increasing with an increase
in acceptor concentration .
CHAPI'ER IV
SUMMARY
The kinetics of the catalytic hydrogenation of the nitro group of
several compounds have been investigated . The supported rhodium-acetic
acid system was employed .
Nitrobenzene, �-nitrostyrene, nitroethane, nitrome sitylene and
2-nitro-1-butene gave kinetic behaviors which were first order with re
spect to hydrogen pressure . Nitromesitylene and nitroethane exhibited
zero order acceptor dependence at high concentrations and first order
at low concentrations . Nitrobenzene, �-nitrostyrene, and 2-nitro-1-
butene exhibited zero order dependence for all concentrations studied .
Variation of the ratio of catalyst weight to acceptor concentration, in
s ome case s, revealed the stepwise mechanism of the hydrogenation of the
nitro group . In some cases the possible intermediates were indicated
or identified .
A comparison with deuterium exchange data shows that the exchange
effects are paralleled by the hydrogenation data . In general the Langmuir
adsorption isotherm explains both the exchange data and hydrogenation
data . The special effect of increased exchange in the case of nitromesi
tylene and nitroethane is discussed .

BIBLIOGRAPHY
BIBLIOGRAPHY
1. M. Faraday, Phil . Trans . , 114, 55 (1834) . (W. L . Lohse, "Catalytic Chemistry, " Chemic"BB'PU.blishing Co. , Inc . , New York, N . Y. , 1945, p . 5) .
2 . J . J . Berzelius, Chem. Zentr . , 1836, 63 o
3 . I. Langmuir, �· �· Chem. Soc . , 38, 2221 (1916) .
4. J . E . Lennard-Jones, Trans . Far . �. , 28, 333 (1932) .
5 . N . D . Sokolov in 11 Problems in Kinetics and Catalysis, " Vol . VIII, Moscow, 1955, pp . 141-144 .
6 . W. G . Pollard, �· !!.!!· ' 56, 324 ( 1939 ) .
1 . J . K . Roberts, Proc . �· �. , !· ' 152, 445 {1935) .
8 . I . Langmuir, Trans. Far. Soc . , 17, 607 (1921) .
9 . C . N. Hinshelwood, ltThe Kinetics of Chemical Change, " Oxford Univer-sity Press, New York, N. Y. , 1940, p . 187 .
10 . E . K . Rideal, Proo . Cambridge Phil. Soc . , 35, 130 (1939 ) .
11 . D . D . Eley, Quart . Rev . (London) , 2, 213 (1949) .
12 . K . J . Laidler in P. H . Emmett, •catalysis, " Vol . I, Reinhold Publishing Corp . , New York, N . Y. , 1954. Ref . a, p . 76; b, p . 123 .
13 . H . A. Smith and J . F. Fuzek, !!_. Am .. Chem. Soc . , 70, 3743 (1948 ) .
14. S . Glasstone, · K . J. Laidler, and H . Eyring, "The Theory of Rate Processes, " McGraw-Hill Book Co. , Inc. , New York, N . Y. , 1941, p . 370.
15 . G . M. Schwab in "Advances in Catalysis, • Vol . II , Academic Press, Inc . , New York, N. Y. , 1950, p . 255 .
16 . W. C . Bedoi t, "Kinetics of the Catalytic Hydrogenation of the Nitro Group on Adams. Platinum and Raney Nickel Catalyst, " Doctoral Dissertation, Universi� of Tennessee, Knoxville, ·Tennessee, 1950 . Ref . a, p . 87 ; b, p . 90; c, p . 57; d, p . 58 ; e, p . 73, 90; f, p . 67 .
17 . W. C . Bedoit and H . A. Smith, J . Phvs . and Colloid Chem., 55, 1085 (1951) .
- � - - -
18 . H . A. Smith and W. c . Bedoit in P. H . Emmett, °Catalysis, " Vol . III, Reinhold Publishing Corp . , New York, N. Y. , 1955, pp . 149�170 .
82
19 . E . L . McDaniel, •The Effects of Certain Nitro and Related Compounds Upon the Rate of Exchange of Deuteri� Gas with Acetic Acid Over Adams Platinum Catalyst, 11 Master' s Thesis, University ot Tennessee, Knoxville, Tennessee, 1954.
20. H. A. Smith am E . L . McDaniel, J . Am. Chem . Soc., 77, 5.33 (1955 ) . - - - - -
21 . E . L. McDaniel, "Catal:ytic Reactions Involving Deuterium, Hydrogenation Solvents, and Nitro Compounds, " Doctoral Dissertation, University of Tennessee, Knoxville, Tennessee, 1956 . Ref . a, · p . 79J b, P • 32 J c, p . 86 .
22 . W. B . Innes in P. H . Emmett, "Catalysis, tt Volo I, Reinhold Publishing Corp . , New York, N. Y. , 1945, p . 245 .
2.3 . G . Gilman and G . Cohn in "Advances in Catalysis, n Vol . IX, Academic �as, Inc . , New York, N. Y. , 1957, p. 736.
24. N. D . Zel!nsky and M . B . Turova-Pollak, !!.!!!:· , 58B, 1298 (1925) .
25. L. Hernandez and F. F. Nord, i!· Colloid � . , J., .363 (1948) .
26. R . G . Thompson, "A Study of the Catalytic Hydrogenation of Methoxybenzenes over Platinum and Rhodium Ca�sts, n Doctoral Dissertation, Univerai ty ot Tennessee, Knoxville, Tennessee, 1956. Ref . a, p . 65; b, p . 19 .
27 . B . L . Stump, Private Communication.
28 . H . A. Smith, D . M. Alderman, and F . W. Nadig, !!_. Am. �· Soc . , §1_, 272 (1945) .
29. G. Powell and F. R. Johnson, Ors. Syntheses, � 68 (1934) .
30. D . E. Worrall, ibid . , _2, 66 (1929) .
31 . G . W. A. Kahlbaum, �· physik . �. , � 601 (1898) .
32 . R. Weegmann, �., ,g, 229 (1888 ) .
33 . H. A. Smith, !!:.· al. , i!_. !:.'!· �· �. , 67, 272, 276, 279 (1945) .
34. s . s. Scholnik, J. R. Reasenburg, E . Leiber, and G. B . L. Smith, i!· Am. Chem. Soc . , §, 1192 ' ( 1941) •
.35. N. A. Lange, "Handbook on Chemistry, • 8th ed. , Handbook Publishers, Inc . , Sandusky, Ohio, 1952, p . 395 .
36 . "International Critical Tables, " Vol. IV, 1st ed . , McGraw-Hill Book Co. , Inc . , New York, N . Y. , 1928, p . 128 ; ibid . , 19.30, Vol . VII, p . 84.
-
83
31 . 0 , Wallach, �.,. 343, 53 (1908 ) .
38 . A. Sonn and A . Sohellenburg, �. , 50, 1513 ( 1917 ) •
PART II
THE EXCHANGE OF DEUTERIUM GAS AND METHANOL IN THE PRESENCE
OF RANEY NICKEL
CHAPI'ER I
INI'RODUCTION
A . General Discussion
If two reactants are adsorbed on a catalytic surface, the reaction
can proceed between adjacent molecules . This is called the Langmuir
Hinshelwood mechanism. 1' 2 To express the rate for this mechanism, one
could calculate the surface concentration of reactants using adsorption
isotherms . The rate of reaction is then proportional to the fractions
of surface covered by each reactant .
If one reactant is adsorbed and another is in the van der Waals
layer next to the surface, a reaction can proceed by collisions of the
reactant molecules . This is called the Rideal-Eley mechanism.3, 4 It
does not have such widespread application as the former mechanism .
Molecules may be adsorbed on a catalytic surface by means of chemi
cal bonds, and high energies are usually associated with the process .
There may be an appreciable activation energy of adsorption, in which case
the process is called activated adsorption . Physical adsorption is prob
ably not important in the reactions of stable molecules .
If one assumes adsorption to be ideal, there would be no interaction
of the adsorbed molecules and the catalyst surface would be homogeneous .
For such condi tiona the amount of chemis orbed substance on the surface is
given by the Langmuir adsorption isotherm . 5a
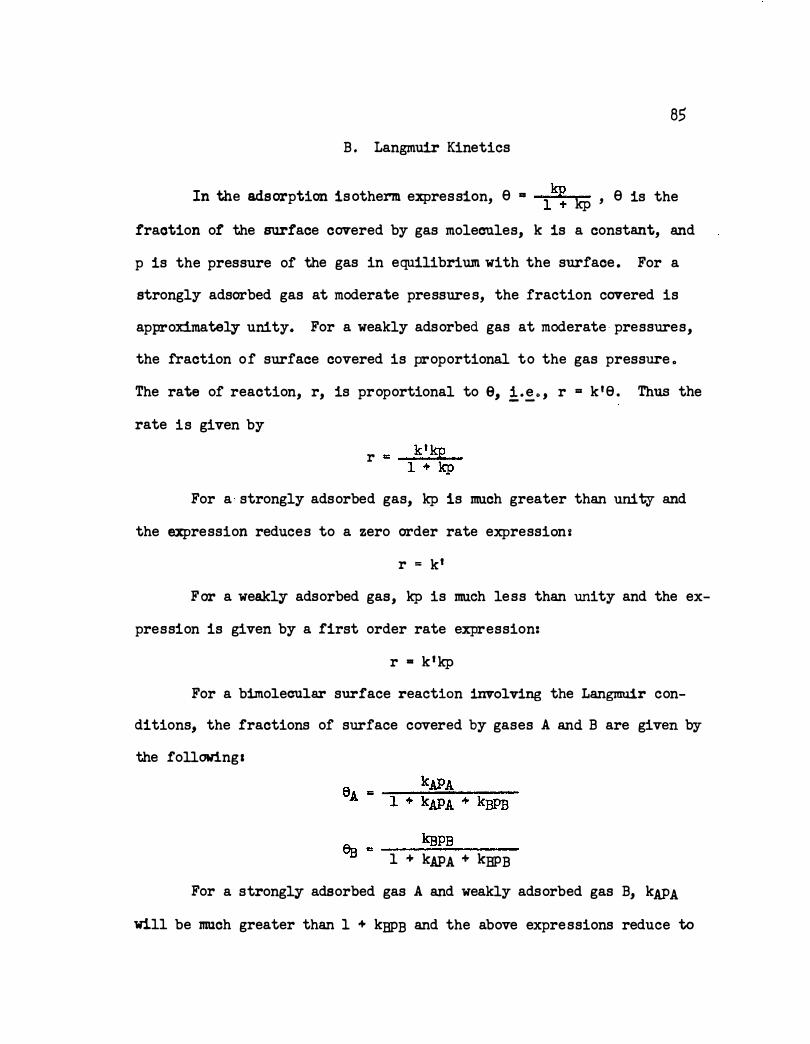
85
B . Langmuir Kinetics
In the adsorption is otherm expres sion, e .. 1� kp , e is the
fraction of the surface covered by gas molecules, k is a constant, and
p is the pressure of the gas in equilibrium with the surface . For a
strongly adsorbed gas at moderate pressure s, the fraction covered is
approximately unity. For a weakly adsorbed gas at moderate · pressures,
the fraction of surface covered is proportional to the gas pressure .
The rate of reaction, r, is proportional to e, !·�· ' r = k '8 . Thus the
rate i s given by
k ' kp r "' ---;.;;....;.-�-1 + kp
For a strongly adsorbed gas, kp is much greater than unity and
the expression reduces to a zero order rate expression s
r = k'
F ar a weakly adsorbed gas, kp is much le ss than unity and the ex-
pression is given by a first order rate expression:
r • k 1 kp
For a bimolecular surface reaction involving the Langmuir con-
ditions, the fractions of surface covered by gases A and B are given b.y
the following &
A... kBPB "'J:j = __ ...;;;.;;..;;:;....._ __ 1 + k.APA + kBPB
For a strongly adsorbed gas A and weakly adsorbed gas B, kAPA
will be much greater than 1 + kBPB and the above expre ssions reduce to
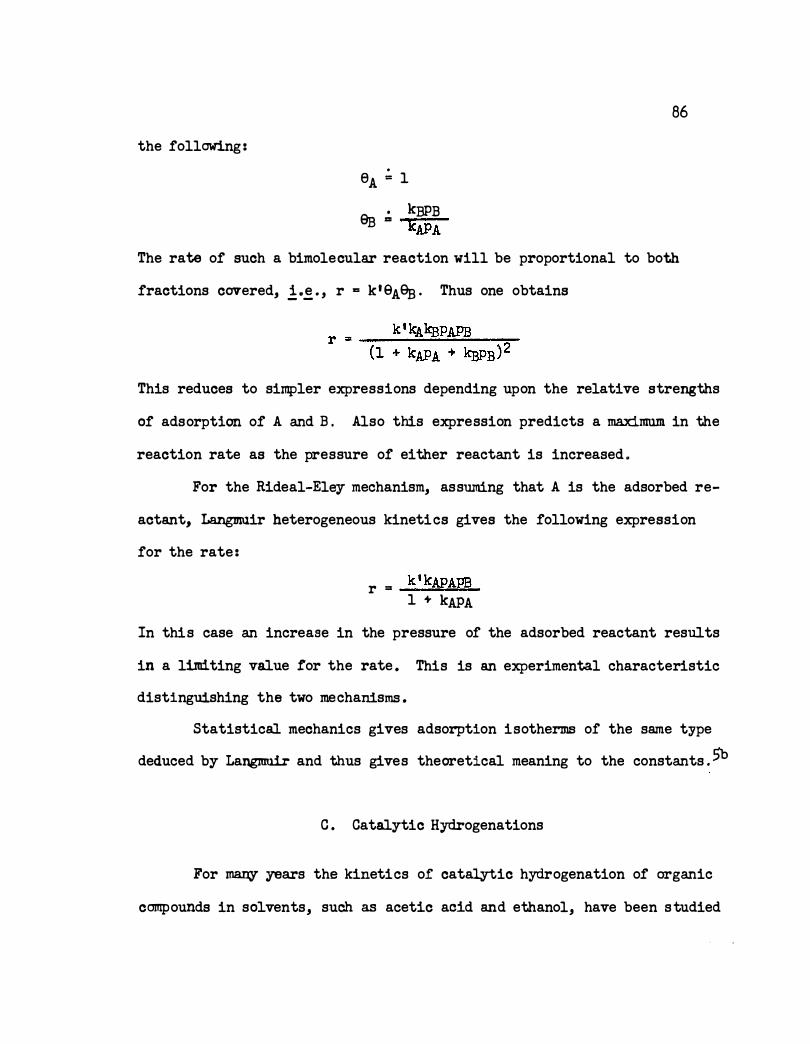
the following :
eA ,;, 1
• kBPB 9]3 = kA.PA
86
The rate of such a bimolecular reaction will be proportional to both
fractions covered, .!·� · , r == k' 9A9f3 . Thus one obtains
This reduces to simpler expressions depending upon the relative strengths
of adsorption of A and B . Also this expression predicts a maximum in the
reaction rate as the pressure of either reactant is increased .
For the Rideal-Ele.y mechanism, assuming that A is the adsorbed re-
actant, Langmuir heterogeneous kineti cs gives the following expression
for the rate :
-k_'_k�AP�APB:=.=:;... r =
1 + kAPA
In thi s case an increase in the pressure of the adsorbed reactant results
in a limiting value for the rate . This is an experimental characteristic
distinguishing the two mechanisms .
Statistical mechanics gives adsorption i sotherms of the same type
deduced by Langmuir and thus gives theoretical meaning to the constants • .5b
C . Catalytic Hydrogenations
For many years the kinetics of catalytic hydrogenation of organic
compounds in solvents, such as acetic acid and ethanol, have been s tudied
87
at these laboratories. In most cases, the e::x:perimentally found orders
can be e::x:plained on the basis of Langmuir kinetics but some of the mech
anisms involved remain to be clearly formulated.6, 7, 8
There are many studies reported in the literature concerning the
catalytic hydrogenation of nitro compounds on Raney nickel catalyst but
most are not kinetic in nature . 9, 10 Bedoit6a has made a kinetic study
of the catalytic hydrogenation of nitro compounds using Raney nickel
catal.yst and ethanol solvent. The aromatic and aliphatic nitro compounds
showed zero order acceptor dependence and first order dependence in hydro
gen pressure. Far most aliphatic and aromatic compounds, it was postu
lated that the initial attack occurred on the coordinate-covalent o�en.
Two reasons for studying hydrogenation and deuteration reactions
are that additional evidence for the mechanisms might be obtained and
that they might give basic data showing how to utilize kinetic methods
for separating �drogen and deuterium.
Some studies have been made using deuterium, in place of hydrogen,
for the reduction of some nitro compounds . The reaction is slower and
is complicated by the exchange of deuterium gas with hydrogen of the sol
vent. S everal exchange reactions for various catalyst-solvent systems
and the effect of nitro compounds on the exchanges have been examined . ll, l2, 13
The present work is a study of the exchange of deuterium with methanol
over Raney nickel and the effect of some nitro compounds on the exchange.
88
D . Catalytic Deuterium Exchanges
Deuterium gas exchanges with practically all hydrogen containing
compounds when sui table catalysts and condi tiona are employed . Deuterium
exchanges readily with water, benzene, ethanol, acetone, 2-ethylhexanol,
�-butane, and ethyl ether vapors over platinized platinum at room tempera
ture . 14
With ethanol vapor the exchange was first order in deuterium pres-
sure . Increasing the pressure of ethanol at constant deuterium pressure
gave a maximum in the rate of exchange, indicating that a Langmuir-
Hinshelwood mechanism was operating . The exchange of ethanol vapor was
seven times as rapid as ethanol liquid .
Exchange studies of deuterium with various alcohols over metal
films such as platinum, rhodium, and nickel have been made .15 Nickel
was found to be the least active for the exchange . The rate expression
for methanol exchange indicates one-half order in deuterium and one -half
order in methanol pressure . One -half order dependence would be predicted
if deuterium and methanol are adsorbed with dissociation to give reaction
and if they are adsorbed with about the same strength .
Studies of deuterium gas exchange with acetic acid over Adams plat-
inum, with methanol over Adams platinum, with acetic acid over supported
rhodium, with methanol over supported rhodium, and with methanol over
Rane.y nickel have been carried out in these laboratories .11, l2, l3 With
the acetic acid-supported rhodium s.ystem, first order dependence in
deuterium pressure was observed .l3c With the methanol�Adama platinum
system, six-tenths order dependence was observed . l3d
E. Statement and Purpose of the Research
89
The kinetic behaviors for the hydrogenation of same nitro compounds 6a over Raney nickel using ethanol solvent have been previously elucidated .
There should be little di!ference using methanol as a solvent. The effects
of nitro compounds upon the exchange of deuterium with methanol over Raney
nickel were to be studied and correlated with the hydrogenation kinetics .
Also it was hoped that the role of the catalyst in the exchange and the
mechanism of the exchange reaction could be better explained .
CHAPTER II
EXPERIMENTAL
A . Preparation of Raney Nickel
Raney nickel was prepared in several batches by a method similar
to that given by Bedoit . 16 In a 2-1 . , three-necked, r ound-bottomed
flask equipped with thermometer and motor-driven glas s stirrer were
placed 128 g . of c . p . sodium hydroxide and 500 ml . of distilled water .
The flask was immersed in a pneumatic trough filled with cold tap water,
and equipped with a siphon s o that the cooling bath c ould be regulated .
When the temperature of the alkaline solution had subsided to 50°, 50 g .
of commercial Raney nickel-aluminum alloy powder was added at such a rate
to the rapidly stirred solution that the reaction temperature remained
at 50° .
The trough was removed and a Glas -Col heating mantle was placed
about the reaction flask . The mixture was digested at 50° for one hour
with continued stirring . In some early preparations, the catalyst was
then transferred to a 2-1 . Erlenmeyer flask with the aid of deaerated
distilled water and was washed by decantation with 2 -1 . portions of de
aerated distilled water . After twenty washes the wash solution was
neutral to phenolphthalein . Washing was continued ten or fifteen more
times using deaerated water . Four washings with 500 ml . portions of de
aerated distilled methanol were made . The catalyst was transferred to a
150-ml . , glass-stoppered bottle and stored under methanol in a refriger
ator. The distilled water and distilled methanol used in the washing
91
steps were deaerated by bubbling tank nitrogen through the liquids for
ten minutes . Later preparations omitted the deaeration steps , which
deactivated the catalyst .
Raney nickel catalyst contains some impurities pre sent in the
original alloy, occluded aluminum, traces of silicon, and occluded alkali .
Immediately following preparation, Raney nickel is saturated wi tb. hydro
gen, s ome of which cannot be removed by ordinary heating . The catalytic
activity declines as the hydrogen is released, but the two behaviors are
not parallel . The hydrogen is probably not simply adsorbed but is com
bined w1 th the metal in the form of the hydride .
Raney nickel is a dense , black, crystalline powder . Oxides formed
on the surface of the metal may j oin with the nickel to give active centers
on the surface . 17 The presence of iron and other metals in the nickel
causes crystallization into the face-centered cubic type of lattice . The
cubic form of nickel is catalytically active whereas the hexagonal is
not .18
B . Preparation and Purification of Nitro Compounds
The preparati on of the nitro compounds used in this work is de
scribed in Part I of this dissertation. The liquid solutes, nitrobenzene,
nitroethane, and 2-nitro-1-butene, were redistilled immediately before use .
The solid solute s, nitramesitylene and �-nitrostyrene, were recrystal
lized immediately before use .
C . Purification of Methanol Solvent
92
Drum grade synthetic methanol was fractionally distilled in an
8-ft. Vigreux column. Constant-boiling cuts were collected at a reflux
ratio of 10: 1 . A typical cut boiled at 63 . 8°/740 mm.
D . Preparation of Deuterated Methanol
Ordinary methanol was equilibrated with heavy water of greater than
99 .5 per cent purity obtained from Liquid Carbonic Company. After four suc
cessive acid-catalysized equilibrations, heavy methanol, CHJOD, of at
least 99.6 per cent purity was obtained . The procedure was as followa x
A mixture of 25.0 ml . of distilled methanol and 25 . 0 ml . of heavy
water containing a trace of sulfuric acid was renuxed for more than
twenty minutes in a small stilL The still was equipped with a. 15-inch
Vigreux column, a total-condensation partial take-off head, and a 50-ml .
pot heated by an internal wire coil . After refluxing, the methanol was
collected at a 2 : 1 reflux ratio , which required about two and one-half
hours . The remaining aqueous portion was removed from the pot .
The collected methanol was then heated with a new 25 . 0-ml . portion
of heavy water for more than twenty minutes. The slow distillation and
collection were repeated as before . The procedure was repeated two more
times to give 20 .0 ml . of CHJOD of at least 99 . 6 per cent purity, as
determined by calculation using the experimental value, 1 . 81, for the
equilibrium constant .l9
9.3
Each distillation required about two and one-halt hours, which
was sufficient time for almost complete equilibration. The actual
vOlumes of methanol for each successive equilibrati on were less than
the volumes assumed for the calculations and thus the calculated purity
is a mini:mum value . The methanol behaved like pure CH,30D when treated
with deuterium gas and Raney nickel catalyst for an exchange run . No
hydrogen was detected in the sample gas after the exchange .
Eo Deuterium and Hydrogen
Deuterium gas of greater than 99 .5 mole per cent purity was ob
tained from the Stuart Oxygen Company of San Francisco . It was passed
through a trap cooled with liquid nitrogen immediately before use . Elec
trolytic hydrogen, obtained from the National Cylinder Gas Compaqy, was
used in prelim.ina.ry runs for testing the effusion system . The hydrogen was
also passed through the trap immediately before use, except in a few ex
change runs o
F . Reaction Apparatus
1.. Reaction Vessels
The reaction vessels consisted of so�� , Erlenmeyer flasks sealed
at the neck to the side arms of number 6 Pyrex stopcocks 6 · em . below the
stopcock housingo To the other arm of each stopcock a socket of a standard
ball and socket j oint ( 28/15) was sealed about 7 em. from the housing .
The total volume of the reaction flasks to the stopcock was 63 ml .
94
The flasks were tested for leaks with a Tesla coil o Cleaning was
effected with a ni trio acid-sulfuric acid mixture . The flasks were rinsed
with tap water five times, distilled water five time s, steamed, and dried
in an oven at 130° .
2 . Shaker
Reactions were carried out by shaking the flask in a controlled=
temperature shaker for known times . The shaker was driven by a geared
down Mi.xma.ster motor mounted on an iron base . The j acket for temperature
control consisted of a bras s can 4 om... in width and 10 em. in depth
mounted in an outside brass can having a width of 7 . 5 em ... and depth of
11 em.., An inlet connection was at the base of one side and an outlet con
nection was at the top of the opposite side o The reaction flask was seated
on the bottom of the inside can and held in place by a parti al� split, one
hole No .. 10-1./2 rubber stopper o The flask was surrounded by water up to
the rubber stopper ... Within the apace completely enclosed by the two cans,
water from a c onstant temperature bath was ciroulated o
With this shaker bath, 10 ml. of methanol in a reaction ves sel at
room temperature could be brought to a constant temperature of 35° in less
than five minutes . In practice, the flask contents were already at the
desired temperature before insertion into the jacket . The flask c ould be
shaken at constant speeds from 150 to 340 cycles per minute, with the body
of the reaction flask traveling through an arc of about 30 degrees at a
distance of 17 em. from the axis of revolution .
95
3 . Analytical Apparatus
It seems appropriate to mention s ome unsuccessful attempts to
utilize a heat conductivity apparatus for the determination of gas compo
sition . This apparatus, constructed by E . J . Kelly, contained two
matched Pyrani tubes and a bridge arrangement . A calibration could be
made with hydrogen, deuterium, and their mixtures so that the percentage
composition could be read directly from the plot of composition versus
galvanometer reading .
This method would be very good if a large number of determinations
could be done at one time o With acetic acid as the exchange solvent, it
would be easy to keep the reaction mixtures frozen until a large number
were ready for the gas analysis o With methanol solvent this would not
be feasible .
This analytical method actually required more time than effusiometry
when only a few runs were to be made at one time , and it was subject to
very large random errors . One s ource of error noted was an erratic fluctu
ation due to normal vibration during use . Evidently s ome of the variable
resistors in the bridge need to be isolated from the rest of the apparatus
and housed in a special vibration-free environment . Also the response
varied with temperature, which was difficult to maintain constant for any
length of time when liquid nitrogen was employed for the bath .
The effusiometry apparatus used in this work to determine the amount
of hydrogen and deuterium in the mixture s after exchange reacti ons was
basically the same as used by other inve stigators . lla, l2a However, a
number of modifications were made in order to increase the precision and
96
to simpl ify the an al yt ic al pr ocedur e.
Earl y w ork w ith the pl atinum pinh ole indicated that eff us ion
times w er e subj ec t to significant var iation from run to run, fr om day to
day. T he greatest s ource of dif ficul ty w ith the system w as th at a sm all
space b etween th e pl atinum f oil and the stopcock, incl uding the b ore,
coul d not b e ev acuate d. Even after f ifteen or twenty fius hing s w ith the
gas b eing determined, a sl ight v ari ation in effusion times coul d b e de
tected. A noth er great difficul ty wa s cause d by the stopcock grease pl ugging
the pinh ole. T his occur red easily since the pinhol e w as of necessity v ery
clo se to th e stopc ock . I t is possibl e that heatin g effects ( as hydr ogen
or deuter ium is passed thr ou gh the pin hol e) gav e some var iation in effu sion
times, and the presence of m oistur e on the pl atinum which w as in con tact
w ith the atm osphere at all times coul d give some v ar iationo
F or each run w ith th is system, th e mer cury had to b e pulled into a
lower reservoir and then for ced wi th compre ssed air into an up per r eserv oir .
Th e qu antity an d cl eanl iness of the m er cur,y w oul d b e subj ect to s ame v ar i
ation . Al so, the stopcock grease used on a 120°, three-way sto pcock at
the bo ttom of t he system v ery readil y came to the top of the me rcur y on
b oth sides of th e system. T his necessitated freq uent cl ean ing of th e entir e
effusion system. T he eff usion system contained a thre e-w ay stop cock j ust
under the pl atin um foil an d t his w as subj ec t to l eak age after a few runs.
T he v acu um manifold c ontained a thr ee-way stopcock w hich fr equ entl y gav e
di fficul ties.
T he modif ied ap par atus incor po rated a gl ass effusion pin hol e b ulb
which coul d b e compl etel y evacuatedo A gl as s pinhol e system for eff u
s iome tr y has b een previ ousl y describ ed.20, 21 T he pinh ole for this w or k
91 was obtained by sparking a thin glass bulb with a Tesla coil until a hole
was produced, as evidenced by the bright spark through the glass . After
several unsuccessful attempts to prepare such a pinhole and etch to the
proper size with hydrofluoric acid, it was found that trial and error
sparking gave a pinhole of just the right size .
A diagram of the manifold and effusion system is shown in Figure 1 .
The stopcocks are numbered from 1 to 10 . All except the flask stopcock
are number 2 .? two-way stopcO'cks .. Mercury was contained in reservoirs A,
B, and C . Reservoirs B and C were connected by 10 mm . Pyrex tubing
through a short section of Tygon tubing . This plastic tubing prevented
strains on the two sides of the mercury setup and allowed easy dis
assemblage for cleaning .
All stopcocks, except numbers 1, 8, and l09 were secured with alum
inum fasteners . All stopcocks and the ball and socket j oint were lubri
cated with Apiezon T stopcock grease . Water from a constant temperature
bath was circulated through the j acket which housed the effusion chamber
and mercury reservoir A . The trap between stopcocks 5 and 6 was a U -bend
of capillary tubing ( 8 mm. , o . d . , 2 mm. i . d . ) which was cooled with liquid
nitrogen .
G. Exchange Procedure
The technique for carrying out an exchange reaction was very impor
tant . Evacuations and flushings had to be thorough . All glass apparatus
used with the catalyst had to be very clean . All reaction vessels and
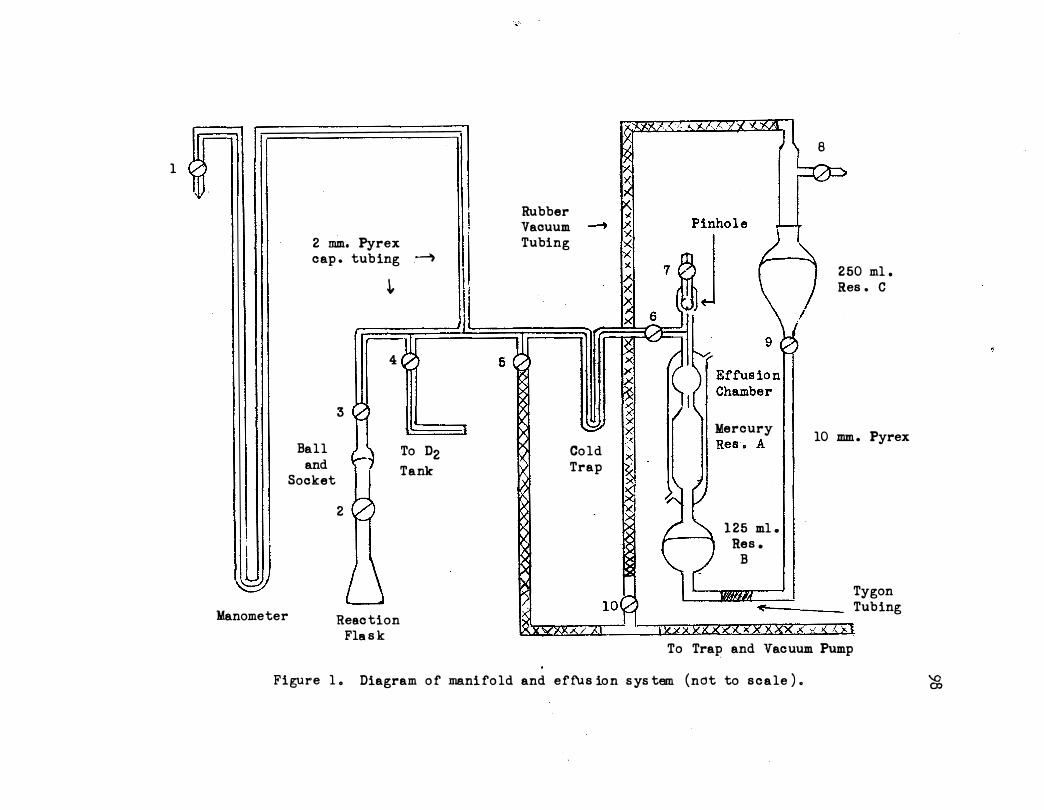
1
Manometer
2 mm. Pyrex cap . tub ing .�
Bal l and
Sooket
�
4
3
A 2
Reac tion Fla s k
w To 02 Tank
i
Rubber Vaouum Tubing
�
� Co ld Trap
�� tr 1 1 Mercury I I 1) ... .. - 4
1 25 ml . Res .
B
8
250 ml . Res . C
10 mm . Pyrex
Tygon Tubing
To Trap and Vacuum Pump
Figure 1 . Diagram o f mani fo ld and effUs io n s ys tem (ndt to s c a le ) . '0 ())
99
glassware used were wiped free of stopcock grease with absorbent tissue
and soaked in ethyl ether . After rinsing in pure ether, cleaning with
nitric acid-sulfUric acid, and rinsing with tap water and distilled
water, the glass was dried in an oven at 130° . The reaction vessels
were steam cleaned immediately before drying in the oven .
Rane,y nickel while wet with methanol was added from a calibrated
glass tube . The tube permitted rough control of the amount of catalyst.
After the reaction was completed, the nickel was collected upon a fritted
tunnel, dried by evacuation with a water pump for one hour, and covered
with an atmosphere of carbon dioxide, using a special filtration system.
Then the funnel was stoppered and weighed .
Solid solutes were weighed in 10-mlo, glass-stoppered flasks and
dissolved with 5 mlo of methanol . Liquid solutes and solvents were pipetted
into a long stem tunnel inserted in the reaction flask .
Unless otherwise specified, 10 ml., of solvent and 799 mm . of
deuterium were used. The exchanges were run at 35 .0 ! 0. 2°, with a shaking
speed of 270 � 10 c .p .m. , and, in most cases, for ten minutes . The pro
cedure for carrying out the exchange and analysis was as follows g
(a) The stopcock on the reaction flask was lubricated with Apiezon
T stopcock grease and assembled while still warm.
(b) The reaction flask was connected to the manifold at the ball
and socket j oint . The contents were frozen using liquid nitrogen.
( c ) The flask stopcock was opened and the flask was evacuated for
two minutes using a Hyvac mechanical pu.mp and a liquid nitrogen trap ..
Stopcocks 6, 9, and 10 must be closed .
100
(d) The flask stopcock and stopcock 3 were closed and the flask
removed from the manifold . The contents were thawed in the constant tem
perature bath at 35° for two minutes .
( e ) The flask was reconnected to the manifold and the contents
were frozen.
(f) Stopcock 3 and the flask stopcock were reopened and the flask
was evacuated for five minutes .
( g ) The flask stopcock and stopcock 3 were closed and the flask
was removed from the manifold . The contents were thawed in the constant
temperature bath at 35° for five minutes .
(h) The flask was reconnected to the manifold. A beaker of water
at 35° was used to maintain the temperature of the flask constant. The
space between the flask and manifold stopcocks was evacuated for two
minutes .
(i ) The deuterium line was opened to the manifold ( stopcock 4) and
evacuated during the above step . The entire manifold was then flushed
with deuterium and evacuated . Flushing and evacuation were repeated twice .
Thereafter, stopcock 4 was left open .
( j ) Stopcock 5 was closed . The manifold was filled with deuterium
to 1000 mm. pressure, the flask stopcock was opened, and the pressure re
adjusted to 1000 mrn .
(k ) The flask stopcock and stopcock 3 were closed . The flask was
removed from the manifold and placed in the shaker bath which was at 35° .
The shaker was turned on and the reaction was run for the desired time .
101
(l) While the exchange reaction was proceeding, the mercur,r level
was brought to the top of the mercury reservoir B by closing stopcock 8,
opening stopcock 6 to the pressure of the system, opening stopcock 10
and finally opening stopcock 9 . The mercury was pulled down until it
reached the top of reservoir B, then stopcock 9 was closed to lock the
mercury at that position . Stopcock 10 was then closed and stopcock 8 was
opened . Stopcock 7 was always closed except during effusions .
(m) At the end of the reaction time the shaker was stopped and
the dried flask immersed in liquid nitrogen to freeze the contents . The
flask was reconnected to the manifold. Evacuation of the entire manifold
system and effusion system was carried out for two minutes . For this
evacuation stopcocks 3, 4, and 6 must be opened and stopcocks 7 and 9 must
be closed. One flushing with deuterium followed by another two-minute
evacuation was made .
(n) The vacuum stopcock was closed and the flask stopcock slowly
opened to admit the gas into the effusion chamber and mercury reservoir A .
Then stopcock 6 was closed and stopcock 9 was opened. This compressed
the gas with the mercury to an arbitrary level below the effusion chamber.
Pressures to allow the exact amount of gas collection were determined and
marked on the two-way manometer .
(o) After five minutes to allow temperature equilibrium, stopcock
7 was opened to allow the gas to effuse through the pinhole . When the
rising mercury reached an arbitrary mark on the capillary tubing just
below the effusion chamber, the stopwatch was started . When the level
reached a mark on the upper capillary tubing, the stopwatch was stopped
102
and stopcock 7 was closed. The time required for the gas to effuse was
measured to the nearest 0.1 second .
(p ) For additional samples of gas, stopcock 8 was closed and
stopcock 10 was opened . Then stopcock 6 was opened so that gas would
be pulled into the effusion s,ystem. The procedure after c ollecting suf
ficient gas was identical with the above . For most runs th;ree or four
samples could be collected .
In case hydrogen is directly liberated, as may happen with active
samples of Raney nickel, one must measure the amount liberated . This was
done for the deuterium-methanol exchange as follows :
(a1 ) The reaction flask was c onnected t o the manifold at the ball
and s ocket j oint . Steps (b) through ( j ) in the preceding description
were repeated .
(b t ) The flask stopcock was closed . The system up to stopcock 6 was evacuated for two minutes � Then stopcoc� 5 was closed and stopcock
2 was opened . This gave a pressure due to 53 ml.. of deuterium at 799 mm .
and 35° expanding into the system. The pre s sure was measured .
( c ' ) With the flask maintained at 35°, deuterium was readmitted
until th� manometer read 1000 rom. (799 mm. of deuterium) � then stopcock 2 was closed and an exchange run carried out in the usual manner.
( d 1 ) After the exchange run, the flask was reconnected and thermo
statted at 35° . After evacuation of the system between stopcocks 2 and 6, stopcock 5 was closed and stopcock 2 was opened . The pre ssure was again
measured . Arry increase , Pg2(1) , from the original measurement with
deuterium was due to directly liberated hydrogen . The actual pre s sure
103
reading for deuterium must be subtracted from atmospheric pressure .
This total pressure was corrected by subtracting the vapor pressure of
the methanol at .35° (101 mm. ) and was designated Pn2 ( i) . See Section 5
under "Calculations" of this chapter .
H. Calculations
1 . Calibration of the Pinhole
The pinhole was calibrated by determining the effusion times for
pure liberated hydrogen and tank deuterium. The rate of effusion of a
gas is inversely proportional to the square root of its molecular weight .
The time of effusion is thus directly proportional to the square root
of the molecular weight . For the effusion times of equal volumes of hy-
drogen and deuterium, one �btains :
Using hydrogen, freshly liberated from acetic acid by sodium, and
tank deuterium, a ratio of 1 . 406 was obtained . This agrees with the ratio
obtained previously using the platinum pinhole .l3a When tank hydrogen
was used, a lower ratio of 1 . 394 was obtained which is probably due to
gases such as nitrogen and oxygen in the tank hydrogen. For all calibra-
tion and exchange runs, the gases were passed through a trap cooled with
liquid nitrogen before effusion.
104
2 . Standardization with Deuterium - ;;..;;.�;.;;;..;;;;;..;;;.;;
By determining the effusion time tor deuterium to one part in 1000
before each run, the effusion time for hydrogen could be calculated using
the experimental ratio of L406 . The variation in effusion times for
deuterium was generally less than 1 per cent from run to run . Room tem-
perature and atmospheric pressure affect the effusion times slightly.
Variation is also due to changes in the condition of the pinhole itself
due to adsorbed substances or temperature effects including hysteresis
of the glas s . Another important factor for obtaining good agreement is
that flushing of the deuterium diaphragm valve must be made in order to
eliminate the air which could enter when the valve pressure goes down
and atmospheric pressure increases . Als o impurities may be picked up
from the rubber tubing connecting the deuterium line to the tank valve .
3. Calculation of Percentage Hydrogen
Using the experimentally obtained effusion times for deuterium (tn2 ) ,
gas mixture ( tx2 ) , and the calculated time for hydrogen ( tH2 ) , the atomic
per cent hydrogen was calculated from the following expression:
to� - tx� % Hydrogen = -----
to� - �� X 100
This follows from Graham' s Law of Effusion.llb See Appendix I . The equa
tion has been verified using known mixtures and the agreement is very good .
When no hydrogen is liberated directly from the catalyst, the percentage
hydrogen is also the percentage exchange .
lOS
4 . Precision and Acc-q.racy
The uncertainty in effusion times was less than ! 0.1 second,
which gave an absolute error of -:!: Oo2 per cent exchange . Thus for 20
per cent exchange, the relative error was ! 1.0 per cent. The relative
error would be more for exchanges of less than 20 per cent.
Accuracy was affected by the calibrati on and by the standardization
effusion runs . Also a slight error was due to the fact that the deuterium
in the stopcock bore of the reaction flask was not utilized in the exchange
reaction. For the second sample the absolute error was very small, but
for the first sample the absolute error was found to be about 1 per cent .
5 . Calculation of Percentage Exchange
When hydrogen is liberated directly from the catalyst, more data are
required for a calculation of percentage exchange . The difference in pres-
sure readings before and after the exchange run is measured. This can be
denoted FH2 (1) • Any increase in pressure must be due to directly liberated
hydrogen. The final pressure reading then will always be the sum of Pn2(i) '
the initial deuterium pressure reading, and PH2 (1) , the increase in pressure .
All readings must be taken for the same volume and temperature .
The expression for calculation of percentage exchange, as derived
in Appendix II, is as follows :
where
% Exchange = 100 - [100 - % H� [ 1 +
2 2 tn2 - tx2 tn� - 11I� (100)
6. Calou.lation ,2! Exchanse Order
106 From exchange results using various pre ssures of deuterium gas,
the order with respect to deuterium gas pressure can be caloulated .
The equation of van 1 t Hoff: 22
log [�]1 - log [�]2
log (B)1 - log (B) 2
where dx/dt, the differential change in concentration with time, is re
placed by t:Jx/t:.t for the initial rate, gives with appropriate substitutions,
the following expression:
log
nn2 =
! Po (% Ex. g . -l min. -1 )] I P0 (% Ex. g . -1 min. -1� L- 1oo 1 - log L· 1oo J2
where nn2 is the order with respect to deuterium gas, P0 is the corrected
initial deuterium pressure, and % Ex. g . -1 min . -1 is the calculated ex
change for the initial part of the reaction.
7 . Calculation 2£ Rate Constants
For an exchange reaction that is zero order with respect to deuterium
pressure, the expression for the rate constant becomes :
k = I112 t
where PH2 is the pressure of hydrogen and t is the time . Using the ex-
change data, the expression become s :
Po . % Ex . g .-1 k1 .0 = -------100 • t
107
where Po is the corrected initial deuterium. pressure and % Ex. g. -1 is
the calculated exchange .found after time, t , .for the given initial
pressure . Tba derivation is given in Appendix III .
CHAPI'ER III
RESULTS AND DISCUSSION
A. Catalyst Weight
The effect of catalyst weight on the exchange reaction of deuterium
gas with liquid methanol was studied using four batches of Raney nickel .
It was found that deaeration of wash liquids for the first three prepara�
tions gave a Raney nickel of rather low activity. A higher activity was
obtained by using untreated wash liquids .
As shown in Figure 2., the catalyst activity declined after pre para·�
tion . It remained fairly constant after three weeks of aging . For the
deaerated catalyst, it is probable that the surface hydrogen was removed
quickly. Also some poisoning probably occurred.
The standard catalyst adopted for this work was based on seven runs
made with catalyst batch 4 after being aged several weeks . By definition
it was taken to be a Raney nickel catalyst which would give an activity
of 7 . 11 per cent exchange per gram per minute, for deuterium· methano1 ex
changes at 35° using 53 ml . of deuterium at 799 mm . and 10 ml . of methanol.
An equilibrium shaking rate is necessary and the per cent exchange must
be linear with catalyst weight . Equilibrium catalyst weights were below
about 0 .35 g . for batch 4 . All runs listed in Table I were made with 10
ml . of methanol at 35° for ten minutes with a shaking rate of 270 � 10
c . p .m. and at a deuterium pressure of 799 mm . Hg . It is apparent that
Raney nickel is a very weak catalyst for the exchange reaction as shown
in Table II .
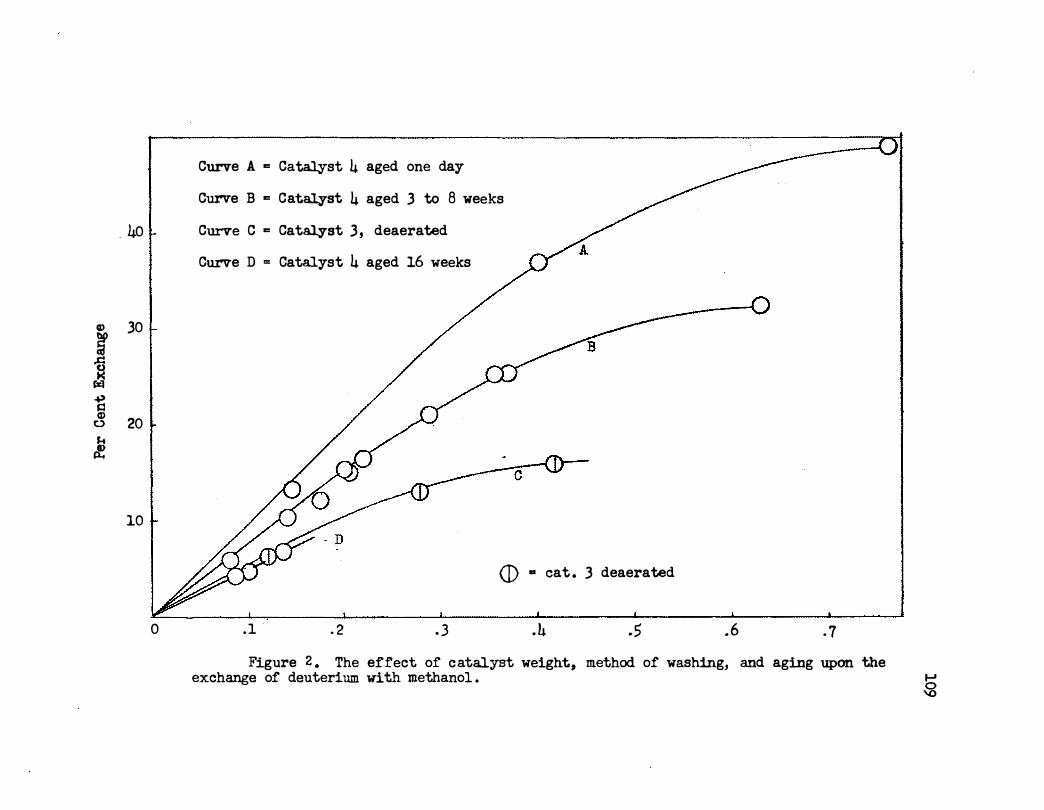
Cl)
� -5 � .. tii 0 Jot £
Curve A = Cat�st 4 aged one day
Curve B = Catalyst 4 aged 3 to 8 weeks
. 40 l Curve C = Catal.yst 3, deaerated
Curve D = Catalyst 4 aged 16 weeks
30
20
10
(D • cat . 3 deaerated
0 .1 . 2 . 3 .4 .5 .6 . 7
Figure 2 . The effect of c atalyst weight., method of washing, and aging upon the exchange of deuterium with methanol . b \0
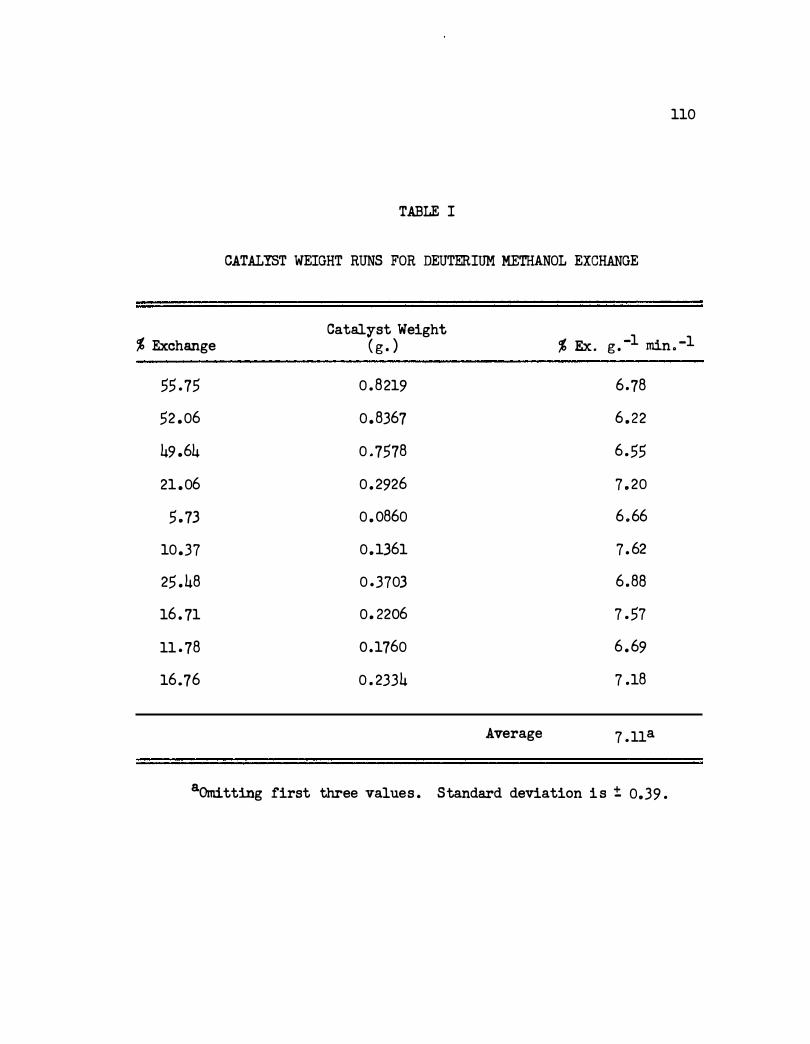
110
TABLE I
CATALYST WEIGHT RUNS FOR DEUTERIUM METHANOL EXCHANGE
% Exchange Catalyst Weight
g . -1 min . -1 ( g . ) % Ex.
55 .75 0 . 8219
52 .06 0 .8367
49 .64 0 . 7578
21 .06 0 . 2926
5 . 73 0 . 0860
10.37 0 .1361
25 .48 0 .3703
16 . 71 0 . 2206
11 . 78 0.1760
16.76 0 . 2334
6 .78
6 . 22
6 .55
7 . 20
6.66
7 . 62
6 .88
7 . 57
6 . 69
7 .18
Average 1 .11a
aomtti.ng first three values . Standard deviation i s ±. 0.39 .
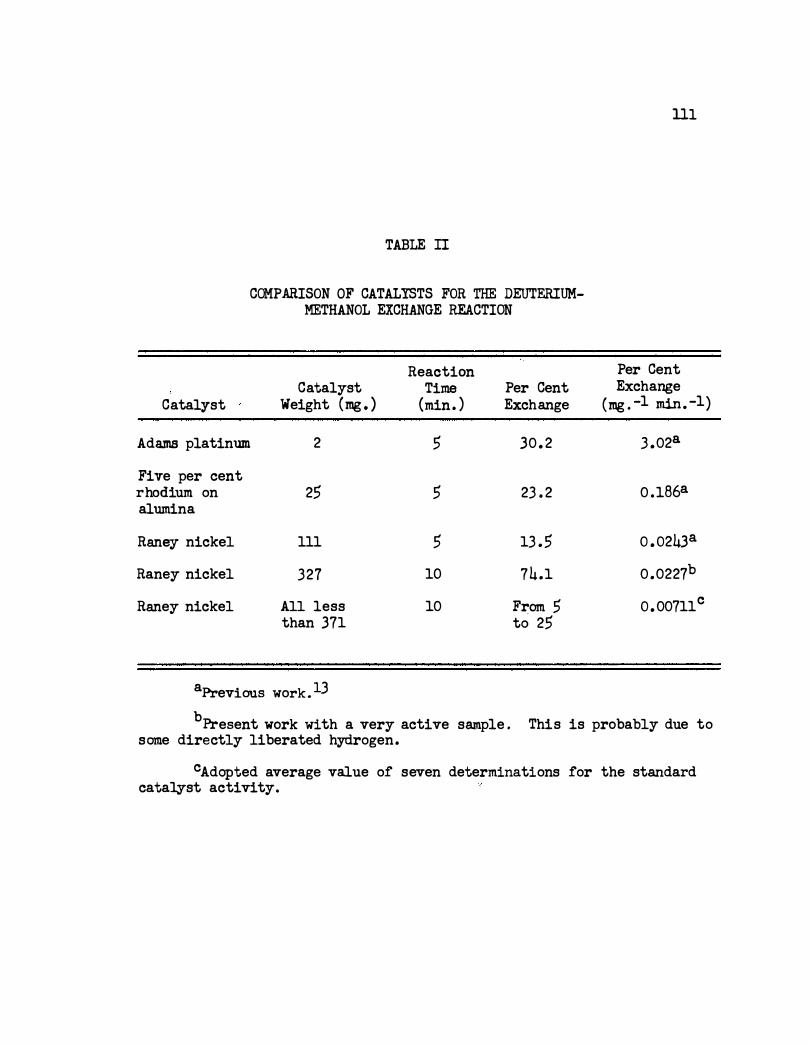
Catalyst
Adams platinum
Five per cent rhodium on alumina
Raney nickel
Raney nickel
Raney nickel
TABLE TI
COMPARISON OF CATALYSTS FOR THE DEUTERIUMMETHANOL EXCHANGE REACTION
Reaction Catalyst Time Per Cent
Weight (mg . ) (min. ) Exchange
2 5 30 . 2
25 5 23 . 2
111 5 13 . 5
327 10 74.1
All less 10 From 5 than 371 to 25
aPrevious work. 13
ill
Per Cent Exchange
(mg . -1 min . -1)
3 .02a
0 . 186a
o . o243a
0 .0227b
o . 00711c
bPresent work with a very active sample . This is probably due to same directly liberated hydrogen.
cAdopted average value of seven determinations for the standard cata�st activity.
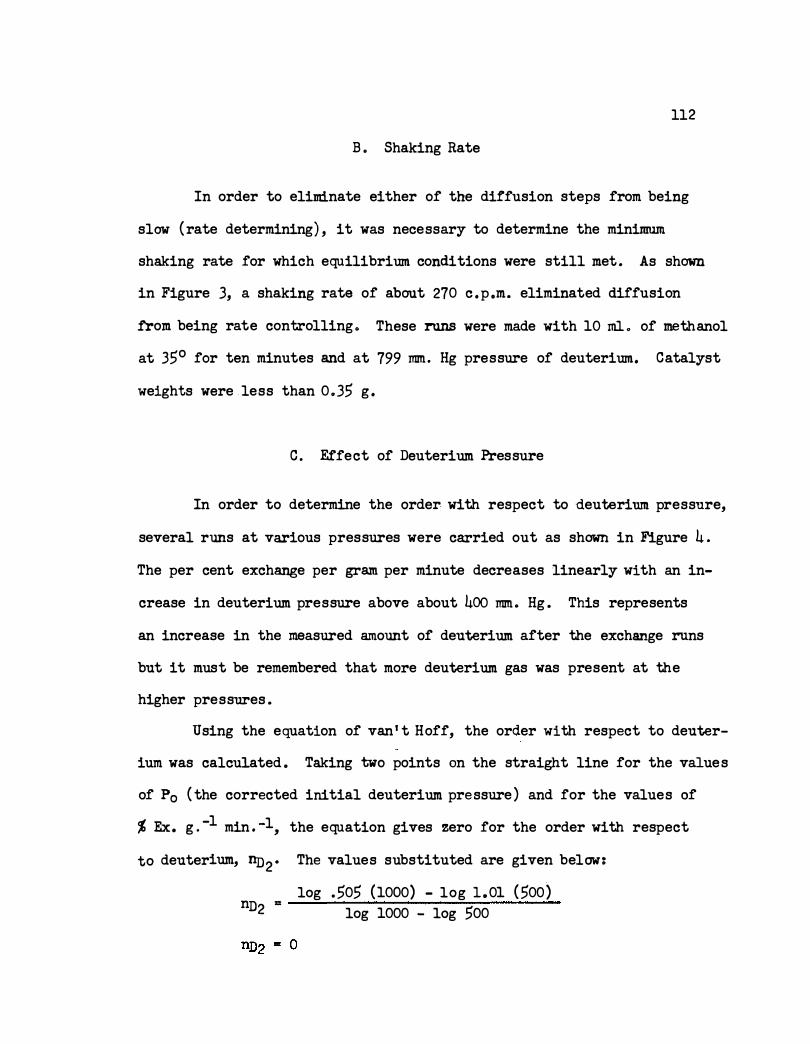
112
B . Shaking Rate
In order to eliminate either of the diffusion steps from being
slow ( rate determining) , it was necessary to determine the minimum
shaking rate for which equilibrium conditions were still met . As shown
in Figure 3, a shaking rate of about 270 c . p .m. eliminated diffusion
from being rate controlling . These runs were made with 10 ml . of methanol
at 35° for ten minutes and at 799 mm . Hg pressure of deuterium. Catalyst
weights were less than 0.35 g .
C . Effect of Deuterium Pressure
In order to determine the order with respect to neuterium pressure,
several runs at various pressures were carried out as shown in Figure 4 .
The per cent exchange per gram per minute decreases linearly with an in-
crease in deuterium pressure above about 400 mm . Hg . This represents
an increase in the measured amount of deuterium after the exchange runs
but it must be remembered that more deuterium gas was present at the
higher pressures .
Using the equation of van' t Hoff, the order with respect to deuter-
ium was calculated . Taking two points on the straight line for the values
of P0 ( the corrected initial deuterium pressure ) and for the values of
% Ex. g . -1 min . -1, the equation gives zero for the order with respect
to deuterium, nn2 • The values substituted are given below:
log . 505 (1000) - log 1.01 ( 500) nn2 = log 1000 - log 500
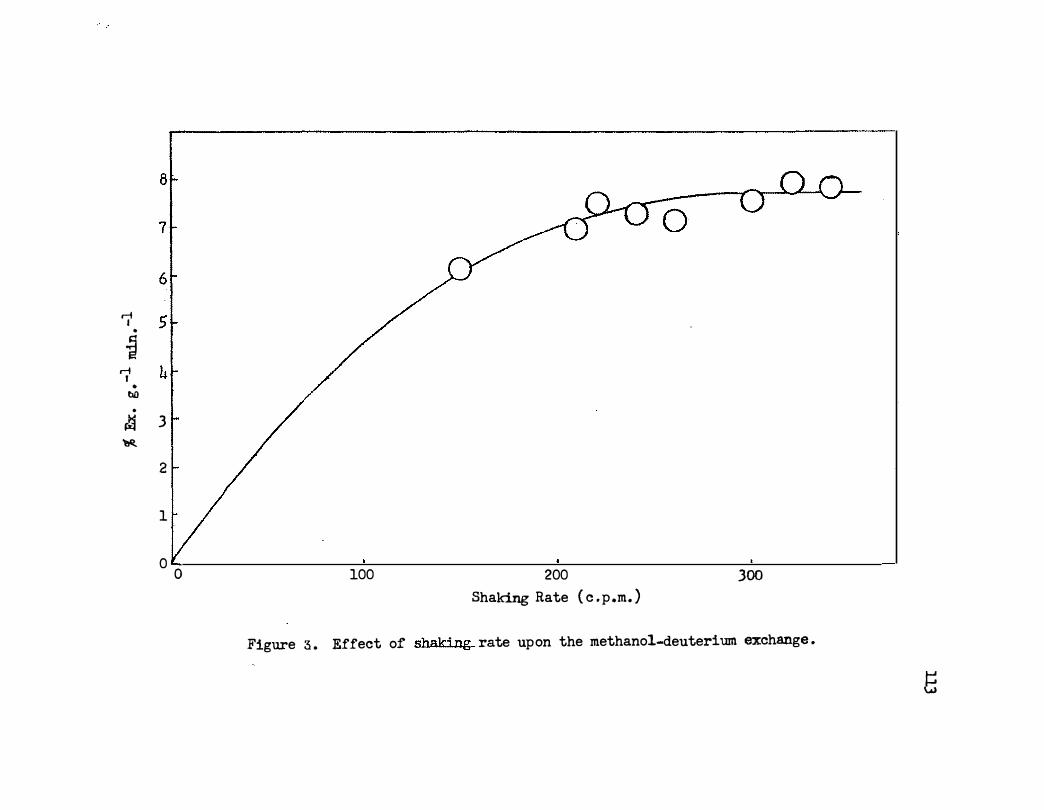
8
1 0
6
r-i 5 I
•
� r-i 4 '
• Ill)
.
M 3
'b't
2
1
0 0 100 200 300
Shaking Rate ( c . p .m. )
Figure 3 . Effect of shaki ng rate upon the methanol-deuterium exchange .
8
0 200 4oo 6oo Boo 1000
Initial. Deu..terium Pressure (mm. Hg) 1200
.... Figure 4 . The effect of initial deuterium pressure upon the methanol-deuterium �
exchange reaction.
-.
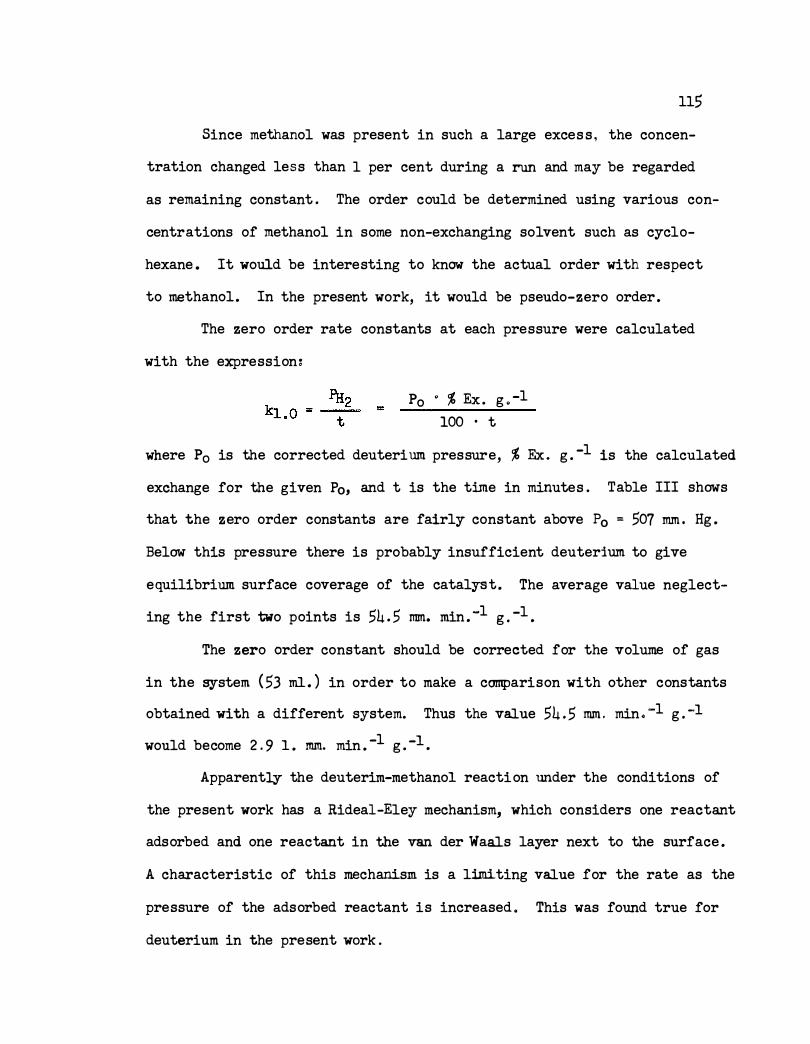
115
Since methanol was present in such a large exces s , the concen-
tration changed less than 1 per cent during a run and may be regarded
as remaining constant . The order could be determined using various con-
centrations of methanol in some non-exchanging solvent such as cyclo-
hexane . It would be interesting to know the actual order with respect
to methanol. In the present work, it would be pseudo-zero order.
The zero order rate constants at each pressure were calculated
with the expression�
Po • % Ex . g . -1
100 . t
where P0 is the corrected deuterium pressure, % Ex . g . -1 is the calculated
exchange for the given P0, and t is the time in minutes . Table III shows
that the zero order constants are fairly constant above P0 = 507 mm . Hg .
Below this pressure there is probably insufficient deuterium to give
equilibrium surface coverage of the catalyst. The average value neglect
ing the first two points is 54 . 5 mm. min . -1 g . -1 .
The zero order constant should be corrected for the volume of gas
in the system ( 53 ml . ) in order to make a comparison with other constants
obtained with a different system. Thus the value 54 . 5 mm . min . -1 g . -1
would become 2 . 9 1 . mm. min . -1 g . -1 .
Apparent� the deuterim-methano1 reaction under the conditions of
the present work has a Rideal-Eley mechanism, which considers one reactant
adsorbed and one reactant in the van der Waals layer next to the surface .
A characteristic of this mechanism is a limiting value for the rate as the
pressure of the adsorbed reactant is increased . This was found true for
deuterium in the present work .
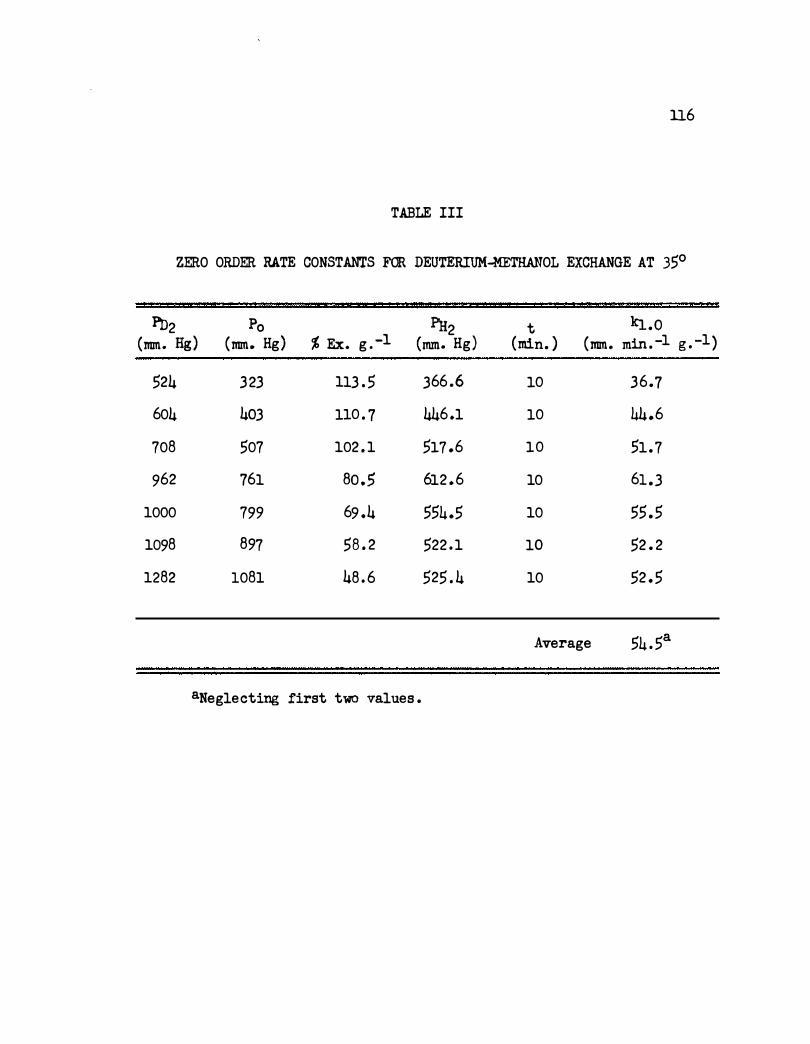
U6
TABLE III
ZERO ORDER RATE CONSTANTS FOR DEUTERIUM-METHANOL EXCHANGE AT 35°
Pn2 Po PH2 (mm. Hg) (mm. Hg) % Ex. g . -1 (mm. Hg )
524 323 113 . 5 366 .6
604 403 110 . 7 446.1
708 507 102 . 1 517 .6
962 761 8oS 612 .6
1000 799 69 .4 554.5
1098 897 58 . 2 522 . 1
1282 1081 48 . 6 525 . 4
aNegle cting first two values .
t kJ..o (min. ) (mm. min . -1 g . -1)
10 36.7
10 44.6
10 51. 7
10 61.3
10 55 .5
10 52 . 2
10 52 . 5
Average 54 . 5a
117
Zero order dependency of the deuterium pressure indicates strong
adsorption of deuterium. The mechanism could be represented as follows �
I I D2 + -M-M- � � -M-M-
I I -*-*- + CHJOH _......,.) -M-M- + HD + CH JOD
It might be of interest to measure the actual surface coverage to
determine if the entire surface is saturated with deuterium and hydrogen.
D . Effect of Time
As shown in Appendix III, the zero order expression for the exchange
reaction predicts a straight line when P0 - PH2 is plotted versus reaction
time . P0 is the corrected deuterium pressure and P0 is the pressure .
P.H:2 is given by g
FH - % Ex. g . -1 Po 2 - 100
Figure 5 shows that the plot is linear for the exchange to 42 per
cent reaction. The points represent individual runs for the given times .
A single run cannot be followed since the gases are lost upon analysis .
E . Effect of Temperature
Runs were made at four temperatures to determine the apparent
activation energy. The rate constants for these temperature are given
in Table IV . A plot of log k1 . o versus 1/T is shown in Figure 6 . The
activation energy is 3 . 47 kcal ./mole which seems low compared to 5 . 5 kcal ./
mole for the deuterium-methanol exchange over Adams platinum.l3e With
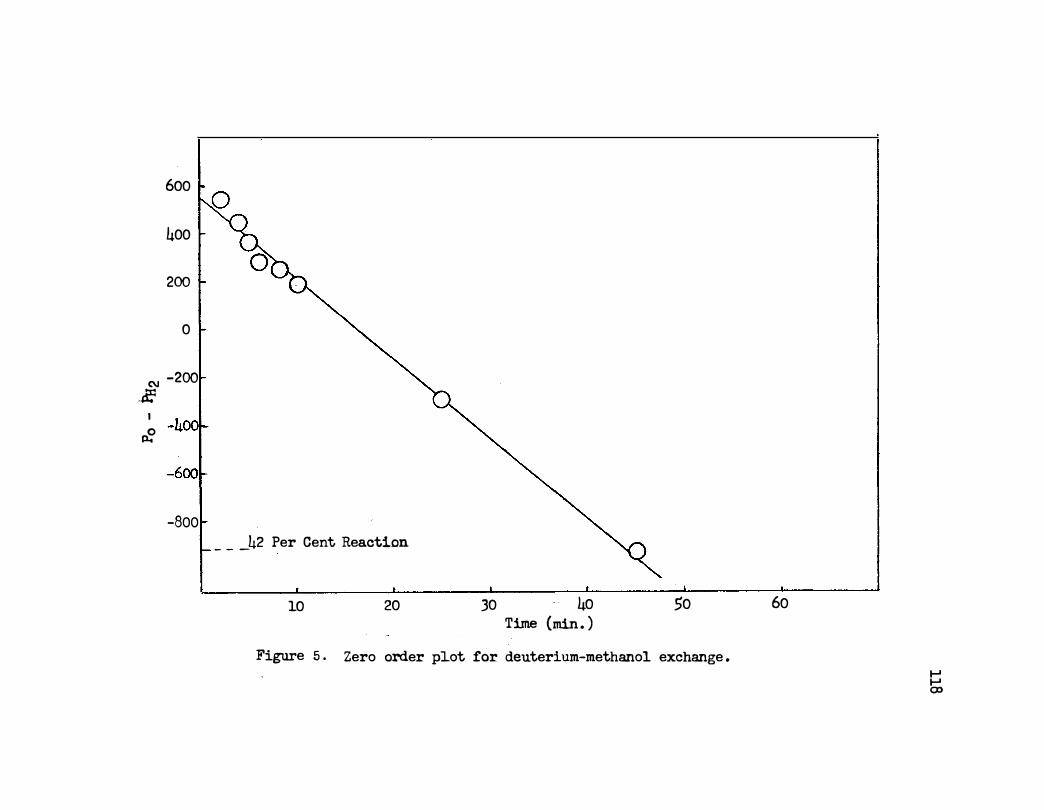
600
4oo I .
200
0
C\1 -200 -�
I
re
-800
a
_ _ _ 42 Per Cent Reaction
10 20 30 40 Time (min. )
50
Figure 5 . Zero order plot for deuterium-methanol exchange .
60
I-' I-' CD
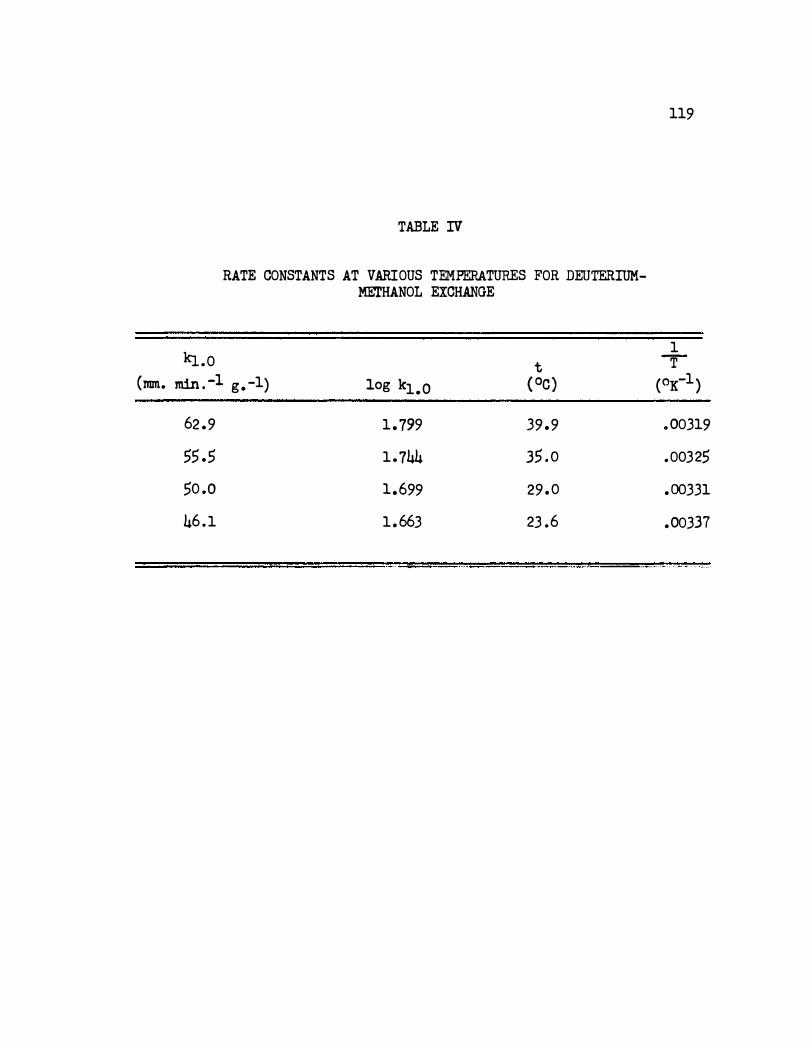
kJ..o
TABLE IV
RATE CONSTANTS AT VARIOUS TEMPERATURES FOR DEUTERIUMMETHANOL EXCHANGE
t (mm. min . -1 g. -1) log k1•0
( Oc)
62 .9 1 . 799 39 .9
55 .5 1 . 744 35 . 0
50 .0 1.699 29 . 0
46 . 1 1 . 663 23 .6
119
1 T
(OK-1)
. 00319
.00325
. 00331
.00337
·- --�-�-.,�·-.---... �--a:.,, -··•••�• •••· c -"� ' "'" •
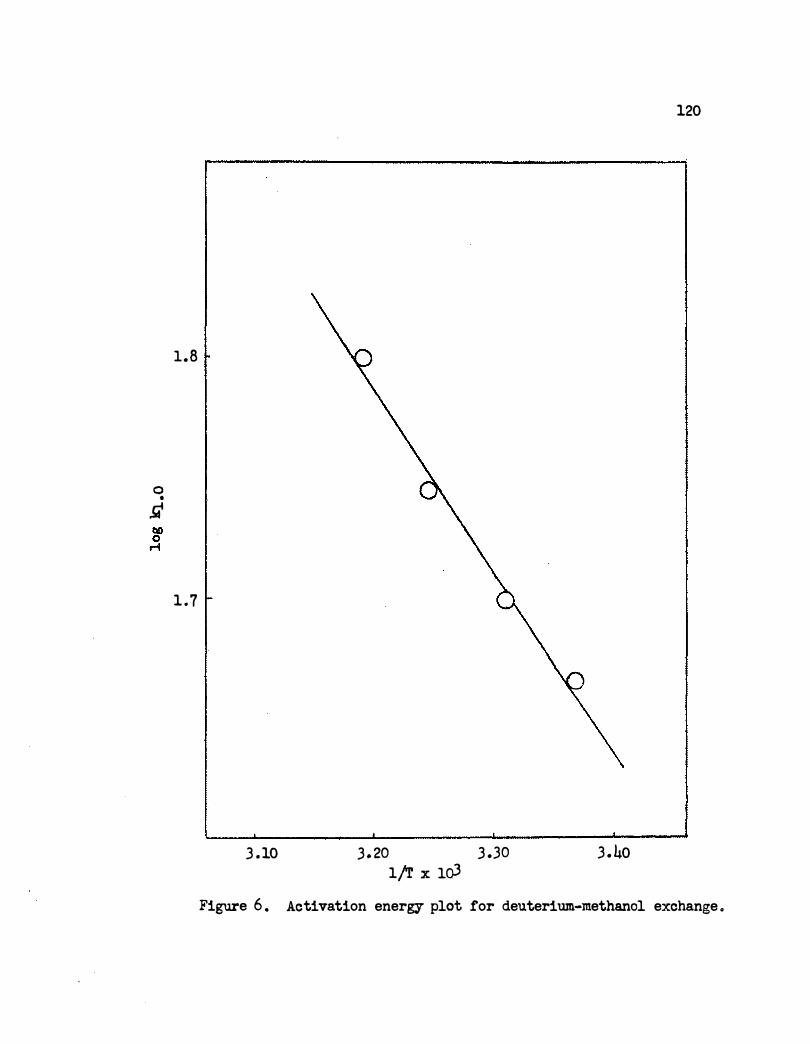
1.8
0 •
Ji
1.7
3 .10 3 .20 3 .30 1/T X lo3
120
3 . 40
Figure 6 . Activation energy plot for deuterium-methanol exchange .
121
platinum, however, there was a considerable scattering of the points
and the value may be too high.
F . Effect of Nitro Compounds
Various concentrations of nitramesitylene, nitroethane, �
nitrostyrene, nitrobenzene, and 2-nitro-1-butene were used to determine
their effect upon the deuterium-methanol exchange . The reactions were
run for ten minutes at 35 . 0°C, with an initial deuterium pressure of 799
mm. Catalyst weights were generally less than 0 .35 g . The data are
given in Tables V and VI . Plots are given in Figures 7 and 8.
All of the nitro compounds decreased the exchange at low concen-
trations . This effect was noted also using Adams platinum for the deuter
ium-methanol exchange .l3f The relative order of the effect is the same
as for the platinum results .
The kinetics of catalytic hydrogenation of the nitro compounds in
ethanol over Raney nickel are zero order in acceptor, indicating strong
adsorption of the nitro compounds on the catalyst .6b, 6c It is expected
that the same kinetic results would be obtained using methanol solvent
with possibly a shift in the rates of hydrogenation for all compounds .
The exchange results also indicate strong adsorption of all acceptors
except for nitramesitylene .
Of interest is the fact that with nitromesitylene an exchange value
almost equal to that with pure methanol was _ obtained . There was no significant
decrease for concentrations as great as 0 . 27 moles per liter . Some early
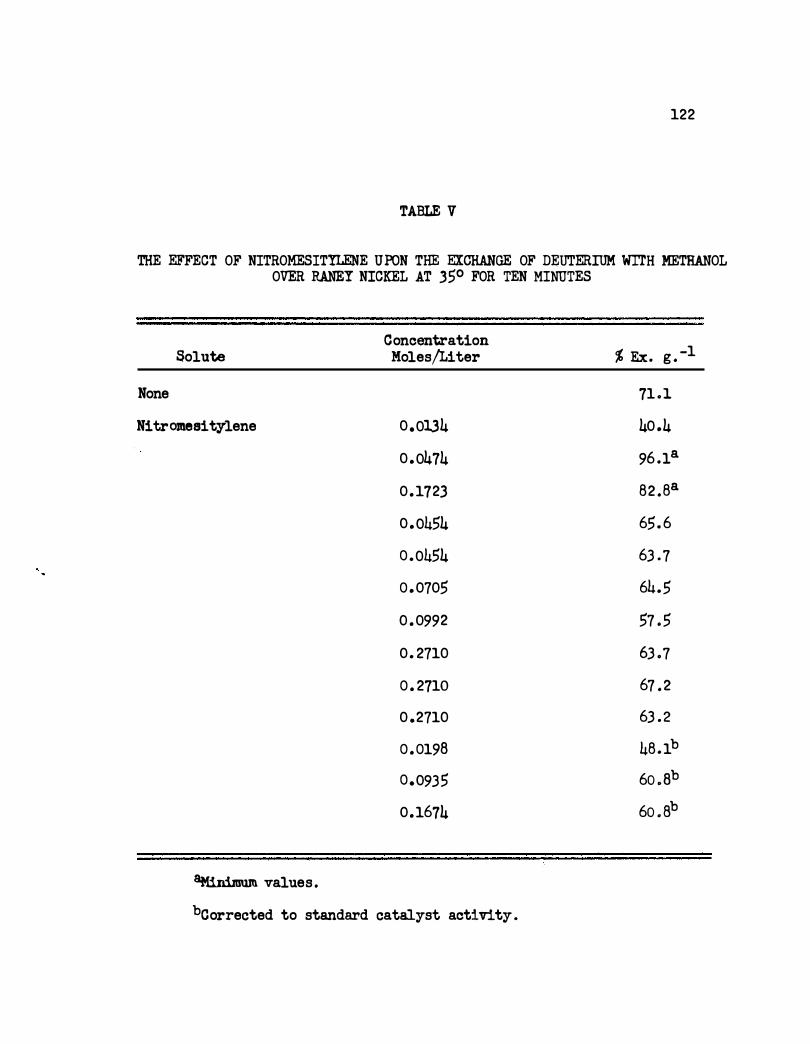
122
TABLE V
THE EFFECT OF NITROMESITYLENE UPON THE EXCHANGE OF DEUTERIUM WITH METHANOL OVER RANEY NICKEL AT 35° FOR TEN MINUTES
Concentration % Ex. g . -1 Solute Moles/Liter
None 71 .1
Ni tromesi tylene 0.01.34 40 .4
0 .0474 96 .la
0.1723 82 .8a
0.0454 65. 6
0 .0454 63 . 7
0 . 0705 64.5
0 . 0992 57 . 5
0. 2710 63 .7
0 . 2710 67 . 2
0 .2710 63 . 2
0 . 0198 48 . 1b
0.0935 6o . Bb
0.1674 6o . ab
8Minimum values .
bcorrected to standard catalyst activity .
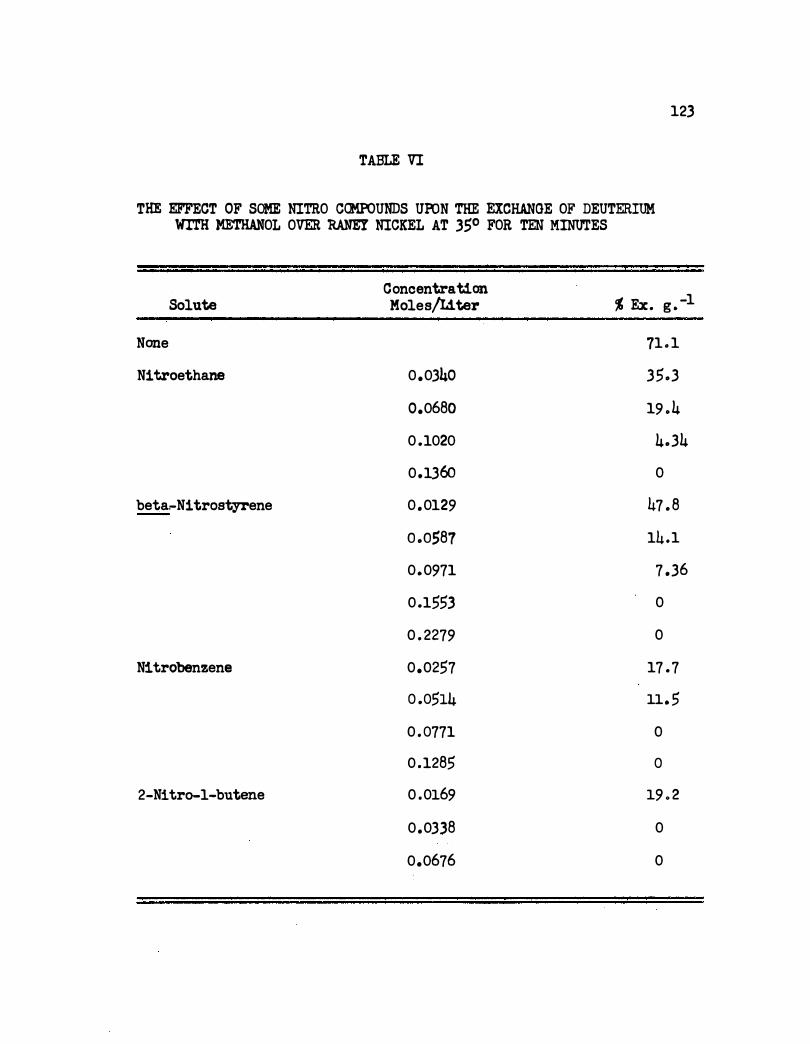
123
TABLE VI
THE EFFECT OF SOME NITRO CCMPOUNDS UPON THE EXCHANGE OF DEUTERIUM WITH METHANOL OVER RANEY NICKEL AT 35° FOR TEN MINUTES
Concentration % Ex. g . -1 Solute Moles/Liter
None 71 . 1
Nitroethane 0.0340 35.3
0.0680 19 .4
0 .1020 4.34
0.1360 0
beta�Nitrostyrene 0 .0129 47 . 8
o .oS87 14.1
0.0971 7 .36
0.1553 0
0 . 2279 0
Nitrobenzene 0.0257 17 . 7
0 .0514 11. 5
0 . 0771 0
0 .1285 0
2-Nitro-1-butene 0 .0169 19 . 2
0.0338 0
0.0676 0
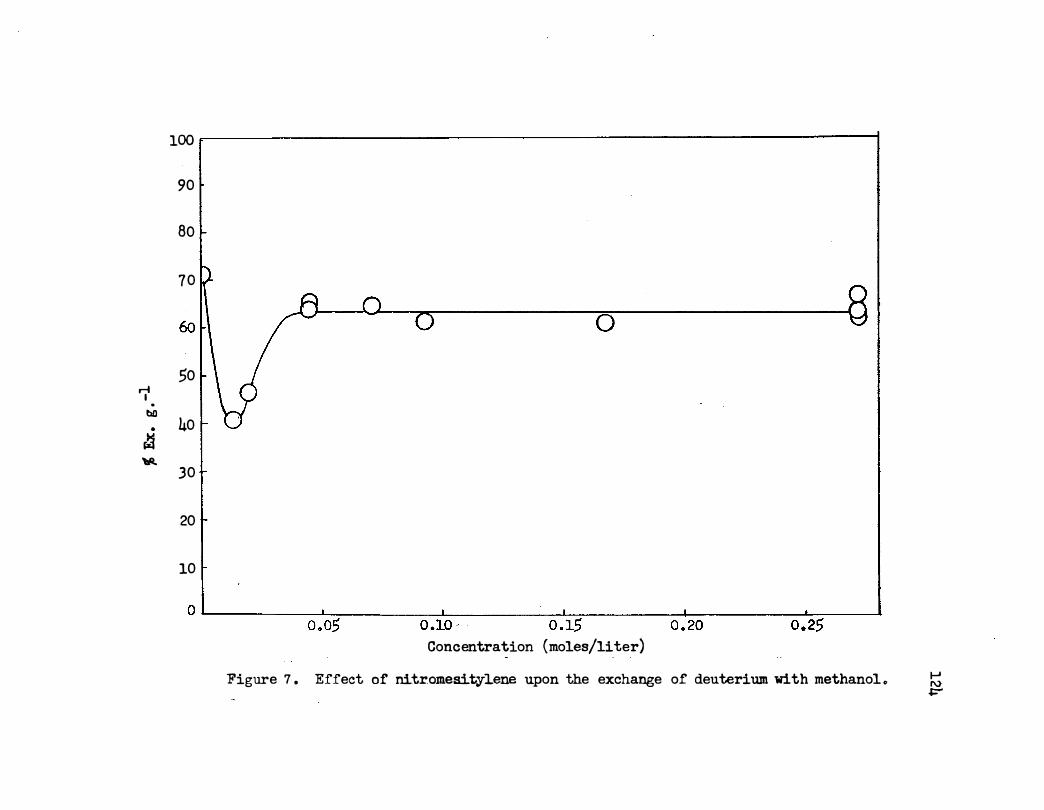
7 .
bO •
� 'Wl
100
90
80
70
0
so
40
30
20
10
0 �--------��--------L----------L�--------�--------��--� o .os 0 .10 � 0 . 15 0 . 20 0 . 25
Concentration (moles/liter)
Figure 7 . Effect of nitromesityLene upon the exchange of deuterium with methanol ., 1-' 1'1.> �
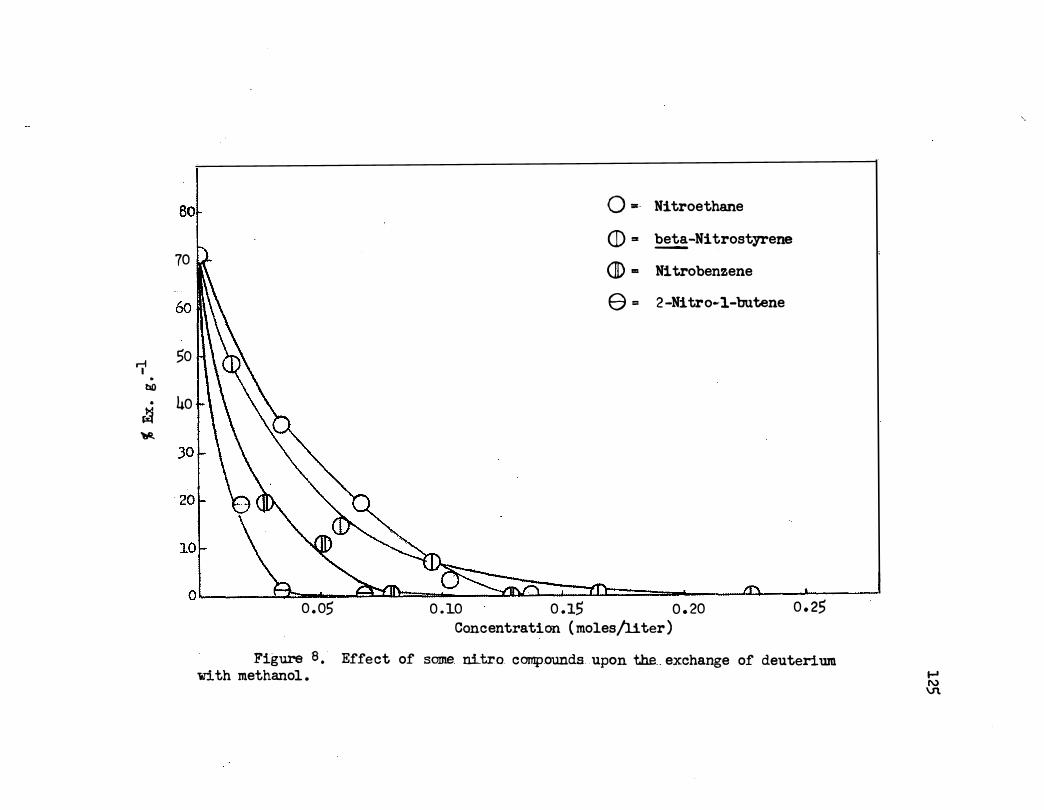
... .
bO .
� Wl
sor 0 =· Nitroethane
CD = beta-Nitrostyrene 70 IJ.
-
(]!) - Nitrobenzene
60�\\\ 8 = 2-Nitro..-l-butene
50
40
o l a I � �� I :tD- I IT) ' I 0 . 05 0.10 0 .15 0 . 20 0 . 25
Concentration ( moles/liter)
Figure a . Effect of some nitro. compounds upon the exchange of deuterium w1 th methanol . � 1\,) V\
'·
126
runs with ni tromesi tylene and one with �-ni trostyrene gave much higher
apparent exchanges . The calculated exchanges for two runs with nitro
mesitylene were much greater than for methanol alone . Less active cata�
lyst samples did not give this effect. When these high exchange runs were
carried out, a great evolution of gas was observed during the freezing and
thawing steps . Thus it was concluded that, in those cases at least, the
values for exchange higher than solvent alone were due to directly liber
ated hydrogen . This may be a special e.f,'fect with very active catalyst
brought about by nitramesitylene which is we� adsorbed above a con
centration of 0.04 moles per liter . A possibility that has not been pre
viously suggested is that freezing and thawing of the mixtures containing
these solutes tends to pulveriz� the catalyst due to expansion-contraction
when the s olute was precipitated and dissolved . Either greater activity
due to smaller catalyst particles or occluded hydrogen freed directly
from the interior or some particles could account for this increase in
per cent hydrogen.
Even though it was observed only with nitromesitylene and beta
nitrostyrene , it might have been due to hyperactive portions of the cata
lyst, randomly sampled . Variation of catalyst activity from sample to
sample was a great source of difficulty with all exchange runs.
Such increased exchange effects for the deuterium-acetic acid system
using supported rhodium catalyst have been previously attributed to inter
mediates which might have active hydrogens to participate in the exchange
reactions .l3g
127
One normal exchange run was tested for liberation of hydrogen by
the method previously described. Within experimental error, no hydrogen
was liberated. A method of magnifying the pressure change and controlling
ver,y precisely the temperature of the apparatus might have shown a slight
contribution due to direct�y liberated hydrogen. When the liberation is
very great the present method will work very well.
G . Exchange of Heavy Methanol
Experiments were made to establish that the hydroxyl hydrogen of
ordinary methanol was actually involved for the exchange reactions . For
a single exchange run, less than 1 per cent of the methanol would be
deuterated am thus an analysis of the methanol would be rather diffiCUlt.
An exchange run using 10 ml. of heavy methanol (CHJOD) and 53 ml.
of deuterium at 799 mm . for ten minute s and at 35° gave no exchange . This
is direct evidence that the hydrogen originates neither from the catalyst
nor from the hydrogen attached to the carbon of methanol .
Another run was carried out using 10 ml . of heavy methanol ( CH30D)
and 53 ml. of hydrogen at 799 mm. for ten minutes and at 35° . The ex
change ( 9 .99 % Ex. g . -1 min. -1) was comparable to that obtained (7 .11
% Ex . g . -l min . -1) using ordinary methanol with deuterium.
To insure that the tank hydrogen did not contain sufficient oxygen
or other impurities to affect the effusion time of the exchange mixture,
two runs were made using 10 ml . of' ordinary methanol and 53 ml . of hydro
gen at 799 mm. f'or ten minutes and at 35° . Both r'lms gave essentially
128
the same result . No significant impurities were present in the gas mix
tures as shown by effusiometry analysi s . Both samples· eontained hydrogen
which effused with the same rate as tank hydrogen . The ratio of effusion
times for deuterium and tank hydrogen was 1 .394 which agreed exactly with
some earlier calibrations . The ratio of effusion times for deuterium and
sample hydrogen was 1 .393 for one run, and 1.394 for an other . Thus , it
was concluded that the calculated exchange of hydrogen with heavy methanol
was a good value . Also it was concluded that the hydroxyl hydrogen of
methanol is involved in the exchange reaction with deuterium.
CHAP!'ER IV
SUMMARY
An improved effusiometry apparatus for ,analyzing hydrogen and
deuterium mixtures was constructed and utilized to s tudy the exchange
reaction of deuterium with methanol over Raney nickel catalyst .
The exchange reaction was zero order with respect to deuterium
pressure and pseudo-zero order with respect to methanol concentration .
The apparent activation energy was found to be 3 .5 kcal ./mole . The Rpe
cific reaction rate constant was 2 . 9 1. mm . min . -1 g . -1 .
The effects of nitro compounds upon the exchange of deuterium with
methanol over Raney nickel were studied . All of the compounds decreased
the exchange at very low concentrations and all, except nitromesitylene ,
prevented the exchange at higher concentrations . Except for nitrome sity
lene, the effects paralleled the kinetics of catalytic hydrogenati on of
these nitro compounds under similar conditions .
Since Raney nickel can liberate hydrogen directly, a method for
determining per cent exchange in its presence was developed . It was shown
that the exchanged hydrogen did originate from the hydroxyl hydrogen of
methanol .

BIBLIOGRAPHY
BIBLIOGRAPHY
1. I . Langmuir, �· Faradal Soc . , g, 621 (1921) .
2 . c . N. Hinshelwood, ttThe Kinetics of Chemical Change, " Oxford University Press, New York, N. Y. , 1940, p . 187 .
3 . E . K . Rideal, �· Cambridge �· Soc . , 35, 130 (1939 ) .
4. D . D . Eley, Quart. Rev. (London) , 3, 213 (1949) . - - -
5 . K. J . Laidler in P . H . Emmett, "Catalysis, " Vol . I, Reinhold Publishing Corp . , New York, N. Y. , 1954 . Ref . a, p . 90; b, p . 93 .
6 . W. c . Bedoit, "Kinetics of Catalytic Hydrogenation of the Nitq.:o_ Group on Adams Platinum and Raney Nickel Catalysts, u Doctoral Dissertation, University of Tennessee, Knoxville, Tennessee, 1950 . Ref . a, p . 120; b, p . 135; c, p . 152 .
1 . W . C . Bedoit and H . A . Smith, i· Phys . � Colloid �., 55, 1085 (1951 ) .
8 . H . A . Smith and W. C . Bedoit in P . H . Emmett, "Catalysis, " Vol . III, Reinhold Publishing Corp . , New York, N. Y. , 1955, pp . 149-170 .
9 . M . R . Stevinson and c . s . Hamilton, J . Am. Cnem. Soc . , 57, 1298 (1935) . . - - - - -
10 . K. Johnson and E . F . Degering, ibid. , 61, 3194 (1939) • . - -
11 . L . E. Line, ttPart A: The Dipole Moments of the 1, 2-Dibromopropenes . Part B: Studies of Catalytic Hydrogenation and Exchange Using Deuterium Gas, '' Doctoral Dissertation, University of Tennessee, Knoxville, Tennessee, 1951 . Ref. a, p . 135; b, p . 202 .
12 . E . L . McDaniel, "The Effects of Certain Nitro and Related Compounds Upon the Rate of Exchange of Deuterium Gas with Acetic Acid over Adams Platinum Catalyst, tt Master ' s Thesis, University of Tennessee, Knoxville, Tennessee, 195g . Ref. a, p . 34.
13 . E . L-� McDaniel, "Catalytic Reactions Involving Deuterium, Hydrogenation Solvents, and Nitro Compounds, " Doctoral Dissertation, University of Tennessee, Knoxville, Tennessee, 1956 • . Ref . a, p . 44; b, p . 99 ; c, p . 82 ; d, p . 57; e , p . 66 ; f, p . 7 2; g, p . 87 .
14. A. Farkas and L . Farkas, Trans . Faradal Soc . , 33, 678 (1937) .
15. J . R . Anderson and C . Kemball, Trans . Faradal Soc . , 51, 966 ( 1955) .
16 . W. C . Bedoit, ttStudies of Raney Nickel Catalysts, " Master ' s Thesis, University of Tennessee, 1948, Appendix .
132
17 . G . Dupont and P . Piganiol, BulL �· � . , §., 322 (1939) .
18 . R . Schroter, Angew. chem. , 54, 229 (1941) .
19 . H . Kwart, L . P. Kuhn, and E . L . Bannister, J . Am. Chern. Soc . , 76, 5998-6001 (1954) .
- --
20 . Atomic Energy Commission Research Development Report, O .R .N.L. -2997, Series A, July 13, 1956 {Declassified) .
21. D . A . Lee, �· Chern. , 30, 1296 (1958) .
22 . A . A . Frost and R . G . Pearson, nKinetics and Mechanism.,\) 11 John Wiley and Sons, Inc . , New York, N . Y. , 1953, p . 44.

APPENDICES
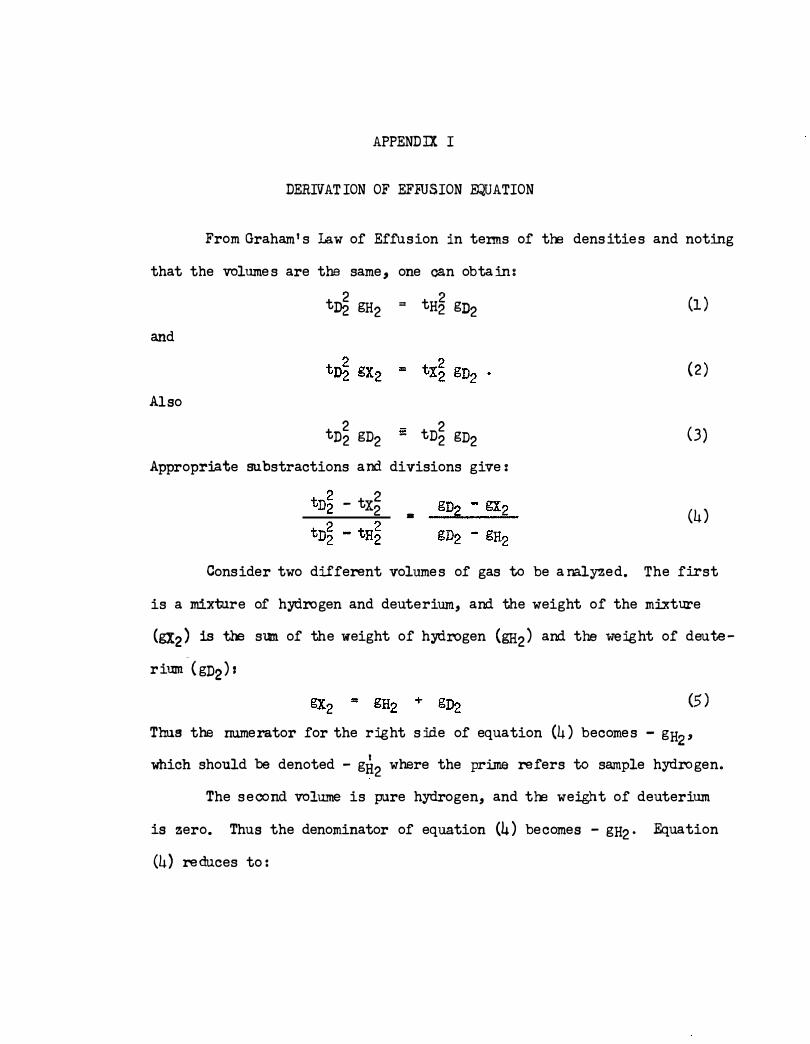
APPENDIX I
DERIVAT ION OF EFFUSION EQUATION
From Graham' s Law of Effusion in terms of tm dens itie s and noting
that the volume s are the same , one can obta in:
and
Also
t� gH2 = tH� gD2
2 2 tn2 gn2 - tn2 gn2
(1 )
{2 )
(3)
Appropriate substractions and divisions give :
- tx� - (4)
Consider two different volume s of gas to be a nalyzed. The first
is a mixture of h;ytlrogen and deuterium, and the weight of the mixture
(gx2 ) is tm sum of the weight of h;ytlrogen (ga2) and the weight of deute
rium { gn2) :
(5 )
Thus the numerator for the right s :ide of equation (4 ) become s - gH2 ,
which should be denoted - gfl:2 where the prime refers to sample hydrogen.
The second volume is pure hydrogen, and tm weight of deuterium
is zero. Thus the denominator of equation (4 ) becomes - gH2 · Equation
(4) reduces to :
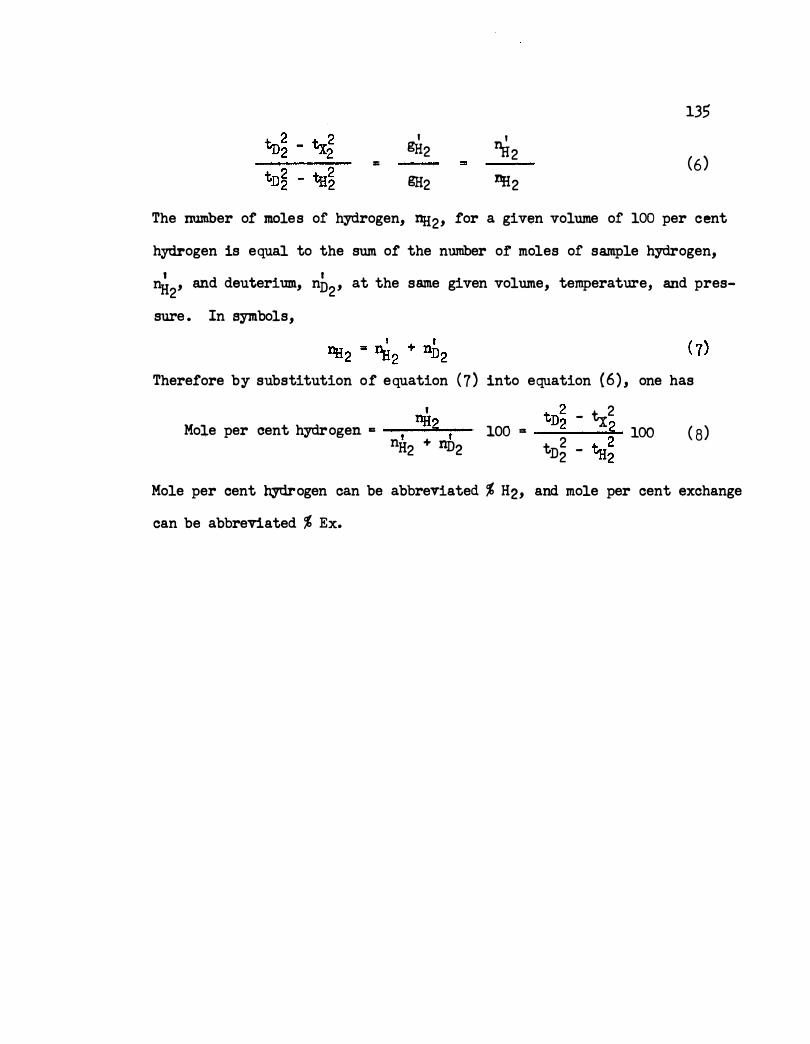
135 I I
.. �2 !Ji2
( 6) mi2 Dfi2
The number of moles of hydrogen, �2, for a giv�n volume of 100 per cent
hydrogen is equal to the sum of the number of moles of sample hydrogen, I I nH2
, and deuterium, nn2, at the same given volume, temperature, and pres-
sure . In symbols,
Therefore by substitution of equation ( 7 ) into equation {6) , one has
'
Mole per cent hydrogen .. -1-rlH...,.2-,-nH2 + nn2
tn� - tx2 100 = _..;;._-�2!'- 100
t 2 - +-22
:02 -li
( 8)
Mole per cent hydrogen can be abbreviated % H2, and mole per cent �xchange
can be abbreviated % Ex.
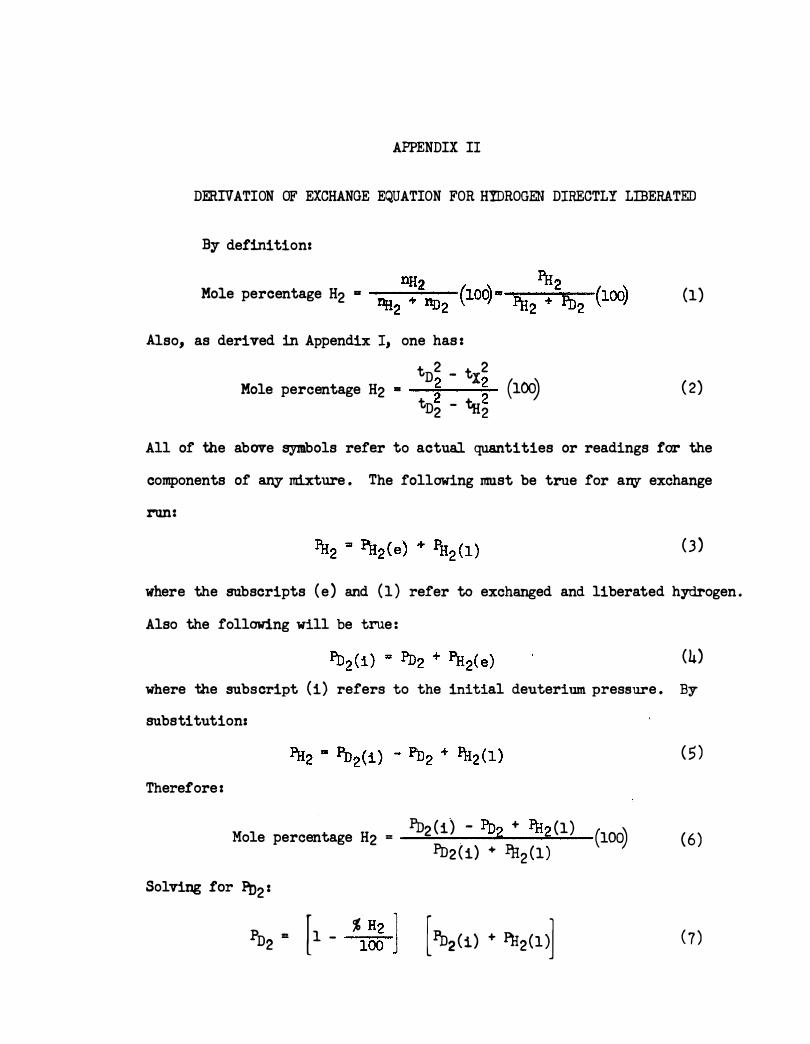
APPENDIX II
DERIVATION OF EXCHANGE EQUATION FOR HYDROGEN DIRECTLY LIBERATED
By definition:
Mole percentage H2 =
Also, as derived in Appendix I, one has :
tD2 - tx
2 Mole percentage H2 • � � (100)
tD2 - 1112
(1)
( 2)
All of the above s,ymbols refer to actual quantities or readings far the
components of any mixture . The following must be true for any exchange
run:
( 3 )
where the subscripts ( e ) and (1 ) refer to exchanged and liberated hydrogen .
Also the following will be true :
(4)
where the subscript (i) refers to the initial deuterium pressure . By
substi tutionr
Therefore :
Mole percentage H2 =
Pn2 (i) - Pn2 + FH2 (1) Pn2 ( i) + %2(1)
Solving for Po2 :
Pn2 • [ 1 - % 1� l [ l'n2(1) + i'H2(1 >]
( 5 )
(100) (6)
( 7 )
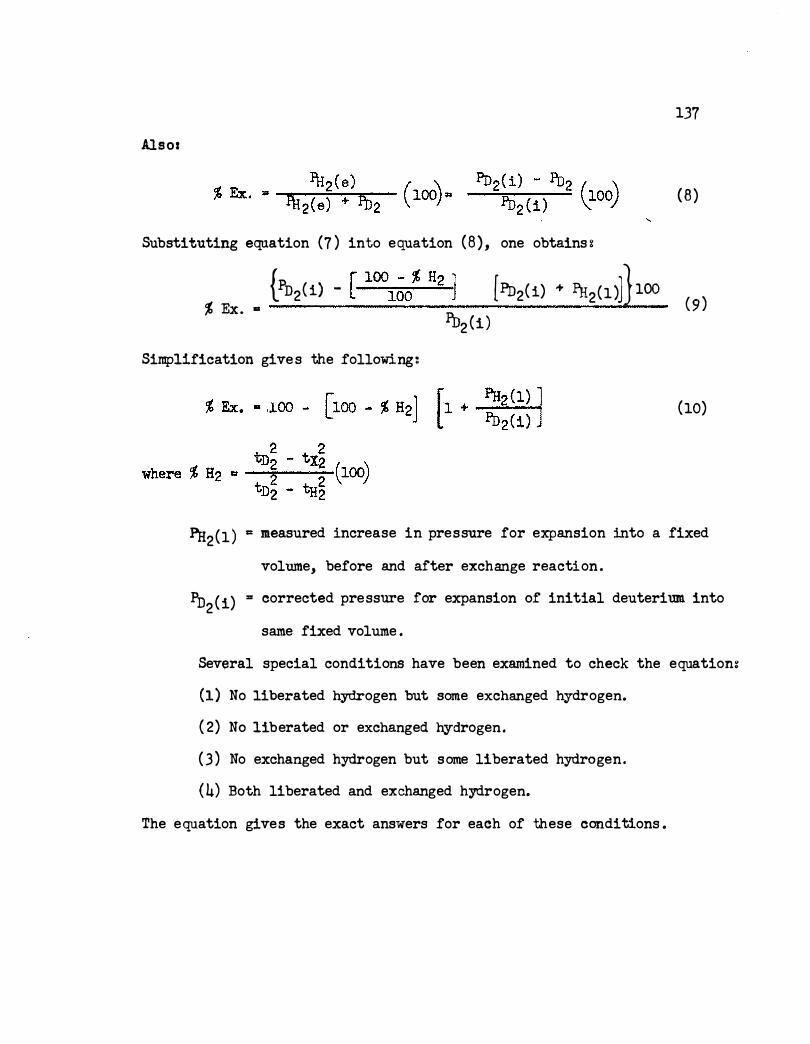
137
Alsos
( 8 )
Substituting equation (7 ) into equation ( 8 ) , one obtains g
{!b2( i) - [ 1001�
% "2 ] [Pn2( i) + l'Ji2(1)J} 1oo % Ex . •
( 9 ) P.o2 (i )
Simplification gives the following:
(10)
Pa2(1 ) • measured increase in pressure for expansion into a fixed
volume, before and after exchange reaction .
Pn2 (i) = corrected pressure for expansion or initial deuterium into
same fixed volume .
Several special condi tiona have been examined to check the equatiom
(1) No liberated hydrogen but some exchanged hydrogen.
( 2) No liberated or exchanged hydrogen.
( 3 ) No exchanged hydrogen but some liberated hydrogen.
(4) Both liberated and exchanged hydrogen.
The equation gives the exact answers for each of these conditions .
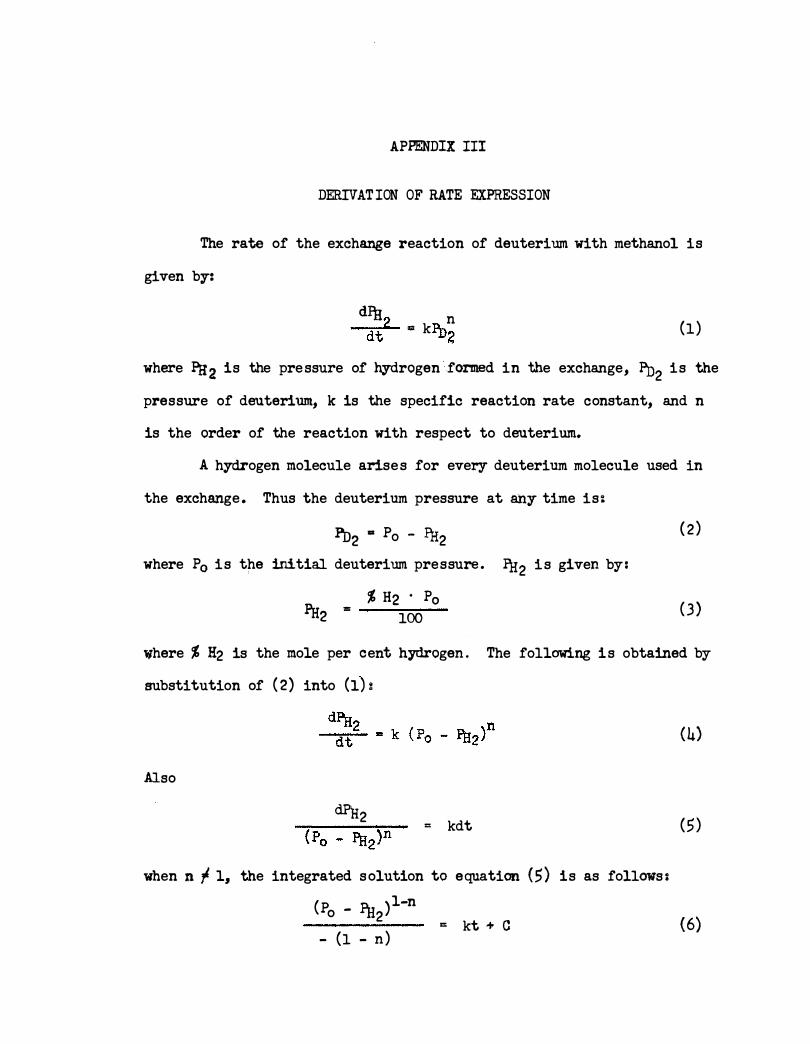
APPENDIX III
DERIVAT ION OF RATE EXPRESSION
The rate of the exchange reaction of deuterium with methanol is
given by-:
dPg n --::--:-"2_ "' k ll... dt · .u2 (1)
where Pa2 is the pressure of hydrogen formed in the exchange, Pn2 is the
pressure of deuterium, k is the specific reaction rate constant, and n
is the order of the reaction with respect to deuterium.
A hydrogen molecule arises for every- deuterium molecule used in
the exchange. Thus the deuterium pressure at any- time is:
Pb2 • Po - Pg2 ( 2 )
where P0 is the initial deuterium pressure. Pg2 is given by:
% H2 ' Po (3 ) Pg2 -
100
where % H2 is the mole per cent hydrogen . The following is obtained by
substitution of ( 2) into (1) :
Also
d.PH2 = kdt
when n f l, the integrated solution to equation (5) is as follows :
(Po - %2)1-n
.. kt + c - (1 - n)
(4)
(5)
(6)
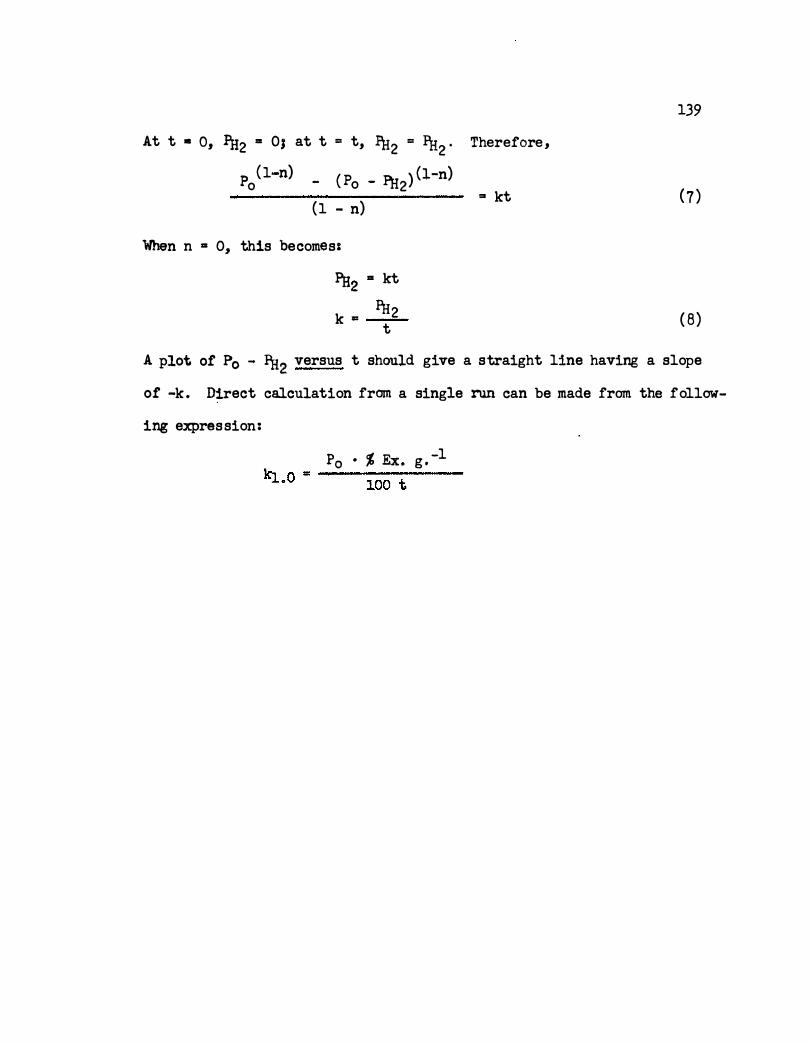
At t • 0, FH2 • OJ at t = t, FH2 = PH2 .
Po( l-n) - ( Po - P.H2) (l-n)
(1 - n)
When n • o
, this becomes:
Pa2 • kt
k . FH2 t
139
Therefore,
... kt ( 7 )
( 8 )
A plot of P0 - Pg2 versus t should give a straight line having a slope
of -k . D�rect calculation from a single run can be made from the follow
ing expression:
P0 • % Ex. g . -l
k:t.o "" ---1-oo_t __ _
VTIA
Burch Byron Stewart was born in Chattanooga , Tenne ssee, on May 1s
1929 . He received his elementary and high school educat ion in Fountain
City, Ten nessee. He attended the University of Tennessee from June , 1947
until December, 1948 on a scholarship sponsored by the Westinghouse Science
Talent Search for 1947. In Decerrber of 1950 he entered the Navy for tw
years during the Korean War. In January, 1953, he returned to the Univer
sity of Tennessee to complete his undergraduate wor k and begin g raduate
work.
He was employed in the Rhen :inm Research Laboratory of the Univer
sity of Tennessee D3partment of Cbemis try from May .�� 1953 to September ,
1954, on a part -tlJile basis. In the fal l of 1954 he was granted a graduate
assistantship, and in September, 1956, be was g ranted a research assistant
ship sponsored by the Atomic Energy �mmission . He received the Bachelor
of Sc ience in Chemistry degree in Mar ch, 1955, and the Master o f Science
degree in chemistry in March, 1957 .
He was awarded the Student Award of the East Ten ne ssee Section of
the American Chemical Society for 1954 and the Merck Index Award for 1954 .
He is a member of the Society of the Sigma Xi, the American Chemical
Society 1 and the Alpha Chi Sigma cmmical fraternity .
He is married to the former Lois M. Speaker o f Neptune , New Jersey,
and has one daughter, leslie Elizabeth.


![Hazards associated with laboratory scale … 2016 tc[2].pdfsmall as well as large-scale laboratory hydrogenations. Catalytic hydrogenation of nitro compounds (Figure 2) is an economi-cal](https://img.pdfslide.us/doc/110x75/5f06a59c7e708231d419086a/hazards-associated-with-laboratory-scale-2016-tc2pdf-small-as-well-as-large-scale.jpg)