Embed Size (px)
Citation preview

General Aspects of Thermal Process Safety Part I
1

Introduction to Risk Analysis of Fine Chemical Processes
3
1
Thermal Safety of Chemical Processes: Risk Assessment and Process Design. Francis StoesselCopyright © 2008 WILEY-VCH Verlag GmbH & Co. KGaA, WeinheimISBN: 978-3-527-31712-7
Case History
A multi - purpose reactor was protected against overpressure by a rupture disk, which lead directly to the outside through the roof of the plant. During a main-tenance operation, it was discovered that this disk was corroded. Although it was decided to replace it, there was no spare part available. Since the next task to be carried out was a sulfonation reaction, it was decided to leave the relief pipe open without the rupture disk in place. In fact, a sulfonation reaction cannot lead to overpressure (sulfuric acid only starts to boil above 300 ° C), so such a protection device should not be required. During the fi rst batch a plug of sublimate formed in the relief line. This went unnoticed and production continued. After heavy rain, water entered the relief tube and accumulated above the sublimate plug. As the next batch began, the plug heated and sud-denly ruptured, allowing the accumulated water to enter the reactor. This led to a sudden exothermal effect, due to the dilution of concentrated sulfuric acid. The increase in temperature triggered sudden decomposition of the reaction mass, causing the reactor to burst, resulting in huge damage.
Lessons drawn
This type of incident is diffi cult to predict. Nevertheless, by using a systematic approach to hazard identifi cation it should become clear that any water entering the reactor could lead to an explosion. Therefore when changing some parts of the equipment, even if they are not directly involved in a given process, espe-cially in multi - purpose plants, one should at least consider possible conse-quences on the safety parameters of the process.
1.1 Introduction
Systematic searches for hazard, assessment of risk, and identifi cation of possible remediation are the basic steps of risk analysis methods reviewed in this chapter.
4 1 Introduction to Risk Analysis of Fine Chemical Processes
After an introduction that considers the place of chemical industry in society, the basic concepts related to risk analysis are presented. The second section reviews the steps of the risk analysis of chemical processes discussed. Safety data are presented in the third section and the methods of hazard identifi cation in the section after that. The chapter closes with a section devoted to the practice of risk analysis.
1.2 Chemical Industry and Safety
The chemical industry, more than any other industry, is perceived as a threat to humans, society, and the environment. Nevertheless, the benefi ts resulting from this activity cannot be negated: health, crop protection, new material, colors, textiles, and so on. This negative perception is more enhanced after major accidents, such as those at Seveso and Bhopal. Even though such catastrophic incidents are rare, they are spectacular and retain public attention. Thus, a fundamental question is raised: “ What risk does society accept regarding the benefi ts of an activity, of a product? ” Such a question assumes that one is able – a priori – to assess the corresponding risk.
In the present chapter, we focus on the methods of risk analysis as they are performed in the chemical industry, and especially in fi ne chemicals and pharma-ceutical industries.
1.2.1 Chemical Industry and Society
The aim of the chemical industry is to provide industry and people in general with functional products, which have a precise use in different activities such as phar-maceuticals, mechanics, electricity, electronics, textile, food, and so on.
Thus, on one hand, safety in the chemical industry is concerned with product safety, that is, the risks linked with the use of a product. On the other hand, it is concerned with process safety, that is, the risks linked with manufacturing the product. In this book, the focus is on process safety.
1.2.1.1 Product Safety Every product between its discovery and its elimination passes through many dif-ferent steps throughout its history: conception, design, feasibility studies, market studies, manufacturing, distribution, use, and elimination, the ultimate step, where from functional product, it becomes a waste product [1] .
During these steps, risks exist linked to handling or using the product. This enters the negative side of the balance between benefi ts and adverse effects of the product. Even if the public is essentially concerned with the product risks during its use, risks are also present during other stages, that is, manufacture, transporta-tion, and storage. For pharmaceutical products, the major concerns are secondary effects. For other products, adverse effects are toxicity for people and/or for the environment, as well as fi re and explosion. Whatever its form, once a product is
1.2 Chemical Industry and Safety 5
no longer functional, it becomes a waste product and thus represents a potential source of harm.
Therefore, during product design, important decision have to be made in order to maximize the benefi ts that are expected from the product and to minimize the negative effects that it may induce. These decisions are crucial and often taken after a systematic evaluation of the risks. Commercialization is strictly regulated by law and each new product must be registered with the appropriate authorities. The aim of the registration is to ensure that the manufacturer knows of any prop-erties of its product that may endanger people or the environment and is familiar with the conditions allowing its safe handling and use, and fi nally safe disposal at the end of the product ’ s life. Thus products are accompanied by a Material Safety Data Sheet ( MSDS ) that summarizes the essential safety information as product identity, properties (toxicity, eco - toxicity, physical chemical properties), informa-tion concerning its life cycle (use, technology, exposure), specifi c risks, protection measures, classifi cation (handling, storage, transportation), and labeling.
1.2.1.2 Process Safety The chemical industry uses numerous and often complex equipment and pro-cesses. In the fi ne chemical industries (including pharmaceuticals), the plants often have a multi - purpose character, that is, a given plant may be used for differ-ent products. When we consider a chemical process, we must do it in an extensive way, including not only the production itself but also storage and transportation. This includes not only the product, but also the raw material.
Risks linked with chemical processes are diverse. As already discussed, product risks include toxicity, fl ammability, explosion, corrosion, etc. but also include addi-tional risks due to chemical reactivity. A process often uses conditions (temperature, pressure) that by themselves may present a risk and may lead to deviations that can generate critical effects. The plant equipment, including its control equipment, may also fail. Finally, since fi ne chemical processes are work - intensive, they may be subject to human error. All of these elements, that is, chemistry, energy, equipment, and operators and their interactions, constitute what we call process safety.
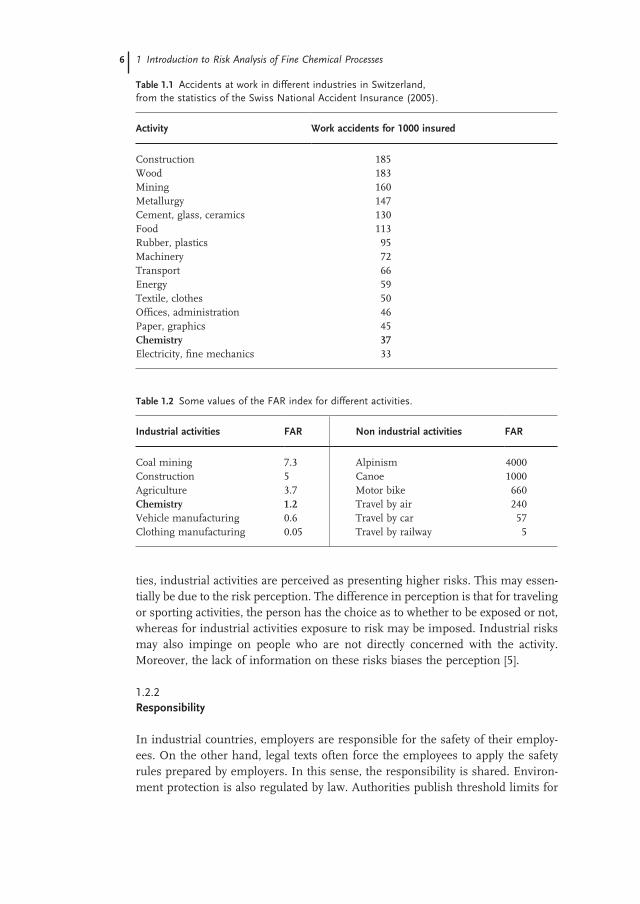
1.2.1.3 Accidents in Chemical Industry Despite some incidents, the chemical industry presents good accident statistics. A statistical survey of work accidents shows that chemistry is positioned close to the end of the list, classifi ed by order of decreasing lost work days [2] (Table 1.1 ). Further, these accidents only constitute a minor part due to chemical accidents, the greatest part consisting of common accidents such as falls, cuts, and so on that can happen in any other activity.
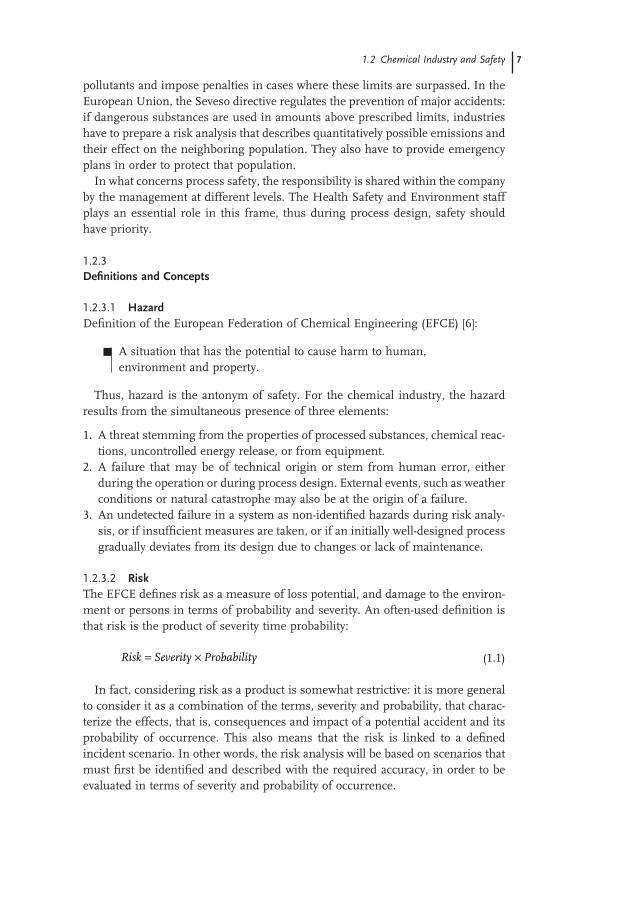
1.2.1.4 Risk Perception Another instructive comparison can be made by comparing fatalities in different activities. Here we use the Fatal Accident Rate index ( FAR ) that gives the number of fatalities for 10 8 hours of exposure to the hazard [3, 4] . Some activities are compared in Table 1.2 . This shows that even with better statistics in terms of fatali-
6 1 Introduction to Risk Analysis of Fine Chemical Processes
ties, industrial activities are perceived as presenting higher risks. This may essen-tially be due to the risk perception. The difference in perception is that for traveling or sporting activities, the person has the choice as to whether to be exposed or not, whereas for industrial activities exposure to risk may be imposed. Industrial risks may also impinge on people who are not directly concerned with the activity. Moreover, the lack of information on these risks biases the perception [5] .
1.2.2 Responsibility
In industrial countries, employers are responsible for the safety of their employ-ees. On the other hand, legal texts often force the employees to apply the safety rules prepared by employers. In this sense, the responsibility is shared. Environ-ment protection is also regulated by law. Authorities publish threshold limits for
Table 1.1 Accidents at work in different industries in Switzerland, from the statistics of the Swiss National Accident Insurance (2005).
Activity Work accidents for 1000 insured
Construction 185 Wood 183 Mining 160 Metallurgy 147 Cement, glass, ceramics 130 Food 113 Rubber, plastics 95 Machinery 72 Transport 66 Energy 59 Textile, clothes 50 Offi ces, administration 46 Paper, graphics 45 Chemistry 37 Electricity, fi ne mechanics 33
Table 1.2 Some values of the FAR index for different activities.
Industrial activities FAR Non industrial activities FAR
Coal mining 7.3 Alpinism 4000 Construction 5 Canoe 1000 Agriculture 3.7 Motor bike 660 Chemistry 1.2 Travel by air 240 Vehicle manufacturing 0.6 Travel by car 57 Clothing manufacturing 0.05 Travel by railway 5
1.2 Chemical Industry and Safety 7
pollutants and impose penalties in cases where these limits are surpassed. In the European Union, the Seveso directive regulates the prevention of major accidents: if dangerous substances are used in amounts above prescribed limits, industries have to prepare a risk analysis that describes quantitatively possible emissions and their effect on the neighboring population. They also have to provide emergency plans in order to protect that population.
In what concerns process safety, the responsibility is shared within the company by the management at different levels. The Health Safety and Environment staff plays an essential role in this frame, thus during process design, safety should have priority.
1.2.3 Defi nitions and Concepts
1.2.3.1 Hazard Defi nition of the European Federation of Chemical Engineering ( EFCE ) [6] :
A situation that has the potential to cause harm to human, environment and property.
Thus, hazard is the antonym of safety. For the chemical industry, the hazard results from the simultaneous presence of three elements:
1. A threat stemming from the properties of processed substances, chemical reac-tions, uncontrolled energy release, or from equipment.
2. A failure that may be of technical origin or stem from human error, either during the operation or during process design. External events, such as weather conditions or natural catastrophe may also be at the origin of a failure.
3. An undetected failure in a system as non - identifi ed hazards during risk analy-sis, or if insuffi cient measures are taken, or if an initially well - designed process gradually deviates from its design due to changes or lack of maintenance.
1.2.3.2 Risk The EFCE defi nes risk as a measure of loss potential, and damage to the environ-ment or persons in terms of probability and severity. An often - used defi nition is that risk is the product of severity time probability:
Risk Severity Probability= × (1.1)
In fact, considering risk as a product is somewhat restrictive: it is more general to consider it as a combination of the terms, severity and probability, that charac-terize the effects, that is, consequences and impact of a potential accident and its probability of occurrence. This also means that the risk is linked to a defi ned incident scenario. In other words, the risk analysis will be based on scenarios that must fi rst be identifi ed and described with the required accuracy, in order to be evaluated in terms of severity and probability of occurrence.
8 1 Introduction to Risk Analysis of Fine Chemical Processes
1.2.3.3 Safety Safety is a quiet situation resulting from the real absence of any hazard [7] .
Absolute safety (or zero risk) does not exist for several reasons: fi rst, it is possible that several protection measures or safety elements can fail simultaneously; second, the human factor is a source of error and a person can misjudge a situa-tion or have a wrong perception of indices, or may even make an error due to a moment ’ s inattention.
1.2.3.4 Security In common language, security is a synonym of safety. In the context of this book, security is devoted to the fi eld of property protection against theft or incursion.
1.2.3.5 Accepted Risk The accepted risk is a risk inferior to a level defi ned in advance either by law, technical, economical, or ethical considerations. The risk analysis, as it will be described in the following sections, has essentially a technical orientation. The minimal requirement is that the process fulfi ls requirements by the local laws and that the risk analysis is carried out by an experienced team using recognized methods and risk - reducing measures that conform to the state of the art. It is obvious that non - technical aspects may also be involved in the risk acceptation criteria. These aspects should also cover societal aspects, that is, a risk – benefi t analysis should be performed
1.3 Risk Analysis
A risk analysis is not an objective by itself, but is one of the elements of the design of a technically and economically effi cient chemical process [1] . In fact, risk analy-sis reveals the process inherent weaknesses and provides means to correct them. Thus, risk analysis should not be considered as a “ police action, ” in the sense that, at the last minute, one wants to ensure that the process will work as intended. Risk analysis rather plays an important role during process design. Therefore, it is a key element in process development, especially in the defi nition of process control strategies to be implemented. A well - driven risk analysis not only leads to a safe process, but also to an economic process, since the process will be more reliable and give rise to less productivity loss.
1.3.1 Steps of Risk Analysis
There are many risk analysis methods, but all have three steps in common:
1. search for hazards, 2. risk assessment, and 3. defi nition of risk - reducing measures.
If these three steps are at the heart of the risk analysis, it is also true that per-forming these steps requires preliminary work and other steps that should not be bypassed [1, 8] .
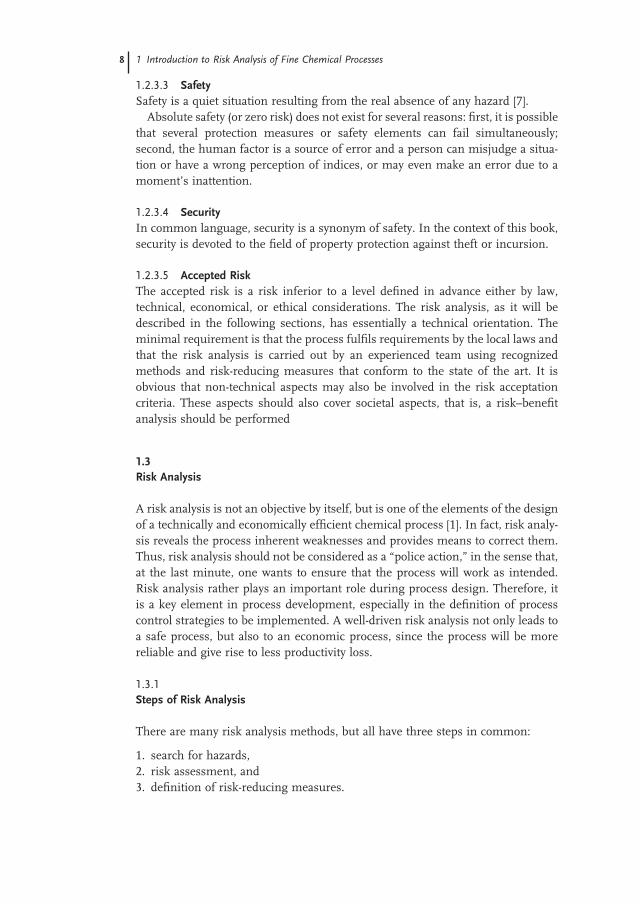
By systematically studying past incidents in the chemical industry, several causes can be identifi ed. These are summarized in Table 1.3 .
Thus, the risk analysis must be well prepared, meaning that the scope of the analysis must be clearly defi ned; data must be available and evaluated, to defi ne the safe process conditions and the critical limits. Then, and only then, the sys-tematic search for process deviations from the safe conditions can be started. The identifi ed deviations lead to the defi nition of scenarios, which can be assessed in terms of severity and probability of occurrence. This work can advantageously be summarized in a risk profi le, enhancing the major risks that are beyond the accepted limits. For these risks, reduction measures can then be defi ned. The residual risk, that is, the risk remaining after implementation of the measures, can be assessed as before and documented in a residual risk profi le showing the progress of the analysis and the risk improvement. These steps are reviewed in the next sections.
1.3.1.1 Scope of Analysis The scope of the analysis aims to identify the process under consideration, in which plant it will take place, and with which chemicals it will be performed. The chemical reactions and unit operations must be clearly characterized. In this step, it is also important to check for interface problems with other plant units. As an example, when considering raw material delivery, it can be assumed that the correct raw material of the intended quantity and quality is delivered from a tank farm. Thus, it can be referred to the tank farm risk analysis, or the tank farm is to be included in the scope of the analysis. Similar considerations can be made for energy supply, to ensure that the appropriate energy is delivered. Nevertheless, loss of energy must be considered in the analysis, but it will be assumed that
Table 1.3 Causes of incidents and their remediation.
Causes Remediation
Lack of knowledge concerning the properties of material and equipment, the reactivity, the thermal data, etc.
Collection and evaluation of process data, physical properties, safety data, thermal data. Defi nition of safe process conditions and critical limits
No - identifi ed deviation or failure Systematic search for deviations from normal operating conditions
Wrong risk assessment (misjudged) Interpretation of data, clearly defi ned assessment criteria, professional experience
No adequate measures provided Process improvement, technical measures Measures neglected Plant management, management of change
1.3 Risk Analysis 9
10 1 Introduction to Risk Analysis of Fine Chemical Processes
if nitrogen is required, nitrogen will be delivered. This allows checking for non - analysed items in a whole plant, completing the analysis.
1.3.1.2 Safety Data Collection The required data must be collected prior to the risk analysis. This can be done gradually during process development as the knowledge on the process increases. The data can be summarized on data sheets devoted to different aspects of the process. They typically should encompass the following:
• involved chemical compounds, • chemical reactions, • technical equipment, • utilities, • operators.
The required data are reviewed in detail in Section 1.4 . In order to be economic and effi cient, the data collection is accompanied by their interpretation in terms of risks. This allows adapting the amount and accuracy of the data to the risk. This procedure is illustrated in the example of thermal data in Section 3.4 .
1.3.1.3 Safe Conditions and Critical Limits Once the safety data have been collected and documented, they must be evaluated with regard to the process conditions in terms of their signifi cance for process safety. With the interpretation of the safety data, the process conditions that provide safe operation and the limits that should not be surpassed become clear. This defi nes the critical limits of the process, which are at the root of the search for deviations in the next step of the risk analysis.
This task should be performed by professionals having the required skills. Prac-tice has shown that it is advantageous to perform, or at least to review, the inter-pretation with the risk analysis team. This ensures that the whole team has the same degree of knowledge and understanding of the process features.
1.3.1.4 Search for Deviations During this step, the process is considered in its future technological environment, that is, the plant equipment, the control systems including the operators, and the delivery of raw material. The utilities are included in the critical examination of deviations from normal operating conditions. Here the following fi elds may be distinguished:
• deviations from operating mode, which are a central part in batch processes, • technical failures of equipment, such as valves, pumps, control elements,
and so on, which represent the central part of the equipment - oriented risk analysis,
• deviations due to external causes, such as climatic impacts (frost, fl ooding, storms),
• failure of utilities, especially electrical power or cooling water.
With continuous processes, different stages must be considered: steady state, start up and shut down, emergency stops, and so on.
The methods for search of hazards can be classifi ed into three categories:
1. Intuitive methods, such as brainstorming. 2. Inductive methods, such as check lists, Failure Mode and Effect Analysis
( FMEA ), event trees, decision tables, Analysis of Potential Problems ( APP ). These methods proceed from an initial cause of the deviation and construct a scenario ending with the fi nal event. They are based on questions of the type: “ What if? ”
3. Deductive methods, such as the Fault Tree Analysis ( FTA ) that proceeds by starting from the top event and looking for failures that may cause it to happen. These methods are based on questions of the type: “ How can it happen? ”
Some examples of those methods, commonly used for hazard search in chemi-cal processes, are presented in Section 1.5 .
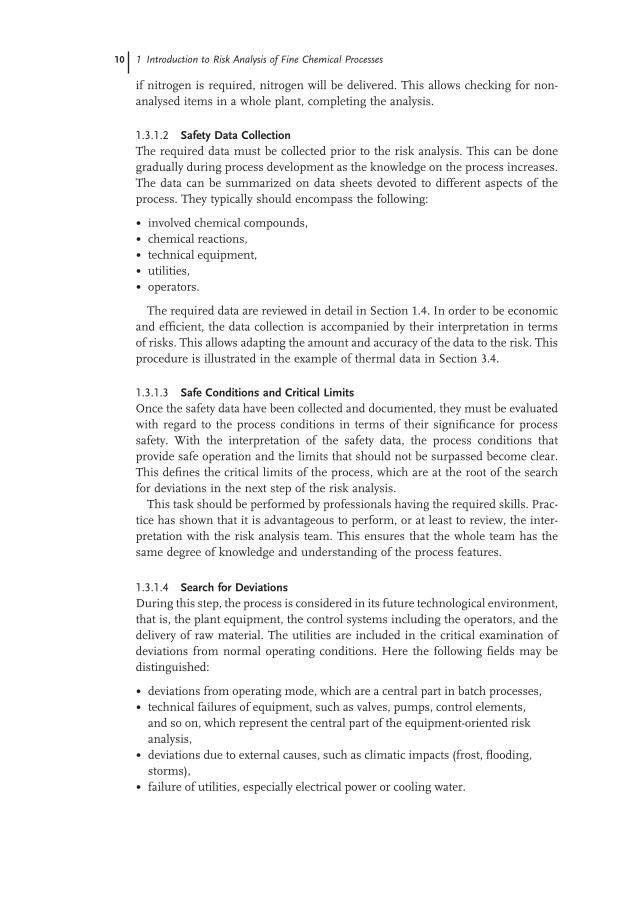
The triggering mechanism to make a real threat out of a potential threat is called the cause. Each potential threat can have several potential causes, which should be listed. The possible consequences of a triggered event are referred to as the effects. This description of hazard causes and effects build an event scenario. The listing of the hazards in a table with an identifi er, a short description a list of pos-sible causes and the consequences, makes up the hazard catalog. The table may also contain risk assessment, a description of risk - reducing measures, assessment of residual risk, and who is responsible for the action decided on. This is of great help for the follow - up of the project. An example of such a hazard catalog is pre-sented in Figure 1.1 .
Figure 1.1 Example of Hazards Catalogue with deviation causes effects and actions decided by the team as well as their status.
1.3 Risk Analysis 11
12 1 Introduction to Risk Analysis of Fine Chemical Processes
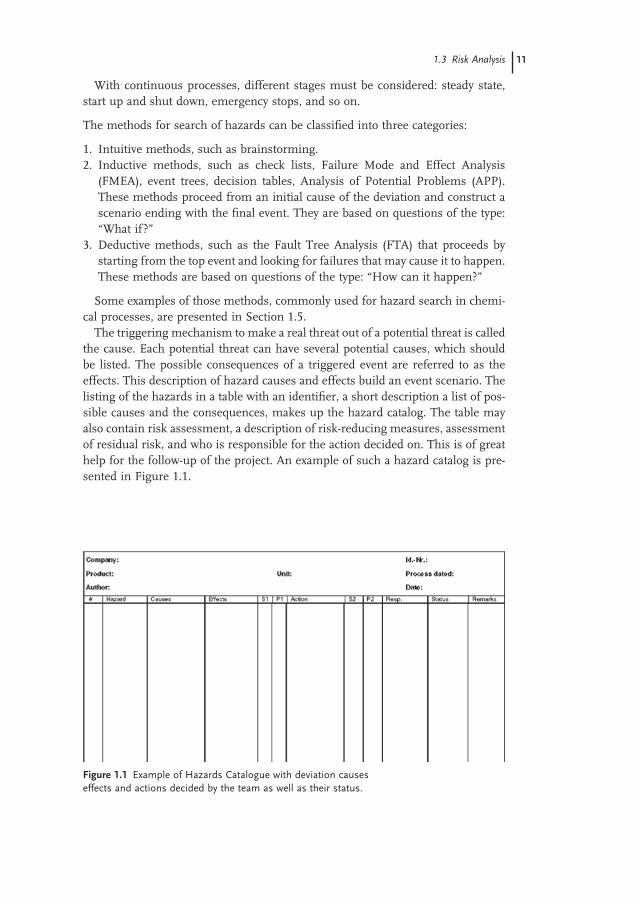
1.3.1.5 Risk Assessment The deviation scenarios found in the previous step of the risk analysis must be assessed in terms of risk, which consists of assigning a level of severity and prob-ability of occurrence to each scenario. This assessment is qualitative or semi - quantitative, but rarely quantitative, since a quantitative assessment requires a statistical database on failure frequency, which is diffi cult to obtain for the fi ne chemicals industry with such a huge diversity of processes. The severity is clearly linked to the consequences of the scenario or to the extent of possible damage. It may be assessed using different points of view, such as the impact on humans, the environment, property, the business continuity, or the company ’ s reputation. Table 1.4 gives an example of such a set of criteria. In order to allow for a correct assess-ment, it is essential to describe the scenarios with all their consequences. This is often a demanding task for the team, which must interpret the available data in order to work out the consequences of a scenario, together with its chain of events.
The probability of occurrence ( P ) is linked to the causes of the deviations. It is often expressed as frequency ( f ), referring to an observation period ( T ) often of one year:
P f T f
P
T= ⋅ ⇒ =
(1.2)
Table 1.4 Example assessment criteria for the severity.
Category 1. Negligible 2. Marginal 3. Critical 4. Catastrophic
Life/health in company
Injury, ambulant treatment
Injury requiring hospitalization
Injury with long - term disability
Fatality
Life/health outside company
No effect No effect First aid cases Severe injury
Environment No effect Only on - site effects, effect on water treatment plant
Pollution outside site, recovery within 1 month
Long - term pollution of water, soil
Property Not signifi cant Production line to be repaired
Loss of production line
Loss of plant
Business continuity
Not affected Production stopped over 1 week
Delivery to customers must be interrupted several weeks
Business interruption more than 1 month
Image No report outside company
Report in local media
Report in national media
Report in international media
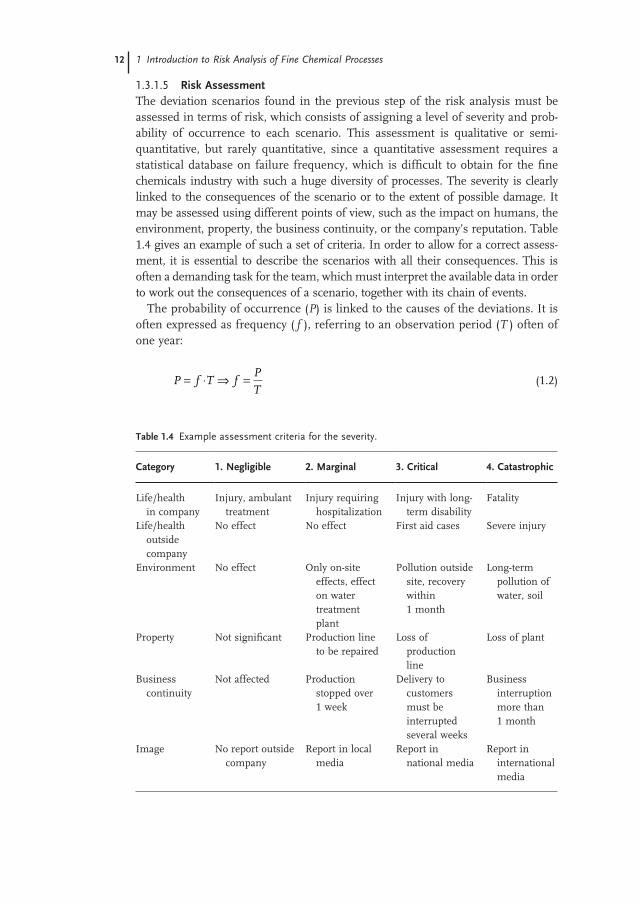
A probability of 0.01 is equivalent to an occurrence of 1 incident in 100 years. An example of evaluation criteria for the probability is given in Table 1.5 . There are two approaches for the assessment of probability: one is the qualitative approach, based on experience and using analogies to similar situations. The other is the quantitative approach, based on statistical data obtained from equipment failure databases [4] . These data were mainly gathered from the petrochemicals industry and bulk chemical industry, working essentially with dedicated plant units. For the fi ne chemicals and pharmaceutical industries, where the processes are carried out in multi - purpose plants, this approach is more diffi cult to use. This is because the equipment may work under very different conditions from process to process, which obviously has an impact on its reliability. The quantitative analy-sis must be based on a method, to allow identifi cation of the interaction between different failures. Such a method, such as the fault tree analysis, is presented in Section 1.5.4 . To get a better idea of the probability, a semi - quantitative approach consists of listing the logical relationships between the different causes. This allows identifying if the simultaneous failure of several elements is required to obtain the deviation and gives access to a semi - quantitative assessment.
The criteria mentioned in Tables 1.4 and 1.5 are given as an example of a pos-sible practice, but as a part of the company ’ s risk policy, they must be defi ned for each company with respect to its actual situation. Severity and probability of occur-rence of an event form the two coordinates of the risk profi le.
Table 1.5 Example assessment criteria for the probability.
Category Frequency Defi nition/Examples
Frequent Several times in a week
Hazards occurring at each batch if no measures are taken, e.g. charging powders in fl ammable solvent, exposure during handling of liquid or solid chemicals, ignition effective electrostatic discharge (if nothing is done against charging)
Moderate Once or twice a month
Pump failure, failure of data acquisition, weighing error, wrong set point setting
Occasional Several times a year
Imprecise communication between production, e.g. tank farm, failure of utilities, failure of a motor, explosive mixture after a failure
Remote Once a year Wrong piping connection after repair, mix - up of chemicals, programming error of control system, leakage at reactor or tank jacket, total power failure in the site
Unlikely Once in 10 years
Simultaneous failure of redundant level control, e.g. LAH and LAHH, leak at fl ange
Almost impossible
Once in 100 years or more
Undiscovered failure of self controlling data acquisition, simultaneous failure of multiple technical safety measures, heavy earthquake, aircraft impact
1.3 Risk Analysis 13
14 1 Introduction to Risk Analysis of Fine Chemical Processes
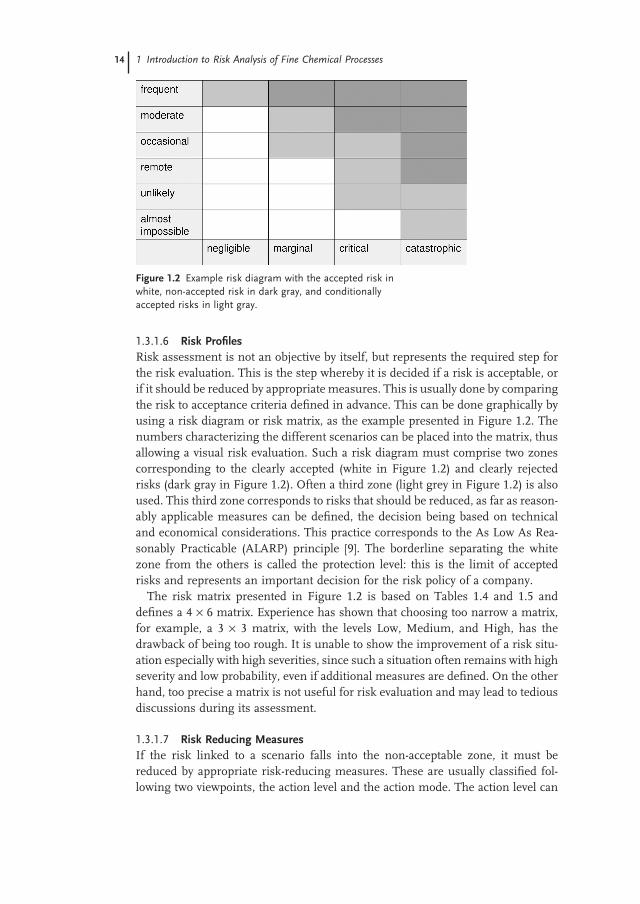
1.3.1.6 Risk Profi les Risk assessment is not an objective by itself, but represents the required step for the risk evaluation. This is the step whereby it is decided if a risk is acceptable, or if it should be reduced by appropriate measures. This is usually done by comparing the risk to acceptance criteria defi ned in advance. This can be done graphically by using a risk diagram or risk matrix, as the example presented in Figure 1.2 . The numbers characterizing the different scenarios can be placed into the matrix, thus allowing a visual risk evaluation. Such a risk diagram must comprise two zones corresponding to the clearly accepted (white in Figure 1.2 ) and clearly rejected risks (dark gray in Figure 1.2 ). Often a third zone (light grey in Figure 1.2 ) is also used. This third zone corresponds to risks that should be reduced, as far as reason-ably applicable measures can be defi ned, the decision being based on technical and economical considerations. This practice corresponds to the As Low As Rea-sonably Practicable ( ALARP ) principle [9] . The borderline separating the white zone from the others is called the protection level: this is the limit of accepted risks and represents an important decision for the risk policy of a company.
The risk matrix presented in Figure 1.2 is based on Tables 1.4 and 1.5 and defi nes a 4 × 6 matrix. Experience has shown that choosing too narrow a matrix, for example, a 3 × 3 matrix, with the levels Low, Medium, and High, has the drawback of being too rough. It is unable to show the improvement of a risk situ-ation especially with high severities, since such a situation often remains with high severity and low probability, even if additional measures are defi ned. On the other hand, too precise a matrix is not useful for risk evaluation and may lead to tedious discussions during its assessment.
1.3.1.7 Risk Reducing Measures If the risk linked to a scenario falls into the non - acceptable zone, it must be reduced by appropriate risk - reducing measures. These are usually classifi ed fol-lowing two viewpoints, the action level and the action mode. The action level can
Figure 1.2 Example risk diagram with the accepted risk in white, non - accepted risk in dark gray, and conditionally accepted risks in light gray.
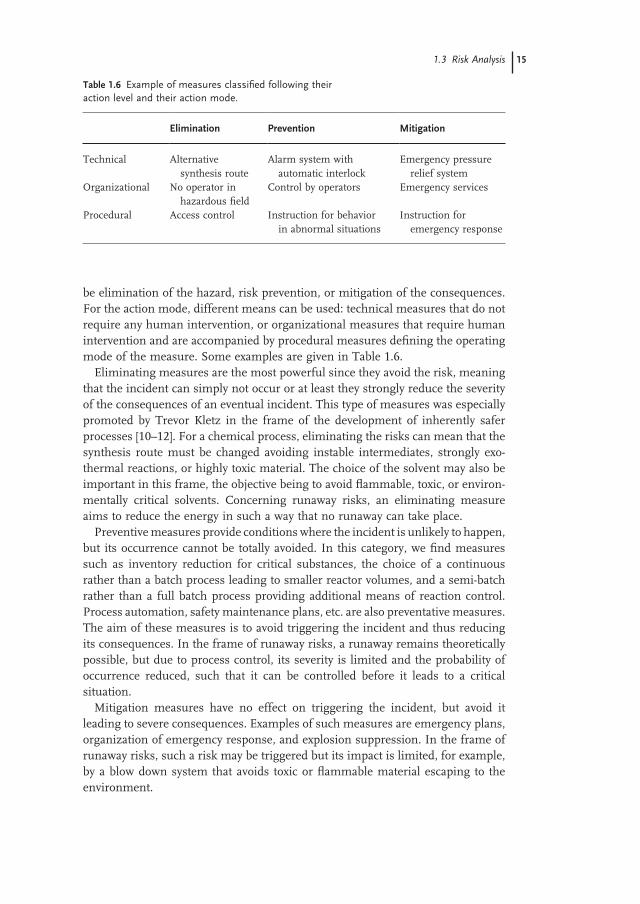
be elimination of the hazard, risk prevention, or mitigation of the consequences. For the action mode, different means can be used: technical measures that do not require any human intervention, or organizational measures that require human intervention and are accompanied by procedural measures defi ning the operating mode of the measure. Some examples are given in Table 1.6 .
Eliminating measures are the most powerful since they avoid the risk, meaning that the incident can simply not occur or at least they strongly reduce the severity of the consequences of an eventual incident. This type of measures was especially promoted by Trevor Kletz in the frame of the development of inherently safer processes [10 – 12] . For a chemical process, eliminating the risks can mean that the synthesis route must be changed avoiding instable intermediates, strongly exo-thermal reactions, or highly toxic material. The choice of the solvent may also be important in this frame, the objective being to avoid fl ammable, toxic, or environ-mentally critical solvents. Concerning runaway risks, an eliminating measure aims to reduce the energy in such a way that no runaway can take place.
Preventive measures provide conditions where the incident is unlikely to happen, but its occurrence cannot be totally avoided. In this category, we fi nd measures such as inventory reduction for critical substances, the choice of a continuous rather than a batch process leading to smaller reactor volumes, and a semi - batch rather than a full batch process providing additional means of reaction control. Process automation, safety maintenance plans, etc. are also preventative measures. The aim of these measures is to avoid triggering the incident and thus reducing its consequences. In the frame of runaway risks, a runaway remains theoretically possible, but due to process control, its severity is limited and the probability of occurrence reduced, such that it can be controlled before it leads to a critical situation.
Mitigation measures have no effect on triggering the incident, but avoid it leading to severe consequences. Examples of such measures are emergency plans, organization of emergency response, and explosion suppression. In the frame of runaway risks, such a risk may be triggered but its impact is limited, for example, by a blow down system that avoids toxic or fl ammable material escaping to the environment.
Table 1.6 Example of measures classifi ed following their action level and their action mode.
Elimination Prevention Mitigation
Technical Alternative synthesis route
Alarm system with automatic interlock
Emergency pressure relief system
Organizational No operator in hazardous fi eld
Control by operators Emergency services
Procedural Access control Instruction for behavior in abnormal situations
Instruction for emergency response
1.3 Risk Analysis 15
16 1 Introduction to Risk Analysis of Fine Chemical Processes
Technical measures are designed in such a way that they require no interven-tion, nor need to be triggered or executed. They are designed to avoid human error (in their action, but not in their design!). Technical measures are often built as automated control systems, such as interlocks or safety trips. In certain instances, they must be able to work under any circumstances, even in the case of utility failure. Therefore, great care is required in their design, which should be simple and robust. Here the simplifi cation principle of inherent safety, the KISS principle ( Keep It Simple and Stupid ), should be followed. Depending on the risk level, they must also present a certifi ed high degree of reliability. This is described in the international standard IEC 61511 [9] that advises on the different Safety Integrity Levels ( SIL ) with the required reliability as a function of the risk.
Organizational measures are based on human action for their performance. In the fi ne chemicals and pharmaceutical industries, reactor - charging operations are often manual operations and the product identifi cation relies on the operator. In this context, quality systems act as support to safety, since they require a high degree of traceability and reliability. Examples of such measures are labeling, double visual checks, response to acoustic or optical alarms, in process control, and so on. The effi ciency of theses measures is entirely based on the discipline and instruction of the operators. Therefore, they must be accompanied by pro-grams of instructions, where the adequate procedures are learned in training.
During the risk analysis, the measures must be accurately described to establish terms of reference, but no detailed engineering must be done during the analysis. It is also advisable to defi ne a responsible person for the design and establishment of these measures.
1.3.1.8 Residual Risk This is the last step of risk analysis. After having completed the risk analysis and defi ned the measures to reduce risks, a further risk assessment must be carried out to ensure risks are reduced to an accepted level. The risks cannot be completely eliminated: risk zero does not exist, thus a residual risk remains. This is also because only identifi ed risks were reduced by the planned measures. Thus, the residual risk has three components:
1. the consciously accepted risk, 2. the identifi ed, but misjudged risk, and 3. the unidentifi ed risk.
Thus, a rigorous and consciously performed risk analysis should reduce both of the last components. This is the responsibility of the risk analysis team. Hence, it becomes obvious that risk analysis is a creative task that must anticipate events, which may occur in the future and has the objective of defi ning means for their avoidance. This may also be seen in opposition to laws that react on events from the past. Therefore, it is a demanding task oriented to the future, which requires excellent engineering skills.
At this stage, a second risk profi le can be constructed, in a similar way to that shown in Section 1.3.1.6 . This allows the identifi cation of the risks that are now
strongly reduced and thus the measures, which require special care in their design, should perhaps be submitted to a reliability analysis, as described in Section 1.3.1.7 .
1.4 Safety Data
In this section, a safety dataset, resulting from over 20 years of practical experience with risk analysis of chemical processes, is presented. These data build the base of risk analysis in the fi ne chemicals and pharmaceutical industries, essentially in multi - purpose plants. Therefore, the dataset introduces plant considerations only at its end. This allows exchanging them without any need for recollecting the whole dataset, in cases where the process is transferred from one plant unit to another. Moreover, this dataset may be used in the frame of different risk analysis methods.
There are many different sources for safety data, such as Material Safety Data Sheet ( MSDS ), databases [13, 14] , company databases, and reports. Great care is required, when using MSDS, since experience has shown that they are not always reliable.
The safety data used in risk analysis can be grouped into different categories, described in the following sections. The data should be provided for raw material, intermediates, and products, as well as for reaction mixtures or wastes as they are to be handled in the process. Missing data, important in risk analysis, may be marked with a letter “ I, ” to indicate that this information is missing or as a default by a letter “ C, ” if its value is unknown but judged to be critical.
1.4.1.1 Physical Properties Physical properties such as melting point, boiling point, and vapor pressure, as well as densities and solubility in water, are especially important in case of a release, but also give important restrictions to the process conditions. For instance, the melting point may indicate that the contents of a stirred vessel solidify below this temperature. This gives a lower limit to the heating or cooling system tem-perature, which would forbid using an emergency cooling system. In a similar way, the vapor pressure may defi ne an upper temperature limit if a certain pres-sure level is not to be surpassed. Densities may also indicate what the upper and lower phase in a mixture is. Solubility in water is important in case of spillage.
1.4.1.2 Chemical Properties The chemical properties allow summarizing observations or experiences made during process development or previous production campaigns. The following characteristic chemical properties should be identifi ed during the risk analysis: acidity, auto - ignition temperature, pyrophoric properties, reaction with water, light sensitivity, air sensitivity, and storage stability. Further, impurities in the product may affect the toxic and ecotoxic properties of substances or mixtures.
1.4 Safety Data 17
18 1 Introduction to Risk Analysis of Fine Chemical Processes
1.4.1.3 Toxicity The odor limit compared to other limits may indicate an early warning of a leak. The maximum allowed work place concentration ( MAC ), is the maximum allowed average concentration expressed in mg m − 3 of a gas, vapor, or dust in air in a workplace, which has no adverse effects on health for an exposure of 8 hours per day or 42 hours per week for the majority of a population. Since it is an average, maintaining the concentration below this value does not guarantee no effects, since the sensitivity may differ within a population. On the other hand, a short - term exposure to a concentration above MAC does not imply consequences on health.
A distinction is made between acute toxicity and chronic toxicity. For acute toxic-ity, the following indicators may be used:
• Lethal dose LD 50 : gives the concentration that caused 50% of fatalities within 5 days in an animal population exposed once to the concentration. It may be an oral or dermal exposure and is expressed in mg kg − 1 of organism with a specifi ca-tion of the test animal used.
• Lethal concentration LC 50 : is the concentration in air that caused 50% of fatali-ties within 5 days in a test in an animal population exposed to this concentration. It is through inhalation and is expressed in mg kg − 1 of organism with a specifi ca-tion of the test animal used.
The LD 50 and TC 50 for humans would be more directly applicable but, for obvious reasons, only very sparse data are available:
• The toxic dose lowest (TDL 0 oral) is the lowest dose that induced diseases in humans by oral absorption.
• The toxic concentration lowest (TCL 0 oral) is the lowest concentration in the air that induced diseases in humans by inhalation.
More qualitative indicators are also useful: absorption through healthy skin, irritation to skin, eyes, and respiratory system, together with sensitization with the following indicators: carcinogenic, mutagenic, teratogenic, reprotoxic, and so on. These properties can be summarized by indication of a toxicity class.
To judge the effect of short - term exposure, such as during a spillage, the short - term exposure limit (e.g. IDLH), must be known. The different levels given by the Emergency Response Planning Guidelines ( EPRG ), issued by the American Department of Energy and the Department of Transport, may also be used in this frame.
The use of carcinogenic material should be avoided as far as possible, by replace-ment with non - toxic or at least less toxic substances. If their use cannot be avoided, appropriate technical and medicinal measures should be applied in order to protect the workers from their effects. Among such measures, the reduction of the expo-sure in terms of concentration and duration as well as a medical follow - up may be required. The exposure can be limited by using closed systems, avoiding any direct contact with the substance, or personal protection equipment. Moreover, the number of exposed operators should be limited.
1.4.1.4 Ecotoxicity In instances of spillage or release, not only humans may be concerned, but the damage may also affect the environment. The following data are required:
• biological degradability, bacteria toxicity (IC 50 ), • algae toxicity (EC 50 ), • daphnia toxicity (EC 50 ), • fi sh toxicity (LC 50 ).
The P o/w, that is, the distribution coeffi cient between octanol and water, indi-cates a possible accumulation in fat. Malodorous or odor intense compounds should also be indicated.
The symbol LC 50 means lethal concentration for 50% of a test population. The symbol EC 50 means effi ciency concentration for mobility suppression of 50% a test population. The symbol IC 50 means inhibition concentration for 50% of a popula-tion in a test for respiratory suppression.
1.4.1.5 Fire and Explosion Data The most common property in the assessment of fi re hazards is the fl ashpoint that is applicable to liquids or melts, and is the lowest temperature at which the vapor above the substance may be ignited and continue to burn. The reference pressure for the fl ashpoint is 1013 mbar.
The combustion index is applicable to solids and gives a qualitative indication about combustibility, ranging from one to six. Index 1 corresponds to no combus-tion and Index 6 to a violent combustion with fast propagation. From Index 4, the combustion propagates through to the solid.
The self - sustaining decomposition is a phenomenon whereby the decomposi-tion is initiated by a hot spot, and then propagates through to the solid with a velocity of some millimeters to centimeters per second. The decomposition does not require oxygen, so it cannot be avoided by using an inert atmosphere.
Electrostatic charges may provide an ignition source for the explosion of a gas, vapor, or dust cloud. Electrostatic charges can accumulate only if a separation process is involved. Since this is an often - occurring phenomenon as soon as a product is in motion, separation processes are common in chemical processes, during pumping, agitation, pneumatic transport, and so on. Charge accumulation occurs when the conductivity is too low to allow charge relaxation. This may lead to an electrostatic discharge that may ignite an explosion if present at the same time as explosive atmosphere. For this to occur the concentration of combustible must be in a given range and oxygen must be present. In order to assess such situ-ations, the explosion characteristics are required.
Explosion limits indicate in which concentration range a mixture of combustible substance can be ignited. There are two limits, the lower explosion limit ( LEL ), below which the concentration is too low to produce an explosion and the upper explosion limit ( UEL ), above which the oxygen is in default and no explosion occurs. Further, the explosion is characterized by the maximum explosion pressure and its violence by the maximum pressure increase rate. In order
1.4 Safety Data 19
20 1 Introduction to Risk Analysis of Fine Chemical Processes
to decide if an explosion can be ignited, the minimum ignition energy ( MIE ) is required.
The shock and friction sensitivity of a solid is also an important parameter, especially when it is to be submitted to mechanical stress during processing.
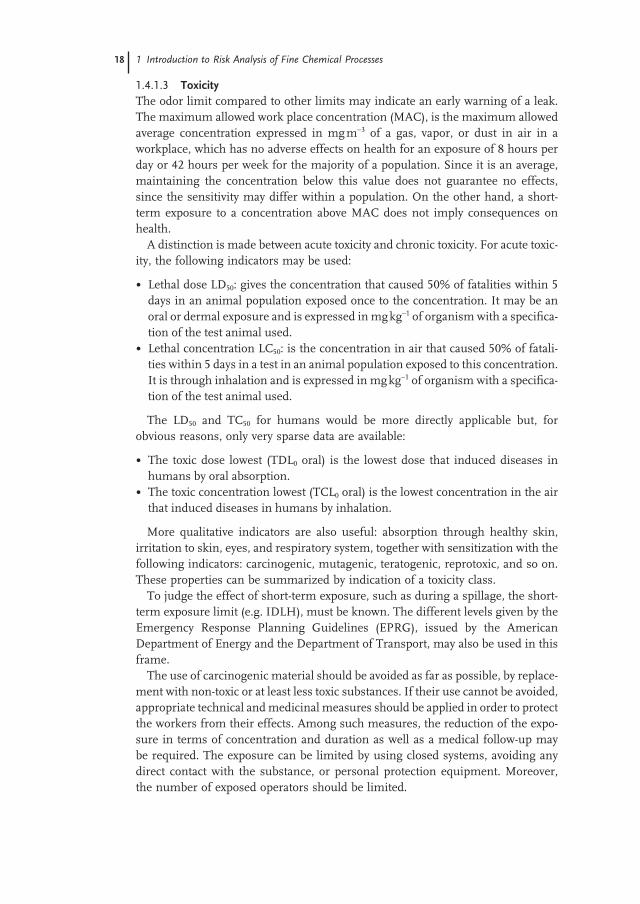
1.4.1.6 Interactions The reactivity of chemicals used in a process must be assessed, since these chemi-cals may become in contact in a desired way or accidentally during the process. These interactions are usually analysed in a triangular matrix where the desired and undesired reactions are marked at the intersection of each row and column. Beside chemicals or mixtures, the different fl uids (i.e. heat carrier), waste streams, and construction materials must also be considered. An example of such a matrix, summarizing the safety data and the interactions, is represented in Figure 1.3 .
1.5 Systematic Search for Hazards
In this section, a selection of commonly used hazard identifi cation techniques is presented. These techniques can be used in the fi ne chemicals and pharmaceutical industries. The methods presented here are designed to provide a systematic search for hazards with the fi nal objective of providing a comprehensive analysis.
Figure 1.3 Interaction matrix, also called hazard matrix, summarizing the safety data of chemicals involved in a process.
1.5.1 Check List Method
The check list method is based on past experience. The process description, the operating mode, is screened using a list of possible failures or deviations from this particular operating mode. Thus, it is obvious that the quality and compre-hensiveness of the check list directly govern its effi ciency. Indeed, the experience of the authors confi rms that the check list is essential. This method is well adapted to discontinuous processes as practised in the fi ne chemicals and pharmaceutical industries, where processes are often performed in multi - purpose plants. The basic document for the hazard identifi cation is the process description, also called operating mode. Each step of the process is analysed with the check list.
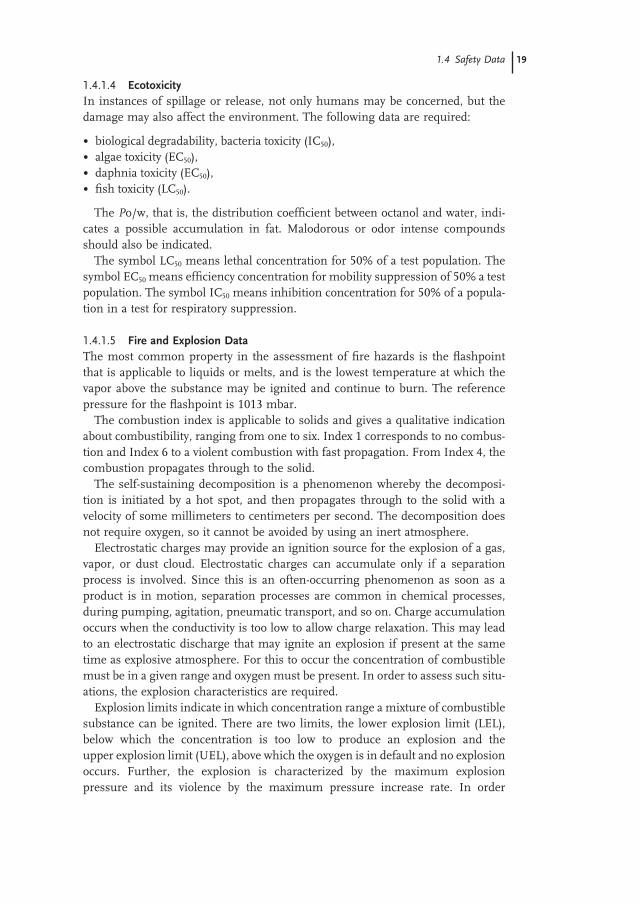
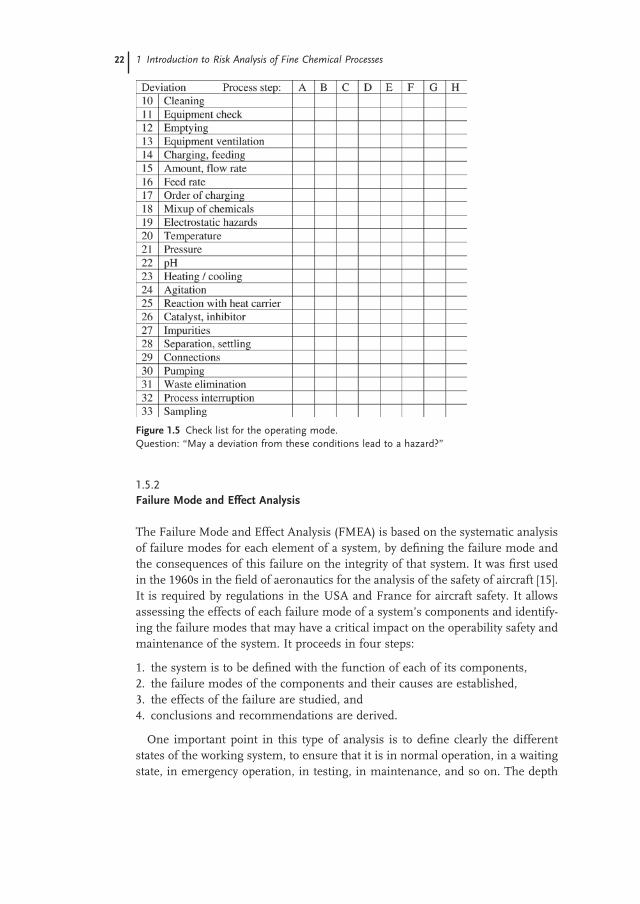
The check list presented here is constructed as a matrix with a row for each keyword of the check list and a column for each process step. The list itself is in two parts: the fi rst (Figure 1.4 ) is devoted to the utilities and the corresponding question is: “ May the failure of the considered utility lead to a hazard in a given process step? ” In the second part (Figure 1.5 ), the operating mode is analysed using the check list, by questioning if a deviation from these conditions may lead to a hazard. This also allows checking the thoroughness of the process description, to see if the process conditions are given with suffi cient precision and to avoid any misunderstandings.
The check list presents some intended redundancies, for example, equipment cleaning and impurities, or fl ow rate and feed rate, that are intended to ensure the comprehensiveness of the analysis. If a critical situation is identifi ed, the corre-sponding box is marked with a cross, and the corresponding hazard identifi ed by the coordinates of the box (e.g. F6: referring to the effect of failure of compressed air in sequence F), as described in the hazard catalog (Figure 1.1 ) in terms of pos-sible causes, effects, risk assessment, measures, and residual risk. For an effi cient analysis, it is advisable to group the process steps into sequences in order to avoid getting lost in useless detail. As an example, the preparation of a reactor may comprise a sequence of steps, such as the check for cleanness, proper connections, valve positions, inerting, heating to a given temperature, and so on.
Figure 1.4 Check list for utilities. Question: “ May the failure of a utility lead to a hazard? ”
1.5 Systematic Search for Hazards 21
22 1 Introduction to Risk Analysis of Fine Chemical Processes
1.5.2 Failure Mode and Effect Analysis
The Failure Mode and Effect Analysis ( FMEA ) is based on the systematic analysis of failure modes for each element of a system, by defi ning the failure mode and the consequences of this failure on the integrity of that system. It was fi rst used in the 1960s in the fi eld of aeronautics for the analysis of the safety of aircraft [15] . It is required by regulations in the USA and France for aircraft safety. It allows assessing the effects of each failure mode of a system ’ s components and identify-ing the failure modes that may have a critical impact on the operability safety and maintenance of the system. It proceeds in four steps:
1. the system is to be defi ned with the function of each of its components, 2. the failure modes of the components and their causes are established, 3. the effects of the failure are studied, and 4. conclusions and recommendations are derived.
One important point in this type of analysis is to defi ne clearly the different states of the working system, to ensure that it is in normal operation, in a waiting state, in emergency operation, in testing, in maintenance, and so on. The depth
Figure 1.5 Check list for the operating mode. Question: “ May a deviation from these conditions lead to a hazard? ”
of decomposition of the system into its components is crucial for the effi ciency of the analysis.
In order to illustrate the method, we can take the example of a pump as a com-ponent. It may fail to start or to stop when requested, provide too low a fl ow rate or too low a pressure, or present an external leak. The internal causes for pump failure may be mechanical blockage, mechanical damage, or vibrations. The exter-nal causes may be power failure, human error, cavitation, or too high a head loss. Then the effect on the operation of the system and external systems must be identifi ed. It is also useful to describe the ways for detecting the failure. This allows establishing the corrective actions and the desired frequency of checks and main-tenance operations.
As it can be seen from this example, the AMDE may rapidly become very work - intensive and tedious. Therefore, a special adaptation has been made for the chemical process industry: the Hazard and Operability study.
1.5.3 Hazard and Operability Study
The Hazard and Operability Study ( HAZOP ) was developed in the early 1970s by ICI [16] , after the Flixborough incident [17] . It is derived from the Failure Mode and Effect Analysis, but specially adapted for the process industry in general, and in the chemical industry in particular. It is essentially oriented towards the identifi cation of risks stemming from the process equipment. It is particularly well suited for the analysis of continuous processes in the steady state, but can also be used for batch processes. The fi rst steps of the risk analysis, of scope defi nition, data collection, safe conditions defi nition, are the same as for other methods. Using the process and instruments design ( PID ) and the Process Flow Diagram ( PFD ) as basic documents, the plant is divided into nodes and lines. For each of these divisions, a design intention is written that precisely summarizes its function. For example, a feed line could be defi ned as: “ the line A129 is designed to feed 100 kg hour − 1 of product A from Tank B101 to reactor R205. ”
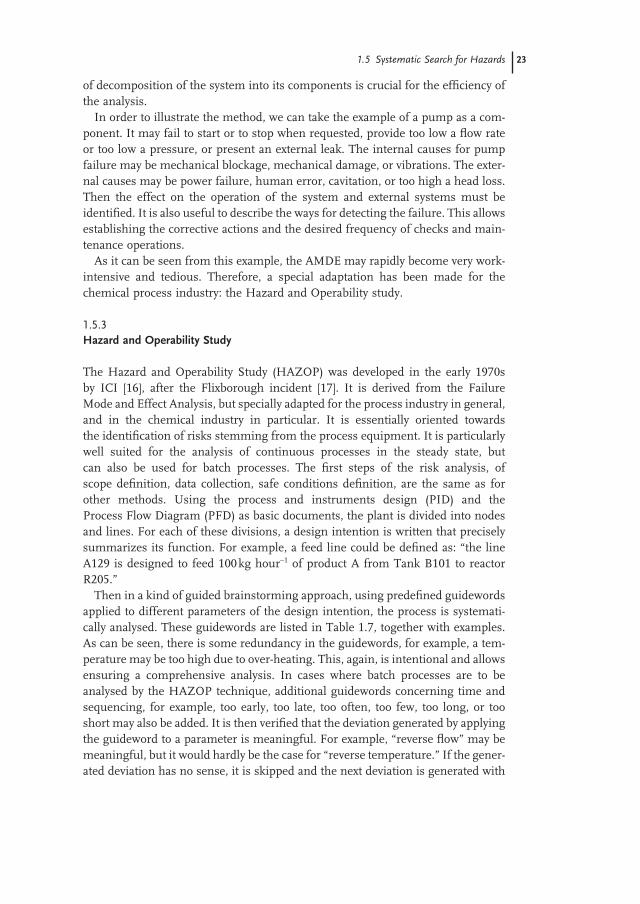
Then in a kind of guided brainstorming approach, using predefi ned guidewords applied to different parameters of the design intention, the process is systemati-cally analysed. These guidewords are listed in Table 1.7 , together with examples. As can be seen, there is some redundancy in the guidewords, for example, a tem-perature may be too high due to over - heating. This, again, is intentional and allows ensuring a comprehensive analysis. In cases where batch processes are to be analysed by the HAZOP technique, additional guidewords concerning time and sequencing, for example, too early, too late, too often, too few, too long, or too short may also be added. It is then verifi ed that the deviation generated by applying the guideword to a parameter is meaningful. For example, “ reverse fl ow ” may be meaningful, but it would hardly be the case for “ reverse temperature. ” If the gener-ated deviation has no sense, it is skipped and the next deviation is generated with
1.5 Systematic Search for Hazards 23
24 1 Introduction to Risk Analysis of Fine Chemical Processes
the next guideword. For traceability of the thoroughness of the analysis, it may be marked as not applicable, “ n.a. ”
For the meaningful deviations identifi ed by the procedure described above, the possible causes for triggering the deviation are systematically searched. As an example, possible causes for “ no fl ow ” may be an empty feed tank, a closed valve, an inadvertently open valve to another direction, a pump failure, a leak, and so on. In this context, it may be useful to indicate the logical relationship between the causes, such as where simultaneous failure of several elements is required in order to trigger the deviation. This is of great help for the assessment of the probability of occurrence.
The effects are searched in order to allow the assessment of the severity. These results are documented together with the risk evaluation and, where required, with risk - reducing measures in a hazard catalog, as presented in Figure 1.1 .
The analysis is performed on the totality of the nodes and lines defi ned by the division of the plant. This allows checking the comprehensiveness of the analysis. The HAZOP technique, as its name indicates, is not only devoted to the
Table 1.7 HAZOP guidewords with defi nitions and examples.
Guideword Defi nition Example
No/not Negation of the design intention. No part of the design intention is realized
No fl ow, no pressure, no agitation
Less Quantitative decrease, deviation from the specifi ed value towards lower value. This may refer to state variables as temperature, quantities, as well as to actions such as heating
Flow rate too low, temperature too low, reaction time too short
More Quantitative increase: deviation from the specifi ed value towards higher value. This may refer to state variables as temperature, quantities, as well as to actions such as heating
Flow rate too high, temperature too high, too much product
Part of Qualitative decrease: only part of the design intention is realized
Charging only a part of a predefi ned amount, omission of a compound at charging, reactor partly emptied
As well as Qualitative increase: the design intention is realized, but at the same time something else happens
Heating and feeding at the same time, raw material contaminated by impurity with catalytic effect
Reverse The design intention is reversed, logical opposite of design intention
Reversed fl ow, back fl ow, heating instead of cooling
Other/else Total substitution: The design intention is not realized, but something else happens instead
Heating instead of dosing, charging A instead of B, mix - up of chemicals
identifi cation of hazards, but also to the identifi cation of operability issues. In this frame, the hazard catalog also provides a list of possible symptoms for the early identifi cation of abnormal situations and remediation. Then it becomes an effi -cient tool for process design, especially for the design of automation systems and interlocks.
1.5.4 Decision Table
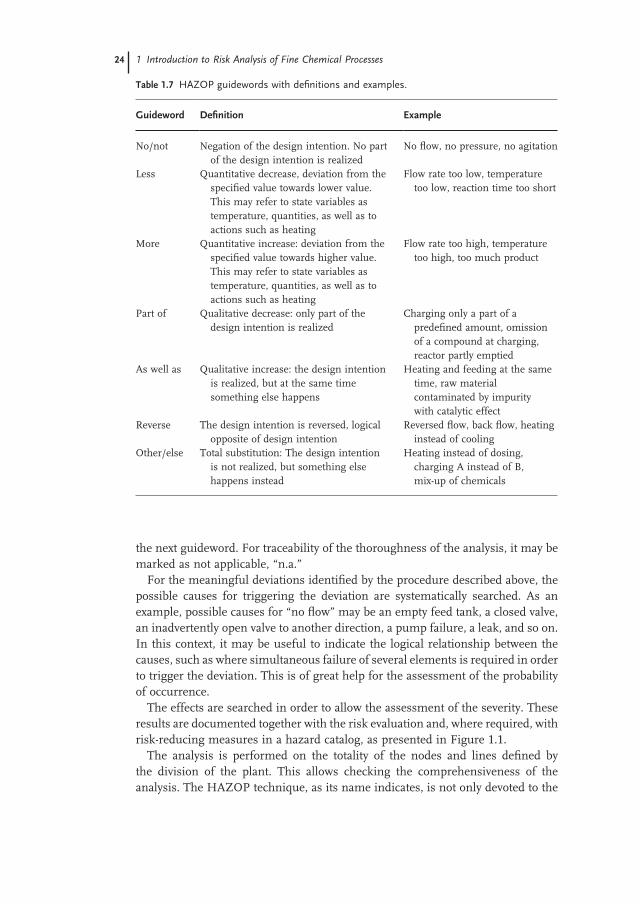
The decision table method consists of logically combining all possible states of each element of a system and outlining the consequences on the entire system. It can be applied to a part of a system or to an operating mode. The combinations are analysed by Boole ’ s algebra that gives the analysis a strong logical backbone. A part of such a decision table is shown by the example of the collision of a car with a deer (Figure 1.6 ). It is the most powerful method for analysing combina-tions of failures, exhaustive in this respect. Nevertheless, the combinations rapidly become so numerous that it is diffi cult to retain an overview of the system by this method. Thus, it has a more academic character.
Figure 1.6 Decision table for the collision of a car with a deer [8] .
1.5 Systematic Search for Hazards 25
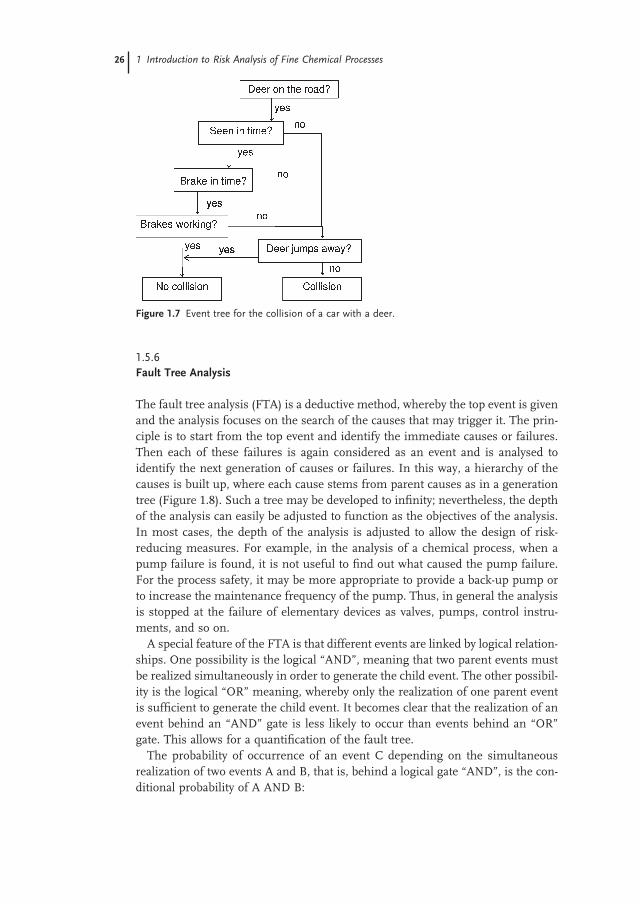
1.5.5 Event Tree Analysis
The event tree analysis ( ETA ) is an inductive method that starts from an initial event and searches for the different possible effects. It is especially useful for studying the scenario of what may happen after the initial event when developing emergency plans. Starting from the initial event, one searches for consecutive events, until the system reaches a fi nal state. These different generations of events are represented as a tree. An example, again based on the collision of a car with a deer, is represented in Figure 1.7 . The vertical lines leading from one event to the next are related in a logical “ AND ” relationship and the corresponding proba-bilities must be multiplied. Horizontal lines indicate a logical “ OR ” relationship and the corresponding probabilities must be added. Thus, the tree can be quanti-fi ed for the probability of entering one or the other branch after an event is known. Thus, it allows assessing quantitatively the effects of different possible chains of events and focuses the measures on the avoidance of the most critical chains.
26 1 Introduction to Risk Analysis of Fine Chemical Processes
1.5.6 Fault Tree Analysis
The fault tree analysis ( FTA ) is a deductive method, whereby the top event is given and the analysis focuses on the search of the causes that may trigger it. The prin-ciple is to start from the top event and identify the immediate causes or failures. Then each of these failures is again considered as an event and is analysed to identify the next generation of causes or failures. In this way, a hierarchy of the causes is built up, where each cause stems from parent causes as in a generation tree (Figure 1.8 ). Such a tree may be developed to infi nity; nevertheless, the depth of the analysis can easily be adjusted to function as the objectives of the analysis. In most cases, the depth of the analysis is adjusted to allow the design of risk - reducing measures. For example, in the analysis of a chemical process, when a pump failure is found, it is not useful to fi nd out what caused the pump failure. For the process safety, it may be more appropriate to provide a back - up pump or to increase the maintenance frequency of the pump. Thus, in general the analysis is stopped at the failure of elementary devices as valves, pumps, control instru-ments, and so on.
A special feature of the FTA is that different events are linked by logical relation-ships. One possibility is the logical “ AND ” , meaning that two parent events must be realized simultaneously in order to generate the child event. The other possibil-ity is the logical “ OR ” meaning, whereby only the realization of one parent event is suffi cient to generate the child event. It becomes clear that the realization of an event behind an “ AND ” gate is less likely to occur than events behind an “ OR ” gate. This allows for a quantifi cation of the fault tree.
The probability of occurrence of an event C depending on the simultaneous realization of two events A and B, that is, behind a logical gate “ AND ” , is the con-ditional probability of A AND B:
Figure 1.7 Event tree for the collision of a car with a deer.
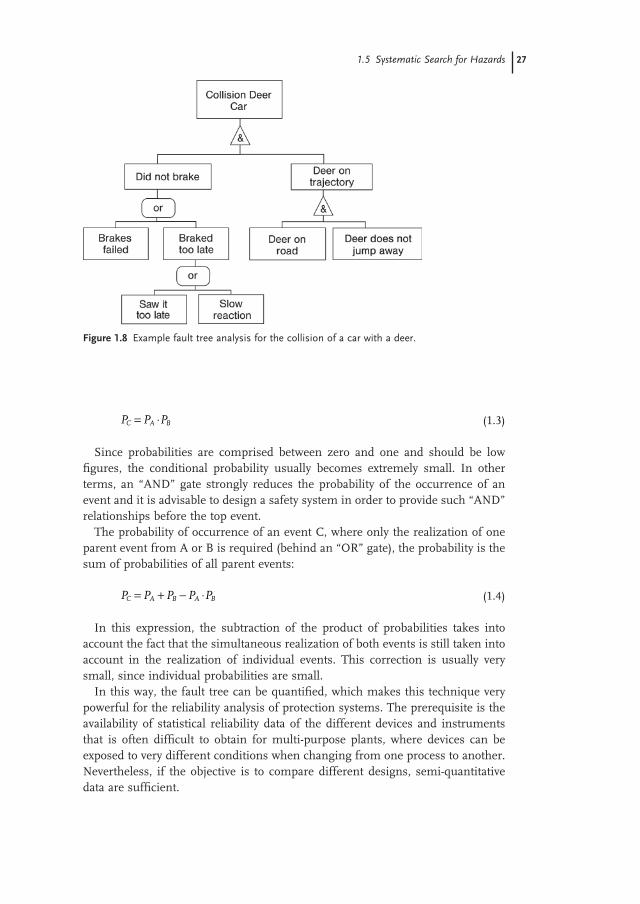
Figure 1.8 Example fault tree analysis for the collision of a car with a deer.
P P PC A B= ⋅ (1.3)
Since probabilities are comprised between zero and one and should be low fi gures, the conditional probability usually becomes extremely small. In other terms, an “ AND ” gate strongly reduces the probability of the occurrence of an event and it is advisable to design a safety system in order to provide such “ AND ” relationships before the top event.
The probability of occurrence of an event C, where only the realization of one parent event from A or B is required (behind an “ OR ” gate), the probability is the sum of probabilities of all parent events:
P P P P PC A B A B= + − ⋅ (1.4)
In this expression, the subtraction of the product of probabilities takes into account the fact that the simultaneous realization of both events is still taken into account in the realization of individual events. This correction is usually very small, since individual probabilities are small.
In this way, the fault tree can be quantifi ed, which makes this technique very powerful for the reliability analysis of protection systems. The prerequisite is the availability of statistical reliability data of the different devices and instruments that is often diffi cult to obtain for multi - purpose plants, where devices can be exposed to very different conditions when changing from one process to another. Nevertheless, if the objective is to compare different designs, semi - quantitative data are suffi cient.
1.5 Systematic Search for Hazards 27
28 1 Introduction to Risk Analysis of Fine Chemical Processes
1.6 Key Factors for a Successful Risk Analysis
The quality of a risk analysis depends essentially on three factors:
1. the systematic and comprehensive hazard identifi cation, 2. the experience of the risk analysis team members, 3. the quality and comprehensiveness of the data used during the analysis.
The hazard identifi cation methods presented in Sections 1.5.1 to 1.5.6 above are all based on strongly systematic procedures. In the check list method, the system-atic is provided by the check list itself. The comprehensiveness can be verifi ed in the matrix (see Figures 1.4 and 1.5 ). With the FMEA, the systematic is provided by the division of the system into elements and the failure modes considered. In the HAZOP study, the systematic stems from the division of the plant into nodes and lines, then the systematic application of the keywords. With the decision table method, the systematic is inherent to the table. For the FTA and ETA, the system-atic is given by the tree and the logical ports. Nevertheless, the work of the team must be traceable, even by persons who did not participate to the analysis. Thus, it is recommended to also document the hazards that were not considered as critical.
Obviously, the composition of the risk analysis team is of primary importance for the quality of the work. Here the professional experience of the participants plays a key role, since the objective of the analysis is to identify events that have not yet occurred. It is a creative task to identify the hazards, but also to defi ne risk - reducing measures. Thus, different professions must be represented in the team, including chemists, chemical engineers, engineers, automation engineers, and operators. When a new process is to be analysed, the experience gained during process development should be available to the team, hence members of the process development team must be represented in the risk analysis. The plant manager, who is the risk owner, takes a determining part in the analysis.
The team leader or moderator is responsible for the quality of the analysis; caring for its thoroughness, for discipline in the team, and for the time manage-ment. In the choice of risk - reducing measures, the moderator drives the group towards effi cient solutions. More generally, the group dynamics is important, so the participants should also be creative and open - minded. The moderator ensures that all opinions can be expressed, leading the team towards consensual solutions. It is advantageous that the moderator has a sound industrial experience and, if possible, some experience in dealing with risks or in incident analysis.
The risk analysis represents an important part of the process know how and therefore the hazards catalog (see Figure 1.1 ) cannot be a static document, but a part of the process documentation at the same level as the operating mode and mass balances. It may be useful to describe the risk - reducing measures together with the status, such as new, accepted, rejected, implemented, and so on. The hazard catalog then becomes a management tool and a living document, which must regularly be updated and accompany the process throughout its life. The list
References 29
of measures is a signifi cant part of the documentation, since it also describes the function of all safety relevant elements.
References
1 Hungerb ü hler , K. and Ranke , J. and Mettier , T. ( 1998 ) Chemische Produkte und Prozesse; Grundkonzepte zum Umweltorientierten Design , Springer , Berlin .
2 SUVA ( 2006 ) Unfallstatistik UVG 2005 , SUVA , Lucerne .
3 Laurent , A. ( 2003 ) S é curit é des proc é d é s chimiques, connaissances de base et m é thodes d ’ analyse de risques . Tec & Doc. Lavoisier , Paris .
4 Lees , F.P. ( 1996 ) Loss Prevention in the Process Industries Hazard Identifi cation Assessment and Control , 2nd edn , Vol 1 – 3, Butterworth - Heinemann , Oxford .
5 Stoessel , F. ( 2002 ) On risk acceptance in the industrial society . Chimia , 56 , 132 – 6 .
6 Jones , D. ( 1992 ) Nomenclature for Hazard and Risk Assessment in the Process Industries , 2nd edn ., Institution of Chemical Engineers , Rugby .
7 Rey , A. , ed. ( 1992 ) Le Robert dictionnaire d ’ aujourd ’ hui , Dictionnaires Le Robert , Paris .
8 Schmalz , F. ( 1996 ) Lecture script: Sicherheit und Industriehygiene , Z ü rich.
9 IEC ( 2004 ) Funktionale Sicherheit – Sicherheitstechnische Systeme f ü r die Prozessindustrie IEC 61511 , DIN VDE.
10 Hendershot , D.C. ( 1997 ) Inherently safer chemical process design . Journal of Loss Prevention in the Process Industries , 10 ( 3 ), 151 – 7 .
11 Kletz , T.A. ( 1996 ) Inherently safer design: the growth of an idea . Process Safety Progress , 15 ( 1 ), 5 – 8 .
12 Crowl , D.A. , ed. ( 1996 ) Inherently Safer Chemical Processes. A Life Cycle Approach , CCPS Concept book, Center for Chemical Process Safety , New York , p. 154 .
13 Sorbe , S. ( 2005 ) Kenndaten chemischer Stoffe , Ecomed Sicherheit , Landsberg .
14 Lewis , R.J. ( 2005 ) Sax ’ s Dangerous Properties of Industrial Materials , 11th edn , Reinhold , New York .
15 Villemeur , A. ( 1988 ) S û ret é de fonctionnement des syst è mes industriels , Eyrolles , Paris .
16 Kletz , T. ( 1992 ) Hazop and Hazan: Identifying and Assessing Process Industry Hazards , 3rd edn , Institution of Chemical Engineers , Rugby .
17 Kletz , T. ( 1988 ) Learning from Accidents in Industry , Butterworths , London .


![Thermal Behavior – I Chemical Processes & Transition State Theory [based on Chapter 6, Sholl & Steckel] From zero K to warmer situations! Kinetics of processes](https://img.pdfslide.us/doc/110x75/56649ee55503460f94bf3ec6/thermal-behavior-i-chemical-processes-transition-state-theory-based.jpg)