Embed Size (px)
Citation preview
https://doi.org/10.1007/s10836-020-05905-1
Part I: Evaluation for Hardware Trojan Detection Basedon Electromagnetic Radiation
Ting Su1 · Shaoqing Li1 · Yongkang Tang1 · Jihua Chen1
Received: 13 January 2020 / Accepted: 17 September 2020© Springer Science+Business Media, LLC, part of Springer Nature 2020
AbstractHardware Trojan (HT) is increasingly becoming a major threat in the filed of hardware security. Recently, researchers aretaking a high value on the side-channel countermeasures. Meanwhile, the electromagnetic radiation (EMR) based method isone of the most promising schemes to ensure whether integrated circuit (IC) is HT-infected or not. In this paper, we focus onthe ability evaluation for existing EMR based methods to implement the HT detection. We propose the noise model based onanalyses of noise sources during HT detection using EMR. Then, we study the effect caused by several types of noises in thismodel. According to these analyses, we discuss the limitation for EMR based methods in two special scenarios, and proposean evaluation scheme to evaluate the detection capability for using EMR analysis to identify HTs. Finally, we exemplify ourscheme with some experiments. Experimental results on FPGA show the effectiveness of EMR based methods as well astheir limitations.
Keywords Ability evaluation · Noise analysis · Electromagnetic radiation · Hardware trojan detection
1 Introduction
Along with the globalization of IC industry, HT [1, 32] hasstarted to gain attention. HT is a malicious modificationto a circuit, which could control, modify, or monitor thecontent and communications of IC [26]. Because most ofIC designers use the third-party intellectual protocol (IP)and outsource their designs to third-party foundries, some IPvendors and foundries can insert the HT into IC maliciously.Due to the imperceptibility of HT, it could be much harderto detect [19].
Responsible Editor: S. Bhunia
� Yongkang [email protected]
Ting [email protected]
Shaoqing [email protected]
Jihua [email protected]
1 College of Computer, National University of DefenseTechnology, Changsha, China
To solve that security threat caused by HT, academia hasproposed many countermeasures to detect and locate HT,such as reverse engineering [17, 34], functional test [7, 33]and side-channel analysis. Among these countermeasures,side-channel analysis techniques have emerged over thepast decade and have proved to be highly effective inextracting information about ICs from their power [1, 3],electromagnetic radiation [2, 8, 12, 13, 21, 27] as well asthermal radiation (TR) [28–30].
Dakshi et al. [1] firstly proposed a countermeasure usingside-channel analysis. Then, with the development of someEMR based HT detection methods, side-channel analysisbecomes the more promising countermeasure. In order toimplement the accurate HT detection, all of recent methodscompare the EMR information from the target IC with theIC fingerprinting [1, 2] from fabricated golden chips orother trusted references. In references [2, 21, 27], authorssimply calculated the absolute difference of EMR tracesbetween golden circuit and circuits under test, to identifyHT-infected IC. In addition, authors of the reference [8]further applied 2-D principal component analysis on EMRtraces and trained a back propagation neural network toimplement HT detection. Using this method, HTs largerthan 0.31% of the host-circuitry can be detected. Inreference [13], authors proposed that the simulated tracescan be used to implement HT detection through comparing
/ Published online: 14 October 2020
Journal of Electronic Testing (2020) 36:591–606

particular frequency spots. According to this idea, theyidentified 11 different types of HTs in Trust-Hub. Thenthey improved their method by neural network [12]. All ofthese methods are only to evaluate their detection abilitythrough the effectiveness of identifying certain types of HT.However, it cannot fully reflect their detection ability.
Admittedly, faint HT signals are prone to be merged invarious types of noises, including measurement noise, envi-ronment noise, process variation and other random signalvariation [1]. However, the types of noises described inthis reference are not complete, and the characteristic ofEMR based methods is not considered for the noise clas-sification. Therefore, it is significant to research the noisemodel for EMR based HT detection methods. Moreover,the connection between HT and noises also will become thekey to analysis limitations of EMR based methods.
In this paper, aiming at EMR analysis, we research itsnoise and ability evaluation for HT detection. We firstlyintroduce the theory of EMR based HT detection. Then, webuild a specialized noise model for EMR based methods.In addition, we discuss the influence of noises, and analyzeour evaluation scheme. Finally, according to the proposedscheme, we evaluate the detection ability of the EMR basedmethod in the actual experiments. To the best of our knowl-edge, there is no such work before trying to evaluate noisesand the detection ability for EMR based HT detection meth-ods. The contributions of this paper are listed as follows.
1) The physical mechanism of EMR analysis based HTdetection is used to analyze the components for noises,and to build the noise model.
2) The influence analysis of noises in noise model areused to research the limitation of EMR based methodsand the evaluation scheme.
3) The effectiveness and limitations of the EMR basedmethod is validated on FPGA, according to theproposed scheme.
The rest of this paper is organized as follows. Section 2introduces the principle of EMR based HT detectionmethods. Section 3 focuses on a variety of noise sources,builds our noise model, and analyzes the influence of eachnoise for HT detection. Section 4 discusses the limitationof EMR based methods in two special scenarios, andintroduces our evaluation scheme. Section 5 introduces ourexperiment, and evaluates the detection ability of EMRbased methods. Section 6 concludes this paper.
2 Background
In this section, we mainly introduce the detection mech-anism of some existing EMR based methods, and furtheranalyze their limitations.
2.1 Physical Mechanism
The basic theory of the EMR based method is Maxwell’sequations [22], and parts of the equations, which describethe process of electromagnetic conversion and magnetoelec-tric conversion, are shown as follow:∮
L
E · dl = −∫ ∫
S
∂B∂t
· dS∮
L
H · dl =∫ ∫
S
∂D∂t
· dS
Where, B and H are the magnetic flux density and themagnetic field strength, E and D are the electric fieldintensity and the electric displacement.
According to the definition of electric displacement andBiot-Savart law, B and D can be given by:
B = μ0
4π
∫L
Idl × rr3
D = εrε0E
Based on these, we can find that EMR arises as aconsequence of current flows (I ) and is related to itsfrequency. Therefore, for EMR analysis, there are twoimportant characteristics: EMR intensity and frequencydistribution. Then, there are two different ideals of EMRbased HT detection in two different dimensions: the timeand frequency domains. These EMR information can bemeasured by a near-field electric probe [24] or magneticprobe [27]. Meanwhile, the current has a correlation withlogical changes performed inside the chip, so each circuitblock works with its own current intensity and frequency.Then, the amount of EMR information of the entire chipis considerable [5]. Therefore, the chip should be dividedinto several blocks [27]. EMR can be measured in differentregions and analyzed respectively.
Evidently, the consequence of current flows inside targetregion will be changed, when a HT is inserted by third-party foundries or untrusted IP vendors. Then, the EMRinformation of the target region will be changed. Essentially,the HT in this paper is also circuits, so its EMR informationalso contains two characteristics: intensity and frequencydistribution. Its detection can be done not only in the timedomain but also in the frequency domain. Generally, a HTconsists of two parts, the trigger circuit and the payloadcircuit. The trigger circuit needs to be always operatingto monitor whether the payload circuit should be triggeredor not. The payload circuit is only active when triggersignal appears. Therefore, we mainly focus on the triggercircuit during EMR based HT detection. When the EMRchange caused by trigger circuits is strong enough so thatthe probe can measure it, we can find some abnormalEMR information and implement HT detection, through
592 J Electron Test (2020) 36:591–606

comparing the measured EMR from the infected region withthe EMR fingerprint.
2.2 ExistingMethods
In order to implement the accurate HT detection, reference[27] proposed a detection technique based on EMR of targetIC, using region-based partition. Authors divided the chipinto many regions and successfully identified HT whichaccounts for 0.68% of the circuit size of AES-128. Howeverthis detection method just focuses on the intensity differenceof each region. The detection is susceptible to the processvariation and electromagnetic interference (EMI), whichcan cause the difference of detection performance whenplacing HT in different locations.
Then reference [2] also implemented the HT detectionfollowing this approach. The author demonstrated that thismethod is able to detect the HT occupying 1.3% of the AESarea, but is unable to detect the extremely small HT whenreducing the HT from 1.3% to 0.1% of the whole circuit.The results of reference [21] show that, using this method,the probabilities to detect the HT occupying 0.5%, 1% and1.7% of the original circuit area are respectively 74%, 83%and 95%. Authors of reference [8] further proposed that2-D principal component analysis can be used for EMRtraces comparison, in order to eliminate the effect of noises.Their research show that there is a probability greater than88% to detect sequential HTs larger than 1.38% of the host-circuitry. Meanwhile, the detection rate for combinationHTs is greater than 78%, where the HT is larger than 0.31%of the original circuit.
According to the idea of spatial projection transfor-mation, in reference [13], authors proposed that turningEMR traces from time domain into frequency domain andcomparing particular frequency spots can be used to dealwith the influence caused by process variation. Meanwhile,instead of golden chips, they utilized the RTL design datafor EMR generation, serving as the golden reference in HTdetection. They successfully detected 11 of total sequentialHTs in Trust-Hub. Then, for improving the performance oftheir methods, they applied the neural network on identify-ing whether IC is HT-infected or not [12]. This frameworkcan distinguish even different types of HTs with an aver-aged 89.2% accuracy rate. But this simulation methodologyneglects some factors that may influence the EMR, likeEMI. Moreover, they only focus on the global EMR of targetchip.
To summarize, all of the existing EMR based methodsonly evaluate their detection ability based on the size ortypes of HT they can detect, and the noise model theyconsidered is incomplete. Meanwhile, they consider HT andnoise separately, which are not completely independent. Forexample, the EMR information of a specially designed HT
(triggered by some signals related to surrounding circuits)may be hidden into EMI noise. At this time, as we eliminateEMI noise, the effect of HT will also be reduced. These arenot conducive to evaluate the effectiveness and limitationfor the EMR based method. Therefore, it is imperative tocompletely consider the noise and its sources. Then, it isalso necessary to analyze the similarities and differences ofvarious types of noises and to establish the specialized noisemodel aiming at the EMR based HT detection. Throughanalyzing the influence of different noises, the limitationsof the EMR based method should be discussed. Finally,the evaluation scheme should be proposed to evaluate thedetection ability of the EMR based method. In the followingsections, we will complete these tasks.
3 Noise Analysis
In this section, we firstly analyze the noise sources duringthe HT detection and simply introduce the character of thesenoises based on their physical property. Then we build thenoise model through the noise source analysis. Finally, wediscuss the influence of these noises on HT detection.
3.1 Noise Source Analysis
Although EMR based methods can implement high-resolution HT detection, the detection result is susceptibleto various types of noises during the detection process.As shown in Fig. 1, these noises usually are derived fromthree different processes: the EMR measurement, the chipworking, and the fabrication of chips.
When measuring the EMR information of IC, the noisesmainly include environment noise and device noise, whereenvironment noise is mainly derived from cosmic noiseand atmosphere noise [31]. All of them obey normaldistribution, and the power spectral density is nearlyconstant throughout the frequency spectrum. Major noisesources in the signal measuring devices are thermal noise,shot noise, flicker noise and quantization noise. Thermalnoise is generated by the thermal agitation of the chargecarriers [16]. Shot noise originates from the discrete natureof electric charge [4]. Flicker noise is a type of electronicnoise and can show up with a variety of other effects like,impurities in a conductive channel [18]. These three typesof noises present in all electronic devices. A sequence ofquantization errors caused by the analog-to-digital converter(ADC) in oscilloscope is called quantization noise [11].All of them are the major noise sources in the EMRmeasurement process.
When chips work, although there are many randomnoises from thermal and flicker, the EMI [24] is the majornoise source there. Each current carrying component of
593J Electron Test (2020) 36:591–606

Fig. 1 Several types of noise sources
the circuit not only produces its radiation but also affectsthe radiation from other components due to coupling andcircuit structure [13]. Therefore, the EMR information ofcertain part of IC can be largely interfered by others.For example, the experimental results in references [2,27] indicate that if the HT is placed right next to somecircuits that already consume a significant amount of power,its EMR information will be merged in these circuit’s.Although some large HTs can also affect the EMR fromneighborhood of the HT regions and be easier to detect,the realistic HT is small and its side-channel information isfaint. Therefore, we consider the EMI as the major noisesource during the chip working.
Finally, the process variation is the main source of noisederived from the fabrication process of chips. Comparingwith other noises, process variation is the unavoidablemanufacturing deviation resulted from the silicon structuresand interconnects not being the intended dimensions.In reference [20], authors divided process variation intoseveral categories, which mainly manifest as die-to-die andwithin-die variation. The die-to-die variation represents thedifference between two chips. As a result, it is impossibleto fabricate two identical chips. The within-die variationrepresents the difference of two transistors in a chip. Thesecond variation is continuous and fainter than the former.As process technology scales to small feature sizes, it isincreasingly difficult to control fabrication precisely [25].Hence, the current will be impacted by the variation inthreshold voltage and channel-length [14]. Then the EMRinformation will also be impacted. In addition, the HTdetection methods using EMR analysis rely on a comparisonbetween the target chip and some trusted references. As aresult, HT signals may be merged in the difference of EMRinformation caused by process variation noise.
3.2 Noise Model
From the discussion in last subsection, it can be seen thatnoises are derived from the EMR measurement process,the chip working process, and the fabrication process of
chips. As shown in Fig. 1, noises in measurement processcan further be divided into environment noise (Nenvironment )and device noise (Ndevice). There are some random noises(Nrandom) and EMI noise (Ninterf erence) in the chip workingprocess. And the major noise in the fabrication process ofchips is process variation noise (Nprocess). In addition, all ofthese noises are additive noise [31]. Hence, a simple noisemodel can be given by the following equation:
Ntotal = Nenvironment + Ndevice + Nrandom +Ninterf erence + Nprocess
Where, Ntotal represents all of noises when detecting HTthrough EMR analysis.
Then, we need to classify the noise for the EMR basedmethod. Two characteristics of the EMR information thatwe analyzed in Section 2.1 are intensity and frequency.We will consider both the similarities and the differencesof these five types of noises from these two aspects. Theprevious equation should be changed to the equation below:
Ntotal = Nbackground + Ninterf erence + Nprocess
Firstly, we merged environment, device and some ran-dom noises into the background noise (Nbackground ). As weanalyzed in Section 3.1, their distribution in the frequencydomain is very random, and their influence can be con-trolled in a small range (it will be verified in Section 3.3.1).Then EMI noise and process variation noise are retained,because they have a great influence on the EMR analysisin the time domain. Meanwhile, their frequency distribu-tion is relatively fixed. However, they are different. Withthe different operating frequencies of surrounding circuits,the distribution of EMI in the frequency domain will alsobe different. But, process variation is fixed when the chipis produced, and the EMR difference caused by processvariation noise will mainly happen nearby 0Hz (it willbe analyzed in Section 3.3.3). Therefore, process variationnoise will not affect the frequency analysis of EMR.
In addition, for EMR based methods, one of the most keysteps is to compare the EMR information measured from
594 J Electron Test (2020) 36:591–606

target chip with the trusted reference. The components ofthe normal and the target EMR signal can be given by thefollowing equations. At this time, the normal EMR signal isthe trusted reference, and the target EMR signal is measuredfrom the chip inserted by HT.
Snormal = Scircuit + Sn background + Sn interf erence +Sn process
Starget = Scircuit + Sn background + Sn interf erence +Sn process + Strojan
Where, Scircuit and Starget respectively represent the normaland the target EMR signal. Scircuit is the EMR causedby the operation of normal circuits with typical processparameters. Strojan is the EMR caused by HT. Sn background ,Sn interf erence and Sn process respectively represent theinfluence caused by background noise, EMI noise andprocess variation noise.
As we discussed before, because of the randomness ofnoises, there are some EMR differences caused by noisesbetween above two formulas. If the IC is infected by HT, thedifference between target signal and reference signal can beexpressed as follow:
�Sdiff erence = �Sn background + �Sn interf erence +�Sn process + Strojan
Where, �Sdiff erence represents the difference between twosignals, �Sn backgroud , �Sn interf erence and �Sn process aredifferences caused by each noise.
If we want to make the HT signal so clear that we candistinguish it from noises, the effect of the HT signal mustbe greater than noises. The most effective way to achievethis goal is noise suppression. It is a necessary step for HTdetection using EMR analysis. But it only considers noisesand HT in isolation. In fact, they can establish a certainrelationship, so that the EMR change caused by the HT willalso be reduced while suppressing the noise. Therefore, wewill analyze the influence of these noises in our model andfurther explore how to connect them with HT.
3.3 Influence Analysis of Noises
Before introducing the evaluation, the influence of each typeof noises should be analyzed, using the previous signal-noise model in Section 3.2. This work can provide insightinto the effect of noises and the appropriate de-noisingmethods.
3.3.1 Background Noise
From the discussion in Section 3.2, it can be seen that majorsources of background noise obey normal distribution.
This conclusion is verified by the actual experiment. Wemeasured the actual EMR of background noise. One ofthe probability density function (PDF) of the 100 sets ofmeasured data is shown in Fig. 2. The red curve representsthe PDF of hypothetical normal distribution with the samemean and standard deviation as the actual data. The bluecurve is the PDF of actual data. We can find that these twocurves match well in Fig. 2. Moreover, the Jarque-Bera test[15] is used for goodness-of-fit test of normal distribution.The probability that the actual data pass the Jarque-Beratest is 75%. Therefore, the influence of EMR derived frombackground noise can be considered as normal distribution.
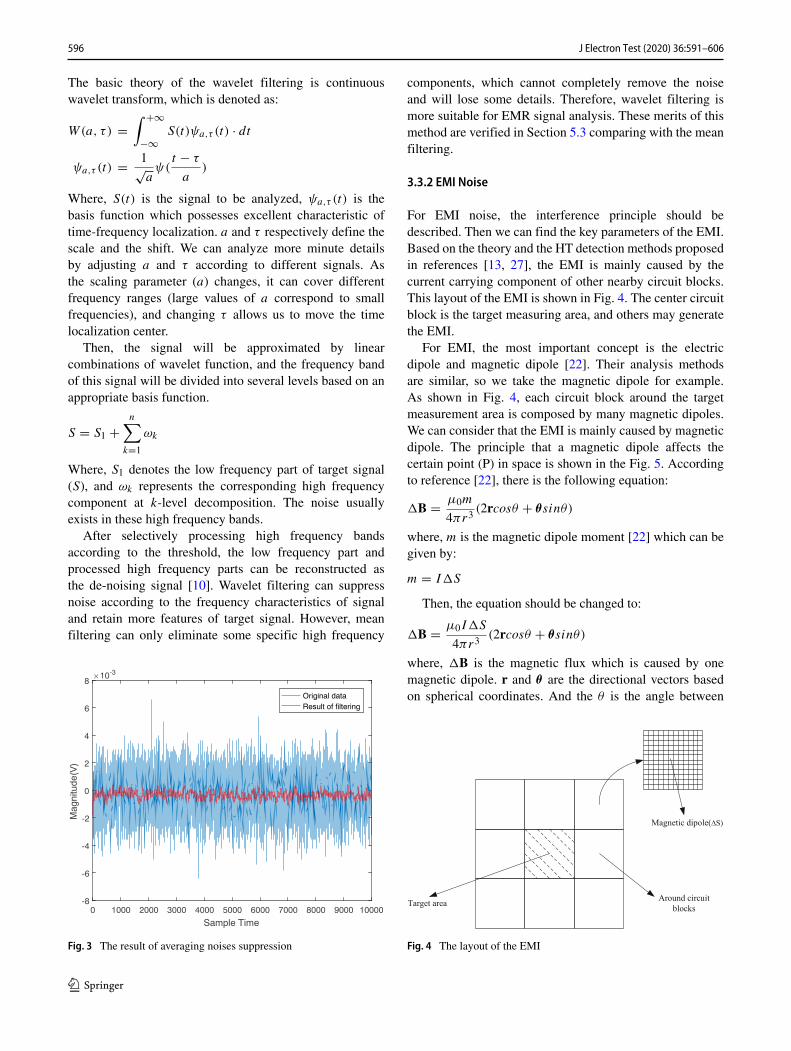
Obviously, according to this characteristic, the meanfiltering methods can be used to eliminate the effect ofbackground noise. We can utilize the mean which is simplycalculated after multiple consecutive sampling as the EMRdata of each region [27]. Or we can use the built-in meanalgorithm of the oscilloscope to reduce the noise. The resultof noise suppression is shown in Fig. 3. The blue curverepresents original data of background noise, and the redcurve is the result of mean filtering. The result indicates thateven with the simplest de-noising method, the backgroundnoise can be well suppressed.
Although the mean filtering is a simple and effectivede-noising approach for this noise, this method cannotdescribe the non-stationary characteristics of actual EMRsignal, which means that it will lose some details whilesmoothing the EMR curve. Therefore, some proper de-noising approaches should be used to do a better job inrecovery of the real EMR data when evaluating the detectionability. In this context, wavelet filtering [9] widely usedin non-stationary signal processing is of particular interest.
-6 -4 -2 0 2 4 6
Magnitude(V) 10-3
0
50
100
150
200
250
300
Actual PDFHypothetical PDF
Fig. 2 Matching PDF of background noise
595J Electron Test (2020) 36:591–606
The basic theory of the wavelet filtering is continuouswavelet transform, which is denoted as:
W(a, τ) =∫ +∞
−∞S(t)ψa,τ (t) · dt
ψa,τ (t) = 1√aψ(
t − τ
a)
Where, S(t) is the signal to be analyzed, ψa,τ (t) is thebasis function which possesses excellent characteristic oftime-frequency localization. a and τ respectively define thescale and the shift. We can analyze more minute detailsby adjusting a and τ according to different signals. Asthe scaling parameter (a) changes, it can cover differentfrequency ranges (large values of a correspond to smallfrequencies), and changing τ allows us to move the timelocalization center.
Then, the signal will be approximated by linearcombinations of wavelet function, and the frequency bandof this signal will be divided into several levels based on anappropriate basis function.
S = S1 +n∑
k=1
ωk
Where, S1 denotes the low frequency part of target signal(S), and ωk represents the corresponding high frequencycomponent at k-level decomposition. The noise usuallyexists in these high frequency bands.
After selectively processing high frequency bandsaccording to the threshold, the low frequency part andprocessed high frequency parts can be reconstructed asthe de-noising signal [10]. Wavelet filtering can suppressnoise according to the frequency characteristics of signaland retain more features of target signal. However, meanfiltering can only eliminate some specific high frequency
0 1000 2000 3000 4000 5000 6000 7000 8000 9000 10000
Sample Time
-8
-6
-4
-2
0
2
4
6
8
Mag
nitu
de(V
)
10-3
Original dataResult of filtering
Fig. 3 The result of averaging noises suppression
components, which cannot completely remove the noiseand will lose some details. Therefore, wavelet filtering ismore suitable for EMR signal analysis. These merits of thismethod are verified in Section 5.3 comparing with the meanfiltering.
3.3.2 EMI Noise
For EMI noise, the interference principle should bedescribed. Then we can find the key parameters of the EMI.Based on the theory and the HT detection methods proposedin references [13, 27], the EMI is mainly caused by thecurrent carrying component of other nearby circuit blocks.This layout of the EMI is shown in Fig. 4. The center circuitblock is the target measuring area, and others may generatethe EMI.
For EMI, the most important concept is the electricdipole and magnetic dipole [22]. Their analysis methodsare similar, so we take the magnetic dipole for example.As shown in Fig. 4, each circuit block around the targetmeasurement area is composed by many magnetic dipoles.We can consider that the EMI is mainly caused by magneticdipole. The principle that a magnetic dipole affects thecertain point (P) in space is shown in the Fig. 5. Accordingto reference [22], there is the following equation:
�B = μ0m
4πr3(2rcosθ + θsinθ)
where, m is the magnetic dipole moment [22] which can begiven by:
m = I�S
Then, the equation should be changed to:
�B = μ0I�S
4πr3(2rcosθ + θsinθ)
where, �B is the magnetic flux which is caused by onemagnetic dipole. r and θ are the directional vectors basedon spherical coordinates. And the θ is the angle between
Fig. 4 The layout of the EMI
596 J Electron Test (2020) 36:591–606
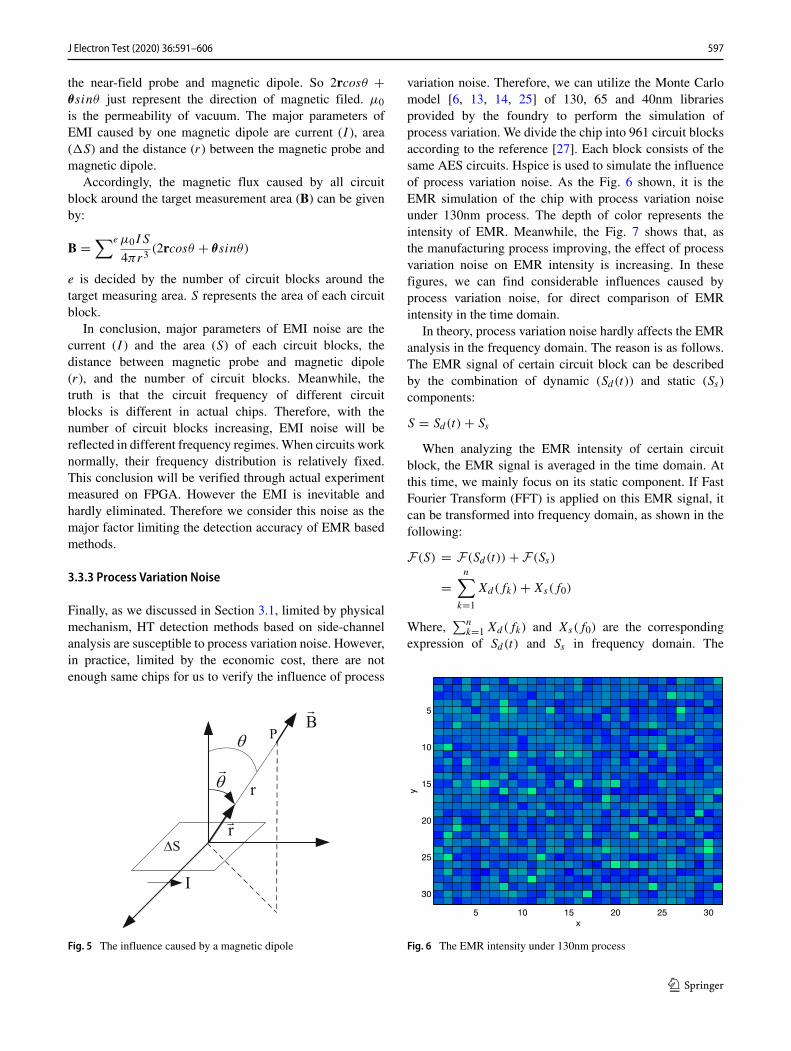
the near-field probe and magnetic dipole. So 2rcosθ +θsinθ just represent the direction of magnetic filed. μ0
is the permeability of vacuum. The major parameters ofEMI caused by one magnetic dipole are current (I ), area(�S) and the distance (r) between the magnetic probe andmagnetic dipole.
Accordingly, the magnetic flux caused by all circuitblock around the target measurement area (B) can be givenby:
B =∑e μ0IS
4πr3(2rcosθ + θsinθ)
e is decided by the number of circuit blocks around thetarget measuring area. S represents the area of each circuitblock.
In conclusion, major parameters of EMI noise are thecurrent (I ) and the area (S) of each circuit blocks, thedistance between magnetic probe and magnetic dipole(r), and the number of circuit blocks. Meanwhile, thetruth is that the circuit frequency of different circuitblocks is different in actual chips. Therefore, with thenumber of circuit blocks increasing, EMI noise will bereflected in different frequency regimes.When circuits worknormally, their frequency distribution is relatively fixed.This conclusion will be verified through actual experimentmeasured on FPGA. However the EMI is inevitable andhardly eliminated. Therefore we consider this noise as themajor factor limiting the detection accuracy of EMR basedmethods.
3.3.3 Process Variation Noise
Finally, as we discussed in Section 3.1, limited by physicalmechanism, HT detection methods based on side-channelanalysis are susceptible to process variation noise. However,in practice, limited by the economic cost, there are notenough same chips for us to verify the influence of process
Fig. 5 The influence caused by a magnetic dipole
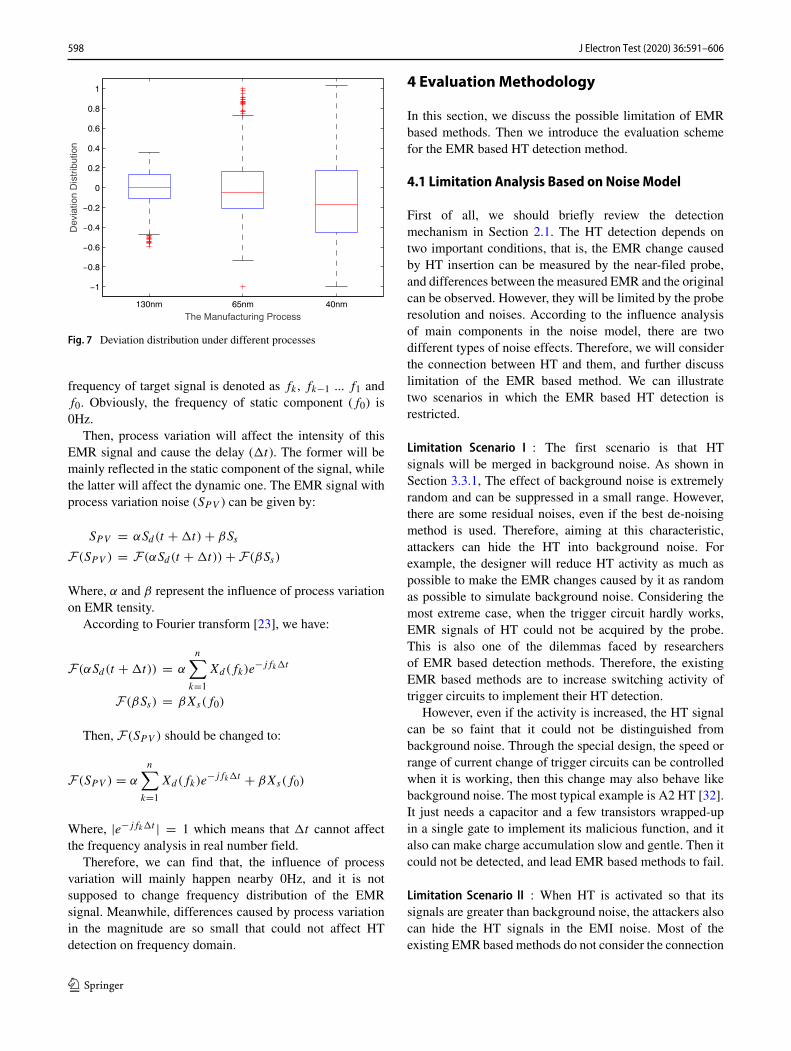
variation noise. Therefore, we can utilize the Monte Carlomodel [6, 13, 14, 25] of 130, 65 and 40nm librariesprovided by the foundry to perform the simulation ofprocess variation. We divide the chip into 961 circuit blocksaccording to the reference [27]. Each block consists of thesame AES circuits. Hspice is used to simulate the influenceof process variation noise. As the Fig. 6 shown, it is theEMR simulation of the chip with process variation noiseunder 130nm process. The depth of color represents theintensity of EMR. Meanwhile, the Fig. 7 shows that, asthe manufacturing process improving, the effect of processvariation noise on EMR intensity is increasing. In thesefigures, we can find considerable influences caused byprocess variation noise, for direct comparison of EMRintensity in the time domain.
In theory, process variation noise hardly affects the EMRanalysis in the frequency domain. The reason is as follows.The EMR signal of certain circuit block can be describedby the combination of dynamic (Sd(t)) and static (Ss)components:
S = Sd(t) + Ss
When analyzing the EMR intensity of certain circuitblock, the EMR signal is averaged in the time domain. Atthis time, we mainly focus on its static component. If FastFourier Transform (FFT) is applied on this EMR signal, itcan be transformed into frequency domain, as shown in thefollowing:
F(S) = F(Sd(t)) + F(Ss)
=n∑
k=1
Xd(fk) + Xs(f0)
Where,∑n
k=1 Xd(fk) and Xs(f0) are the correspondingexpression of Sd(t) and Ss in frequency domain. The
x
y
5 10 15 20 25 30
5
10
15
20
25
30
Fig. 6 The EMR intensity under 130nm process
597J Electron Test (2020) 36:591–606
130nm 65nm 40nm
−1
−0.8
−0.6
−0.4
−0.2
0
0.2
0.4
0.6
0.8
1
The Manufacturing Process
Dev
iatio
n D
istr
ibut
ion
Fig. 7 Deviation distribution under different processes
frequency of target signal is denoted as fk , fk−1 ... f1 andf0. Obviously, the frequency of static component (f0) is0Hz.
Then, process variation will affect the intensity of thisEMR signal and cause the delay (�t). The former will bemainly reflected in the static component of the signal, whilethe latter will affect the dynamic one. The EMR signal withprocess variation noise (SPV ) can be given by:
SPV = αSd(t + �t) + βSs
F(SPV ) = F(αSd(t + �t)) + F(βSs)
Where, α and β represent the influence of process variationon EMR tensity.
According to Fourier transform [23], we have:
F(αSd(t + �t)) = α
n∑k=1
Xd(fk)e−jfk�t
F(βSs) = βXs(f0)
Then, F(SPV ) should be changed to:
F(SPV ) = α
n∑k=1
Xd(fk)e−jfk�t + βXs(f0)
Where, |e−jfk�t | = 1 which means that �t cannot affectthe frequency analysis in real number field.
Therefore, we can find that, the influence of processvariation will mainly happen nearby 0Hz, and it is notsupposed to change frequency distribution of the EMRsignal. Meanwhile, differences caused by process variationin the magnitude are so small that could not affect HTdetection on frequency domain.
4 EvaluationMethodology
In this section, we discuss the possible limitation of EMRbased methods. Then we introduce the evaluation schemefor the EMR based HT detection method.
4.1 Limitation Analysis Based on Noise Model
First of all, we should briefly review the detectionmechanism in Section 2.1. The HT detection depends ontwo important conditions, that is, the EMR change causedby HT insertion can be measured by the near-filed probe,and differences between the measured EMR and the originalcan be observed. However, they will be limited by the proberesolution and noises. According to the influence analysisof main components in the noise model, there are twodifferent types of noise effects. Therefore, we will considerthe connection between HT and them, and further discusslimitation of the EMR based method. We can illustratetwo scenarios in which the EMR based HT detection isrestricted.
Limitation Scenario I : The first scenario is that HTsignals will be merged in background noise. As shown inSection 3.3.1, The effect of background noise is extremelyrandom and can be suppressed in a small range. However,there are some residual noises, even if the best de-noisingmethod is used. Therefore, aiming at this characteristic,attackers can hide the HT into background noise. Forexample, the designer will reduce HT activity as much aspossible to make the EMR changes caused by it as randomas possible to simulate background noise. Considering themost extreme case, when the trigger circuit hardly works,EMR signals of HT could not be acquired by the probe.This is also one of the dilemmas faced by researchersof EMR based detection methods. Therefore, the existingEMR based methods are to increase switching activity oftrigger circuits to implement their HT detection.
However, even if the activity is increased, the HT signalcan be so faint that it could not be distinguished frombackground noise. Through the special design, the speed orrange of current change of trigger circuits can be controlledwhen it is working, then this change may also behave likebackground noise. The most typical example is A2 HT [32].It just needs a capacitor and a few transistors wrapped-upin a single gate to implement its malicious function, and italso can make charge accumulation slow and gentle. Then itcould not be detected, and lead EMR based methods to fail.
Limitation Scenario II : When HT is activated so that itssignals are greater than background noise, the attackers alsocan hide the HT signals in the EMI noise. Most of theexisting EMR based methods do not consider the connection
598 J Electron Test (2020) 36:591–606

between HT and EMI noise. However, the attacker canutilize some signals whose EMR characteristics are similarwith the circuits around HT, to adjust the HT’s frequency.Then its characteristic frequencies will be spread acrossmultiple frequency regions. From the principle of EMR, wecan know that the EMR intensity is related to the powerof the circuit block. Therefore, we can replace some of thesignals it monitors with signals related to the surroundingcircuits, and make the EMR intensity changes little. Atthis time, as we eliminate EMI noise, the effect of HTwill also be reduced. Then, its signals may be merged inEMI noise.
In addition, according to the analysis in Section 3.3.2,we can find that the frequency distribution of EMI noise isrelatively fixed and its influence is considerable. EMI noisealso has some randomness, because the surrounding circuitis also affected by random noise, and the repeatabilityof probe positioning can also introduce randomness.Therefore, EMR noise is suitable for hiding HT.
4.2 Evaluation Scheme
As what has been discussed in Section 2.2, we shouldfurther evaluate the detection ability for EMR basedmethods instead of just considering the types of HT theycan detect. Meanwhile, the existing EMR based methodsare to consider HT and noise separately. They believe thatsuppressing the noise as much as possible can implementthe HT detection. But, in practice, they are not completelyindependent. Therefore, two special scenarios we consider,are that HT and the noise can be connected. The influencearising from HT will also be reduced, while suppressing thenoise.
Based on previous analyses of EMR based HT detection,our evaluation scheme, as shown in Fig. 8, can beintroduced. The proposed scheme consists of two parts:effectiveness and limitation evaluation. The latter will befurther divided into two scenarios. Therefore, we shouldevaluate the EMR based method in three steps.
Firstly, we consider the general situation to validate thedetection effectiveness of EMR based methods. In this case,we follow existing methods to improve the HT activity asmuch as possible, and consider HT and the noise separately.At this time, we evaluate whether EMR based detectionmethods can successfully identify various types of HT fromthe noise under the normal condition.
Secondly, we consider the connection between HT andbackground noise. At this time, we evaluate whether EMRbased methods can implement the HT detection when HTbehaves like background noise. In order to evaluate thelimitation of EMR based HT detection in this specialscenario, we will reduce the HT activity as much aspossible. However, it is out of this paper’s scope to research
how much switch activity is required to prevent the HTdetection.
Finally, we evaluate the detection limitation of EMRbased methods in another special scenario. We will increasethe HT activity, but use the signals of the surroundingcircuits to disperse the HT characteristic in the frequencydomain into EMI noise. Here we evaluate whether EMRbased HT detection will fail under this condition.
In the next section, we will provide an evaluationexample based on actual experiments to verify therationality of our evaluation scheme.
5 Experiment and Evaluation
In this section, we simply introduce our experimentalenvironment. The influence of EMI noise should be firstlyverified on this experimental environment. Then we validatethe effectiveness of the HT detection method using EMRanalysis on FPGA. Finally, we evaluate limitations of thedetection ability for EMR based methods in two scenarios.
5.1 Experiment Environment
Firstly, the experimental setup should be introduced whichconsists of three major parts: FPGAs, the near-filed probeand the oscilloscope. Xilinx Spartan-3E XC3S50 FPGAsare used to implement our experiments. Their configurablelogic blocks (CLBs) contain flexible look-up tables (LUTs)and can perform a wide variety of logical functions [32].The AES benchmark can be implemented with the CLBsand constrained by PlanAhead in a fixed layout. Theincremental compilation is used for adding the HT to forma new layout without changing previous fixed layout. A setof NFP-3 near field probe is utilized. They can measure thefrequency that ranges from 30MHz to 3GHz. The NFP-3-P4 magnetic probe is placed right above the surface of theFPGA to measure EMR. After acquiring EMR informationby the probe, this information is captured by a TektronixTDS3052C oscilloscope whose acquisition frequency is upto 500MHz, and is transferred to the control computer forfurther analysis.
Then, the experimental design should be introducedwhich consists of two major parts: the verified experimentof EMI noise influence and ability evaluation experiments.The latter will include effectiveness and limitation evalua-tion according to our scheme shown in Section 4.2.
For experiment I, in order to completely exclude theinfluence of other noises, these experiments are performedon the same FPGA. The AES circuits are layout around thetarget measured area.
For experiment II, one FPGA is configured with the pureAES circuit to mimic the pure chips. Other FPGAs are
599J Electron Test (2020) 36:591–606
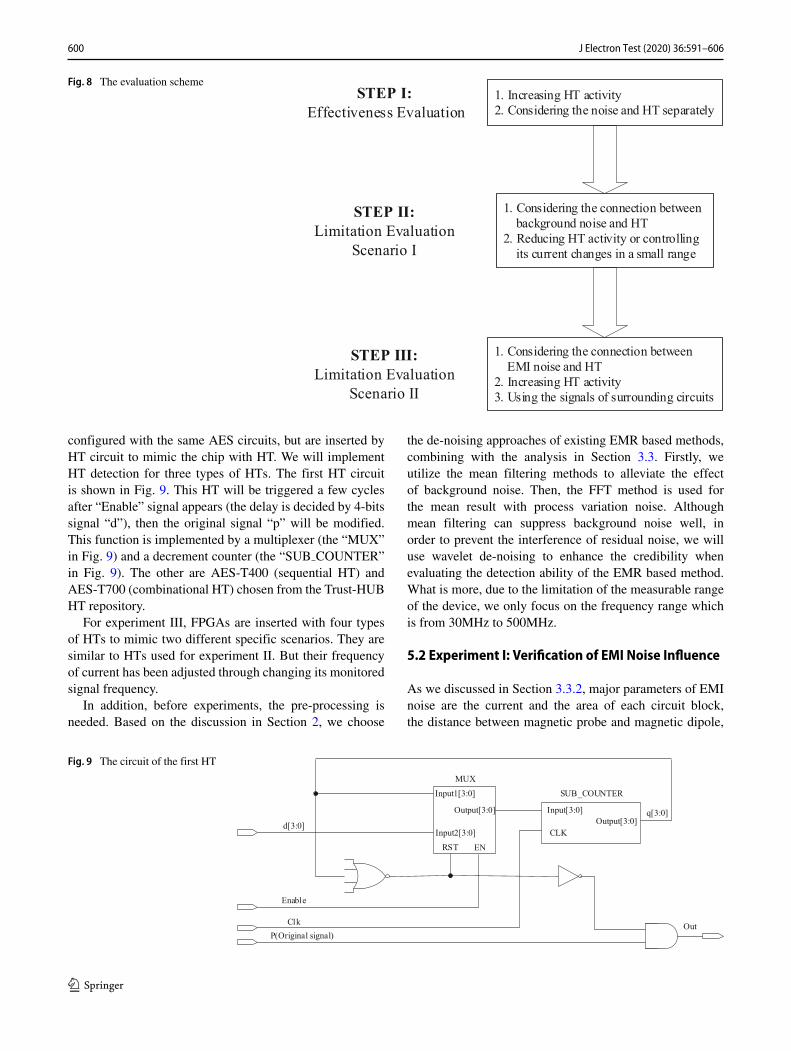
Fig. 8 The evaluation scheme
configured with the same AES circuits, but are inserted byHT circuit to mimic the chip with HT. We will implementHT detection for three types of HTs. The first HT circuitis shown in Fig. 9. This HT will be triggered a few cyclesafter “Enable” signal appears (the delay is decided by 4-bitssignal “d”), then the original signal “p” will be modified.This function is implemented by a multiplexer (the “MUX”in Fig. 9) and a decrement counter (the “SUB COUNTER”in Fig. 9). The other are AES-T400 (sequential HT) andAES-T700 (combinational HT) chosen from the Trust-HUBHT repository.
For experiment III, FPGAs are inserted with four typesof HTs to mimic two different specific scenarios. They aresimilar to HTs used for experiment II. But their frequencyof current has been adjusted through changing its monitoredsignal frequency.
In addition, before experiments, the pre-processing isneeded. Based on the discussion in Section 2, we choose
the de-noising approaches of existing EMR based methods,combining with the analysis in Section 3.3. Firstly, weutilize the mean filtering methods to alleviate the effectof background noise. Then, the FFT method is used forthe mean result with process variation noise. Althoughmean filtering can suppress background noise well, inorder to prevent the interference of residual noise, we willuse wavelet de-noising to enhance the credibility whenevaluating the detection ability of the EMR based method.What is more, due to the limitation of the measurable rangeof the device, we only focus on the frequency range whichis from 30MHz to 500MHz.
5.2 Experiment I: Verification of EMI Noise Influence
As we discussed in Section 3.3.2, major parameters of EMInoise are the current and the area of each circuit block,the distance between magnetic probe and magnetic dipole,
Fig. 9 The circuit of the first HT
600 J Electron Test (2020) 36:591–606

and the number of circuit blocks. At first, we can findthat in references [2, 5, 27], these circuit blocks have thesame area for the same type of chips. Then the positionbetween magnetic probe and target chip is fixed. In order tocompletely control the influence of process variation noise,the FFT method is used for our experiment. So we careabout the frequency of current (f ). In our actual experiment,controlled experiments are used to verify the influence ofthe current frequency, the distance between the target areaand other circuit blocks around it, and circuit numbers forEMI noise.
To begin with, it is kept for the distance betweentarget circuit block and each circuit block around it. Theexperiment result is shown in Fig. 10, which includes theEMI influence of three circuit blocks. In this figure, the bluecurve is frequency distribution of EMI noise, and the EMRaround 62MHz, 128.5MHz and 309MHz are respectivelycaused by three different circuit blocks. In addition, the redcurve represent that there is only the HT in target circuit.
From this figure, we can find that these added circuitblocks around the target area can complicate the frequencyspectra, and then can affect the EMR based HT detection.This impact will be reflected in evaluation experiments ofdetection ability.
Then we change the distance between the target circuitblock and each circuit block around it. In this experiment,the type of circuit blocks is unchanged. But there aretwo distances between the target block and other blocks.In addition, this experiment is used to verify the EMInoise influence for HT detection through EMR analysis.Therefore, the HT circuit shown in Fig. 9 should be insertedinto target area. As the Fig. 11a and b shown, the EMR ofthe HT circuit is mainly reflected around 76.5MHz, and the
0.5 1 1.5 2 2.5 3 3.5 4 4.5 5
x 108
0
1
2
3
4
5
6
7
8x 10
−5
Frequency(Hz)
Mag
nitu
de(V
)
Only TrojanEMI noises
Fig. 10 The frequency distribution of EMI noise
distance change has little impact on it. Because the distancein the previous figure is closer than in the latter, it is clearthat the amplitudes of noise frequency regimes in the formerare lower than in the latter.
From another perspective, we can also use the Signalto Noise Ratio (SNR) to compare the influence betweentwo distances for HT detection. The SNR can be computedthrough the follow equation:
SNR = 10 lgS2
HT
S2noise
Where, the SHT represents the influence caused by HT,and the Snoise represents the influence caused by noisesignals. The results are shown in Table 1. The results aresimilar with the conclusion of Fig. 11.
0.5 1 1.5 2 2.5 3 3.5 4 4.5 5
x 108
0
1
2
3
4
5
6
7
8x 10
−5
Frequency(Hz)
Mag
nitu
de(V
)
(a)
0.5 1 1.5 2 2.5 3 3.5 4 4.5 5
x 108
0
1
2
3
4
5
6
7
8x 10
−5
Frequency(Hz)
Mag
nitu
de(V
)
(b)
Fig. 11 The EMI influence of different distance
601J Electron Test (2020) 36:591–606

Table 1 The results of SNRScenarios Experiment I: Fig. 11a Experiment I: Fig. 11b
SNR –16.64 –17.19
Scenarios Experiment II: Experiment II Experiment II Experiment II
Wavelet filtering (First HT) (AES-T400) (AES-T700)
SNR –14.34 0.94 2.19 1.84
Scenarios Experiment III Experiment III Experiment III Experiment III
(Low Activity HT) (HT I) (HT II) (HT III)
SNR –10.70 –11.06 –9.47 –10.76
From the results of these analysis above, the majorparameters of EMI noise are the current frequency, thedistance between the target area and other circuit blocksaround it, and the number of circuit blocks. The currentfrequency and the number of circuit blocks can affect thecomplexity of the frequency spectra. The distance can affectthe amplitudes of these noise frequency regimes. However,we find that the EMI noise influence is relatively definite,so it can be controlled by using the difference method. Thisconclude will be verified in the next experiment.
5.3 Experiment II: Effectiveness Evaluation
Combining with all previous analyses, HT detection canbe implemented through EMR analysis. Based on theexperimental condition in Fig. 11a, the result of wavelet de-noising is shown in Fig. 12. Comparing these two figures, itis obvious that wavelet filtering can suppress noises betterthan mean filtering. In Fig. 12, there are fewer frequencybands where noise appears, and the magnitude of EMI noiseis reduced, while the useful details of EMR signal (around
0.5 1 1.5 2 2.5 3 3.5 4 4.5 5
x 108
0
1
2
3
4
5
6
7
8x 10
−5
Frequency(Hz)
Mag
nitu
de(V
)
Fig. 12 De-noising result of wavelet filtering
76.5MHz and 100MHz) are more completely retained. Inaddition, comparing the SNR in Table 1, we can come toa similar conclusion. These results are consistent with ouranalyses in Section 3.3.1.
Detection result are shown in Fig. 13, in which the redcircle indicates the EMR frequency of HT insertion. InFig. 13a, the major EMR of the first HT (shown in Fig. 9)distributes around 76.5MHz and 100MHz. It is worth notingthat the positive peaks around 105MHz and 310MHz arecaused by the frequency skewing of EMI noise. In thedetection result of AES-T400 (shown in Fig. 13b), its EMRdistributes around 184.5MHz, 227.5MHz and 256.5MHz.The Fig. 13c shows that the EMR of AES-T700 distributesaround 95.5MHz and 172MHz. They clearly prove thatHT detection can be effectively implemented through EMRanalysis.
Before the calculation of SNR, we have to deal with theevidently abnormal amplitude fluctuations caused by thefrequency skewing. Then the result is shown in Table 1. It isclear that the SNR of this experiment is higher than others.
5.4 Experiment III: Limitation Evaluation
The last experiment in this paper is used to evaluate thelimitation. According to the analyses in Section 4.2, wewill consider the connection between HT and the noise, andillustrate these special scenarios. Because detection resultsof scenario I are similar. We only show one of detectionresults, in which the circuit shown in Fig. 9, but with aslow current frequency. In scenario II, we modify the HT ofFig. 9 (HT I), AES-T400 (HT II) and AES-T700 (HT III),according to our evaluation scheme.
5.4.1 Scenario I
The first scenario is that HT signals will be merged inbackground noise. As shown in Fig. 14, it is the resultof comparing the EMR caused by HT circuits with EMRcaused by background noise.
In this figure, we could hardly find the characteristicfrequencies in this frequency spectra. Therefore, we must
602 J Electron Test (2020) 36:591–606
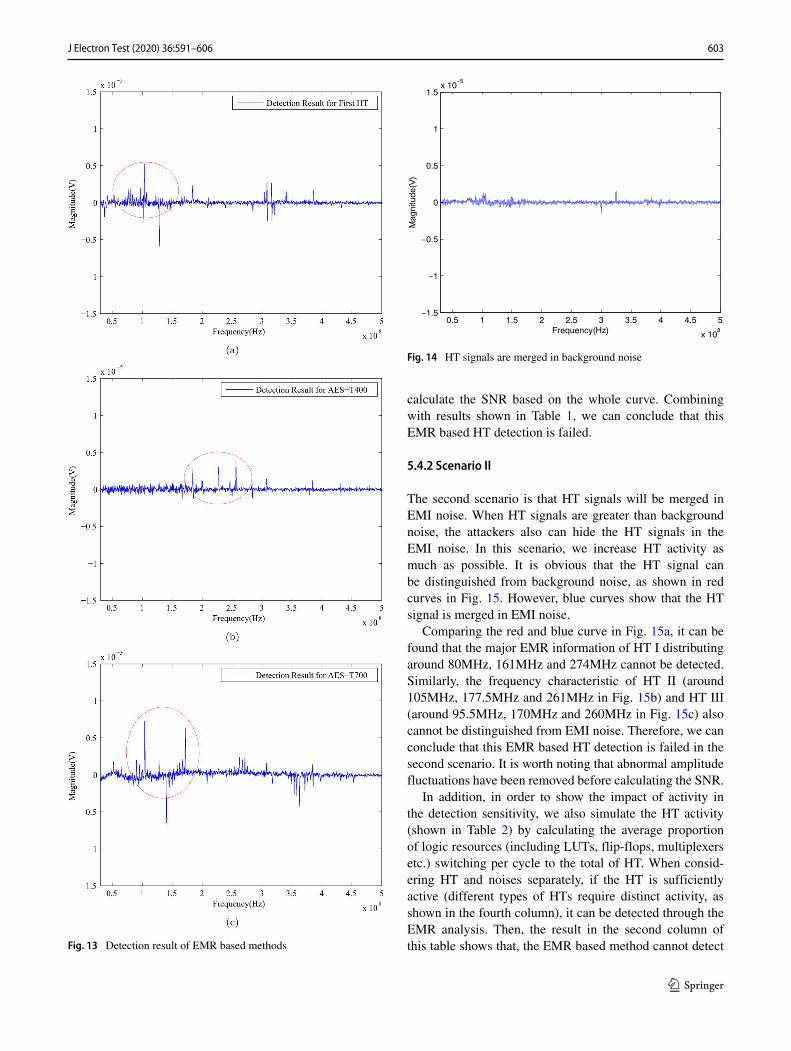
Fig. 13 Detection result of EMR based methods
0.5 1 1.5 2 2.5 3 3.5 4 4.5 5
x 108
−1.5
−1
−0.5
0
0.5
1
1.5x 10
−5
Frequency(Hz)
Mag
nitu
de(V
)
Fig. 14 HT signals are merged in background noise
calculate the SNR based on the whole curve. Combiningwith results shown in Table 1, we can conclude that thisEMR based HT detection is failed.
5.4.2 Scenario II
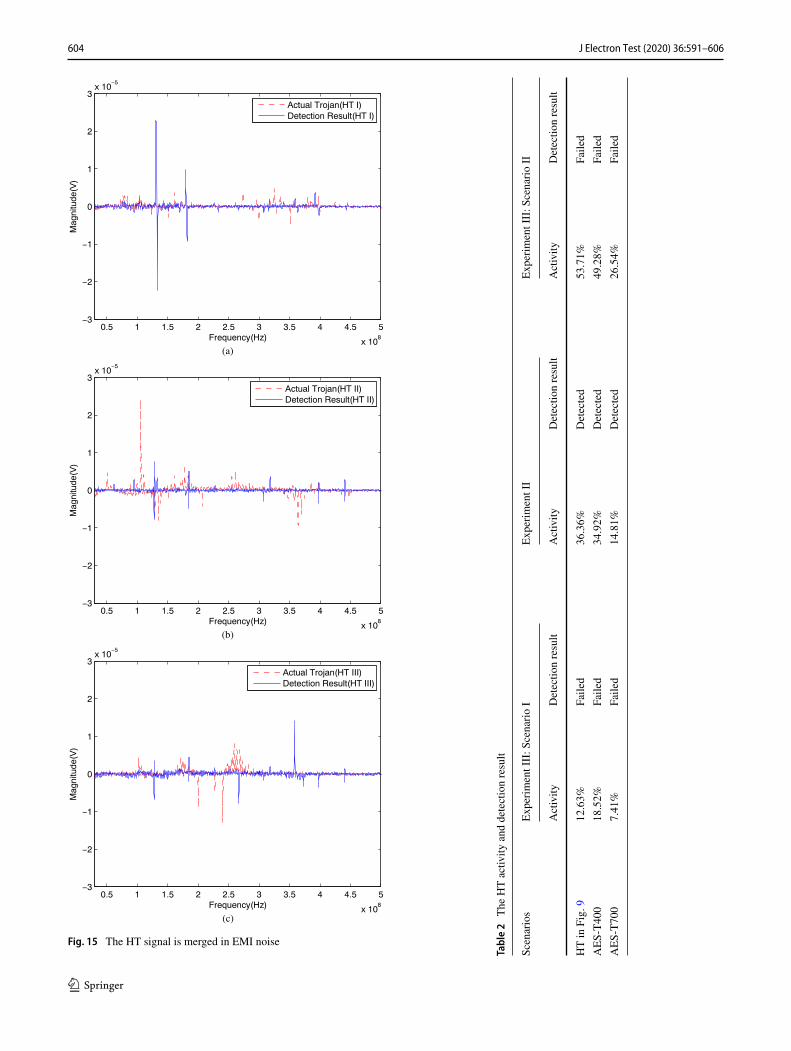
The second scenario is that HT signals will be merged inEMI noise. When HT signals are greater than backgroundnoise, the attackers also can hide the HT signals in theEMI noise. In this scenario, we increase HT activity asmuch as possible. It is obvious that the HT signal canbe distinguished from background noise, as shown in redcurves in Fig. 15. However, blue curves show that the HTsignal is merged in EMI noise.
Comparing the red and blue curve in Fig. 15a, it can befound that the major EMR information of HT I distributingaround 80MHz, 161MHz and 274MHz cannot be detected.Similarly, the frequency characteristic of HT II (around105MHz, 177.5MHz and 261MHz in Fig. 15b) and HT III(around 95.5MHz, 170MHz and 260MHz in Fig. 15c) alsocannot be distinguished from EMI noise. Therefore, we canconclude that this EMR based HT detection is failed in thesecond scenario. It is worth noting that abnormal amplitudefluctuations have been removed before calculating the SNR.
In addition, in order to show the impact of activity inthe detection sensitivity, we also simulate the HT activity(shown in Table 2) by calculating the average proportionof logic resources (including LUTs, flip-flops, multiplexersetc.) switching per cycle to the total of HT. When consid-ering HT and noises separately, if the HT is sufficientlyactive (different types of HTs require distinct activity, asshown in the fourth column), it can be detected through theEMR analysis. Then, the result in the second column ofthis table shows that, the EMR based method cannot detect
603J Electron Test (2020) 36:591–606
0.5 1 1.5 2 2.5 3 3.5 4 4.5 5
x 108
−3
−2
−1
0
1
2
3x 10
−5
Frequency(Hz)
Mag
nitu
de(V
)
Actual Trojan(HT I)Detection Result(HT I)
(a)
0.5 1 1.5 2 2.5 3 3.5 4 4.5 5
x 108
−3
−2
−1
0
1
2
3x 10
−5
Frequency(Hz)
Mag
nitu
de(V
)
Actual Trojan(HT II)Detection Result(HT II)
(b)
0.5 1 1.5 2 2.5 3 3.5 4 4.5 5
x 108
−3
−2
−1
0
1
2
3x 10
−5
Frequency(Hz)
Mag
nitu
de(V
)
Actual Trojan(HT III)Detection Result(HT III)
(c)
Fig. 15 The HT signal is merged in EMI noise
Table2
The
HTactiv
ityanddetectionresult
Scenarios
Experim
entIII:S
cenarioI
Experim
entII
Experim
entIII:S
cenarioII
Activity
Detectio
nresult
Activity
Detectio
nresult
Activity
Detectio
nresult
HTin
Fig.9
12.63%
Failed
36.36%
Detected
53.71%
Failed
AES-T400
18.52%
Failed
34.92%
Detected
49.28%
Failed
AES-T700
7.41%
Failed
14.81%
Detected
26.54%
Failed
604 J Electron Test (2020) 36:591–606
HT whose activity is greatly reduced compared with exper-iment II, which is consistent with our experimental result inFig. 14. Moreover, even though we further increase the HTactivity (shown in the sixth column) comparing to exper-iment II, when HT’s frequency characteristic is dispersedinto EMI noise, the EMR based method is hardly to detectit. Therefore, we can conclude that improving HT activityis an effective approach to assist HT detection. However,when we increase the complexity of HT’s frequency dis-tribution, it is difficult to implement HT detection throughEMR analysis even if this HT has high activity.
To summarize, we exemplified the correctness of theanalysis of limitation for the EMR based method and therationality of proposed evaluation scheme. The EMR basedHT detection method is failed in these two scenarios.
6 Conclusion
In this paper, we firstly introduce the detection mechanismand noise source of EMR based HT detection methods.Then, we propose a specialized noise model and analyze theinfluence of each type of noises in this model. We discussthe connection between HT and the noise in proposedmodel, and propose the possible limitation for EMR basedmethods. Based on these, we propose the evaluation schemefor the EMR based method and verify the effectivenessand limitation of them through actual experiments onFPGA. For some special scenarios, EMR based detectionmethods are failed. In order to confront with these problem,the reverse engineering or the countermeasure based onthermal radiation (TR) side-channel analysis will be usedto implement HT detection. In the future work, we willevaluate the ability of HT detection for TR side-channelanalysis.
References
1. Agrawal D, Baktir S, Karakoyunlu D, Rohatgi P, Sunar B(2007) Trojan detection using IC fingerprinting. In: 2007 IEEEsymposium on security and privacy, proceedings, IEEE CompSoc TCSP, IEEE symposium on security and privacy, IEEEsymposium on security and privacy (S&P 2007), Berkeley, CA,May 20-23, 2007, p 296+, https://doi.org/10.1109/SP.2007.36
2. Balasch J, Gierlichs B, Verbauwhede I (2015) Electromag-netic circuit fingerprints for hardware trojan detection. In: 2015IEEE international symposium on electromagnetic compatibil-ity (EMC), IEEE; EMC Soc; EMC europe; VDE; wurth elek-tronik; rohde & schwarz; huawei; EMCos; altair; AMETEK; ETSLINDGREN; albatross projects; nolato; airbus; thales; ANDRO;thyssenkrupp; AR, IEEE international symposium on electro-magnetic compatibility,Joint IEEE international symposium onelectromagnetic compatibility (EMC) And Emc Europe, Dresden,Germany, Aug 16-22, 2015, pp 246–251
3. Banga M, Hsiao MS (2008) A region based approach for the iden-tification of hardware Trojans. In: 2008 IEEE international work-shop on hardware-oriented security and trust, IEEE, IEEE inter-national workshop on hardware-oriented security and trust, Ana-heim, CA, Jun 09, 2008, pp 40–47, https://doi.org/10.1109/HST.2008.4559047
4. Beenakker C, Buttiker M (1992) Suppression of shot noise inmetallic diffusive conductors. Phys Rev B 46(3):1889
5. Bossuet L, Fischer V, Bayon P (2015) Contactless transmissionof intellectual property data to protect fpga designs. In: 2015IFIP/IEEE international conference on very large scale integration(VLSI-SOC), Int Federat Informat Proc TC 10 Working Grp 105; Inst Elect & Elect Engineers; Korea Adv Inst Sci & Technol;Seoul Natl Univ, Embedded Syst Res Ctr; IEEE Council ElectDesign Automat; IEEE Circuits & Syst Soc; Korean Inst InformatScientists & Engineers; ACM Special Interest Grp DesignAutomat, 23rd IFIP WG 10.5/IEEE international conference onvery large scale integration (VLSI-SoC), Daejeon, South Korea,Oct 05-07, 2015, pp 19–24
6. Cha B, Gupta SK (2012) Efficient trojan detection via calibrationof process variations. In: 2012 IEEE 21st asian test symposium,pp 355–361, https://doi.org/10.1109/ATS.2012.64
7. Chakraborty RS, Wolff F, Paul S, Papachristou C, BhuniaS (2009) MERO: A statistical approach for hardware trojandetection. In: Clavier C, Gaj K (eds) Cryptographic hardware andembedded systems - CHES 2009, proceedings, int assoc cryptolres, lecture notes in computer science, vol 5747, pp 396–410. 11thinternational workshop on cryptographic hardware and embeddedsystems, Lausanne, Switzerland, Sep 06-09, 2009
8. Chen Z, Guo S, Wang J, Li Y, Lu Z (2019) Toward FPGA securityin IoT: a new detection technique for hardware trojans. IEEEInt Things J 6(4):7061–7068. https://doi.org/10.1109/JIOT.2019.2914079
9. Daubechies I (1992) Ten lectures on wavelets. SIAM10. Donoho DL, Johnstone JM (1994) Ideal spatial adaptation by
wavelet shrinkage. Biometrika 81(3):425–45511. Gray RM, Neuhoff DL (1998) Quantization. IEEE Trans Inform
Theor 44(6):2325–238312. He J, Liu Y, Yuan Y, Hu K, Xia X, Zhao Y (2019) Golden
chip free trojan detection leveraging electromagnetic side channelfingerprinting. IEICE Electronics Express 16(2), https://doi.org/10.1587/elex.16.20181065
13. He J, Zhao Y, Guo X, Jin Y (2017) Hardware trojan detectionthrough chip-free electromagnetic side-channel statistical analy-sis. IEEE Trans Very Large Scale Int (VLSI) Syst 25(10):2939–2948. https://doi.org/10.1109/TVLSI.2017.2727985
14. Hou B, He C, Wang L, En Y, Xie S (2014) Hardware trojandetection via current measurement: a method immune to processvariation effects. In: En YF, Ji CY (eds) Proceedings of 2014 10thinternational conference on reliability, maintainability and safety(ICRMS), VOLS I AND II, China Inst Elect (CIE); IEEE; CSAS;CMES; CICS; COS; CSA; CSAA, international conferenceon reliability maintainability and safety, 10th internationalconference on reliability maintainability and safety, chineseinstitute of electronics, Guangzhou, Peoples R China, Aug 06-08,2014, pp 1039–1042
15. Jarque CM, Bera AK (1987) A test for normality of observationsand regression residuals. International Statistical Review/RevueInternationale de Statistique pp 163–172
16. Lee EA, Messerschmitt DG (2012) Digital communication.Springer Science & Business Media, New York
17. Liu C, Cronin P, Yang C (2016) A mutual auditing framework toprotect iot against hardware trojans. In: 2016 21st asia and southpacific design automation conference (ASP-DAC), Asia and southpacific design automation conference proceedings, 21st Asia and
605J Electron Test (2020) 36:591–606
south pacific design automation conference (ASP-DAC), Macao,Peoples R China, Jan 25-28, 2016, pp 69–74
18. Lundberg KH (2002) Noise sources in bulk cmos. UnpublishedPaper 3:28
19. Mitra S, Wong HSP, Wong S (2015) The trojan-proof chip.IEEE Spectr 52(2):46–51. https://doi.org/10.1109/MSPEC.2015.7024511
20. Mittal S (2016) A survey of architectural techniques formanaging process variation. ACM Computing Surveys 48(4)https://doi.org/10.1145/2871167
21. Ngo XT, Exurville I, Bhasin S, Danger JL, Guilley S, Najm Z,Rigaud JB, Robisson B (2015) Hardware trojan detection by delayand electromagnetic measurements. In: 2015 design, automation& test in europe conference & exhibition (DATE), european design& automation association; elect design automation consortium;IEEE council on elec design automation; european elect chips& Syst design initiative; ACM special interest Grp on designautomation; Russian Acad of Sciences; IEEE Comp Soc testtechnology tech Council (tttC); IEEE solid-state circuits Soc(SSCS); international federation for information processing(IFIP); Ville De Grenoble; LETI; ST; MINALOGIC; AgenceDEtudes et de Promotion de lIsere; Rhone Alpes; GrenobleAlpes; CMP; Systematic Paris Region Systems & ICT; ClusterSCC; JEITA; Synopsys; Mentor Graphics; Cadence; Mathworks;Eurotraining, design automation and test in europe conferenceand exhibition, conference on design automation test in Europe(DATE), alpexpo congress center, Grenoble, France, Mar 09-13,2015, pp 782–787
22. Notaros B (2011) Electromagnetics. Prentice Hall. https://books.google.com/books?id=alBXAAAACAAJ
23. Proakis JG (2001) Digital signal processing: principles algorithmsand applications. Pearson Education India, India
24. Qiu H, Luo C, Fang W, Jiang L (2018) Noncontact time-domainemi measurement of two adjacent traces on a pcb. In: 2018 IEEEsymposium on electromagnetic compatibility, signal integrity andpower integrity (EMC, SI & PI), IEEE; EMC Soc; ROHDE &SCHWARZ; Altair; AH Syst Inc; ANDRO; Bruce Archambeault;EMC Shop; ITG Magnet & EMI Filter; SPIRA; TDK, IEEEsymposium on electromagnetic compatibility, signal integrity andpower integrity (EMC, SI & PI), Long Beach, CA, Jul 30-Aug 03,2018, pp 634–639
25. Rai D, Lach J (2009) Performance of Delay-Based trojandetection techniques under parameter variations. In: 2009 IEEEinternational workshop on hardware-oriented security and trust,IEEE, IEEE international workshop on hardware-oriented securityand trust, San Francisco, CA, Jul 27, 2009, pp 58–65,https://doi.org/10.1109/HST.2009.5224966
26. Rostami M, Koushanfar F, Karri R (2014) A primer on hardwaresecurity: models, methods, and metrics. Proc IEEE 102((8,SI)):1283–1295. https://doi.org/10.1109/JPROC.2014.2335155
27. Soell O, Korak T, Muehlberghuber M, Hutter M (2014) EM-based detection of hardware trojans on FPGAs. In: 2014 IEEEinternational symposium on hardware-oriented security and trust(Host), IEEE; IEEE Test Technol Tech Council; IEEE Comp Soc;IEEE Secur & Privacy Soc, IEEE international symposium onhardware-oriented security and trust (Host), Arlington, VA, May06-07, 2014, pp 84–87
28. Tang Y, Fang L, Li S (2019) Activity factor based hardwaretrojan detection and localization. J Electron Test-Theor Appl35(3):293–302. https://doi.org/10.1007/s10836-019-05803-1
29. Tang Y, Li S, Fang L, Hu X, Chen J (2019) Golden-chip-free hardware trojan detection through quiescent thermal maps.IEEE Trans Very Large Scale Int (VLSI) Syst 27(12):2872–2883.https://doi.org/10.1109/TVLSI.2019.2933441
30. Tang Y, Li S, Zhang F, Fang L (2018) Thermal maps basedHT detection using spatial projection transformation. IET InformSecur 12(4):356–361. https://doi.org/10.1049/iet-ifs.2017.0354
31. Tuzlukov V (2018) Signal processing noise. CRC Press, BocaRaton
32. Yang K, Hicks M, Dong Q, Austin T, Sylvester D (2016)A2: analog malicious hardware. In: 2016 IEEE symposiumon security and privacy (SP), IEEE; IEEE Comp soc IEEEsymposium on security and privacy, pp 18–37, IEEE symposiumon security and privacy (SP), San Jose, CA, MAY 23-25, 2016,https://doi.org/10.1109/SP.2016.10
33. Zhang J, Fang L, Li L, Zhang Z (2015) A novel approachto detecting hardware trojan horses. In: 2015 8th internationalsymposium on computational intelligence and design (ISCID),vol 1, IEEE Nanjing Computat Intelligence Chapter; UnivBristol; Zhejiang Univ; Zhejiang Sci Tech Univ; Zhejiang Univ,Coll Comp Sci; IEEE Comp Soc, International Symposiumon Computational Intelligence and Design, 8th InternationalSymposium on Computational Intelligence and Design (ISCID),Hangzhou, Peoples R China, Dec 12-13, 2015, pp 43–46,https://doi.org/10.1109/ISCID.2015.32
34. Zhou B, Zhang W, Thambipillai S, Jin JTK, Chaturvedi V, LuoT (2016) Cost-efficient acceleration of hardware trojan detectionthrough fan-out cone analysis and weighted random patterntechnique. IEEE Trans Comput-Aided Design Integrat Circ Syst35(5):792–805. https://doi.org/10.1109/TCAD.2015.2460551
Publisher’s Note Springer Nature remains neutral with regard tojurisdictional claims in published maps and institutional affiliations.
Ting Su received the B.S. degree in mechanical design manufactureand automation from Beijing Information Science and TechnologyUniversity, Beijing, China, in 2018. He is currently pursuing theM.S. degree at School of Computer, National University of DefenseTechnology, Changsha, Hunan, China. His current research interestsinclude digital circuit design and hardware reliability
Shaoqing Li joined the School of Computer, National Universityof Defense Technology, where he was responsible for softwareengineering. Since 1995, he has been leading the IC reliability group.He is currently a Professor. His research interests include IC design,test and reliability.
Yongkang Tang received the B.S. degree in surveying engineeringand the M.S. degree in electronic science and technology fromAir Force Engineering University, Xi?an, Shaanxi, China, in 2014and 2016, respectively. He received the Ph.D. degree at School ofComputer, National University of Defense Technology, Changsha,Hunan, China, in 2019. His current research interests include digitalcircuit design and hardware reliability.
Jihua Chen received the B.S. degree in computer science fromHuazhong University of Science and Technology, Wuhan, Hubei,China, and the M.S. degree in computer application from NationalUniversity of Defense Technology, Changsha, Hunan, China. In 1983,he joined the School of Computer, National University of DefenseTechnology, where he was responsible for CAD and IC physicaldesign. He is currently a Professor. His research interests include ICdesign and test.
606 J Electron Test (2020) 36:591–606


![Scalable Consistency-based Hardware Trojan …miodrag/papers/Wei_NSS_2011.pdfA. Hardware Trojan Detection Agrawal et al. [2] proposed one of the first HT detection techniques in 2007](https://img.pdfslide.us/doc/110x75/5ee10ab5ad6a402d666c114d/scalable-consistency-based-hardware-trojan-miodragpapersweinss2011pdf-a-hardware.jpg)


![On-Chip Analog Trojan Detection Framework for ...jin.ece.ufl.edu/papers/TCAD18.pdf · A. Analog Hardware Trojans ... The transistor schematic of the A2 analog Trojan [2] circuit is](https://img.pdfslide.us/doc/110x75/5f09d7b37e708231d428c153/on-chip-analog-trojan-detection-framework-for-jineceufledupapers-a-analog.jpg)