Embed Size (px)
Citation preview
Solid State Ionics 72 (1994) 209-217 North-Holland
SOLID STATE IONICS
Structure, microstructure and transport properties of mixed ionic-electronic conductors based on bismuth oxide Part I. B i -Y-Cu-O system
Yousheng Shen, Ashok Joshi Ceramatec, Inc., 2425 South 900 West, Salt Lake City, UT84119, USA
Meilin Liu School of Materials Engineering, Georgia Institute of Technology, Atlanta, GA 30332, USA
and
Kevin Krist Gas Research Institute, 8600 West Bryn Mawr Avenue, Chicago, IL 60631, USA
An ionic-electronic mixed conductor consisting of a stabilized fcc Bil.sYo.503 ionic conductive matrix phase, and a tetragonal Bi2 Cu2+.Cu~, + 04-o.5. electronic conductive second phase has been developed. The ionic transference number and conductivity of the composite material depend critically on the amount of the bismuth copper oxide second phase and its morphology.
1. Introduction 2. Experiments
We have already reported that by introducing mul- tivalent t i tanium oxide into yttria-stabilized bis- muth oxide, an ionic-electronic mixed conducting solid solution (Bil.sYo.5_xTixOa+o.sx) was formed [ 1,2 ]. The introduced electronic conduction in such a solid solution is due to the electron hopping through transitions between ti tanium oxidation states. An- other method used to synthesize a mixed conductor is to introduce an electronic conducting second phase into an ionic conductor. Recently, Subramanian et al. [ 3 ] reported a two-phase mixed conductor based on a sodium-ion-conducting [3-alumina and an elec- tronic-conducting iron oxide. In this paper, we re- port a newly developed, oxygen-ion and electronic mixed conductive composite material consisting of a BiLsYo.503 ionic conducting matrix phase and a Bi2CuO4_o.sn electronic conducting second phase.
2.1. Sample preparation
To fabricate the mixed conducting composite ma- terials, the oxides of Bi203, Y203 and Cu20 with the desired ratios according to the formula
(Bil.5Yo.503) (loo-x)mol~ (Bi2CuO4_ o.sn)x~ol~, were mixed and ground. The powder was isostatically pressed into pellets at a pressure of 30000 psi. The green density was 60% of the theoretical density. The samples were sintered in air for 4 h. The theoretical densities were calculated from X-ray diffraction ( X R D ) data. The densities of sintered pellets were higher than 95% of their theoretical density. Prep- aration details were described elsewhere [4].
2.2. Crystal structures and microstructures
The crystal structures were identified by X R D at room temperature (Cu Ka) . Microstructures were examined by a scanning electron microscope (SEM)
0167-2738/94/$ 07.00 © 1994 Elsevier Science B.V. All rights reserved.
210 Y. Shen et aL /Bi-Y-Cu-O system
coupled with X-ray mapping. All samples were ther- mally etched to reverse the grain boundaries.
2.3. Chemical composition
The chemical compositions o f the phases were di- rectly analyzed by wavelength dispersion spectros- copy (WDS) microprobe under the image of the SEM. The size o f the incident WDS beam was 1 gm or less. The instrument was calibrated using a syn- thesized Bil.sYo.503 solid solution material and a copper oxide (CuO). The sensitivity of the instru- ment is about 0.2 wt % of the absolute concentration.
3. Results
3.1. Microstructure
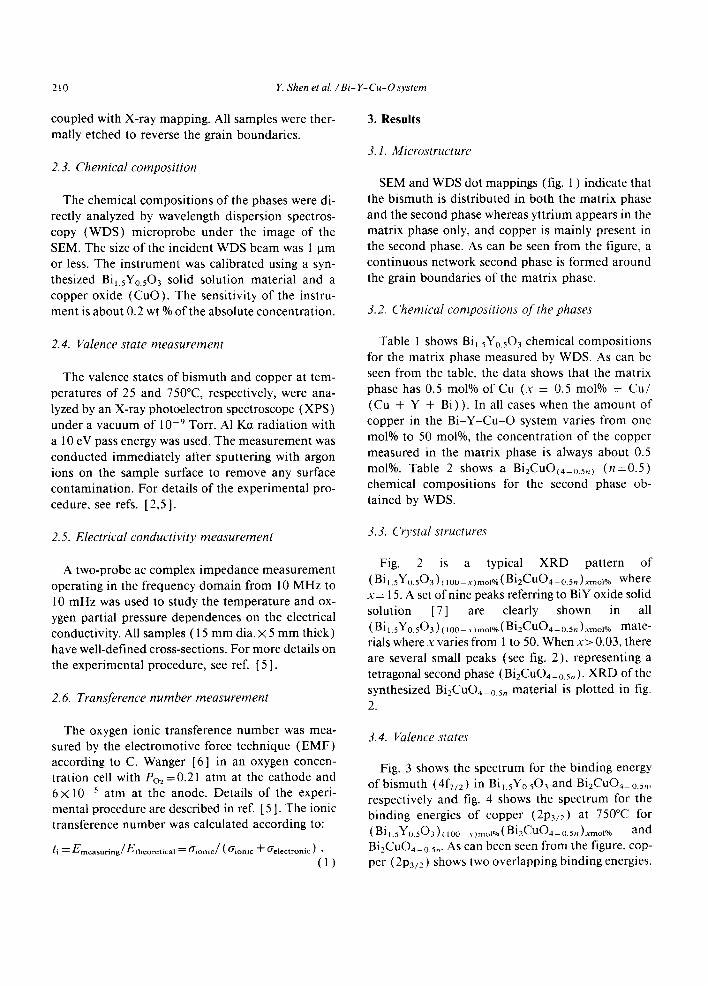
SEM and WDS dot mappings (fig. 1 ) indicate that the bismuth is distributed in both the matrix phase and the second phase whereas yttrium appears in the matrix phase only, and copper is mainly present in the second phase. As can be seen from the figure, a continuous network second phase is formed around the grain boundaries of the matrix phase.
3.2. Chemical compositions o f the phases
2.4. Valence state measurement
The valence states of bismuth and copper at tem- peratures of 25 and 750°C, respectively, were ana- lyzed by an X-ray photoelectron spectroscope (XPS) under a vacuum of 10 -9 Torr. A1 Kct radiation with a 10 eV pass energy was used. The measurement was conducted immediately after sputtering with argon ions on the sample surface to remove any surface contamination. For details of the experimental pro- cedure, see refs. [2,5].
Table 1 shows Bil.sY0.503 chemical compositions for the matrix phase measured by WDS. As can be seen from the table, the data shows that the matrix phase has 0.5 mol% of Cu (x = 0.5 mol% = Cu/ (Cu + Y + Bi)) . In all cases when the amount of copper in the B i - Y - C u - O system varies from one mol% to 50 mol%, the concentration of the copper measured in the matrix phase is always about 0.5 mol%. Table 2 shows a Bi2CuO(4_o.sn ) ( n = 0 . 5 ) chemical compositions for the second phase ob- tained by WDS.
2.5. Electrical conductivity measurement
A two-probe ac complex impedance measurement operating in the frequency domain from 10 MHz to 10 mHz was used to study the temperature and ox- ygen partial pressure dependences on the electrical conductivity. All samples ( 15 mm dia. × 5 mm thick) have well-defined cross-sections. For more details on the experimental procedure, see ref. [5].
2. 6. Transference number measurement
3.3. Crystal structures
Fig. 2 is a typical XRD pattern of ( Bil.sYo.503 ) (100-x)mol% ( Bi2CuO4_o.sn ) xmol°/o where x = 15. A set of nine peaks referring to BiY oxide solid solution [ 7 ] are clearly shown in all (Bix.sYo.503) (loo- x)mol% ( BizCuO4-o.sn )xmol% mate- rials where x varies from 1 to 50. When x > 0.03, there are several small peaks (see fig. 2), representing a tetragonal second phase (Bi2CuO4_o.sn). XRD of the syn thes ized Bi2CuO4_o.sn material is plotted in fig. 2.
The oxygen ionic transference number was mea- sured by the electromotive force technique (EMF) according to C. Wanger [6] in an oxygen concen- tration cell with Po: =0.21 atm at the cathode and 6 × 10 -5 atm at the anode. Details of the experi- mental procedure are described in ref. [ 5 ]. The ionic transference number was calculated according to:
ti = gm . . . . ring/Eth . . . . tical ~- O ' i o n i c / ( O'ionic -[- O'electronic ) •
(1)
3.4. Valence states
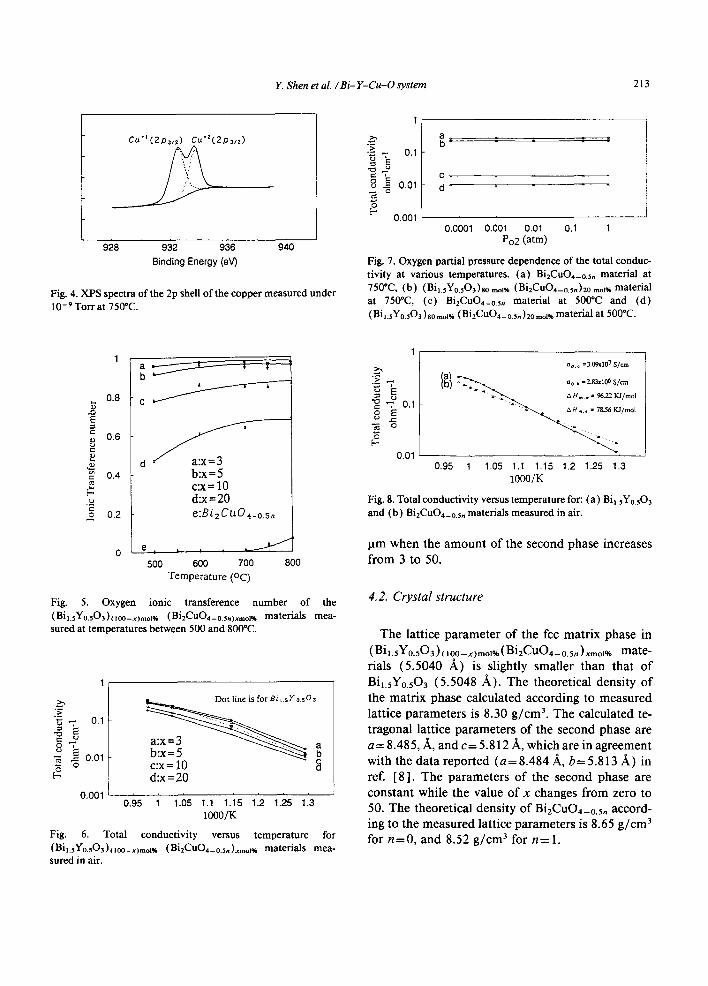
Fig. 3 shows the spectrum for the binding energy of bismuth (4f7/2) in Bil.sYo.503 and Bi2CuO4_o.5,,, respectively and fig. 4 shows the spectrum for the binding energies of copper (2p3/2) at 750°C for ( Bi t.syo.sO3 ) ( 100_ x)molO/o ( Bi2CuO4_ 0.Sn )xmol% and Bi2CuO4_o.sn. As can been seen from the figure, cop- per (2p3/2) shows two overlapping binding energies.
Y. Shen et al. / Bi- Y - C u - O system 211
(a)
(b)
B
(c)
The fingerprint spectrum of yttrium 3d5/2 is over- lapped by that of the bismuth 4f7/2, therefore the va- lence state of the yttrium ions could not be identi- fied. However, it is well known that yttrium only has one oxidation state ( y 3 + ) .
3.5. Transference number
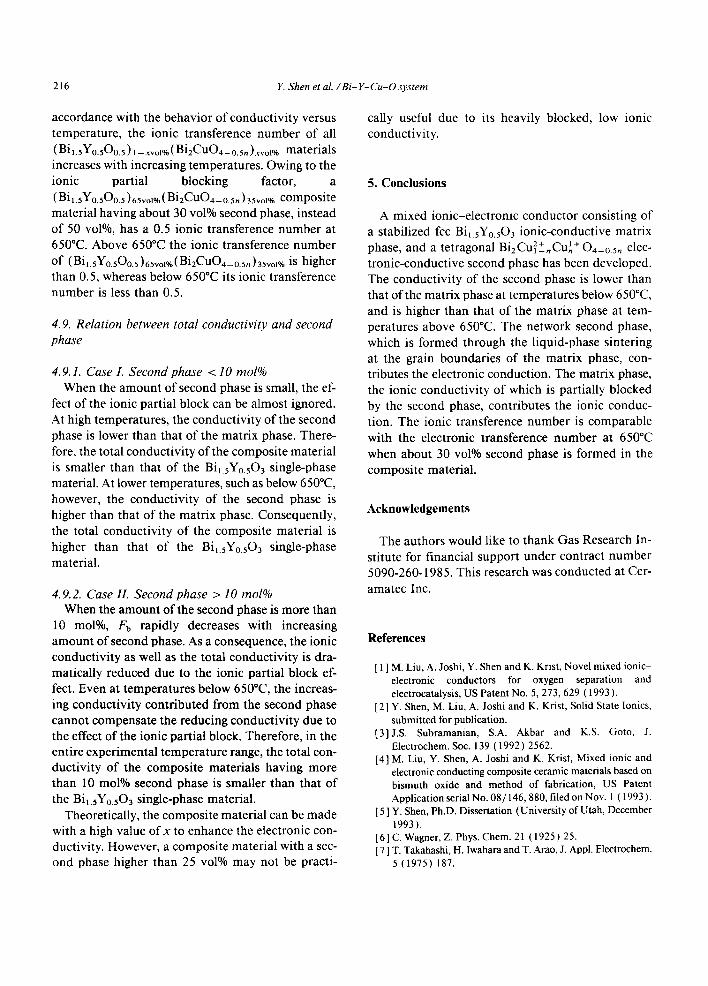
Fig. 5 illustrates the ionic transference number (ti) of (Bil.sYo.sO3)(loo_x)mol%(Bi2CuOa_o.sn)xmol,/, ver- sus copper content at temperatures between 400 and 800°C. The ti is reduced with increasing x, indicating that the second phase contributes to the electronic conduction. The ti is independent of the oxygen par- tial pressure at the experimental range of Po: = 1 to 10 -6 atm.
Ionic transference number (ti) of Bi2CuO4_ 0.Sn at temperatures between 500 and 750°C are plotted in fig. 5. The ti is almost zero when the temperature is below 700°C. When the temperature is above 700°C, ti increases with increasing temperature, ti is also in- dependent of the oxygen partial pressures from Po2 = 1 t o 1 0 - 6 atm.
3.6. Electrical conductivity
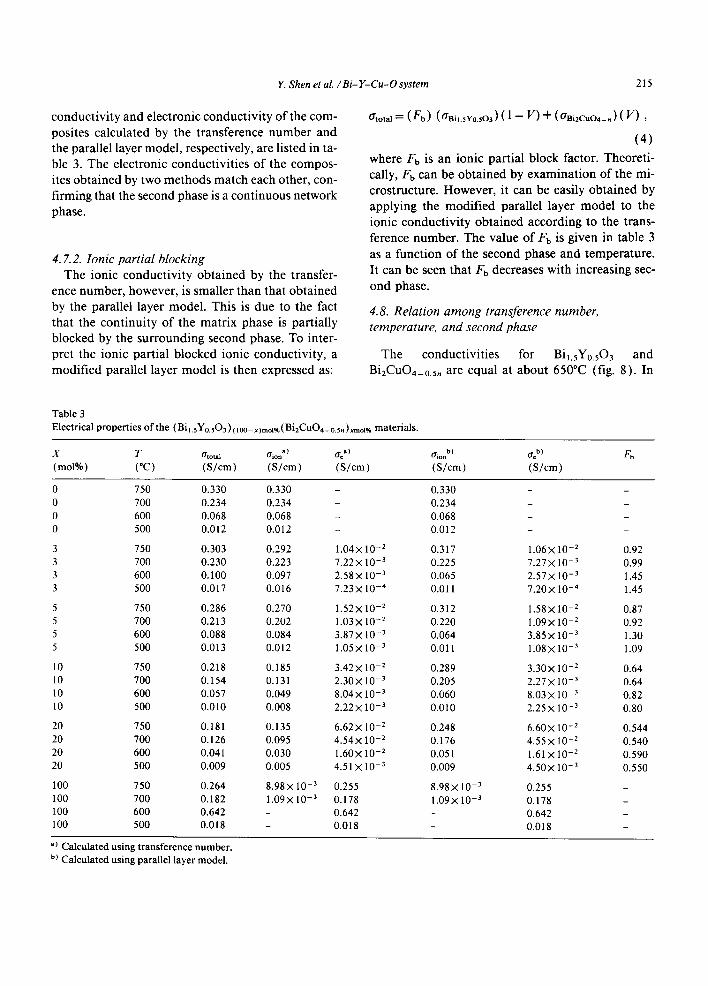
The temperature dependence of the total conduc- tivity for polycrystalline samples of ( BiLsYo.503 ) (, oo-x)mol~ ( Bi2CuO4 _ s, )~o1~* is plot- ted in fig. 6. Fig. 7 shows the total conductivity of (Bil.sYo.sO3) ( 1oo- x)mol% (BiECUO4- o.sn ) xmol~* mate- rial as a function of oxygen partial pressure at var- ious temperatures. Fig. 7 also shows the dependence of the oxygen partial pressure on the total conduc- tivity for the synthesized BiECuO4_oJn material. The temperature dependence of the total conductivity for a polycrystalline sample of Bi2CuO4-o.sn is plotted in fig. 8.
Fig. 1. Microstructure of the (Bil.sYo.503)9s tool% (Bi2- CUO4_0.5,) s moL% material. (a) Absorption electron image of the sample. (b) Copper X-ray mapping image. A copper-rich second phase is formed around the boundaries of the grains of the matrix phase. (c) Yttrium X-ray mapping image. A yttrium-rich matrix phase is surrounded by a copper-rich second phase.

212 Y. Shen et aL / Bi- Y-Cu-O system
Table 1 Chemical composition of the matrix phase in (BiLsYo.503)90 mo~ (Bi2CuO4_0.5,)~0 ,.o~ material obtained by WDS analysis.
Element K K Concentration Normalized ( ix/i~td ) ( ratio ) (wt % ) Concentration
(at %)
Y 0.3012 0,1028 10.837 9.879 Cu 0.0013 0.0011 0.088 0.19 Bi 0.7789 0,6705 77.396 30.00 O 0.13047 0,1231 9.357 59.97
Total 0,8975 97.677 100.03
Table 2 Chemical composition of the second phase in (BiLsYo.503)90 mo~ (Bi2CuOa-0.sn) 10 rnol% obtained by WDS analysis.
Element K K Concentration Normalized ( ix / istd ) ratio (wt % ) Concentration
(at%)
Y 0.0046 0.0022 0.253 0.24 Bi 0.8043 0.6924 75.807 30.77 Ag 0.0000 0.0000 0.000 0.00 Ti 0.0000 0.0000 0.000 0.00 Cu 0.1473 0.1260 10.569 14.11 O 0.1453 0.1092 10.254 55.36
Total 97.052 100.48
x( Bit.sYo.sOa)
• Bt2CuO,~_o.5,,
t" x
2-Tho~'a - Scalo
Fig. 2. XRD pattern of the (a) (Bil.~Yo.~O3)9o .ol~ ( Bi2CuO4 _ o.5.) ~o mol~ and (b) Bi2CuO4_ o.5. materials. The XRD is scanned at room temperature at a speed of 0.5°/min.
4. Discussion
4.1. M i c r o s t r u c t u r e
Accord ing to m e a s u r e d D T A data , w h e n the sin-
te r ing t e m p e r a t u r e is above 840°C, l iqu id
Bi2CuO4_o.sn p h a s e will be f o r m e d in the mater ia l s .
BCa(4 f r:2)
' ~ (a) (b) (c)
150 155 160 165 170 Binding Energy (eV) Fig. 3. XPS spectra of the 4f shell of bismuth measured un- der 10 -9 Torr. (a) (Bil.sYo.503)9Omol~ (Bi2CuO4_o.5,)lomol~ material measured at 750"C, (b) (Bit.sY0.503)9omot~ (Bi2- CuO4_o.5,)1o moJ~ material measured at 25°C, and (c) Bi2CuO4_o.5# material measured at 750°C.
W i t h well con t ro l l ed l iqu id s inter ing, a c o n t i n u o u s
n e t w o r k s eco n d phase was f o r m e d even w h e n the
a m o u n t o f the s eco n d phase was only 3 mol%. The
th i ckness o f the s eco n d phase f o r m e d a r o u n d gra in
b o u n d a r i e s o f the ma t r ix phase var ies f r o m 0.5 to 20
Y. Shen et al. /Bi- Y-Cu-O system 213
Cu'l(2p~,z) Cu'Z(2pz,,z)
928 932 936 940 Binding Energy (eV)
Fig. 4. XPS spectra of the 2p shell of the copper measured under 10 -9 Torr at 750"C.
"7.
c
"~ 0.01 ..& o d -
0.001 0.0001 0.001 0.01 0.1 1
Po2 (atm)
Fig. 7. Oxygen partial pressure dependence of the total conduc- tivity at various temperatures. (a) Bi2CuO4_o.~, material at 750"C, (b) (BiL~Yo.503)8o ~ol~ (Bi2CuO4_o.5,)2o ~ot~ material at 750°C, (c) Bi2CuO4_o.5. material at 500"C and (d) (BiLsYo.503) so mol~ (Bi2CuO4 - o.5, ) 20 mol~ material at 500"C.
0.8 r~ E
0.6
0.4 [,- .'-2
0.2
b
C
b : x - - 5 c:x = 10 d:x=20 e:Bi2CuO 4-o.sn
500 600 700 800 Temperature (oc)
Fig. 5. Oxygen ionic transference number of the (BiLsYo.503)UOO-x)mol~ (Bi2CuO4-o.sn)xmol~ materials mea- sured at temperatures between 500 and 800"C.
~ o.1
o "7'
~ .~ 0.01
0.001
Bi t.sYo.sO3
d:x=20
0.95 1 1 .05 1.1 1.15 1.2 1.25 1.3 1000/K
Fig. 6. Total conductivity versus temperature for (Bil.sYo.503)(loo-x)motsb (Bi2CuO4-0.sn)xmol,/, mate r ia l s mea- sured in air.
:r.
~ 0.1
-~ o
0.01
ao.. =3.09xi0 ? S/¢m
0.95 1 1 .05 1.1 1.15 1.2 1.25 1.3 1000/K
Fig. 8. Total conductivity versus temperature for: (a) BiLsYo.503 and (b) Bi2CuO4_o.5. materials measured in air.
~tm when the a m o u n t o f the second phase increases f rom 3 to 50.
4.2. Crystal structure
The lat t ice pa rame te r o f the fcc ma t r ix phase in
(Bil.sYo.503) (lO0-x)mol% ( B i 2 C u O 4 - o . s n ) x m o t % m a t e -
rials (5 .5040 ~,) is slightly smal ler t han that o f
Bil.sYo.503 (5.5048 A) . The theoret ical dens i ty o f the mat r ix phase calcula ted according to measu red lat t ice paramete rs is 8.30 g / c m 3. The calculated te- t ragonal lat t ice paramete rs of the second phase are a = 8.485,/~, and c = 5.812/~, which are in agreement with the da ta repor ted ( a = 8 . 4 8 4 / ~ , b = 5 . 8 1 3 / ~ ) in ref. [8] . The paramete rs of the second phase are cons t an t while the va lue o f x changes f rom zero to 50. The theoret ical dens i ty of Bi2CuO4_o.sn accord- ing to the measu red lat t ice paramete rs is 8.65 g / c m 3 for n = 0 , and 8.52 g / c m 3 for n = 1.

214 Y. Shen et al. / Bi- Y-Cu-O system
4.3. Cation valence states
In 1971, Datta et al. [9] proposed an yttria-sta- bilized bismuth oxide formula of
• 3+ .5+ In that paper, B13_x_yBlx Yl+yOl+xV0,(2-x)" quantitative determination o f pentavalent bismuth (Bi 5+ ) was not at tempted due to lack of a straight- forward method at that time. Harwig et al. [ 10 ] also proposed that the formation of Bi 5+ or Bi 4+ is pos- sible in bismuth oxide from the viewpoint o f the sta- bility structure. As can be seen from the results of the XPS measurement in fig. 3, the binding energy of bismuth (4t"7/2) shows a single peak and keeps a con- stant value (158.5 eV) for both BizYo.503 and BizCuOa_o.s,. Therefore, this observation might rule out the possibility o f significant Bi 4+ or Bi 5+ being present in the Bi2Yo.503 or BizCuO4_o.sn lattice.
For the first time in 1976, Arpe et al. [8] reported a Bi2CuO4 formula for the compound they found in the B i - C u - O system. However, the WDS measure- ment conducted by this study shows an oxygen-de- ficient formula of Bi2CuO4_o.sn. As can be seen in fig. 4, a binding energy of 932.4 eV corresponding to Cu + and a binding energy of 933.8 corresponding to Cu 2+ are observed. The intensities of the two peaks are almost the same, implying that the mole ratio of the Cu + to Cu 2+ is close to unity. With the combi- nation of the chemical composit ion data obtained by WDS and the valence state data measured by XPS,
. 2 + Cu + a formula o f BlzCUl_n n Oo.(4-o.5~) has been pro- posed for the compound found in the B i - C u - O sys- tem, and the n is about 0.5. The role of the multi- valent copper cations in material 's electronic conductivity will be addressed elsewhere [ 11 ].
4.4. Copper solubility in the matrix phase
A copper content, C u / ( C u + B i + Y ) , in the ma- trix phase o f 0.5 mol% was measured by WDS mi- croprobe in this study• Further evidence o f soluble copper in the matrix phase was observed from the XRD measurement• The lattice parameter of the matrix phase was slightly smaller than that of the un- doped Bil.sYo.503 material, indicating that bismuth or yttrium ions may have been partially replaced by copper since the radius of Cu 2+ (0.72 A) is smaller than that o f Y 3+ (0.89 A) and Bi 3+ (0.96 A) [12]. The lattice parameter is constant when x changes
from 1 to 50, implying that copper is already satu- rated. At this point, it can be concluded that the sol- ubility of the copper is very limited, and must be around 0.5 mol% or less.
4.5. Electrical properties of the matrix phase
To see the effect of the small amount copper on the electrical properties of the Bil.sYo.503 matrix phase, a (Bil.sYo.503)99.5 molO/o (CuO)0.5 molO~ mate- rial was fabricated and tested for its conductivity and transference number• The measured electrical prop- erties of the (Bil.sYo.503)99.5 molO/o (CuO)o.5 tool% are almost identical to those of Bil.sYo.503. Therefore, it can be concluded that the effect of 0.5 tool% copper on the electrical properties of Bi,.sYo.503 is negligible.
4.6. The electrical properties of the second phase
From the results of the transference number mea- surement (see fig. 5), it can be seen that the ionic
B12CUl_nCun O4-o.5n material is conductivity of the " 2+ + insignificant at temperatures below 700°C. The value of t~ increased from 0.034 to 0.067 when the tem- perature was above 700°C. Nevertheless, the oxygen ion conduction was still low even at high tempera- tures. In fig. 8, the total conductivities of the
• 2 + U + . . B12Cul-nC n 04 -0 . 5n and Bi~ 5YsO3 materials are plotted together for comparison• Listed in fig. 8 are the activation energy AH m and pre-exponential term ~r0 of the conductivity for both
• 2+ U + B12CUl_nC ~ O4-0.5n and BiL~Y.503 calculated ac- cording to:
/ A~/mt (2) O'tota 1 T = Oo exp ~ .
4.7. Electrical properties of the composites
4.7. I. Parallel layer model Assuming both phases are continuous, a parallel
layer model can be used to calculate the total con- ductivity of the composite materials:
atotal = (aBil.,Vo.,o3) ( 1 - V) + (crui2cuo,_o.,,) (V), ( 3 )
where V is the vol% of the second phase. The ionic
Y. Shen et al. / Bi- Y-Cu-O system 215
c o n d u c t i v i t y a n d e l ec t ron ic c o n d u c t i v i t y o f the com-
pos i t e s ca lcu la ted by the t r a n s f e r e n c e n u m b e r a n d
the paral lel layer mode l , respec t ive ly , are l i s ted in ta-
ble 3. T h e e lec t ron ic c o n d u c t i v i t i e s o f the c o m p o s -
i tes o b t a i n e d by two m e t h o d s m a t c h each o ther , con-
f i rming tha t the s econd phase is a con t inuous ne twork
phase .
4. 7.2. Ionic partial blocking T h e ion ic c o n d u c t i v i t y o b t a i n e d by the t r ans fe r -
ence n u m b e r , howeve r , is sma l l e r t h a n tha t o b t a i n e d
by the paral lel layer mode l . Th i s is due to the fact
t ha t the c o n t i n u i t y o f the ma t r i x phase is par t ia l ly
b locked by the s u r r o u n d i n g s econd phase . To in ter-
p re t the ion ic par t ia l b locked ionic conduc t iv i ty , a
m o d i f i e d paral le l layer m o d e l is t h e n exp re s sed as:
O'tota I : ( F b ) (O'Bil.sYo.sO3) ( 1 -- V) + (aBi2cuo4_n) (V) ,
( 4 )
where Fb is an ion ic par t ia l b lock factor . Theore t i -
cally, Fb can be o b t a i n e d by e x a m i n a t i o n o f the mi -
c ros t ruc tu re . H o w e v e r , it can be easily o b t a i n e d by
app ly ing the m o d i f i e d paral le l layer m o d e l to the
ion ic c o n d u c t i v i t y o b t a i n e d a c c o r d i n g to the t rans -
f e rence n u m b e r . The va lue o f Fb is g iven in table 3
as a f u n c t i o n o f the s e c o n d phase a n d t e m p e r a t u r e .
It can be seen tha t Fb dec reases wi th inc reas ing sec-
o n d phase .
4.8. Relation among transference number, temperature, and second phase
The co n d u c t i v i t i e s for BiLsYo.503 a n d
Bi2CuO4_o.sn are equal at a b o u t 650°C (fig. 8) . In
Table 3 Electrical properties of the (Bit.sYo.sO3)ooo_x)mot~o(Bi2CuO4_o.sn)xraol,/, materials.
X T O'tota I O'ion a ) o'c a ) O'ion b ) 0"e b ) F b
(mol°/0) (°C) (S/cm) (S/cm) (S/cm) (S/cm) (S/cm)
0 750 0.330 0.330 - 0.330 - - 0 700 0.234 0.234 - 0.234 - - 0 600 0.068 0.068 - 0.068 - - 0 500 0.012 0.012 - 0.012 - -
3 750 0.303 0.292 1.04× 10 -2 0.317 1.06X 10 -2 0.92 3 700 0.230 0.223 7.22× 10 -3 0.225 7.27× 10 -3 0.99 3 600 0.100 0.097 2.58× 10 -3 0.065 2.57× 10 -3 1.45 3 500 0.017 0.016 7.23X 10 -4 0.011 7.20X 10 -4 1.45
5 750 0.286 0.270 1.52× 10 -2 0.312 1.58)< 10 -2 0.87 5 700 0.213 0.202 1.03× 10 -2 0.220 1.09X 10 -2 0.92 5 600 0.088 0.084 3.87× 10 -3 0.064 3.85× 10 -3 1.30 5 500 0.013 0.012 1.05× 10 -3 0.011 1.08× 10 -3 1.09
10 750 0.218 0.185 3.42× 10 -2 0.289 3.30X 10 -2 0.64 10 700 0.154 0.131 2.30× 10 -3 0.205 2 . 2 7 × 10 -3 0.64 10 600 0.057 0.049 8 .0 4 × 10 -3 0.060 8 .0 3 × 10 -3 0.82 10 500 0.010 0.008 2.22X 10 -3 0.010 2.25 x 10 -3 0.80
20 750 0.181 0.135 6.62× 10 -2 0.248 6.60× 10 -2 0.544 20 700 0.126 0.095 4.54× 10 -2 0.176 4.55X 10 -2 0.540 20 600 0.041 0.030 1.60× 10 -2 0.051 1.61 × 10 -2 0.590 20 500 0.009 0.005 4.51 × 10 -3 0.009 4.50X l0 -3 0.550
100 750 0.264 8.98X 10 -3 0.255 8.98× 10 -3 0.255 100 700 0.182 1 .09× 10 -3 0.178 1.09X 10 -3 0.178 100 600 0.642 0.642 - 0.642 100 500 0.018 0.018 - 0.018
a) Calculated using transference number. b) Calculated using parallel layer model.
216 E Shen et al. / Bi- Y-Cu-O system
accordance with the behavior of conduct ivi ty versus temperature , the ionic transference number of all
(Bil 5Yo.5Oo.5) ~ _x~ol~ (Bi2CuO4_ o.sn)~vol% materials increases with increasing temperatures. Owing to the ionic part ia l blocking factor, a
(Bi~.sYo.500.5)65vol%(Bi2CuO4_o.sn)35vol% composi te mater ial having about 30 vol% second phase, ins tead of 50 vol%, has a 0.5 ionic transference number at 650°C. Above 650°C the ionic transference number
of (Bil.sYo.5Oo.s)65voto~(Bi2CuO4_o.5~)35vot% is higher than 0.5, whereas below 650°C its ionic transference number is less than 0.5.
4.9. Relation between total conductivity and second phase
4.9.1. Case L Second phase < I0 mol% When the amount o f second phase is small, the ef-
fect of the ionic part ia l block can be almost ignored. At high temperatures , the conduct ivi ty of the second phase is lower than that of the matr ix phase. There- fore, the total conduct ivi ty o f the composi te mater ia l is smaller than that of the Bi~.sYo.503 single-phase material. At lower temperatures, such as below 650°C, however, the conduct ivi ty of the second phase is higher than that of the matr ix phase. Consequently, the total conduct ivi ty o f the composi te mater ia l is higher than that of the BiLsYo.503 single-phase material .
4.9.2. Case II. Second phase > 10 mol% When the amount of the second phase is more than
10 mol%, Fb rapidly decreases with increasing amount of second phase. As a consequence, the ionic conduct ivi ty as well as the total conduct ivi ty is dra- matical ly reduced due to the ionic par t ia l block ef- fect. Even at temperatures below 650°C, the increas- ing conduct ivi ty contr ibuted f rom the second phase cannot compensate the reducing conduct ivi ty due to the effect of the ionic par t ia l block. Therefore, in the entire exper imental t empera ture range, the total con- duct ivi ty of the composi te mater ia ls having more than 10 mol% second phase is smaller than that of the Bi~.sYo 503 single-phase material .
Theoretically, the composi te mater ia l can be made with a high value o f x to enhance the electronic con- ductivity. However, a composi te mater ia l with a sec- ond phase higher than 25 vol% may not be practi-
cally useful due to its heavily blocked, low ionic conductivity.
5. Conclusions
A mixed ionic-e lect ronic conductor consisting of a stabil ized fcc BiLsYo.503 ionic-conduct ive matr ix
B12CUl_nCun O4-o.5n elec- phase, and a tetragonal ' 2+ ~+ t ronic-conduct ive second phase has been developed. The conduct ivi ty of the second phase is lower than that of the matrix phase at temperatures below 650°C, and is higher than that of the matr ix phase at tem- peratures above 650°C. The network second phase, which is formed through the l iquid-phase sintering at the grain boundar ies of the matr ix phase, con- tributes the electronic conduction. The matr ix phase, the ionic conduct ivi ty of which is part ial ly blocked by the second phase, contr ibutes the ionic conduc- tion. The ionic transference number is comparable with the electronic transference number at 650°C when about 30 vol% second phase is formed in the composi te material .
Acknowledgements
The authors would like to thank Gas Research In- sti tute for f inancial support under contract number 5090-260-1985. This research was conducted at Cer-
amatec Inc.
References
[ 1 ] M. Liu, A. Joshi, Y. Shen and K. Krist, Novel mixed ionic- electronic conductors for oxygen separation and electrocatalysis, US Patent No. 5, 273,629 ( 1993 ).
[2] Y. Shen, M. Liu, A. Joshi and K. Krist, Solid State lonics, submitted for publication.
[3]J.S. Subramanian, S.A. Akbar and K.S. Goto, J. Electrochem. Soc. 139 (1992) 2562.
[4] M. Liu, Y. Shen, A. Joshi and K. Krist, Mixed ionic and electronic conducting composite ceramic materials based on bismuth oxide and method of fabrication, US Patent Application serial No. 08/146, 880, filed on Nov. 1 ( 1993 ).
[ 5 ] Y. Shen, Ph.D. Dissertation (University of Utah, December 1993).
[ 6 ] C. Wagner, Z. Phys. Chem. 21 ( 1925 ) 25. [ 7 ] T. Takahashi, H. Iwahara and T. Arao, J. Appl. Electrochem.
5 (1975) 187.

Y. Shen et al. / B i - Y -Cu-O system 217
[ 8 ] V.R. Arpe and H.M. Buschbaum, Z. Anorg. AUg. Chem. 426 (1976) 1.
[9] R.K. Datta and J.P. Meehan, Z. Anorg, Allg. Chem. 383 (1971) 328.
[ 10] H.A. Harwig and J.W. Weenk, Z. Anorg. Allg. Chem. 444 (1978) 167.
[ 11 ] Y. Shen and A. Joshi, Structure and Transport Properties in Bi-Cu-O System, manuscript in preparation.
[12] R.D. Shannon and C.T. Prewitt, Acta. Crystallogr. B 25 (1969) 925.


![Cu/Al2O3 catalysts for soot oxidation: Copper loading effect.€¦ · et al. [4] also screened a number of metal chlorides (Ba, Ca, Fe, Bi, Hg, Co, Mo, Ni, Cu, ... catalysed soot](https://img.pdfslide.us/doc/110x75/605ea46c37b24a693504a81e/cual2o3-catalysts-for-soot-oxidation-copper-loading-et-al-4-also-screened.jpg)