Embed Size (px)
Citation preview
Part I (AAP QI) - Results
Ruth S. Gubernick, MPHQuality Improvement Advisor
Florida Pediatric Medical Home Demonstration Project Learning Session 3
December 7, 2012
Disclosure
I have no relevant financial relationships with the manufacturers of any commercial products and/or provider of commercial services discussed in this CME activity. I do not intend to discuss an unapproved/investigative use of a commercial product/device in their presentation.
Chart Review Aggregate Data
Phase 2 Measures
May-12 June July Aug Sept Oct0%
20%
40%
60%
80%
100%
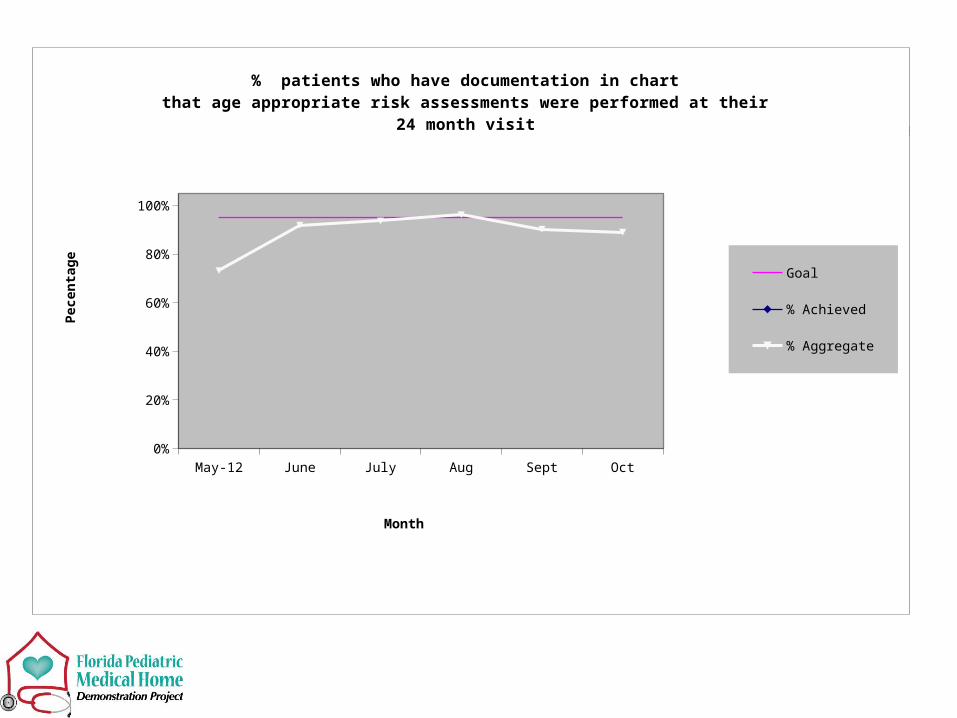
% patients who have documentation in chart that age appropriate risk assessments were performed at their
24 month visit
Goal
% Achieved
% Aggregate
Month
Pec
enta
ge
May-12 June July Aug Sept Oct0%
20%
40%
60%
80%
100%
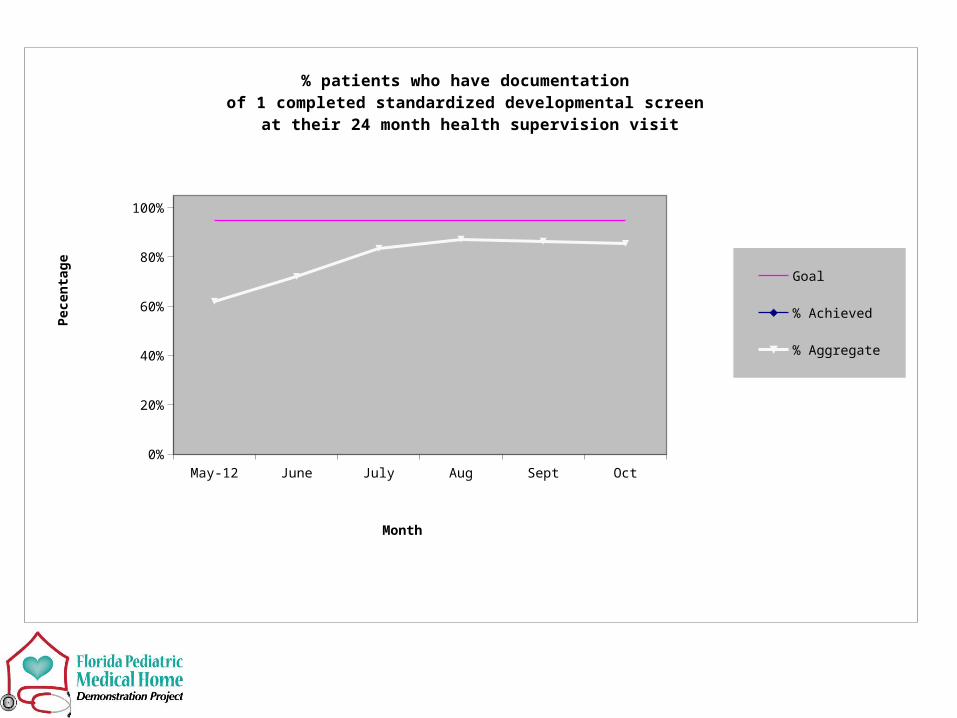
% patients who have documentation of 1 completed standardized developmental screen
at their 24 month health supervision visit
Goal
% Achieved
% Aggregate
Month
Pec
enta
ge
May-12 June July Aug Sept Oct0%
20%
40%
60%
80%
100%
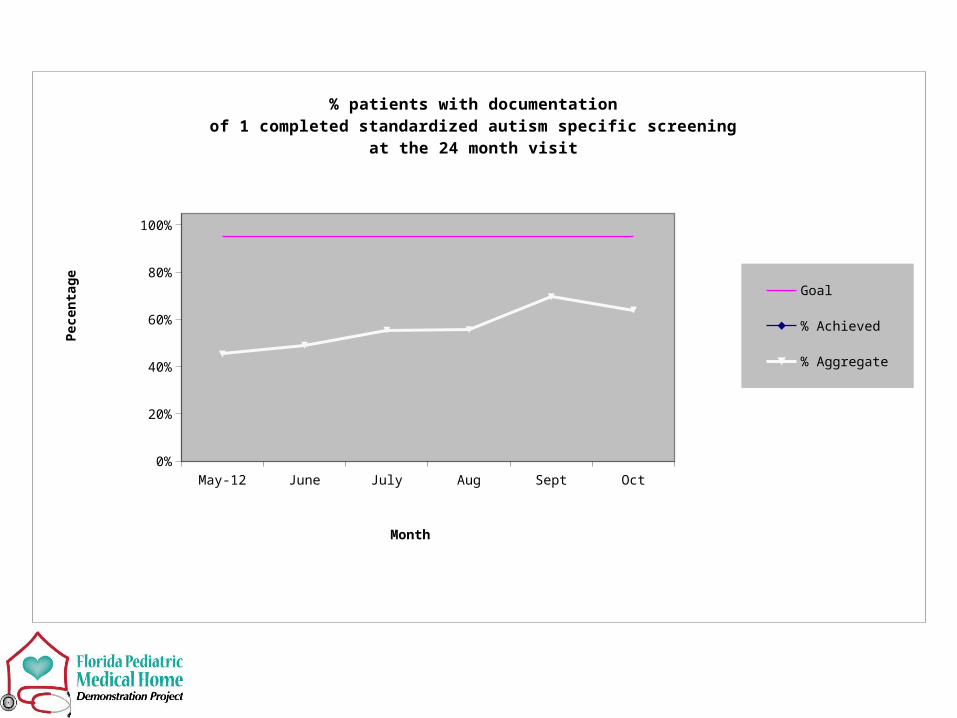
% patients with documentation of 1 completed standardized autism specific screening
at the 24 month visit
Goal
% Achieved
% Aggregate
Month
Pec
enta
ge
May-12 June July Aug Sept Oct0%
20%
40%
60%
80%
100%
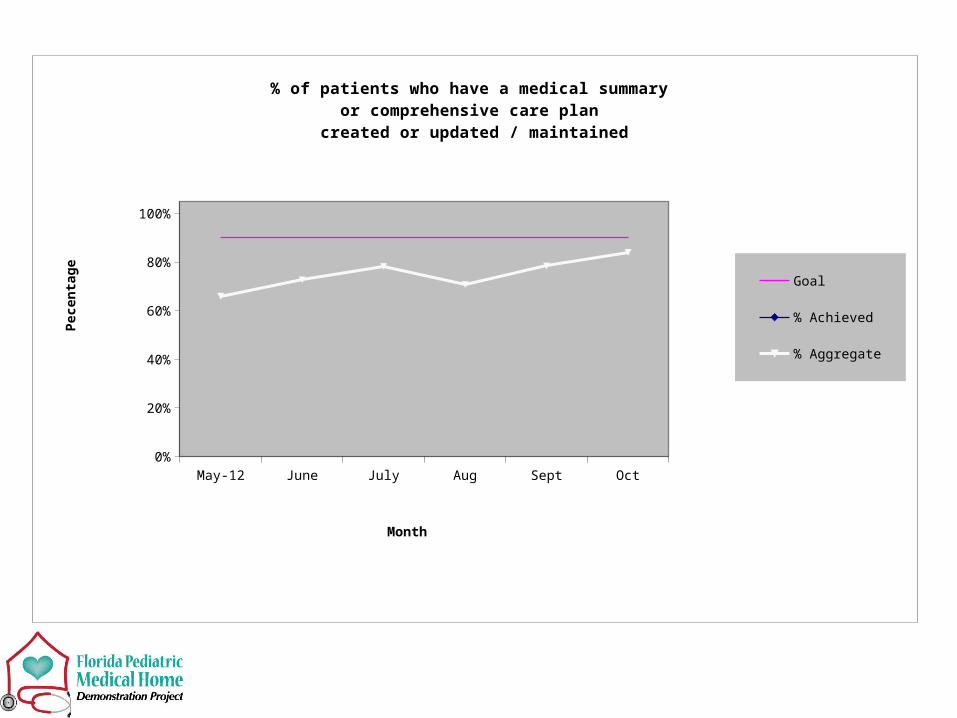
% of patients who have a medical summary or comprehensive care plan
created or updated / maintained
Goal
% Achieved
% Aggregate
Month
Pec
enta
ge
May-12 June July Aug Sept Oct0%
20%
40%
60%
80%
100%
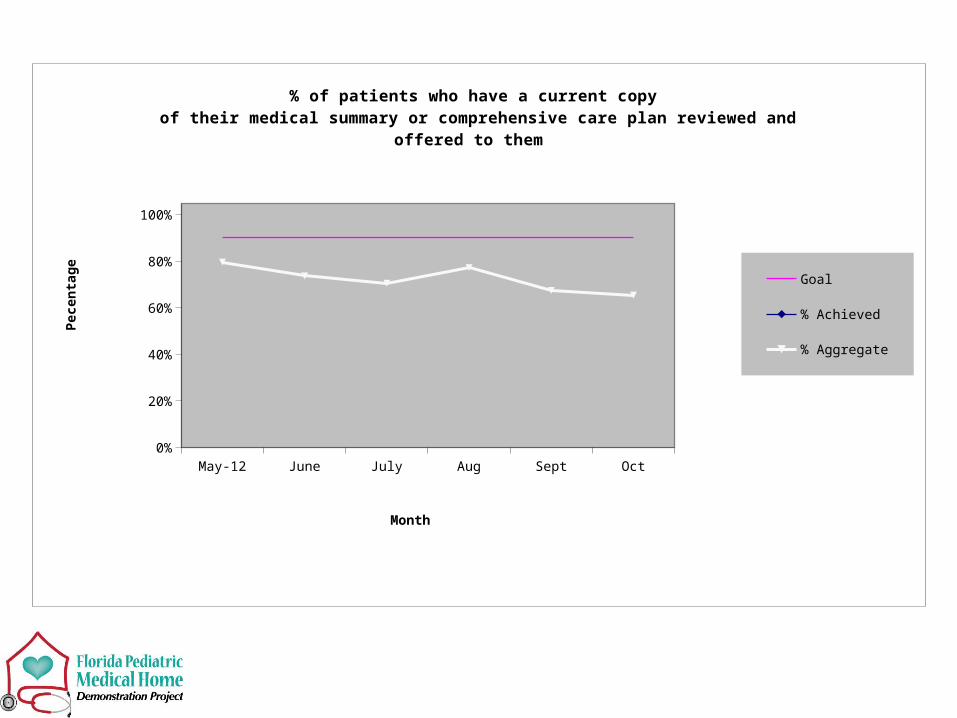
% of patients who have a current copy of their medical summary or comprehensive care plan reviewed and offered to them
Goal
% Achieved
% Aggregate
Month
Pec
enta
ge
May-12 June July Aug Sept Oct0%
20%
40%
60%
80%
100%
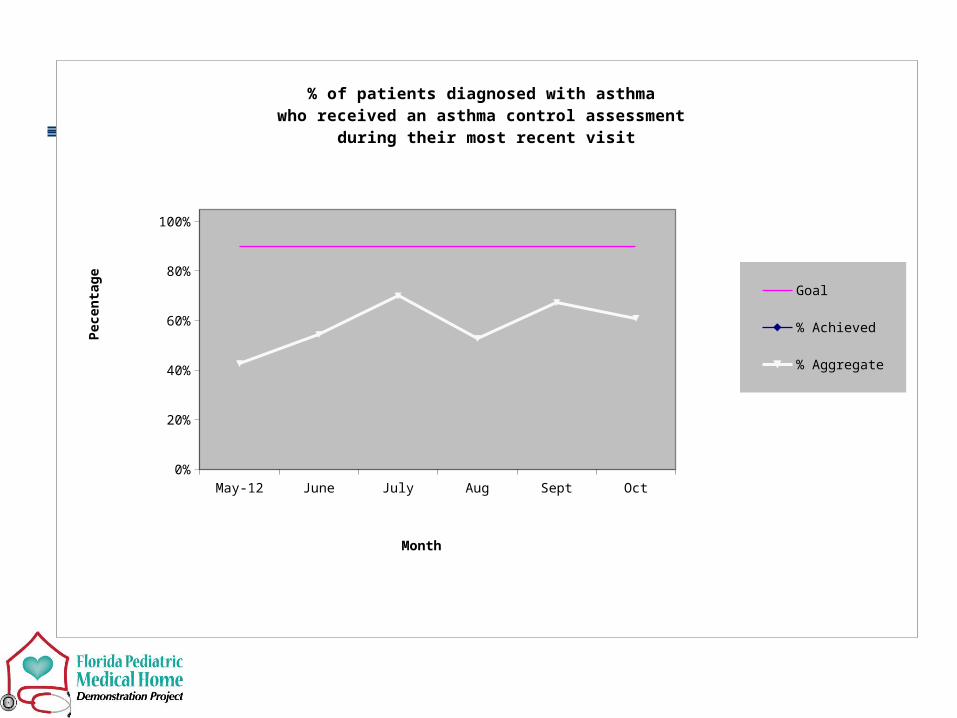
% of patients diagnosed with asthma who received an asthma control assessment
during their most recent visit
Goal
% Achieved
% Aggregate
Month
Pec
enta
ge
May-12 June July Aug Sept Oct0%
20%
40%
60%
80%
100%
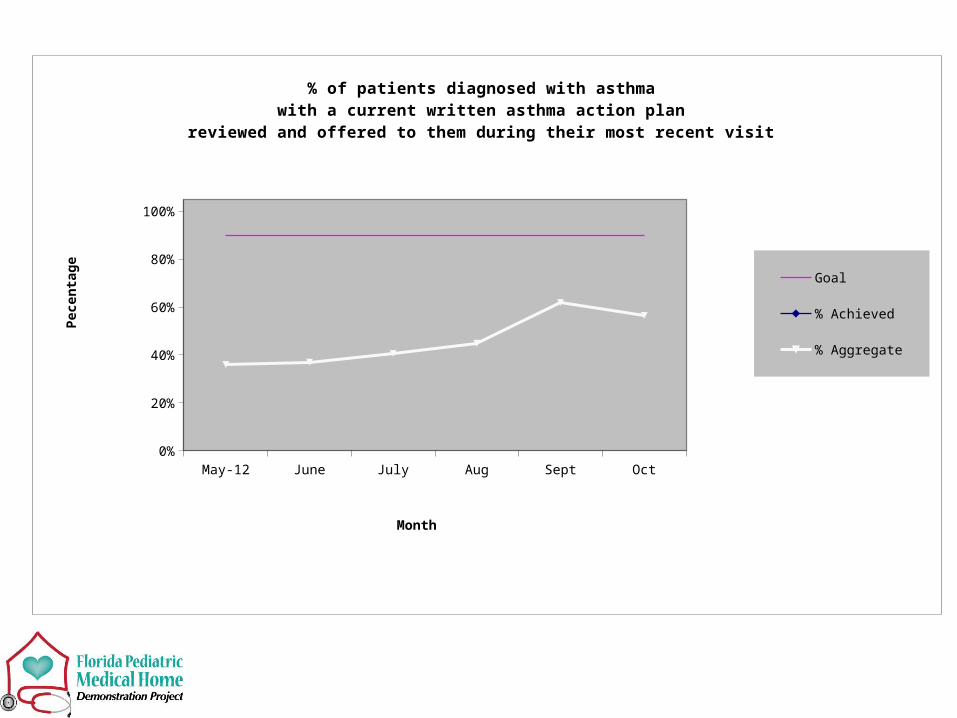
% of patients diagnosed with asthma with a current written asthma action plan
reviewed and offered to them during their most recent visit
Goal
% Achieved
% Aggregate
Month
Pec
enta
ge
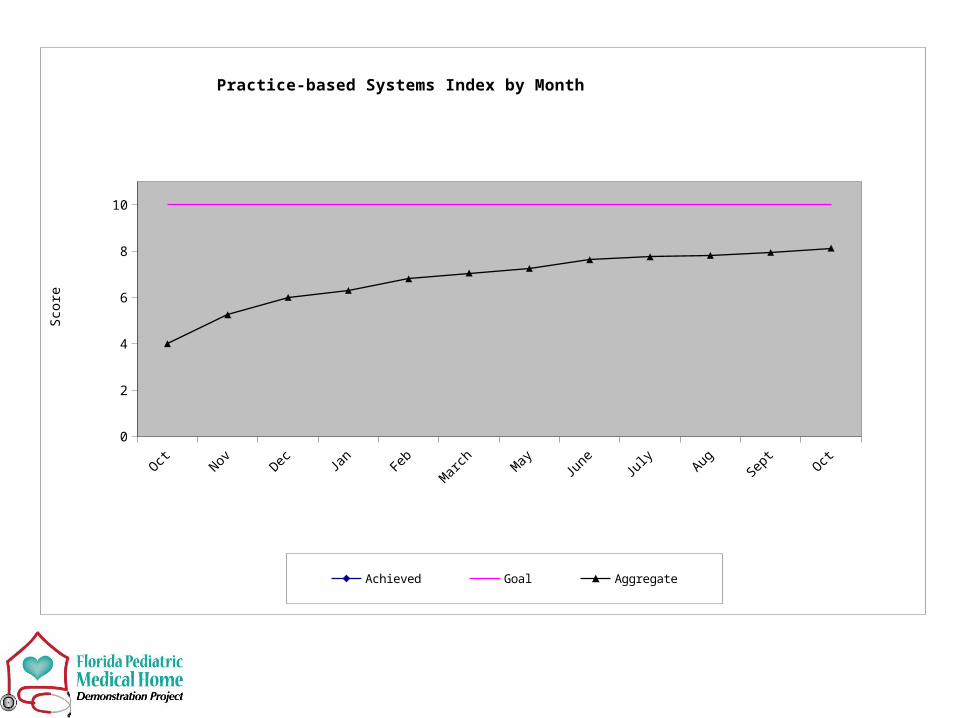
Practice-based Systems IndexOctober 2011-October 2012
OctNov Dec Ja
nFeb
Mar
chM
ayJu
ne July
AugSep
tOct
0
2
4
6
8
10
Practice-based Systems Index by Month
Achieved Goal Aggregate
Sco
re
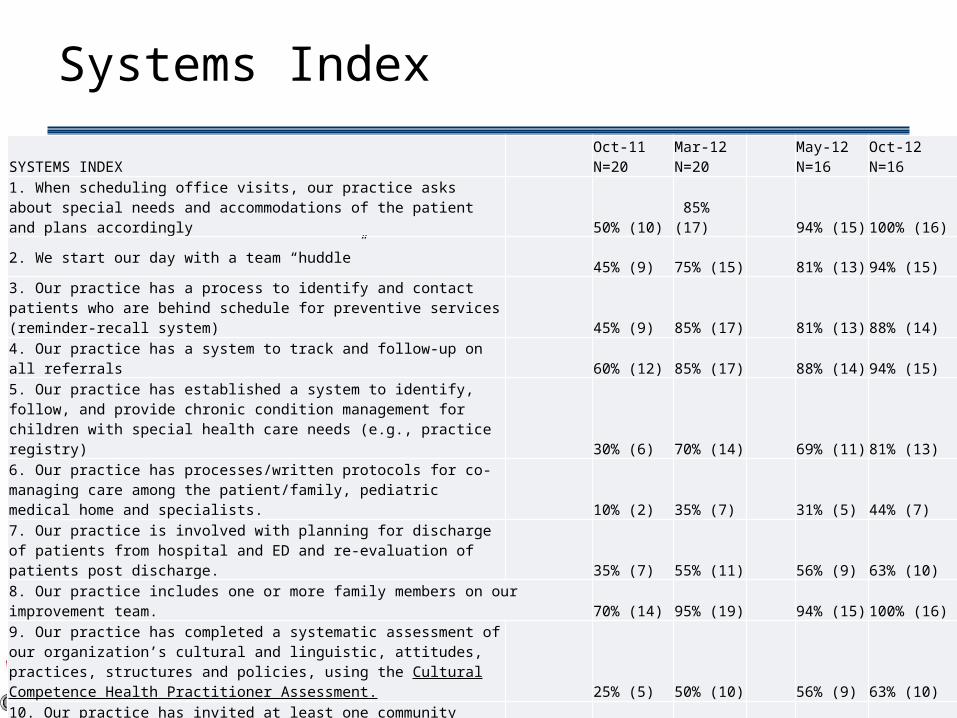
Systems Index
SYSTEMS INDEX Oct-11N=20
Mar-12N=20
May-12N=16
Oct-12N=16
1. When scheduling office visits, our practice asks about special needs and accommodations of the patient and plans accordingly 50% (10) 85% (17) 94% (15) 100% (16)
2. We start our day with a team “huddle”45% (9) 75% (15) 81% (13) 94% (15)
3. Our practice has a process to identify and contact patients who are behind schedule for preventive services (reminder-recall system) 45% (9) 85% (17) 81% (13) 88% (14)
4. Our practice has a system to track and follow-up on all referrals60% (12) 85% (17) 88% (14) 94% (15)
5. Our practice has established a system to identify, follow, and provide chronic condition management for children with special health care needs (e.g., practice registry) 30% (6) 70% (14) 69% (11) 81% (13)
6. Our practice has processes/written protocols for co-managing care among the patient/family, pediatric medical home and specialists.
10% (2) 35% (7) 31% (5) 44% (7)
7. Our practice is involved with planning for discharge of patients from hospital and ED and re-evaluation of patients post discharge. 35% (7) 55% (11) 56% (9) 63% (10)
8. Our practice includes one or more family members on our improvement team. 70% (14) 95% (19) 94% (15) 100% (16)
9. Our practice has completed a systematic assessment of our organization’s cultural and linguistic, attitudes, practices, structures and policies, using the Cultural Competence Health Practitioner Assessment. 25% (5) 50% (10) 56% (9) 63% (10)
10. Our practice has invited at least one community organization to a quarterly practice team “lunch and learn” during which information was shared and introductions/personal connections with staff were made. 30% (6) 70% (14) 81% (13) 88% (14)
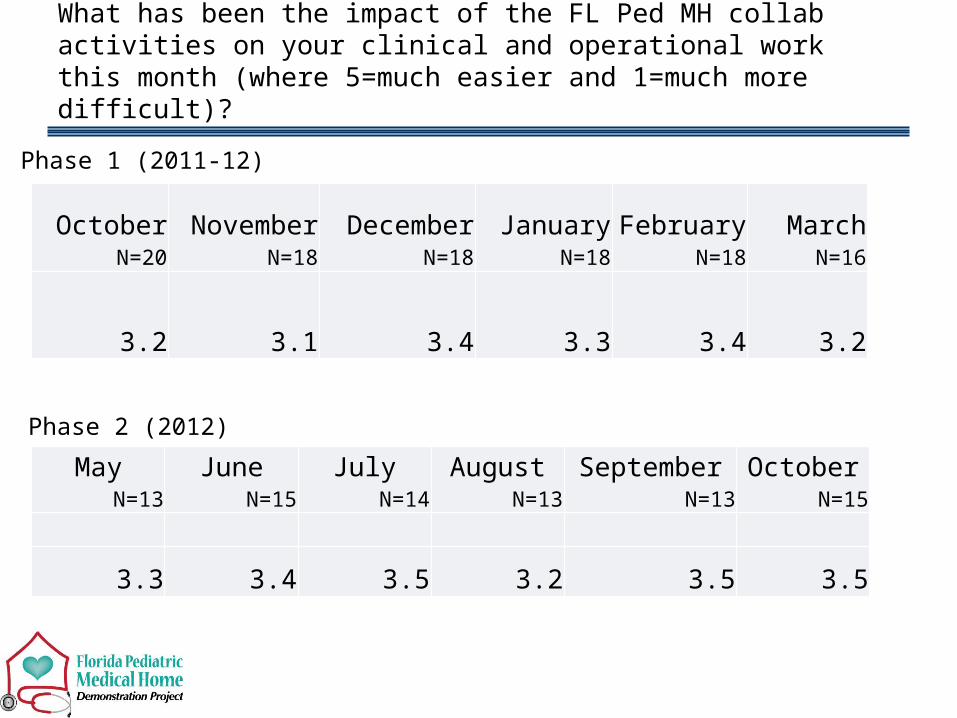
What has been the impact of the FL Ped MH collab activities on your clinical and operational work this month (where 5=much easier and 1=much more difficult)?
OctoberN=20
NovemberN=18
DecemberN=18
JanuaryN=18
FebruaryN=18
MarchN=16
3.2 3.1 3.4 3.3 3.4 3.2
MayN=13
JuneN=15
JulyN=14
AugustN=13
SeptemberN=13
OctoberN=15
3.3 3.4 3.5 3.2 3.5 3.5
Phase 1 (2011-12)
Phase 2 (2012)

Part 1 - Practice Survey Aggregate Data
August 2011, March 2012, and November 2012
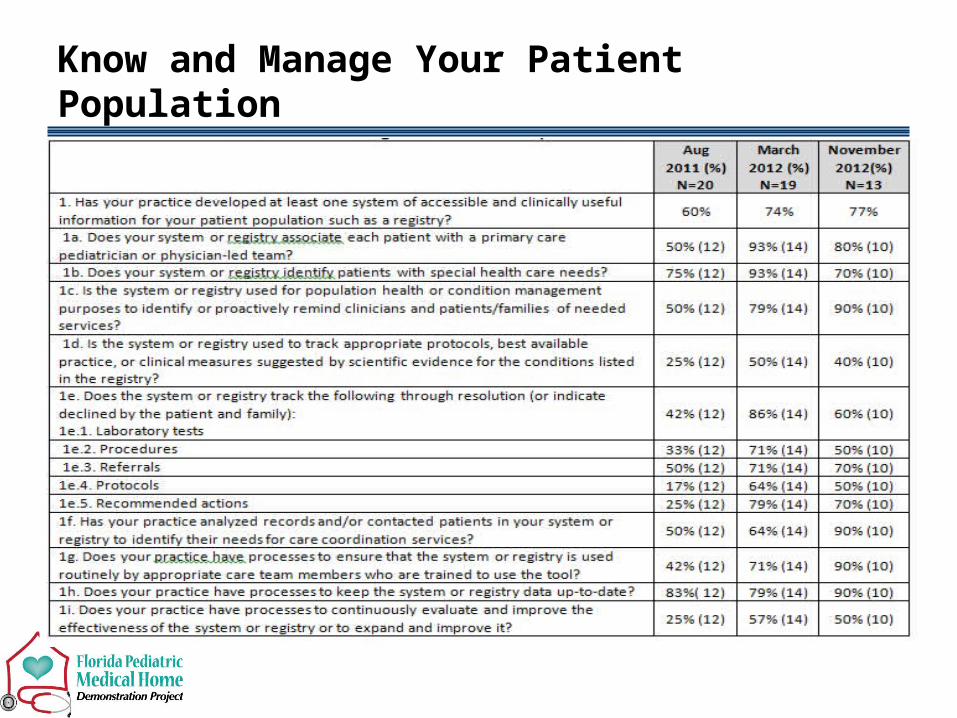
Know and Manage Your Patient Population
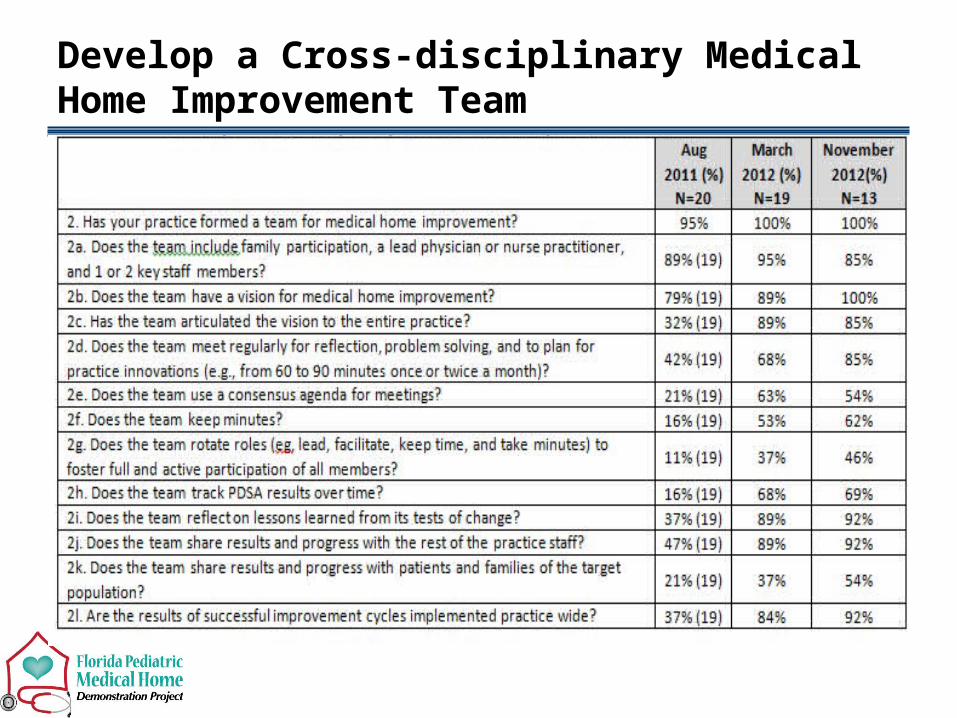
Develop a Cross-disciplinary Medical Home Improvement Team
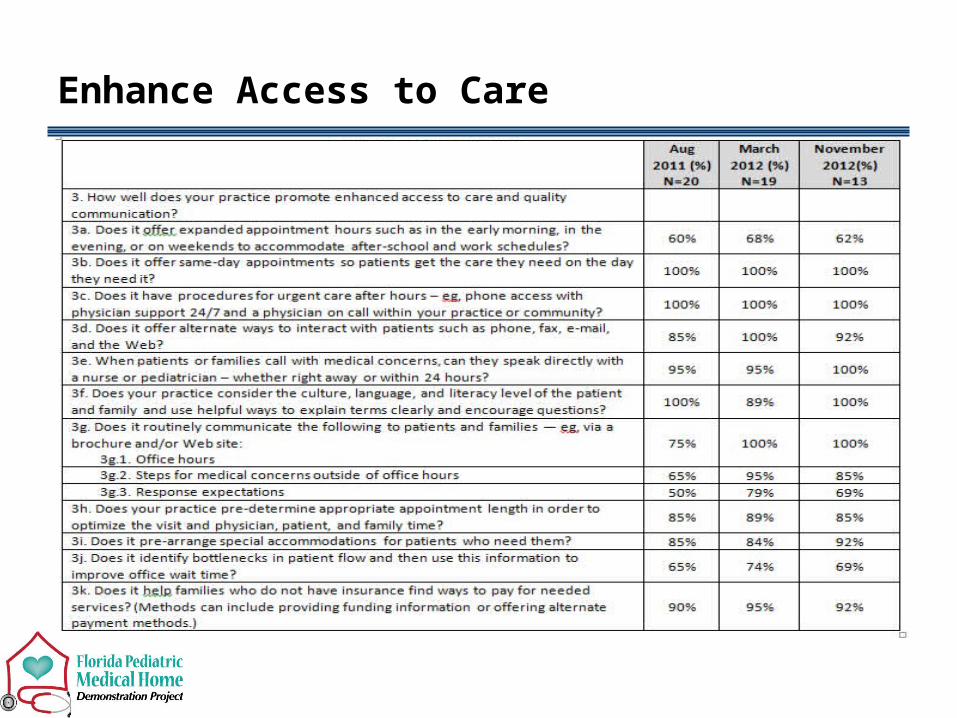
Enhance Access to Care
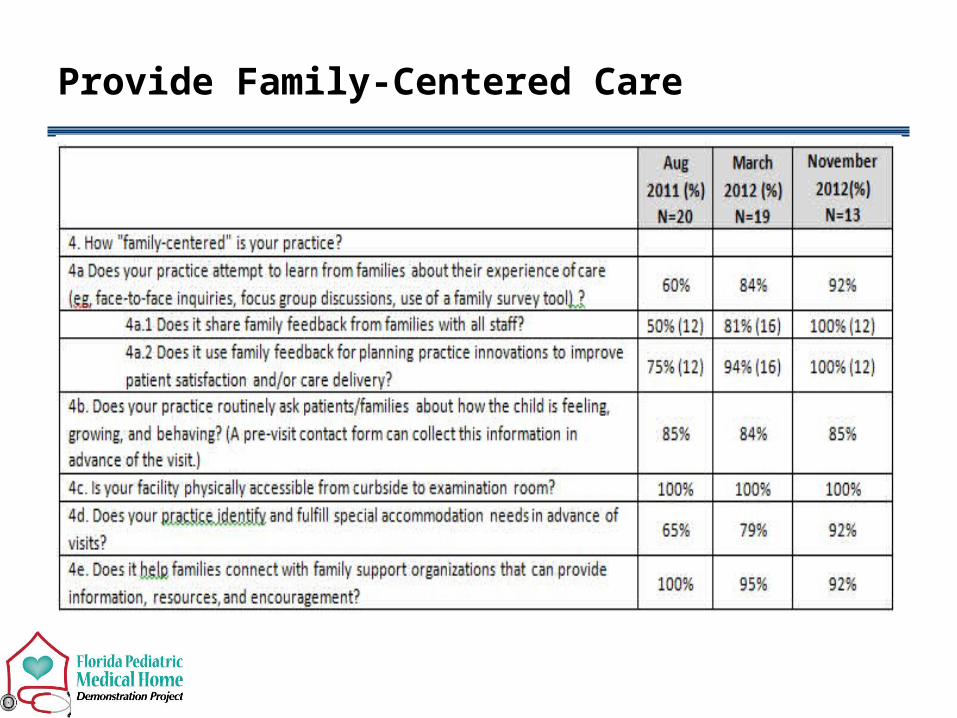
Provide Family-Centered Care
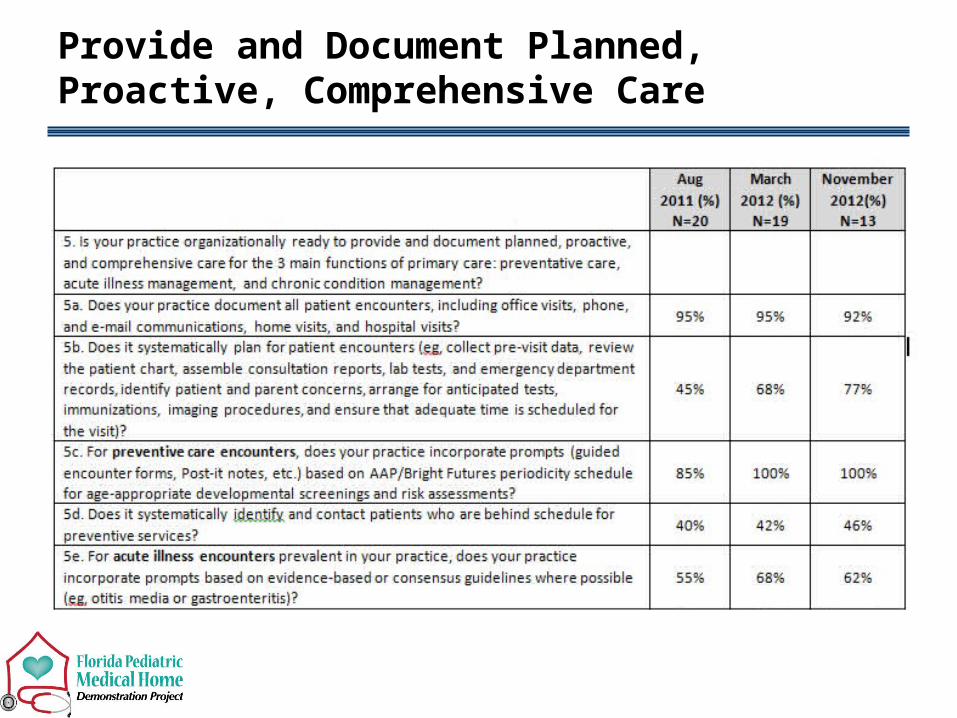
Provide and Document Planned, Proactive, Comprehensive Care
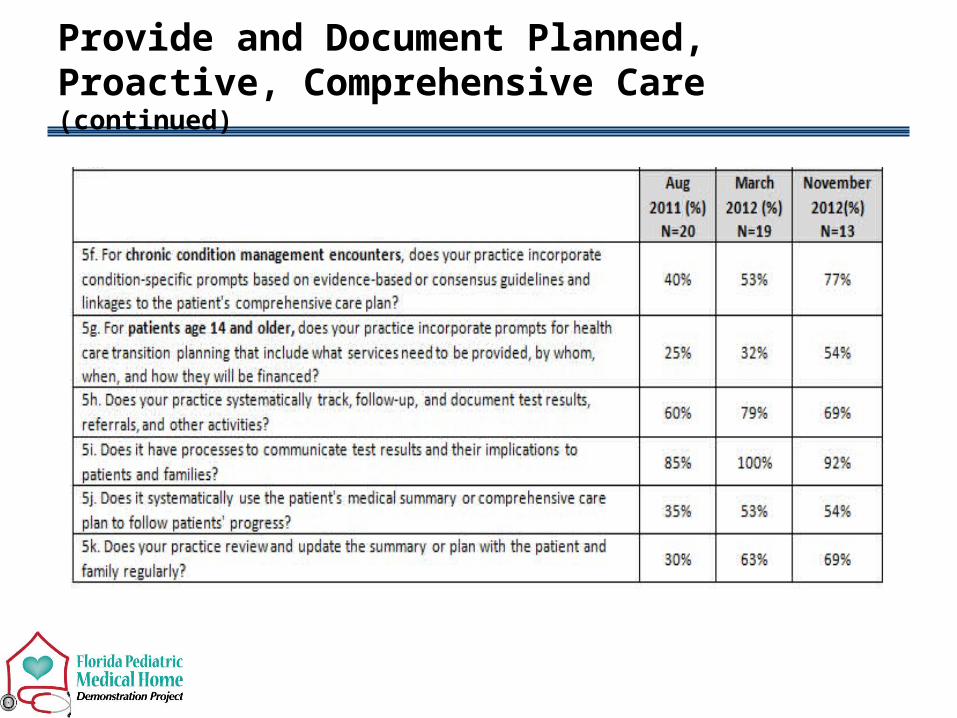
Provide and Document Planned, Proactive, Comprehensive Care (continued)
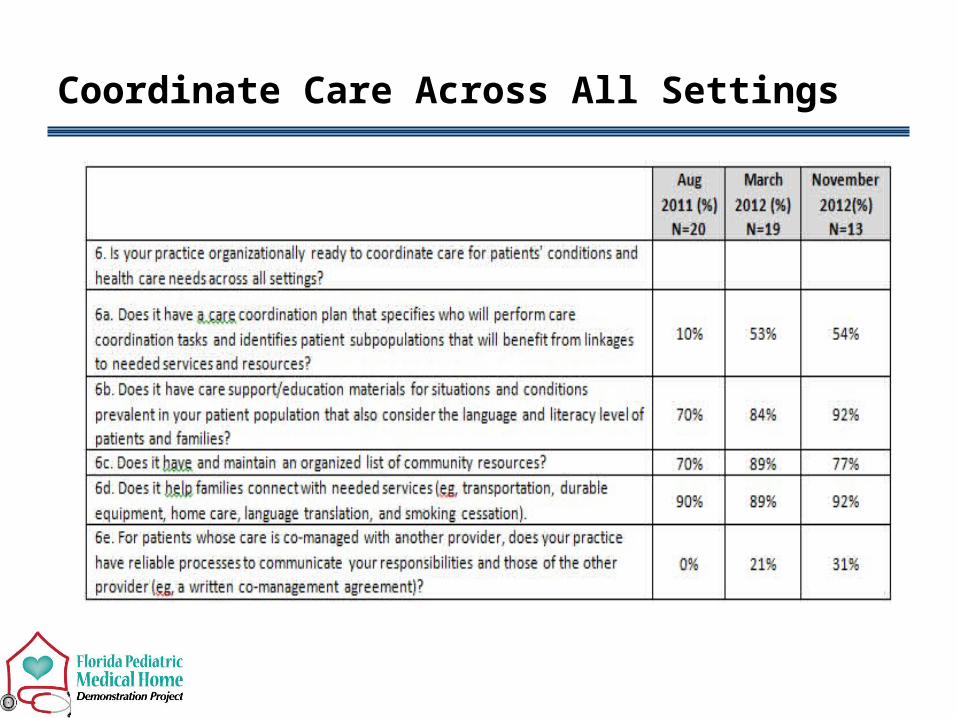
Coordinate Care Across All Settings
The end of this formal collaborative is only the beginning…
---Success is only a step in the right direction
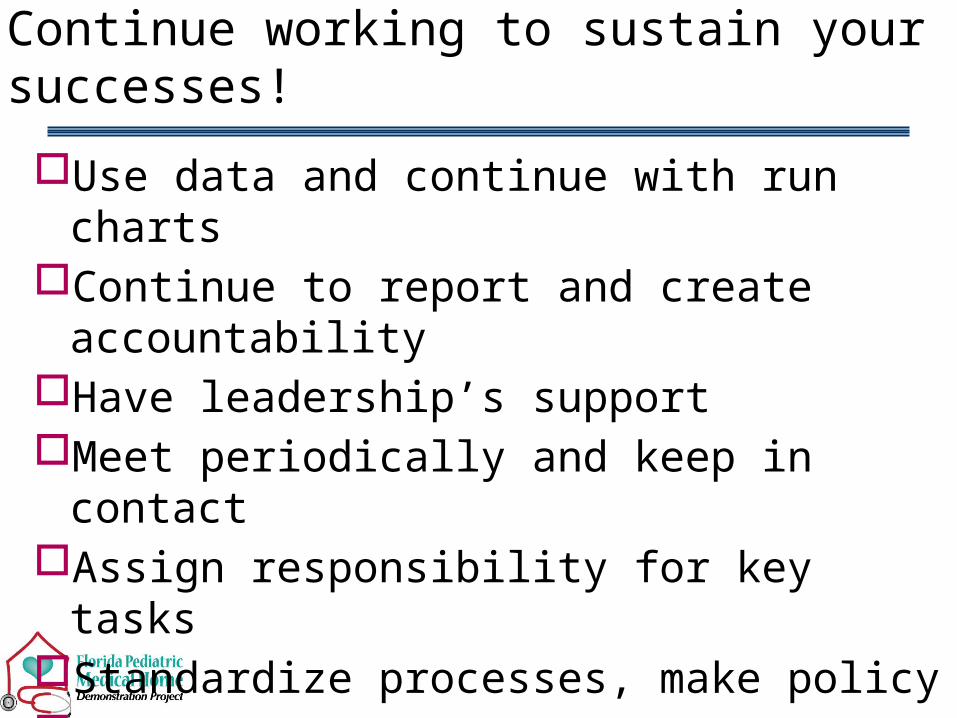
Continue working to sustain your successes!
Use data and continue with run chartsContinue to report and create accountabilityHave leadership’s supportMeet periodically and keep in contactAssign responsibility for key tasksStandardize processes, make policyTrain and orientKeep in contact with other teams

Questions/Comments?