Embed Size (px)
Citation preview
IV
ECONOMIC OUTLOOK AND POLICY DIRECTION
PART
216 PART IV 2013 ECONOMIC REPORT ON INDONESIA
The direction of the economy, which began to show signs of improvement in the final quarter of 2013, is a key factor in determining the prospect of the Indonesia’s economy. Bank Indonesia expects to see more balanced growth in 2014 that will lead to strengthened economic stability. Indonesia’s economy is expected to grow in the range of 5.5%-5.9% with more balanced sources of growth between external and domestic demand. On one hand, improvement in the external demand is expected to continue and thereby boost exports performance. On the other hand, domestic demand continue to moderate so that imports and inflation will remain in check. Accordingly, the ratio of current account deficit is expected to fall below 3% of GDP with inflation rate stays within its target range of 4.5% ± 1%.
Indonesia’s economy is expected to perform better in 2014, although some risks remain, both from external and domestic side. From the external side, China’s rebalancing strategy from investment-oriented growth towards more consumption-oriented growth may have an adverse impact to Indonesia’s exports performance. In addition, the atmosphere of uncertainty that overshadows the tapering policy of the Federal Reserve in the US could slow portfolio capital inflows. From the domestic side, risk factors come from rising inflation of food prices originating from weather anomalies and natural disasters. Risks also come from administered prices hike and exchange rate depreciation. In relation to the enactment of the Mineral and Coal Mining (Minerba) Law, the policy will favourably impact exports in the medium term although in the short term it will reduce Indonesia exports performance if the process of building smelters falls behind schedule.
The dynamics of the domestic economy in 2013 provided a number of valuable lessons in terms of confronting
the risk factors faced in 2014. The first lesson is the importance of disciplined macroeconomic policy, fiscal and monetary, to maintain stability and sustainability of economic growth. Second, the policy response cannot merely rely on single type of policy but requires an appropriate set of policy mix. Third, a bold policy response demands support from sound financial system and corporate sector’s balance sheets. Fourth, intensive communication is crucial to anchor market perceptions. Fifth, the importance of close coordination between policymakers to enhance policy effectiveness. Sixth, the importance of strengthening structural policy to sustain economic growth, including fuel subsidy management policy, real sector policy, and financial sector policy, mainly related to financial deepening.
Learning from the experience in the past year and considering some risk factors, Bank Indonesia will remain focused on efforts to maintain economic and financial system stability through strengthening the policy mix. Monetary policy will be geared towards achieving the inflation target and reducing the current account deficit to a more sustainable level through interest rate and exchange rate stabilisation, consistent with its fundamental. Reinforcing monetary operations, managing the flow of foreign exchange, and financial market deepening will be intensified to support the effectiveness of policy rate and exchange rate transmission, while simultaneously improve the structure and capacity of the financial system to provide financing for the economic development. Macroprudential policy will remain focused on mitigating systemic risk in the financial sector as well as managing credit and liquidity to promote macroeconomic stability management. Bank Indonesia will also broaden public access to banking services (financial inclusion). Payment system policy will continue to encourage the development of more secure,
ECONOMIC OUTLOOK AND POLICY DIRECTION
Part IV
2172013 ECONOMIC REPORT ON INDONESIA PART IV
efficient, and seamless domestic payment system. Those policies will be supplemented by policy coordination with the Government and other relevant financial sector authorities.
In the medium term, the economy of Indonesia is projected to accelerate with a low rate of inflation and a sound current account structure. Notwithstanding, this prognosis depends heavily on the capacity to overcome the array of structural challenges that currently overshadow the domestic economy. The challenges relate to the structure of financing, the structure of domestic production, including energy and food security as well as the impact of managing subsidies in the state budget. The Government and Bank Indonesia have implemented an array of reform measures to overcome structural challenges faced. Apart from the achievements already accomplished, expediting the implementation of existing structural reform policy remains imperative. Structural policy includes efforts to deepen domestic financial markets, efforts to reinforce the production structure and
integrate with global value chains, as well as efforts to optimally manage fuel subsidies in order to provide fiscal space to support sustainable economic growth. Advancing structural reform efforts is expected to prevent Indonesia from falling into a middle-income trap.
Bank Indonesia predicts that if the structural reforms proceed smoothly, economic growth will arrive at 6.5% in 2018, accompanied by a low level of inflation in line with its medium-term target and a sound current account balance. The economic outlook in the long term is even more propitious if the variety of efforts implemented to boost industrial capacity come to fruition as expected. Furthermore, the prospects of the Indonesian economy would be more impressive if the policy preconditions to boost economic productivity and competitiveness are also met. Nonetheless, if the structural reforms are not implemented as planned, economic growth will be lower than that projected and accompanied by a higher rate of inflation and limited improvement in the current account deficit.
2172013 ECONOMIC REPORT ON INDONESIA PART IV

CHAPTER
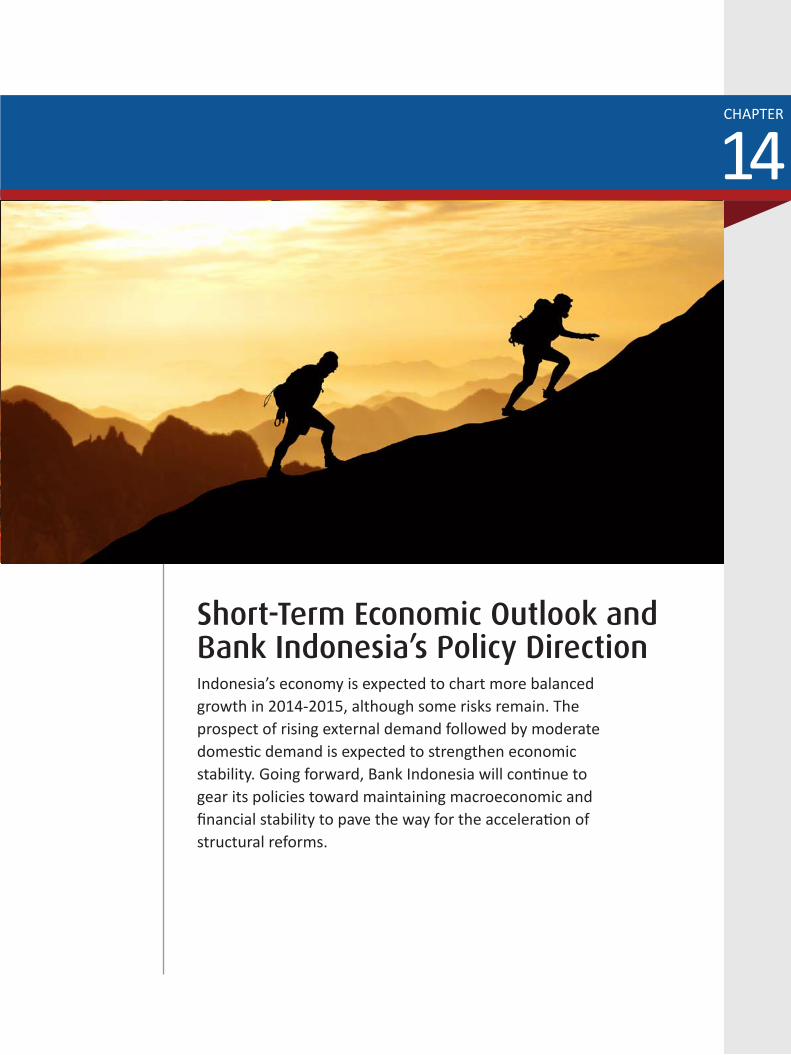
Indonesia’s economy is expected to chart more balanced growth in 2014-2015, although some risks remain. The prospect of rising external demand followed by moderate domestic demand is expected to strengthen economic stability. Going forward, Bank Indonesia will continue to gear its policies toward maintaining macroeconomic and financial stability to pave the way for the acceleration of structural reforms.
Short-Term Economic Outlook and Bank Indonesia’s Policy Direction
14
220 CHAPTER 14 2013 ECONOMIC REPORT ON INDONESIA
Indonesia’s economic condition, which started to improve in the final quarter of 2013, has become a key factor in determining the prospect of the Indonesia’s economy. Bank Indonesia expects that maintained stability and more balanced growth will be able to bring current-account deficit toward a more moderate level and contain inflation within its target range. However, some risks remain, both from global and domestic. Globally, risk factors come from the impact of shifting global economic landscape and China’s rebalancing strategy that may affect Indonesia’s capital inflow and exports performance. Domestically, risk factors come from rising inflation of food prices originating from weather anomalies, natural disasters, administered prices hike, exchange rate depreciation, as well as the enactment of the Mineral and Coal Mining (Minerba) Law. Those domestic risk factors may adversely affect Indonesia’s inflation rate and exports performance.
The dynamics of the domestic economy in 2013 provided a number of valuable lessons to support Indonesia’s sustainable economic growth going forward. The first lesson is the importance of disciplined macroeconomic policy, fiscal and monetary, to maintain stability and sustainability of economic growth. The dynamics of Indonesia’s economy in 2013 showed the importance of macroeconomic policy to remain focused on maintaining the balance in the economy to prevent excessive growth that may put pressure on current-account and inflation. In this regard, pre-emptive monetary policy with a focus on inflation control along with consistent fiscal policy to preserve fiscal resilience is the cornerstone of overall economic resilience. Second, amid structural and cyclical factors confronting Indonesia’s economy, policy response cannot rely only on single type of policy. The use of single policy to address various complex issues may put policy maker into difficult position. Third, a strong policy response requires support from sound financial system and corporate sector’s balance sheets. In the absence of those factors, the policy will face a dilemma between stabilization on one hand and weak corporation and financial system on the other hand. Fourth, intensive communication is crucial to anchor market perceptions. Fifth, close coordination between policymakers is an important element of strengthening policy effectiveness. The sixth lesson is the importance of strengthening structural policy to sustain economic growth.
Learning from the economic lessons of 2013 and the myriad of risks faced, Bank Indonesia will continue to focus its policy in 2014 on maintaining economic and financial system stability through a sound policy mix. Monetary policy will be geared towards achieving the inflation target and reducing the current account
deficit to a more sustainable level through interest rate and exchange rate policy. Reinforcing monetary operations, managing the flow of foreign exchange, and financial market deepening will be intensified to support the effectiveness of policy rate and exchange rate transmission, while simultaneously improve the structure and capacity of the financial system to provide financing for the economic development. Macroprudential policy will remain directed towards systemic risk mitigation in the financial sector as well as controlling credit and liquidity in line with macroeconomic stability management. Bank Indonesia will also broaden public access to banking services (financial inclusion). Payment system policy will continue to encourage the development of more secure, efficient, and seamless domestic payment system. Those policies will be supplemented by policy coordination with the Government and other relevant financial sector authorities.
14.1. Short-Term Economic Outlook
Bank Indonesia forecasts the economic prospects of advanced countries to improve in 2014 (Table 14.1). The United States economy will continue to perform better marked by increasingly strong domestic demand and supported by fiscal consolidation in 2014. Meanwhile, economic conditions in Europe are also showing signs of recovery. Conversely, Japan’s economy is expected to decelerate in response to tighter fiscal policy stance adopted in 2014. In developing countries, the economy of China is expected to remain relatively stable in line with the transition process towards more balanced and sustainable growth. Similarly, the economy of India will continue to expand, buttressed by structural policy to stimulate investment.
Global economic performance in 2014 and 2015 is projected to improve moderately. Global economic growth is predicted to achieve 3.9% in 2015 and spur 5.1% growth in world trade volume. In line with more robust global economic performance, non-oil and gas commodity prices are expected to rise 2.1% in 2015 after slipping 8.8% in 2013. On the other hand, potential additional supply of crude oil in the United States may lower the international oil price to the US$100 per barrel in 2015. Meanwhile, economic recovery in advanced countries will be followed by tighter monetary policy, indicated by a rising LIBOR rate to around 0.73% in 2015.
In line with favourable global economic prospect, the economic outlook for Indonesia in 2014 is expected in
2212013 ECONOMIC REPORT ON INDONESIA CHAPTER 14
the range of 5.5-5.9%. As the global economy recovers, the main driver of the economic growth will come from external demand, while domestic demand continues to moderate (Table 14.2).
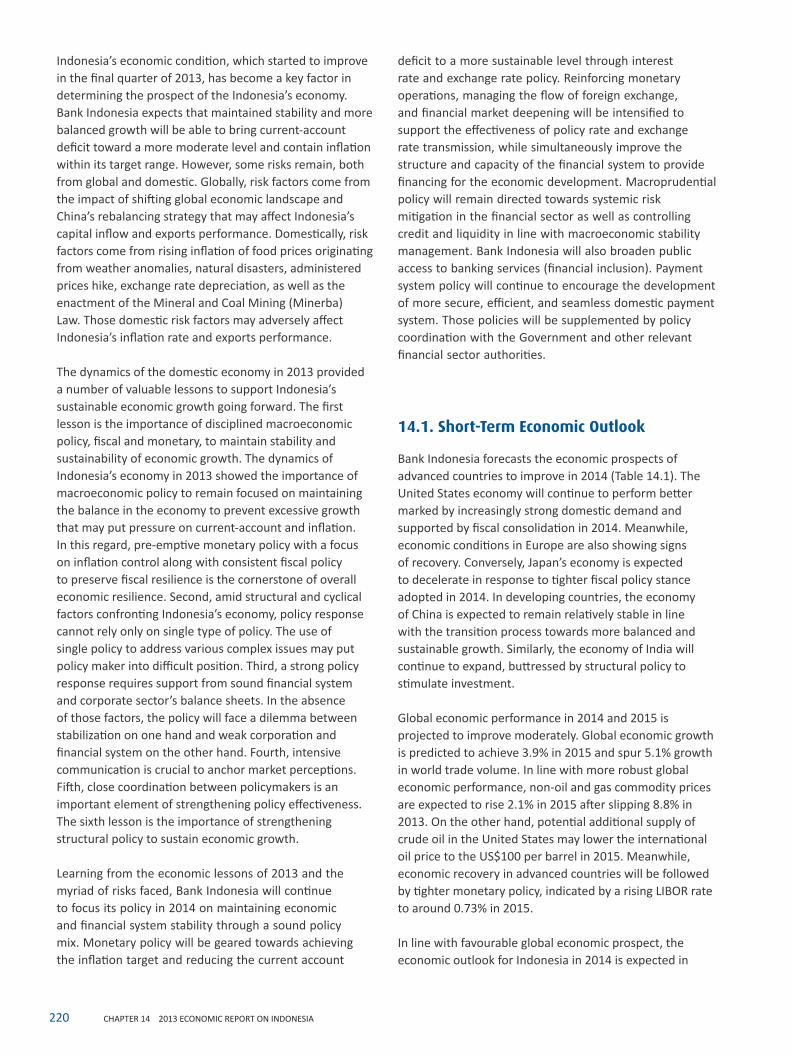
Household consumption will grow modestly in 2014 in the range of 4.9-5.3%. Consumption will be underpinned by a lower dependency ratio, thereby providing additional space for working population to increase their consumptions (Chart 14.1). Furthermore, there are a number of factors that will boost purchasing power and consumption, namely wage hikes and increases in the salaries of civil servants, military and police personnel as well as pensioners, in addition to decelerating inflation rate to its target corridor of 4.5±1%. Household consumption growth will also be buoyed by spending related to upcoming legislative and presidential elections in 2014. Nonetheless, the overall impact of the elections in 2014 on economic growth will only account for 0.1%, less pronounced than it was in 2009 at 0.2%. The relatively benign spill over effect from the elections on household consumption is partly attributable to new regulations limiting the activities and use of funds related to the election to ensure greater efficiency and effectiveness. On the other hand, growth in household consumption stemming from the elections in 2014 is expected to have only mild impact on inflation, as the majority of spending is in the form of advertising and campaign activities.
Government spending, in real terms, is expected to grow by around 6.0-6.4% in 2014, exceeding that in the previous year due to, in part, the spending related to upcoming election. Corresponding to the Government Action Plan for 2014, government spending policy will be directed towards four pillars. The first is to support robust economic growth (pro-growth). Second is to boost productivity in order to expand employment opportunities (pro-job). Third is to broaden the poverty alleviation program (pro-poor). Fourth is to advocate
environmentally sound development (pro-environment).
Investment in 2014 is expected to grow in the range of 5.4-5.8%, exceeding that posted in the previous year. That forecast is supported by government efforts to improve the efficacy of its national spending by increasing allocation of productive spending. The allocation of productive spending will focus on infrastructure development to boost competitiveness and production capacity. The commitment is seen in the plan to increase the allocation of capital expenditure from Rp192.6 trillion in 2013 to Rp229.5 trillion in 2014. That rising capital spending is expected to create value added, boost economic capacity and expand employment opportunities.
The positive perception prevalent in the business community apropos future investment prospects also supports favourable investment projections. This is illustrated in the publication of United Nations Conference on Trade and Development (UNCTAD), World Investment Prospects Survey 2013-2015, which places Indonesia in
Table 14.1. World GDP Forecast (% yoy) Table 14.2. GDP Growth Forecast by Expenditure
Chart 14.1. Indonesia Demographic Structure and Dependency Ratio
CountriesProjection
2013 2014 2015
World GDP 3.0 3.6 3.9
United States of America 1.9 2.8 3.0
Japan 1.7 1.7 1.1
Euro Zone -0.4 0.9 1.4
China 7.7 7.5 7.5
India 4.4 5.3 6.4
Component 2013 2014* 2015*
Household Consumption 5.3 4.9 - 5.3 5.0 - 5.4
Government Consumption 4.9 6.0 - 6.4 3.4 - 3.8
Gross Fixed Capital Formation 4.7 5.4 - 5.8 5.8 - 6.2
Goods and Services Export 5.3 8.1 - 8.5 8.5 - 8.9
Goods and Services Import 1.2 5.4 - 5.8 7.1 - 7.5
GDP 5.8 5.5 - 5.9 5.8 - 6.2
* Bank Indonesia projection
222 CHAPTER 14 2013 ECONOMIC REPORT ON INDONESIA
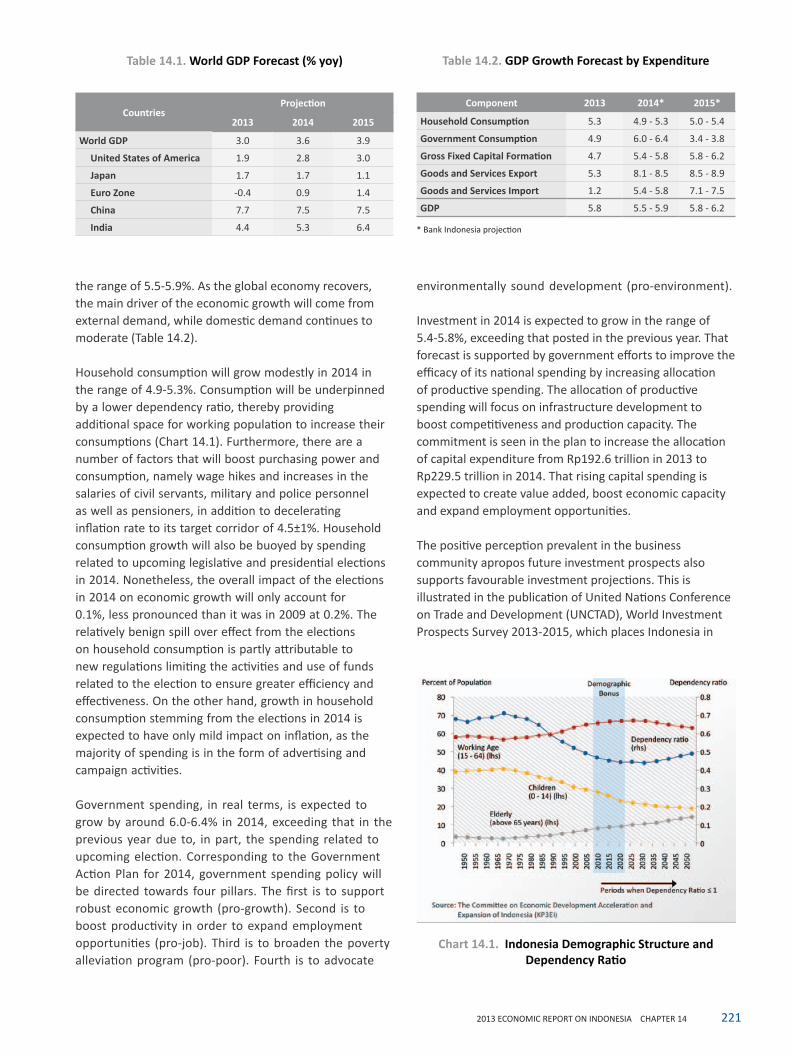
fourth position as a prospective investment destination (Chart 14.2). That view is further endorsed by the assessments of credit rating agencies, which affirmed Indonesia’s status as investment grade (refer to Box 14.1 Analysis of Indonesia’s Credit Rating). Meanwhile, in line with implementation of the Mineral and Coal Mining (Minerba) Law, investment in the form of smelter development is expected to raise the overall level of investment. Nonetheless, amid all the optimism on investment, the projection of investment growth in 2014 is relatively moderate due to the wait-and-see stance in the business community during election.
Exports growth in 2014 is projected to be higher than it was in the previous year. this rising exports growth is in line with recovery in the global economy (Chart 14.3). The majority of Indonesia’s leading exports destinations are on an upward economic growth trends over the coming years, which can stimulate demand for exports of goods from Indonesia. On the other hand, implementation of policy to limit exports of raw minerals is expected to supress exports growth in 2014. However, with some measures to boost competitiveness as well as promote diversification of market and export products, exports growth is expected to arrive at the range of 8.1-8.5%.
Exports and investment growth prospects in 2014 will bring imports growth in the range of 5.4-5.8%. In line with stronger investment growth, imports of capital goods in the form of machinery and equipment, among others related to the construction of smelters, are expected to pick up. Persistently solid production activity, among others to meet the rising demand for exports, will drive imports of raw materials. Notwithstanding, a variety of government programs aimed at discouraging imports,
for instance the use of biofuels produced domestically and raising taxes on specific imported goods, will ensure relatively moderate imports growth.
In 2015, domestic economic growth is expected to outpace that in 2014, and arrive at the range of 5.8%-6.2%. That forecast is primarily supported by strong demand for investment after new government is installed following the general election and an upswing in exports growth as the global economy recovers and international commodity prices rebound.
From the production side, the manufacturing sector, the trade, hotels and restaurants sector as well as the transportation and communication sector will become a main economic driver of economic growth in 2014. The general election will also contribute to domestic economic growth from the production side through greater spending in the financial services sector, leasing and corporate services as well as the trade, hotels and restaurants sector. Conversely, similar to the previous year, the mining sector will continue to record limited growth (Table 14.3).
The manufacturing sector is expected to achieve moderate growth in the range of 5.3-5.7% in 2014. Amid increasingly favourable global economic conditions and a rebound in world trade volume, the on going stabilisation process will spur moderate growth in the manufacturing sector. The outlook for the manufacturing sector is also linked to a number of government policies to restore manufacturing sector performance, including the industry acceleration and revitalisation program. In addition, the general election in 2014 will also catalyse growth in the food and beverages subsector, surpassing that in 2013. Additional growth is predicted in the automotive subsector as a
Chart 14.3. Indonesia’s Export and World GDP GrowthChart 14.2. Top Investment Destinations
2232013 ECONOMIC REPORT ON INDONESIA CHAPTER 14
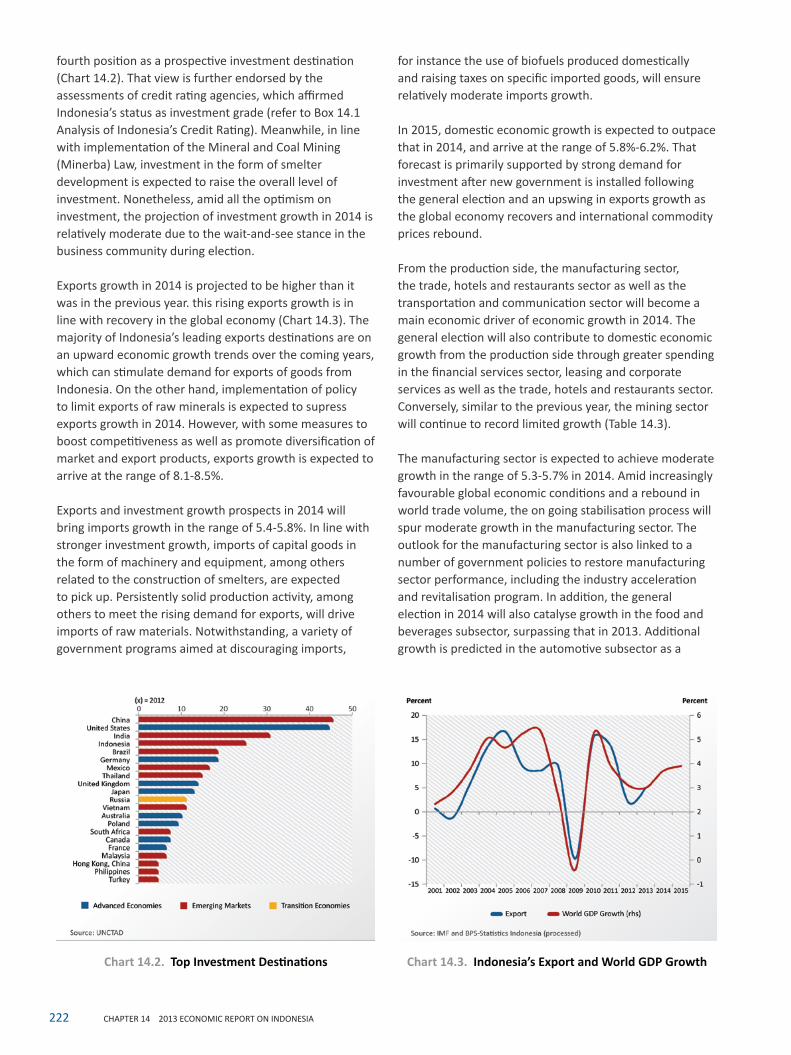
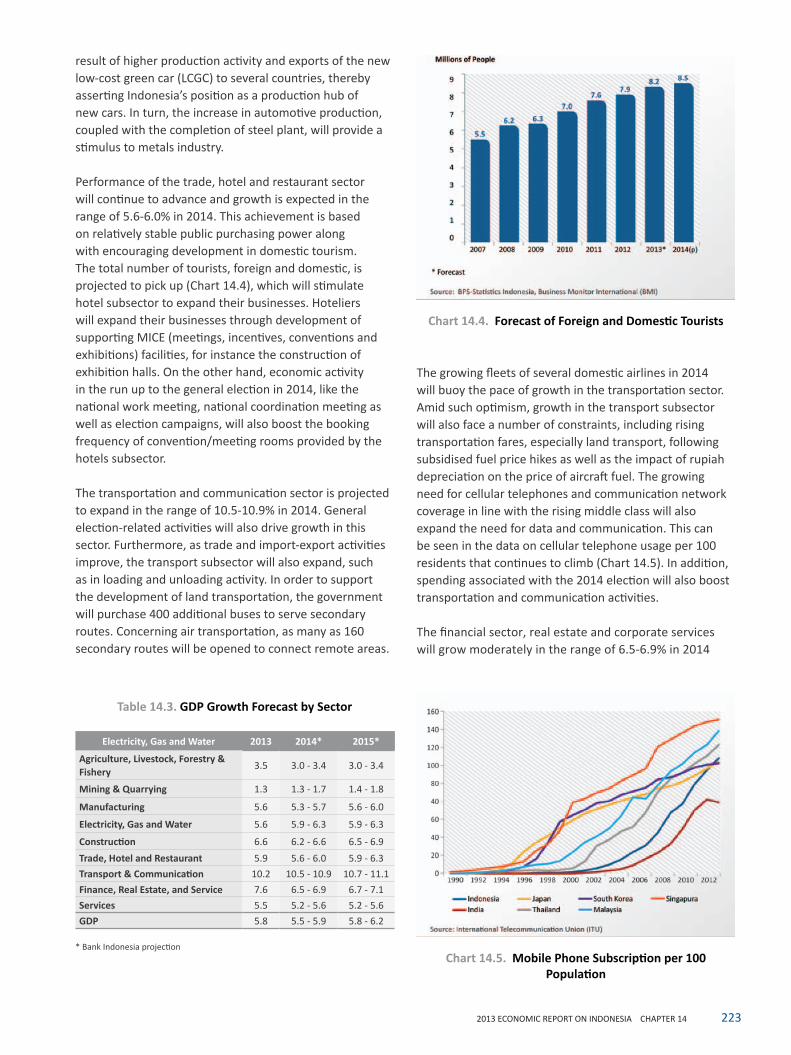
The growing fleets of several domestic airlines in 2014 will buoy the pace of growth in the transportation sector. Amid such optimism, growth in the transport subsector will also face a number of constraints, including rising transportation fares, especially land transport, following subsidised fuel price hikes as well as the impact of rupiah depreciation on the price of aircraft fuel. The growing need for cellular telephones and communication network coverage in line with the rising middle class will also expand the need for data and communication. This can be seen in the data on cellular telephone usage per 100 residents that continues to climb (Chart 14.5). In addition, spending associated with the 2014 election will also boost transportation and communication activities.
The financial sector, real estate and corporate services will grow moderately in the range of 6.5-6.9% in 2014
result of higher production activity and exports of the new low-cost green car (LCGC) to several countries, thereby asserting Indonesia’s position as a production hub of new cars. In turn, the increase in automotive production, coupled with the completion of steel plant, will provide a stimulus to metals industry.
Performance of the trade, hotel and restaurant sector will continue to advance and growth is expected in the range of 5.6-6.0% in 2014. This achievement is based on relatively stable public purchasing power along with encouraging development in domestic tourism. The total number of tourists, foreign and domestic, is projected to pick up (Chart 14.4), which will stimulate hotel subsector to expand their businesses. Hoteliers will expand their businesses through development of supporting MICE (meetings, incentives, conventions and exhibitions) facilities, for instance the construction of exhibition halls. On the other hand, economic activity in the run up to the general election in 2014, like the national work meeting, national coordination meeting as well as election campaigns, will also boost the booking frequency of convention/meeting rooms provided by the hotels subsector.
The transportation and communication sector is projected to expand in the range of 10.5-10.9% in 2014. General election-related activities will also drive growth in this sector. Furthermore, as trade and import-export activities improve, the transport subsector will also expand, such as in loading and unloading activity. In order to support the development of land transportation, the government will purchase 400 additional buses to serve secondary routes. Concerning air transportation, as many as 160 secondary routes will be opened to connect remote areas.
Table 14.3. GDP Growth Forecast by Sector
Chart 14.4. Forecast of Foreign and Domestic Tourists
Electricity, Gas and Water 2013 2014* 2015*
Agriculture, Livestock, Forestry & Fishery 3.5 3.0 - 3.4 3.0 - 3.4
Mining & Quarrying 1.3 1.3 - 1.7 1.4 - 1.8
Manufacturing 5.6 5.3 - 5.7 5.6 - 6.0
Electricity, Gas and Water 5.6 5.9 - 6.3 5.9 - 6.3
Construction 6.6 6.2 - 6.6 6.5 - 6.9Trade, Hotel and Restaurant 5.9 5.6 - 6.0 5.9 - 6.3Transport & Communication 10.2 10.5 - 10.9 10.7 - 11.1Finance, Real Estate, and Service 7.6 6.5 - 6.9 6.7 - 7.1Services 5.5 5.2 - 5.6 5.2 - 5.6GDP 5.8 5.5 - 5.9 5.8 - 6.2
* Bank Indonesia projectionChart 14.5. Mobile Phone Subscription per 100
Population
224 CHAPTER 14 2013 ECONOMIC REPORT ON INDONESIA
as the economic rebalancing process continues. Election spending in 2014 through the corporate services subsector will stimulate spending on advertisements in the media, both print media and electronic. Against this favourable backdrop, the impact of fuel price hike in 2013 will continue to be felt in the financial subsector, marked by slower credit expansion. Such condition was driven by higher policy rate, which could potentially reduce bank’s profitability as net interest margin become smaller.
Global economic recovery will help maintain the domestic economic outlook for 2015. Economic growth will be driven by three leading sectors, namely the manufacturing sector, trade, hotel and restaurant sector as well as transportation and communication sector. Moreover, resilient public purchasing power following expansion of middle class will also underpin economic performance.
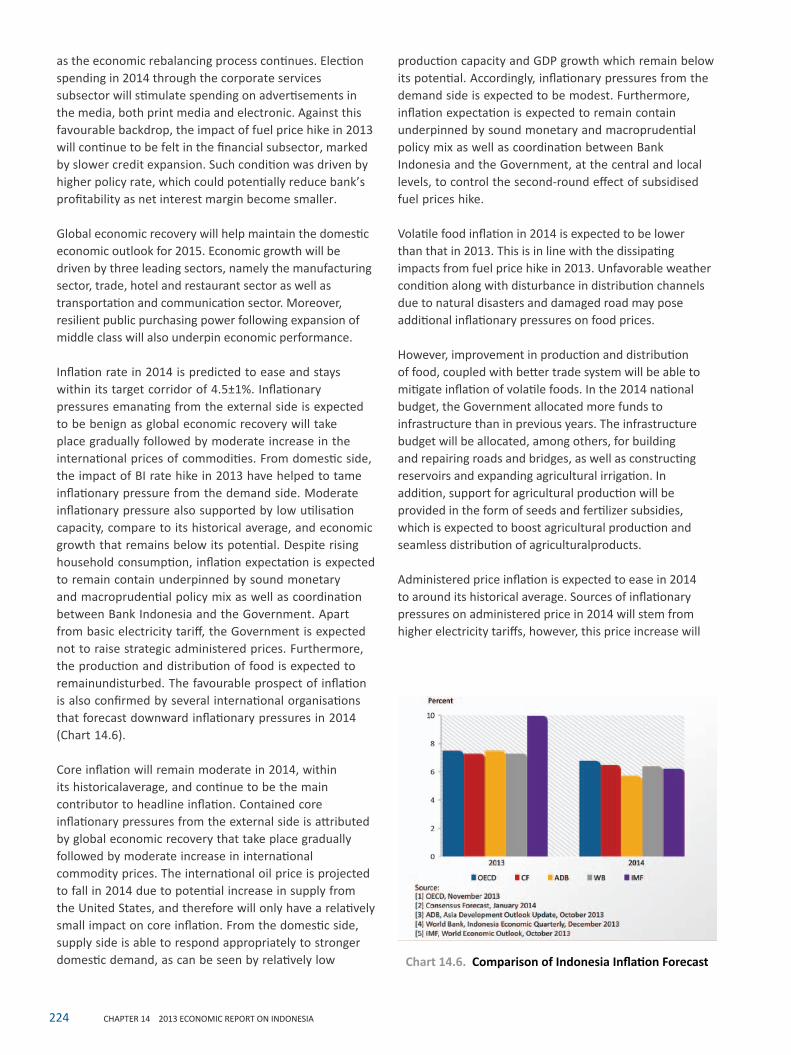
Inflation rate in 2014 is predicted to ease and stays within its target corridor of 4.5±1%. Inflationary pressures emanating from the external side is expected to be benign as global economic recovery will take place gradually followed by moderate increase in the international prices of commodities. From domestic side, the impact of BI rate hike in 2013 have helped to tame inflationary pressure from the demand side. Moderate inflationary pressure also supported by low utilisation capacity, compare to its historical average, and economic growth that remains below its potential. Despite rising household consumption, inflation expectation is expected to remain contain underpinned by sound monetary and macroprudential policy mix as well as coordination between Bank Indonesia and the Government. Apart from basic electricity tariff, the Government is expected not to raise strategic administered prices. Furthermore, the production and distribution of food is expected to remainundisturbed. The favourable prospect of inflation is also confirmed by several international organisations that forecast downward inflationary pressures in 2014 (Chart 14.6).
Core inflation will remain moderate in 2014, within its historicalaverage, and continue to be the main contributor to headline inflation. Contained core inflationary pressures from the external side is attributed by global economic recovery that take place gradually followed by moderate increase in international commodity prices. The international oil price is projected to fall in 2014 due to potential increase in supply from the United States, and therefore will only have a relatively small impact on core inflation. From the domestic side, supply side is able to respond appropriately to stronger domestic demand, as can be seen by relatively low
production capacity and GDP growth which remain below its potential. Accordingly, inflationary pressures from the demand side is expected to be modest. Furthermore, inflation expectation is expected to remain contain underpinned by sound monetary and macroprudential policy mix as well as coordination between Bank Indonesia and the Government, at the central and local levels, to control the second-round effect of subsidised fuel prices hike.
Volatile food inflation in 2014 is expected to be lower than that in 2013. This is in line with the dissipating impacts from fuel price hike in 2013. Unfavorable weather condition along with disturbance in distribution channels due to natural disasters and damaged road may pose additional inflationary pressures on food prices.
However, improvement in production and distribution of food, coupled with better trade system will be able to mitigate inflation of volatile foods. In the 2014 national budget, the Government allocated more funds to infrastructure than in previous years. The infrastructure budget will be allocated, among others, for building and repairing roads and bridges, as well as constructing reservoirs and expanding agricultural irrigation. In addition, support for agricultural production will be provided in the form of seeds and fertilizer subsidies, which is expected to boost agricultural production and seamless distribution of agriculturalproducts.
Administered price inflation is expected to ease in 2014 to around its historical average. Sources of inflationary pressures on administered price in 2014 will stem from higher electricity tariffs, however, this price increase will
Chart 14.6. Comparison of Indonesia Inflation Forecast
2252013 ECONOMIC REPORT ON INDONESIA CHAPTER 14
not compromise Bank Indonesia efforts to control inflation within its target corridor of 4.5±1% in 2014.
In 2015, inflation is expected to fall further to around 4.0±1%, supported by a range of policies instituted to control inflation. Core inflation will remain in check on the back of anchored inflation expectation. Inflation of volatile foods is also projected to moderate in line with increased food production and better trade procedures. The administered price inflation will resume to low levels in the absence of policies to raise the prices of strategic goods and services.
Balance of payments is expected to improve in 2014, buoyed by an improvement in the current account deficit which fall to below 3% of GDP, which is lower than that in 2013. Lower current account deficit is mainly driven by recovery in the global economy and international commodity prices that will boost exports performance. Furthermore, a variety of government efforts to curb imports, among other, through promoting greater usage of biofuels and raising taxes on imported goods will also help reduce the current account deficit. In the financial and capital account, foreign capital flows will continue to surge throughout 2014. Such optimism is underpinned by monetary policy that focuses on macroeconomic stability, reducing the current account deficit and better global financial markets. The improvement in external financing will contribute to an improvement in the balance of payments and reinforce international reserves position.
The prospects of the banking sector will remain overshadowed by relatively moderate domestic economic expansion and relatively high interest rates. In this context, credit growth in the banking sector will slow in the range of 15-17%, supported by growth of deposits in a similar range. This credit growth forecast is consistent with Bank Indonesia efforts to stabilise the domestic economy. Bank Indonesia will continue to encourage banking sector to play an active role in supporting efforts to manage economic balance through setting apropriate credit growth targets in its business plan.
Although Indonesia’s economic outlook in the near term will improve with more balanced sources of growth, there are a number of risk factors that may compromise economic stability looking ahead. From the external side, the normalisation policy of the Federal Reserve will prompt the risk of capital outflow from the domestic economy in line with widespread uncertainty and narrowing yield between US Treasury Bills and Indonesia Government Bond (SUN). Meanwhile, the economic downturn in China, attributable to slower credit growth, less liquidity and
the rising cost of capital, may affect Indonesia’s economic outlook through trade channel.
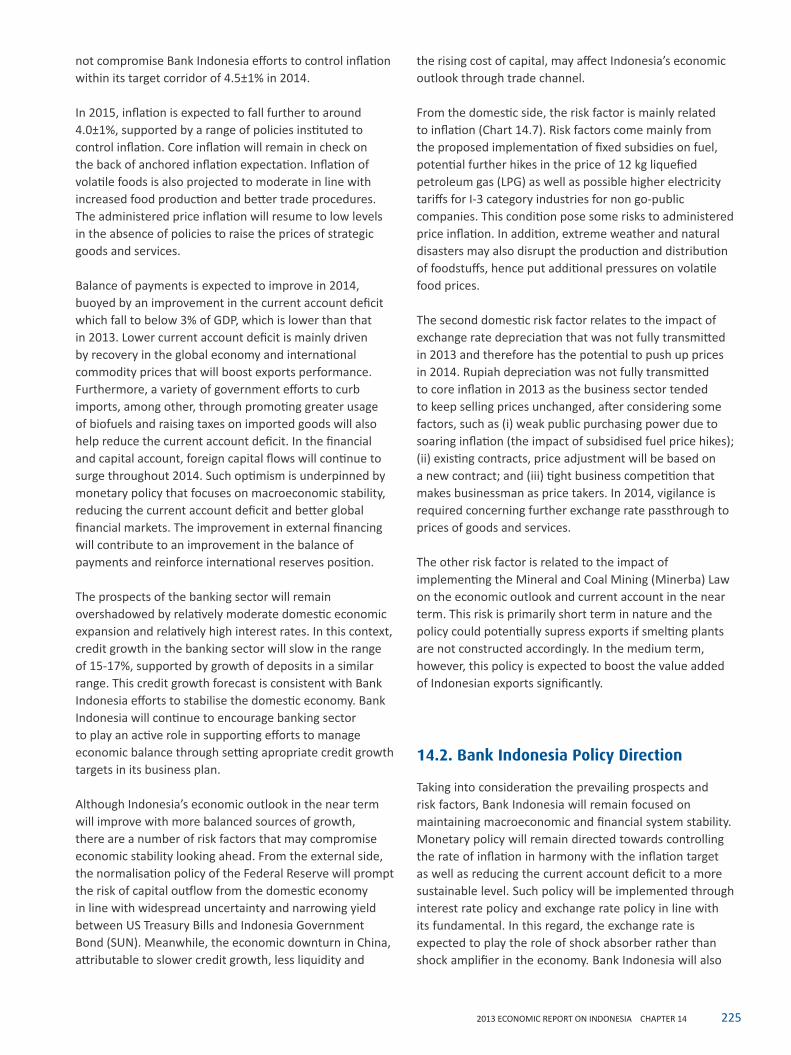
From the domestic side, the risk factor is mainly related to inflation (Chart 14.7). Risk factors come mainly from the proposed implementation of fixed subsidies on fuel, potential further hikes in the price of 12 kg liquefied petroleum gas (LPG) as well as possible higher electricity tariffs for I-3 category industries for non go-public companies. This condition pose some risks to administered price inflation. In addition, extreme weather and natural disasters may also disrupt the production and distribution of foodstuffs, hence put additional pressures on volatile food prices.
The second domestic risk factor relates to the impact of exchange rate depreciation that was not fully transmitted in 2013 and therefore has the potential to push up prices in 2014. Rupiah depreciation was not fully transmitted to core inflation in 2013 as the business sector tended to keep selling prices unchanged, after considering some factors, such as (i) weak public purchasing power due to soaring inflation (the impact of subsidised fuel price hikes); (ii) existing contracts, price adjustment will be based on a new contract; and (iii) tight business competition that makes businessman as price takers. In 2014, vigilance is required concerning further exchange rate passthrough to prices of goods and services.
The other risk factor is related to the impact of implementing the Mineral and Coal Mining (Minerba) Law on the economic outlook and current account in the near term. This risk is primarily short term in nature and the policy could potentially supress exports if smelting plants are not constructed accordingly. In the medium term, however, this policy is expected to boost the value added of Indonesian exports significantly.
14.2. Bank Indonesia Policy Direction
Taking into consideration the prevailing prospects and risk factors, Bank Indonesia will remain focused on maintaining macroeconomic and financial system stability. Monetary policy will remain directed towards controlling the rate of inflation in harmony with the inflation target as well as reducing the current account deficit to a more sustainable level. Such policy will be implemented through interest rate policy and exchange rate policy in line with its fundamental. In this regard, the exchange rate is expected to play the role of shock absorber rather than shock amplifier in the economy. Bank Indonesia will also
226 CHAPTER 14 2013 ECONOMIC REPORT ON INDONESIA
continue to strengthen monetary operations, manage the flow of foreign exchange and persist with financial market deepening to support the effectiveness of policy transmission, while at the same time reinforcing the structure and capacity of the financial system in providing financing for the economy. In addition, to mitigate uncertainty from the global economy, Bank Indonesia continue to take measures to buttress the second line of defence through cooperation between the central bank and financial authorities in the region.
Macroprudential policy will remain directed towards maintaining financial system stability and fostering banking system resilience by prioritising prudential principles. Bank Indonesia will also reinforce the implementation of its new function and jurisdiction as the macroprudential authority. To this end, macroprudential policy will be directed towards managing systemic risk, including credit risk, market risk and liquidity risk as well as strengthening the structure of capital. Furthermore, macroprudential policy will also be directed towards increasing the portion of credit allocated to productive export-oriented sectors and sectors that produce goods for import substitution to strengthen resilience of the external sector and boost economic capacity. With regard to strengthening financial system stability, efforts to enhance macroprudential and microprudential coordination between Bank Indonesia and the Financial Services Authority (OJK) will be maintained to ensure that the tasks, function and authority of both institutions are implemented effectively. Islamic financial development is also a priority in strengthening financial system stability. Developing legal and institutional infrastructure as well as Islamic financial markets, accompanied by supporting
instruments, will be expedited to increase the economic contribution of Islamic-based principles to national economic growth.
In terms of the non-cash payment system, policy will be geared towards increasing security and efficiency as well as expanding access. Regarding non-cash payment settlement infrastructure in Bank Indonesia, completion of the second-generation BI-RTGS system and BI-SSSS as well as development of the SKNBI-NG application will be coninued. Policy to improve the quality of infrastructure outside of Bank Indonesia will be continued through the development of a National Domestic Switch/Domestic Payment Scheme towards implementation of the National Payment Gateway (NPG).
Policy and regulation to boost the efficiency of national economic infrastructure through greater retail payment system efficiency will be continued through development of LCS regions in a number of areas, expanding the use of electronic money to allocate aid from government-to-people (G2P), expanding the use of electronic money to facilitate person-to-person transfers as well as promoting interoperability and interconnectivity.
Bank Indonesia’s role in terms of strengthening the non-cash payment system will also be seen in regulations to protect consumers, followed by the provision of a payment system consumer complaints service operated at Bank Indonesia branches nationwide. Bank Indonesia will also formulate regulations regarding the processing and settlement of non-cash payment transactions. Such regulations will cover the obligation of payment system agents in compliance with prudential principals and risk mitigation.
Looking ahead, Bank Indonesia will explore the possibility of coordination with the Government to provide fiscal incentives for non-cash transaction in order to expand the role of the non-cash payment system.
Concerning currency management, the policy instituted by Bank Indonesia will be directed towards efforts to maintain sufficient rupiah currency availability with appropriate denominations, on time, and fit for circulation. In terms of maintaining the availability of rupiah currency fit for circulation, Bank Indonesia will broaden cooperation with the Government and the Coordination Board for the Eradication of Counterfeit Money (BOTASUPAL) as well as its alignment with Perum Peruri to expand printing capacity for rupiah currency. In addition, Bank Indonesia will coordinate with the Ministry of Finance regarding the issuance of Chart 14.7. Fan Chart of Inflation Forecast 2014-2015
2272013 ECONOMIC REPORT ON INDONESIA CHAPTER 14
Looking ahead, efforts to develop financial inclusion policy will be achieved through innovation and refining existing business processes. Expanding the scope of policy is accomplished gradually considering the potential of the regions. Broadening the targets of financial education will focus on reaching low-income people, including those on government assistance as well as those residing in border regions and remote areas. Digital Financial Services will be developed further, thus ensuring financial services using digital technology will be able to enhance efficiency in banks operation and improve the conditions of the unbanked. Enriching the value added of mapping the unbanked as well as data on commodities will be continued. Consequently, such information will be beneficial to the unbanked people as well as the banking industry.
Regarding MSME development, Bank Indonesia policy is directed towards safeguarding food security and creating new economic centres in the region to help control inflation. Such policy is instituted according to four main strategies. First, expanding the capacity of MSMEs through cluster extensification and intensification based on commodities to ensure food security as well as promoting entrepreneur. Second, broadening financial access to MSMEs through financial infrastructure development, such as credit rating of MSMEs and advocating the establishment of Regional Credit Guarantee Companies (PPKD) as well as facilitating government programs that provide value added, including land certification, beef cattle insurance and warehouse receipts. Third, providing information through assesment of potential leading commodities in each region and their financing scheme, as well as disseminating information through a microsite of MSME information posted on the official website of Bank Indonesia. Fourth, coordination and cooperation with relevant stakeholders, including but not limited to local government, related ministries, the Financial Services Authority (OJK) and international institutions.
The policy mix adopted by Bank Indonesia in response to various economic challenges requires close coordination with relevant authorities. Coordination is required in terms of containing inflation, mitigating the impact of fiscal risk, reinforcing financial system stability as well as expediting the implementation of structural reforms.
From the standpoint of controlling prices, pursuant to the direction of monetary policy to control inflation, coordination with the Government will be strengthened, at the central and local levels, through the Inflation Control Team as well as Regional Inflation Control
specific denominations of rupiah on Independence Day, 17th August 2014, and the planned issuance of other rupiah denominations. To fight counterfeit rupiah, Bank Indonesia will tighten coordination and cooperation with all elements of BOTASUPAL, namely the National Intelligence Agency, the National Police, the Attorney General and the Ministry of Finance.
In an effort to maintain national sovereignty, Bank Indonesia will strengthen its assesments relating to the planned use of a local agricultural commodity as a raw material for banknotes. The local agricultural commodity is called Abacá, which is extracted from the trunk of banana trees and cotton fibre. Bank Indonesia reviewed the benefits of abacá with reference to the experience of the Bank of Japan and Bangko Sentral ng Pilipinas, both of which use local raw materials for their banknotes. In this context, Bank Indonesia will also coordinate with the Ministry of State Enterprises and its subsidiary agencies to review the benefits of paper mill infrastructure to produce sample of raw material for banknotes and full-scale production1. Bank Indonesia will also coordinate with the Ministry of Agriculture in an effort to expand the cultivation of local abacá and cotton in the medium term, considering that local cotton cultivation currently only meets around 0.5% of the national requirement.
In addition to monetary policy, macroprudential policy and payment system policy, Bank Indonesia will also enrich policy related to financial inclusion as well as micro, small and medium enterprises. Financial inclusion plays an important role in promoting bank intermediation and efficiency, thereby contributing to financial system stability and supporting policy in the payment system.
Financial inclusion policy focuses on five key strategies. First, strengthening financial education in an attempt to alter financial management behavior, particularly among low-income people. Second, broadening access to financial services, underpinned by consolidation of payment system infrastructure and utilisation of information technology and innovation as well as local economic networks. Third is consumer protection to safeguard the rights when accessing financial services and the payment system. Fourth, reducing asymmetric information through the provision of financial profile data on unbanked people and data on commodities. Fifth, promulgating regulations within financial system stability framework as well as formulating policy recommendations for relevant authorities.
1 Subsidiary agencies under the Ministry of State Enterprises are Perum Peruri, Pura Group, PT. Kertas Padalarang and PT. Kertas Leces.
228 CHAPTER 14 2013 ECONOMIC REPORT ON INDONESIA
Teams. The ongoing coordination has been intensively directed towards overcoming a number of most binding constraints, like lowering inflation of volatile foods, mitigating the impact of exchange rate depreciation on rising goods prices as well as ensuring the availability and seamless distribution of food supply. Through such policy coordination, inflation is expected to remain within its target range.
In relation to strengthening financial system stability, Bank Indonesia and the Financial Services Authority (OJK) will bolster cooperation and coordination in order to create overall financial system stability. Strengthening macroprudential and microprudential coordination is crucial to prevent higher regulatory costs, avoid regulatory arbitrage and enhance the quality of Crisis Management Protocol (CMP). In the context of policy on the financial sector, the Financial Services Authority (OJK) will continue to maintain consistency between banking supervisory and regulatory as well as prevailing policies and commitments agreed previously with the banking industry. Inter-authority coordination, however, requires further reinforcement through inter-institutional cooperation and coordination in terms of crisis prevention and resolution. Therefore, the issuance of regulation related to financial system safety net are essential to ensure better inter-authority cooperation. Through such coordination and cooperation, the financial system is expected to be more efficient,
hence improving the intermediation function and enhancing the competitiveness of the Indonesian economy.
Efforts to strengthen coordination related to the financial system have been done through the signing of a Memorandum of Understanding (MoU) between Bank Indonesia and the Financial Services Authority (OJK) on 18th October 2013. The Memorandum of Understanding (MoU) contains commitment to ensure smooth handover of the microprudential supervision function from Bank Indonesia to the Financial Services Authority (OJK) and that the tasks, function and authority of each respective institution can be carried out effectively. Furthermore, pursuant to Law No. 21 of 2011 concerning the Financial Services Authority (OJK), the banking supervision and regulation function was transferred from Bank Indonesia to the Financial Services Authority (OJK), effective on 31st December 2013. Since then, the Financial Services Authority (OJK) has been responsible for microprudential supervision, while macroprudential supervision remains under the authority of Bank Indonesia in coordination with the Financial Services Authority (OJK).
With the array of policy support mentioned, economic stability in 2014 will continue to improve, thereby providing a foundation for more sustainable and sound economic growth in the longer term.
2292013 ECONOMIC REPORT ON INDONESIA PART IV
Analysis of Indonesia’s Credit RatingBox 14.1.
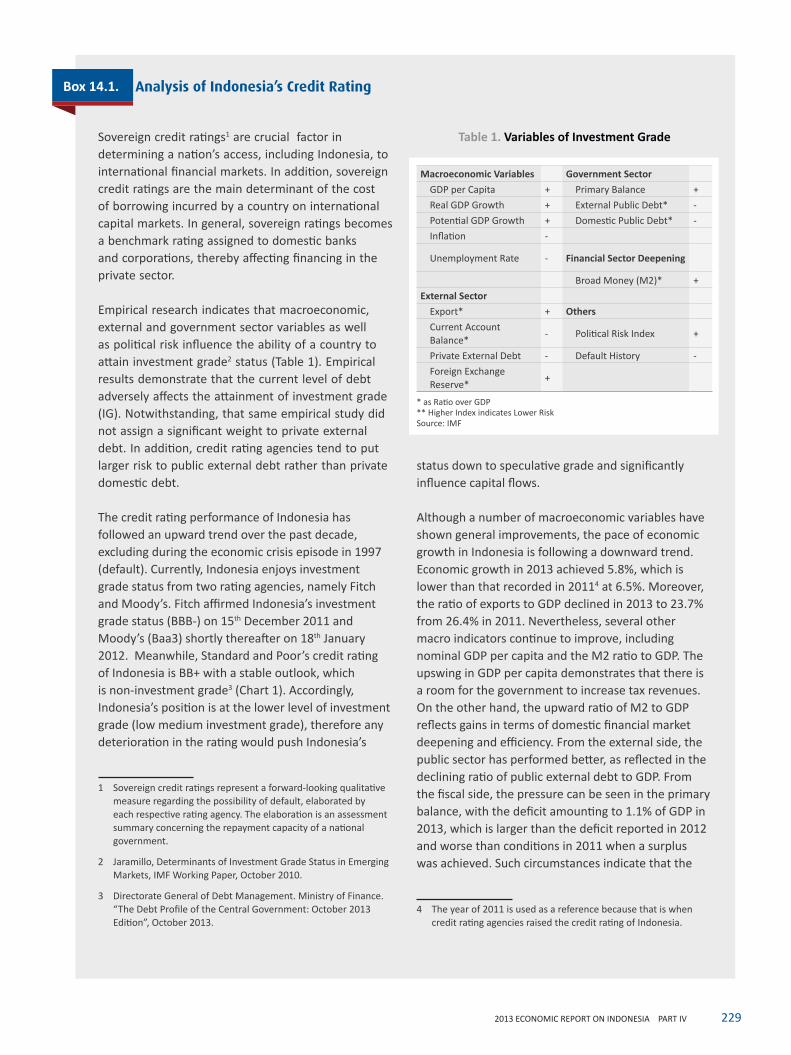
Sovereign credit ratings1 are crucial factor in determining a nation’s access, including Indonesia, to international financial markets. In addition, sovereign credit ratings are the main determinant of the cost of borrowing incurred by a country on international capital markets. In general, sovereign ratings becomes a benchmark rating assigned to domestic banks and corporations, thereby affecting financing in the private sector.
Empirical research indicates that macroeconomic, external and government sector variables as well as political risk influence the ability of a country to attain investment grade2 status (Table 1). Empirical results demonstrate that the current level of debt adversely affects the attainment of investment grade (IG). Notwithstanding, that same empirical study did not assign a significant weight to private external debt. In addition, credit rating agencies tend to put larger risk to public external debt rather than private domestic debt.
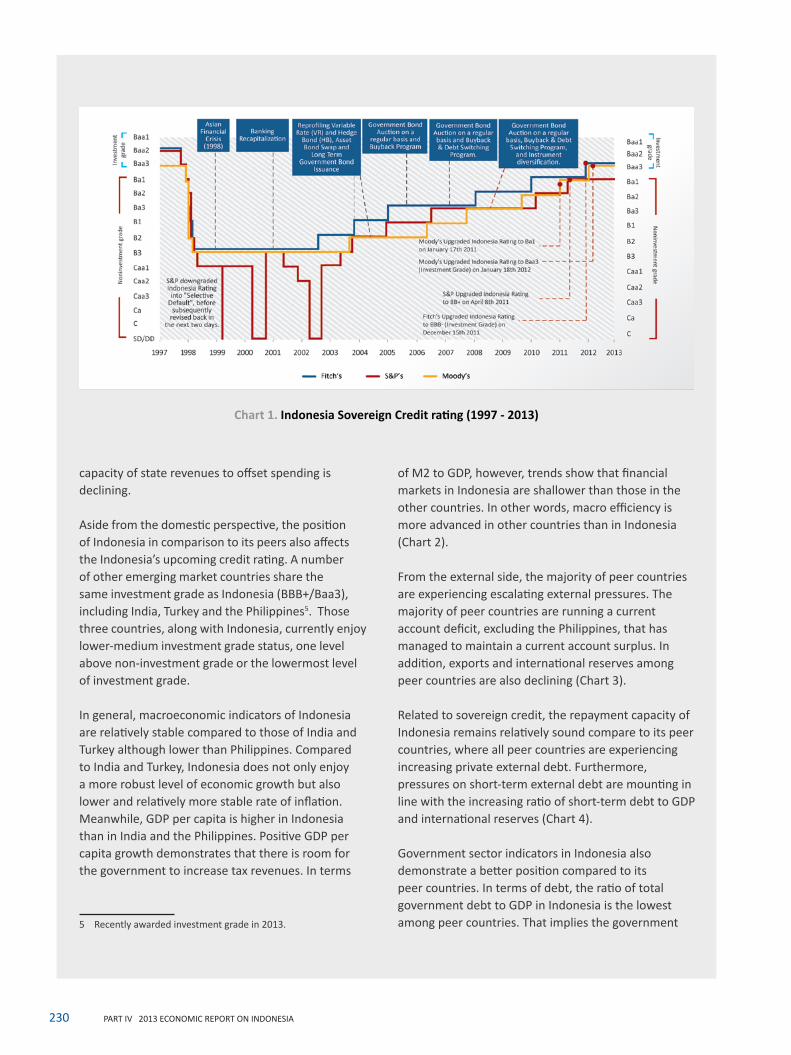
The credit rating performance of Indonesia has followed an upward trend over the past decade, excluding during the economic crisis episode in 1997 (default). Currently, Indonesia enjoys investment grade status from two rating agencies, namely Fitch and Moody’s. Fitch affirmed Indonesia’s investment grade status (BBB-) on 15th December 2011 and Moody’s (Baa3) shortly thereafter on 18th January 2012. Meanwhile, Standard and Poor’s credit rating of Indonesia is BB+ with a stable outlook, which is non-investment grade3 (Chart 1). Accordingly, Indonesia’s position is at the lower level of investment grade (low medium investment grade), therefore any deterioration in the rating would push Indonesia’s
1 Sovereign credit ratings represent a forward-looking qualitative measure regarding the possibility of default, elaborated by each respective rating agency. The elaboration is an assessment summary concerning the repayment capacity of a national government.
2 Jaramillo, Determinants of Investment Grade Status in Emerging Markets, IMF Working Paper, October 2010.
3 Directorate General of Debt Management. Ministry of Finance. “The Debt Profile of the Central Government: October 2013 Edition”, October 2013.
status down to speculative grade and significantly influence capital flows.
Although a number of macroeconomic variables have shown general improvements, the pace of economic growth in Indonesia is following a downward trend. Economic growth in 2013 achieved 5.8%, which is lower than that recorded in 20114 at 6.5%. Moreover, the ratio of exports to GDP declined in 2013 to 23.7% from 26.4% in 2011. Nevertheless, several other macro indicators continue to improve, including nominal GDP per capita and the M2 ratio to GDP. The upswing in GDP per capita demonstrates that there is a room for the government to increase tax revenues. On the other hand, the upward ratio of M2 to GDP reflects gains in terms of domestic financial market deepening and efficiency. From the external side, the public sector has performed better, as reflected in the declining ratio of public external debt to GDP. From the fiscal side, the pressure can be seen in the primary balance, with the deficit amounting to 1.1% of GDP in 2013, which is larger than the deficit reported in 2012 and worse than conditions in 2011 when a surplus was achieved. Such circumstances indicate that the
4 The year of 2011 is used as a reference because that is when credit rating agencies raised the credit rating of Indonesia.
Table 1. Variables of Investment Grade
Macroeconomic Variables Government SectorGDP per Capita + Primary Balance +Real GDP Growth + External Public Debt* -Potential GDP Growth + Domestic Public Debt* -Inflation -
Unemployment Rate - Financial Sector Deepening
Broad Money (M2)* +External Sector
Export* + OthersCurrent Account Balance* - Political Risk Index +
Private External Debt - Default History -Foreign Exchange Reserve* +
* as Ratio over GDP** Higher Index indicates Lower RiskSource: IMF
230 PART IV 2013 ECONOMIC REPORT ON INDONESIA
capacity of state revenues to offset spending is declining.
Aside from the domestic perspective, the position of Indonesia in comparison to its peers also affects the Indonesia’s upcoming credit rating. A number of other emerging market countries share the same investment grade as Indonesia (BBB+/Baa3), including India, Turkey and the Philippines5. Those three countries, along with Indonesia, currently enjoy lower-medium investment grade status, one level above non-investment grade or the lowermost level of investment grade.
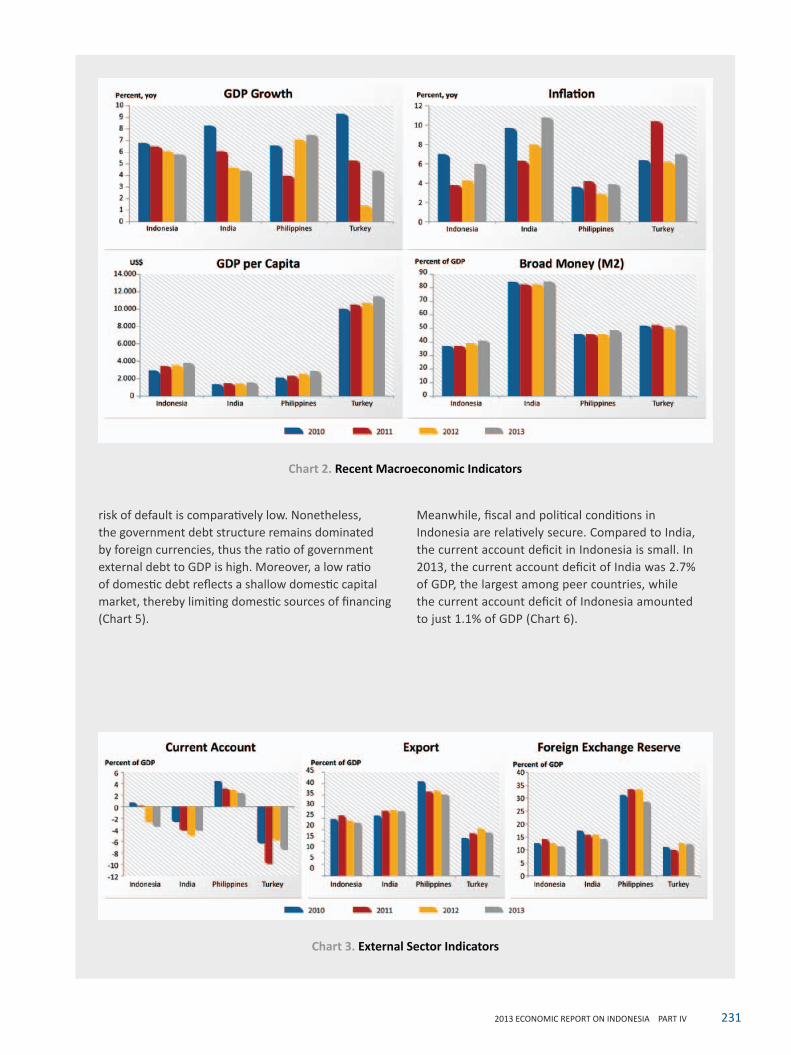
In general, macroeconomic indicators of Indonesia are relatively stable compared to those of India and Turkey although lower than Philippines. Compared to India and Turkey, Indonesia does not only enjoy a more robust level of economic growth but also lower and relatively more stable rate of inflation. Meanwhile, GDP per capita is higher in Indonesia than in India and the Philippines. Positive GDP per capita growth demonstrates that there is room for the government to increase tax revenues. In terms
5 Recently awarded investment grade in 2013.
of M2 to GDP, however, trends show that financial markets in Indonesia are shallower than those in the other countries. In other words, macro efficiency is more advanced in other countries than in Indonesia (Chart 2).
From the external side, the majority of peer countries are experiencing escalating external pressures. The majority of peer countries are running a current account deficit, excluding the Philippines, that has managed to maintain a current account surplus. In addition, exports and international reserves among peer countries are also declining (Chart 3).
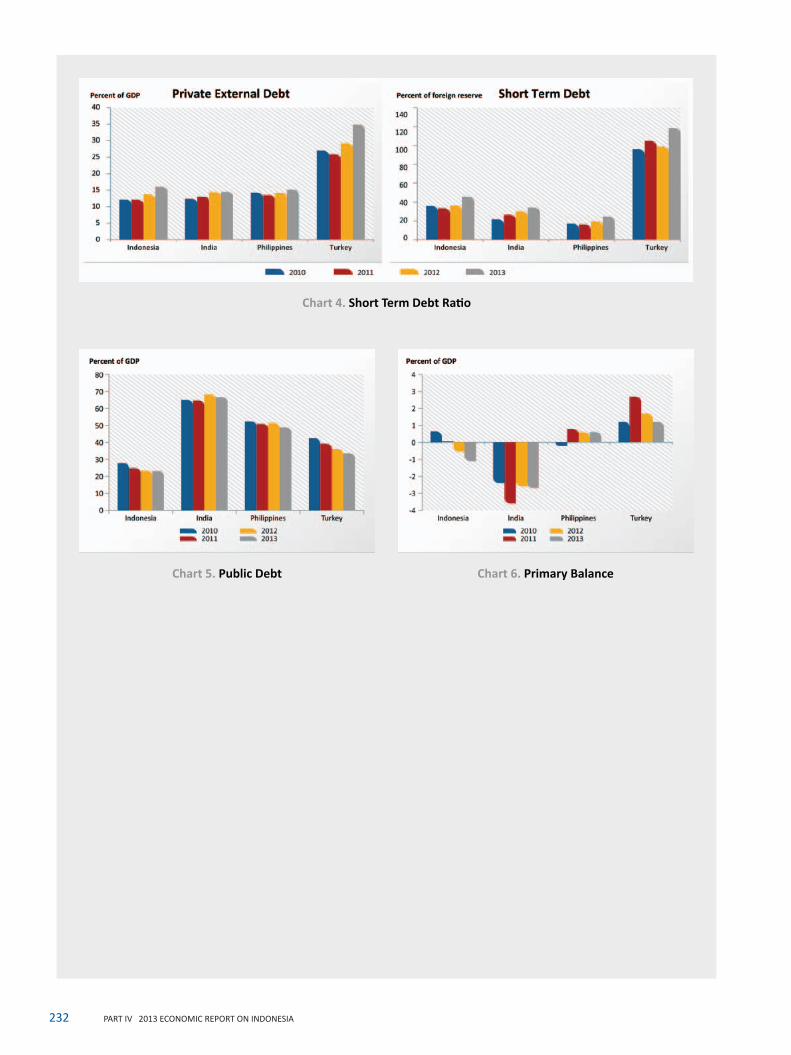
Related to sovereign credit, the repayment capacity of Indonesia remains relatively sound compare to its peer countries, where all peer countries are experiencing increasing private external debt. Furthermore, pressures on short-term external debt are mounting in line with the increasing ratio of short-term debt to GDP and international reserves (Chart 4).
Government sector indicators in Indonesia also demonstrate a better position compared to its peer countries. In terms of debt, the ratio of total government debt to GDP in Indonesia is the lowest among peer countries. That implies the government
Chart 1. Indonesia Sovereign Credit rating (1997 - 2013)
2312013 ECONOMIC REPORT ON INDONESIA PART IV
risk of default is comparatively low. Nonetheless, the government debt structure remains dominated by foreign currencies, thus the ratio of government external debt to GDP is high. Moreover, a low ratio of domestic debt reflects a shallow domestic capital market, thereby limiting domestic sources of financing (Chart 5).
Meanwhile, fiscal and political conditions in Indonesia are relatively secure. Compared to India, the current account deficit in Indonesia is small. In 2013, the current account deficit of India was 2.7% of GDP, the largest among peer countries, while the current account deficit of Indonesia amounted to just 1.1% of GDP (Chart 6).
Chart 3. External Sector Indicators
Chart 2. Recent Macroeconomic Indicators
232 PART IV 2013 ECONOMIC REPORT ON INDONESIA
Chart 4. Short Term Debt Ratio
Chart 5. Public Debt Chart 6. Primary Balance

2332013 ECONOMIC REPORT ON INDONESIA PART IV

BAB
Medium-Term Economic Outlook and Structural Reform
15
Over the medium term, the domestic economy is projected to follow an improving trend, supported by the implementation of structural reform in a number of key areas. Within its mandate, Bank Indonesia will strengthen policy coordination with the Government, to expedite the implementation of reform agenda. Bank Indonesia is of the view that advancing structural reform is necessary for sustained economic growth.
236 CHAPTER 15 2013 ECONOMIC REPORT ON INDONESIA
Over the medium term, the domestic economy is expected to expand at a progressively rapid pace, with inflation tamed at a low rate and current account outturn improved. This prognosis, however, rests upon the implementation of reform to overcome impediments to sustained economic growth. Key impediments that have raised concerns relate to the structure of development financing, weaknesses in the production side, including in food and energy, the fallout of energy subsidy on the State budget, and the inadequacy of basic enablers for sustained economic growth.
An array of reform has already been introduced by the Government and Bank Indonesia to overcome the aforementioned impediments. Irrespective of the achievements already accomplished, expediting the implementation of remaining initiatives is imperative. Among the main reform agenda that need to be expedited are promoting deep and liquid domestic financial markets, strengthening the capability of domestic manufacturing sector and facilitating its further integration to the global value chains, and improving fiscal space for a strengthened development financing. Advancement of these economic reform agenda is expected to prevent Indonesia from falling into the so called middle-income trap1.
On the financial side, policies to promote deeper and more liquid financial markets are expected to foster more sustainable sources of medium to long term economic financing. Bank Indonesia will also continue to enhance policy coordination with the Government and the Financial Services Authority (OJK) to ensure macroeconomic and financial system stability remain intact.
On the real side, the implementation of policies aimed at ensuring adequate provision of basic enablers for a more globally competitive domestic manufacturing industry is expected to continue and be expedited. These include the development of (a) seamless physical and digital connectivity, (b) skilled and globally competitive labour force (human capital), and (c) favourable institutions and business climate conducive to broader private sector participation. Through these measures, the domestic manufacturing sector is projected to become more competitive and integrated to the global value chains. Furthermore, stronger implementation of policies to promote adequate supply of food and energy, as vital production inputs for industrialisation, is also anticipated. In addition, increased fiscal space on the back of efficiency enhancing fuel subsidies is envisaged, and projected to
1 In the passages to follow the word ‘reform’ and phrases ‘economic reform’ / ‘structural reform’ will be used interchangeably.
contribute to the development of basic enablers for a more competitive domestic manufacturing sector.
15.1. Medium-Term Economic Outlook
In the medium term, economic growth is projected to accelerate gradually towards a more robust yet sustainable pace, supported by more favourable global economic prospects and expedited reform.
Such positive medium-term economic growth outlook is buttressed by expected sustained improvement in the global economic conditions. Advanced economies are projected to fully recover from deflationary threats as growth accelerates. The international oil price is projected to rebound, while the prices of non-oil and gas commodities will recover, albeit at a limited pace.
The favourable medium term economic outlook is also underpinned by the expected continuation of economic reform aimed at strengthening the fundamental supports for sustained economic growth. The Government is expected to persevere with initiatives to develop key basic enablers, namely infrastructure, human capital, institutions and technology. Such innitiatives will manifest through implementation of the Third National Medium-Term Development Plan (RPJMN) for 2015-2019 as well as the Masterplan for the Acceleration and Expansion of Economic Development in Indonesia (MP3EI) for 2011-2025. The Government will also continue implementation of various policies, fiscal and sectoral, in order to promote the expanding role of the private sector in economic development. In addition, fiscal policy will be geared towards strengthening development financing to sustain industrialisation.
If the range of aforementioned initiatives is implemented fully, the availability and quality of basic enabling factors for sustained economic growth are expected to improve significantly and be more sparsely distributed, hence advancing development in all economic corridors in various regions of the archipelago. Accordingly, the successful implementation of reform will subsequently reinforce the capabilities and capacity of the domestic manufacturing sector, thereby enabling the sector to adapt to the challenges of global competition. Furthermore, private investment, both FDI and domestic, is expected to increase and expand in line with more favourable conditions pertaining to the basic enablers for growth. Growth of export oriented high value added industries is expected to accelerate, supported by the expansion of raw materials and intermediate goods industries. Such
2372013 ECONOMIC REPORT ON INDONESIA CHAPTER 15
improvements in the production side will subsequently be mirrored by increased growth of manufacturing exports as well as the use of processed raw materials and manufactured intermediate goods from domestic sources, which will ultimately help to strengthen the overall posture of the current account.
Based on the above global and domestic assumptions, domestic economic growth is projected to reach 6.5% by 2018 with inflation tamed at a low rate, and current account deficit to GDP ratio reduced. The level of productivity will increase, as reflected by gains in capability and capacity of the manufacturing sector. The structure of exports will shift away from raw primary commodities towards commodities with greater value added that are human capital, technology and innovation intensive. Meanwhile, demand for processed raw materials and intermediate manufactured goods will gradually be met by domestic producers. Enhanced economic productivity coupled with policy consistency by fiscal, monetary and financial services authorities to maintain macroeconomic and financial system stability will support the internal balance as shown by inflation contained within its medium-term target range of 3.5±1%. In addition, income per capita (measured in constant US dollars) will continue to rise and inequality will start to decline, suggesting much lesser probability of the economy to fall into the middle income trap.
15.2. Medium-Term Economic Challenges
To project a more balanced view of the economy in the medium term, it is also important to note some of the key medium term economic challenges. From the external side, it is conceivable that the ongoing global economic recovery may not proceed as expected, with unbalanced recoveries occurring in several regions, and sustained risk of muddling through. If such risk comes to realization, the demand for exported goods from Indonesia may drop below initial projections. Such conditions would impede the rebound of non-oil/gas commodities and thereby potentially supress export growth performance. These global risk factors could also undermine the ability of domestic demand and the overall domestic economy to advance at higher rate of growth.
Domestically, a range of structural challenges remain and require immediate responses. The first set of challenges relates to suboptimal structure of economic financing as a result of shallow domestic financial markets. The second concerns conditions in the production side that hamper
competitiveness. Related to this is also the challenge of food and energy security as well as its impact on the scale of subsidies in the State budget particularly the issue of fuel subsidies. The third relates to efforts to expedite the provision of key enablers for advancing the progress of economic development, i.e. seamless physical and digital connectivity, competitive human capital, strengthened capacity to absorb technology, and favourable business climate and institution.
Challenges Relating to Structure of Financing
The set of challenges associated with the structure of economic financing requires continuous attention of policy makers due to its propensity to disrupt the sustainability and quality of real economic activity. Current conditions show a less favourable structure of economic financing, including the high cost of funds. In addition, dependence on short-term foreign portfolio investment is quite large and sources of long-term funds remain limited.
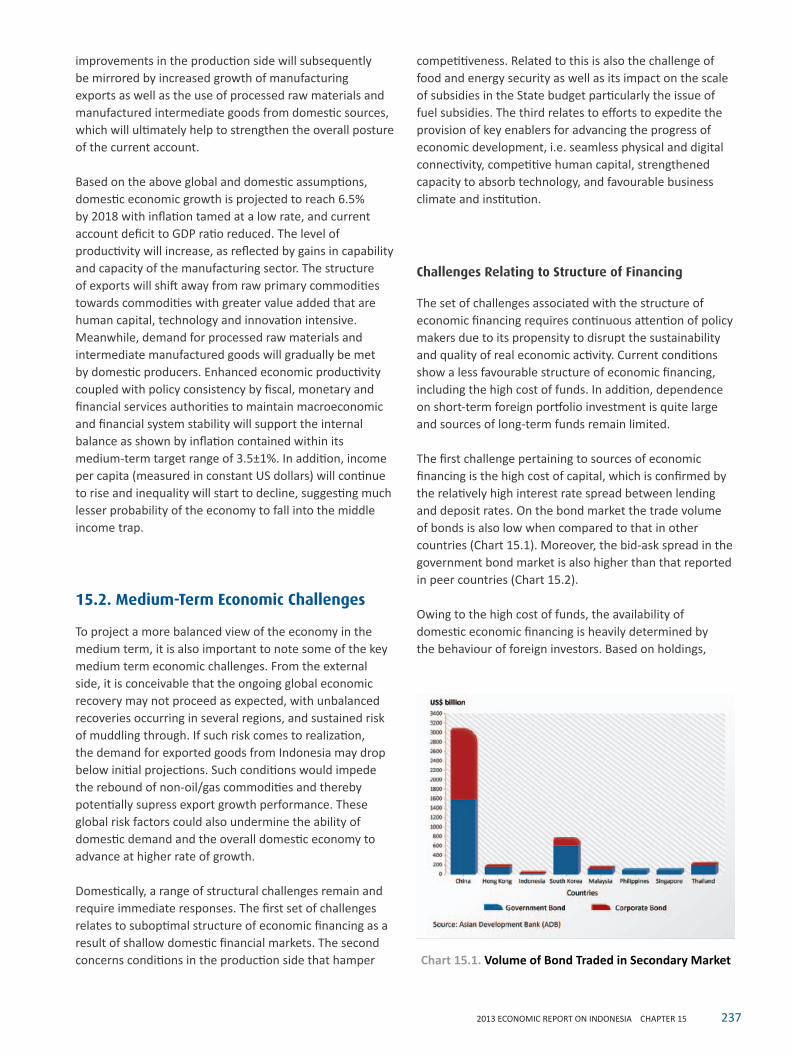
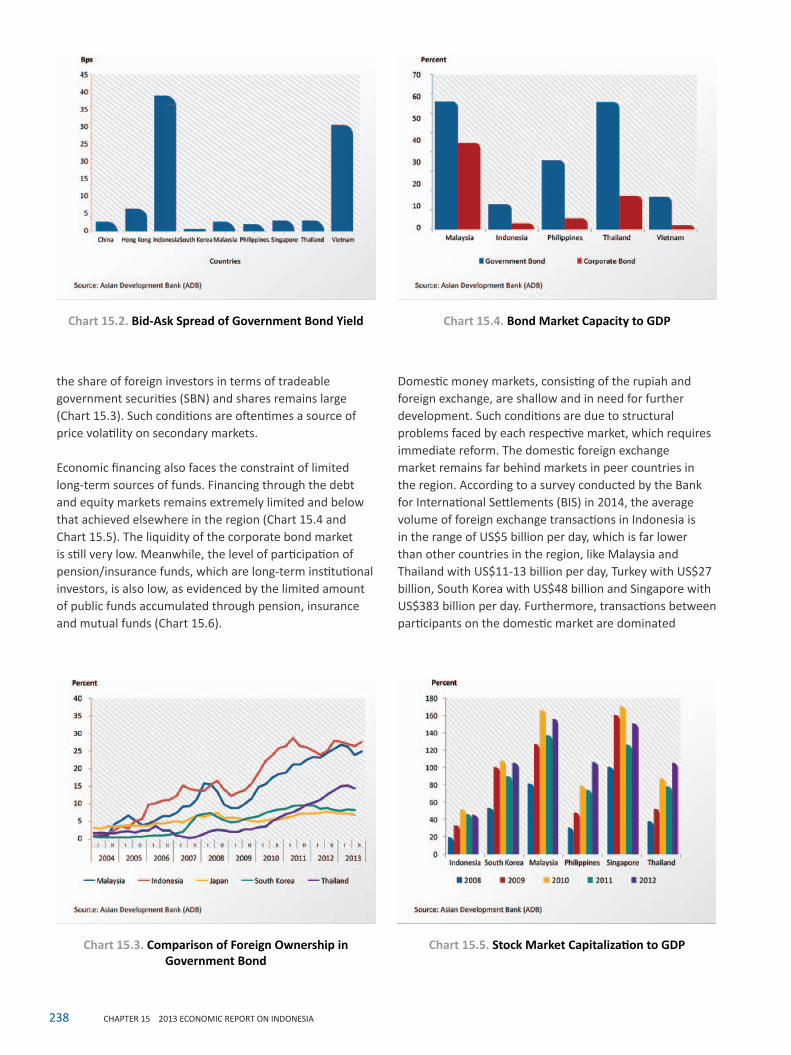
The first challenge pertaining to sources of economic financing is the high cost of capital, which is confirmed by the relatively high interest rate spread between lending and deposit rates. On the bond market the trade volume of bonds is also low when compared to that in other countries (Chart 15.1). Moreover, the bid-ask spread in the government bond market is also higher than that reported in peer countries (Chart 15.2).
Owing to the high cost of funds, the availability of domestic economic financing is heavily determined by the behaviour of foreign investors. Based on holdings,
Chart 15.1. Volume of Bond Traded in Secondary Market
238 CHAPTER 15 2013 ECONOMIC REPORT ON INDONESIA
the share of foreign investors in terms of tradeable government securities (SBN) and shares remains large (Chart 15.3). Such conditions are oftentimes a source of price volatility on secondary markets.
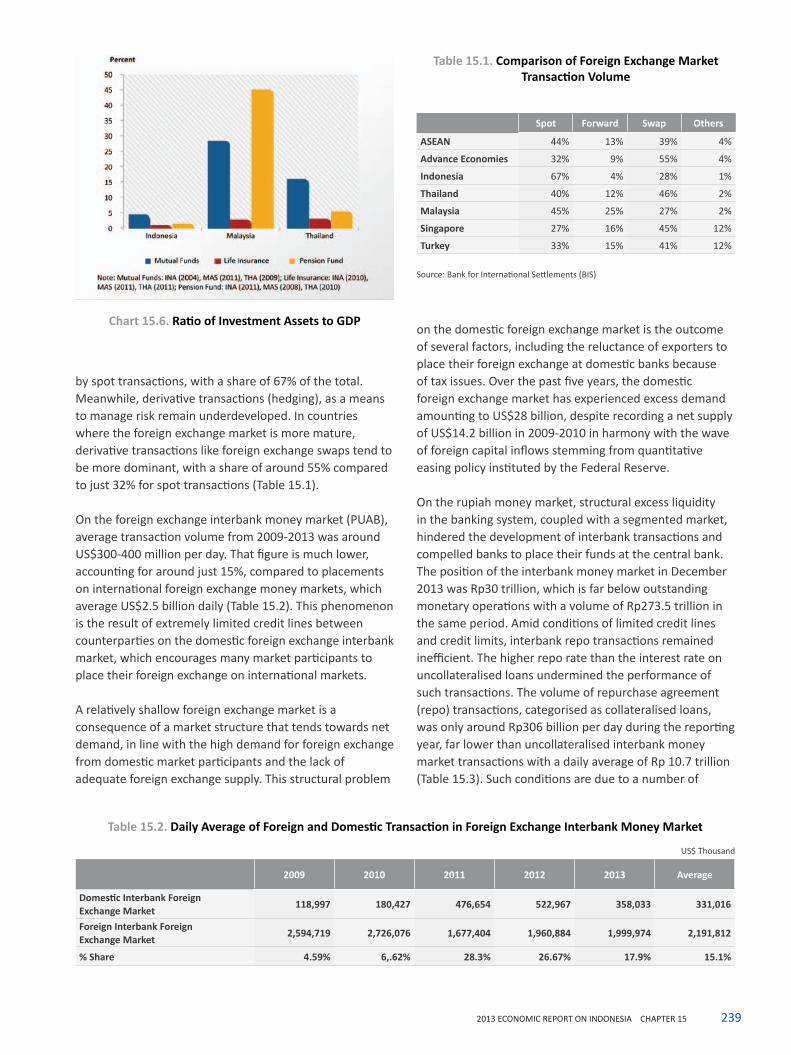
Economic financing also faces the constraint of limited long-term sources of funds. Financing through the debt and equity markets remains extremely limited and below that achieved elsewhere in the region (Chart 15.4 and Chart 15.5). The liquidity of the corporate bond market is still very low. Meanwhile, the level of participation of pension/insurance funds, which are long-term institutional investors, is also low, as evidenced by the limited amount of public funds accumulated through pension, insurance and mutual funds (Chart 15.6).
Domestic money markets, consisting of the rupiah and foreign exchange, are shallow and in need for further development. Such conditions are due to structural problems faced by each respective market, which requires immediate reform. The domestic foreign exchange market remains far behind markets in peer countries in the region. According to a survey conducted by the Bank for International Settlements (BIS) in 2014, the average volume of foreign exchange transactions in Indonesia is in the range of US$5 billion per day, which is far lower than other countries in the region, like Malaysia and Thailand with US$11-13 billion per day, Turkey with US$27 billion, South Korea with US$48 billion and Singapore with US$383 billion per day. Furthermore, transactions between participants on the domestic market are dominated
Chart 15.3. Comparison of Foreign Ownership in Government Bond
Chart 15.5. Stock Market Capitalization to GDP
Chart 15.2. Bid-Ask Spread of Government Bond Yield Chart 15.4. Bond Market Capacity to GDP
2392013 ECONOMIC REPORT ON INDONESIA CHAPTER 15
by spot transactions, with a share of 67% of the total. Meanwhile, derivative transactions (hedging), as a means to manage risk remain underdeveloped. In countries where the foreign exchange market is more mature, derivative transactions like foreign exchange swaps tend to be more dominant, with a share of around 55% compared to just 32% for spot transactions (Table 15.1).
On the foreign exchange interbank money market (PUAB), average transaction volume from 2009-2013 was around US$300-400 million per day. That figure is much lower, accounting for around just 15%, compared to placements on international foreign exchange money markets, which average US$2.5 billion daily (Table 15.2). This phenomenon is the result of extremely limited credit lines between counterparties on the domestic foreign exchange interbank market, which encourages many market participants to place their foreign exchange on international markets.
A relatively shallow foreign exchange market is a consequence of a market structure that tends towards net demand, in line with the high demand for foreign exchange from domestic market participants and the lack of adequate foreign exchange supply. This structural problem
on the domestic foreign exchange market is the outcome of several factors, including the reluctance of exporters to place their foreign exchange at domestic banks because of tax issues. Over the past five years, the domestic foreign exchange market has experienced excess demand amounting to US$28 billion, despite recording a net supply of US$14.2 billion in 2009-2010 in harmony with the wave of foreign capital inflows stemming from quantitative easing policy instituted by the Federal Reserve.
On the rupiah money market, structural excess liquidity in the banking system, coupled with a segmented market, hindered the development of interbank transactions and compelled banks to place their funds at the central bank. The position of the interbank money market in December 2013 was Rp30 trillion, which is far below outstanding monetary operations with a volume of Rp273.5 trillion in the same period. Amid conditions of limited credit lines and credit limits, interbank repo transactions remained inefficient. The higher repo rate than the interest rate on uncollateralised loans undermined the performance of such transactions. The volume of repurchase agreement (repo) transactions, categorised as collateralised loans, was only around Rp306 billion per day during the reporting year, far lower than uncollateralised interbank money market transactions with a daily average of Rp 10.7 trillion (Table 15.3). Such conditions are due to a number of
Table 15.1. Comparison of Foreign Exchange Market Transaction Volume
Spot Forward Swap Others
ASEAN 44% 13% 39% 4%
Advance Economies 32% 9% 55% 4%
Indonesia 67% 4% 28% 1%
Thailand 40% 12% 46% 2%
Malaysia 45% 25% 27% 2%
Singapore 27% 16% 45% 12%
Turkey 33% 15% 41% 12%
Source: Bank for International Settlements (BIS)
Table 15.2. Daily Average of Foreign and Domestic Transaction in Foreign Exchange Interbank Money Market
US$ Thousand
2009 2010 2011 2012 2013 Average
Domestic Interbank ForeignExchange Market
118,997 180,427 476,654 522,967 358,033 331,016
Foreign Interbank ForeignExchange Market
2,594,719 2,726,076 1,677,404 1,960,884 1,999,974 2,191,812
% Share 4.59% 6,.62% 28.3% 26.67% 17.9% 15.1%
Chart 15.6. Ratio of Investment Assets to GDP
240 CHAPTER 15 2013 ECONOMIC REPORT ON INDONESIA
factors, among others, relating to the unavailability of standardised repo contracts, complex operating and administrative procedures, the negative stigma attached to repo transactions, the problem of double taxation as well as a lack of confidence in the execution of collateral related to accounting issues.
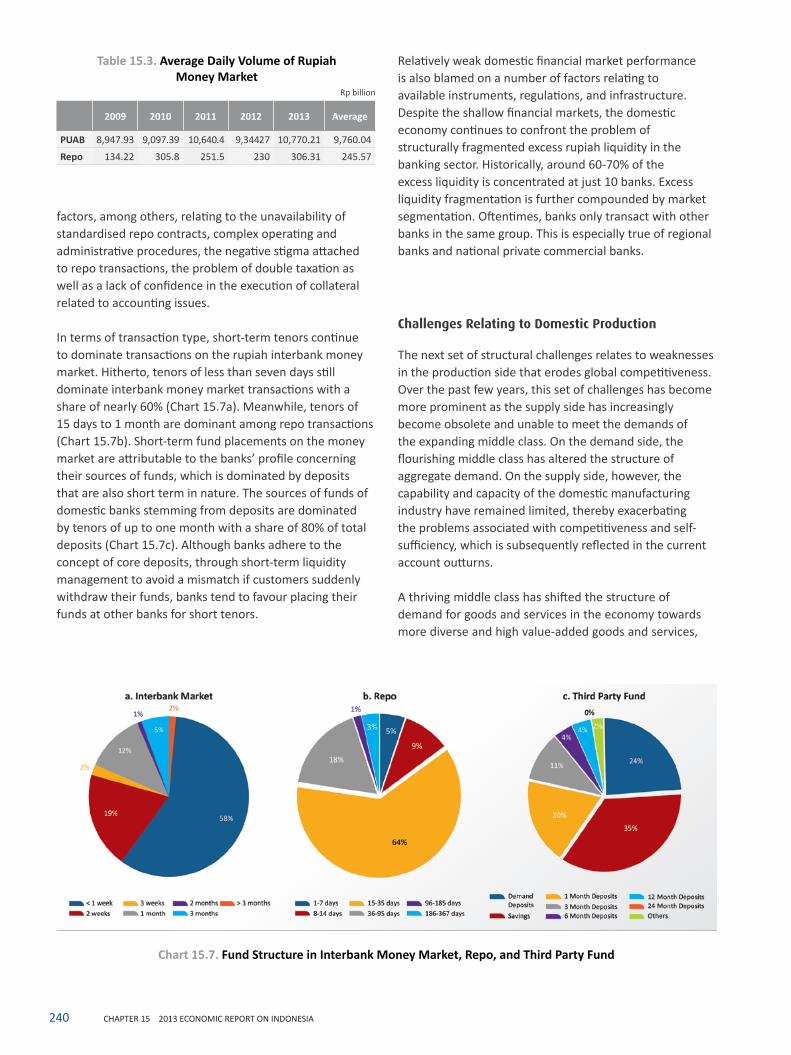
In terms of transaction type, short-term tenors continue to dominate transactions on the rupiah interbank money market. Hitherto, tenors of less than seven days still dominate interbank money market transactions with a share of nearly 60% (Chart 15.7a). Meanwhile, tenors of 15 days to 1 month are dominant among repo transactions (Chart 15.7b). Short-term fund placements on the money market are attributable to the banks’ profile concerning their sources of funds, which is dominated by deposits that are also short term in nature. The sources of funds of domestic banks stemming from deposits are dominated by tenors of up to one month with a share of 80% of total deposits (Chart 15.7c). Although banks adhere to the concept of core deposits, through short-term liquidity management to avoid a mismatch if customers suddenly withdraw their funds, banks tend to favour placing their funds at other banks for short tenors.
Relatively weak domestic financial market performance is also blamed on a number of factors relating to available instruments, regulations, and infrastructure. Despite the shallow financial markets, the domestic economy continues to confront the problem of structurally fragmented excess rupiah liquidity in the banking sector. Historically, around 60-70% of the excess liquidity is concentrated at just 10 banks. Excess liquidity fragmentation is further compounded by market segmentation. Oftentimes, banks only transact with other banks in the same group. This is especially true of regional banks and national private commercial banks.
Challenges Relating to Domestic Production
The next set of structural challenges relates to weaknesses in the production side that erodes global competitiveness. Over the past few years, this set of challenges has become more prominent as the supply side has increasingly become obsolete and unable to meet the demands of the expanding middle class. On the demand side, the flourishing middle class has altered the structure of aggregate demand. On the supply side, however, the capability and capacity of the domestic manufacturing industry have remained limited, thereby exacerbating the problems associated with competitiveness and self-sufficiency, which is subsequently reflected in the current account outturns.
A thriving middle class has shifted the structure of demand for goods and services in the economy towards more diverse and high value-added goods and services,
Chart 15.7. Fund Structure in Interbank Money Market, Repo, and Third Party Fund
Rp billion
2009 2010 2011 2012 2013 Average
PUAB 8,947.93 9,097.39 10,640.4 9,34427 10,770.21 9,760.04
Repo 134.22 305.8 251.5 230 306.31 245.57
Table 15.3. Average Daily Volume of Rupiah Money Market
2412013 ECONOMIC REPORT ON INDONESIA CHAPTER 15
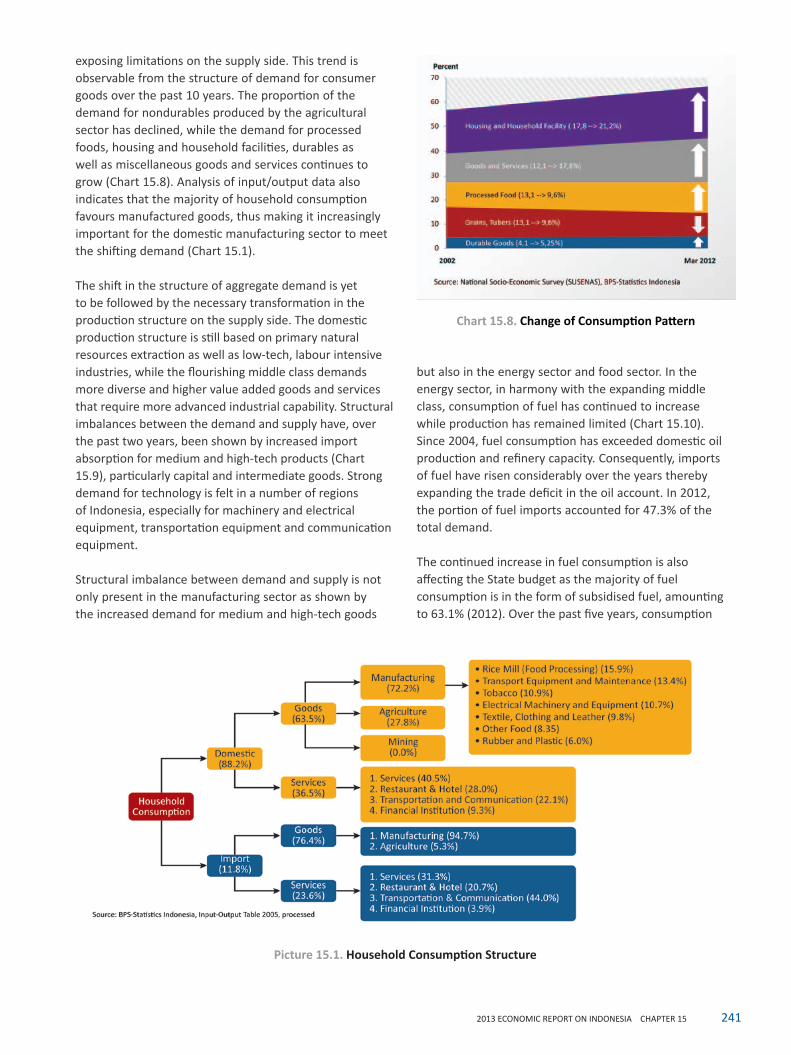
exposing limitations on the supply side. This trend is observable from the structure of demand for consumer goods over the past 10 years. The proportion of the demand for nondurables produced by the agricultural sector has declined, while the demand for processed foods, housing and household facilities, durables as well as miscellaneous goods and services continues to grow (Chart 15.8). Analysis of input/output data also indicates that the majority of household consumption favours manufactured goods, thus making it increasingly important for the domestic manufacturing sector to meet the shifting demand (Chart 15.1).
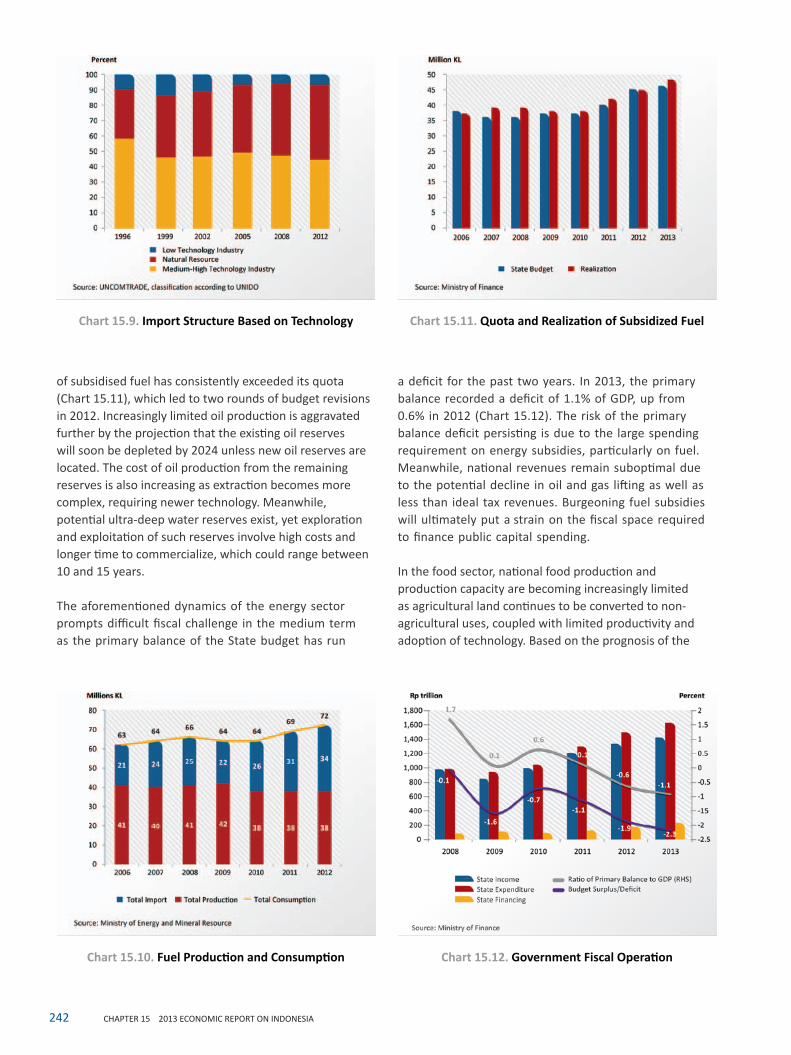
The shift in the structure of aggregate demand is yet to be followed by the necessary transformation in the production structure on the supply side. The domestic production structure is still based on primary natural resources extraction as well as low-tech, labour intensive industries, while the flourishing middle class demands more diverse and higher value added goods and services that require more advanced industrial capability. Structural imbalances between the demand and supply have, over the past two years, been shown by increased import absorption for medium and high-tech products (Chart 15.9), particularly capital and intermediate goods. Strong demand for technology is felt in a number of regions of Indonesia, especially for machinery and electrical equipment, transportation equipment and communication equipment.
Structural imbalance between demand and supply is not only present in the manufacturing sector as shown by the increased demand for medium and high-tech goods
but also in the energy sector and food sector. In the energy sector, in harmony with the expanding middle class, consumption of fuel has continued to increase while production has remained limited (Chart 15.10). Since 2004, fuel consumption has exceeded domestic oil production and refinery capacity. Consequently, imports of fuel have risen considerably over the years thereby expanding the trade deficit in the oil account. In 2012, the portion of fuel imports accounted for 47.3% of the total demand.
The continued increase in fuel consumption is also affecting the State budget as the majority of fuel consumption is in the form of subsidised fuel, amounting to 63.1% (2012). Over the past five years, consumption
Picture 15.1. Household Consumption Structure
Chart 15.8. Change of Consumption Pattern
242 CHAPTER 15 2013 ECONOMIC REPORT ON INDONESIA
of subsidised fuel has consistently exceeded its quota (Chart 15.11), which led to two rounds of budget revisions in 2012. Increasingly limited oil production is aggravated further by the projection that the existing oil reserves will soon be depleted by 2024 unless new oil reserves are located. The cost of oil production from the remaining reserves is also increasing as extraction becomes more complex, requiring newer technology. Meanwhile, potential ultra-deep water reserves exist, yet exploration and exploitation of such reserves involve high costs and longer time to commercialize, which could range between 10 and 15 years.
The aforementioned dynamics of the energy sector prompts difficult fiscal challenge in the medium term as the primary balance of the State budget has run
a deficit for the past two years. In 2013, the primary balance recorded a deficit of 1.1% of GDP, up from 0.6% in 2012 (Chart 15.12). The risk of the primary balance deficit persisting is due to the large spending requirement on energy subsidies, particularly on fuel. Meanwhile, national revenues remain suboptimal due to the potential decline in oil and gas lifting as well as less than ideal tax revenues. Burgeoning fuel subsidies will ultimately put a strain on the fiscal space required to finance public capital spending.
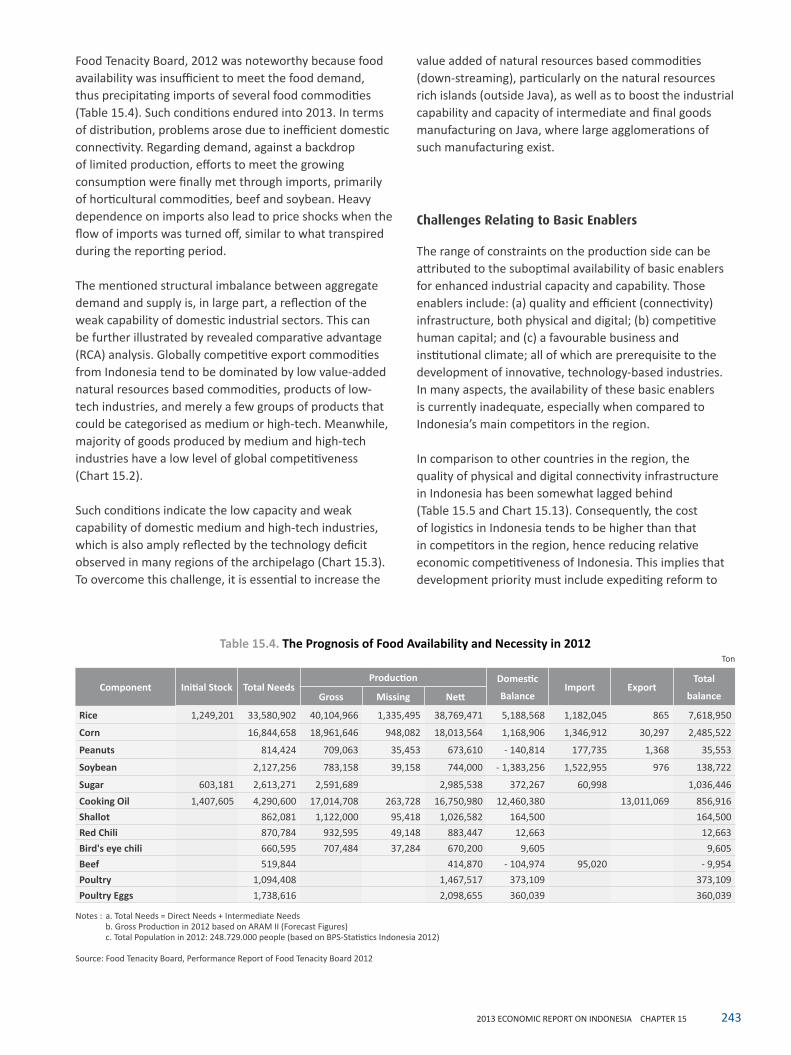
In the food sector, national food production and production capacity are becoming increasingly limited as agricultural land continues to be converted to non-agricultural uses, coupled with limited productivity and adoption of technology. Based on the prognosis of the
Chart 15.11. Quota and Realization of Subsidized Fuel
Chart 15.12. Government Fiscal OperationChart 15.10. Fuel Production and Consumption
Chart 15.9. Import Structure Based on Technology
2432013 ECONOMIC REPORT ON INDONESIA CHAPTER 15
Food Tenacity Board, 2012 was noteworthy because food availability was insufficient to meet the food demand, thus precipitating imports of several food commodities (Table 15.4). Such conditions endured into 2013. In terms of distribution, problems arose due to inefficient domestic connectivity. Regarding demand, against a backdrop of limited production, efforts to meet the growing consumption were finally met through imports, primarily of horticultural commodities, beef and soybean. Heavy dependence on imports also lead to price shocks when the flow of imports was turned off, similar to what transpired during the reporting period.
The mentioned structural imbalance between aggregate demand and supply is, in large part, a reflection of the weak capability of domestic industrial sectors. This can be further illustrated by revealed comparative advantage (RCA) analysis. Globally competitive export commodities from Indonesia tend to be dominated by low value-added natural resources based commodities, products of low-tech industries, and merely a few groups of products that could be categorised as medium or high-tech. Meanwhile, majority of goods produced by medium and high-tech industries have a low level of global competitiveness (Chart 15.2).
Such conditions indicate the low capacity and weak capability of domestic medium and high-tech industries, which is also amply reflected by the technology deficit observed in many regions of the archipelago (Chart 15.3). To overcome this challenge, it is essential to increase the
value added of natural resources based commodities (down-streaming), particularly on the natural resources rich islands (outside Java), as well as to boost the industrial capability and capacity of intermediate and final goods manufacturing on Java, where large agglomerations of such manufacturing exist.
Challenges Relating to Basic Enablers
The range of constraints on the production side can be attributed to the suboptimal availability of basic enablers for enhanced industrial capacity and capability. Those enablers include: (a) quality and efficient (connectivity) infrastructure, both physical and digital; (b) competitive human capital; and (c) a favourable business and institutional climate; all of which are prerequisite to the development of innovative, technology-based industries. In many aspects, the availability of these basic enablers is currently inadequate, especially when compared to Indonesia’s main competitors in the region.
In comparison to other countries in the region, the quality of physical and digital connectivity infrastructure in Indonesia has been somewhat lagged behind (Table 15.5 and Chart 15.13). Consequently, the cost of logistics in Indonesia tends to be higher than that in competitors in the region, hence reducing relative economic competitiveness of Indonesia. This implies that development priority must include expediting reform to
Table 15.4. The Prognosis of Food Availability and Necessity in 2012Ton
Component Initial Stock Total NeedsProduction Domestic
BalanceImport Export
Total
balanceGross Missing Nett
Rice 1,249,201 33,580,902 40,104,966 1,335,495 38,769,471 5,188,568 1,182,045 865 7,618,950
Corn 16,844,658 18,961,646 948,082 18,013,564 1,168,906 1,346,912 30,297 2,485,522
Peanuts 814,424 709,063 35,453 673,610 - 140,814 177,735 1,368 35,553
Soybean 2,127,256 783,158 39,158 744,000 - 1,383,256 1,522,955 976 138,722
Sugar 603,181 2,613,271 2,591,689 2,985,538 372,267 60,998 1,036,446
Cooking Oil 1,407,605 4,290,600 17,014,708 263,728 16,750,980 12,460,380 13,011,069 856,916
Shallot 862,081 1,122,000 95,418 1,026,582 164,500 164,500
Red Chili 870,784 932,595 49,148 883,447 12,663 12,663
Bird's eye chili 660,595 707,484 37,284 670,200 9,605 9,605
Beef 519,844 414,870 - 104,974 95,020 - 9,954
Poultry 1,094,408 1,467,517 373,109 373,109
Poultry Eggs 1,738,616 2,098,655 360,039 360,039
Notes : a. Total Needs = Direct Needs + Intermediate Needsb. Gross Production in 2012 based on ARAM II (Forecast Figures)c. Total Population in 2012: 248.729.000 people (based on BPS-Statistics Indonesia 2012)
Source: Food Tenacity Board, Performance Report of Food Tenacity Board 2012
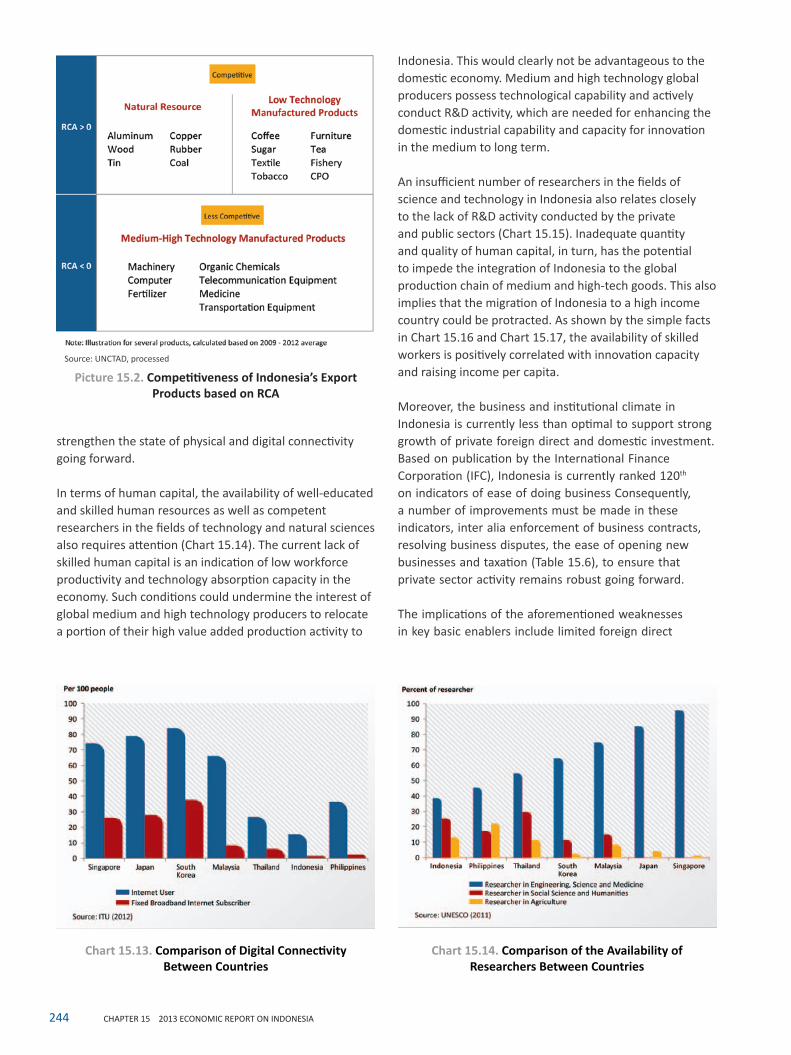
244 CHAPTER 15 2013 ECONOMIC REPORT ON INDONESIA
strengthen the state of physical and digital connectivity going forward.
In terms of human capital, the availability of well-educated and skilled human resources as well as competent researchers in the fields of technology and natural sciences also requires attention (Chart 15.14). The current lack of skilled human capital is an indication of low workforce productivity and technology absorption capacity in the economy. Such conditions could undermine the interest of global medium and high technology producers to relocate a portion of their high value added production activity to
Indonesia. This would clearly not be advantageous to the domestic economy. Medium and high technology global producers possess technological capability and actively conduct R&D activity, which are needed for enhancing the domestic industrial capability and capacity for innovation in the medium to long term.
An insufficient number of researchers in the fields of science and technology in Indonesia also relates closely to the lack of R&D activity conducted by the private and public sectors (Chart 15.15). Inadequate quantity and quality of human capital, in turn, has the potential to impede the integration of Indonesia to the global production chain of medium and high-tech goods. This also implies that the migration of Indonesia to a high income country could be protracted. As shown by the simple facts in Chart 15.16 and Chart 15.17, the availability of skilled workers is positively correlated with innovation capacity and raising income per capita.
Moreover, the business and institutional climate in Indonesia is currently less than optimal to support strong growth of private foreign direct and domestic investment. Based on publication by the International Finance Corporation (IFC), Indonesia is currently ranked 120th on indicators of ease of doing business Consequently, a number of improvements must be made in these indicators, inter alia enforcement of business contracts, resolving business disputes, the ease of opening new businesses and taxation (Table 15.6), to ensure that private sector activity remains robust going forward.
The implications of the aforementioned weaknesses in key basic enablers include limited foreign direct
Picture 15.2. Competitiveness of Indonesia’s Export Products based on RCA
Source: UNCTAD, processed
Chart 15.13. Comparison of Digital Connectivity Between Countries
Chart 15.14. Comparison of the Availability of Researchers Between Countries
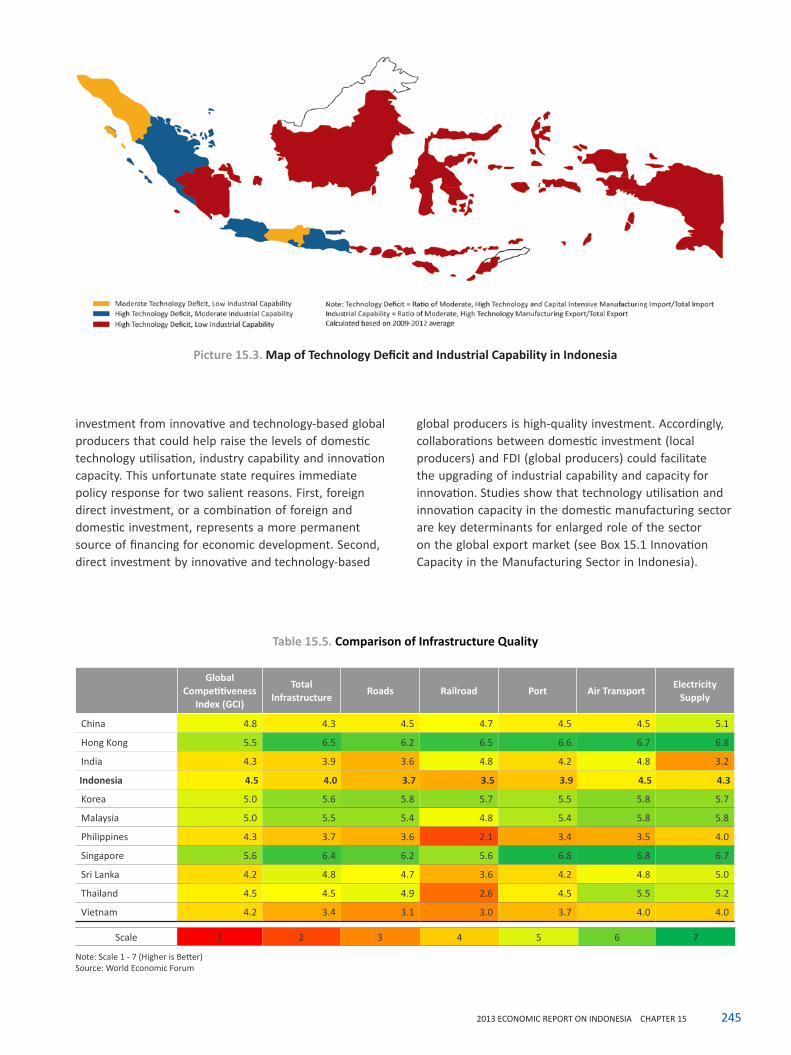
2452013 ECONOMIC REPORT ON INDONESIA CHAPTER 15
Table 15.5. Comparison of Infrastructure Quality
Global Competitiveness
Index (GCI)
Total Infrastructure
Roads Railroad Port Air TransportElectricity
Supply
China 4.8 4.3 4.5 4.7 4.5 4.5 5.1
Hong Kong 5.5 6.5 6.2 6.5 6.6 6.7 6.8
India 4.3 3.9 3.6 4.8 4.2 4.8 3.2
Indonesia 4.5 4.0 3.7 3.5 3.9 4.5 4.3
Korea 5.0 5.6 5.8 5.7 5.5 5.8 5.7
Malaysia 5.0 5.5 5.4 4.8 5.4 5.8 5.8
Philippines 4.3 3.7 3.6 2.1 3.4 3.5 4.0
Singapore 5.6 6.4 6.2 5.6 6.8 6.8 6.7
Sri Lanka 4.2 4.8 4.7 3.6 4.2 4.8 5.0
Thailand 4.5 4.5 4.9 2.6 4.5 5.5 5.2
Vietnam 4.2 3.4 3.1 3.0 3.7 4.0 4.0
Scale 1 2 3 4 5 6 7
Note: Scale 1 - 7 (Higher is Better)Source: World Economic Forum
investment from innovative and technology-based global producers that could help raise the levels of domestic technology utilisation, industry capability and innovation capacity. This unfortunate state requires immediate policy response for two salient reasons. First, foreign direct investment, or a combination of foreign and domestic investment, represents a more permanent source of financing for economic development. Second, direct investment by innovative and technology-based
global producers is high-quality investment. Accordingly, collaborations between domestic investment (local producers) and FDI (global producers) could facilitate the upgrading of industrial capability and capacity for innovation. Studies show that technology utilisation and innovation capacity in the domestic manufacturing sector are key determinants for enlarged role of the sector on the global export market (see Box 15.1 Innovation Capacity in the Manufacturing Sector in Indonesia).
Picture 15.3. Map of Technology Deficit and Industrial Capability in Indonesia
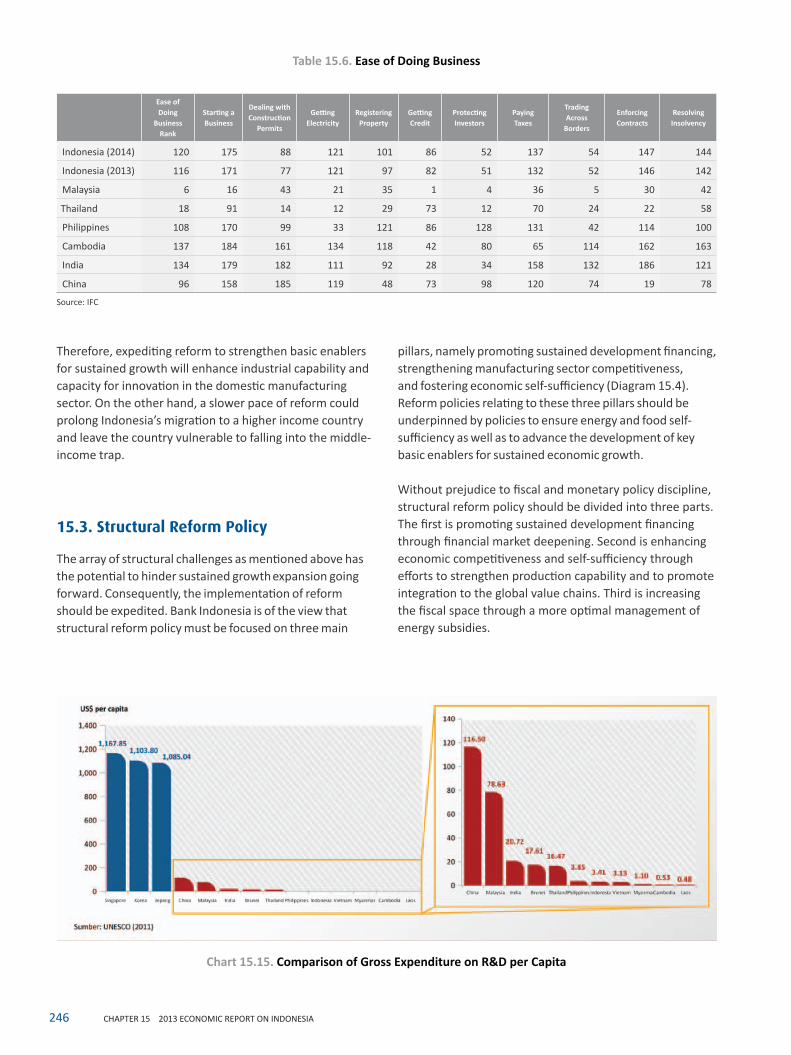
246 CHAPTER 15 2013 ECONOMIC REPORT ON INDONESIA
Therefore, expediting reform to strengthen basic enablers for sustained growth will enhance industrial capability and capacity for innovation in the domestic manufacturing sector. On the other hand, a slower pace of reform could prolong Indonesia’s migration to a higher income country and leave the country vulnerable to falling into the middle-income trap.
15.3. Structural Reform Policy
The array of structural challenges as mentioned above has the potential to hinder sustained growth expansion going forward. Consequently, the implementation of reform should be expedited. Bank Indonesia is of the view that structural reform policy must be focused on three main
pillars, namely promoting sustained development financing, strengthening manufacturing sector competitiveness, and fostering economic self-sufficiency (Diagram 15.4). Reform policies relating to these three pillars should be underpinned by policies to ensure energy and food self-sufficiency as well as to advance the development of key basic enablers for sustained economic growth.
Without prejudice to fiscal and monetary policy discipline, structural reform policy should be divided into three parts. The first is promoting sustained development financing through financial market deepening. Second is enhancing economic competitiveness and self-sufficiency through efforts to strengthen production capability and to promote integration to the global value chains. Third is increasing the fiscal space through a more optimal management of energy subsidies.
Table 15.6. Ease of Doing Business
Ease of Doing
Business Rank
Starting a Business
Dealing with Construction
Permits
Getting Electricity
Registering Property
Getting Credit
Protecting Investors
Paying Taxes
Trading Across
Borders
Enforcing Contracts
Resolving Insolvency
Indonesia (2014) 120 175 88 121 101 86 52 137 54 147 144
Indonesia (2013) 116 171 77 121 97 82 51 132 52 146 142
Malaysia 6 16 43 21 35 1 4 36 5 30 42
Thailand 18 91 14 12 29 73 12 70 24 22 58
Philippines 108 170 99 33 121 86 128 131 42 114 100
Cambodia 137 184 161 134 118 42 80 65 114 162 163
India 134 179 182 111 92 28 34 158 132 186 121
China 96 158 185 119 48 73 98 120 74 19 78
Source: IFC
Chart 15.15. Comparison of Gross Expenditure on R&D per Capita
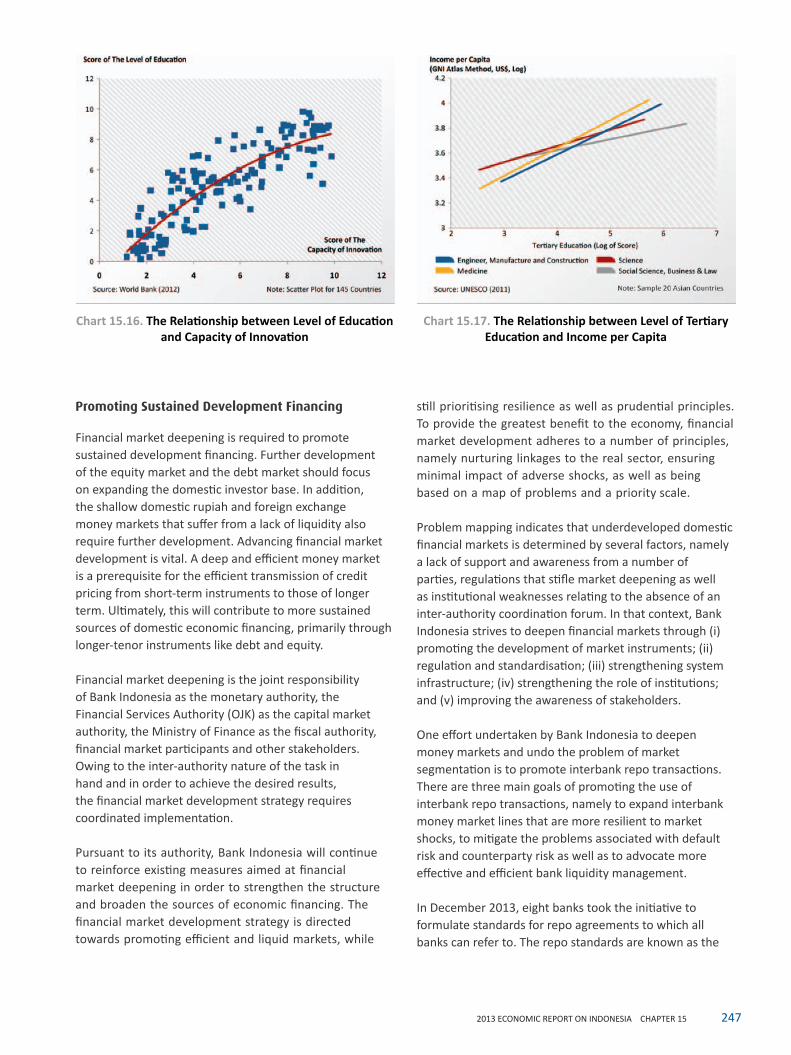
2472013 ECONOMIC REPORT ON INDONESIA CHAPTER 15
Promoting Sustained Development Financing
Financial market deepening is required to promote sustained development financing. Further development of the equity market and the debt market should focus on expanding the domestic investor base. In addition, the shallow domestic rupiah and foreign exchange money markets that suffer from a lack of liquidity also require further development. Advancing financial market development is vital. A deep and efficient money market is a prerequisite for the efficient transmission of credit pricing from short-term instruments to those of longer term. Ultimately, this will contribute to more sustained sources of domestic economic financing, primarily through longer-tenor instruments like debt and equity.
Financial market deepening is the joint responsibility of Bank Indonesia as the monetary authority, the Financial Services Authority (OJK) as the capital market authority, the Ministry of Finance as the fiscal authority, financial market participants and other stakeholders. Owing to the inter-authority nature of the task in hand and in order to achieve the desired results, the financial market development strategy requires coordinated implementation.
Pursuant to its authority, Bank Indonesia will continue to reinforce existing measures aimed at financial market deepening in order to strengthen the structure and broaden the sources of economic financing. The financial market development strategy is directed towards promoting efficient and liquid markets, while
still prioritising resilience as well as prudential principles. To provide the greatest benefit to the economy, financial market development adheres to a number of principles, namely nurturing linkages to the real sector, ensuring minimal impact of adverse shocks, as well as being based on a map of problems and a priority scale.
Problem mapping indicates that underdeveloped domestic financial markets is determined by several factors, namely a lack of support and awareness from a number of parties, regulations that stifle market deepening as well as institutional weaknesses relating to the absence of an inter-authority coordination forum. In that context, Bank Indonesia strives to deepen financial markets through (i) promoting the development of market instruments; (ii) regulation and standardisation; (iii) strengthening system infrastructure; (iv) strengthening the role of institutions; and (v) improving the awareness of stakeholders.
One effort undertaken by Bank Indonesia to deepen money markets and undo the problem of market segmentation is to promote interbank repo transactions. There are three main goals of promoting the use of interbank repo transactions, namely to expand interbank money market lines that are more resilient to market shocks, to mitigate the problems associated with default risk and counterparty risk as well as to advocate more effective and efficient bank liquidity management.
In December 2013, eight banks took the initiative to formulate standards for repo agreements to which all banks can refer to. The repo standards are known as the
Chart 15.17. The Relationship between Level of Tertiary Education and Income per Capita
Chart 15.16. The Relationship between Level of Education and Capacity of Innovation
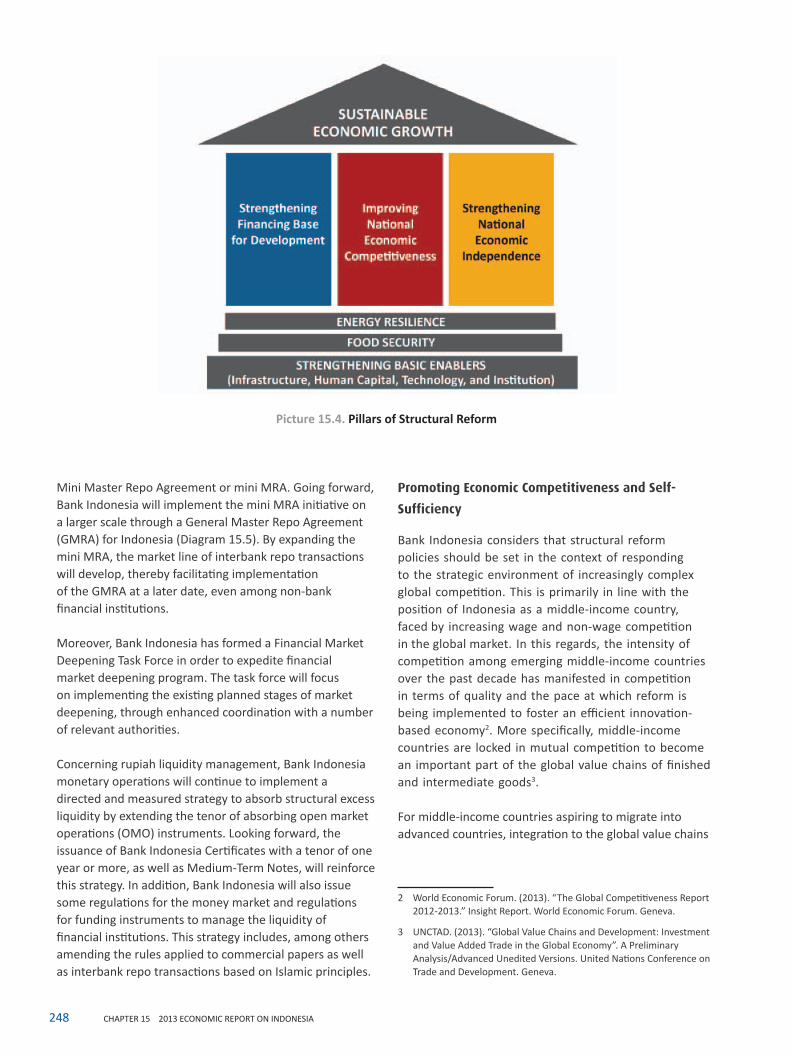
248 CHAPTER 15 2013 ECONOMIC REPORT ON INDONESIA
Mini Master Repo Agreement or mini MRA. Going forward, Bank Indonesia will implement the mini MRA initiative on a larger scale through a General Master Repo Agreement (GMRA) for Indonesia (Diagram 15.5). By expanding the mini MRA, the market line of interbank repo transactions will develop, thereby facilitating implementation of the GMRA at a later date, even among non-bank financial institutions.
Moreover, Bank Indonesia has formed a Financial Market Deepening Task Force in order to expedite financial market deepening program. The task force will focus on implementing the existing planned stages of market deepening, through enhanced coordination with a number of relevant authorities.
Concerning rupiah liquidity management, Bank Indonesia monetary operations will continue to implement a directed and measured strategy to absorb structural excess liquidity by extending the tenor of absorbing open market operations (OMO) instruments. Looking forward, the issuance of Bank Indonesia Certificates with a tenor of one year or more, as well as Medium-Term Notes, will reinforce this strategy. In addition, Bank Indonesia will also issue some regulations for the money market and regulations for funding instruments to manage the liquidity of financial institutions. This strategy includes, among others amending the rules applied to commercial papers as well as interbank repo transactions based on Islamic principles.
Promoting Economic Competitiveness and Self-
Sufficiency
Bank Indonesia considers that structural reform policies should be set in the context of responding to the strategic environment of increasingly complex global competition. This is primarily in line with the position of Indonesia as a middle-income country, faced by increasing wage and non-wage competition in the global market. In this regards, the intensity of competition among emerging middle-income countries over the past decade has manifested in competition in terms of quality and the pace at which reform is being implemented to foster an efficient innovation-based economy2. More specifically, middle-income countries are locked in mutual competition to become an important part of the global value chains of finished and intermediate goods3.
For middle-income countries aspiring to migrate into advanced countries, integration to the global value chains
2 World Economic Forum. (2013). “The Global Competitiveness Report 2012-2013.” Insight Report. World Economic Forum. Geneva.
3 UNCTAD. (2013). “Global Value Chains and Development: Investment and Value Added Trade in the Global Economy”. A Preliminary Analysis/Advanced Unedited Versions. United Nations Conference on Trade and Development. Geneva.
Picture 15.4. Pillars of Structural Reform
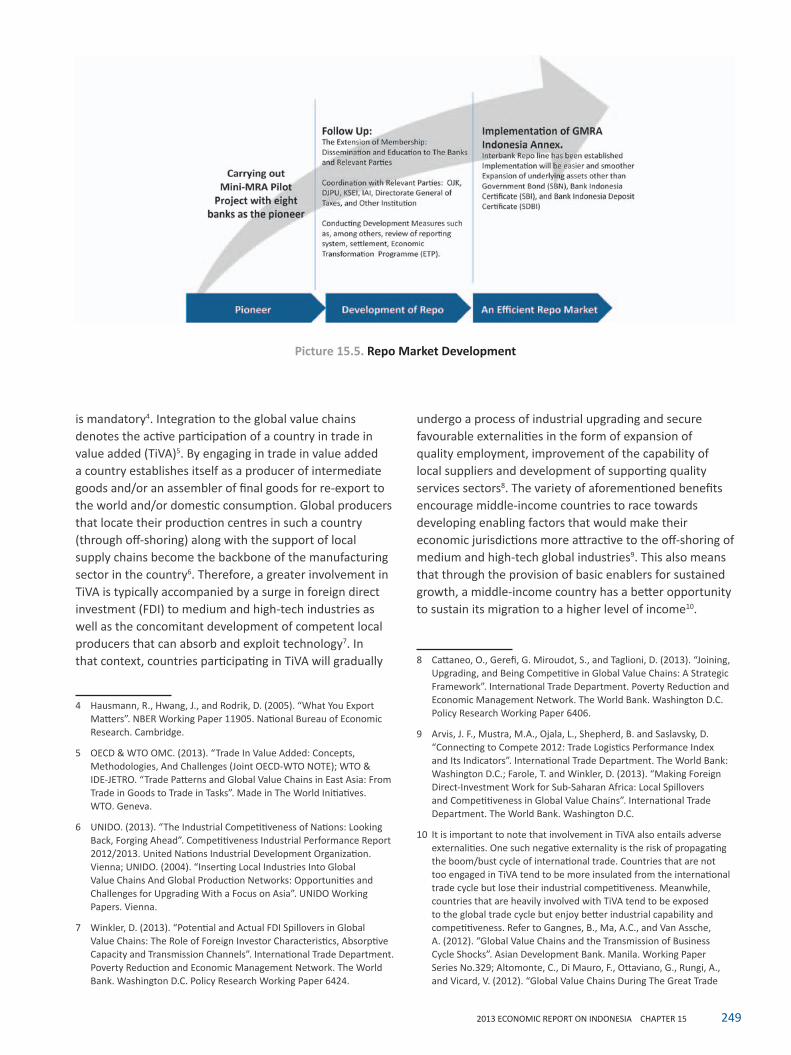
2492013 ECONOMIC REPORT ON INDONESIA CHAPTER 15
is mandatory4. Integration to the global value chains denotes the active participation of a country in trade in value added (TiVA)5. By engaging in trade in value added a country establishes itself as a producer of intermediate goods and/or an assembler of final goods for re-export to the world and/or domestic consumption. Global producers that locate their production centres in such a country (through off-shoring) along with the support of local supply chains become the backbone of the manufacturing sector in the country6. Therefore, a greater involvement in TiVA is typically accompanied by a surge in foreign direct investment (FDI) to medium and high-tech industries as well as the concomitant development of competent local producers that can absorb and exploit technology7. In that context, countries participating in TiVA will gradually
4 Hausmann, R., Hwang, J., and Rodrik, D. (2005). “What You Export Matters”. NBER Working Paper 11905. National Bureau of Economic Research. Cambridge.
5 OECD & WTO OMC. (2013). “Trade In Value Added: Concepts, Methodologies, And Challenges (Joint OECD-WTO NOTE); WTO & IDE-JETRO. “Trade Patterns and Global Value Chains in East Asia: From Trade in Goods to Trade in Tasks”. Made in The World Initiatives. WTO. Geneva.
6 UNIDO. (2013). “The Industrial Competitiveness of Nations: Looking Back, Forging Ahead”. Competitiveness Industrial Performance Report 2012/2013. United Nations Industrial Development Organization. Vienna; UNIDO. (2004). “Inserting Local Industries Into Global Value Chains And Global Production Networks: Opportunities and Challenges for Upgrading With a Focus on Asia”. UNIDO Working Papers. Vienna.
7 Winkler, D. (2013). “Potential and Actual FDI Spillovers in Global Value Chains: The Role of Foreign Investor Characteristics, Absorptive Capacity and Transmission Channels”. International Trade Department. Poverty Reduction and Economic Management Network. The World Bank. Washington D.C. Policy Research Working Paper 6424.
undergo a process of industrial upgrading and secure favourable externalities in the form of expansion of quality employment, improvement of the capability of local suppliers and development of supporting quality services sectors8. The variety of aforementioned benefits encourage middle-income countries to race towards developing enabling factors that would make their economic jurisdictions more attractive to the off-shoring of medium and high-tech global industries9. This also means that through the provision of basic enablers for sustained growth, a middle-income country has a better opportunity to sustain its migration to a higher level of income10.
8 Cattaneo, O., Gerefi, G. Miroudot, S., and Taglioni, D. (2013). “Joining, Upgrading, and Being Competitive in Global Value Chains: A Strategic Framework”. International Trade Department. Poverty Reduction and Economic Management Network. The World Bank. Washington D.C. Policy Research Working Paper 6406.
9 Arvis, J. F., Mustra, M.A., Ojala, L., Shepherd, B. and Saslavsky, D. “Connecting to Compete 2012: Trade Logistics Performance Index and Its Indicators”. International Trade Department. The World Bank: Washington D.C.; Farole, T. and Winkler, D. (2013). “Making Foreign Direct-Investment Work for Sub-Saharan Africa: Local Spillovers and Competitiveness in Global Value Chains”. International Trade Department. The World Bank. Washington D.C.
10 It is important to note that involvement in TiVA also entails adverse externalities. One such negative externality is the risk of propagating the boom/bust cycle of international trade. Countries that are not too engaged in TiVA tend to be more insulated from the international trade cycle but lose their industrial competitiveness. Meanwhile, countries that are heavily involved with TiVA tend to be exposed to the global trade cycle but enjoy better industrial capability and competitiveness. Refer to Gangnes, B., Ma, A.C., and Van Assche, A. (2012). “Global Value Chains and the Transmission of Business Cycle Shocks”. Asian Development Bank. Manila. Working Paper Series No.329; Altomonte, C., Di Mauro, F., Ottaviano, G., Rungi, A., and Vicard, V. (2012). “Global Value Chains During The Great Trade
Picture 15.5. Repo Market Development
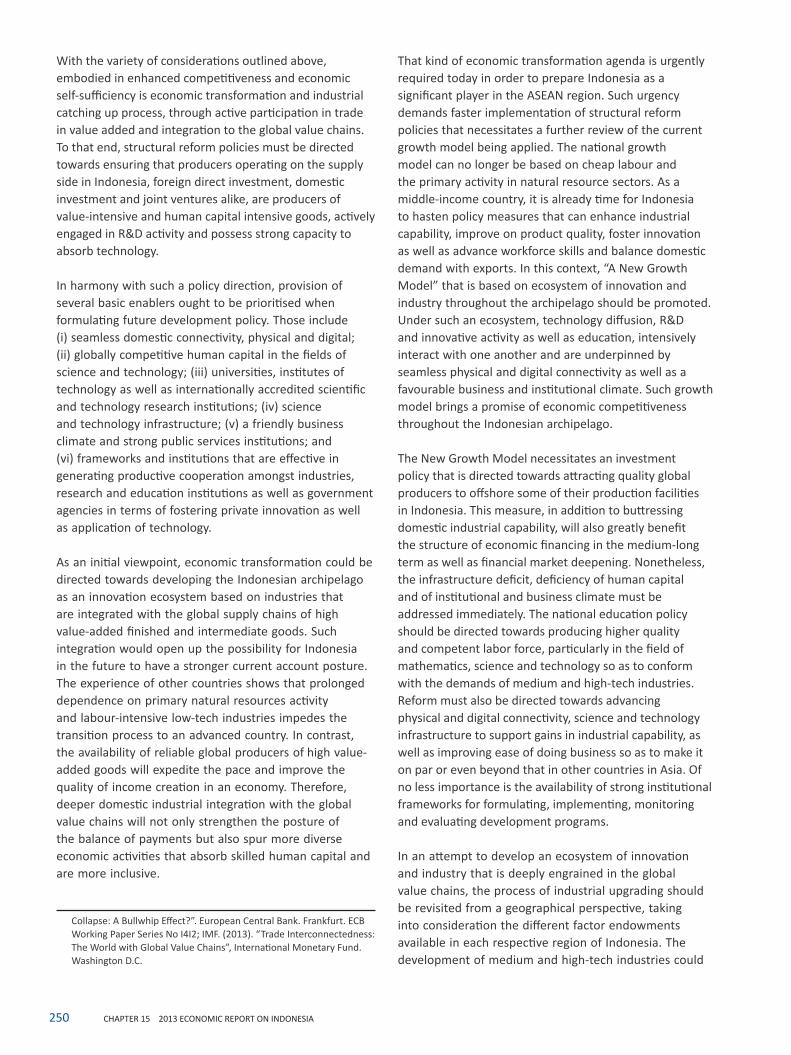
250 CHAPTER 15 2013 ECONOMIC REPORT ON INDONESIA
With the variety of considerations outlined above, embodied in enhanced competitiveness and economic self-sufficiency is economic transformation and industrial catching up process, through active participation in trade in value added and integration to the global value chains. To that end, structural reform policies must be directed towards ensuring that producers operating on the supply side in Indonesia, foreign direct investment, domestic investment and joint ventures alike, are producers of value-intensive and human capital intensive goods, actively engaged in R&D activity and possess strong capacity to absorb technology.
In harmony with such a policy direction, provision of several basic enablers ought to be prioritised when formulating future development policy. Those include (i) seamless domestic connectivity, physical and digital; (ii) globally competitive human capital in the fields of science and technology; (iii) universities, institutes of technology as well as internationally accredited scientific and technology research institutions; (iv) science and technology infrastructure; (v) a friendly business climate and strong public services institutions; and (vi) frameworks and institutions that are effective in generating productive cooperation amongst industries, research and education institutions as well as government agencies in terms of fostering private innovation as well as application of technology.
As an initial viewpoint, economic transformation could be directed towards developing the Indonesian archipelago as an innovation ecosystem based on industries that are integrated with the global supply chains of high value-added finished and intermediate goods. Such integration would open up the possibility for Indonesia in the future to have a stronger current account posture. The experience of other countries shows that prolonged dependence on primary natural resources activity and labour-intensive low-tech industries impedes the transition process to an advanced country. In contrast, the availability of reliable global producers of high value-added goods will expedite the pace and improve the quality of income creation in an economy. Therefore, deeper domestic industrial integration with the global value chains will not only strengthen the posture of the balance of payments but also spur more diverse economic activities that absorb skilled human capital and are more inclusive.
Collapse: A Bullwhip Effect?”. European Central Bank. Frankfurt. ECB Working Paper Series No I4I2; IMF. (2013). “Trade Interconnectedness: The World with Global Value Chains”, International Monetary Fund. Washington D.C.
That kind of economic transformation agenda is urgently required today in order to prepare Indonesia as a significant player in the ASEAN region. Such urgency demands faster implementation of structural reform policies that necessitates a further review of the current growth model being applied. The national growth model can no longer be based on cheap labour and the primary activity in natural resource sectors. As a middle-income country, it is already time for Indonesia to hasten policy measures that can enhance industrial capability, improve on product quality, foster innovation as well as advance workforce skills and balance domestic demand with exports. In this context, “A New Growth Model” that is based on ecosystem of innovation and industry throughout the archipelago should be promoted. Under such an ecosystem, technology diffusion, R&D and innovative activity as well as education, intensively interact with one another and are underpinned by seamless physical and digital connectivity as well as a favourable business and institutional climate. Such growth model brings a promise of economic competitiveness throughout the Indonesian archipelago.
The New Growth Model necessitates an investment policy that is directed towards attracting quality global producers to offshore some of their production facilities in Indonesia. This measure, in addition to buttressing domestic industrial capability, will also greatly benefit the structure of economic financing in the medium-long term as well as financial market deepening. Nonetheless, the infrastructure deficit, deficiency of human capital and of institutional and business climate must be addressed immediately. The national education policy should be directed towards producing higher quality and competent labor force, particularly in the field of mathematics, science and technology so as to conform with the demands of medium and high-tech industries. Reform must also be directed towards advancing physical and digital connectivity, science and technology infrastructure to support gains in industrial capability, as well as improving ease of doing business so as to make it on par or even beyond that in other countries in Asia. Of no less importance is the availability of strong institutional frameworks for formulating, implementing, monitoring and evaluating development programs.
In an attempt to develop an ecosystem of innovation and industry that is deeply engrained in the global value chains, the process of industrial upgrading should be revisited from a geographical perspective, taking into consideration the different factor endowments available in each respective region of Indonesia. The development of medium and high-tech industries could
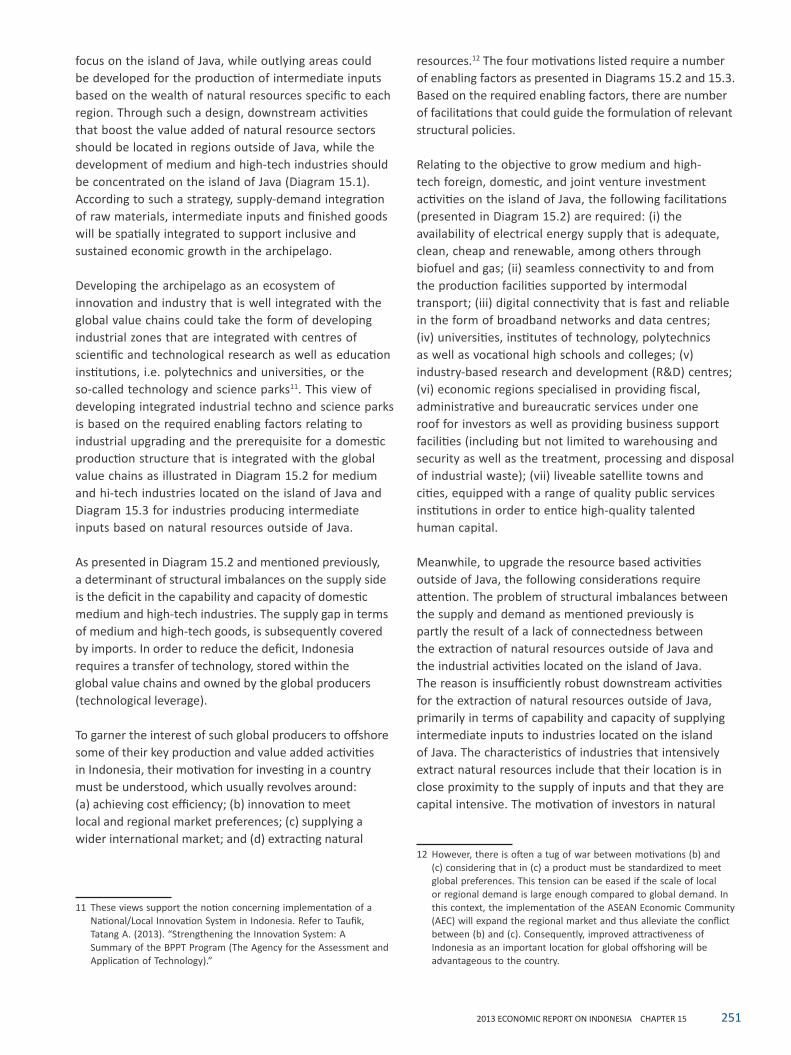
2512013 ECONOMIC REPORT ON INDONESIA CHAPTER 15
focus on the island of Java, while outlying areas could be developed for the production of intermediate inputs based on the wealth of natural resources specific to each region. Through such a design, downstream activities that boost the value added of natural resource sectors should be located in regions outside of Java, while the development of medium and high-tech industries should be concentrated on the island of Java (Diagram 15.1). According to such a strategy, supply-demand integration of raw materials, intermediate inputs and finished goods will be spatially integrated to support inclusive and sustained economic growth in the archipelago.
Developing the archipelago as an ecosystem of innovation and industry that is well integrated with the global value chains could take the form of developing industrial zones that are integrated with centres of scientific and technological research as well as education institutions, i.e. polytechnics and universities, or the so-called technology and science parks11. This view of developing integrated industrial techno and science parks is based on the required enabling factors relating to industrial upgrading and the prerequisite for a domestic production structure that is integrated with the global value chains as illustrated in Diagram 15.2 for medium and hi-tech industries located on the island of Java and Diagram 15.3 for industries producing intermediate inputs based on natural resources outside of Java.
As presented in Diagram 15.2 and mentioned previously, a determinant of structural imbalances on the supply side is the deficit in the capability and capacity of domestic medium and high-tech industries. The supply gap in terms of medium and high-tech goods, is subsequently covered by imports. In order to reduce the deficit, Indonesia requires a transfer of technology, stored within the global value chains and owned by the global producers (technological leverage).
To garner the interest of such global producers to offshore some of their key production and value added activities in Indonesia, their motivation for investing in a country must be understood, which usually revolves around: (a) achieving cost efficiency; (b) innovation to meet local and regional market preferences; (c) supplying a wider international market; and (d) extracting natural
11 These views support the notion concerning implementation of a National/Local Innovation System in Indonesia. Refer to Taufik, Tatang A. (2013). “Strengthening the Innovation System: A Summary of the BPPT Program (The Agency for the Assessment and Application of Technology).”
resources.12 The four motivations listed require a number of enabling factors as presented in Diagrams 15.2 and 15.3. Based on the required enabling factors, there are number of facilitations that could guide the formulation of relevant structural policies.
Relating to the objective to grow medium and high-tech foreign, domestic, and joint venture investment activities on the island of Java, the following facilitations (presented in Diagram 15.2) are required: (i) the availability of electrical energy supply that is adequate, clean, cheap and renewable, among others through biofuel and gas; (ii) seamless connectivity to and from the production facilities supported by intermodal transport; (iii) digital connectivity that is fast and reliable in the form of broadband networks and data centres; (iv) universities, institutes of technology, polytechnics as well as vocational high schools and colleges; (v) industry-based research and development (R&D) centres; (vi) economic regions specialised in providing fiscal, administrative and bureaucratic services under one roof for investors as well as providing business support facilities (including but not limited to warehousing and security as well as the treatment, processing and disposal of industrial waste); (vii) liveable satellite towns and cities, equipped with a range of quality public services institutions in order to entice high-quality talented human capital.
Meanwhile, to upgrade the resource based activities outside of Java, the following considerations require attention. The problem of structural imbalances between the supply and demand as mentioned previously is partly the result of a lack of connectedness between the extraction of natural resources outside of Java and the industrial activities located on the island of Java. The reason is insufficiently robust downstream activities for the extraction of natural resources outside of Java, primarily in terms of capability and capacity of supplying intermediate inputs to industries located on the island of Java. The characteristics of industries that intensively extract natural resources include that their location is in close proximity to the supply of inputs and that they are capital intensive. The motivation of investors in natural
12 However, there is often a tug of war between motivations (b) and (c) considering that in (c) a product must be standardized to meet global preferences. This tension can be eased if the scale of local or regional demand is large enough compared to global demand. In this context, the implementation of the ASEAN Economic Community (AEC) will expand the regional market and thus alleviate the conflict between (b) and (c). Consequently, improved attractiveness of Indonesia as an important location for global offshoring will be advantageous to the country.
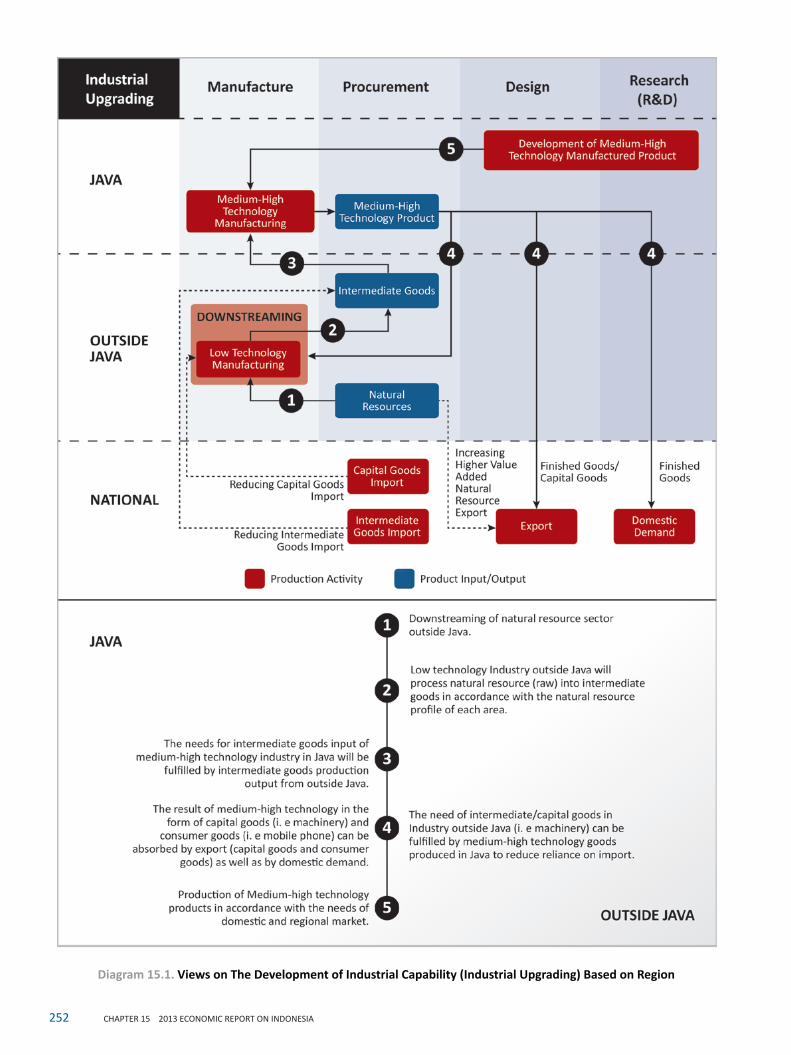
252 CHAPTER 15 2013 ECONOMIC REPORT ON INDONESIA
Diagram 15.1. Views on The Development of Industrial Capability (Industrial Upgrading) Based on Region
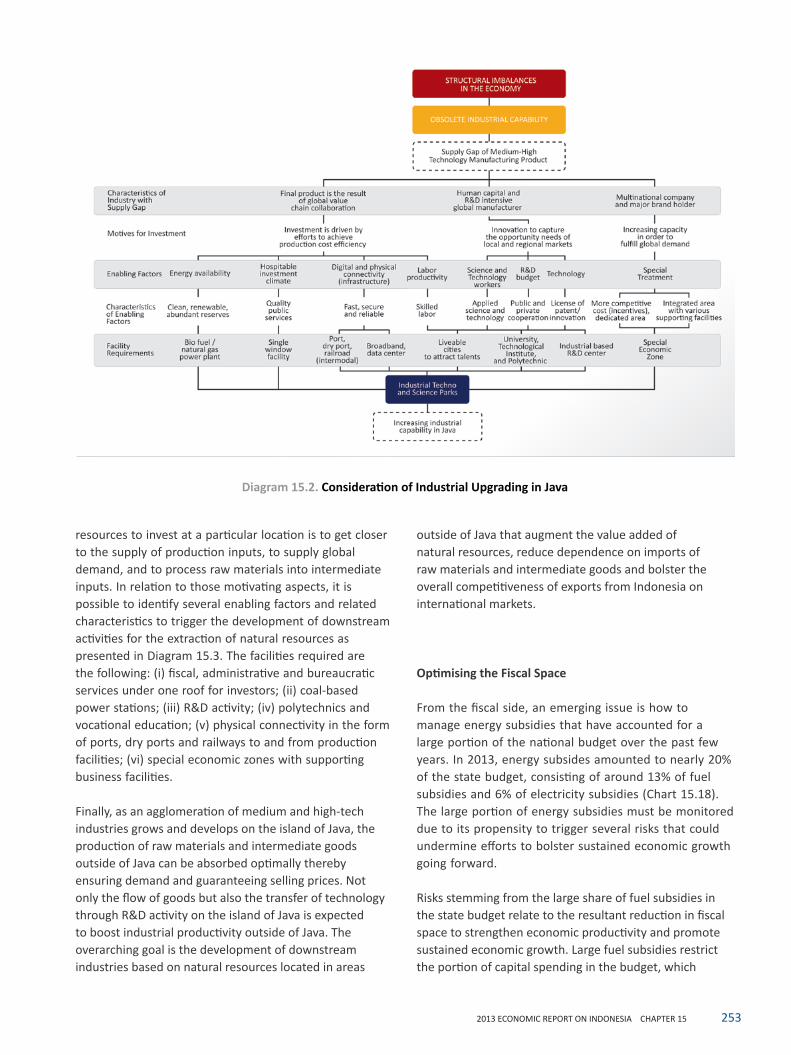
2532013 ECONOMIC REPORT ON INDONESIA CHAPTER 15
resources to invest at a particular location is to get closer to the supply of production inputs, to supply global demand, and to process raw materials into intermediate inputs. In relation to those motivating aspects, it is possible to identify several enabling factors and related characteristics to trigger the development of downstream activities for the extraction of natural resources as presented in Diagram 15.3. The facilities required are the following: (i) fiscal, administrative and bureaucratic services under one roof for investors; (ii) coal-based power stations; (iii) R&D activity; (iv) polytechnics and vocational education; (v) physical connectivity in the form of ports, dry ports and railways to and from production facilities; (vi) special economic zones with supporting business facilities.
Finally, as an agglomeration of medium and high-tech industries grows and develops on the island of Java, the production of raw materials and intermediate goods outside of Java can be absorbed optimally thereby ensuring demand and guaranteeing selling prices. Not only the flow of goods but also the transfer of technology through R&D activity on the island of Java is expected to boost industrial productivity outside of Java. The overarching goal is the development of downstream industries based on natural resources located in areas
outside of Java that augment the value added of natural resources, reduce dependence on imports of raw materials and intermediate goods and bolster the overall competitiveness of exports from Indonesia on international markets.
Optimising the Fiscal Space
From the fiscal side, an emerging issue is how to manage energy subsidies that have accounted for a large portion of the national budget over the past few years. In 2013, energy subsides amounted to nearly 20% of the state budget, consisting of around 13% of fuel subsidies and 6% of electricity subsidies (Chart 15.18). The large portion of energy subsidies must be monitored due to its propensity to trigger several risks that could undermine efforts to bolster sustained economic growth going forward.
Risks stemming from the large share of fuel subsidies in the state budget relate to the resultant reduction in fiscal space to strengthen economic productivity and promote sustained economic growth. Large fuel subsidies restrict the portion of capital spending in the budget, which
Diagram 15.2. Consideration of Industrial Upgrading in Java
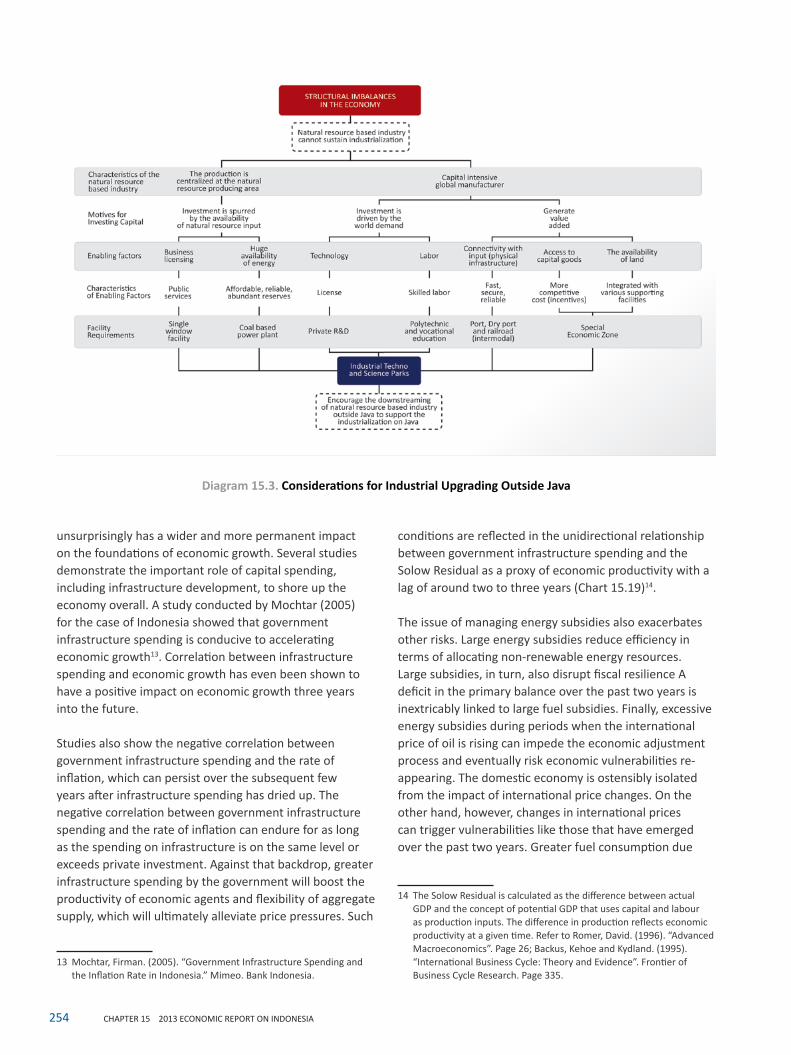
254 CHAPTER 15 2013 ECONOMIC REPORT ON INDONESIA
Diagram 15.3. Considerations for Industrial Upgrading Outside Java
unsurprisingly has a wider and more permanent impact on the foundations of economic growth. Several studies demonstrate the important role of capital spending, including infrastructure development, to shore up the economy overall. A study conducted by Mochtar (2005) for the case of Indonesia showed that government infrastructure spending is conducive to accelerating economic growth13. Correlation between infrastructure spending and economic growth has even been shown to have a positive impact on economic growth three years into the future.
Studies also show the negative correlation between government infrastructure spending and the rate of inflation, which can persist over the subsequent few years after infrastructure spending has dried up. The negative correlation between government infrastructure spending and the rate of inflation can endure for as long as the spending on infrastructure is on the same level or exceeds private investment. Against that backdrop, greater infrastructure spending by the government will boost the productivity of economic agents and flexibility of aggregate supply, which will ultimately alleviate price pressures. Such
13 Mochtar, Firman. (2005). “Government Infrastructure Spending and the Inflation Rate in Indonesia.” Mimeo. Bank Indonesia.
conditions are reflected in the unidirectional relationship between government infrastructure spending and the Solow Residual as a proxy of economic productivity with a lag of around two to three years (Chart 15.19)14.
The issue of managing energy subsidies also exacerbates other risks. Large energy subsidies reduce efficiency in terms of allocating non-renewable energy resources. Large subsidies, in turn, also disrupt fiscal resilience A deficit in the primary balance over the past two years is inextricably linked to large fuel subsidies. Finally, excessive energy subsidies during periods when the international price of oil is rising can impede the economic adjustment process and eventually risk economic vulnerabilities re-appearing. The domestic economy is ostensibly isolated from the impact of international price changes. On the other hand, however, changes in international prices can trigger vulnerabilities like those that have emerged over the past two years. Greater fuel consumption due
14 The Solow Residual is calculated as the difference between actual GDP and the concept of potential GDP that uses capital and labour as production inputs. The difference in production reflects economic productivity at a given time. Refer to Romer, David. (1996). “Advanced Macroeconomics”. Page 26; Backus, Kehoe and Kydland. (1995). “International Business Cycle: Theory and Evidence”. Frontier of Business Cycle Research. Page 335.
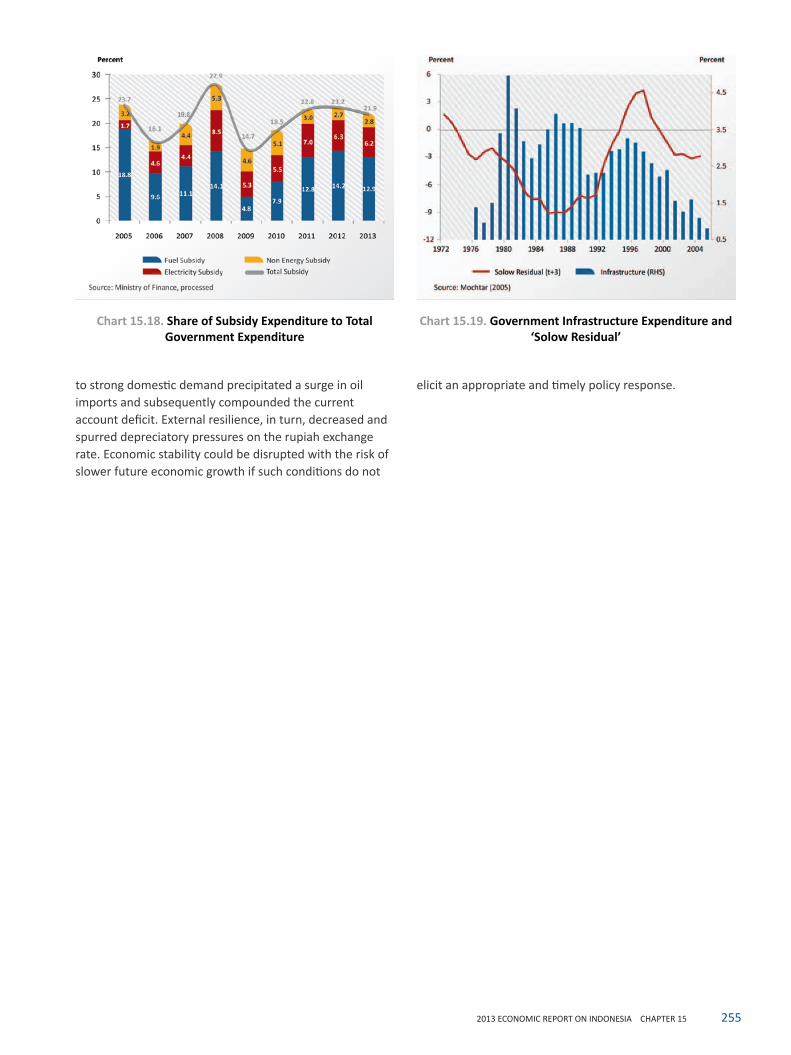
2552013 ECONOMIC REPORT ON INDONESIA CHAPTER 15
Chart 15.19. Government Infrastructure Expenditure and ‘Solow Residual’
Chart 15.18. Share of Subsidy Expenditure to Total Government Expenditure
to strong domestic demand precipitated a surge in oil imports and subsequently compounded the current account deficit. External resilience, in turn, decreased and spurred depreciatory pressures on the rupiah exchange rate. Economic stability could be disrupted with the risk of slower future economic growth if such conditions do not
elicit an appropriate and timely policy response.
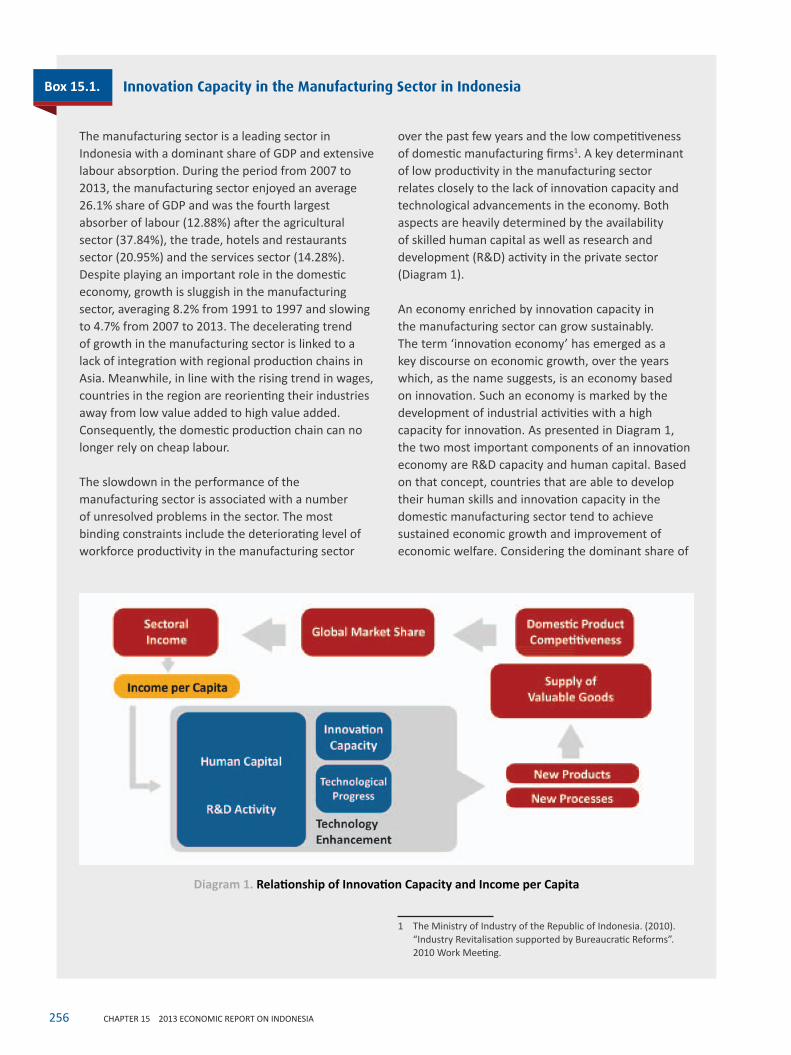
256 CHAPTER 15 2013 ECONOMIC REPORT ON INDONESIA
Box 15.1. Innovation Capacity in the Manufacturing Sector in Indonesia
The manufacturing sector is a leading sector in Indonesia with a dominant share of GDP and extensive labour absorption. During the period from 2007 to 2013, the manufacturing sector enjoyed an average 26.1% share of GDP and was the fourth largest absorber of labour (12.88%) after the agricultural sector (37.84%), the trade, hotels and restaurants sector (20.95%) and the services sector (14.28%). Despite playing an important role in the domestic economy, growth is sluggish in the manufacturing sector, averaging 8.2% from 1991 to 1997 and slowing to 4.7% from 2007 to 2013. The decelerating trend of growth in the manufacturing sector is linked to a lack of integration with regional production chains in Asia. Meanwhile, in line with the rising trend in wages, countries in the region are reorienting their industries away from low value added to high value added. Consequently, the domestic production chain can no longer rely on cheap labour.
The slowdown in the performance of the manufacturing sector is associated with a number of unresolved problems in the sector. The most binding constraints include the deteriorating level of workforce productivity in the manufacturing sector
over the past few years and the low competitiveness of domestic manufacturing firms1. A key determinant of low productivity in the manufacturing sector relates closely to the lack of innovation capacity and technological advancements in the economy. Both aspects are heavily determined by the availability of skilled human capital as well as research and development (R&D) activity in the private sector (Diagram 1).
An economy enriched by innovation capacity in the manufacturing sector can grow sustainably. The term ‘innovation economy’ has emerged as a key discourse on economic growth, over the years which, as the name suggests, is an economy based on innovation. Such an economy is marked by the development of industrial activities with a high capacity for innovation. As presented in Diagram 1, the two most important components of an innovation economy are R&D capacity and human capital. Based on that concept, countries that are able to develop their human skills and innovation capacity in the domestic manufacturing sector tend to achieve sustained economic growth and improvement of economic welfare. Considering the dominant share of
1 The Ministry of Industry of the Republic of Indonesia. (2010). “Industry Revitalisation supported by Bureaucratic Reforms”. 2010 Work Meeting.
Diagram 1. Relationship of Innovation Capacity and Income per Capita
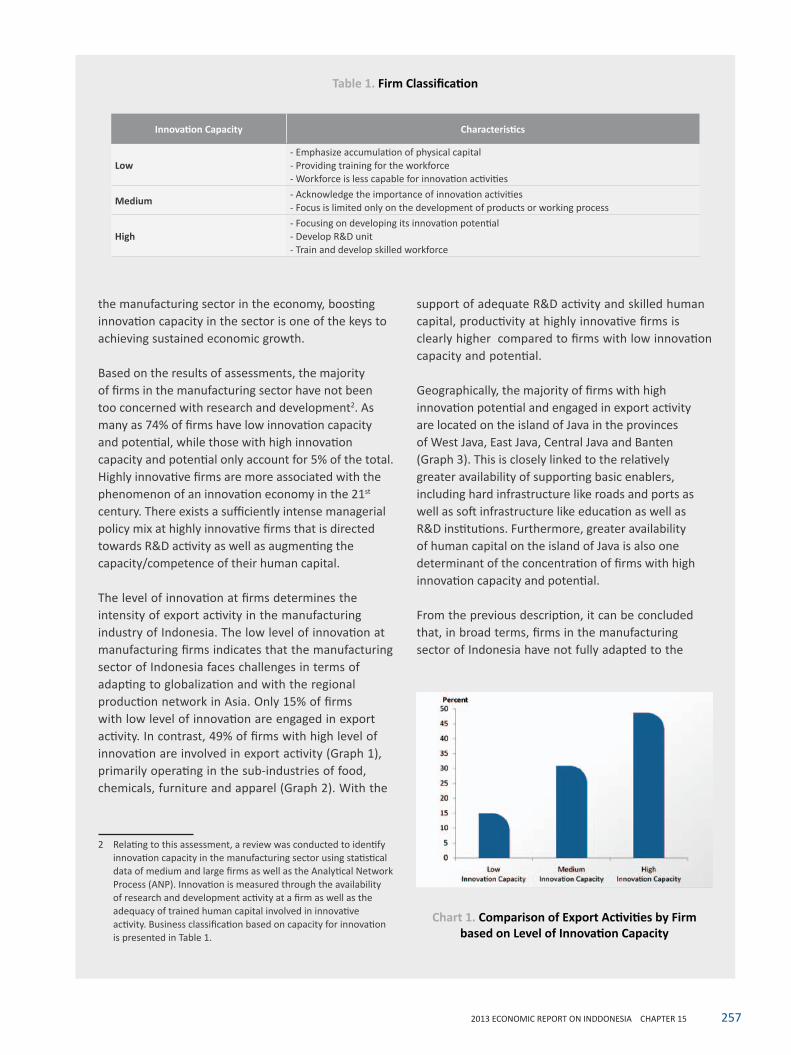
2572013 ECONOMIC REPORT ON INDDONESIA CHAPTER 15
the manufacturing sector in the economy, boosting innovation capacity in the sector is one of the keys to achieving sustained economic growth.
Based on the results of assessments, the majority of firms in the manufacturing sector have not been too concerned with research and development2. As many as 74% of firms have low innovation capacity and potential, while those with high innovation capacity and potential only account for 5% of the total. Highly innovative firms are more associated with the phenomenon of an innovation economy in the 21st century. There exists a sufficiently intense managerial policy mix at highly innovative firms that is directed towards R&D activity as well as augmenting the capacity/competence of their human capital.
The level of innovation at firms determines the intensity of export activity in the manufacturing industry of Indonesia. The low level of innovation at manufacturing firms indicates that the manufacturing sector of Indonesia faces challenges in terms of adapting to globalization and with the regional production network in Asia. Only 15% of firms with low level of innovation are engaged in export activity. In contrast, 49% of firms with high level of innovation are involved in export activity (Graph 1), primarily operating in the sub-industries of food, chemicals, furniture and apparel (Graph 2). With the
2 Relating to this assessment, a review was conducted to identify innovation capacity in the manufacturing sector using statistical data of medium and large firms as well as the Analytical Network Process (ANP). Innovation is measured through the availability of research and development activity at a firm as well as the adequacy of trained human capital involved in innovative activity. Business classification based on capacity for innovation is presented in Table 1.
support of adequate R&D activity and skilled human capital, productivity at highly innovative firms is clearly higher compared to firms with low innovation capacity and potential.
Geographically, the majority of firms with high innovation potential and engaged in export activity are located on the island of Java in the provinces of West Java, East Java, Central Java and Banten (Graph 3). This is closely linked to the relatively greater availability of supporting basic enablers, including hard infrastructure like roads and ports as well as soft infrastructure like education as well as R&D institutions. Furthermore, greater availability of human capital on the island of Java is also one determinant of the concentration of firms with high innovation capacity and potential.
From the previous description, it can be concluded that, in broad terms, firms in the manufacturing sector of Indonesia have not fully adapted to the
Table 1. Firm Classification
Innovation Capacity Characteristics
Low- Emphasize accumulation of physical capital- Providing training for the workforce- Workforce is less capable for innovation activities
Medium- Acknowledge the importance of innovation activities- Focus is limited only on the development of products or working process
High- Focusing on developing its innovation potential- Develop R&D unit- Train and develop skilled workforce
Chart 1. Comparison of Export Activities by Firm based on Level of Innovation Capacity
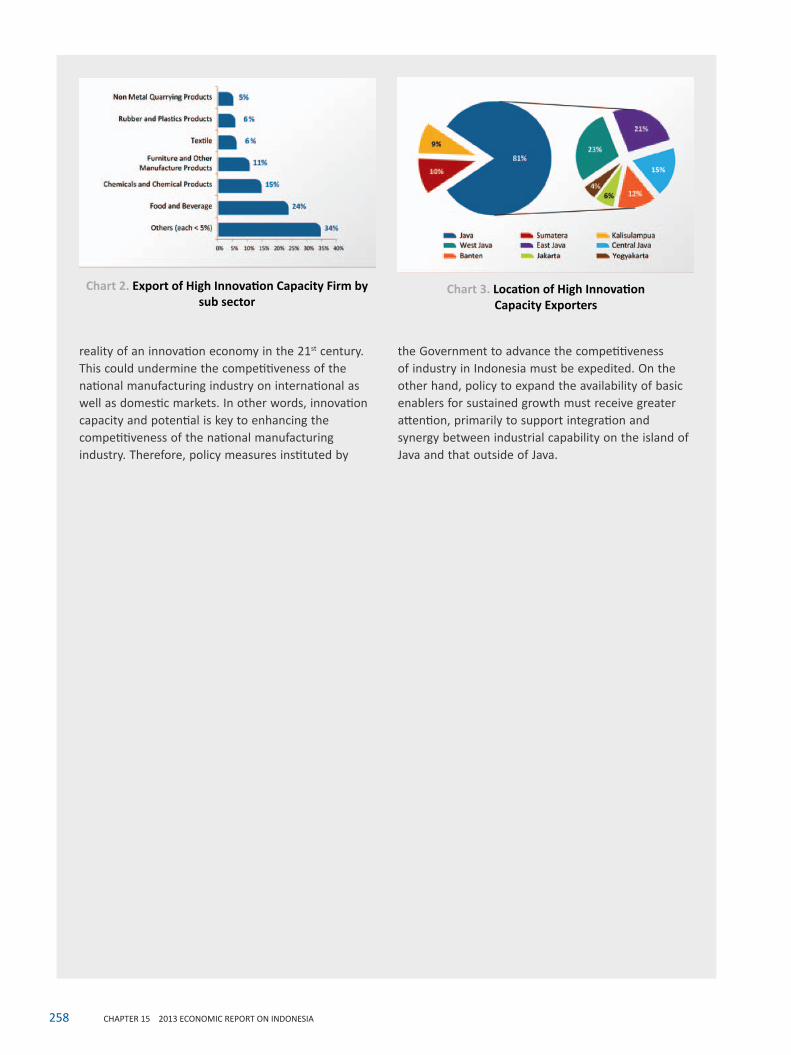
258 CHAPTER 15 2013 ECONOMIC REPORT ON INDONESIA
Chart 3. Location of High Innovation Capacity Exporters
Chart 2. Export of High Innovation Capacity Firm by sub sector
reality of an innovation economy in the 21st century. This could undermine the competitiveness of the national manufacturing industry on international as well as domestic markets. In other words, innovation capacity and potential is key to enhancing the competitiveness of the national manufacturing industry. Therefore, policy measures instituted by
the Government to advance the competitiveness of industry in Indonesia must be expedited. On the other hand, policy to expand the availability of basic enablers for sustained growth must receive greater attention, primarily to support integration and synergy between industrial capability on the island of Java and that outside of Java.