Embed Size (px)
Citation preview
VEFMAP Stage 6
Part A: Program context and rationale
October 2017
Arthur Rylah Institute for Environmental Research
and
Integrated Water and Catchments Division, DELWP
VEFMAP Stage 6 – Part A: Program context and rationale
ii
VEFMAP Stage 6 Part A: Program context and rationale
Report produced by: Arthur Rylah Institute for Environmental Research
Department of Environment, Land, Water and Planning
PO Box 137
Heidelberg, Victoria 3084
and
Integrated Water and Catchments Division
Department of Environment, Land, Water and Planning
8 Nicholson Street, East Melbourne, Victoria 3002
Website: www.delwp.vic.gov.au
With assistance from
Peter Cottingham, Peter Cottingham and Associates
Citation: DELWP (2017) VEFMAP Stage 6 Part A: Program context and rationale. A report by Arthur Rylah Institute for Environmental
Research and Integrated Water and Catchments Division, Department of Environment, Land, Water and Planning, Victoria.
© The State of Victoria Department of Environment, Land, Water and Planning 2017
This work is licensed under a Creative Commons Attribution 4.0 International licence. You are free to re-use the work under that licence, on the condition that you credit the State of Victoria as author. The licence does not apply to any images, photographs or branding, including the Victorian Coat of Arms, the Victorian Government logo and the
Department of Environment, Land, Water and Planning (DELWP) logo. To view a copy of this licence, visit http://creativecommons.org/licenses/by/4.0/
ISBN 978-1-76047-922-0 (print)
ISBN 978-1-76047-923-7 (pdf)
Disclaimer
This publication may be of assistance to you but the State of Victoria and its employees do not guarantee that the publication is without flaw of any kind or is wholly appropriate for your particular purposes and therefore disclaims all liability for any error, loss or other consequence which may arise from you relying on any information in this publication.
Accessibility
If you would like to receive this publication in an alternative format, please telephone the
DELWP Customer Service Centre on 136186, email [email protected], or
via the National Relay Service on 133 677 www.relayservice.com.au. This document is also
available on the internet at www.delwp.vic.gov.au.
VEFMAP Stage 6 – Part A: Program context and rationale
iii
Contents Summary .............................................................................................................................. 1
1 Purpose of this document .............................................................................................. 2
2 VEFMAP Stage 6 objectives .......................................................................................... 3
3 Context .......................................................................................................................... 4
3.1 VEFMAP in the Victorian monitoring and reporting context ..................................... 5
3.2 Key learnings from previous VEFMAP stages ......................................................... 7
3.3 Scoping VEFMAP Stage 6 ...................................................................................... 7
4 Key Evaluation Themes ................................................................................................. 9
4.1 Native Fish Theme .................................................................................................. 9
4.2 Aquatic and River Bank Vegetation Theme ........................................................... 14
5 Sampling sites and program design ............................................................................. 23
5.1 Sampling sites ...................................................................................................... 23
5.2 Monitoring design ................................................................................................. 23
6 Program management ................................................................................................. 25
6.1 Governance .......................................................................................................... 25
6.2 Health and Safety ................................................................................................. 26
7 Program review and evaluation .................................................................................... 27
8 Communication and Reporting ..................................................................................... 28
9 Data and information management .............................................................................. 30
9.1 Quality assurance and quality control ................................................................... 30
9.2 Data handling and storage .................................................................................... 30
9.3 Audit procedures ................................................................................................... 31
10 Adaptive management .............................................................................................. 32
10.1 Benefits of an adaptive management framework .................................................. 32
10.2 Reporting and ongoing engagement with CMAs ................................................... 33
11 References ............................................................................................................... 34
Appendix 1: Conceptual model of habitat processes and flows developed by Chee et al.
(2006) (WQ = water quality) ............................................................................................... 36
Appendix 2: Conceptual model for fish spawning and recruitment into the juvenile population
(developed by Chee et al. 2006) ......................................................................................... 37
Appendix 3: Example of native fish conceptual models ....................................................... 38
Appendix 4: Summary of native fish objectives for each river system .................................. 44
Appendix 5: Full list of potential VEFMAP Stage 6 fish questions ....................................... 46
Appendix 6: Multi-Criteria Analysis tool ............................................................................... 51
VEFMAP Stage 6 – Part A: Program context and rationale
iv
Appendix 7: MCA ranked priority fish questions .................................................................. 52
Appendix 8: Native vegetation conceptual models .............................................................. 55
Appendix 9: Vegetation monitoring objectives and potential evaluation questions for each
river system ........................................................................................................................ 58
Appendix10: Summarised vegetation objectives for each river system ............................... 60
Appendix 11: Proposed complementary vegetation research questions .............................. 63
Figures
Figure 1: Timeline for VEFMAP stages 1-6 ........................................................................... 5
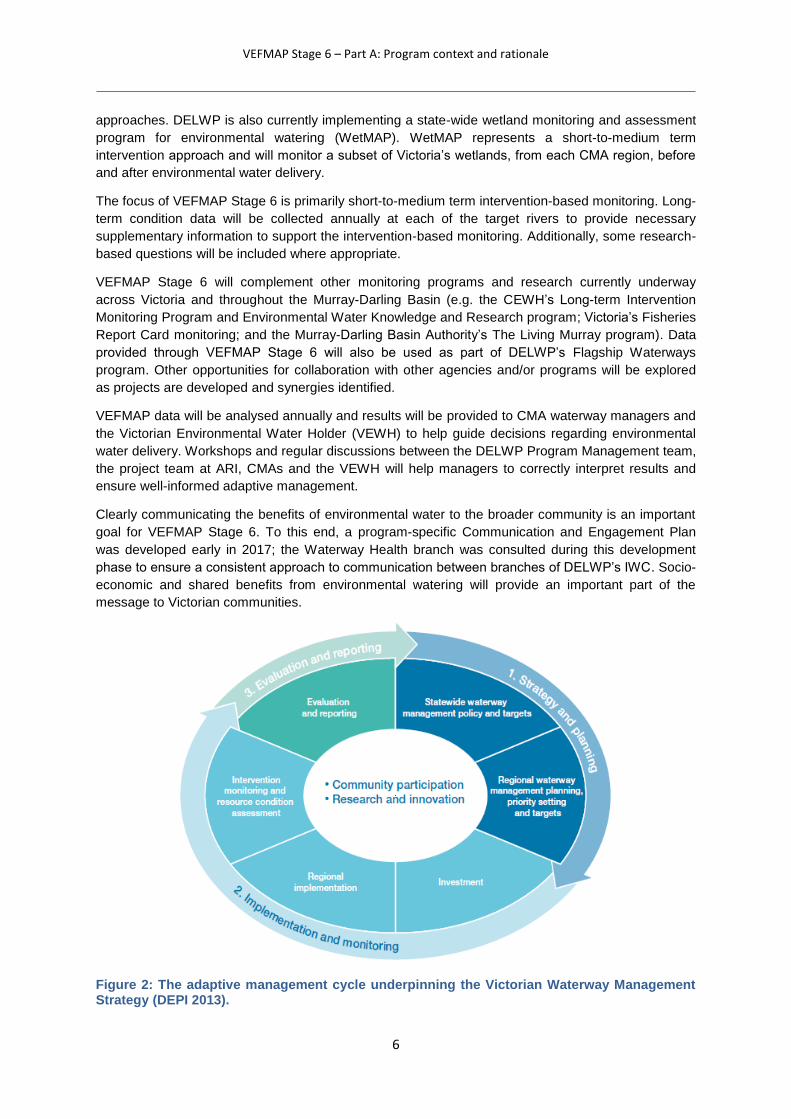
Figure 2: The adaptive management cycle underpinning the Victorian Waterway
Management Strategy (DEPI 2013) ...................................................................................... 6
Figure 3: Overarching conceptual model underpinning the key drivers and modifiers of fish
life-history processes and subsequent population outcomes .............................................. 10
Figure 4: Conceptual model underpinning the relationship between environmental flows and
vegetation response developed in Stage 2 of VEFMAP, reproduced from Chee et al. (2006)
........................................................................................................................................... 17
Figure 5: Overarching conceptual model underpinning the relationship between
environmental flows and vegetation response. .................................................................... 18
Figure 6: Conceptual approach to sampling environmetal flow events ................................ 24
Figure 7: Components of the VEFMAP data management solution showing flow of data… 31
Tables
Table 1: Indicators to address native fish KEQs. ................................................................. 12
Table 2: Types of environmental flows. ............................................................................... 14
Table 3: Vegetation types occurring within a river channel. ................................................. 15
Table 4: Expected termporal responses of aquatic and riparian vegetation to environmental
flows. .................................................................................................................................. 15
Table 5: List of vegetation KEQs and relevant details for VEFMAP Stage 6. ....................... 21
Table 6: Summary of reporting requirements for VEFMAP Stage 6. .................................... 29
VEFMAP Stage 6 – Part A: Program context and rationale
1
Summary
The Department of Environment, Land, Water and Planning (DELWP) established the Victorian
Environmental Flows Monitoring and Assessment Program (VEFMAP) in 2005 and Stages 1-5 were
completed in mid-2016. VEFMAP Stage 6 includes a refocus on ‘intervention’ or ‘flow-event’ style
questions to help demonstrate the ecological value of water for the environment at catchment,
regional and state-wide scales.
The scope and detail of Stage 6 has been compiled in two volumes:
Part A: Program context and rationale
Part B: Program design and monitoring methods.
Part A outlines the scope of VEFMAP Stage 6, which will include three years of monitoring and
evaluation from 2016/17 until 2019/20, followed by a full analysis and program evaluation in 2020.
The planning for Stage 6 has been based on a strong collaboration between members of DELWP’s
Environmental Water team, the Arthur Rylah Institute (ARI), Victorian Catchment Management
Authorities (CMAs), the University of Melbourne (UoM) and other key stakeholders.
The environmental flow objectives and evaluation questions related to native fish and vegetation
responses included in VEFMAP Stage 6 were developed based on Seasonal Watering Plans (SWPs)
(VEWH 2016), Environmental Water Management Plans (EWMPs), and the latest conceptual
understanding of native fish and aquatic and riparian vegetation responses to managed water
regimes. A shortlist of evaluation questions was ranked in order of their importance using agreed
criteria and distributed to CMAs for comment. The project team then worked through the feedback
from CMAs and developed a set of refined key evaluation questions (KEQs) for Stage 6 that have
high transferability among river reaches and catchments.
KEQs for Stage 6 are directly aimed at demonstrating ecological responses associated with
environmental flow events. The combination of clear objectives and consolidated conceptual
understanding that underpin the KEQs has also been used to identify indicators (monitoring end
points) that will be measured during Stage 6. Details of the study design and sampling methods are
provided in VEFMAP Stage 6 Part B: Program design and monitoring methods (DELWP 2017).
Earlier stages of VEFMAP have highlighted the importance of good data collection and management
practices. VEFMAP Stage 6 will use a refined data management system including QA/QC checks to
ensure data collected is accurate, adequate and up-to-date. Stage 6 will also include an updated and
comprehensive Communication and Engagement Strategy that will detail clear roles and
responsibilities for reporting to ensure effective communication and accountability throughout the life
of the program.
VEFMAP Stage 6 represents an exciting way forward for Victoria’s state-wide monitoring of
environmental water; the program will operate on a strong foundation of communication and
collaboration with CMAs, scientists and other key stakeholders.

VEFMAP Stage 6 – Part A: Program context and rationale
2
1 Purpose of this document
This document has been compiled for the following purposes:
To provide an Independent Review Panel (IRP) and internal reviewers from the Department
of Environment, Land, Water and Planning (DELWP) with adequate information to assess the
suitability of the proposed program design for meeting the stated program objectives.
To provide a summary of the context and rationale for VEFMAP Stage 6 for Victorian
Catchment Management Authorities (CMAs) and other interested stakeholders.
To provide a source and summary of information for use in briefing DELWP Managers,
Directors, Executive Directors and the Minister, Water.
To provide a source and summary of information for use in preparing contracts to complete
the monitoring.
The scope and detail of VEFMAP Stage 6 have been compiled into two volumes:
Part A: Program context and rationale, and
Part B: Program design and monitoring methods.
VEFMAP Stage 6 – Part A: Program context and rationale
3
2 VEFMAP Stage 6 objectives
1. Enable DELWP and its water delivery partners to clearly demonstrate the ecological value of environmental water management to the community and water industry stakeholders.
2. Fill knowledge gaps to improve planning, delivery and evaluation of environmental water management in rivers across Victoria.
3. Identify ecosystem outcomes from environmental water to help meet Victoria’s obligations under the Murray-Darling Basin Plan (Schedule 12, Matter 8).
VEFMAP Stage 6 includes three years of monitoring and evaluation, from 2016/17 to 2019/20,
followed by a full analysis and program evaluation in 2020.
VEFMAP Stage 6 – Part A: Program context and rationale
4
3 Context
The acquisition and delivery of environmental water by the Victorian and Commonwealth
Governments represents a significant investment in aquatic ecosystem health and rehabilitation. The
Victorian Environmental Water Holder (VEWH) currently holds approximately 634 GL of
environmental water in Victoria (long-term average), while the Commonwealth Environmental Water
Holder (CEWH) holds an additional 543 GL.
Maximising the efficiency and effectiveness of environmental water use requires clear ecological
objectives and an adaptive management framework that builds on evidence and key learnings from
environmental watering outcomes.
With this in mind, the Victorian Environmental Flows Monitoring and Assessment Program (VEFMAP)
was established to investigate ecosystem responses to environmental flows and to provide new
information that can adaptively support flow-management decisions.
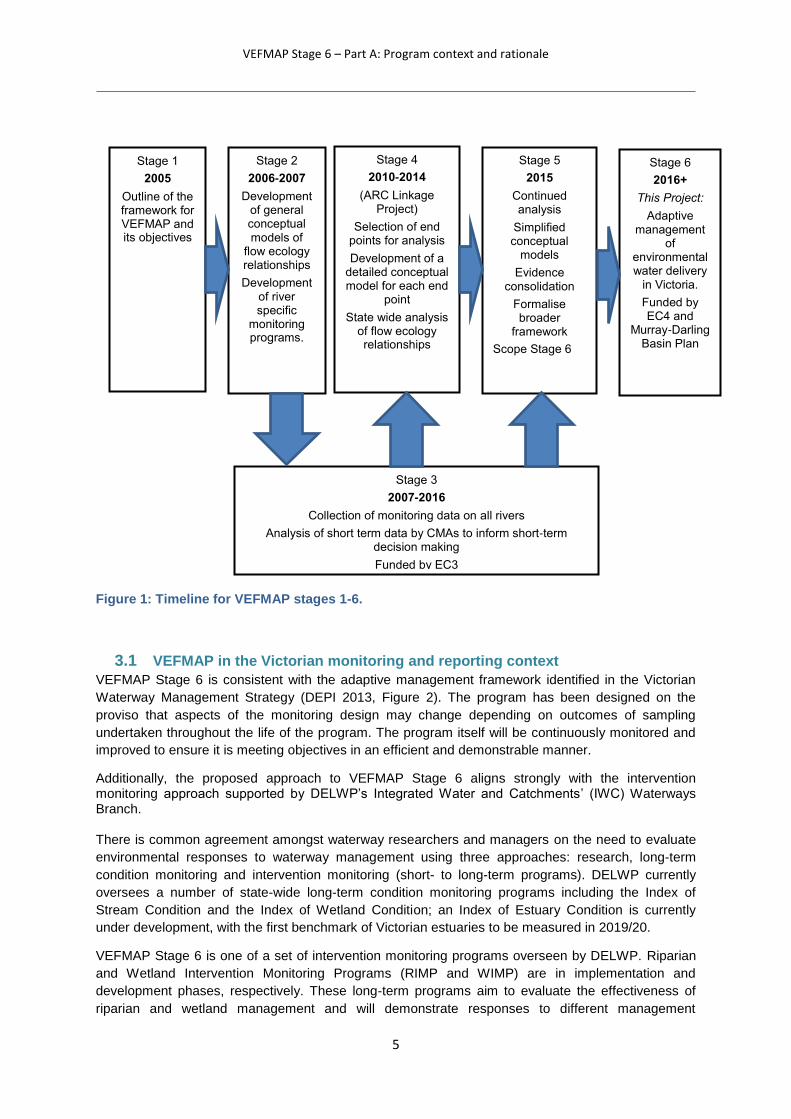
Following Stage 1 development in 2005, VEFMAP was refined in 2006 (Stage 2). Monitoring
commenced in 2007 in eight regulated rivers across Victoria (Stage 3; 2007-2016). In 2010, staff at
the University of Melbourne (UoM) secured an Australian Research Council (ARC) linkage grant to
complete a detailed analysis of VEFMAP data (Stage 4; Miller et al. 2014). The most recent phase of
VEFMAP (Stage 5; 2015-2016) has involved further analysis and reporting of VEFMAP data and
results to date, along with development of the scope and monitoring design for Stage 6 (Figure 1). A
Stage 5 report is currently being finalised by the Arthur Rylah Institute (ARI) (ARI 2017; in prep.).
Based on the combined experience of implementing VEFMAP over many years, and particularly in light of the Stage 5 outcomes, ARI and the UoM recommended that VEFMAP Stage 6 include the following:
Revision of the VEFMAP approach by developing a series of regional and system-specific
objectives and hypotheses with stakeholder input.
The use of best-available knowledge to develop testable regional flow-ecology hypotheses.
Selection of key indicators to evaluate the responses of fish and vegetation, focussing on
those flow parameters (hydrology and hydraulics) and ecological processes (e.g. spawning,
recruitment, movement) that govern fish and vegetation communities.
Development of regionally appropriate methods, such as flow-event based monitoring, to
measure fish and vegetation responses to support the hypotheses.
Continued analysis and evaluation of existing data to confirm flow-biota relationships to inform
more effective delivery of environmental flows and future monitoring programs.
Clear and comprehensive stakeholder communication and engagement.
The proposed approach to VEFMAP Stage 6 has closely followed these recommendations and is strongly aligned with DELWP’s intervention monitoring approach (section 3.1).
Monitoring for VEFMAP Stage 6 is intended to run from late 2016 to early 2020 under EC4. The three main components of the VEFMAP Stage 6 monitoring phase will include:
Intervention monitoring with refined hypothesis testing for native fish and aquatic and river
bank vegetation outcomes.
Adaptive management to inform operational watering decisions.
Clear and comprehensive stakeholder communication and engagement.
Stage 6 monitoring outcomes will also contribute to reporting for Matter 8, Schedule 12 of the Murray-Darling Basin Plan and address significant knowledge gaps in our understanding of ecosystem and population responses to environmental flows.
VEFMAP Stage 6 – Part A: Program context and rationale
5
Stage 1
2005
Outline of the framework for VEFMAP and its objectives
Stage 2
2006-2007
Development of general conceptual models of
flow ecology relationships
Development of river specific
monitoring programs.
Stage 4
2010-2014
(ARC Linkage Project)
Selection of end points for analysis
Development of a detailed conceptual model for each end
point
State wide analysis of flow ecology relationships
Stage 5
2015
Continued analysis
Simplified conceptual
models
Evidence consolidation
Formalise broader
framework
Scope Stage 6
Stage 3
2007-2016
Collection of monitoring data on all rivers
Analysis of short term data by CMAs to inform short-term decision making
Funded by EC3
Stage 6
2016+
This Project:
Adaptive management
of environmental water delivery
in Victoria.
Funded by EC4 and
Murray-Darling Basin Plan
Figure 1: Timeline for VEFMAP stages 1-6.
3.1 VEFMAP in the Victorian monitoring and reporting context
VEFMAP Stage 6 is consistent with the adaptive management framework identified in the Victorian
Waterway Management Strategy (DEPI 2013, Figure 2). The program has been designed on the
proviso that aspects of the monitoring design may change depending on outcomes of sampling
undertaken throughout the life of the program. The program itself will be continuously monitored and
improved to ensure it is meeting objectives in an efficient and demonstrable manner.
Additionally, the proposed approach to VEFMAP Stage 6 aligns strongly with the intervention monitoring approach supported by DELWP’s Integrated Water and Catchments’ (IWC) Waterways Branch. There is common agreement amongst waterway researchers and managers on the need to evaluate
environmental responses to waterway management using three approaches: research, long-term
condition monitoring and intervention monitoring (short- to long-term programs). DELWP currently
oversees a number of state-wide long-term condition monitoring programs including the Index of
Stream Condition and the Index of Wetland Condition; an Index of Estuary Condition is currently
under development, with the first benchmark of Victorian estuaries to be measured in 2019/20.
VEFMAP Stage 6 is one of a set of intervention monitoring programs overseen by DELWP. Riparian
and Wetland Intervention Monitoring Programs (RIMP and WIMP) are in implementation and
development phases, respectively. These long-term programs aim to evaluate the effectiveness of
riparian and wetland management and will demonstrate responses to different management
VEFMAP Stage 6 – Part A: Program context and rationale
6
approaches. DELWP is also currently implementing a state-wide wetland monitoring and assessment
program for environmental watering (WetMAP). WetMAP represents a short-to-medium term
intervention approach and will monitor a subset of Victoria’s wetlands, from each CMA region, before
and after environmental water delivery.
The focus of VEFMAP Stage 6 is primarily short-to-medium term intervention-based monitoring. Long-
term condition data will be collected annually at each of the target rivers to provide necessary
supplementary information to support the intervention-based monitoring. Additionally, some research-
based questions will be included where appropriate.
VEFMAP Stage 6 will complement other monitoring programs and research currently underway
across Victoria and throughout the Murray-Darling Basin (e.g. the CEWH’s Long-term Intervention
Monitoring Program and Environmental Water Knowledge and Research program; Victoria’s Fisheries
Report Card monitoring; and the Murray-Darling Basin Authority’s The Living Murray program). Data
provided through VEFMAP Stage 6 will also be used as part of DELWP’s Flagship Waterways
program. Other opportunities for collaboration with other agencies and/or programs will be explored
as projects are developed and synergies identified.
VEFMAP data will be analysed annually and results will be provided to CMA waterway managers and
the Victorian Environmental Water Holder (VEWH) to help guide decisions regarding environmental
water delivery. Workshops and regular discussions between the DELWP Program Management team,
the project team at ARI, CMAs and the VEWH will help managers to correctly interpret results and
ensure well-informed adaptive management.
Clearly communicating the benefits of environmental water to the broader community is an important
goal for VEFMAP Stage 6. To this end, a program-specific Communication and Engagement Plan
was developed early in 2017; the Waterway Health branch was consulted during this development
phase to ensure a consistent approach to communication between branches of DELWP’s IWC. Socio-
economic and shared benefits from environmental watering will provide an important part of the
message to Victorian communities.
Figure 2: The adaptive management cycle underpinning the Victorian Waterway Management Strategy (DEPI 2013).
VEFMAP Stage 6 – Part A: Program context and rationale
7
3.2 Key learnings from previous VEFMAP stages
Environmental outcomes demonstrated from the VEFMAP Stage 3 monitoring phase are outlined in
Miller et al. (2014).
In summary, analysis of data from VEFMAP Stage 3 showed system-scale, condition-style monitoring
has limited ability to detect outcomes from environmental watering for short-to-medium term data sets.
It is now more broadly recognised that this approach to monitoring may yield results if data sets span
10+ years; however, directly attributing ecological responses to environmental flows is still likely to be
difficult if relying only on this approach.
A complete review of the program at the end of VEFMAP Stage 4 (see Cottingham et al. 2014)
recommended that future monitoring should focus on the monitoring and analysis of native fish and
riparian vegetation responses to environmental flows. The focus on these attributes was considered
appropriate, given that native fish and riparian vegetation are key ecosystem components and are of
direct interest to environmental water managers.
Complementary projects conducted during Stage 5 used an intervention-style approach, examining
fish spawning responses before, during and after environmental water delivery. Results from these
projects provided sound evidence for a response by fish to environmental flows (e.g. Amtstaetter et al.
2016). Stage 5 also involved the refinement of conceptual models to develop testable, regional, flow-
ecology hypotheses for native fish and riparian vegetation (see section 4.2, this volume; and section
2, VEFMAP Stage 6 Part B, DELWP 2017).
As a result of this work, the focus of VEFMAP Stage 6 is to conduct intervention-based monitoring
that will enable improved understanding of responses in the short-to-medium term, while continuing
data collection that will allow long-term evaluation. Data collection will focus on the two key evaluation
themes: native fish and aquatic and river bank vegetation, recommended from the Stage 4 review.
Population demographic data will be collected annually to provide necessary supplementary
information to support the intervention-based monitoring. The locations of this condition-style
monitoring will focus on specific sites and river reaches of relevance to the intervention-based
monitoring and KEQs. Data from this annual condition monitoring (along with other complementary
programs such as Victoria’s Fisheries Report Card) will continue to build the VEFMAP Stage 3 long-
term data set, which is a widely valued as a means of informing changes in fish population
demographics over time.
3.3 Scoping VEFMAP Stage 6
Stage 6 planning involved a strong collaboration between DELWP’s Environmental Water team, ARI,
CMAs, UoM and other key stakeholders.
During Stage 5, representatives from DELWP, ARI, CMAs, UoM and other key agencies attended
workshops and responded to questionnaires to plan the way forward and provide suggestions for
monitoring questions for VEFMAP Stage 6 (see Cottingham et al. 2014; Miller et al. 2014; Sharpe
2014). This input was essential for understanding CMA needs and areas of interest.
Based on this consultation process, and in conjunction with the latest scientific understanding of
ecological responses to changes in flow regimes, ARI and UoM developed a shortlist of potential key
evaluation questions (KEQs) for native fish and vegetation. These questions were further refined
through workshops, individual meetings with CMAs, and independent expert advice.
Particular care was taken to ensure all suggestions for monitoring questions were based on state-
wide and regional objectives for environmental water delivery outlined in Seasonal Watering Plans
(SWPs; VEWH 2016), Environmental Water Management Plans (EWMPs) and MDBP Long-Term
Watering Plans (LTWPs).
VEFMAP Stage 6 – Part A: Program context and rationale
8
This process ensured that VEFMAP Stage 6 focuses on both state-wide and regionally relevant KEQs
that are explicitly linked to Victoria’s current objectives for environmental water.
In summary, key tasks completed during the Stage 6 scoping phase included:
- Development of a series of regional and system-specific objectives and evaluation questions.
- Selection of key indicators to evaluate the responses of fish and vegetation, focussing on flow
parameters (hydrology and hydraulics) and ecological processes (spawning, recruitment,
movement) that govern fish and vegetation communities.
- Development of regionally appropriate methods, such as flow-event based monitoring, to
measure fish and vegetation responses.
- Continued analysis and evaluation of existing data to confirm flow-biota relationships, to
inform more effective delivery of environmental flows and future monitoring programs.
- Development of KEQs that are:
o regionally focused and relevant to CMAs;
o highly transferable, where possible, among rivers in order to maximise the benefits at
broad geographic scales (notwithstanding the point above);
o realistically answerable and able to demonstrate the value of environmental water for
engaging local, regional and potentially state-wide stakeholders;
o based on the latest conceptual understanding of ecological responses to flow; and
o weighted toward flow-driven population processes (e.g. dispersal, spawning,
recruitment, vegetation cover).
VEFMAP Stage 6 – Part A: Program context and rationale
9
4 Key Evaluation Themes
4.1 Native Fish Theme
To assist the development of KEQs relating native fish population responses to environmental
watering, conceptual models were developed using best-available scientific information. Detailed
conceptual models were developed in Stage 2 of VEFMAP (Chee et al. 2006; Appendix 1 and 2).
Although some progress has been made towards understanding these links already, the generalised
nature of these models (which were not system or species specific), substantial knowledge gaps and
the uncertainties of some links mean many of the responses require further examination. As such, a
general conceptual model has been developed (Figure 3), which incorporates more recent
understanding of links between fish populations and system drivers at a broad level (e.g. MDFRC
2013) along with a compilation of recent species-specific information to consolidate the current
scientific understanding of the life cycle of target native fish species and their response to different
water regimes (developed as part of several expert panel workshops (Koehn et al. in prep; see
Appendix 3 for example). A series of diagrammatic conceptual models to represent specific processes
being investigated for each KEQ was also developed (see section 2, VEFMAP Stage 6 Part B,
DELWP 2017). Together, this information provided a sound scientific base for developing evaluation
questions that could be addressed through the Stage 6 VEFMAP program.
VEFMAP Stage 6 – Part A: Program context and rationale
10
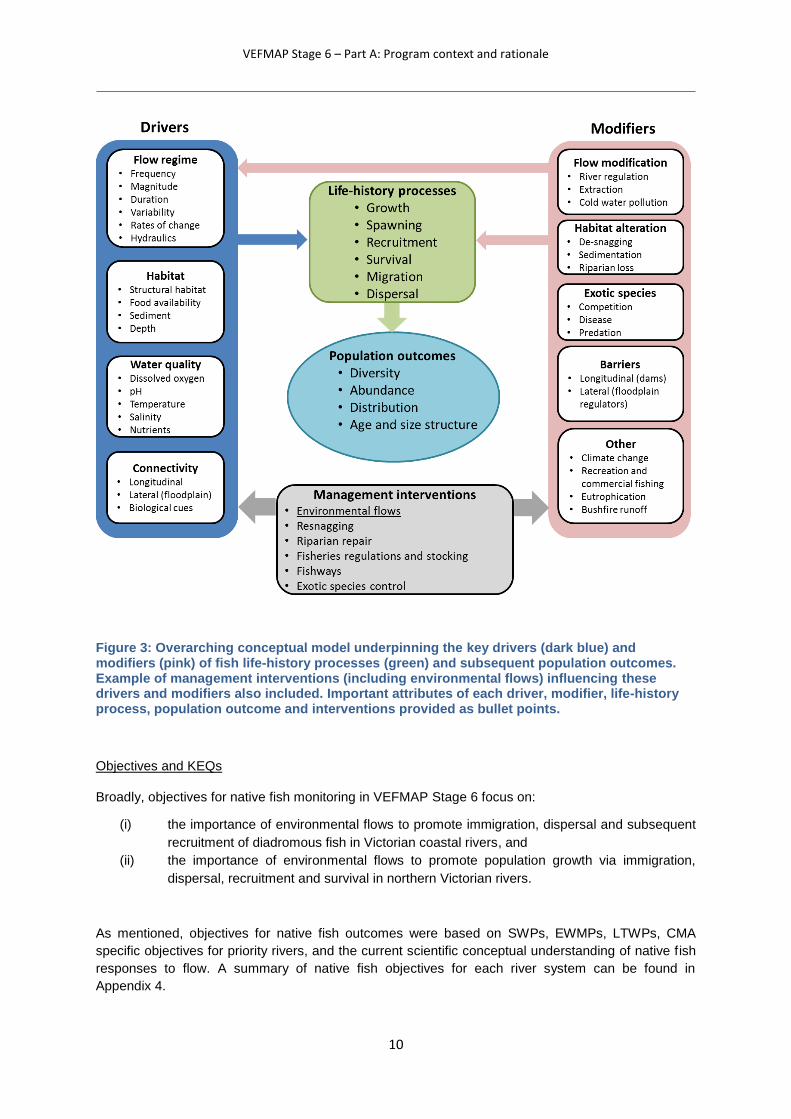
Figure 3: Overarching conceptual model underpinning the key drivers (dark blue) and modifiers (pink) of fish life-history processes (green) and subsequent population outcomes. Example of management interventions (including environmental flows) influencing these drivers and modifiers also included. Important attributes of each driver, modifier, life-history process, population outcome and interventions provided as bullet points.
Objectives and KEQs
Broadly, objectives for native fish monitoring in VEFMAP Stage 6 focus on:
(i) the importance of environmental flows to promote immigration, dispersal and subsequent
recruitment of diadromous fish in Victorian coastal rivers, and
(ii) the importance of environmental flows to promote population growth via immigration,
dispersal, recruitment and survival in northern Victorian rivers.
As mentioned, objectives for native fish outcomes were based on SWPs, EWMPs, LTWPs, CMA
specific objectives for priority rivers, and the current scientific conceptual understanding of native fish
responses to flow. A summary of native fish objectives for each river system can be found in
Appendix 4.
VEFMAP Stage 6 – Part A: Program context and rationale
11
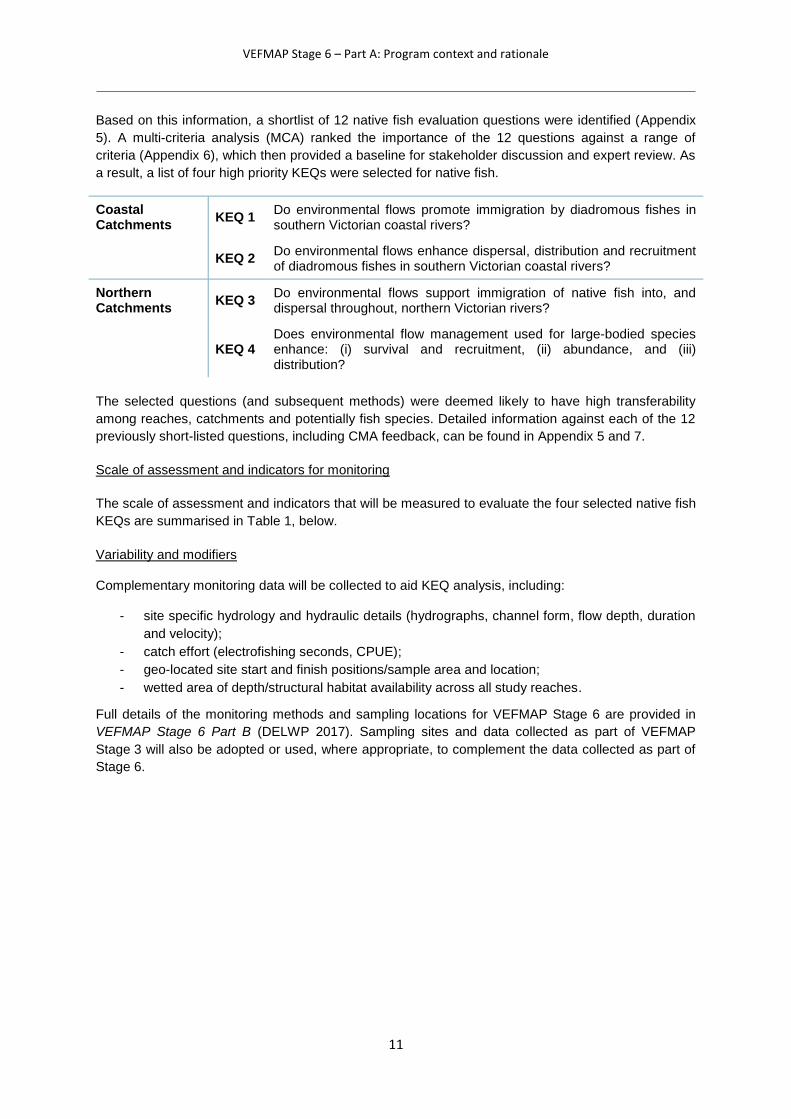
Based on this information, a shortlist of 12 native fish evaluation questions were identified (Appendix
5). A multi-criteria analysis (MCA) ranked the importance of the 12 questions against a range of
criteria (Appendix 6), which then provided a baseline for stakeholder discussion and expert review. As
a result, a list of four high priority KEQs were selected for native fish.
Coastal Catchments
KEQ 1 Do environmental flows promote immigration by diadromous fishes in southern Victorian coastal rivers?
KEQ 2 Do environmental flows enhance dispersal, distribution and recruitment of diadromous fishes in southern Victorian coastal rivers?
Northern Catchments
KEQ 3 Do environmental flows support immigration of native fish into, and dispersal throughout, northern Victorian rivers?
KEQ 4 Does environmental flow management used for large-bodied species enhance: (i) survival and recruitment, (ii) abundance, and (iii) distribution?
The selected questions (and subsequent methods) were deemed likely to have high transferability
among reaches, catchments and potentially fish species. Detailed information against each of the 12
previously short-listed questions, including CMA feedback, can be found in Appendix 5 and 7.
Scale of assessment and indicators for monitoring
The scale of assessment and indicators that will be measured to evaluate the four selected native fish
KEQs are summarised in Table 1, below.
Variability and modifiers
Complementary monitoring data will be collected to aid KEQ analysis, including:
- site specific hydrology and hydraulic details (hydrographs, channel form, flow depth, duration
and velocity);
- catch effort (electrofishing seconds, CPUE);
- geo-located site start and finish positions/sample area and location;
- wetted area of depth/structural habitat availability across all study reaches.
Full details of the monitoring methods and sampling locations for VEFMAP Stage 6 are provided in
VEFMAP Stage 6 Part B (DELWP 2017). Sampling sites and data collected as part of VEFMAP
Stage 3 will also be adopted or used, where appropriate, to complement the data collected as part of
Stage 6.
VEFMAP Stage 6 – Part A: Program context and rationale
12
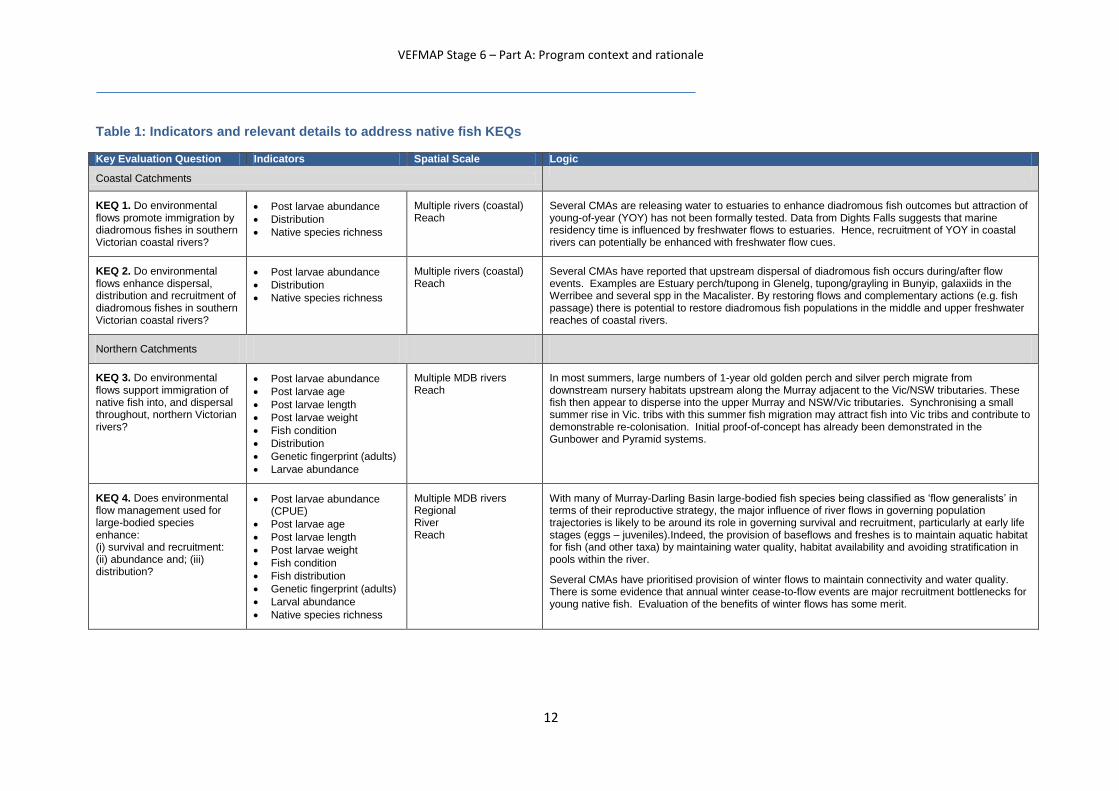
Table 1: Indicators and relevant details to address native fish KEQs
Key Evaluation Question Indicators Spatial Scale Logic
Coastal Catchments
KEQ 1. Do environmental flows promote immigration by diadromous fishes in southern Victorian coastal rivers?
Post larvae abundance
Distribution
Native species richness
Multiple rivers (coastal) Reach
Several CMAs are releasing water to estuaries to enhance diadromous fish outcomes but attraction of young-of-year (YOY) has not been formally tested. Data from Dights Falls suggests that marine residency time is influenced by freshwater flows to estuaries. Hence, recruitment of YOY in coastal rivers can potentially be enhanced with freshwater flow cues.
KEQ 2. Do environmental flows enhance dispersal, distribution and recruitment of diadromous fishes in southern Victorian coastal rivers?
Post larvae abundance
Distribution
Native species richness
Multiple rivers (coastal) Reach
Several CMAs have reported that upstream dispersal of diadromous fish occurs during/after flow events. Examples are Estuary perch/tupong in Glenelg, tupong/grayling in Bunyip, galaxiids in the Werribee and several spp in the Macalister. By restoring flows and complementary actions (e.g. fish passage) there is potential to restore diadromous fish populations in the middle and upper freshwater reaches of coastal rivers.
Northern Catchments
KEQ 3. Do environmental flows support immigration of native fish into, and dispersal throughout, northern Victorian rivers?
Post larvae abundance
Post larvae age
Post larvae length
Post larvae weight
Fish condition
Distribution
Genetic fingerprint (adults)
Larvae abundance
Multiple MDB rivers Reach
In most summers, large numbers of 1-year old golden perch and silver perch migrate from downstream nursery habitats upstream along the Murray adjacent to the Vic/NSW tributaries. These fish then appear to disperse into the upper Murray and NSW/Vic tributaries. Synchronising a small summer rise in Vic. tribs with this summer fish migration may attract fish into Vic tribs and contribute to demonstrable re-colonisation. Initial proof-of-concept has already been demonstrated in the Gunbower and Pyramid systems.
KEQ 4. Does environmental flow management used for large-bodied species enhance: (i) survival and recruitment: (ii) abundance and; (iii) distribution?
Post larvae abundance (CPUE)
Post larvae age
Post larvae length
Post larvae weight
Fish condition
Fish distribution
Genetic fingerprint (adults)
Larval abundance
Native species richness
Multiple MDB rivers Regional River Reach
With many of Murray-Darling Basin large-bodied fish species being classified as ‘flow generalists’ in terms of their reproductive strategy, the major influence of river flows in governing population trajectories is likely to be around its role in governing survival and recruitment, particularly at early life stages (eggs – juveniles).Indeed, the provision of baseflows and freshes is to maintain aquatic habitat for fish (and other taxa) by maintaining water quality, habitat availability and avoiding stratification in pools within the river.
Several CMAs have prioritised provision of winter flows to maintain connectivity and water quality. There is some evidence that annual winter cease-to-flow events are major recruitment bottlenecks for young native fish. Evaluation of the benefits of winter flows has some merit.
VEFMAP Stage 6 – Part A: Program context and rationale
13
Constraints to Stage 6 fish monitoring
The following constraints may influence whether monitoring objectives can be achieved:
- dry year scenarios (including drought) can influence important factors such as habitat
availability and survival;
- low abundance (current status) of spawning stocks may limit the extent of spawning detected;
- winter shut-down of river systems may lead to low carrying capacity;
- cold water releases from dams during summer-autumn may limit spawning (Koehn et al.
2014);
- barriers to fish movement in the Murray-Darling Basin could lead to recruitment failure
(Agostinho et al. 2008);
- mortality of large bodied fish such as Murray cod through undershot weirs (Baumgartner et al.
2006);
- larger in-channel flow peaks, including small floods (5,000-10,000 ML/d), have declined by
half in the Murray River over the past 50 years (Maheshwari et al. 1995) – these act as
migration and spawning cues;
- large numbers of larvae, juvenile and adult fish moving into irrigation channels (Gilligan and
Schiller 2003 and Koehn and Harrington 2005);
- reversal of the flow regime in the Murray River (Maheshwari et al. 1995); and
- low winter flows in the Murray River increase risk to fish through increased predation,
competition, habitat loss, drying, poor water quality, lower egg and larval survival rates and
potential lack of flow cues and gonad development in larger fish (Koehn et al. 2014).
Limiting or constraining factors have been noted and accounted for, where possible, when designing
monitoring projects to assess each KEQ.
VEFMAP Stage 6 – Part A: Program context and rationale
14
4.2 Aquatic and River Bank Vegetation Theme
To assist the development of KEQs relating vegetation to environmental watering, conceptual models
were developed using best-available scientific information. Detailed conceptual models were
developed in Stage 2 of VEFMAP (Chee et al. 2006) and these have been built on and further
developed for VEFMAP Stage 6. Vegetation-based conceptual models for environmental flows are
largely based on four major components: flow types, vegetation types, channel components and
response types.
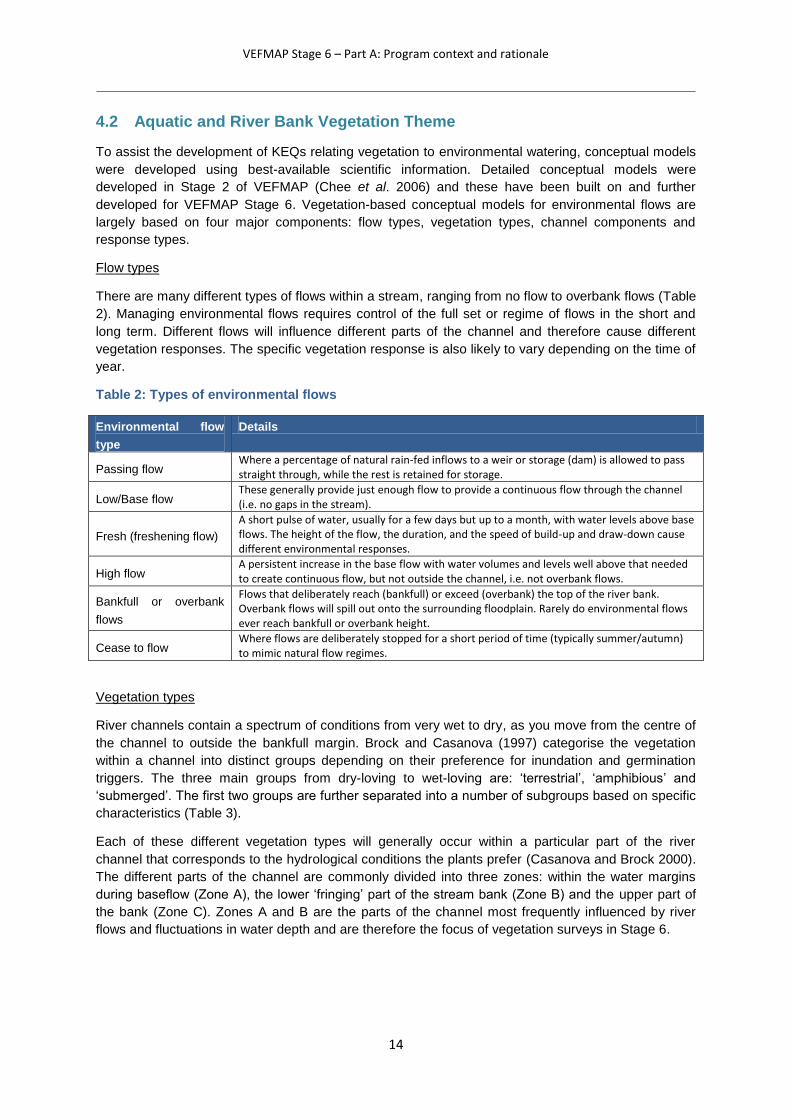
Flow types
There are many different types of flows within a stream, ranging from no flow to overbank flows (Table
2). Managing environmental flows requires control of the full set or regime of flows in the short and
long term. Different flows will influence different parts of the channel and therefore cause different
vegetation responses. The specific vegetation response is also likely to vary depending on the time of
year.
Table 2: Types of environmental flows
Environmental flow
type
Details
Passing flow Where a percentage of natural rain-fed inflows to a weir or storage (dam) is allowed to pass straight through, while the rest is retained for storage.
Low/Base flow These generally provide just enough flow to provide a continuous flow through the channel (i.e. no gaps in the stream).
Fresh (freshening flow)
A short pulse of water, usually for a few days but up to a month, with water levels above base flows. The height of the flow, the duration, and the speed of build-up and draw-down cause different environmental responses.
High flow A persistent increase in the base flow with water volumes and levels well above that needed to create continuous flow, but not outside the channel, i.e. not overbank flows.
Bankfull or overbank
flows
Flows that deliberately reach (bankfull) or exceed (overbank) the top of the river bank. Overbank flows will spill out onto the surrounding floodplain. Rarely do environmental flows ever reach bankfull or overbank height.
Cease to flow Where flows are deliberately stopped for a short period of time (typically summer/autumn) to mimic natural flow regimes.
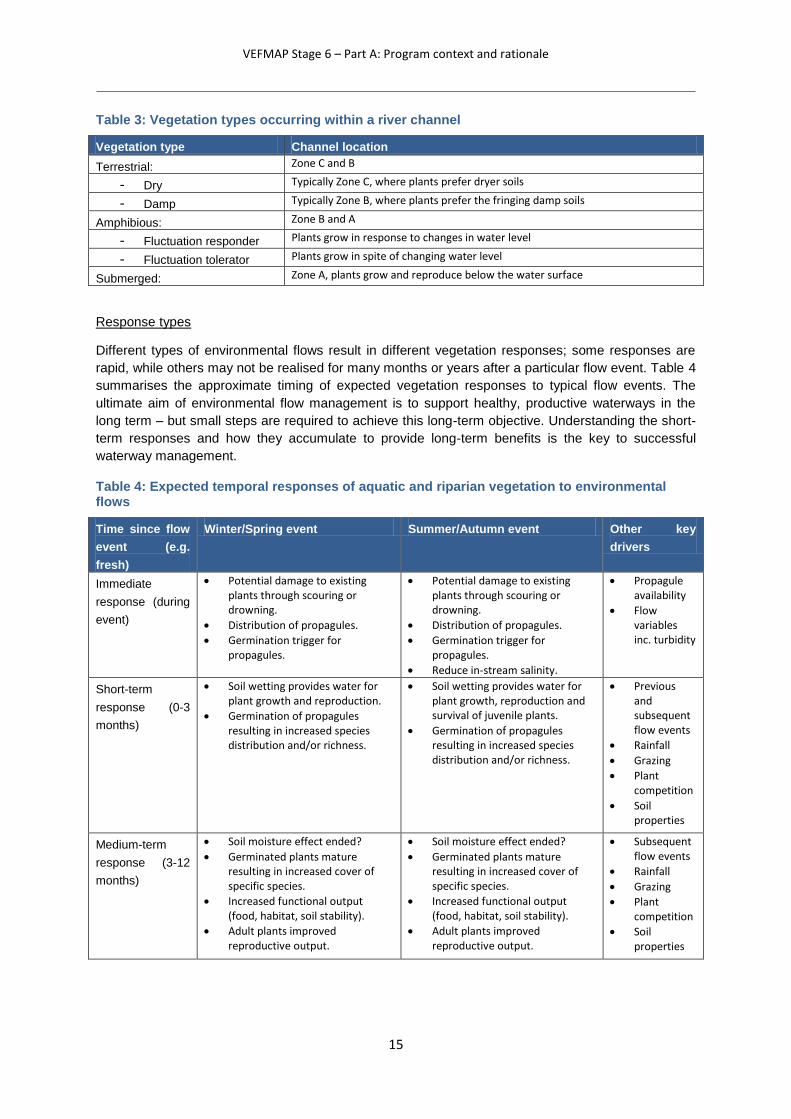
Vegetation types
River channels contain a spectrum of conditions from very wet to dry, as you move from the centre of
the channel to outside the bankfull margin. Brock and Casanova (1997) categorise the vegetation
within a channel into distinct groups depending on their preference for inundation and germination
triggers. The three main groups from dry-loving to wet-loving are: ‘terrestrial’, ‘amphibious’ and
‘submerged’. The first two groups are further separated into a number of subgroups based on specific
characteristics (Table 3).
Each of these different vegetation types will generally occur within a particular part of the river
channel that corresponds to the hydrological conditions the plants prefer (Casanova and Brock 2000).
The different parts of the channel are commonly divided into three zones: within the water margins
during baseflow (Zone A), the lower ‘fringing’ part of the stream bank (Zone B) and the upper part of
the bank (Zone C). Zones A and B are the parts of the channel most frequently influenced by river
flows and fluctuations in water depth and are therefore the focus of vegetation surveys in Stage 6.
VEFMAP Stage 6 – Part A: Program context and rationale
15
Table 3: Vegetation types occurring within a river channel
Vegetation type Channel location
Terrestrial: Zone C and B
- Dry Typically Zone C, where plants prefer dryer soils
- Damp Typically Zone B, where plants prefer the fringing damp soils
Amphibious: Zone B and A
- Fluctuation responder Plants grow in response to changes in water level
- Fluctuation tolerator Plants grow in spite of changing water level
Submerged: Zone A, plants grow and reproduce below the water surface
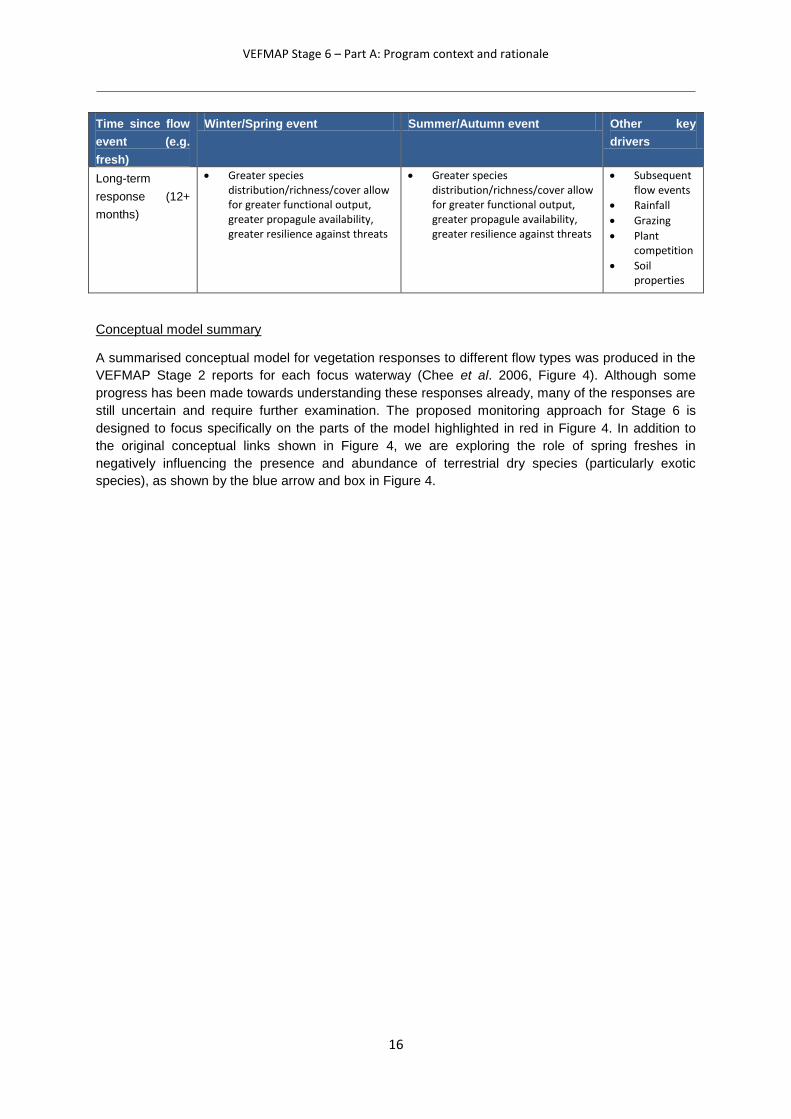
Response types
Different types of environmental flows result in different vegetation responses; some responses are
rapid, while others may not be realised for many months or years after a particular flow event. Table 4
summarises the approximate timing of expected vegetation responses to typical flow events. The
ultimate aim of environmental flow management is to support healthy, productive waterways in the
long term – but small steps are required to achieve this long-term objective. Understanding the short-
term responses and how they accumulate to provide long-term benefits is the key to successful
waterway management.
Table 4: Expected temporal responses of aquatic and riparian vegetation to environmental flows
Time since flow
event (e.g.
fresh)
Winter/Spring event Summer/Autumn event Other key
drivers
Immediate
response (during
event)
Potential damage to existing plants through scouring or drowning.
Distribution of propagules.
Germination trigger for propagules.
Potential damage to existing plants through scouring or drowning.
Distribution of propagules.
Germination trigger for propagules.
Reduce in-stream salinity.
Propagule availability
Flow variables inc. turbidity
Short-term
response (0-3
months)
Soil wetting provides water for plant growth and reproduction.
Germination of propagules resulting in increased species distribution and/or richness.
Soil wetting provides water for plant growth, reproduction and survival of juvenile plants.
Germination of propagules resulting in increased species distribution and/or richness.
Previous and subsequent flow events
Rainfall
Grazing
Plant competition
Soil properties
Medium-term
response (3-12
months)
Soil moisture effect ended?
Germinated plants mature resulting in increased cover of specific species.
Increased functional output (food, habitat, soil stability).
Adult plants improved reproductive output.
Soil moisture effect ended?
Germinated plants mature resulting in increased cover of specific species.
Increased functional output (food, habitat, soil stability).
Adult plants improved reproductive output.
Subsequent flow events
Rainfall
Grazing
Plant competition
Soil properties
VEFMAP Stage 6 – Part A: Program context and rationale
16
Time since flow
event (e.g.
fresh)
Winter/Spring event Summer/Autumn event Other key
drivers
Long-term
response (12+
months)
Greater species distribution/richness/cover allow for greater functional output, greater propagule availability, greater resilience against threats
Greater species distribution/richness/cover allow for greater functional output, greater propagule availability, greater resilience against threats
Subsequent flow events
Rainfall
Grazing
Plant competition
Soil properties
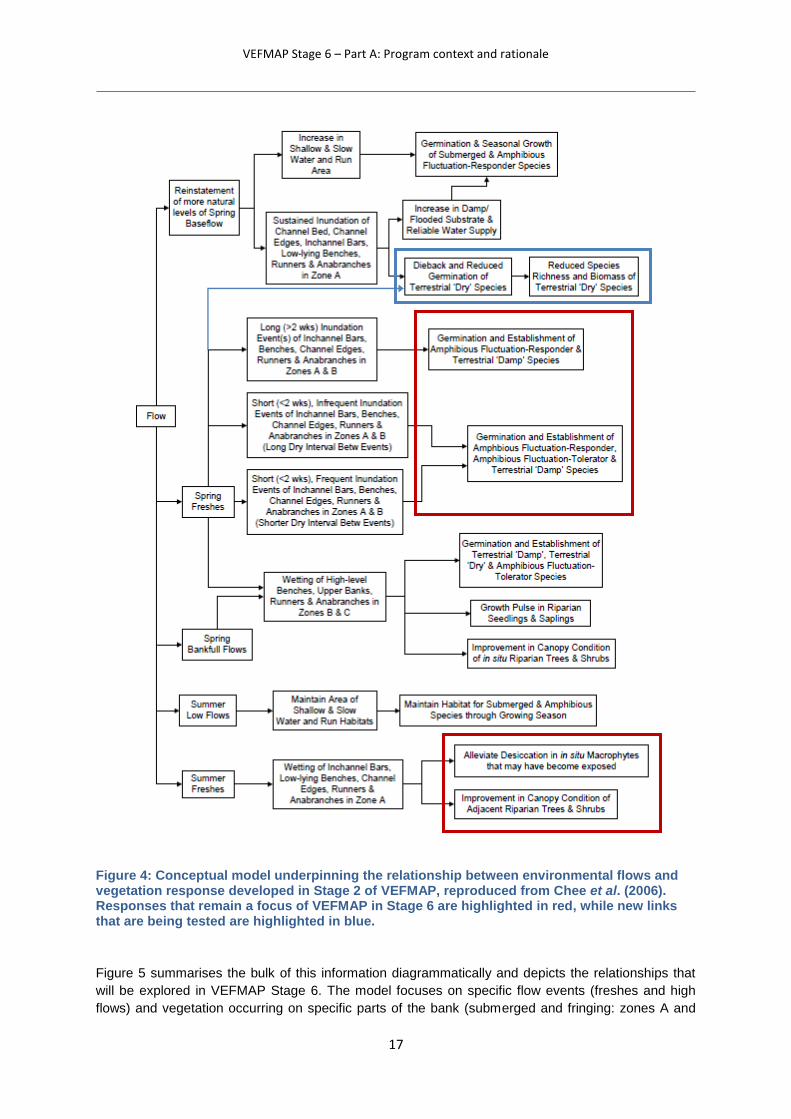
Conceptual model summary
A summarised conceptual model for vegetation responses to different flow types was produced in the
VEFMAP Stage 2 reports for each focus waterway (Chee et al. 2006, Figure 4). Although some
progress has been made towards understanding these responses already, many of the responses are
still uncertain and require further examination. The proposed monitoring approach for Stage 6 is
designed to focus specifically on the parts of the model highlighted in red in Figure 4. In addition to
the original conceptual links shown in Figure 4, we are exploring the role of spring freshes in
negatively influencing the presence and abundance of terrestrial dry species (particularly exotic
species), as shown by the blue arrow and box in Figure 4.
VEFMAP Stage 6 – Part A: Program context and rationale
17
Figure 4: Conceptual model underpinning the relationship between environmental flows and vegetation response developed in Stage 2 of VEFMAP, reproduced from Chee et al. (2006). Responses that remain a focus of VEFMAP in Stage 6 are highlighted in red, while new links that are being tested are highlighted in blue.
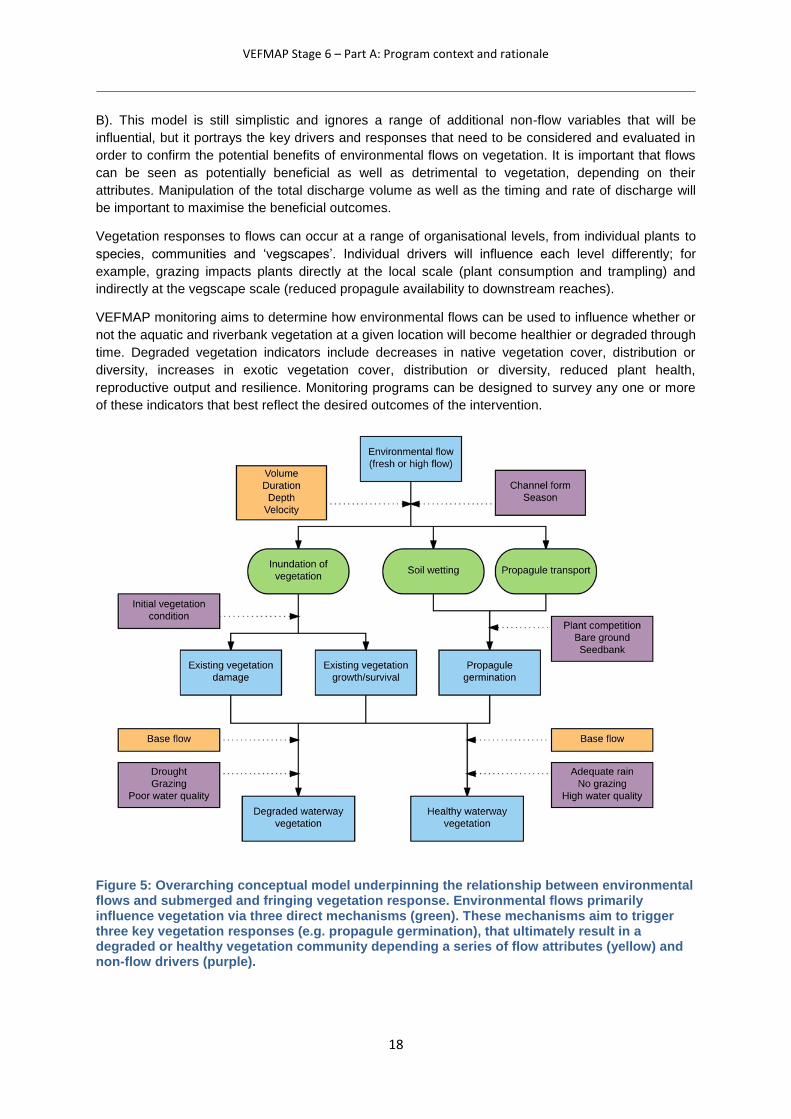
Figure 5 summarises the bulk of this information diagrammatically and depicts the relationships that
will be explored in VEFMAP Stage 6. The model focuses on specific flow events (freshes and high
flows) and vegetation occurring on specific parts of the bank (submerged and fringing: zones A and
VEFMAP Stage 6 – Part A: Program context and rationale
18
B). This model is still simplistic and ignores a range of additional non-flow variables that will be
influential, but it portrays the key drivers and responses that need to be considered and evaluated in
order to confirm the potential benefits of environmental flows on vegetation. It is important that flows
can be seen as potentially beneficial as well as detrimental to vegetation, depending on their
attributes. Manipulation of the total discharge volume as well as the timing and rate of discharge will
be important to maximise the beneficial outcomes.
Vegetation responses to flows can occur at a range of organisational levels, from individual plants to
species, communities and ‘vegscapes’. Individual drivers will influence each level differently; for
example, grazing impacts plants directly at the local scale (plant consumption and trampling) and
indirectly at the vegscape scale (reduced propagule availability to downstream reaches).
VEFMAP monitoring aims to determine how environmental flows can be used to influence whether or
not the aquatic and riverbank vegetation at a given location will become healthier or degraded through
time. Degraded vegetation indicators include decreases in native vegetation cover, distribution or
diversity, increases in exotic vegetation cover, distribution or diversity, reduced plant health,
reproductive output and resilience. Monitoring programs can be designed to survey any one or more
of these indicators that best reflect the desired outcomes of the intervention.
Figure 5: Overarching conceptual model underpinning the relationship between environmental flows and submerged and fringing vegetation response. Environmental flows primarily influence vegetation via three direct mechanisms (green). These mechanisms aim to trigger three key vegetation responses (e.g. propagule germination), that ultimately result in a degraded or healthy vegetation community depending a series of flow attributes (yellow) and non-flow drivers (purple).
VEFMAP Stage 6 – Part A: Program context and rationale
19
It is critical to the full understanding of the impact of environmental flows that conceptual models
consider the spatial and temporal scale over which the responses are likely to occur. The conceptual
model in Figure 5 relates to a range of spatial scales, from a transect location to an entire river.
However, given the variability in site conditions along a river, it is very difficult to use dispersed
sampling locations to determine how an entire reach or river is responding to flows. Due to this
limitation, the focus of Stage 6 is to examine change at a local scale and then use this in conjunction
with existing data to suggest broader scale responses.
There is likely to be a very strong temporal influence of vegetation responses to individual flow
events, and successive flow events. A summary of the expected temporal response of vegetation was
shown previously in Table 4. The immediate response during an individual flow event is generally
considered the most likely moment for plant damage to occur. Following the event, the flow influence
continues through persistent soil moisture and vegetation responses, such as growth. The influence
of an individual flow event will decrease through time, but it is unclear how long the influence will last
and in what situations it lasts longest or is most effective. Isolating the impacts of individual flow
events is extremely difficult, due to additional factors such as rainfall and season, as well as other flow
events before and after the target event. Intervention monitoring around individual events gives us the
clearest picture of vegetation response to flows, but it makes it difficult to determine delayed
responses. A detailed description of the methods used to address these challenges is provided in
VEFMAP Stage 6 Part B (DELWP 2017).
In addition to the model depicted in Figure 5, a series of high-level graphical conceptual models have
been prepared that summarise the relationship between environmental flows and vegetation
responses (Appendix 8). These conceptual models, along with the developing body of information
relating the response of Australian native vegetation to different components of flow, have provided a
strong scientific basis for objectives and KEQ development.
Objectives and KEQs
The broad objective for vegetation monitoring in VEFMAP Stage 6 is to:
Evaluate the effectiveness of implementing flow delivery plans (i.e. EWMPs, SWPs) in
achieving vegetation objectives over the three year sampling time frame.
Supplementary objectives include:
- Identify if vegetation responses to flow management vary within or among rivers or regions.
- Assess if vegetation responses to flow management are dependent on or enhanced by
complementary management interventions (e.g. livestock exclusion).
Vegetation objectives were based on SWPs, EWMPs, LTWPs, CMA specific objectives for priority
rivers, and the current scientific conceptual understanding of vegetation responses to flow. A
summary of vegetation objectives for each river system can be found in Appendix 9 and 10.
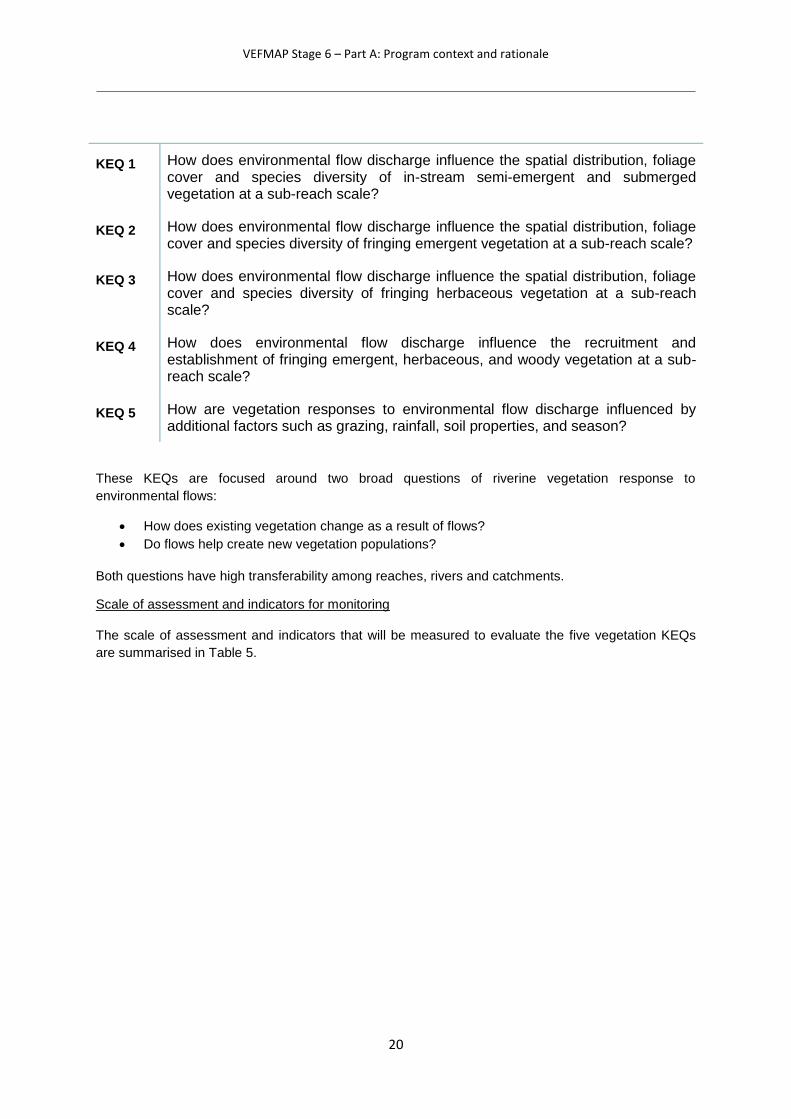
During the scoping of Stage 6, seven KEQs were initially developed for rivers where environmental
water is being delivered to achieve a particular vegetation objective. These questions were identified
and subsequently refined through close collaboration between DELWP’s Environmental Water team,
ARI, CMAs and UoM. After an external independent review, it was recommended that these KEQs be
further refined, and the final five KEQs are listed below.
VEFMAP Stage 6 – Part A: Program context and rationale
20
KEQ 1 How does environmental flow discharge influence the spatial distribution, foliage cover and species diversity of in-stream semi-emergent and submerged vegetation at a sub-reach scale?
KEQ 2 How does environmental flow discharge influence the spatial distribution, foliage cover and species diversity of fringing emergent vegetation at a sub-reach scale?
KEQ 3 How does environmental flow discharge influence the spatial distribution, foliage cover and species diversity of fringing herbaceous vegetation at a sub-reach scale?
KEQ 4 How does environmental flow discharge influence the recruitment and establishment of fringing emergent, herbaceous, and woody vegetation at a sub-reach scale?
KEQ 5 How are vegetation responses to environmental flow discharge influenced by additional factors such as grazing, rainfall, soil properties, and season?
These KEQs are focused around two broad questions of riverine vegetation response to
environmental flows:
How does existing vegetation change as a result of flows?
Do flows help create new vegetation populations?
Both questions have high transferability among reaches, rivers and catchments.
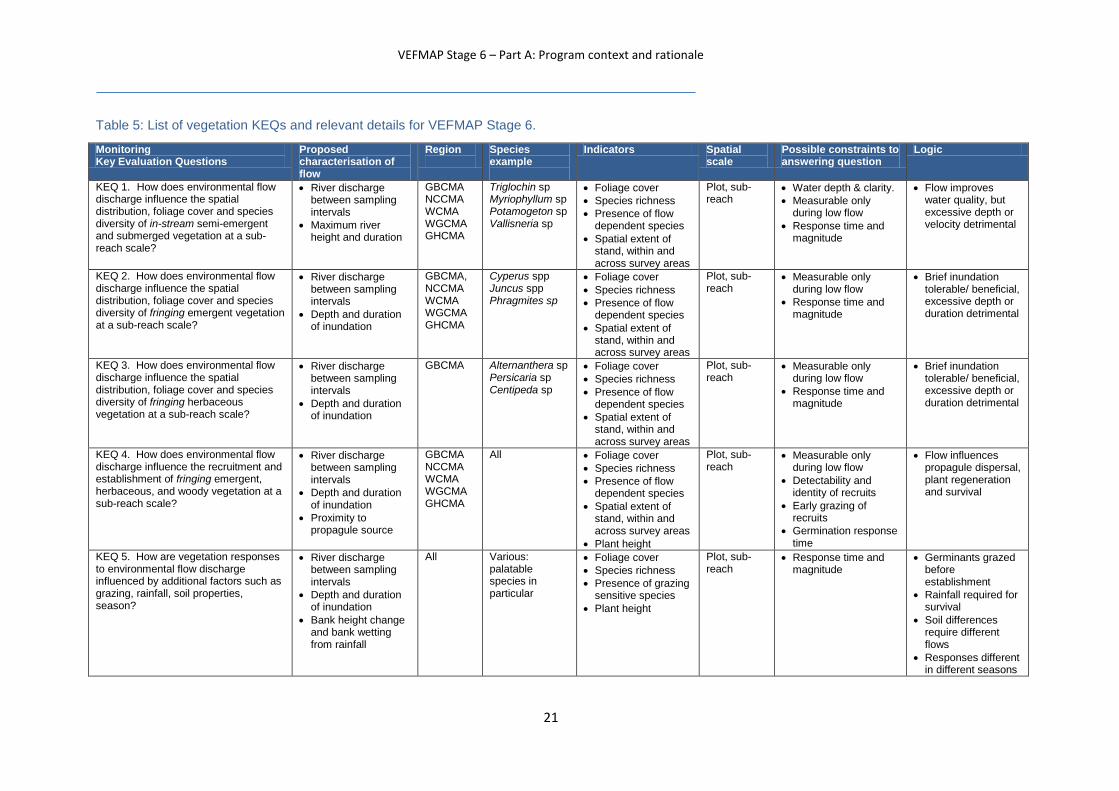
Scale of assessment and indicators for monitoring
The scale of assessment and indicators that will be measured to evaluate the five vegetation KEQs
are summarised in Table 5.
VEFMAP Stage 6 – Part A: Program context and rationale
21
Table 5: List of vegetation KEQs and relevant details for VEFMAP Stage 6.
Monitoring Key Evaluation Questions
Proposed characterisation of flow
Region
Species example
Indicators Spatial scale
Possible constraints to answering question
Logic
KEQ 1. How does environmental flow discharge influence the spatial distribution, foliage cover and species diversity of in-stream semi-emergent and submerged vegetation at a sub-reach scale?
River discharge between sampling intervals
Maximum river height and duration
GBCMA NCCMA WCMA WGCMA GHCMA
Triglochin sp Myriophyllum sp Potamogeton sp Vallisneria sp
Foliage cover
Species richness
Presence of flow dependent species
Spatial extent of stand, within and across survey areas
Plot, sub-reach
Water depth & clarity.
Measurable only during low flow
Response time and magnitude
Flow improves water quality, but excessive depth or velocity detrimental
KEQ 2. How does environmental flow discharge influence the spatial distribution, foliage cover and species diversity of fringing emergent vegetation at a sub-reach scale?
River discharge between sampling intervals
Depth and duration of inundation
GBCMA, NCCMA WCMA WGCMA GHCMA
Cyperus spp Juncus spp Phragmites sp
Foliage cover
Species richness
Presence of flow dependent species
Spatial extent of stand, within and across survey areas
Plot, sub-reach
Measurable only during low flow
Response time and magnitude
Brief inundation tolerable/ beneficial, excessive depth or duration detrimental
KEQ 3. How does environmental flow discharge influence the spatial distribution, foliage cover and species diversity of fringing herbaceous vegetation at a sub-reach scale?
River discharge between sampling intervals
Depth and duration of inundation
GBCMA
Alternanthera sp Persicaria sp Centipeda sp
Foliage cover
Species richness
Presence of flow dependent species
Spatial extent of stand, within and across survey areas
Plot, sub-reach
Measurable only during low flow
Response time and magnitude
Brief inundation tolerable/ beneficial, excessive depth or duration detrimental
KEQ 4. How does environmental flow discharge influence the recruitment and establishment of fringing emergent, herbaceous, and woody vegetation at a sub-reach scale?
River discharge between sampling intervals
Depth and duration of inundation
Proximity to propagule source
GBCMA NCCMA WCMA WGCMA GHCMA
All Foliage cover
Species richness
Presence of flow dependent species
Spatial extent of stand, within and across survey areas
Plant height
Plot, sub-reach
Measurable only during low flow
Detectability and identity of recruits
Early grazing of recruits
Germination response time
Flow influences propagule dispersal, plant regeneration and survival
KEQ 5. How are vegetation responses to environmental flow discharge influenced by additional factors such as grazing, rainfall, soil properties, season?
River discharge between sampling intervals
Depth and duration of inundation
Bank height change and bank wetting from rainfall
All Various: palatable species in particular
Foliage cover
Species richness
Presence of grazing sensitive species
Plant height
Plot, sub-reach
Response time and magnitude
Germinants grazed before establishment
Rainfall required for survival
Soil differences require different flows
Responses different in different seasons
VEFMAP Stage 6 – Part A: Program context and rationale
22
Variability and modifiers
Complementary data collection and investigations to aid KEQ analysis will include the following:
- site specific hydrology and hydraulic details (hydrographs, channel form, flow depth,
duration and velocity) will be collected by UoM;
- effects of grazing on the regeneration or new growth of particular species/lifeforms will be
examined using grazing exclosures;
- soil moisture probes will be installed to examine the relationship between soil moisture
levels, environmental conditions, bank attributes and different flow regimes; and
- a mix of experiments, analysis of existing data and literature reviews will be used to
examine effects of water quality on vegetation responses to flow.
See Appendix 11 for a full list of complementary vegetation research questions.
Full details of the monitoring methods and sampling locations for VEFMAP Stage 6 are provided in
VEFMAP Stage 6 Part B (DELWP 2017). Sampling sites and data collected as part of previous
VEFMAP stages will also be adopted or used, where appropriate, to complement the data collected
as part of Stage 6.
Constraints to Stage 6 vegetation monitoring
During development of the priority vegetation KEQs for VEFMAP Stage 6 it was recognised that
other factors may be present that limit responses of vegetation to environmental water, such as
poor water quality or the presence of carp or livestock (e.g. deep and/or turbid water make it difficult
to assess submerged vegetation).
These factors have been considered in detail when developing the study design and monitoring
methods presented in VEFMAP Stage 6 Part B (DELWP 2017). While some of these factors are
directly measurable (e.g. water quality) or can be accounted for in the study design (e.g. grazing
exclosures to evaluate grazing influences), others may not be possible to address and will therefore
need to be considered during evaluation of the program. One of the challenging factors is the
delayed response of vegetation to flows; that is, although a flow event may enable increased plant
growth soon after the event, the influence on reproductive output and therefore germination
response may be realised the following year. In some cases, we will be able to use existing data to
try and evaluate these delayed impacts; in other cases, the same site will be surveyed in
consecutive years.
VEFMAP Stage 6 – Part A: Program context and rationale
23
5 Sampling sites and program design
5.1 Sampling sites
Potential rivers for monitoring in VEFMAP Stage 6 include all regulated rivers that receive
environmental water throughout Victoria, plus a subset of unregulated rivers that experience high
flow variability and have comparable fish species to the state’s regulated rivers (e.g. Cardinia
Creek, the Tarwin River).
Specific sites selected to examine each native fish and vegetation KEQ are listed in the relevant
sections of VEFMAP Stage 6 Part B (DELWP 2017).
5.2 Monitoring design
Three commonly used sampling designs have been identified as suitable for evaluating the
outcomes from environmental water management (listed here in decreasing evidentiary strength):
the Before-After-Control Intervention (BACI) design, the Single-Site, Multiple Interventions (SSMI)
design and the Before-After-Intervention (BAI) design (see Downes et al. 2002 for full details).
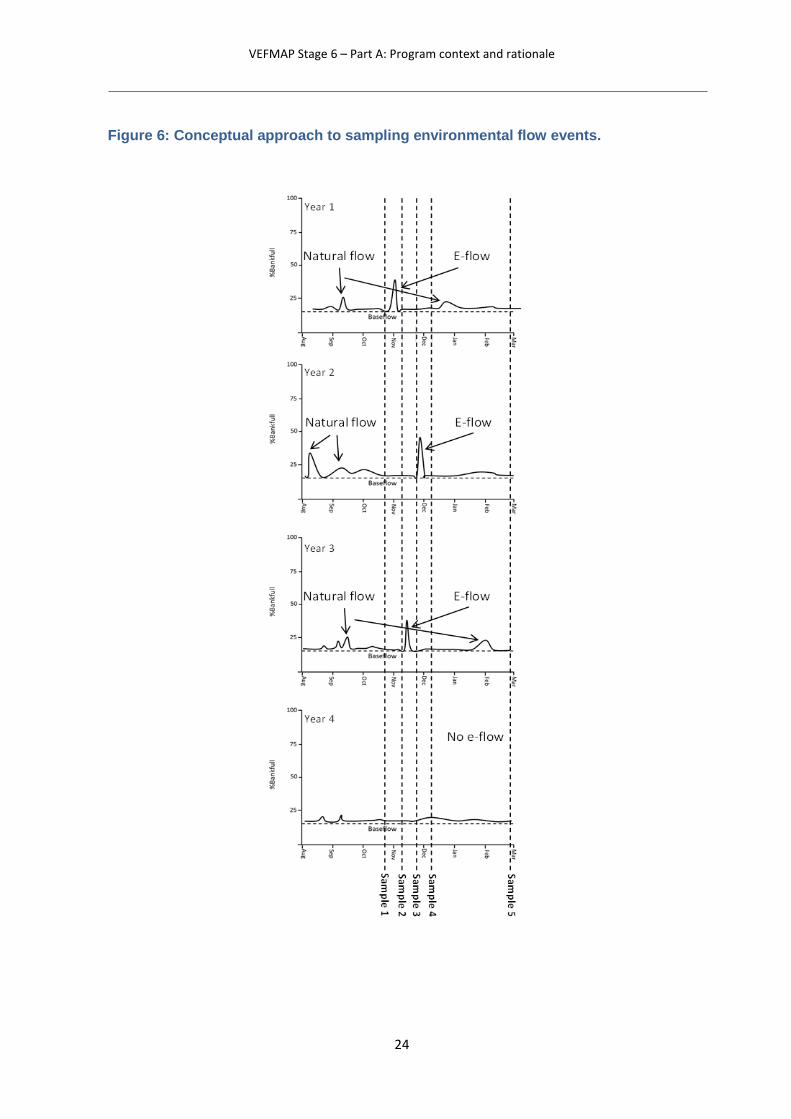
For VEFMAP Stage 6, intervention monitoring for native fish and vegetation will involve both before-
after comparisons for environmental flow events (the BAI design) and full BACI designs, using
control sites (same as the intervention sites but without environmental flows), where available.
Where possible, the sampling regime adopted will aim to isolate particular environmental flow types
and capture multiple before and after sampling events (SSMI; Figure 6).
Refer to VEFMAP Stage 6 Part B (DELWP 2017) for details of the complete monitoring program
designs used to address each KEQ.
VEFMAP Stage 6 – Part A: Program context and rationale
24
Figure 6: Conceptual approach to sampling environmental flow events.
VEFMAP Stage 6 – Part A: Program context and rationale
25
6 Program management
6.1 Governance
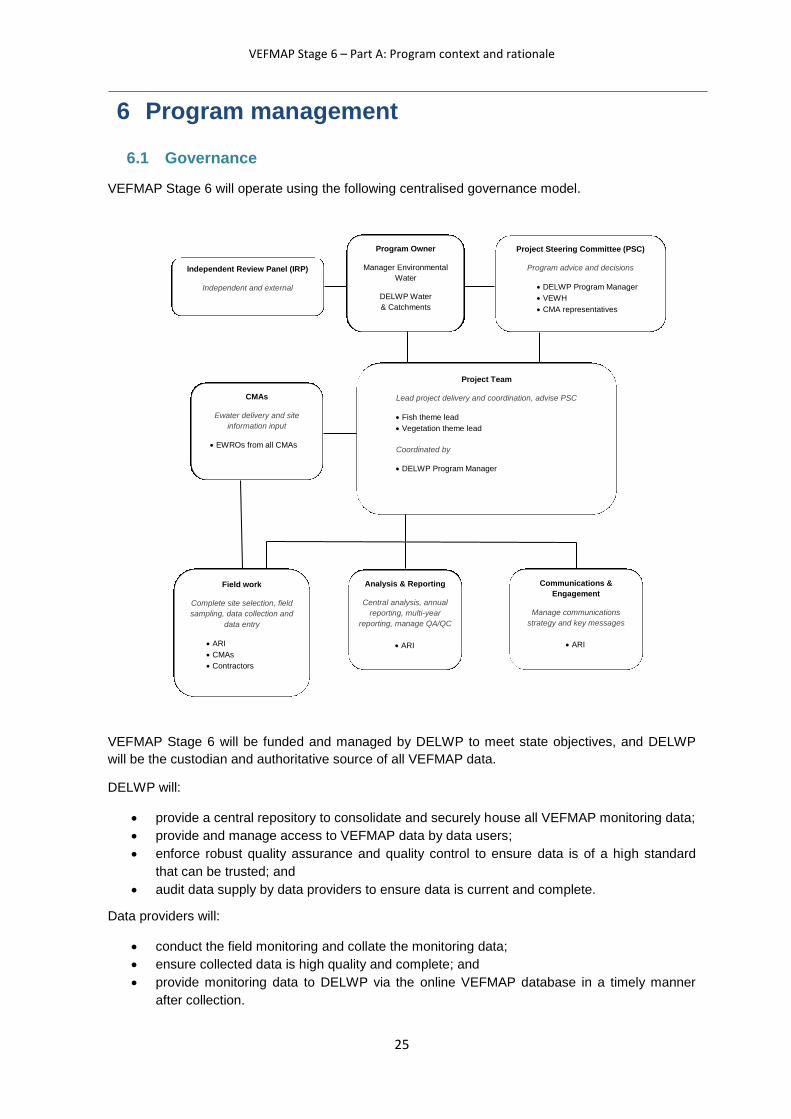
VEFMAP Stage 6 will operate using the following centralised governance model.
VEFMAP Stage 6 will be funded and managed by DELWP to meet state objectives, and DELWP
will be the custodian and authoritative source of all VEFMAP data.
DELWP will:
provide a central repository to consolidate and securely house all VEFMAP monitoring data;
provide and manage access to VEFMAP data by data users;
enforce robust quality assurance and quality control to ensure data is of a high standard
that can be trusted; and
audit data supply by data providers to ensure data is current and complete.
Data providers will:
conduct the field monitoring and collate the monitoring data;
ensure collected data is high quality and complete; and
provide monitoring data to DELWP via the online VEFMAP database in a timely manner
after collection.
Independent Review Panel (IRP)
Independent and external
Program Owner
Manager Environmental
Water
DELWP Water
& Catchments
Project Steering Committee (PSC)
Program advice and decisions
DELWP Program Manager
VEWH
CMA representatives
Project Team
Lead project delivery and coordination, advise PSC
Fish theme lead
Vegetation theme lead
Coordinated by
DELWP Program Manager
Field work
Complete site selection, field
sampling, data collection and
data entry
ARI
CMAs
Contractors
Analysis & Reporting
Central analysis, annual
reporting, multi-year
reporting, manage QA/QC
ARI
Communications &
Engagement
Manage communications
strategy and key messages
ARI
CMAs
Ewater delivery and site
information input
EWROs from all CMAs
VEFMAP Stage 6 – Part A: Program context and rationale
26
A strong partnership approach between DELWP, CMAs and research providers will ensure:
Timeliness: prompt delivery of information and advice.
Robustness: scientifically sound ecological data and assessments.
Transferability: processes that ensure a framework by which to share data and inform works
and measures.
Accountability and transparency: well designed and scientifically defensible program that
enables clear reporting.
Pragmatism: clarifies and justifies a selection of the most suitable and effective waterway
management strategies, outlining existing constraints.
Improved understanding of ecological links to flow. This information will be available for
waterway managers to inform future development of environmental flow recommendations
aimed into the future.
6.2 Health and Safety
Each organisation undertaking VEFMAP must complete a health, safety and environmental plan
(HSEP). This can be in accordance with the organisation’s own health and safety procedures and
practices, but at a minimum must include:
Job Safety and Environment Assessment (JSEA) – details the potential hazards associated with work activities and the controls in place to minimise risks.
First Aid Training - the requirements for First Aid training and qualification of staff.
Emergency Response – the procedures to be followed in the event of an emergency.
Incident Reporting – incident reporting procedures.
Enquires and Complaints – procedures relating to public complaints and media enquiries.
VEFMAP Stage 6 – Part A: Program context and rationale
27
7 Program review and evaluation
Regular program evaluation is critical to ensure the monitoring design proposed for VEFMAP Stage
6 meets its objectives and that program objectives and KEQs remain relevant over time.
The first program evaluation will occur in 2017-2018, after the initial year of field monitoring, to
maximise the opportunity for adaptive management, improve program implementation, evaluate the
effectiveness of the proposed governance model and examine opportunities to update/improve
program methods. This “internal” evaluation will examine the first year of data to:
Check that field protocols are delivering useful, high quality data.
Assess levels of variance in response indicators (using power analysis) and confirm the
appropriateness of proposed methods and design.
Examine and confirm the appropriateness of the scope of rivers and sites included in the
first year of monitoring.
Review by the VEFMAP Stage 6 Independent Review Panel will provide the opportunity to identify
improvements to program governance, objectives, design and monitoring methods.
VEFMAP Stage 6 – Part A: Program context and rationale
28
8 Communication and Reporting
Maintaining ongoing engagement with CMAs is an essential element of the adaptive management
framework in which VEFMAP sits. A Communication and Engagement Plan has been developed for
Stage 6, to help guide reporting and communication activities associated with VEFMAP
implementation. Ongoing engagement with CMAs will be fostered by consistent annual reporting of
VEFMAP results via established networks (e.g. Environmental Water Reserve Officer meetings and
an annual VEFMAP stakeholder meeting). Collected data and information will be made available to
the CMAs so that they have access to best-available data as inputs to their own activities (e.g.
planning, program/project implementation, monitoring). Information collected annually will be
presented in easily understandable language.
Reporting conducted throughout the project will include:
annual reports for the first three years of the program;
a final report covering the entire Stage 6 program;
individual summary reports on all additional research activities;
research publications; and
summaries/flyers to CMAs/stakeholders for distribution to stakeholders and the public.
There will also be a range of discussions, meetings and presentations to a range of relevant
stakeholders throughout the program. This will include presentations and ongoing discussions with
the environmental water officers from each of the CMAs.
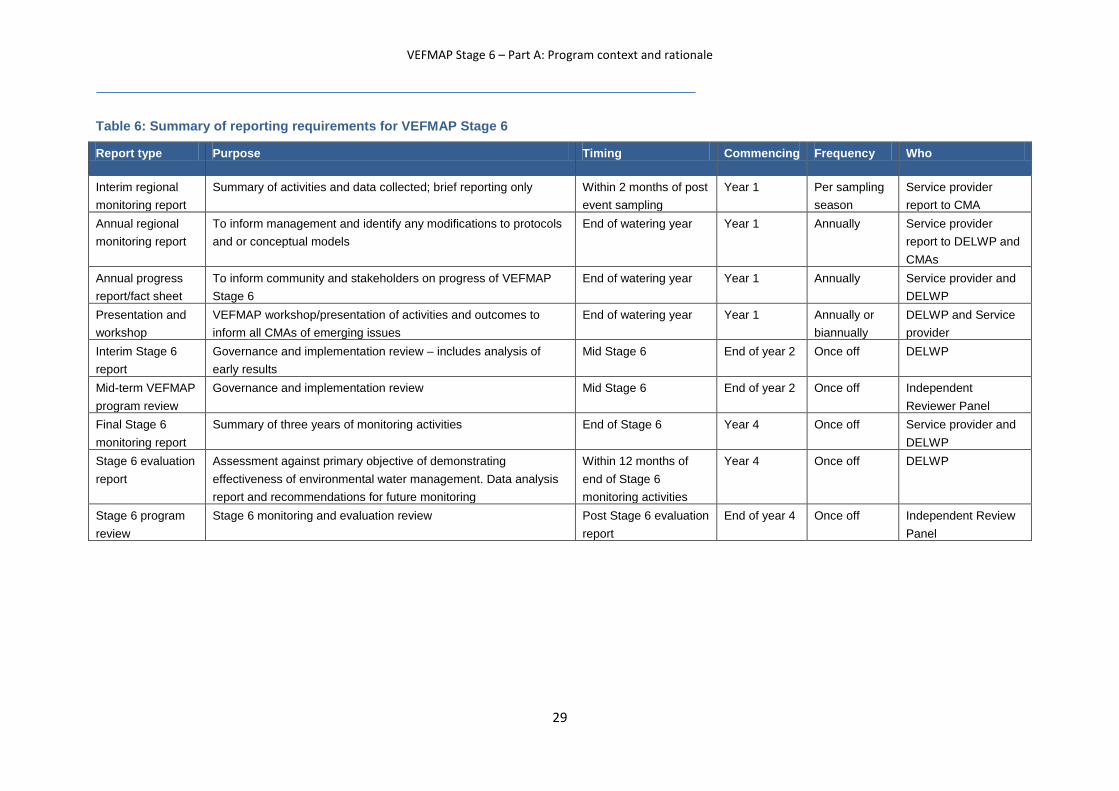
A summary of the reporting requirements for Stage 6 are presented in Table 6, below.
VEFMAP Stage 6 – Part A: Program context and rationale
29
Table 6: Summary of reporting requirements for VEFMAP Stage 6
Report type Purpose Timing Commencing Frequency Who
Interim regional
monitoring report
Summary of activities and data collected; brief reporting only Within 2 months of post
event sampling
Year 1 Per sampling
season
Service provider
report to CMA
Annual regional
monitoring report
To inform management and identify any modifications to protocols
and or conceptual models
End of watering year Year 1 Annually Service provider
report to DELWP and
CMAs
Annual progress
report/fact sheet
To inform community and stakeholders on progress of VEFMAP
Stage 6
End of watering year Year 1 Annually Service provider and
DELWP
Presentation and
workshop
VEFMAP workshop/presentation of activities and outcomes to
inform all CMAs of emerging issues
End of watering year Year 1 Annually or
biannually
DELWP and Service
provider
Interim Stage 6
report
Governance and implementation review – includes analysis of
early results
Mid Stage 6 End of year 2 Once off DELWP
Mid-term VEFMAP
program review
Governance and implementation review Mid Stage 6 End of year 2 Once off Independent
Reviewer Panel
Final Stage 6
monitoring report
Summary of three years of monitoring activities End of Stage 6 Year 4 Once off Service provider and
DELWP
Stage 6 evaluation
report
Assessment against primary objective of demonstrating
effectiveness of environmental water management. Data analysis
report and recommendations for future monitoring
Within 12 months of
end of Stage 6
monitoring activities
Year 4 Once off DELWP
Stage 6 program
review
Stage 6 monitoring and evaluation review Post Stage 6 evaluation
report
End of year 4 Once off Independent Review
Panel
VEFMAP Stage 6 – Part A: Program context and rationale
30
9 Data and information management
9.1 Quality assurance and quality control
The success of VEFMAP Stage 6 relies on collection of data that are high quality, complete and fit-for-
purpose to meet reporting and evaluation needs.
Quality assurance is provided by procedures that produce monitoring data that are fit-for-purpose. This
includes training for contractors, data standards and accepted methods for data capture, chain of custody
and traceability of data and auditing to ensure data providers are adhering to designated protocols. Quality
control procedures include checks for calibration of equipment and review of the monitoring data to check for
consistency, accuracy and completeness, and to identify errors or highlight data anomalies (e.g. outliers) that
require further investigation or correction.
Both QA and QC have the intent of ensuring VEFMAP Stage 6 data are of the highest quality and can be
used to evaluate KEQs with high levels of confidence.
Quality assurance will be improved by an adaptive management process, where the methods are reviewed
annually.
9.2 Data handling and storage
All VEFMAP data (old and new) will be stored in a Microsoft SQL Server relational database. The database
has in-built quality assurance measures to ensure consistency in the data entered. A user-friendly database
interface will allow CMA staff to view and extract data summaries relevant to their area, but will not allow
external users to input or change data.
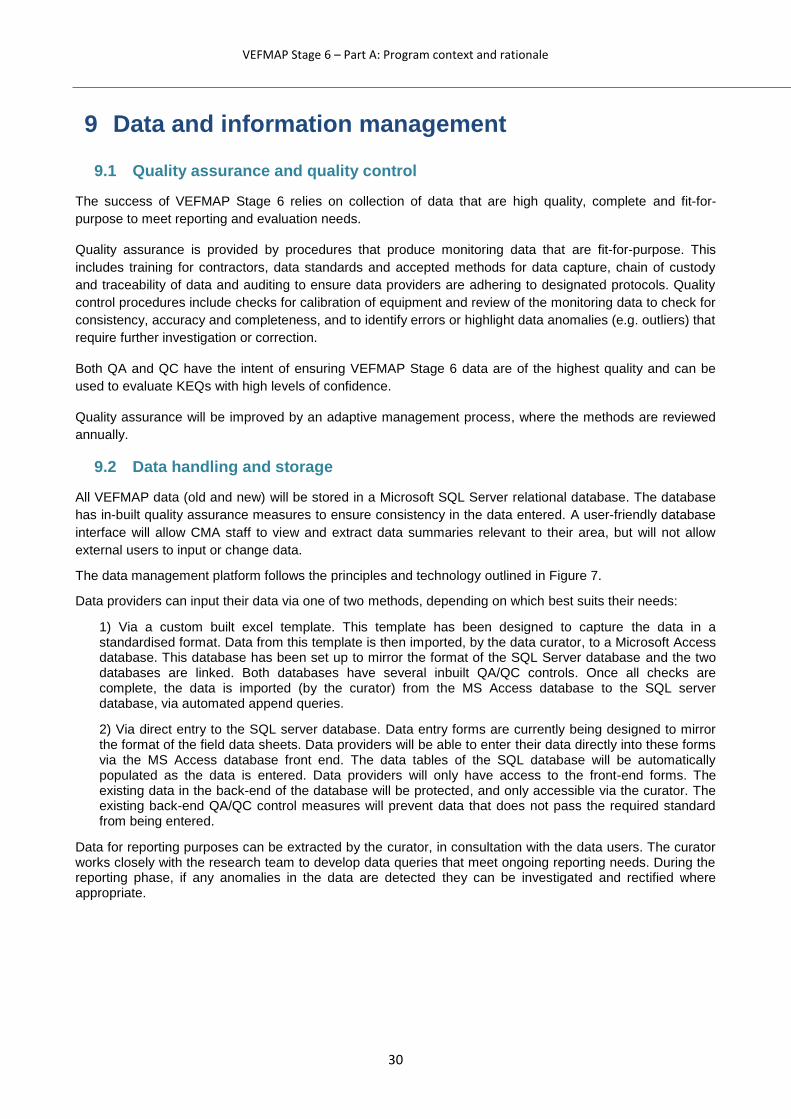
The data management platform follows the principles and technology outlined in Figure 7.
Data providers can input their data via one of two methods, depending on which best suits their needs:
1) Via a custom built excel template. This template has been designed to capture the data in a standardised format. Data from this template is then imported, by the data curator, to a Microsoft Access database. This database has been set up to mirror the format of the SQL Server database and the two databases are linked. Both databases have several inbuilt QA/QC controls. Once all checks are complete, the data is imported (by the curator) from the MS Access database to the SQL server database, via automated append queries.
2) Via direct entry to the SQL server database. Data entry forms are currently being designed to mirror the format of the field data sheets. Data providers will be able to enter their data directly into these forms via the MS Access database front end. The data tables of the SQL database will be automatically populated as the data is entered. Data providers will only have access to the front-end forms. The existing data in the back-end of the database will be protected, and only accessible via the curator. The existing back-end QA/QC control measures will prevent data that does not pass the required standard from being entered.
Data for reporting purposes can be extracted by the curator, in consultation with the data users. The curator works closely with the research team to develop data queries that meet ongoing reporting needs. During the reporting phase, if any anomalies in the data are detected they can be investigated and rectified where appropriate.
VEFMAP Stage 6 – Part A: Program context and rationale
31
Figure 7: Components of the VEFMAP data management solution showing flow of data.
.
9.3 Audit procedures
VEFMAP Stage 6 will be audited by DELWP’s Environmental Water team. This will include audits of both
field and desktop assessments to ensure consistency with the written methods and that appropriate
protocols have been implemented. The audit will assess compliance with the written methods and identify:
exceptions to the VEFMAP Stage 6 methods and procedures,
improvements required, and
recommendations for modifications to procedures and methods.
Those audited will be provided with a set period to respond to the audit and address audit findings.
VEFMAP Stage 6 – Part A: Program context and rationale
32
10 Adaptive management
10.1 Benefits of an adaptive management framework
Adaptive management is a commonly suggested management approach, but capturing new information and
applying it effectively and transparently to future decisions is a significant endeavour. There are many
benefits to applying VEFMAP within an adaptive management framework - these are summarised below.
Strictly speaking, VEFMAP has limited ability to manipulate environmental flow management approaches in
order to learn how alternative methods compare, so that the better outcomes can be pursued – as per
conventional adaptive management. However, there are many cases where outcomes from monitoring have
and will be used to directly alter flow delivery to contribute to improvements in management outcomes or
learnings. VEFMAP will also be used to inform adaptive monitoring, whereby alternative methods or
approaches are used to monitor and the most effective methods are selected to continue.
Improving data collection and monitoring design
Opportunities may exist to improve VEFMAP, either through implementation of new procedures (e.g.
improving standardisation of data collection), or though changes to the monitoring design (e.g. site selection
criteria, indicators) to improve resolution of emerging threats or novel outcomes. Such opportunities could be
considered at the 1-year progress review and 4-year evaluation of Stage 6. In some cases, the learning
process is truly adaptive and alternative approaches are implemented and compared before the most
appropriate is selected for continued use (and potential further comparisons). In other cases, the methods
will be evaluated on their own and updates and refinements will be made if considered necessary.
This will allow consideration of such features as how well the methods are working and whether the correct
data are being generated to answer the KEQs. The monitoring methods and data management
arrangements can then be adjusted, if necessary, to ensure the sampling undertaken in subsequent years is
based on the best-available science and according to fit-for-purpose methods.
Improving Conceptual Models
The VEFMAP Stage 6 conceptual models summarise relationships between environmental water and
management outcomes. Updating the conceptual models is a fundamental process towards improving future
management decisions. Specific improvements may include:
improving estimates of magnitudes of effects;
improving estimates of rates of change;
refining predicted outcomes from the works implemented;
refining impacts of modifiers;
addition of new/emerging issues or threats;
changing the structure of models to improve interpretation;
development of new models to incorporate novel management approaches or to provide alternative models for different contexts; and
improving links with other DELWP models and management frameworks (e.g. condition reporting for the Index of Stream Condition).
Improving environmental water delivery
Predicting outcomes, quantifying magnitudes and rates of change and identifying unexpected consequences
will improve the effectiveness of the intervention design and implementation. Improved understanding of the
influence of modifiers will be used to update conceptual models, with flow on to strategic planning,
prioritisation, implementation and resource allocation. Regular communication between water managers,
ARI, DELWP Environmental Water and other relevant stakeholders will allow for direct input of this
information into the decision-making process for environmental flow deliveries.
VEFMAP Stage 6 – Part A: Program context and rationale
33
Improving DELWP environmental water target setting
Quantifying magnitudes and rates of change in ecosystem and species response to environmental water
management will facilitate the setting of realistic objectives and targets for regional waterway strategies and
other programs such as the Murray-Darling Basin long term watering strategies.
10.2 Reporting and ongoing engagement with CMAs
Maintaining ongoing engagement with CMAs is an essential element of the adaptive management
framework and will be fostered by annual reporting of VEFMAP results via established environmental water
networks. Collected data and information will be made available to the CMAs as soon as possible, so they
have access to best-available data as inputs to their own activities (e.g. planning, program/project
implementation, monitoring). Information collected annually will be presented in easily understandable
language.
VEFMAP Stage 6 – Part A: Program context and rationale
34
11 References
Agostinho A., Pelicice F. and Gomes L. (2008). Dams and the fish fauna of the Neotropical region: impacts
and management related to diversity and fisheries. Brazilian Journal of Biology, 68, pp. 1119–1132.
Amtstaetter, F., O’Connor, J. and Pickworth, A. (2016). Environmental flow releases trigger spawning
migrations by Australian grayling Prototroctes maraena, a threatened, diadromous fish. Aquatic
Conservation: Marine and Freshwater Ecosystems 26, 35–43.
Arthur Rylah Institute (2017). VEFMAP Stage 5. Arthur Rylah Institute and University of Melbourne report
to the Department of Environment, Land, Water and Planning, Melbourne. In prep.
Baumgartner L. J., Reynoldson N. and Gilligan D. M. (2006). Mortality of larval Murray Cod (Maccullochella
peelii peelii) and golden perch (Macquaria ambigua) associated with passage through two types of low-
head weirs. Marine and Freshwater Research, 57, pp. 187–191.
Brock, M. A. and Casanova, M. T. (1997) Plant life at the edge of wetlands: ecological responses to wetting
and drying patterns. In Frontiers in Ecology. Klomp, N. and Lunt, I., (Ed.). Elsevier Science Ltd., Oxford.
pp. 181-192.
Casanova, M. T. and Brock, M. A. (2000) How do depth, duration and frequency of flooding influence the
establishment of wetland plant communities? Plant Ecology, 147, 237-250.
Chee, Y., Webb, A., Stewardson, M. and Cottingham, P. (2006) Victorian Environmental Flows Monitoring
and Assessment Program: Monitoring and assessing environmental flow releases in the Glenelg River.
Report prepared for the Glenelg-Hopkins Catchment Management Authority and the Department of
Sustainability and Environment. e-Water Cooperative Research Centre, Melbourne.
Cottingham P., Spruzen F. and Wickson S. (eds) (2014). Victorian environmental flows monitoring and
assessment program: Stage 5 future directions workshop report. Report prepared for the Department of
Environment, Land, Water and Planning by Peter Cottingham & Associates, December 2014.
DELWP (2017). VEFMAP Stage 6 Part B: Program design and monitoring methods. Department of
Environment, Land, Water and Planning.
DEPI (2013). Improving Our Waterways: Victorian Waterway Management Strategy, State of Victoria,
Department of Environment and Primary Industries.
http://www.depi.vic.gov.au/__data/assets/pdf_file/0015/200373/VWMS_Part1.pdf
Downes, B.J., Barmuta, L.A., Fairweather, P.G., Faith, D.P., Keough, M.J., Lake, P.S., Mapstone, B.D.,
and Quinn, G. 2002. Monitoring ecological impacts: concepts and practice in flowing waters. Cambridge
University Press, Cambridge, UK ; New York, NY, USA.
Gilligan, D. and Schiller, C. (2003). Downstream transport of larval and juvenile fish in the Murray River.
Cronulla, NSW Fisheries Final Report Series No 50.
Koehn J.D. and Harrington D.J. (2005). Collection and distribution of the early life stages of the Murray cod
(Maccullochella peelii peelii) in a regulated river. Australian Journal of Zoology, 53, pp. 137–144.
Koehn J., I. Stuart, H. Bamford, C. Bice, K. Hodges, P. Jackson, J. Lieschke, S. Lovett, M. Mallen-Cooper,
T. Raadik, J. Thiem, C. Todd, Z. Tonkin, B. Zampatti. (2014). Quantifiable Environmental Outcomes for
Fish. Arthur Rylah Institute for Environmental Research Unpublished Client Report for the Murray Darling
Basin Authority, Department of Environment and Primary Industries, Heidelberg, Victoria.
VEFMAP Stage 6 – Part A: Program context and rationale
35
Koehn, J.D., Todd, C., Raymond, S., Balcombe, S., Zampatti, B., Bamford, H., Ingram, B.A., Bice, C.,
Burndred, K., Butler, G., Baumgartner, L., Clunie, P., Ellis, I., Forbes, J., Hutchison, M., Koster, W.,
Lintermans, M., Mallen-Cooper, M., McLellan, M., Pearce, L., Ryall, J., Sharpe, C., Stuart, I., Thiem, J.,
Tonkin, Z., Townsend, A., Ye, Q. (in prep) A compendium of ecological knowledge for key fish species to
assist environmental flow delivery and population restoration in the Murray–Darling Basin. For Submission
to Marine and Freshwater Research.
Maheshwari, B.L., Walker, K.F., & McMahon, T.A. (1995), Effects of flow regulation on the flow regime of the River Murray, Australia. Regulated Rivers: Research & Management, 10, pp. 15-38.
MDFRC (2013) Long-term Intervention Monitoring - Generic Cause and Effect Diagrams Final Report prepared for the Commonwealth Environmental Water Office by The Murray-Darling Freshwater Research Centre, MDFRC Publication 01/2013, May, 163pp.
Miller K.A., Webb, J.A.., de Little, S.C., Stewardson, M.J. and Rutherfurd, I.D. (2014). How effective are
environmental flows? Analyses of flow-ecology relationships in the Victorian Environmental Flow
Monitoring and Assessment Program (VEFMAP) from 2011-2014. Report prepared for the Department of
Environment and Primary Industries.
Sharpe, A. (2014). VEFMAP next steps. How CMAs use VEFMAP data. Jacobs report to DEPI.
VEWH (2016). Seasonal Watering Plan 2016-17. http://www.vewh.vic.gov.au/watering-program/seasonal-
watering-plan/seasonal-watering-plan-2016-17.

VEFMAP Stage 6 – Part A: Program context and rationale
36
Appendix 1: Conceptual model of habitat processes and flows developed by
Chee et al. (2006) (WQ = water quality)
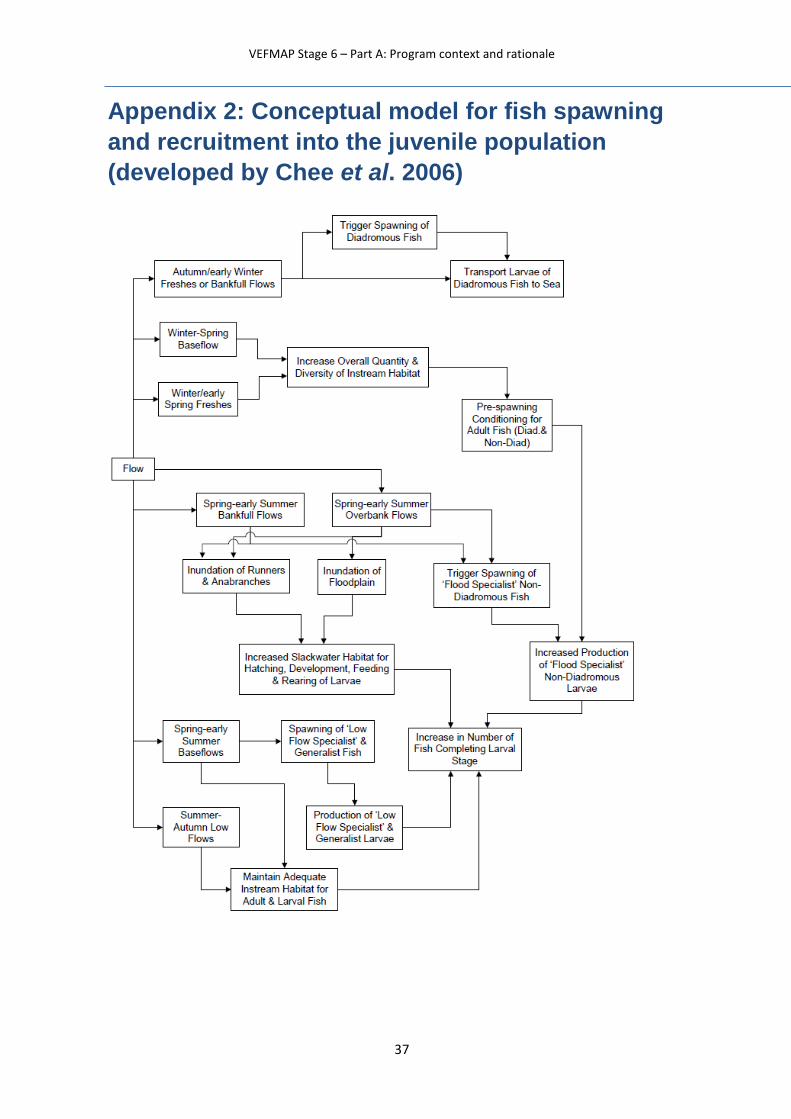
VEFMAP Stage 6 – Part A: Program context and rationale
37
Appendix 2: Conceptual model for fish spawning
and recruitment into the juvenile population
(developed by Chee et al. 2006)

VEFMAP Stage 6 – Part A: Program context and rationale
38
Appendix 3: Example of native fish conceptual
models
Silver perch (From Koehn et al. in prep, Draft April
2017)
Southern Murray-Darling Basin
General description
A large bodied, long-lived, omnivorous, schooling, river channel specialist that has drifting eggs and
larvae stages (Rowland 2009). Silver perch continues to be a popular angling species and is also
regarded as a good table fish. As such the species is widely cultured in hatcheries (Rowland 1994,
2004, 2009), both for the restaurant trade and conservation/recreational purposes. The latter has
resulted fish stocked throughout the MDB as well as outside it’s natural range. Categorised as
having a mode 2 life history (Humphries et al. 1999) and is classified as a flow dependant specialist
(Baumgartner et al. 2014).
Distribution and status
Once widespread over most lowland reaches of the MDB, it has suffered serious declines in
abundance and range (Lintermans 2007: Trueman 2012). The greatest concentration of fish in the
MDB is centred in the mid-Murray River (Yarrawonga to Euston), with lower numbers of fish
occupying the Edward-Wakool, Lower Darling, Murrumbidgee, Warrago/Condamine, Victorian
tributaries (Loddon, Campaspe, Goulburn, Ovens) with low numbers present in SA. Catches in the
mid-Murray have declined considerably (by 94% at Euston) over a 50-year period (Mallen-Cooper
and Brand 2007) and the species is now rare in the NMDB. Listed as critically endangered
nationally, endangered in the ACT, vulnerable in Victoria (DSE 2013), New South Wales and SA
(DEE 2017). Concern has been expressed over the status of this species for several decades with a
recovery plan and supporting document written in 2001 (Clunie and Koehn 2001).
Taxonomy and similar species
There are low levels of genetic variation in wild populations of silver perch across the MDB (Keenan
et al. 1996). Of the species considered in this paper, Silver perch is closest ecologically to golden
perch.
Age, length, weight, growth, maturity
Maximum TL is 500 mm and weight around 8 kg (Trueman 2012); although more commonly up to
450 mm and 1.5 kg (Lintermans 2007). Long-lived; to 17 years in rivers (27 years in dam) and show
variable growth, (Mallen-Cooper and Stuart 2003). In rivers, however, fish over age 8 are now
relatively uncommon.
Habitat use
An obligate river channel specialist that occupies a range of habitats from large, faster flowing river
reaches to the slow flowing, turbid waters of lower reaches and impoundments (Clunie and Koehn
2001; Rowland 1995). They appear to prefer open waters devoid of snags (Cadwallader and
Backhouse 1983), although strong ordinations with river habitat occur (Raymond et al. 2014). Often
found in mid-channel, rather than along the banks (EO). Were once more commonly found in lakes,
but this is now rarely so; exceptions include Menindee (NSW) and Lake Boga (Nthn Vic).
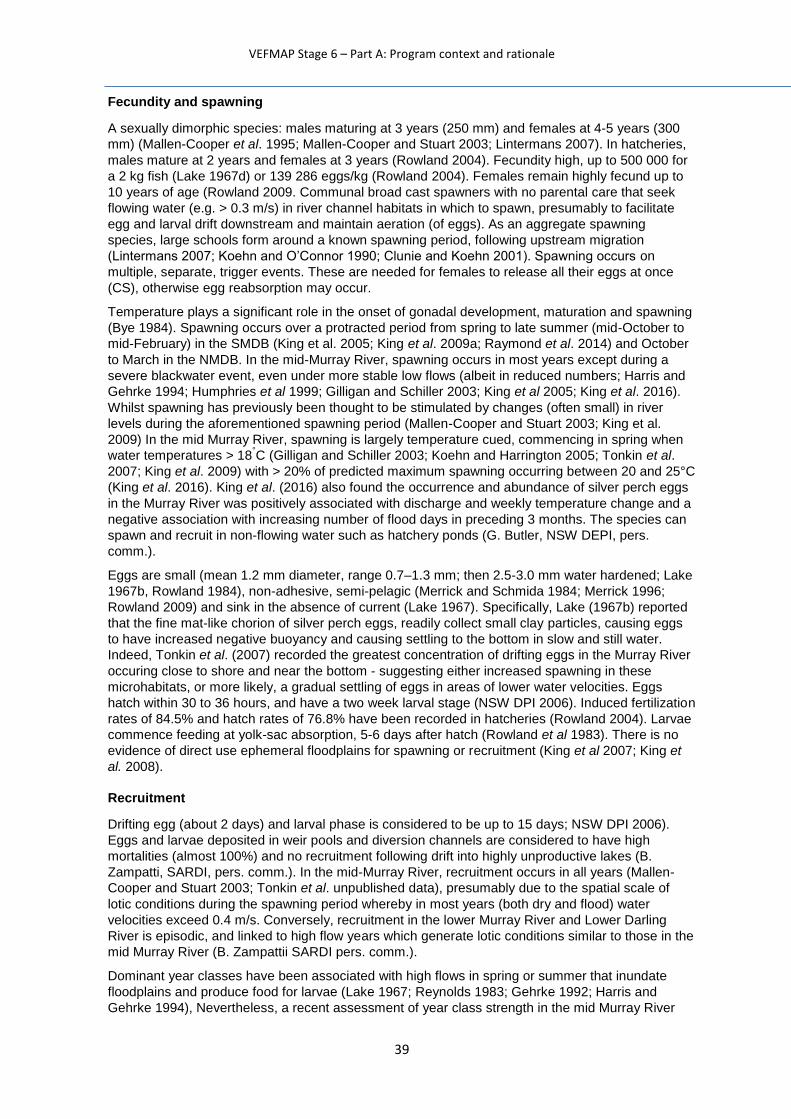
VEFMAP Stage 6 – Part A: Program context and rationale
39
Fecundity and spawning
A sexually dimorphic species: males maturing at 3 years (250 mm) and females at 4-5 years (300
mm) (Mallen-Cooper et al. 1995; Mallen-Cooper and Stuart 2003; Lintermans 2007). In hatcheries,
males mature at 2 years and females at 3 years (Rowland 2004). Fecundity high, up to 500 000 for
a 2 kg fish (Lake 1967d) or 139 286 eggs/kg (Rowland 2004). Females remain highly fecund up to
10 years of age (Rowland 2009. Communal broad cast spawners with no parental care that seek
flowing water (e.g. > 0.3 m/s) in river channel habitats in which to spawn, presumably to facilitate
egg and larval drift downstream and maintain aeration (of eggs). As an aggregate spawning
species, large schools form around a known spawning period, following upstream migration
(Lintermans 2007; Koehn and O’Connor 1990; Clunie and Koehn 2001). Spawning occurs on
multiple, separate, trigger events. These are needed for females to release all their eggs at once
(CS), otherwise egg reabsorption may occur.
Temperature plays a significant role in the onset of gonadal development, maturation and spawning
(Bye 1984). Spawning occurs over a protracted period from spring to late summer (mid-October to
mid-February) in the SMDB (King et al. 2005; King et al. 2009a; Raymond et al. 2014) and October
to March in the NMDB. In the mid-Murray River, spawning occurs in most years except during a
severe blackwater event, even under more stable low flows (albeit in reduced numbers; Harris and
Gehrke 1994; Humphries et al 1999; Gilligan and Schiller 2003; King et al 2005; King et al. 2016).
Whilst spawning has previously been thought to be stimulated by changes (often small) in river
levels during the aforementioned spawning period (Mallen-Cooper and Stuart 2003; King et al.
2009) In the mid Murray River, spawning is largely temperature cued, commencing in spring when
water temperatures > 18°C (Gilligan and Schiller 2003; Koehn and Harrington 2005; Tonkin et al.
2007; King et al. 2009) with > 20% of predicted maximum spawning occurring between 20 and 25°C
(King et al. 2016). King et al. (2016) also found the occurrence and abundance of silver perch eggs
in the Murray River was positively associated with discharge and weekly temperature change and a
negative association with increasing number of flood days in preceding 3 months. The species can
spawn and recruit in non-flowing water such as hatchery ponds (G. Butler, NSW DEPI, pers.
comm.).
Eggs are small (mean 1.2 mm diameter, range 0.7–1.3 mm; then 2.5-3.0 mm water hardened; Lake
1967b, Rowland 1984), non-adhesive, semi-pelagic (Merrick and Schmida 1984; Merrick 1996;
Rowland 2009) and sink in the absence of current (Lake 1967). Specifically, Lake (1967b) reported
that the fine mat-like chorion of silver perch eggs, readily collect small clay particles, causing eggs
to have increased negative buoyancy and causing settling to the bottom in slow and still water.
Indeed, Tonkin et al. (2007) recorded the greatest concentration of drifting eggs in the Murray River
occuring close to shore and near the bottom - suggesting either increased spawning in these
microhabitats, or more likely, a gradual settling of eggs in areas of lower water velocities. Eggs
hatch within 30 to 36 hours, and have a two week larval stage (NSW DPI 2006). Induced fertilization
rates of 84.5% and hatch rates of 76.8% have been recorded in hatcheries (Rowland 2004). Larvae
commence feeding at yolk-sac absorption, 5-6 days after hatch (Rowland et al 1983). There is no
evidence of direct use ephemeral floodplains for spawning or recruitment (King et al 2007; King et
al. 2008).
Recruitment
Drifting egg (about 2 days) and larval phase is considered to be up to 15 days; NSW DPI 2006).
Eggs and larvae deposited in weir pools and diversion channels are considered to have high
mortalities (almost 100%) and no recruitment following drift into highly unproductive lakes (B.
Zampatti, SARDI, pers. comm.). In the mid-Murray River, recruitment occurs in all years (Mallen-
Cooper and Stuart 2003; Tonkin et al. unpublished data), presumably due to the spatial scale of
lotic conditions during the spawning period whereby in most years (both dry and flood) water
velocities exceed 0.4 m/s. Conversely, recruitment in the lower Murray River and Lower Darling
River is episodic, and linked to high flow years which generate lotic conditions similar to those in the
mid Murray River (B. Zampattii SARDI pers. comm.).
Dominant year classes have been associated with high flows in spring or summer that inundate
floodplains and produce food for larvae (Lake 1967; Reynolds 1983; Gehrke 1992; Harris and
Gehrke 1994), Nevertheless, a recent assessment of year class strength in the mid Murray River
VEFMAP Stage 6 – Part A: Program context and rationale
40
has highlighted that the strongest year classes within the mid Murray River are those which
spawned during relatively stable in-channel flows (as per Mallen-Cooper and Stuart 2003; Clayton
Sharpe pers. comm.) followed by large overbank flows (Tonkin et al. unpublished data). ). There
appears to be no recruitment in impoundments (LB). Recruitment of silver perch into northern
Victorian rivers appear heavily reliant on connectivity with the mid Murray River to facilitate
immigration of fish, particularly juveniles (B. Zampattii SARDI unpublished data). Survival rates from
40-80 mm is guestimated to be about 20%. Although widely stocked, there is little evidence of this
being successful in rivers.
Movement, migration and dispersal
Regarded as a mobile species with good swimming abilities, but as there is limited information on
movements; often assumed to be similar to golden perch. They do move large distances and most
silver perch tagged in the lower Murray River moved upstream; one individual moved 570 km in 19
months (Reynolds 1983). Most movements for both adults and juveniles occur over a broad
timeframe (October to April). Adult movements in spring are presumed to be associated with
spawning (Mallen-Cooper ~1995). Juvenile movement, whereby tens of thousands of one year old
fish have been recorded moving through fishways (Mallen-Cooper and Stuart 2003; Baumgartner et
al. 2011; 2014), is thought to be an important dispersal mechanism. For example, a large number of
silver perch recently found occupying Lake Boga in Northern Victoria were found to have colonised
the Lake from the mid Murray River as one year old fish during the large flood event in 2010/2011
(Z. Tonkin and B. Zampatti unpublished data). Movements appear to be stimulated by very sensitive
to small increases in flows (e.g. +0.15m/24h) (Mallen-Cooper and Stuart 2003: J. Thiem, NSW DPI
pers. comm.) and movements decline as flows reduce (Baumgartner et al. 2011; 2014).
Recolonization form isolated refuge water holes is critical in the NMDB, otherwise there is no
evidence to suggest movement patterns would be different between SMDB and NMDB (LB).
Key threats
River regulation and associated infrastructure is thought to be the main threatening process for
silver perch populations. Weirs and dams restrict juvenile and adult movement, particularly those
associated with dispersal and recolonization, creating highly fragmented metapopulations (i.e.
tributaries of the Murray River). High densities of regulating structures severely reduce the
availability of suitable habitat required for frequent spawning and recruitment. For example, the
creation of a large number of weir pools in the lower Murray River have severely depleted the
hydrodynamic conditions required for regular recruitment of the species, with episodic recruitment
associated with years when these structures are inundated and the hydraulics of the systems under
relatively unregulated conditions is restored (B. Zampatti unpublished data).
Water diversions mean large numbers of eggs, larvae and juveniles and adults are lost into
irrigation channels (Gilligan and Schiller 2003; Koehn and Harrington 2005) as eggs and larvae can
be trapped-causing them to settle and die (Clunie and Koehn 2001; Baumgartner et al 2014) and
undershot weirs can kill >90% of larvae (Boys et al. 2010). Floodplain regulation structures can also
strand juvenile and adult fish (Jones and Stuart 2008). Current low densities and severely
fragmented populations may heighten the risk from extended recruitment failure in the future. Loss
of submergent macrophytes may reduce nursery areas for juveniles. Negative impacts of
blackwater events on spawning (Raymond et al. 2016). This loss may be compounded by carp;
although the impacts of carp are not considered to be large. Thermal pollution will limit spawning
below weirs and possibly increase larval survivorship below many impoundments. There is
susceptibility to several diseases including EHNV (Langdon 1989). Silver perch is considered to
have low vulnerability to the impacts climate change (Chessman 2013).
Knowledge gaps and data limitations
• Recruitment dynamics and life stages survival rates.
• Causal links between silver perch life stages and flows.
• Location of YOY silver perch.
• Eggs and larval drift distances and their survivorship in weir pools.
• Downstream movements of silver perch.
VEFMAP Stage 6 – Part A: Program context and rationale
41
• Recolonisation rates- where do all the 1+ fish that move through Torrumbarry go?
• Percentage of females breeding under specific flow and temperature triggers throughout the
season.
• Specific flow links with movement, particularly juvenile fish.
• Dietary / trophic overlap with exotic species, particularly carp.
• Genetic structure.
Key directions for environmental flows and rehabilitation
Landscape scale planning is required for management and to maximise population outcomes and
providing fish passage to increase connectivity is an essential rehabilitation measure. Flow events
appear critical and protecting the integrity of flows and flow components over large spatial scales
(e.g. 300-500 km) through co-ordinated management is required to enhance populations dynamics
(Koehn et al. 2014). Increased small short-term flow variability (1-2 days, height changes up to
0.2m) to 50% of those flows occurring naturally to stimulate juvenile movements in late summer and
early autumn. Dispersal flows implemented in Murray tributaries in early summer (e.g. January-
March) can attract upstream migrating juvenile fish into the in the Echuca-Yarrawonga reach,
especially if synchronised with rising flows in the Murray River (Sharpe 2011; Stuart and Sharpe
2015). Spawning flows can be implemented as annual in-channel events with strong variability, and
should be based on the natural hydrograph in spring/early summer. Delivery of a flood or high
within-channel flow pulse a minimum of 2 in every 5 years will assist recruitment. Habitat
improvements can be made by increasing hydrodynamic diversity, through weir pool lowering used
in conjunction with environmental flows (Ye et al. 2008). For example, an increase in flow rate
through weir pools to > 0.3m/s, can be achieved via increased flow delivery (20,000 ML/d) or
through physical lowering of weir (flows of 10,000 ML/d) to achieve same ecological output. Low
winter flows increase risk of fish through predation, competition, habitat loss, drying, poor water
quality and lower egg and larval survival rates and mitigating low winter flows (to more natural
winter flows) could improve fish condition and have flow on benefits for recruitment (Koehn et al.
2014).
References
Agostinho A., Pelicice F. and Gomes L. (2008). Dams and the fish fauna of the Neotropical region: impacts and
management related to diversity and fisheries. Brazilian Journal of Biology 68, 1119–1132.
Anderson, J.R., Morison, A.K. and Ray, D.J. (1992). Validation of the use of thin-sectioned otoliths for
determining the age and growth of golden perch, Macquaria ambigua, in the lower MDB. Marine and
Freshwater Research43, 1103-1128.
Baumgartner, L., Zampatti, B., Jones, M., Stuart, I. and Mallen-Cooper, M. (2014). Fish passage in the Murray-
Darling Basin: not just an uphill battle. Ecological Management and Restoration 15, 28-39.
Boys, C., Baumgartner, L., Robinson, W., Giddings, G. and Lay, C. (2010). Protecting migrating fish at in-
stream structures: downstream mortality at weirs and screening water diversions. 2010 Native Fish Forum —
Abstracts. Murray-Darling Basin Authority, Canberra. Online at: http://www.mdba.gov.au/system/files/NFS-
2010-fish-forum-abstracts_Final.pdf Accessed: 8 November 2011.
Bye, V. (1984). The role of environmental factors in the timing of reproductive cycles. Pp. 187-205 in Fish
Reproduction: Strategies and Tactics, G. W. Potts and R. J. Wootton, eds. Academic Press, London.
Cadwallader, P. and Backhouse, G.N. (1983). A Guide to the Freshwater Fish of Victoria. Government Printer,
Melbourne.
Clunie, P. E. and Koehn, J. D. (2001). Silver Perch: A Recovery Plan. Final report for project R8002 to Murray-
Darling Basin Commission: Canberra. Department of Natural Resources and Environment, Victoria.
Conservation Advice Bidyanus bidyanus (Silver Perch). (2013).
http://www.environment.gov.au/biodiversity/threatened/species/pubs/76155-conservation-advice.pdf
VEFMAP Stage 6 – Part A: Program context and rationale
42
Davies, P.E., Stewartson, M.J., Hillman, T.J., Roberts, J. R. and Thoms, M. C. (2012). ‘Sustainable Rivers
Audit 2: The ecological health of rivers in the Murray–Darling Basin after the Millennium Drought (2008-2010)’,
Vol. 1, Murray–Darling Basin Authority, Canberra.
Gilligan, D. and Schiller, C. (2003). Downstream transport of larval and juvenile fish in the Murray River.
Cronulla, NSW Fisheries Final Report Series No 50.
Harris, J.H. and Gehrke, P.C. (1994). Modelling the relationship between streamflow and population
recruitment to manage freshwater fisheries. Aust. Fish. 6: 28–30.
Harris J. H. and Gehrke P. C. (1997) Fish and Rivers in Stress: the NSW Rivers Survey. NSW Fisheries Office
of Conservation and CRC for freshwater Ecology, Sydney 298 pp.
Humphries, P., King, A. and Koehn, J. (1999). Fish, flows and flood plains: links between freshwater fishes and
their environment in the Murray-Darling River system, Australia. Environmental Biology of Fishes 56: 129–151,
1999.
Humphries, P., Serafini, L.G. and King, A.J. (2002), ‘River regulation and fish larvae: variation through space
and time’, Freshwater Biology, vol. 47, pp. 1307–1331.
Jones, M.J. and Stuart, I. G. (2008). Regulated floodplains – a trap for unwary fish. Fisheries Management and
Ecology 15: 71–79.
Keenan, C., Watts, R. and Serafini, L. (1996). Population genetics of golden perch, silver perch and eel-tailed
catfish within the Murray-Darling Basin. Pages 17-25 in J.R. Banes and R. Lehane (eds.) Proceedings 1995
Riverine Environment Research Forum. Murray-Darling Basin Committee, Canberra, Australia.
King, A.J., Crook, D.A., Koster, W.M., Mahoney, J., and Tonkin, Z. (2005). Comparison of larval fish drift in the
lower-Goulburn and mid-Murray Rivers. Environmental Management & Restoration 6(2): 136-138.
King, A.J. and O’Connor, J.P. (2007) Native fish entrapment in irrigation systems: A step towards
understanding the significance of the problem. Ecological Management and Restoration 8(1): 32-37
King, A., Tonkin, Z. and Mahoney, J. (2009a). Environmental flow enhances native fish spawning and
recruitment in the Murray River, Australia. River Research and Applications25, 1205-1218.
King, A.J., Ramsey, D., Baumgartner, L., Humphries, P., Jones, M., Koehn, J., Lyon, J., Mallen-Cooper, M.,
Meredith, S., Vilizzi, L., Ye, Q. and Zampatti, B. (2009). Environmental requirements for managing successful
fish recruitment in the Murray River Valley – Review of existing knowledge, Arthur Rylah Institute for
Environmental Research Technical Report Series No. 197, Department of Sustainabilityand Environment,
Heidelberg.
Koehn J.D. & Harrington D.J. (2005) Collection and distribution of the early life stages of the Murray cod
(Maccullochella peelii peelii) in a regulated river. Australian Journal of Zoology 53: 137–144.
Koehn, J.D., and O’Connor, W.G. (1990). Biological Information for Management of Native Freshwater Fish in
Victoria. Department of Conservation and Environment, Freshwater Fish Management Branch, Arthur Rylah
Institute for Environmental Research. Government Printer, Melbourne.
J. Koehn, I. Stuart, H. Bamford, C. Bice, K. Hodges, P. Jackson, J. Lieschke, S. Lovett, M. Mallen-Cooper, T.
Raadik, J. Thiem, C. Todd, Z. Tonkin, B. Zampatti. (2014). Quantifiable Environmental Outcomes for Fish.
Arthur Rylah Institute for Environmental Research Unpublished Client Report for the Murray Darling Basin
Authority, Department of Environment and Primary Industries, Heidelberg, Victoria.
Lake, J.S. 1967. Rearing experiments with five species of Australian freshwater fishes. I. Inducement to
spawning. Aust. J. Mar. Freshw. Res. 18: 137–153.
Langdon, J.S. (1989). Experimental transmission and pathogenicity of epizootic haematopoietic necrosis virus
(EHNV) in redfin perch, Perca fluviatilis L., and 11 other teleosts. J. Fish Dis., 12: 295–310.
Lintermans M (2007) 'Fishes of the Murray-Darling Basin: An introductory guide.' (Murray-Darling Basin
Commission, Canberra)
Lucas M. C. and Baras E. (2000) Methods for studying spatial behaviour of freshwater fishes in the natural
environment. Fish and Fisheries 1, 283–316.
Lucas M. C., Baras E., Thom T. J., Duncan A. and Slavik O. (2001) Migration of Freshwater Fishes. Blackwell
Science Ltd, London, UK.
VEFMAP Stage 6 – Part A: Program context and rationale
43
Lyon, J., Kearns, J., Bird, T., Tonkin, Z, O’Mahony, J., Nicol, S., Hackett, G., Raymond, S., Todd, C. and
Kitchingman, A. (2014). Monitoring of Resnagging between Lake Hume and Yarrawonga: Final Report 2014.
Arthur Rylah Institute for Environmental Research Unpublished Client Report for the Murray-Darling Basin
Authority, The Living Murray Program, Department of Environment and Primary Industries, Heidelberg,
Victoria.
Maheshwari, B.L., Walker, K.F., & McMahon, T.A. (1995), Effects of flow regulation on the flow regime of the
River Murray, Australia. Regulated Rivers: Research & Management, 10: 15-38.
Mallen-Cooper M., Stuart, I.G., Hides-Pearson, F. and Harris, J.H. (1995). Fish migration in the Murray River
and assessment of the Torrumbarry fishway. Final report for Natural Resources Management Strategy Project.
NSW Fisheries, Sydney, Australia.
Mallen-Cooper, M., and Stuart, I. (2003) Age, growth and non-flood recruitment of two potamodromous fishes
in a large semi-arid/temperate river system. River Research and Applications 19: 697-719.
Mallen-Cooper M. and Brand D. M. (2007) Non salmonids in a salmonid fishway: what do 50 years of data tell
us about past and future fish passage? Fisheries Management and Ecology 14, 319–332.
Mallen-Cooper, M., and Zampatti, B. (2015). Background paper: use of life-history conceptual models of fish in
flow management in the Murray-Darling Basin. Murray-Darling Basin Authority, Canberra.
Merrick JR 1996. Freshwater grunters or perches, Family Terapontidae. Chapter 26. Silver perch. Pp. 164-166
in: Freshwater fishes of south-eastern Australia. [Ed. McDowall R.]. Reed Books, NSW.
Merrick, J.R. and Schmida, G.E. (1984). Australian freshwater fishes: biology and management. Griffin Press
Ltd., South Australia. 409 p.
NSW Department of Primary Industries. (2006). Silver perch Bidyanus bidyanus: NSW Recovery Plan. Port
Stephens NSW.
Raymond, S., Duncan, M., Robinson, W. and Tonkin, Z. (2014). Barmah-Millewa Fish Condition Monitoring:
2006 to 2014. Arthur Rylah Institute for Environmental Research Unpublished Client Report for the Murray
Darling Basin Authority. Department of Environment and Primary Industries, Heidelberg, Victoria.
Reynolds, L.F. (1983). Migration patterns of five fish species in the Murray-Darling river system. Aust. J. Mar.
Freshw. Res. 34: 857–871.
Rowland, S.J. (1995). The silver perch and its potential for aquaculture. Pp. 9-11 in: Proceedings of Silver
Perch Aquaculture Workshops, Grafton and Narrandera, April 1994. NSW Fisheries.
Rowland, S.J. (2004). Domestication of Silver perch, Bidyanus bidyanus, Broodfish. Journal of Applied
Aquaculture, 16: 1, 75-83.
Rowland, S.J. (2009). Review of Aquaculture research and development of the Australian freshwater fish silver
perch, Bidyanus bidyanus. Journal of the World Aquaculture Society 40(3): 291-323
Sharpe, C., Stuart, I. and Mallen-Cooper, M. (2015). Monitoring of fish spawning in response to variable flow
releases in the lower Darling River 2013/14. A summary of findings report to MDBA by CPS Enviro.
Sharpe, C. (2011). Fish surveys in Gunbower Creek downstream of Koondrook Weir in association with
Environmental Flows, December 2011. pp. 15.
Tonkin Z, King A, Mahoney J and Morrongiello J (2007). Diel and spatial drifting patterns of silver perch
Bidyanus bidyanus eggs in an Australian lowland river. Journal of Fish Biology 70: 313–317.
Walker, K.F. (1981). Effects of weirs on the environment of the Lower River Murray. South Australian Fishing
Industry Council Newsletter 5(6): 26-29.
Ye, Q., Cheshire, K. and Fleer, D. (2008). Recruitment of golden perch and selected large-bodied fish species
following the weir pool manipulation in the River Murray, South Australia. SARDI Aquatic Sciences report.
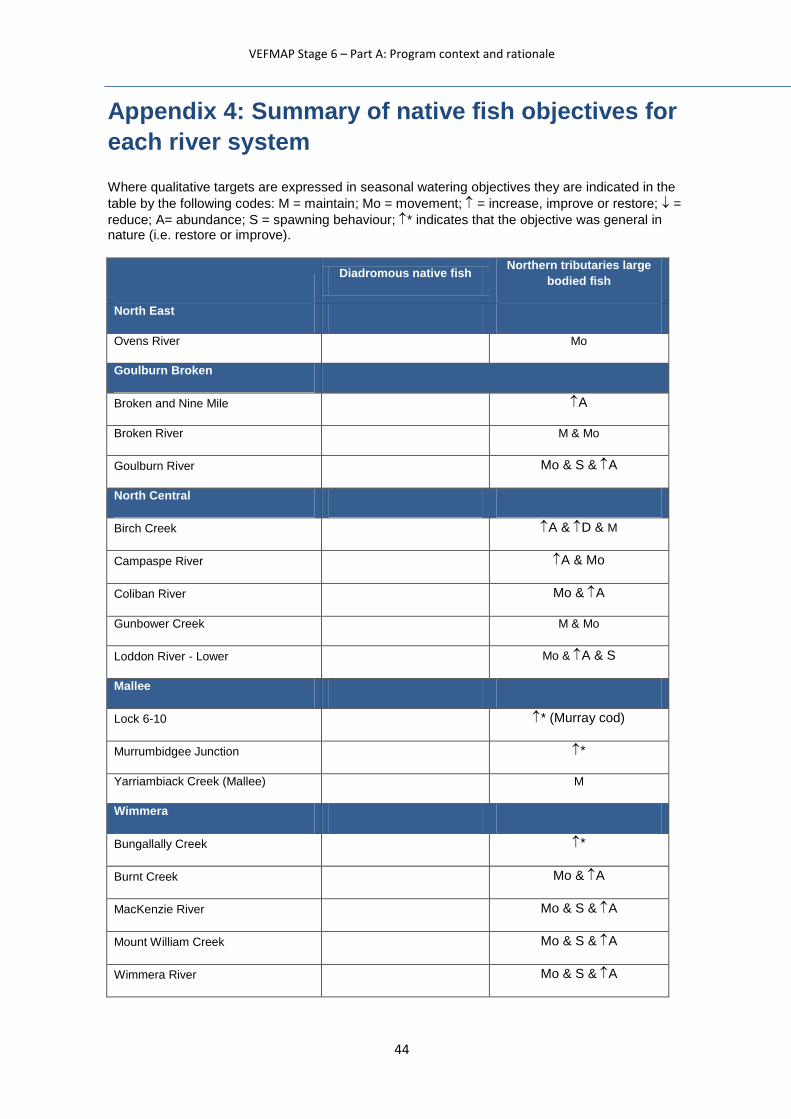
VEFMAP Stage 6 – Part A: Program context and rationale
44
Appendix 4: Summary of native fish objectives for
each river system
Where qualitative targets are expressed in seasonal watering objectives they are indicated in the
table by the following codes: M = maintain; Mo = movement; = increase, improve or restore; =
reduce; A= abundance; S = spawning behaviour; * indicates that the objective was general in nature (i.e. restore or improve).
Diadromous native fish
Northern tributaries large
bodied fish
North East
Ovens River Mo
Goulburn Broken
Broken and Nine Mile A
Broken River M & Mo
Goulburn River Mo & S & A
North Central
Birch Creek A & D & M
Campaspe River A & Mo
Coliban River Mo & A
Gunbower Creek M & Mo
Loddon River - Lower Mo & A & S
Mallee
Lock 6-10 * (Murray cod)
Murrumbidgee Junction *
Yarriambiack Creek (Mallee) M
Wimmera
Bungallally Creek *
Burnt Creek Mo & A
MacKenzie River Mo & S & A
Mount William Creek Mo & S & A
Wimmera River Mo & S & A
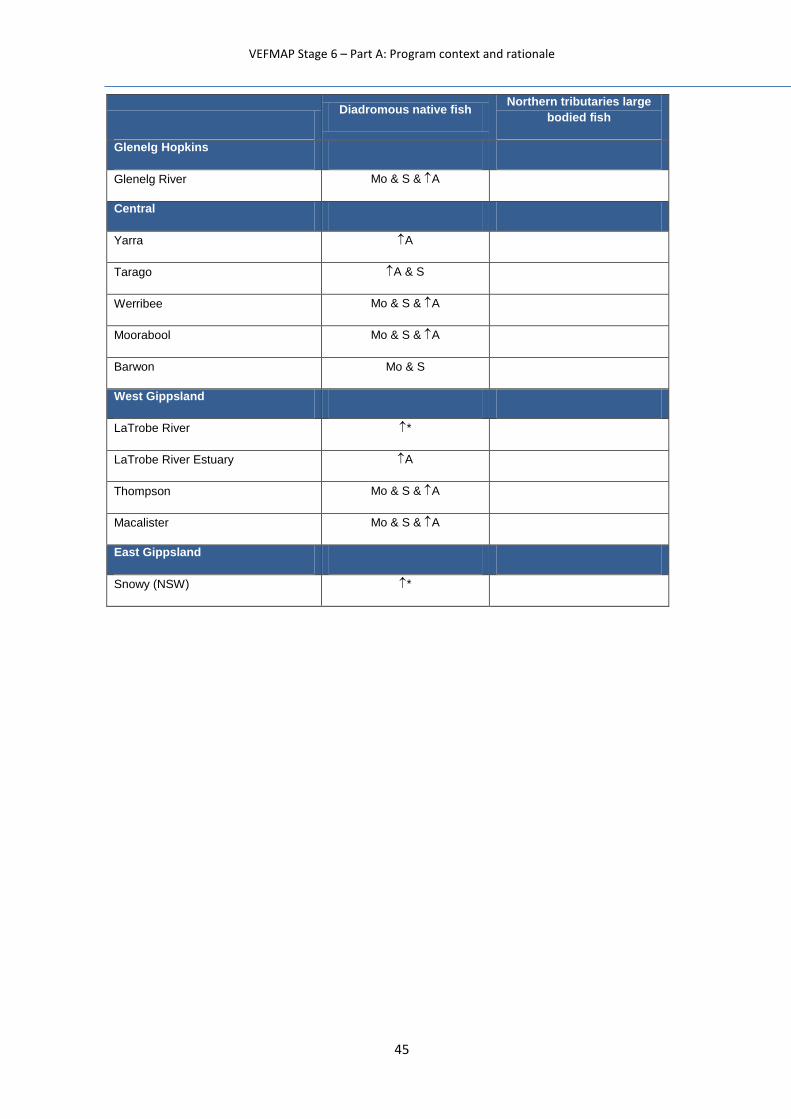
VEFMAP Stage 6 – Part A: Program context and rationale
45
Diadromous native fish
Northern tributaries large
bodied fish
Glenelg Hopkins
Glenelg River Mo & S & A
Central
Yarra A
Tarago A & S
Werribee Mo & S & A
Moorabool Mo & S & A
Barwon Mo & S
West Gippsland
LaTrobe River *
LaTrobe River Estuary A
Thompson Mo & S & A
Macalister Mo & S & A
East Gippsland
Snowy (NSW) *

VEFMAP Stage 6 – Part A: Program context and rationale
46
Appendix 5: Full list of potential VEFMAP Stage 6 fish questions
Shortlisted VEFMAP Stage 6 fish questions as developed by ARI, UoM, CMAs and DELWP.
Question (can be refined by CMAs)
Proposed characterisation of
flow
Condition or intervention monitoring
Relevant catchment
Species Proposed measurement
endpoint/s
Question posed by?
Possible constraints
to answering question
Scale Value add/cost sharing
Logic
1. Does environmental flow management trigger post-larval and YOY diadromous (fish that move between freshwater & the sea) fish to enter rivers from estuarine/marine environments?
Spring fresh flow with 14-day duration and 50% exceedance flow
Quantify hydraulic cues (water velocity, turbulence)
Intervention Bunyip
Yarra
Thomson
Cardinia
Glenelg
Werribee
Barham
Tyers/
La Trobe
Barwon/
Moorabool
Grayling
Tupong
Australian bass
Galaxiids?
Estuary perch
Otolith analysis
Hydraulics
Fishway trapping
Distribution
Stream barriers
Where possible align with areas where there is stream barrier remediation
Catchment
& Regional
MW
CMAs
Several CMAs are releasing water to estuaries to enhance diadromous fish outcomes but attraction of Young-Of-Year (YOY) has not been formally tested. Data from Dights Falls suggests that marine residency time is influenced by freshwater flows to estuaries. Hence, recruitment of YOY in coastal rivers can potentially be enhanced with freshwater flow cues.
2. Does environmental flow management improve the spatial distribution of diadromous fish in coastal rivers?
Spring/summer fresh flow with two 10+ day duration events and 50% exceedance flow
Quantify hydraulic cues (water velocity, turbulence)
Intervention Glenelg
Thomson
Cardinia
Yarra
Barwon/
Moorabool
Macalister Werribee
Barham?
Tyers/La Trobe
Grayling
Tupong
Eels
Australian bass
Galaxiids?
Lampreys?
Estuary perch
CPUE
Movement
Fishway trapping
Marked fish
Distribution
Steam barriers
Catchment
&Regional
MW
CMAs
Several CMAs have reported that upstream dispersal of diadromous fish occurs during/after flow events. Examples are Estuary perch/tupong in Glenelg, tupong/grayling in Bunyip, galaxiids in the Werribee and several spp in the Macalister. By restoring flows and complementary actions (e.g. fish passage) there is potential to restore diadromous fish populations in the middle and upper freshwater reaches of coastal rivers.
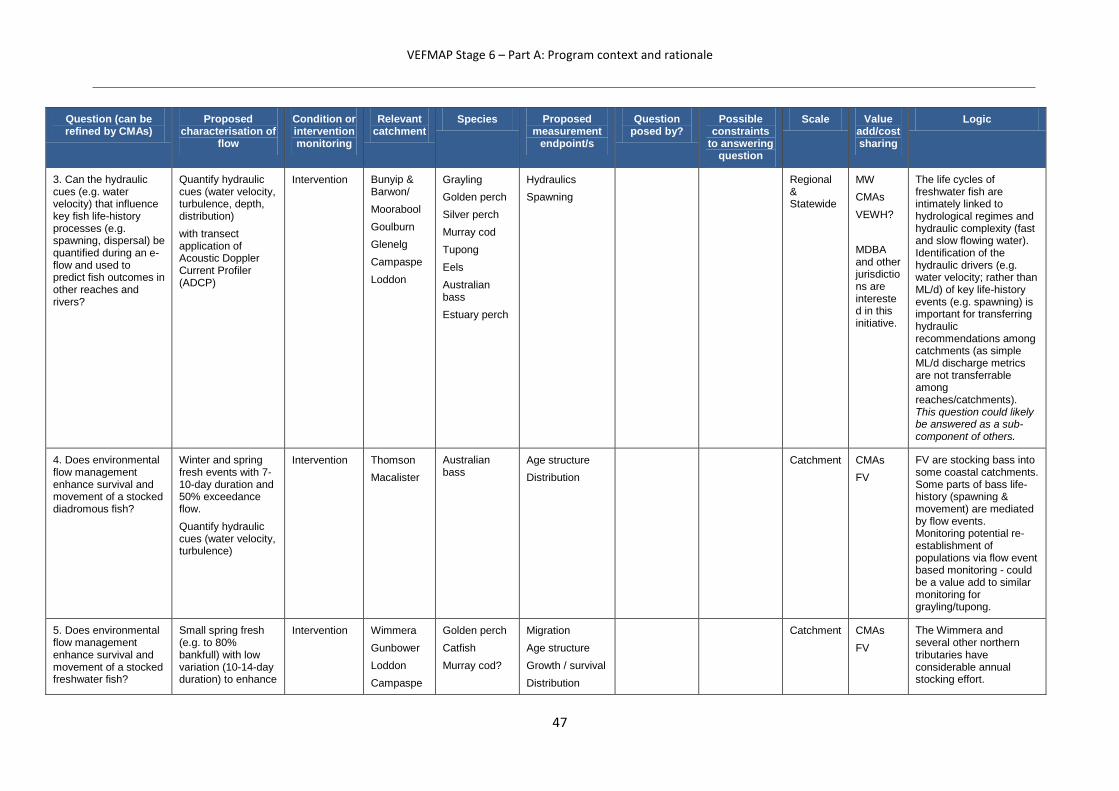
VEFMAP Stage 6 – Part A: Program context and rationale
47
Question (can be refined by CMAs)
Proposed characterisation of
flow
Condition or intervention monitoring
Relevant catchment
Species Proposed measurement
endpoint/s
Question posed by?
Possible constraints
to answering question
Scale Value add/cost sharing
Logic
3. Can the hydraulic cues (e.g. water velocity) that influence key fish life-history processes (e.g. spawning, dispersal) be quantified during an e-flow and used to predict fish outcomes in other reaches and rivers?
Quantify hydraulic cues (water velocity, turbulence, depth, distribution)
with transect application of Acoustic Doppler Current Profiler (ADCP)
Intervention Bunyip & Barwon/
Moorabool
Goulburn
Glenelg
Campaspe
Loddon
Grayling
Golden perch
Silver perch
Murray cod
Tupong
Eels
Australian bass
Estuary perch
Hydraulics
Spawning
Regional & Statewide
MW
CMAs
VEWH?
MDBA and other jurisdictions are interested in this initiative.
The life cycles of freshwater fish are intimately linked to hydrological regimes and hydraulic complexity (fast and slow flowing water). Identification of the hydraulic drivers (e.g. water velocity; rather than ML/d) of key life-history events (e.g. spawning) is important for transferring hydraulic recommendations among catchments (as simple ML/d discharge metrics are not transferrable among reaches/catchments). This question could likely be answered as a sub-component of others.
4. Does environmental flow management enhance survival and movement of a stocked diadromous fish?
Winter and spring fresh events with 7-10-day duration and 50% exceedance flow.
Quantify hydraulic cues (water velocity, turbulence)
Intervention Thomson
Macalister
Australian bass
Age structure
Distribution
Catchment CMAs
FV
FV are stocking bass into some coastal catchments. Some parts of bass life-history (spawning & movement) are mediated by flow events. Monitoring potential re-establishment of populations via flow event based monitoring - could be a value add to similar monitoring for grayling/tupong.
5. Does environmental flow management enhance survival and movement of a stocked freshwater fish?
Small spring fresh (e.g. to 80% bankfull) with low variation (10-14-day duration) to enhance
Intervention Wimmera
Gunbower
Loddon
Campaspe
Golden perch
Catfish
Murray cod?
Migration
Age structure
Growth / survival
Distribution
Catchment CMAs
FV
The Wimmera and several other northern tributaries have considerable annual stocking effort.

VEFMAP Stage 6 – Part A: Program context and rationale
48
Question (can be refined by CMAs)
Proposed characterisation of
flow
Condition or intervention monitoring
Relevant catchment
Species Proposed measurement
endpoint/s
Question posed by?
Possible constraints
to answering question
Scale Value add/cost sharing
Logic
movement and spawning of nest building native fish
Goulburn/
Broken
Determining how flows support stocked fish populations in terms of movement and survival has some merit.
6. Can environmental flows be used to increase populations of target species in Victorian Tributaries of the Murray through the use of attraction flows (summer /autumn juvenile emigration flows or spring adult flows)?
Summer/autumn (Jan/Feb) fresh of 10+ days duration to rise at least 0.3 m above ‘normal’ summer level. Must be integrated with Murray River rise (e.g. >8,000 ML/d at Torrumbarry)
Intervention Loddon/
Pyramid
Campaspe
Goulburn/
Broken
Gunbower
Golden perch
Silver perch
Hydraulics
Migration
Age structure
CPUE?
Distribution
Synchronising flows with Murray River
Catchment
& Regional
CMAs
FV
MDBA
In most summers, large numbers of 1-year old golden perch and silver perch migrate from downstream nursery habitats upstream along the Murray adjacent to the Vic/NSW tributaries. These fish then appear to disperse into the upper Murray and NSW/Vic tributaries. Synchronising a small summer rise in Vic. tribs with this summer fish migration may attract fish into Vic tribs and contribute to demonstrable re-colonisation. Initial proof-of-concept has already been demonstrated in the Gunbower and Pyramid systems.
7. Does environmental flow management used for Murray cod and other native species result in higher survival?
Late winter/early spring rise to 80-100% bankfull and hold for up to 21 days
Intervention Loddon
Campaspe
Goulburn/
Broken
Mullaroo
Murray cod
Trout cod
Freshwater catfish
Hydraulics
Larvae
YOY
Age structure
CPUE
Productivity
Growth
Catchment & Regional
CMAs Murray cod can spawn independently of a river rise but in some irrigation systems the fluctuation in river height due to irrigation demand is too far outside that of natural and negatively impacts life-history processes (e.g. spawning). Environmental water to fill in the ‘gaps’ in the flow regime to reduce overt
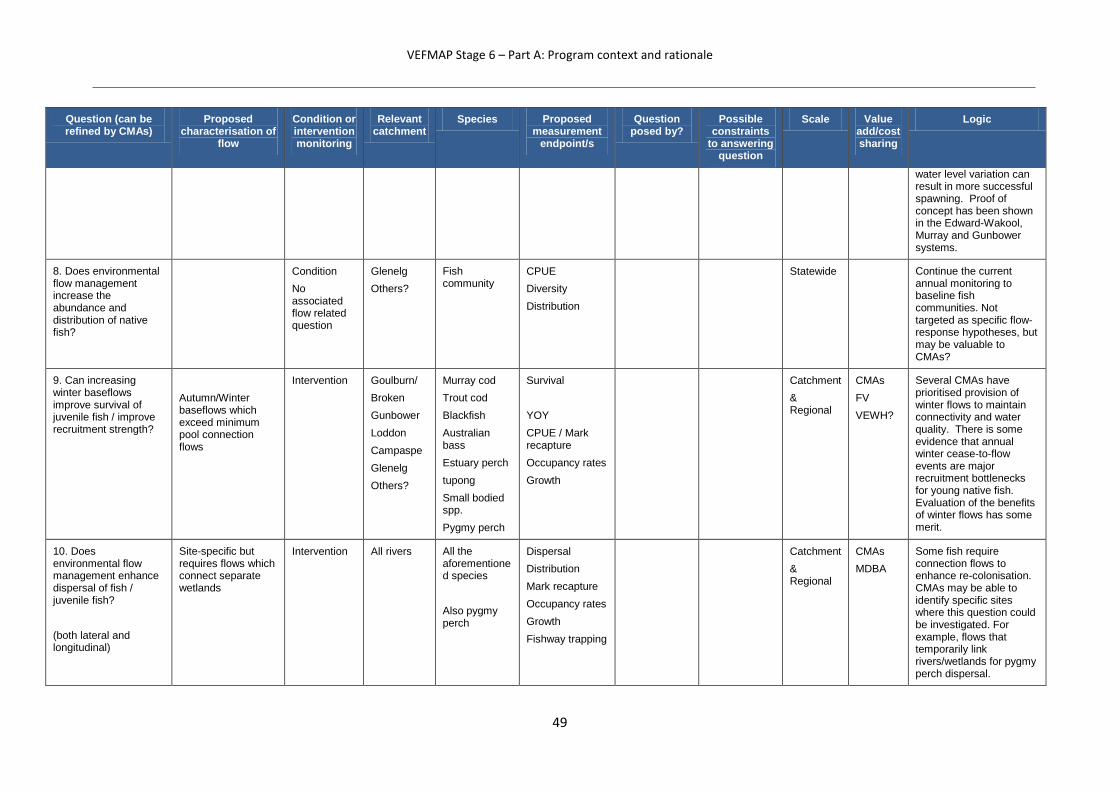
VEFMAP Stage 6 – Part A: Program context and rationale
49
Question (can be refined by CMAs)
Proposed characterisation of
flow
Condition or intervention monitoring
Relevant catchment
Species Proposed measurement
endpoint/s
Question posed by?
Possible constraints
to answering question
Scale Value add/cost sharing
Logic
water level variation can result in more successful spawning. Proof of concept has been shown in the Edward-Wakool, Murray and Gunbower systems.
8. Does environmental flow management increase the abundance and distribution of native fish?
Condition
No associated flow related question
Glenelg
Others?
Fish community
CPUE
Diversity
Distribution
Statewide Continue the current annual monitoring to baseline fish communities. Not targeted as specific flow-response hypotheses, but may be valuable to CMAs?
9. Can increasing winter baseflows improve survival of juvenile fish / improve recruitment strength?
Autumn/Winter baseflows which exceed minimum pool connection flows
Intervention Goulburn/
Broken
Gunbower
Loddon
Campaspe
Glenelg
Others?
Murray cod
Trout cod
Blackfish
Australian bass
Estuary perch
tupong
Small bodied spp.
Pygmy perch
Survival
YOY
CPUE / Mark recapture
Occupancy rates
Growth
Catchment
& Regional
CMAs
FV
VEWH?
Several CMAs have prioritised provision of winter flows to maintain connectivity and water quality. There is some evidence that annual winter cease-to-flow events are major recruitment bottlenecks for young native fish. Evaluation of the benefits of winter flows has some merit.
10. Does environmental flow management enhance dispersal of fish / juvenile fish?
(both lateral and longitudinal)
Site-specific but requires flows which connect separate wetlands
Intervention All rivers All the aforementioned species
Also pygmy perch
Dispersal
Distribution
Mark recapture
Occupancy rates
Growth
Fishway trapping
Catchment
& Regional
CMAs
MDBA
Some fish require connection flows to enhance re-colonisation. CMAs may be able to identify specific sites where this question could be investigated. For example, flows that temporarily link rivers/wetlands for pygmy perch dispersal.
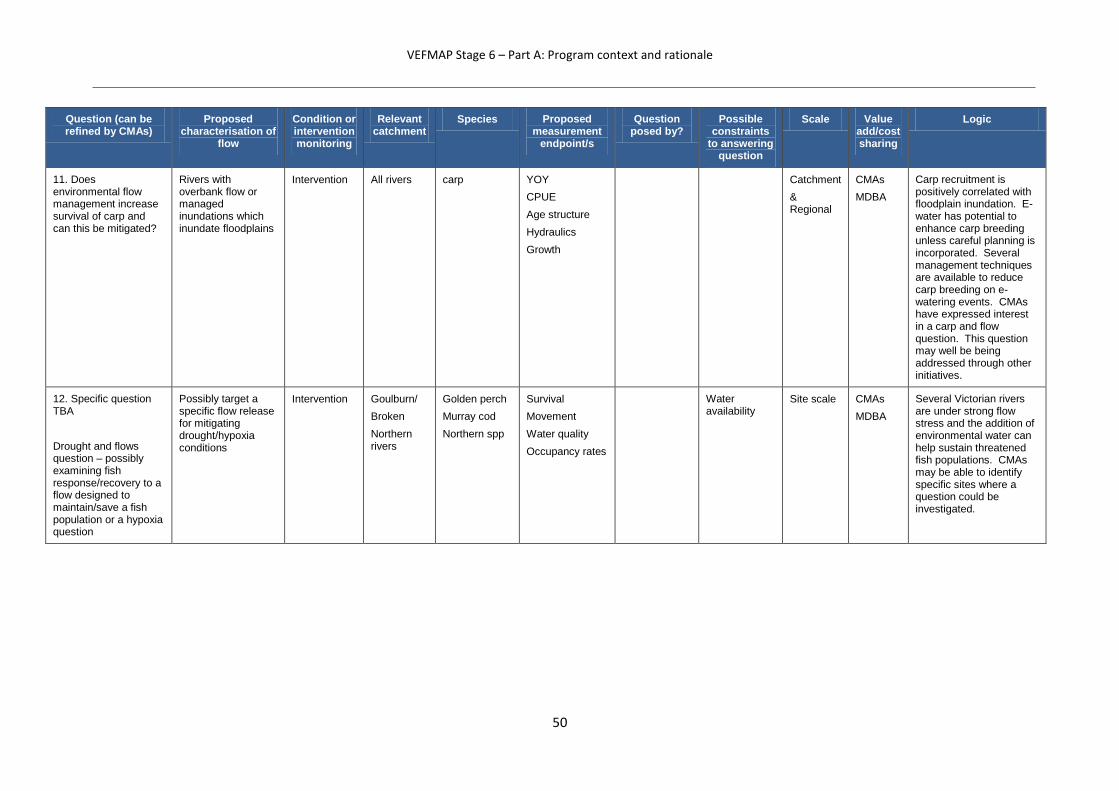
VEFMAP Stage 6 – Part A: Program context and rationale
50
Question (can be refined by CMAs)
Proposed characterisation of
flow
Condition or intervention monitoring
Relevant catchment
Species Proposed measurement
endpoint/s
Question posed by?
Possible constraints
to answering question
Scale Value add/cost sharing
Logic
11. Does environmental flow management increase survival of carp and can this be mitigated?
Rivers with overbank flow or managed inundations which inundate floodplains
Intervention All rivers carp YOY
CPUE
Age structure
Hydraulics
Growth
Catchment
& Regional
CMAs
MDBA
Carp recruitment is positively correlated with floodplain inundation. E-water has potential to enhance carp breeding unless careful planning is incorporated. Several management techniques are available to reduce carp breeding on e-watering events. CMAs have expressed interest in a carp and flow question. This question may well be being addressed through other initiatives.
12. Specific question TBA
Drought and flows question – possibly examining fish response/recovery to a flow designed to maintain/save a fish population or a hypoxia question
Possibly target a specific flow release for mitigating drought/hypoxia conditions
Intervention Goulburn/
Broken
Northern rivers
Golden perch
Murray cod
Northern spp
Survival
Movement
Water quality
Occupancy rates
Water availability
Site scale CMAs
MDBA
Several Victorian rivers are under strong flow stress and the addition of environmental water can help sustain threatened fish populations. CMAs may be able to identify specific sites where a question could be investigated.
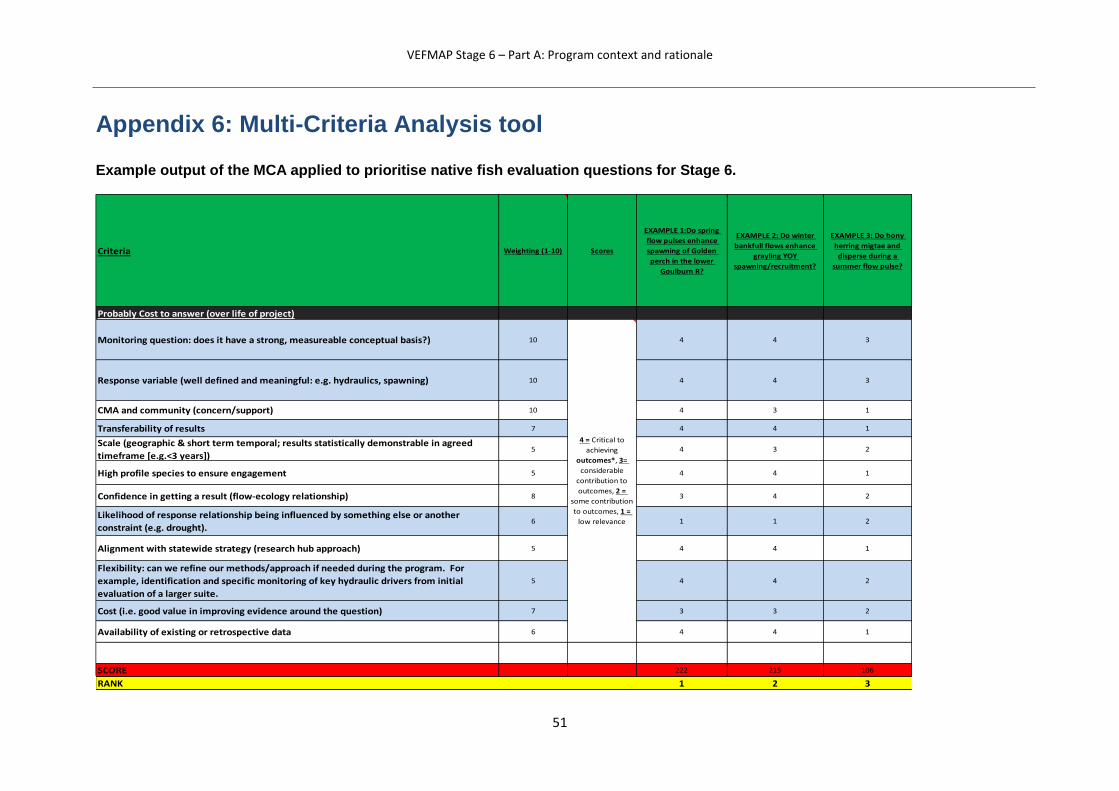
VEFMAP Stage 6 – Part A: Program context and rationale
51
Appendix 6: Multi-Criteria Analysis tool
Example output of the MCA applied to prioritise native fish evaluation questions for Stage 6.
Criteria Weighting (1-10) Scores
EXAMPLE 1:Do spring
flow pulses enhance
spawning of Golden
perch in the lower
Goulburn R?
EXAMPLE 2: Do winter
bankfull flows enhance
grayling YOY
spawning/recruitment?
EXAMPLE 3: Do bony
herring migtae and
disperse during a
summer flow pulse?
Probably Cost to answer (over life of project)
Monitoring question: does it have a strong, measureable conceptual basis?) 10 4 4 3
Response variable (well defined and meaningful: e.g. hydraulics, spawning) 10 4 4 3
CMA and community (concern/support) 10 4 3 1
Transferability of results 7 4 4 1
Scale (geographic & short term temporal; results statistically demonstrable in agreed
timeframe [e.g.<3 years]) 5 4 3 2
High profile species to ensure engagement 5 4 4 1
Confidence in getting a result (flow-ecology relationship) 8 3 4 2
Likelihood of response relationship being influenced by something else or another
constraint (e.g. drought).6 1 1 2
Alignment with statewide strategy (research hub approach) 5 4 4 1
Flexibility: can we refine our methods/approach if needed during the program. For
example, identification and specific monitoring of key hydraulic drivers from initial
evaluation of a larger suite.
5 4 4 2
Cost (i.e. good value in improving evidence around the question) 7 3 3 2
Availability of existing or retrospective data 6 4 4 1
SCORE 222 215 106
RANK 1 2 3
4 = Critical to
achieving
outcomes*, 3=
considerable
contribution to
outcomes, 2 =
some contribution
to outcomes, 1 =
low relevance
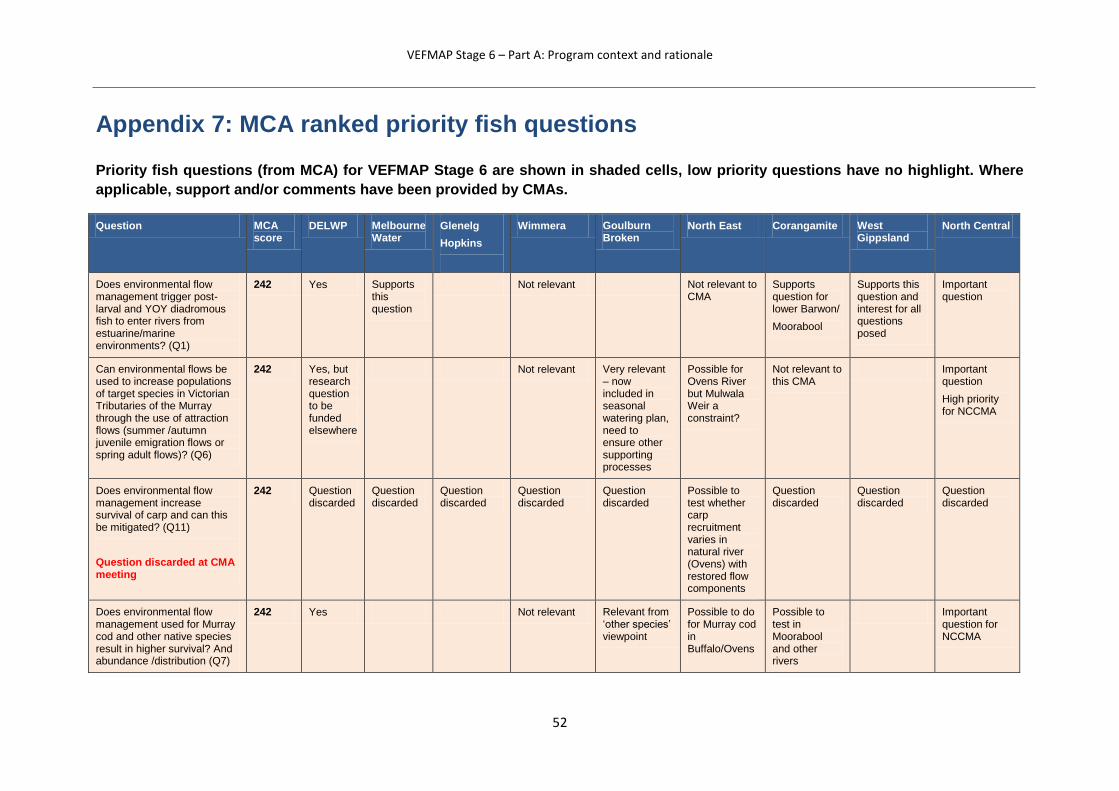
VEFMAP Stage 6 – Part A: Program context and rationale
52
Appendix 7: MCA ranked priority fish questions
Priority fish questions (from MCA) for VEFMAP Stage 6 are shown in shaded cells, low priority questions have no highlight. Where
applicable, support and/or comments have been provided by CMAs.
Question MCA score
DELWP Melbourne Water
Glenelg
Hopkins
Wimmera Goulburn Broken
North East Corangamite West Gippsland
North Central
Does environmental flow management trigger post-larval and YOY diadromous fish to enter rivers from estuarine/marine environments? (Q1)
242 Yes Supports this question
Not relevant Not relevant to CMA
Supports question for lower Barwon/
Moorabool
Supports this question and interest for all questions posed
Important question
Can environmental flows be used to increase populations of target species in Victorian Tributaries of the Murray through the use of attraction flows (summer /autumn juvenile emigration flows or spring adult flows)? (Q6)
242 Yes, but research question to be funded elsewhere
Not relevant Very relevant – now included in seasonal watering plan, need to ensure other supporting processes
Possible for Ovens River but Mulwala Weir a constraint?
Not relevant to this CMA
Important question
High priority for NCCMA
Does environmental flow management increase survival of carp and can this be mitigated? (Q11)
Question discarded at CMA meeting
242 Question discarded
Question discarded
Question discarded
Question discarded
Question discarded
Possible to test whether carp recruitment varies in natural river (Ovens) with restored flow components
Question discarded
Question discarded
Question discarded
Does environmental flow management used for Murray cod and other native species result in higher survival? And abundance /distribution (Q7)
242 Yes Not relevant Relevant from ‘other species’ viewpoint
Possible to do for Murray cod in Buffalo/Ovens
Possible to test in Moorabool and other rivers
Important question for NCCMA

VEFMAP Stage 6 – Part A: Program context and rationale
53
Does environmental flow management improve the spatial distribution of diadromous fish in coastal rivers? (Q2)
235 Yes Supports this question (Galaxiids)
Interested in this question
Not relevant Not relevant Possible to test question in Barwon and Gellibrand
Can increasing winter baseflows improve survival of juvenile fish / improve recruitment? (Q9)
222 Yes MW mildly interested
Only relevant if it relates to small bodied species
Can be tested in Moorabool
Less relevant unless tracking individuals
Does environmental flow management enhance survival and movement of a stocked diadromous fish? (Q4)
201 Low priority
Not relevant Not relevant, FV to investigate
Does environmental flow management enhance survival and movement of a stocked freshwater fish? (Q5)
197 Low priority
Very relevant Some significant technical and operational difficulties
Does environmental flow management enhance dispersal of fish/juvenile fish? (Q10)
185 Out of scope
See above. Only relevant during flooding
Does environmental flow management increase the abundance and distribution of native fish? (Annual surveys as per VEFMAP Stage 1-5) (Q8)
111 Answered by Q2 and Q7.
Very relevant Only if funding is available
Some relevance but could be targeted to reaches
Can the hydraulic cues (e.g. water velocity) that influence key fish life-history processes (e.g. spawning, dispersal) be quantified during an e-flow and used to predict fish outcomes in other reaches and rivers? (Q3)
Not scored
Too complex for 4-year timeframe
Very interested in this question
Very interested - applies to recruitment/spawning for grayling, tupong & bass
Drought and flows question – possibly examining fish response/recovery to a flow designed to maintain/save a
Not scored
High priority –good for Wimmera
Good question and useful information for catastrophic
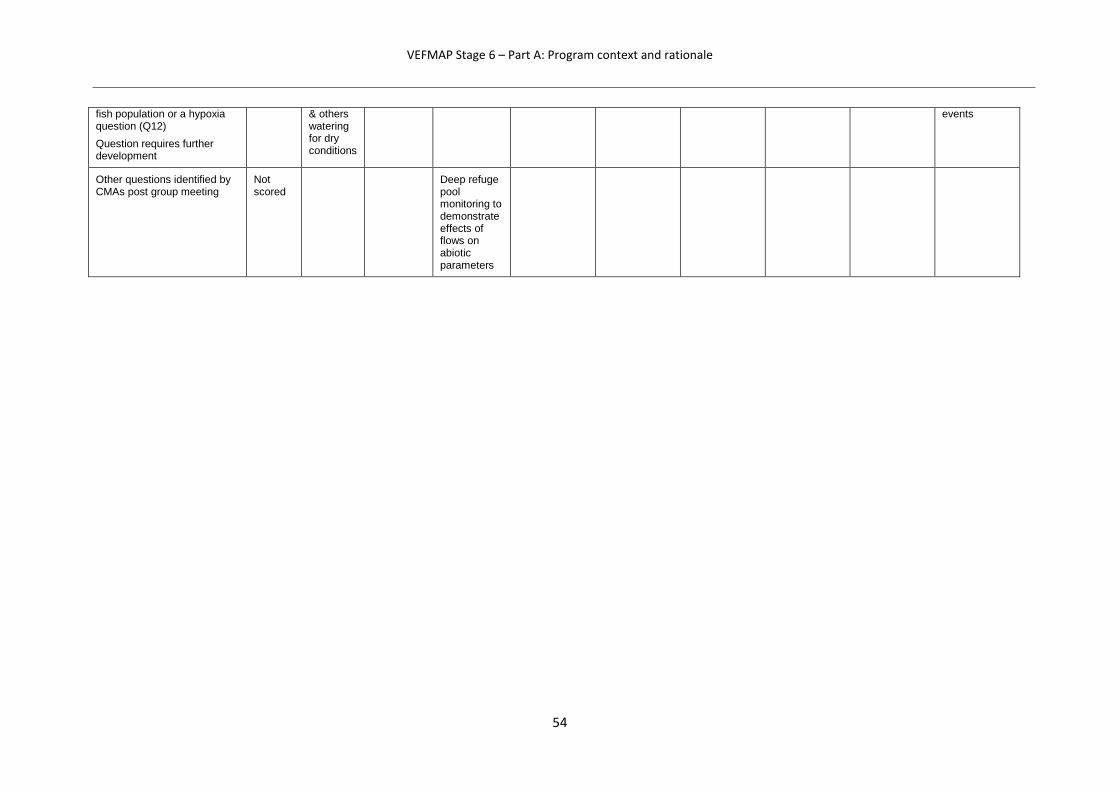
VEFMAP Stage 6 – Part A: Program context and rationale
54
fish population or a hypoxia question (Q12)
Question requires further development
& others watering for dry conditions
events
Other questions identified by CMAs post group meeting
Not scored
Deep refuge pool monitoring to demonstrate effects of flows on abiotic parameters

VEFMAP Stage 6 – Part A: Program context and rationale
55
Appendix 8: Native vegetation conceptual models
Vegetation responses to flows can be captured in specific responses to a series of direct impacts
from such things as: inundation depth, inundation duration, soil moisture/water availability, flow
velocity, water turbidity and salinity. Different life forms and species will respond to these impacts
differently, with some being highly sensitive to change and others being tolerant. For example, as
the depth and duration of watering increases, the survival of flood-sensitive species is expected to
decrease, as they are effectively drowned (Miller et al. 2013, Figure A). It is expected that with
regulation of waterways and the reduction of flooding frequency and volumes, river banks will be
invaded by terrestrial and/or exotic species (Catford et al. 2014, Greet et al. 2012, Greet et al. 2013,
Poff et al. 2010 and Webb et al. 2015). These shifts are likely to alter the composition of species
occurring within the channel, which may have significant implications for altered ecosystem services
or functions (Laliberté et al. 2010, Merritt et al. 2010). While river regulation alters vegetation
composition, it is anticipated that controlled flow deliveries can be used to favour native species and
reduce invasion of undesirable species (Miller et al. 2013).
Also, while flows are beneficial for transporting seeds and stimulating germination at particular times
in the growing season (Greet et al. 2012), very young seedlings are easily killed by inundation
(Miller et al. 2013). However, the balance between flows promoting germination and consequently
reducing survival is not fully understood (Miller et al. 2013).
Figure A: Conceptual model for vegetation survival with increasing depth and duration of inundation.
On a similar note, when considering soil moisture levels, it is expected that increasing soil moisture
levels will result in increased plant survival, until the point that soils become waterlogged, in which
case sensitive species (e.g. terrestrial species) will suffer (Figure B).
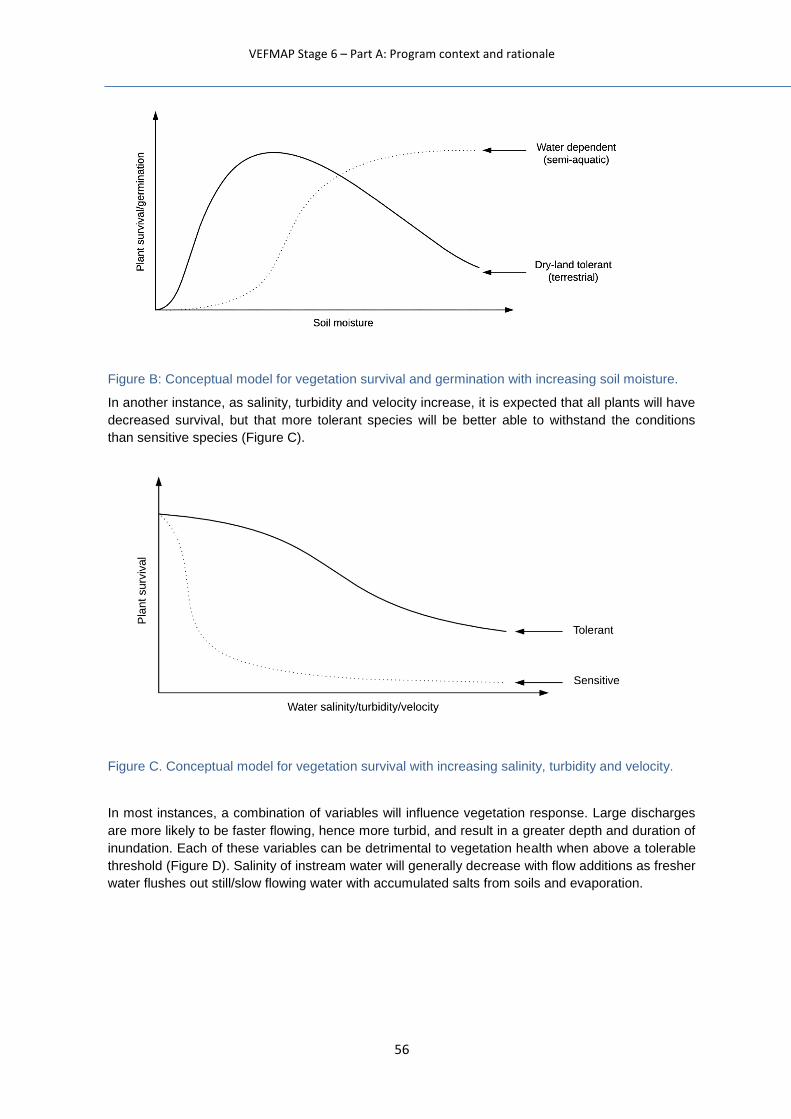
VEFMAP Stage 6 – Part A: Program context and rationale
56
Figure B: Conceptual model for vegetation survival and germination with increasing soil moisture.
In another instance, as salinity, turbidity and velocity increase, it is expected that all plants will have
decreased survival, but that more tolerant species will be better able to withstand the conditions
than sensitive species (Figure C).
Figure C. Conceptual model for vegetation survival with increasing salinity, turbidity and velocity.
In most instances, a combination of variables will influence vegetation response. Large discharges
are more likely to be faster flowing, hence more turbid, and result in a greater depth and duration of
inundation. Each of these variables can be detrimental to vegetation health when above a tolerable
threshold (Figure D). Salinity of instream water will generally decrease with flow additions as fresher
water flushes out still/slow flowing water with accumulated salts from soils and evaporation.
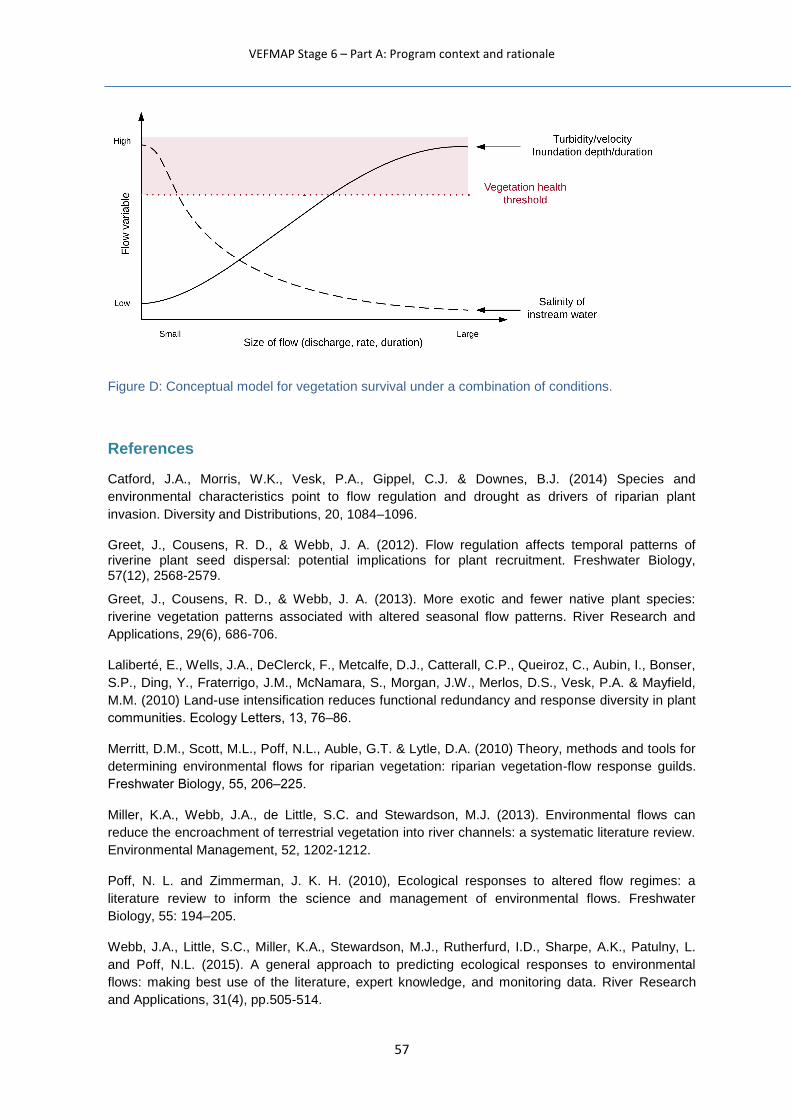
VEFMAP Stage 6 – Part A: Program context and rationale
57
Figure D: Conceptual model for vegetation survival under a combination of conditions.
References
Catford, J.A., Morris, W.K., Vesk, P.A., Gippel, C.J. & Downes, B.J. (2014) Species and
environmental characteristics point to flow regulation and drought as drivers of riparian plant
invasion. Diversity and Distributions, 20, 1084–1096.
Greet, J., Cousens, R. D., & Webb, J. A. (2012). Flow regulation affects temporal patterns of riverine plant seed dispersal: potential implications for plant recruitment. Freshwater Biology, 57(12), 2568-2579.
Greet, J., Cousens, R. D., & Webb, J. A. (2013). More exotic and fewer native plant species:
riverine vegetation patterns associated with altered seasonal flow patterns. River Research and
Applications, 29(6), 686-706.
Laliberté, E., Wells, J.A., DeClerck, F., Metcalfe, D.J., Catterall, C.P., Queiroz, C., Aubin, I., Bonser,
S.P., Ding, Y., Fraterrigo, J.M., McNamara, S., Morgan, J.W., Merlos, D.S., Vesk, P.A. & Mayfield,
M.M. (2010) Land-use intensification reduces functional redundancy and response diversity in plant
communities. Ecology Letters, 13, 76‒86.
Merritt, D.M., Scott, M.L., Poff, N.L., Auble, G.T. & Lytle, D.A. (2010) Theory, methods and tools for
determining environmental flows for riparian vegetation: riparian vegetation-flow response guilds.
Freshwater Biology, 55, 206‒225.
Miller, K.A., Webb, J.A., de Little, S.C. and Stewardson, M.J. (2013). Environmental flows can
reduce the encroachment of terrestrial vegetation into river channels: a systematic literature review.
Environmental Management, 52, 1202-1212.
Poff, N. L. and Zimmerman, J. K. H. (2010), Ecological responses to altered flow regimes: a
literature review to inform the science and management of environmental flows. Freshwater
Biology, 55: 194–205.
Webb, J.A., Little, S.C., Miller, K.A., Stewardson, M.J., Rutherfurd, I.D., Sharpe, A.K., Patulny, L.
and Poff, N.L. (2015). A general approach to predicting ecological responses to environmental
flows: making best use of the literature, expert knowledge, and monitoring data. River Research
and Applications, 31(4), pp.505-514.
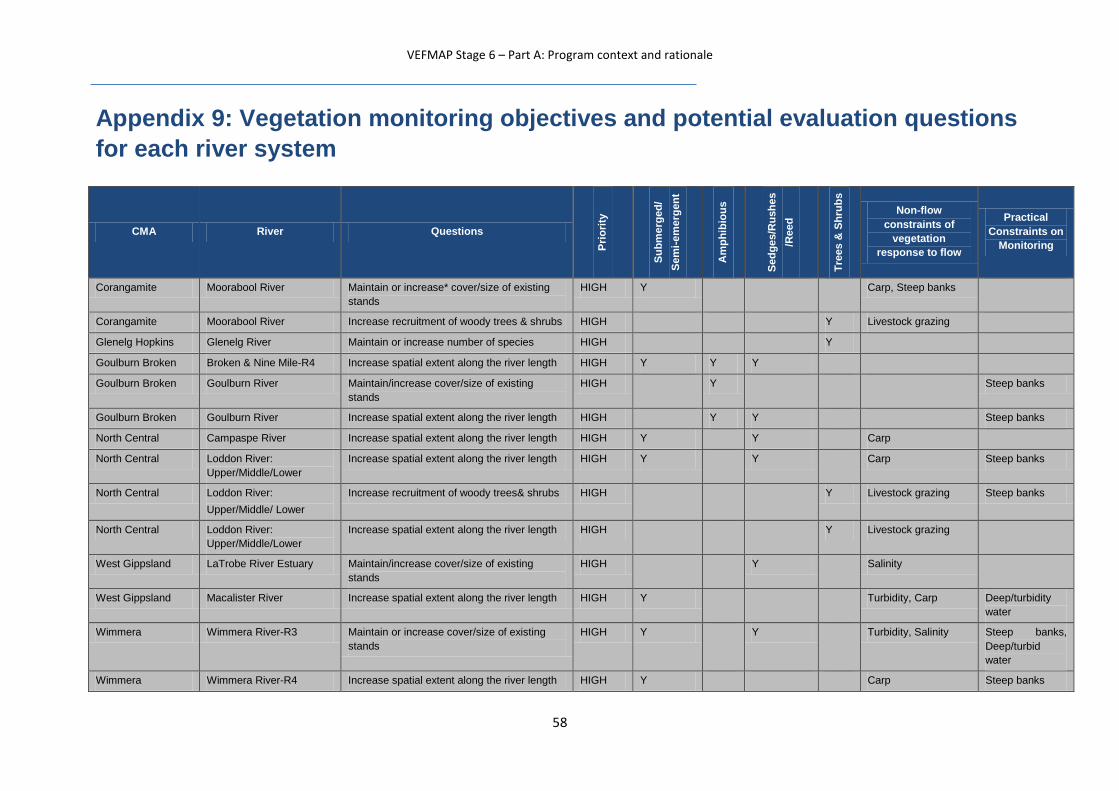
VEFMAP Stage 6 – Part A: Program context and rationale
58
Appendix 9: Vegetation monitoring objectives and potential evaluation questions
for each river system
CMA River Questions
Pri
ori
ty
Su
bm
erg
ed
/
Sem
i-em
erg
en
t
Am
ph
ibio
us
Sed
ge
s/R
ush
es
/Reed
Tre
es &
Sh
rub
s
Non-flow
constraints of
vegetation
response to flow
Practical
Constraints on
Monitoring
Corangamite Moorabool River Maintain or increase* cover/size of existing
stands
HIGH Y Carp, Steep banks
Corangamite Moorabool River Increase recruitment of woody trees & shrubs HIGH Y Livestock grazing
Glenelg Hopkins Glenelg River Maintain or increase number of species HIGH Y
Goulburn Broken Broken & Nine Mile-R4 Increase spatial extent along the river length HIGH Y Y Y
Goulburn Broken Goulburn River Maintain/increase cover/size of existing
stands
HIGH Y Steep banks
Goulburn Broken Goulburn River Increase spatial extent along the river length HIGH Y Y Steep banks
North Central Campaspe River Increase spatial extent along the river length HIGH Y Y Carp
North Central Loddon River:
Upper/Middle/Lower
Increase spatial extent along the river length HIGH Y Y Carp Steep banks
North Central Loddon River:
Upper/Middle/ Lower
Increase recruitment of woody trees& shrubs HIGH Y Livestock grazing Steep banks
North Central Loddon River:
Upper/Middle/Lower
Increase spatial extent along the river length HIGH Y Livestock grazing
West Gippsland LaTrobe River Estuary Maintain/increase cover/size of existing
stands
HIGH Y Salinity
West Gippsland Macalister River Increase spatial extent along the river length HIGH Y Turbidity, Carp Deep/turbidity
water
Wimmera Wimmera River-R3 Maintain or increase cover/size of existing
stands
HIGH Y Y Turbidity, Salinity Steep banks,
Deep/turbid
water
Wimmera Wimmera River-R4 Increase spatial extent along the river length HIGH Y Carp Steep banks
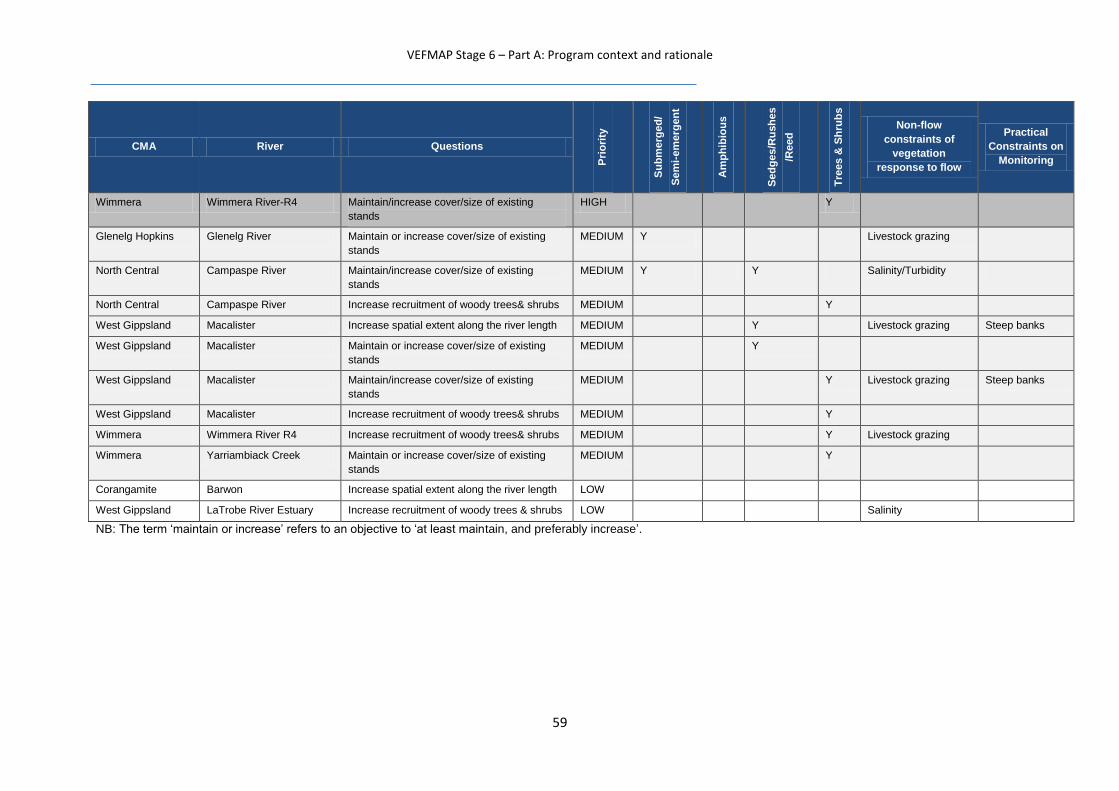
VEFMAP Stage 6 – Part A: Program context and rationale
59
CMA River Questions
Pri
ori
ty
Su
bm
erg
ed
/
Sem
i-em
erg
en
t
Am
ph
ibio
us
Sed
ge
s/R
ush
es
/Reed
Tre
es &
Sh
rub
s
Non-flow
constraints of
vegetation
response to flow
Practical
Constraints on
Monitoring
Wimmera Wimmera River-R4 Maintain/increase cover/size of existing
stands
HIGH Y
Glenelg Hopkins Glenelg River Maintain or increase cover/size of existing
stands
MEDIUM Y Livestock grazing
North Central Campaspe River Maintain/increase cover/size of existing
stands
MEDIUM Y Y Salinity/Turbidity
North Central Campaspe River Increase recruitment of woody trees& shrubs MEDIUM Y
West Gippsland Macalister Increase spatial extent along the river length MEDIUM Y Livestock grazing Steep banks
West Gippsland Macalister Maintain or increase cover/size of existing
stands
MEDIUM Y
West Gippsland Macalister Maintain/increase cover/size of existing
stands
MEDIUM Y Livestock grazing Steep banks
West Gippsland Macalister Increase recruitment of woody trees& shrubs MEDIUM Y
Wimmera Wimmera River R4 Increase recruitment of woody trees& shrubs MEDIUM Y Livestock grazing
Wimmera Yarriambiack Creek Maintain or increase cover/size of existing
stands
MEDIUM Y
Corangamite Barwon Increase spatial extent along the river length LOW
West Gippsland LaTrobe River Estuary Increase recruitment of woody trees & shrubs LOW Salinity
NB: The term ‘maintain or increase’ refers to an objective to ‘at least maintain, and preferably increase’.
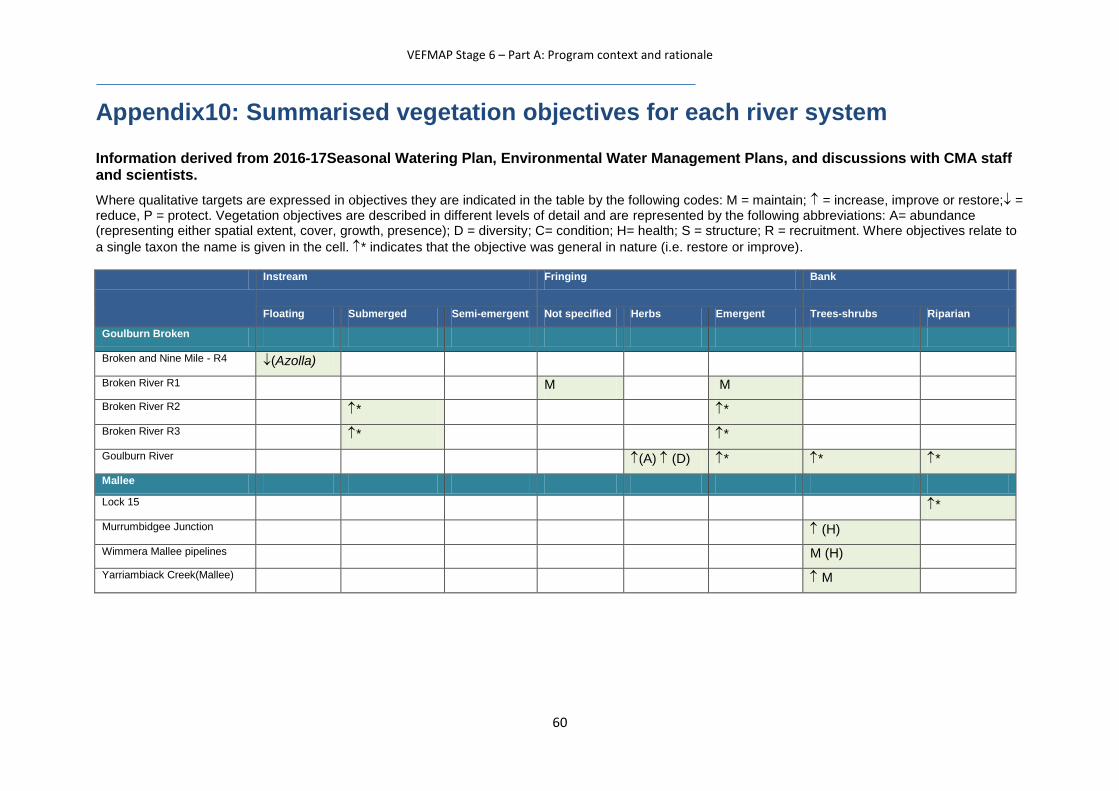
VEFMAP Stage 6 – Part A: Program context and rationale
60
Appendix10: Summarised vegetation objectives for each river system
Information derived from 2016-17Seasonal Watering Plan, Environmental Water Management Plans, and discussions with CMA staff and scientists.
Where qualitative targets are expressed in objectives they are indicated in the table by the following codes: M = maintain; = increase, improve or restore; = reduce, P = protect. Vegetation objectives are described in different levels of detail and are represented by the following abbreviations: A= abundance (representing either spatial extent, cover, growth, presence); D = diversity; C= condition; H= health; S = structure; R = recruitment. Where objectives relate to
a single taxon the name is given in the cell. * indicates that the objective was general in nature (i.e. restore or improve).
Instream Fringing Bank
Floating Submerged Semi-emergent Not specified Herbs Emergent Trees-shrubs Riparian
Goulburn Broken
Broken and Nine Mile - R4 (Azolla)
Broken River R1 M M
Broken River R2 * *
Broken River R3 * *
Goulburn River (A) (D) * * *
Mallee
Lock 15 *
Murrumbidgee Junction (H)
Wimmera Mallee pipelines M (H)
Yarriambiack Creek(Mallee) M
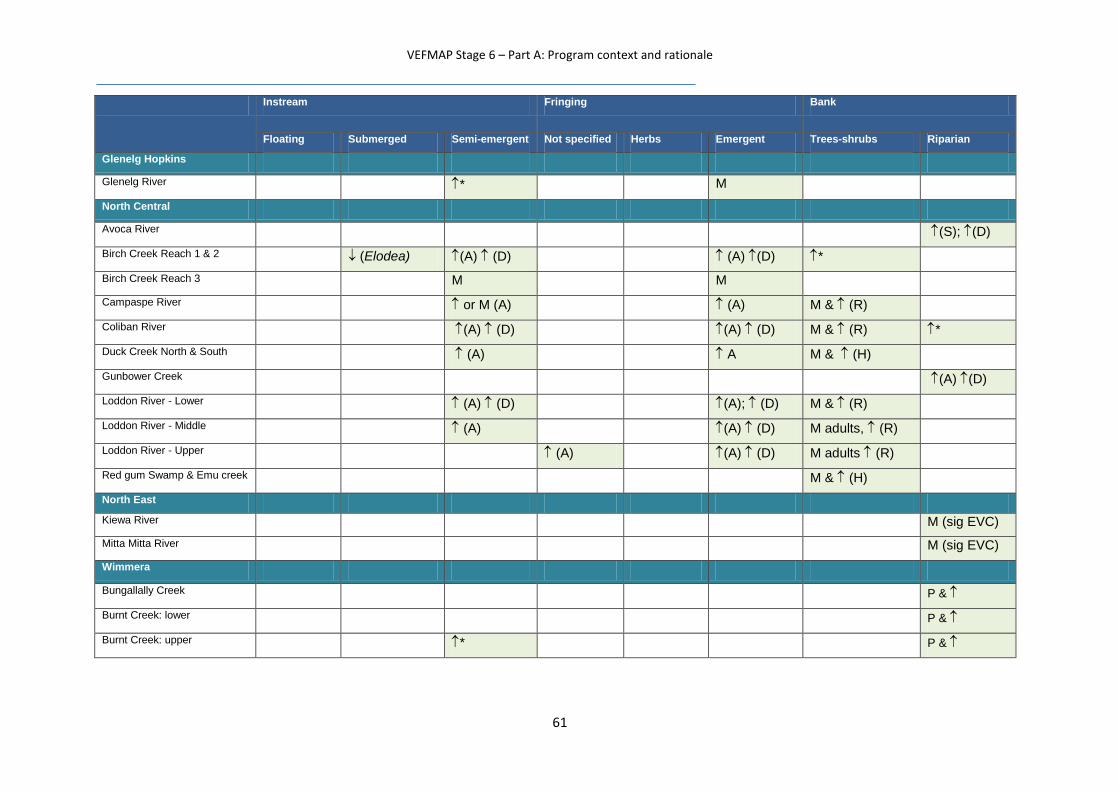
VEFMAP Stage 6 – Part A: Program context and rationale
61
Instream Fringing Bank
Floating Submerged Semi-emergent Not specified Herbs Emergent Trees-shrubs Riparian
Glenelg Hopkins
Glenelg River * M
North Central
Avoca River (S); (D)
Birch Creek Reach 1 & 2 (Elodea) (A) (D) (A) (D) *
Birch Creek Reach 3 M M
Campaspe River or M (A) (A) M & (R)
Coliban River (A) (D) (A) (D) M & (R) *
Duck Creek North & South (A) A M & (H)
Gunbower Creek (A) (D)
Loddon River - Lower (A) (D) (A); (D) M & (R)
Loddon River - Middle (A) (A) (D) M adults, (R)
Loddon River - Upper (A) (A) (D) M adults (R)
Red gum Swamp & Emu creek M & (H)
North East
Kiewa River M (sig EVC)
Mitta Mitta River M (sig EVC)
Wimmera
Bungallally Creek P &
Burnt Creek: lower P &
Burnt Creek: upper * P &
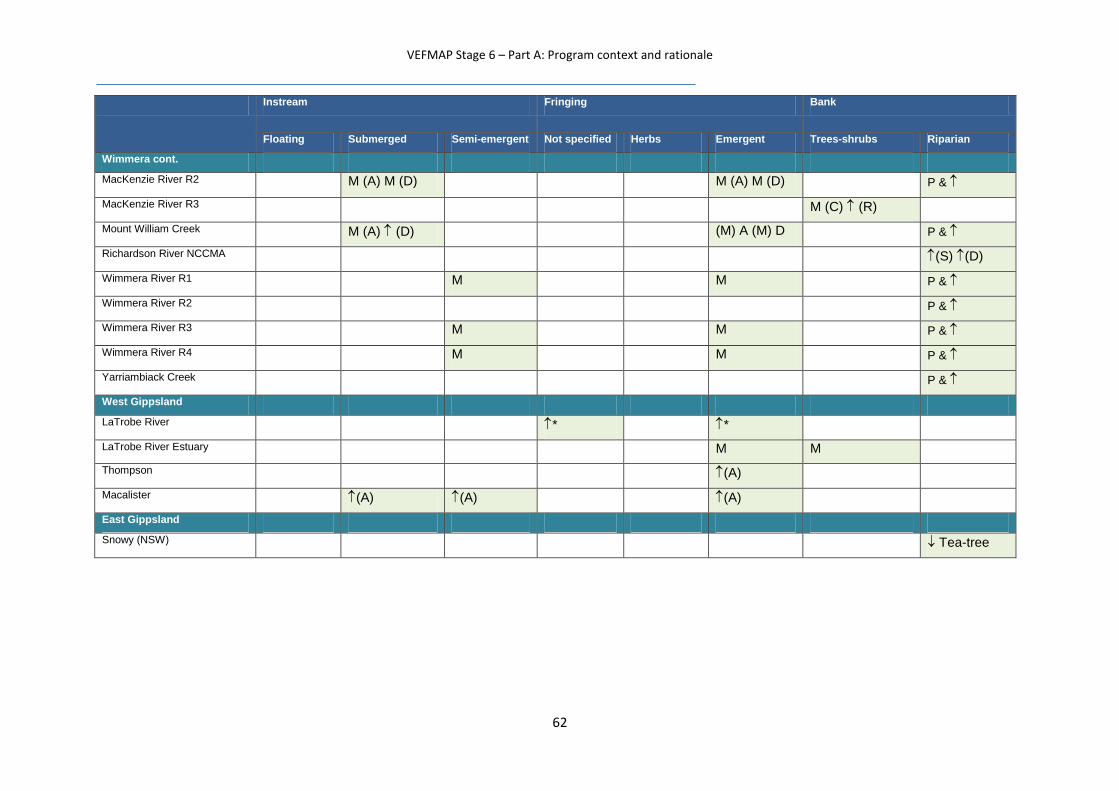
VEFMAP Stage 6 – Part A: Program context and rationale
62
Instream Fringing Bank
Floating Submerged Semi-emergent Not specified Herbs Emergent Trees-shrubs Riparian
Wimmera cont.
MacKenzie River R2 M (A) M (D) M (A) M (D) P &
MacKenzie River R3 M (C) (R)
Mount William Creek M (A) (D) (M) A (M) D P &
Richardson River NCCMA (S) (D)
Wimmera River R1 M M P &
Wimmera River R2 P &
Wimmera River R3 M M P &
Wimmera River R4 M M P &
Yarriambiack Creek P &
West Gippsland
LaTrobe River * *
LaTrobe River Estuary M M
Thompson (A)
Macalister (A) (A) (A)
East Gippsland
Snowy (NSW) Tea-tree
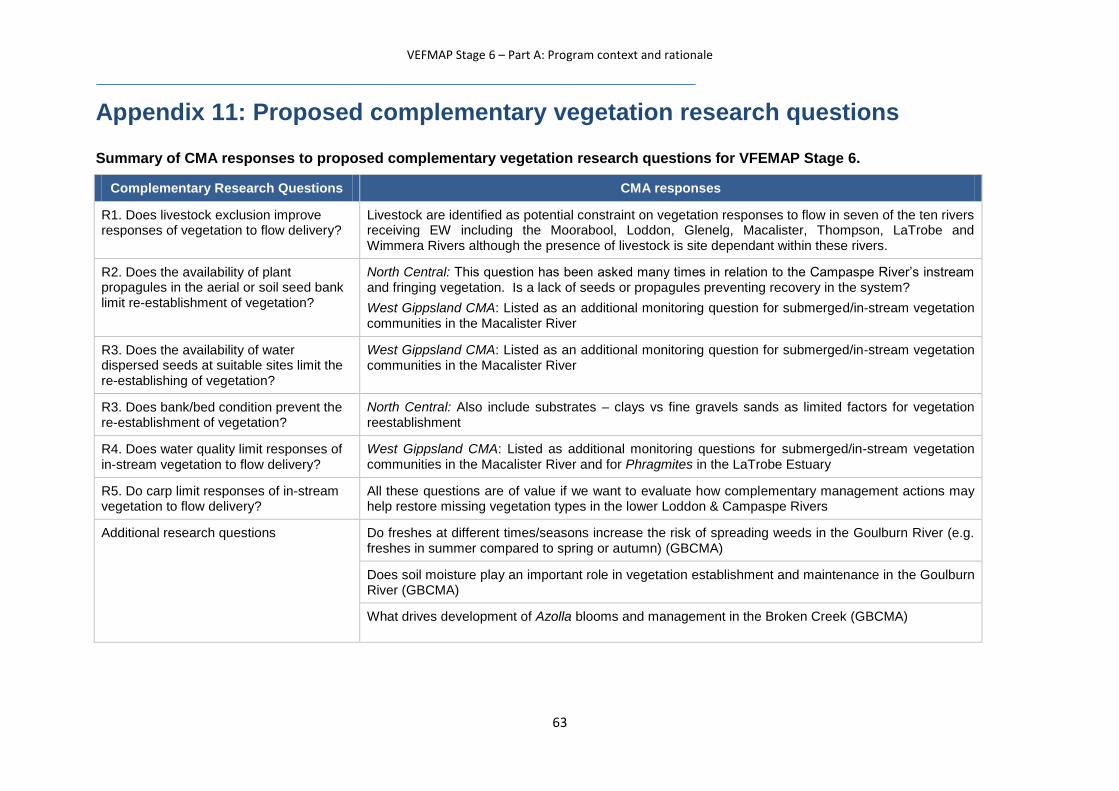
VEFMAP Stage 6 – Part A: Program context and rationale
63
Appendix 11: Proposed complementary vegetation research questions
Summary of CMA responses to proposed complementary vegetation research questions for VFEMAP Stage 6.
Complementary Research Questions CMA responses
R1. Does livestock exclusion improve responses of vegetation to flow delivery?
Livestock are identified as potential constraint on vegetation responses to flow in seven of the ten rivers receiving EW including the Moorabool, Loddon, Glenelg, Macalister, Thompson, LaTrobe and Wimmera Rivers although the presence of livestock is site dependant within these rivers.
R2. Does the availability of plant propagules in the aerial or soil seed bank limit re-establishment of vegetation?
North Central: This question has been asked many times in relation to the Campaspe River’s instream and fringing vegetation. Is a lack of seeds or propagules preventing recovery in the system?
West Gippsland CMA: Listed as an additional monitoring question for submerged/in-stream vegetation communities in the Macalister River
R3. Does the availability of water dispersed seeds at suitable sites limit the re-establishing of vegetation?
West Gippsland CMA: Listed as an additional monitoring question for submerged/in-stream vegetation communities in the Macalister River
R3. Does bank/bed condition prevent the re-establishment of vegetation?
North Central: Also include substrates – clays vs fine gravels sands as limited factors for vegetation reestablishment
R4. Does water quality limit responses of in-stream vegetation to flow delivery?
West Gippsland CMA: Listed as additional monitoring questions for submerged/in-stream vegetation communities in the Macalister River and for Phragmites in the LaTrobe Estuary
R5. Do carp limit responses of in-stream vegetation to flow delivery?
All these questions are of value if we want to evaluate how complementary management actions may help restore missing vegetation types in the lower Loddon & Campaspe Rivers
Additional research questions
Do freshes at different times/seasons increase the risk of spreading weeds in the Goulburn River (e.g. freshes in summer compared to spring or autumn) (GBCMA)
Does soil moisture play an important role in vegetation establishment and maintenance in the Goulburn River (GBCMA)
What drives development of Azolla blooms and management in the Broken Creek (GBCMA)