Embed Size (px)
Citation preview

Report on Compliance with Part 5 of the Disability Act 2005 for 2015

2
Report on Compliance with Part 5 of the Disability Act 2005 for 2015 1
Executive Summary 3
1 Introduction 4
2 Main Findings for 2015 6
3. Monitoring and Compliance 12
Appendix A – Government Departments 15
Appendix B – Public bodies 16
Appendix C – Staff census response rates 2015 28
3
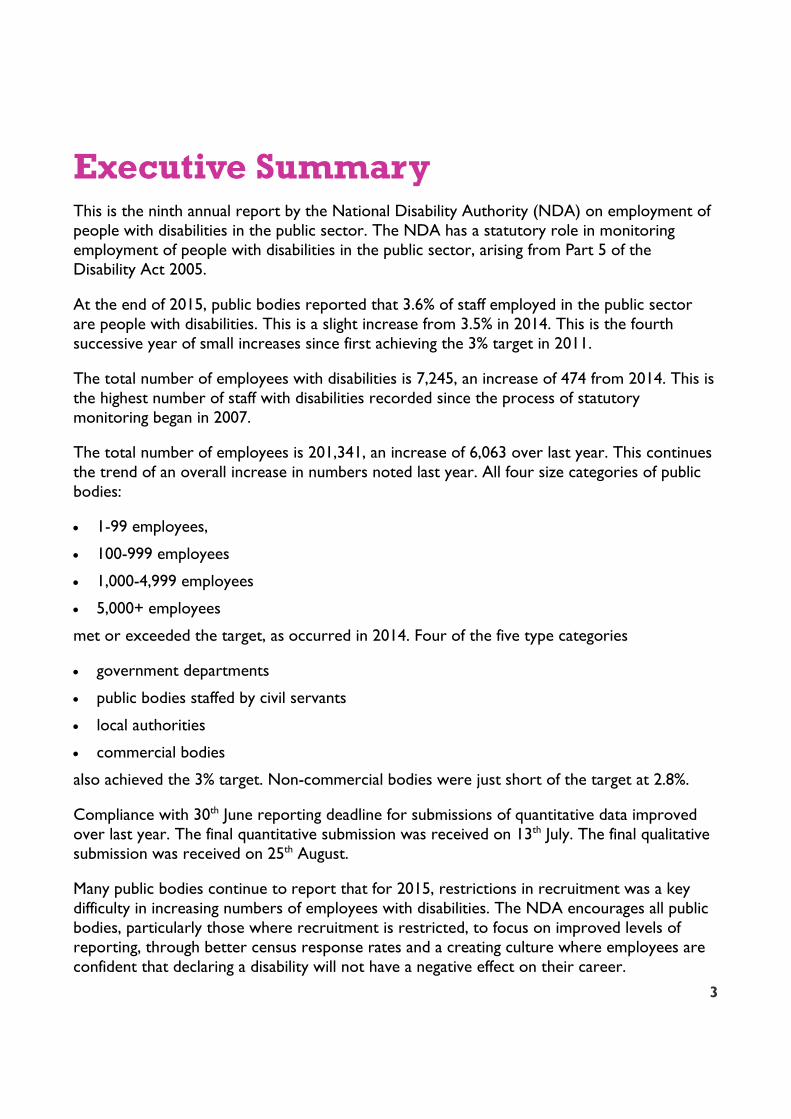
Executive Summary This is the ninth annual report by the National Disability Authority (NDA) on employment of people with disabilities in the public sector. The NDA has a statutory role in monitoring employment of people with disabilities in the public sector, arising from Part 5 of the Disability Act 2005.
At the end of 2015, public bodies reported that 3.6% of staff employed in the public sector are people with disabilities. This is a slight increase from 3.5% in 2014. This is the fourth successive year of small increases since first achieving the 3% target in 2011.
The total number of employees with disabilities is 7,245, an increase of 474 from 2014. This is the highest number of staff with disabilities recorded since the process of statutory monitoring began in 2007.
The total number of employees is 201,341, an increase of 6,063 over last year. This continues the trend of an overall increase in numbers noted last year. All four size categories of public bodies:
1-99 employees,
100-999 employees
1,000-4,999 employees
5,000+ employees
met or exceeded the target, as occurred in 2014. Four of the five type categories
government departments
public bodies staffed by civil servants
local authorities
commercial bodies
also achieved the 3% target. Non-commercial bodies were just short of the target at 2.8%.
Compliance with 30th June reporting deadline for submissions of quantitative data improved over last year. The final quantitative submission was received on 13th July. The final qualitative submission was received on 25th August.
Many public bodies continue to report that for 2015, restrictions in recruitment was a key difficulty in increasing numbers of employees with disabilities. The NDA encourages all public bodies, particularly those where recruitment is restricted, to focus on improved levels of reporting, through better census response rates and a creating culture where employees are confident that declaring a disability will not have a negative effect on their career.
4
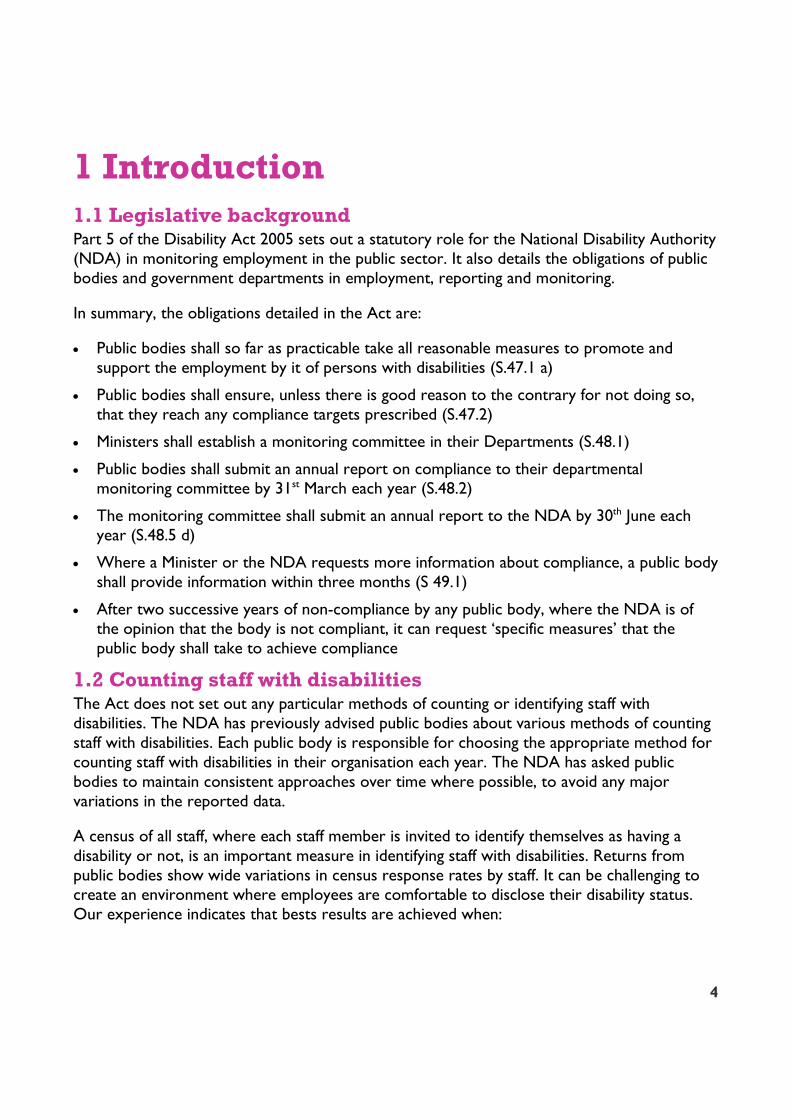
1 Introduction 1.1 Legislative background Part 5 of the Disability Act 2005 sets out a statutory role for the National Disability Authority (NDA) in monitoring employment in the public sector. It also details the obligations of public bodies and government departments in employment, reporting and monitoring.
In summary, the obligations detailed in the Act are:
Public bodies shall so far as practicable take all reasonable measures to promote and support the employment by it of persons with disabilities (S.47.1 a)
Public bodies shall ensure, unless there is good reason to the contrary for not doing so, that they reach any compliance targets prescribed (S.47.2)
Ministers shall establish a monitoring committee in their Departments (S.48.1)
Public bodies shall submit an annual report on compliance to their departmental monitoring committee by 31st March each year (S.48.2)
The monitoring committee shall submit an annual report to the NDA by 30th June each year (S.48.5 d)
Where a Minister or the NDA requests more information about compliance, a public body shall provide information within three months (S 49.1)
After two successive years of non-compliance by any public body, where the NDA is of the opinion that the body is not compliant, it can request ‘specific measures’ that the public body shall take to achieve compliance
1.2 Counting staff with disabilities The Act does not set out any particular methods of counting or identifying staff with disabilities. The NDA has previously advised public bodies about various methods of counting staff with disabilities. Each public body is responsible for choosing the appropriate method for counting staff with disabilities in their organisation each year. The NDA has asked public bodies to maintain consistent approaches over time where possible, to avoid any major variations in the reported data.
A census of all staff, where each staff member is invited to identify themselves as having a disability or not, is an important measure in identifying staff with disabilities. Returns from public bodies show wide variations in census response rates by staff. It can be challenging to create an environment where employees are comfortable to disclose their disability status. Our experience indicates that bests results are achieved when:

5
The census is accompanied with a broad programme of communication around the reasons for the census, the security of the information provided and the benefits for employees and the organisation as a whole. Partnership with trade unions and other stakeholders can be helpful.
The employer creates a culture and environment where the employee is comfortable that declaring their disability to their employer will not have any negative impacts for their employment.
It is not always necessary to carry out a full census every year. Some public bodies will carry out a census periodically, and use HR records of joiners, leavers and requests for reasonable accommodations to identify changes in intermediate years, with appropriate data protection measures in place. Where a census has not taken place for a number of years, it can be a useful tool in itself to highlight the importance of employment of people with disabilities.
1.3 Promoting and supporting employment The NDA would generally expect to see public bodies taking measures such as these to promote and support employment of people with disabilities:
Setting a strategic target of achieving or exceeding the 3% target within a HR strategy or a workforce plan
Ensuring a good response rate to an employee census by creating a culture where employees are confident that declaring their disability status will have no negative impacts for their employment
Ensuring that recruitment policy and processes treat people with disabilities fairly, and allow for non-traditional ways for people to demonstrate their abilities
Ensuring that interview panel members have been trained to ensure appropriate approaches to disability matters during interviews
Providing appropriate accommodations to existing or new staff to allow them to do their job, including changes to procedures, communications, physical environment and technology
Providing disability equality training to staff at all levels, including those responsible for policy development and human resources management
The NDA understands that the public sector employment moratorium has made it difficult or impossible for many public sector bodies to recruit more people with disabilities in recent years. Even with no recruitment, public bodies can improve compliance by changing the culture and improving supports to existing staff. We are hopeful that improving economic conditions will provide more employment opportunities for people with disabilities and others over the coming years.
6
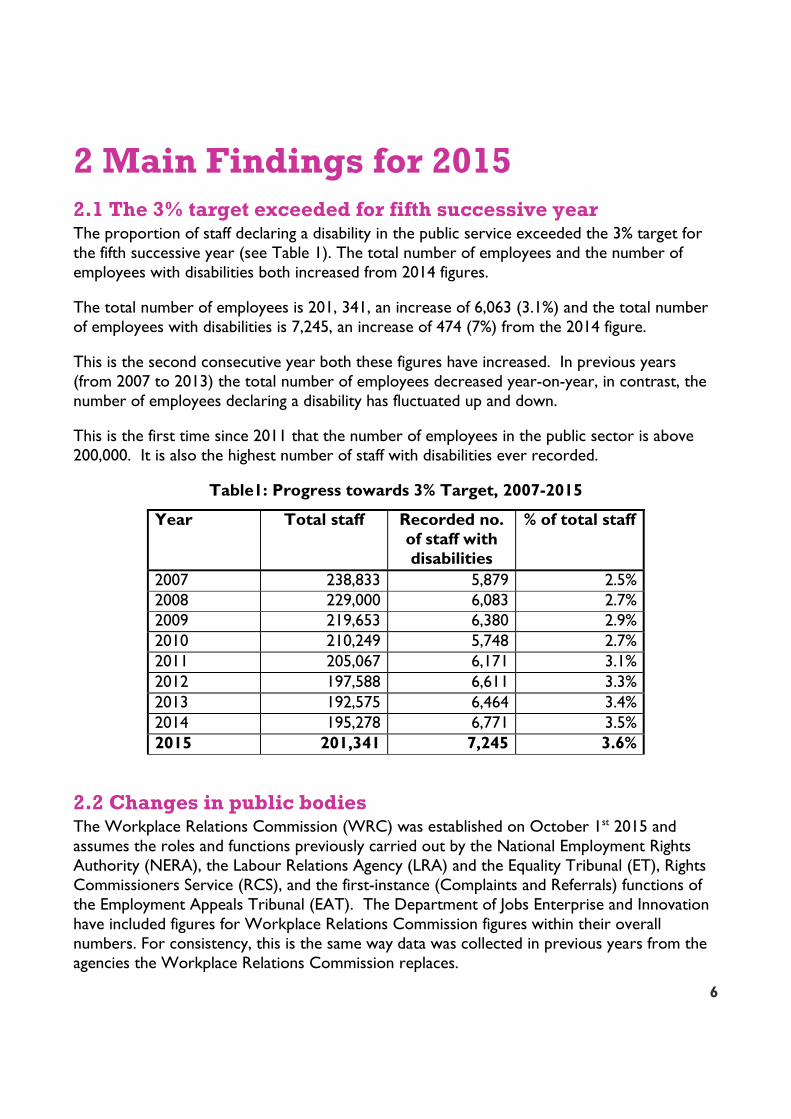
2 Main Findings for 2015 2.1 The 3% target exceeded for fifth successive year The proportion of staff declaring a disability in the public service exceeded the 3% target for the fifth successive year (see Table 1). The total number of employees and the number of employees with disabilities both increased from 2014 figures.
The total number of employees is 201, 341, an increase of 6,063 (3.1%) and the total number of employees with disabilities is 7,245, an increase of 474 (7%) from the 2014 figure.
This is the second consecutive year both these figures have increased. In previous years (from 2007 to 2013) the total number of employees decreased year-on-year, in contrast, the number of employees declaring a disability has fluctuated up and down.
This is the first time since 2011 that the number of employees in the public sector is above 200,000. It is also the highest number of staff with disabilities ever recorded.
Table1: Progress towards 3% Target, 2007-2015
Year Total staff Recorded no. of staff with disabilities
% of total staff
2007 238,833 5,879 2.5% 2008 229,000 6,083 2.7% 2009 219,653 6,380 2.9% 2010 210,249 5,748 2.7% 2011 205,067 6,171 3.1% 2012 197,588 6,611 3.3% 2013 192,575 6,464 3.4% 2014 195,278 6,771 3.5% 2015 201,341 7,245 3.6%
2.2 Changes in public bodies The Workplace Relations Commission (WRC) was established on October 1st 2015 and assumes the roles and functions previously carried out by the National Employment Rights Authority (NERA), the Labour Relations Agency (LRA) and the Equality Tribunal (ET), Rights Commissioners Service (RCS), and the first-instance (Complaints and Referrals) functions of the Employment Appeals Tribunal (EAT). The Department of Jobs Enterprise and Innovation have included figures for Workplace Relations Commission figures within their overall numbers. For consistency, this is the same way data was collected in previous years from the agencies the Workplace Relations Commission replaces.

7
Sport Ireland is a new agency resulting from a merger between the National Sports Campus Development Authority and Irish sports council in October 2015.
Ervia moved to the department of Housing, Planning, Community and Local Government in 2015. Previously it was under the Department of Communications, Climate Action and Environment.
Finally, there are three departments with new names, they are:
Department of Arts, Heritage, Regional, Rural and Gaeltacht Affairs
Department of Communications, Climate Action and Environment
Department of Housing, Planning, Community and Local Government
2.3 Analysis by type of public sector body The 2015 data has been categorised into the same five types of public bodies used in previous years:
• commercial bodies,
• government departments,
• local government bodies,
• non-commercial public bodies and
• public bodies staffed by civil servants.
Commercial Bodies The commercial bodies sector includes the state’s transport and energy companies and in 2015 accounted for 18.5% of the public sector workforce. The data for 2015 shows the overall staff numbers increased by 938 to 37,206 and the number of employees reporting a disability increased by 55 to 1,581 (4.2%). Some of this increase may be due to bodies changing their counting procedures. For example, Bord Na gCon declared their overall staff numbers as the full time equivalent up to and including 2014, whereas in 2015 they declared actual headcount numbers, including seasonal staff. This resulted in an increase of 331 overall staff numbers declared by Bord Na gCon from 175 in 2014 to 506 in 2015.
In total 76.7% of bodies in this category achieved the target, an increase from the 2014 figure of 67.7% (see Table 2).
Government Departments Government departments account for about one in ten public sector employees. In 2015 there were 20,286 employees of whom 4.5% (916) reported a disability; this shows an increase of 152 compared to 2014 figures. All 17 departments exceeded the 3% target for the fourth year in a row.
8
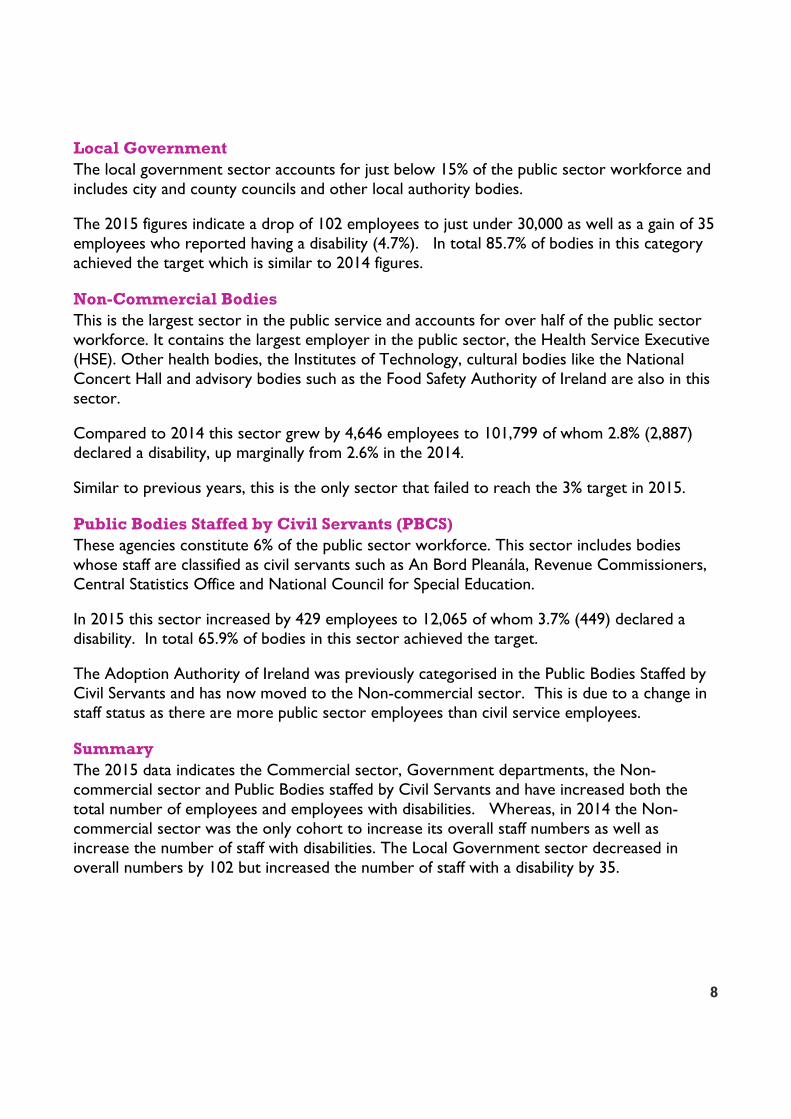
Local Government The local government sector accounts for just below 15% of the public sector workforce and includes city and county councils and other local authority bodies.
The 2015 figures indicate a drop of 102 employees to just under 30,000 as well as a gain of 35 employees who reported having a disability (4.7%). In total 85.7% of bodies in this category achieved the target which is similar to 2014 figures.
Non-Commercial Bodies This is the largest sector in the public service and accounts for over half of the public sector workforce. It contains the largest employer in the public sector, the Health Service Executive (HSE). Other health bodies, the Institutes of Technology, cultural bodies like the National Concert Hall and advisory bodies such as the Food Safety Authority of Ireland are also in this sector.
Compared to 2014 this sector grew by 4,646 employees to 101,799 of whom 2.8% (2,887) declared a disability, up marginally from 2.6% in the 2014.
Similar to previous years, this is the only sector that failed to reach the 3% target in 2015.
Public Bodies Staffed by Civil Servants (PBCS) These agencies constitute 6% of the public sector workforce. This sector includes bodies whose staff are classified as civil servants such as An Bord Pleanála, Revenue Commissioners, Central Statistics Office and National Council for Special Education.
In 2015 this sector increased by 429 employees to 12,065 of whom 3.7% (449) declared a disability. In total 65.9% of bodies in this sector achieved the target.
The Adoption Authority of Ireland was previously categorised in the Public Bodies Staffed by Civil Servants and has now moved to the Non-commercial sector. This is due to a change in staff status as there are more public sector employees than civil service employees.
Summary The 2015 data indicates the Commercial sector, Government departments, the Non-commercial sector and Public Bodies staffed by Civil Servants and have increased both the total number of employees and employees with disabilities. Whereas, in 2014 the Non-commercial sector was the only cohort to increase its overall staff numbers as well as increase the number of staff with disabilities. The Local Government sector decreased in overall numbers by 102 but increased the number of staff with a disability by 35.

9
Table 2: Data by type of public body 2013, 2014
Type of public sector body
Total staff
No. of staff with
disabilities
% of staff with
disabilities
% of total
work-force
% of bodies
achieving target
No. of Public Bodies
Commercial 2015 37,206 1,581 4.2% 18.5% 76.7% 30 Commercial 2014 36,268 1,526 4.2% 18.6% 67.7% 31 Change 2014/15 +938 +55 - -0.1% +9% -1 Gov Dept. 2015 20,286 916 4.5% 10.1% 100.0% 17 Gov Dept. 2014 20,134 874 4.3% 10.3% 100.0% 17 Change 2014/15 +152 +42 +0.2% -0.2% - - Local Gov 2015 29,985 1,412 4.7% 14.9% 85.7% 35 Local Gov 2014 30,087 1,377 4.6% 15.4% 85.3% 34 Change 2014/15 -102 +35 +0.1% -0.5% +0.4% +1 Non-comm. 2015 101,799 2,887 2.8% 50.6% 67.0% 97 Non-comm.2014 97,153 2,574 2.6% 49.8% 61.2% 98 Change 2014/15 +4,646 +313 -0.2% +0.8% +5.8% -1 PBCS 2015 12,065 449 3.7% 6.0% 65.9% 41 PBCS 2014 11,636 420 3.6% 6.0% 65.1% 43 Change 2014/15 +429 +29 +0.1% - -0.8% -2 Totals 2015 201,341 7,245 3.6% 100% 73.6% 220 Totals 2014 195,278 6,771 3.5% 100% 69.5% 223 Change 2014/15 +6,063 +474 +0.1% - +4.1% -3
2.4 Analysis by size of public sector body Public bodies with less than 100 staff There are 89 public bodies with less than100 staff in the public sector representing just over 1.6% of the entire workforce. This size category employs 3,143 people, of which 4.5% (142) have declared a disability. This category represents just over 2% of the workforce who has declared a disability (see Table 3).
Public bodies with between 100 and 999 staff This size category has the highest number of public bodies (97) making up just over 20% of the total workforce. In total 40,562 are employed of which 4.2% (1,687) declared a disability. This size category represents 23% of the workforce who have declared a disability.

10
Public bodies with between 1000 and 4999 staff There are 28 public bodies employing between 1,000 and 4,999 staff representing just over 30% of the total workforce. This cohort employs 58,021 staff of which 4.1% (2,393) have declared a disability, representing 33% of the workforce who have declared a disability.
Three public bodies in this category did not achieve the 3% target:
Beaumont Hospital 2.5% (2.4% in 2014)
Child and Family Agency (TUSLA) 1.2% (0.6% in 2014)
Waterford IT 2.5% (3.2% in 2014)
Public bodies with over 5,000 staff This size category has the smallest number of public bodies (6) but represents the largest percentage of the total workforce (49.5%). It employs 99,615 staff of which 3% (3,023) have declared a disability. These large public bodies account for just under 42% of all public sector staff who have declared a disability.
The public bodies in this category and their reported percentage of employees with disabilities are:
An Post 5.1% (5.0% in 2014)
Department of Social Protection 5.0% (4.7% in 2014)
Dublin City Council 5.9% (5.6% in 2014)
Electricity Supply Board (ESB) 4.7% ( 5.3% in 2014)
Health Service Executive 2.2% (2.1% in 2014)
Revenue Commissioners 3.2% (2.5% in 2014)
Revenue Commissioners returned to compliance in 2015 after being below the 3% target for the previous three years.
Table 3: Data by size of public body 2015
No. of Staff
No. of Public Bodies
Total Staff
No. of staff with
disabilities
% of staff with
disabilities
% of total workforce
% of workforce
with disabilities
1-99 89 3,143 142 4.5% 1.6% 2.1% 100 -999 97 40,562 1,687 4.2% 20.1% 23.0% 1,000 -4,999 28 58,021 2,393 4.1% 28.8% 33.0% 5,000 + 6 99,615 3,023 3.0% 49.5% 41.7% Total 2014 220 201,341 7,245 3.6% 100% 100%
11
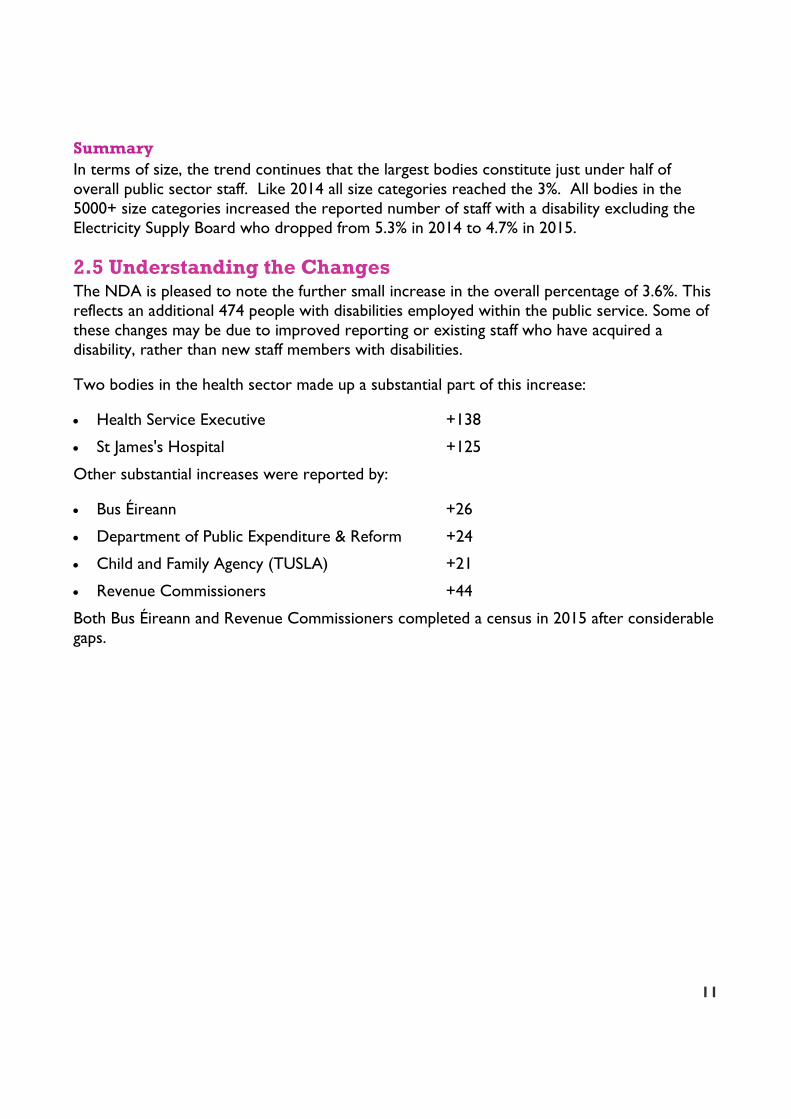
Summary In terms of size, the trend continues that the largest bodies constitute just under half of overall public sector staff. Like 2014 all size categories reached the 3%. All bodies in the 5000+ size categories increased the reported number of staff with a disability excluding the Electricity Supply Board who dropped from 5.3% in 2014 to 4.7% in 2015.
2.5 Understanding the Changes The NDA is pleased to note the further small increase in the overall percentage of 3.6%. This reflects an additional 474 people with disabilities employed within the public service. Some of these changes may be due to improved reporting or existing staff who have acquired a disability, rather than new staff members with disabilities.
Two bodies in the health sector made up a substantial part of this increase:
Health Service Executive +138
St James's Hospital +125
Other substantial increases were reported by:
Bus Éireann +26
Department of Public Expenditure & Reform +24
Child and Family Agency (TUSLA) +21
Revenue Commissioners +44
Both Bus Éireann and Revenue Commissioners completed a census in 2015 after considerable gaps.
12
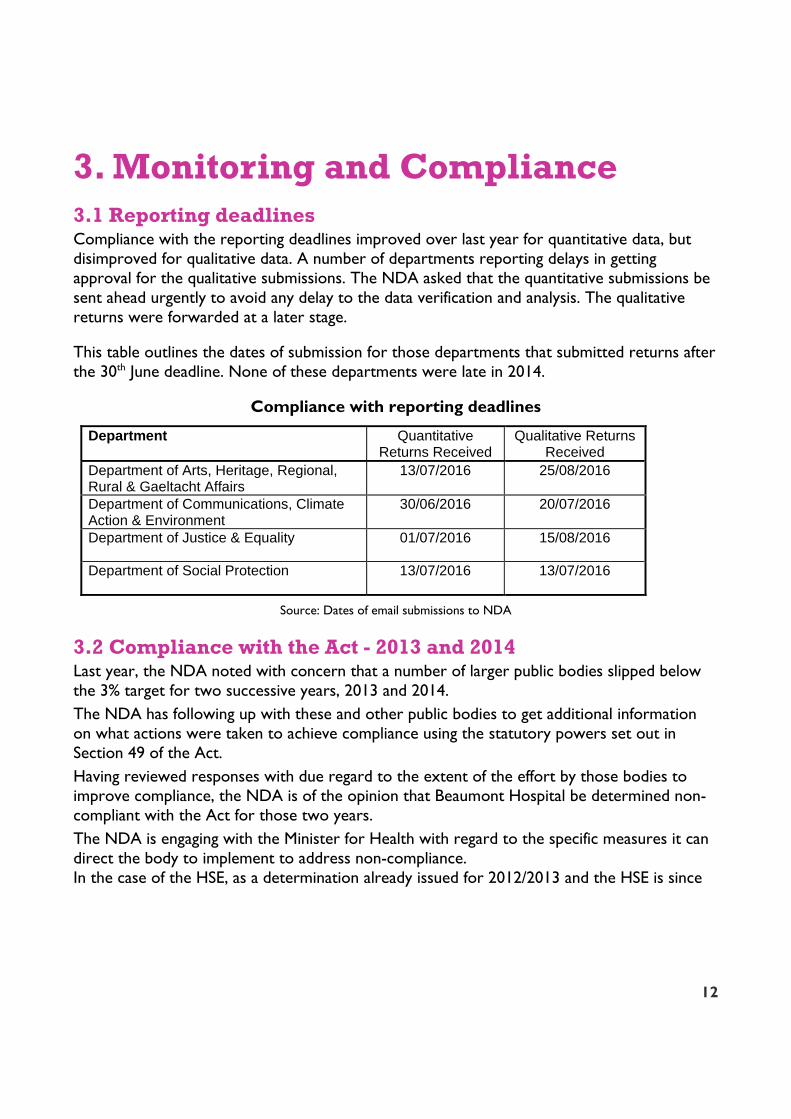
3. Monitoring and Compliance 3.1 Reporting deadlines Compliance with the reporting deadlines improved over last year for quantitative data, but disimproved for qualitative data. A number of departments reporting delays in getting approval for the qualitative submissions. The NDA asked that the quantitative submissions be sent ahead urgently to avoid any delay to the data verification and analysis. The qualitative returns were forwarded at a later stage.
This table outlines the dates of submission for those departments that submitted returns after the 30th June deadline. None of these departments were late in 2014.
Compliance with reporting deadlines
Department Quantitative Returns Received
Qualitative Returns Received
Department of Arts, Heritage, Regional, Rural & Gaeltacht Affairs
13/07/2016 25/08/2016
Department of Communications, Climate Action & Environment
30/06/2016 20/07/2016
Department of Justice & Equality 01/07/2016 15/08/2016
Department of Social Protection 13/07/2016 13/07/2016
Source: Dates of email submissions to NDA
3.2 Compliance with the Act - 2013 and 2014 Last year, the NDA noted with concern that a number of larger public bodies slipped below the 3% target for two successive years, 2013 and 2014. The NDA has following up with these and other public bodies to get additional information on what actions were taken to achieve compliance using the statutory powers set out in Section 49 of the Act. Having reviewed responses with due regard to the extent of the effort by those bodies to improve compliance, the NDA is of the opinion that Beaumont Hospital be determined non-compliant with the Act for those two years. The NDA is engaging with the Minister for Health with regard to the specific measures it can direct the body to implement to address non-compliance. In the case of the HSE, as a determination already issued for 2012/2013 and the HSE is since
13
implementing the measures NDA has directed, this will be borne in mind in considering future determinations.
3.3 Compliance with the Act - 2014 and 2015 The NDA notes that the following substantial public bodies (more than 100 staff) failed to reach the 3% for the last two successive years;
Health Service Executive Child and Family Agency Beaumont Hospital NTMA Enterprise Ireland Irish Blood Transfusion Service Sligo County Council Carlow County Council Oberstown Children Detention Camps
The NDA will be using the statutory powers under Section 49 of the Act to seek further information from these bodies. This will be used to come to a judgement on non-compliance (or otherwise) with the Act.
3.4 Monitoring Committee engagement The NDA noted concerns in the 2014 report about the level of engagement in the statutory process from Departmental Monitoring Committees. These concerns remain, with a lack of consistency in the frequency of committee meetings (if any) and wide disparity in the nature of responses. In some cases, the requested feedback from the Monitoring Committees appear to be direct copies of the returns from public bodies, with no intervening analysis.
Issues Raised Some monitoring committees raised particular issues in their returns that go beyond any one sector and are relevant for all public bodies, including:
whether possible to have a centralised shared Employee Assistance Service to support many public bodies which could deliver cost benefits and consistent approach.
the challenge of disclosure for staff with mental health difficulties and how to best support this as well as ensure a supportive work environment.
that public sector needs to prepare to achieve the higher employment targets arising from the comprehensive employment strategy.
The NDA will continue its role to share information and good practice to assist public bodies to meet their duties. However, the shared Employee Assistance Service is a wider issue that might be considered by the network of HR managers and the Office of Government Procurement.
14
Improving the quality of information supplied There appears to be a variety of views as to what constitutes a ‘census’. For the purposes of this process, the NDA view is that a census takes place when every employee is invited to declare their disability status within any particular year, or at a particular point in the year.
A census is not the only way for a public body to prepare their monitoring committee return. It is quite legitimate for public bodies to review HR records as an alternative to a census, or to supplement a census from earlier years. Our experience would indicate that the holding of a census can be a useful tool to raise awareness of disability in the workplace. Best results will be achieved when a broad process of communication and engagement with stakeholders including staff and trade unions is implement.
Where a full census involving all staff is not held in any particular year, public bodies should respond ‘No’ to question 2.4 ‘Census Held’ and leave questions 2.5 and 2.6 about census responses blank.
3.5 Rounding All calculated percentages are rounded to one decimal place.
3.6 Errata – changes after publishing date There are no changes to the published data at this point.

15
Appendix A – Government Departments
2015 2014
Public Bodies Total
Employment
Employees
with
Disabilities
% of
employees
with
disabilities
Employees
with
Disabilities
% of
employees
with
disabilities
Departments of Agriculture, Food & the Marine 3136 124 4.0% 117 3.7% Arts, Heritage, Regional, Rural & Gaeltacht Affairs 590 18 3.1% 20 3.4% Children & Youth Affairs 160 8 5.0% 11 7.1% Communications, Climate Action & Environment 276 9 3.3% 9 3.4% Defence 354 11 3.1% 16 4.7% Defence - Civilian Employees 499 23 4.6% 25 4.9% Education & Skills 1289 52 4.0% 45 3.5% Finance 304 15 4.9% 11 3.4% Foreign Affairs & Trade 1440 51 3.5% 52 3.6% Health 363 12 3.3% 12 3.3% Housing, Planning, Community & Local Government 758 36 4.7% 35 4.6% Jobs, Enterprise & Innovation 842 48 5.7% 44 5.5% Justice & Equality 1658 84 5.1% 86 5.3% Public Expenditure & Reform 1060 54 5.1% 30 3.4% Social Protection 6878 339 4.9% 327 4.7% Taoiseach 206 11 5.3% 13 6.6% Transport, Tourism & Sport 473 21 4.4% 21 4.6% Grand Total 20286 916 4.5% 874 4.3%

16
Appendix B – Public bodies Public bodies staffed by civil servants report to the Minister for Public Expenditure and Reform.
Department of Agriculture, Food & the Marine
2014 2015
Public Bodies
Total Employment
Employees with
disabilities
% of employees
with disabilities
Employees with disabilities
% of employees
with disabilities
Bord Bia 95 1 1.1% 1 1.1%
Bord Iascaigh Mhara 123 3 2.4% 4 3.3%
Bord na gCon 175 7 4.0% 18 3.6%
Coillte 562 33 5.9% 28 5.1%
Horse Racing Ireland 177 8 4.5% 4 2.3%
Irish National Stud 66 0 0.0% 4 6.2%
Marine Institute 175 8 4.6% 8 4.4%
National Milk Agency 5 0 0.0% 0 0.0%
Sea Fisheries Prot Auth 87 5 5.7% 5 5.6%
Teagasc 1208 46 3.8% 50 4.1%
Veterinary Council of Irl 5 0 0.0% 0 0.0%
Department of Arts, Heritage, Regional, Rural & Gaeltacht Affairs
2014 2015 Public Bodies Total
Employment Employees
with disabilities
% of employees
with disabilities
Employees with disabilities
% of employees
with disabilities
Arts Council 47 1 2.1% 0 0.0%
Chester Beatty Library 30 0 0.0% 0 0.0%
Crawford Art Gallery 18 3 16.7% 2 10.5%
Foras na Gaeilge 47 1 2.1% 2 4.1%
Heritage Council 14 1 7.1% 1 7.1%
Irish Film Board 17 1 5.9% 0 0.0%

17
Irish Museum of Modern Art 66 3 4.5% 6 9.1%
National Concert Hall 89 5 5.6% 5 5.6%
National Gallery of Ireland 108 5 4.6% 5 4.6%
National Library of Ireland 95 8 8.4% 9 9.5%
National Museum of Ireland 150 10 6.7% 10 6.7%
Údarás na Gaeltachta 81 4 4.9% 4 5.0%
Ulster-Scots Agency 17 0 0.0% 0 0.0%
Waterways Ireland 233 9 3.9% 9 3.9%
Department of Children & Youth Affairs
2014 2015 Public Bodies Total
Employment Employees
with disabilities
% of employees
with disabilities
Employees with disabilities
% of employees
with disabilities
Adoption Authority of Ireland 4 18.2%
Child and Family Agency 4035 26 0.6% 47 1.2%
Oberstown Children Det 256 2 0.8% 4 1.6%
Department of Communications, Climate Action & Environment
2014 2015 Public Bodies Total
Employment Employees
with disabilities
% of employees
with disabilities
Employees with
disabilities
% of employees
with disabilities
An Post 8878 444 5.0% 444 5.1%
Bord na Móna 1779 60 3.4% 59 3.3%
Broadcasting Auth of Ireland 35 0 0.0% 1 2.8%
ComReg 110 4 3.6% 4 3.6%
Comm for Energy Regulation 86 8 9.3% 5 5.4%
EirGrid Plc 345 17 4.9% 19 5.2%
Electricity Supply Board (ESB) 5745 302 5.3% 282 4.7%
18
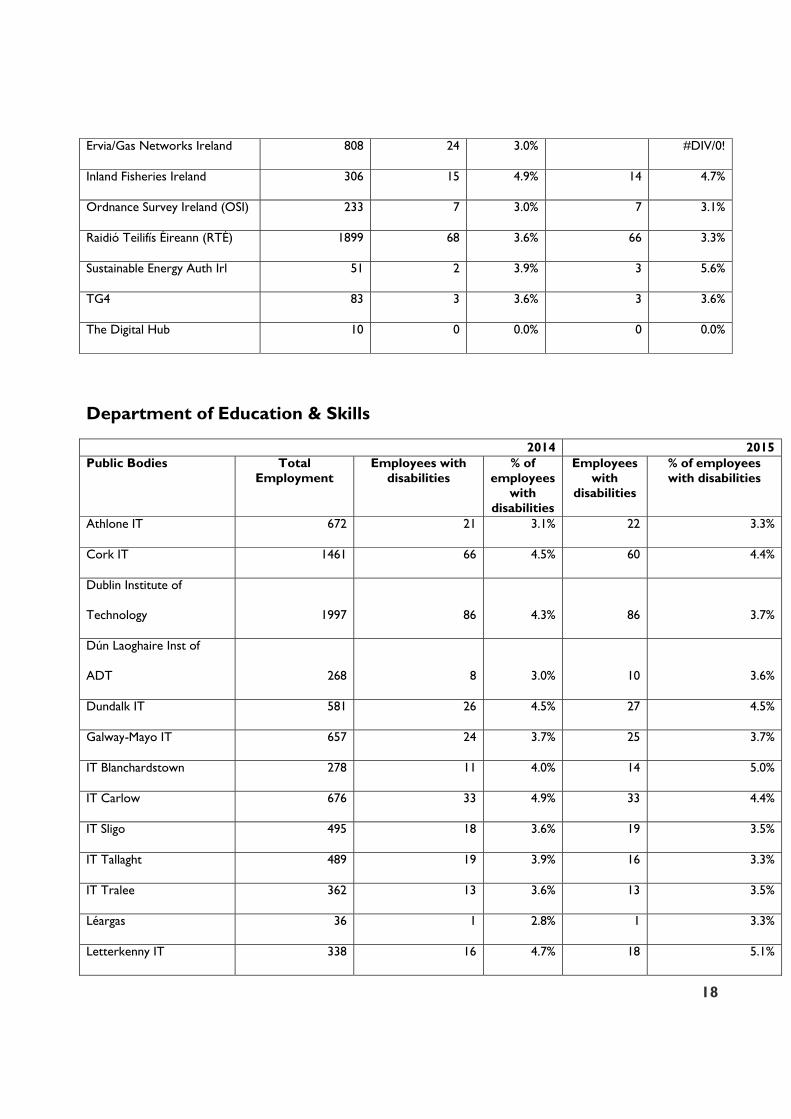
Ervia/Gas Networks Ireland 808 24 3.0% #DIV/0!
Inland Fisheries Ireland 306 15 4.9% 14 4.7%
Ordnance Survey Ireland (OSI) 233 7 3.0% 7 3.1%
Raidió Teilifís Éireann (RTÉ) 1899 68 3.6% 66 3.3%
Sustainable Energy Auth Irl 51 2 3.9% 3 5.6%
TG4 83 3 3.6% 3 3.6%
The Digital Hub 10 0 0.0% 0 0.0%
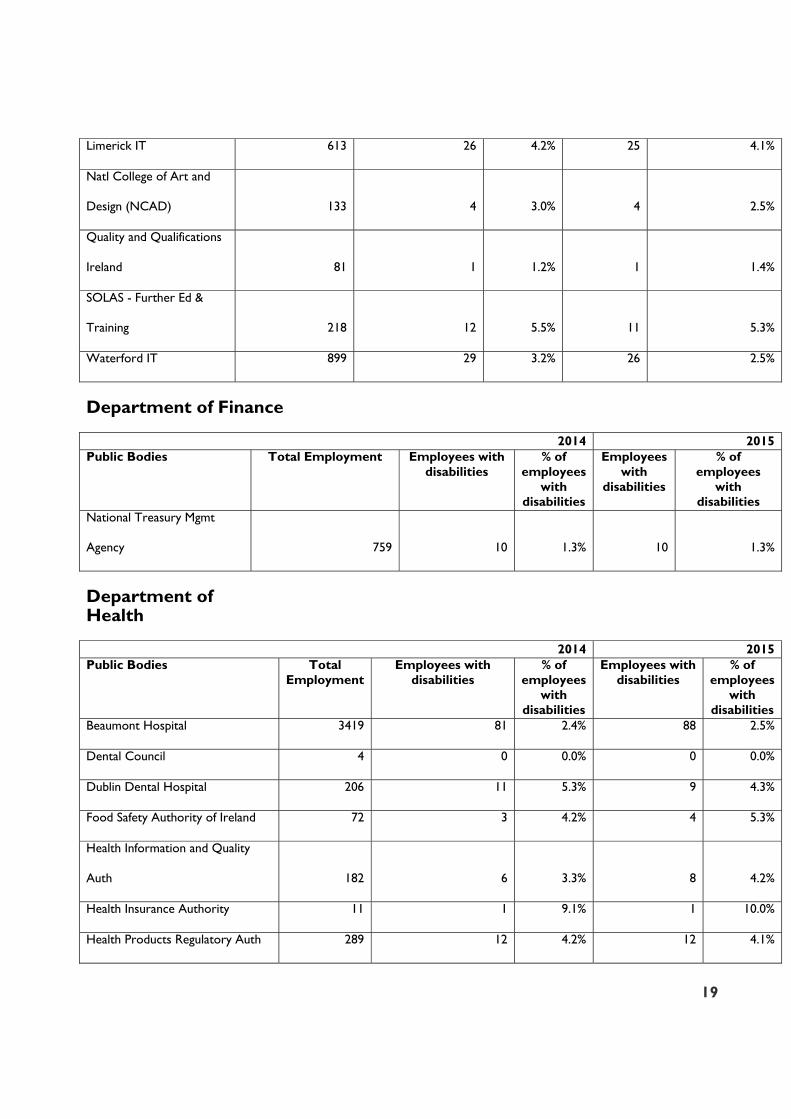
Department of Education & Skills
2014 2015 Public Bodies Total
Employment Employees with
disabilities % of
employees with
disabilities
Employees with
disabilities
% of employees with disabilities
Athlone IT 672 21 3.1% 22 3.3%
Cork IT 1461 66 4.5% 60 4.4%
Dublin Institute of
Technology 1997 86 4.3% 86 3.7%
Dún Laoghaire Inst of
ADT 268 8 3.0% 10 3.6%
Dundalk IT 581 26 4.5% 27 4.5%
Galway-Mayo IT 657 24 3.7% 25 3.7%
IT Blanchardstown 278 11 4.0% 14 5.0%
IT Carlow 676 33 4.9% 33 4.4%
IT Sligo 495 18 3.6% 19 3.5%
IT Tallaght 489 19 3.9% 16 3.3%
IT Tralee 362 13 3.6% 13 3.5%
Léargas 36 1 2.8% 1 3.3%
Letterkenny IT 338 16 4.7% 18 5.1%
19
Limerick IT 613 26 4.2% 25 4.1%
Natl College of Art and
Design (NCAD) 133 4 3.0% 4 2.5%
Quality and Qualifications
Ireland 81 1 1.2% 1 1.4%
SOLAS - Further Ed &
Training 218 12 5.5% 11 5.3%
Waterford IT 899 29 3.2% 26 2.5%
Department of Finance
2014 2015 Public Bodies Total Employment Employees with
disabilities % of
employees with
disabilities
Employees with
disabilities
% of employees
with disabilities
National Treasury Mgmt
Agency 759 10 1.3% 10 1.3%
Department of Health
2014 2015 Public Bodies Total
Employment Employees with
disabilities % of
employees with
disabilities
Employees with disabilities
% of employees
with disabilities
Beaumont Hospital 3419 81 2.4% 88 2.5%
Dental Council 4 0 0.0% 0 0.0%
Dublin Dental Hospital 206 11 5.3% 9 4.3%
Food Safety Authority of Ireland 72 3 4.2% 4 5.3%
Health Information and Quality
Auth 182 6 3.3% 8 4.2%
Health Insurance Authority 11 1 9.1% 1 10.0%
Health Products Regulatory Auth 289 12 4.2% 12 4.1%

20
Health Research Board 59 1 1.7% 1 1.7%
Health Service Executive 61974 1293 2.1% 1431 2.2%
Institute of Public Health 27 1 3.7% 1 4.2%
Irish Blood Transfusion Service 601 16 2.7% 15 2.7%
Leopardstown Park Hospital 228 18 7.9% 18 7.2%
Medical Council 60 1 1.7% 3 4.3%
Mental Health Commission 34 1 2.9% 1 2.9%
National Cancer Registry Ireland 51 3 5.9% 3 5.4%
National Treatment Purchase Fund 48 0 0.0% 2 4.3%
Nursing and Midwifery Board Irl 43 1 2.3% 1 2.6%
Pharmaceutical Society of Ireland 37 1 2.7% 4 10.0%
Pre-Hospital Emerg Care Council 11 0 0.0% 0 0.0%
Safefood 29 1 3.4% 1 3.0%
St James's Hospital 4504 291 6.5% 416 9.2%
The Adelaide and Meath Hospital 3223 107 3.3% 115 3.9%
Voluntary Health Insurance Board 1121 37 3.3% 49 4.2%
Department of Jobs, Enterprise & Innovation
2014 2015 Public Bodies Total
Employment Employees
with disabilities
% of employees
with disabilities
Employees with
disabilities
% of employees
with disabilities
Competition and Consumer Protection Commission 5 7.1%
Enterprise Ireland 645 19 2.9% 16 2.8%
Health & Safety Authority 174 7 4.0% 6 3.4%
IDA Ireland 307 12 3.9% 13 4.2%
InterTrade Ireland 39 1 2.6% 1 2.6%
National Standards Auth Irl 132 6 4.5% 5 3.8%
Personal Injuries Assess Brd 67 0 0.0% 0 0.0%

21
Science Foundation Ireland 49 2 4.1% 2 4.1%
Department of Justice & Equality
2014 2015 Public Bodies Total
Employment Employees with
disabilities % of
employees with
disabilities
Employees with
disabilities
% of employees with disabilities
National Disability Authority 33 7 21.2% 5 16.1%
Department of Public Expenditure & Reform
2014 2015 Public Bodies Total
Employment Employees
with disabilities
% of employees
with disabilities
Employees with
disabilities
% of employees with disabilities
Adoption Authority of Ireland 23 0 0.0%
An Chomhairle um Oideachas
Gaeltachta & Gaelscolaíochta 3 0 0.0% 0 0.0%
An Coimisinéir Teanga 6 0 0.0% 0 0.0%
Army Pensions Board 2 0 0.0% 0 0.0%
Central Statistics Office 697 40 5.7% 49 5.8%
Charities Regulatory Auth 10 0 0.0% 2 10.5%
Chief State Solicitor's Office 8 3.2%
Civil Defence Ireland 28 4 14.3% 4 14.3%
Competition and Consumer
Protection Commission 78 4 5.1%
Data Protection Comm 28 3 10.7% 3 6.8%
Defence Forces Canteen Brd 5 2 40.0% 0 0.0%
Garda Inspectorate 9 0 0.0% 0 0.0%
Houses of the Oireachtas 409 17 4.2% 14 3.0%
Insolvency Service of Ireland 84 5 6.0% 2 2.9%
Irish Film Classification Office 8 0 0.0% 0 0.0%
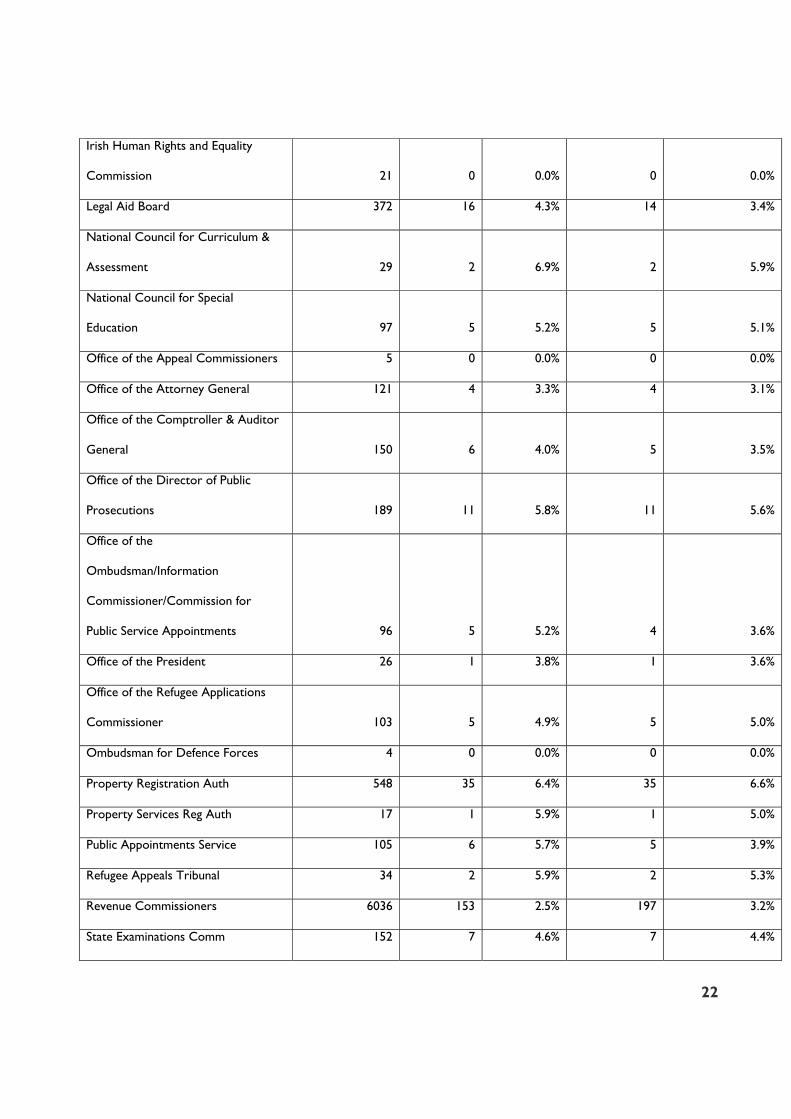
22
Irish Human Rights and Equality
Commission 21 0 0.0% 0 0.0%
Legal Aid Board 372 16 4.3% 14 3.4%
National Council for Curriculum &
Assessment 29 2 6.9% 2 5.9%
National Council for Special
Education 97 5 5.2% 5 5.1%
Office of the Appeal Commissioners 5 0 0.0% 0 0.0%
Office of the Attorney General 121 4 3.3% 4 3.1%
Office of the Comptroller & Auditor
General 150 6 4.0% 5 3.5%
Office of the Director of Public
Prosecutions 189 11 5.8% 11 5.6%
Office of the
Ombudsman/Information
Commissioner/Commission for
Public Service Appointments 96 5 5.2% 4 3.6%
Office of the President 26 1 3.8% 1 3.6%
Office of the Refugee Applications
Commissioner 103 5 4.9% 5 5.0%
Ombudsman for Defence Forces 4 0 0.0% 0 0.0%
Property Registration Auth 548 35 6.4% 35 6.6%
Property Services Reg Auth 17 1 5.9% 1 5.0%
Public Appointments Service 105 6 5.7% 5 3.9%
Refugee Appeals Tribunal 34 2 5.9% 2 5.3%
Revenue Commissioners 6036 153 2.5% 197 3.2%
State Examinations Comm 152 7 4.6% 7 4.4%

23
The Courts Service of Ireland 985 31 3.1% 31 3.1%
The Labour Relations Comm 41 4 9.8%
National Consumer Agency 78 4 5.1%
The Office of Public Works 575 17 3.0% 22 3.7%
Ombudsman for Children 8 0 0.0% 0 0.0%
Private Security Authority 36 1 2.8% 1 2.6%
The State Laboratory 85 5 5.9% 5 5.7%
Valuation Office/ Tribunal 127 7 5.5% 6 4.9%
Department of Social Protection
2014 2015 Public Bodies Total
Employment Employees
with disabilities
% of employees
with disabilities
Employees with
disabilities
% of employees
with disabilities
Citizens Information Board 87 8 9.2% 8 9.8%
Office of the Pensions Ombudsman 8 1 12.5% 1 16.7%
The Pensions Authority 45 1 2.2% 0 0.0%
Department of the Taoiseach
2014 2015 Public Bodies Total
Employment Employees
with disabilities
% of employees
with disabilities
Employees with
disabilities
% of employees
with disabilities
Chief State Solicitor's Office 248 22 8.9%
Law Reform Commission 18 0 0.0% 0 0.0%
National Economic and Social
Development Office 18 1 5.6% 1 5.9%
Department of Transport, Tourism & Sport
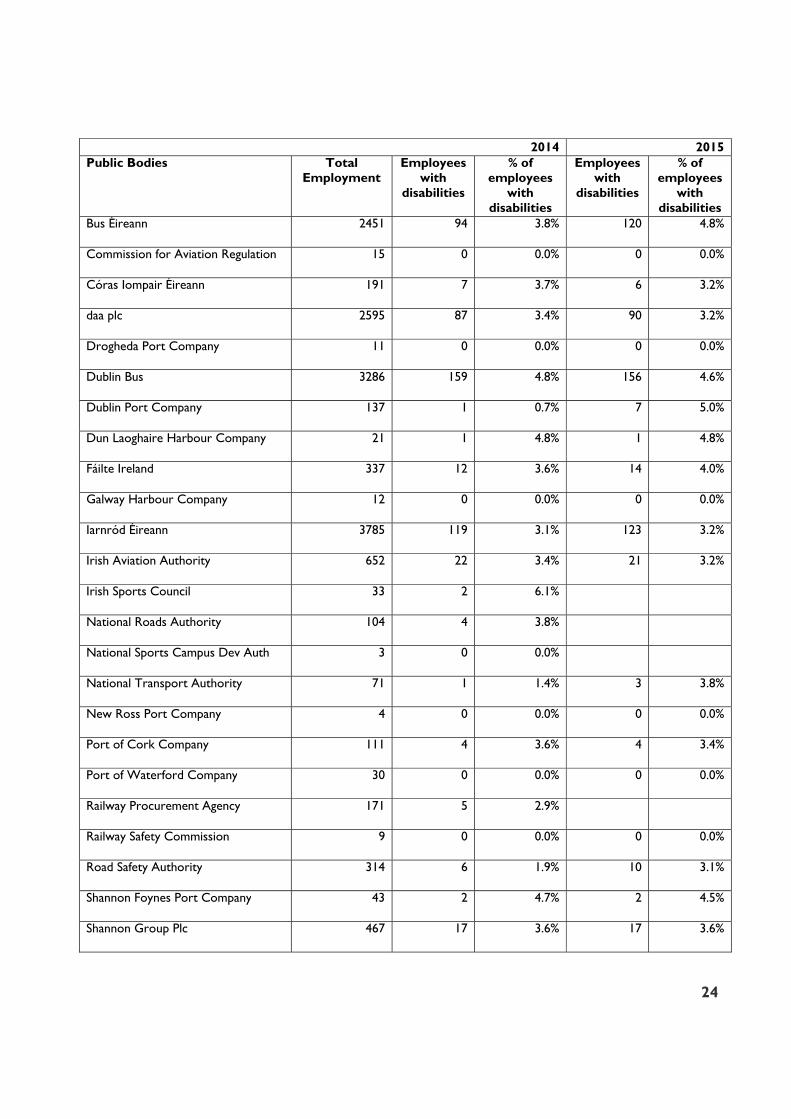
24
2014 2015 Public Bodies Total
Employment Employees
with disabilities
% of employees
with disabilities
Employees with
disabilities
% of employees
with disabilities
Bus Éireann 2451 94 3.8% 120 4.8%
Commission for Aviation Regulation 15 0 0.0% 0 0.0%
Córas Iompair Éireann 191 7 3.7% 6 3.2%
daa plc 2595 87 3.4% 90 3.2%
Drogheda Port Company 11 0 0.0% 0 0.0%
Dublin Bus 3286 159 4.8% 156 4.6%
Dublin Port Company 137 1 0.7% 7 5.0%
Dun Laoghaire Harbour Company 21 1 4.8% 1 4.8%
Fáilte Ireland 337 12 3.6% 14 4.0%
Galway Harbour Company 12 0 0.0% 0 0.0%
Iarnród Éireann 3785 119 3.1% 123 3.2%
Irish Aviation Authority 652 22 3.4% 21 3.2%
Irish Sports Council 33 2 6.1%
National Roads Authority 104 4 3.8%
National Sports Campus Dev Auth 3 0 0.0%
National Transport Authority 71 1 1.4% 3 3.8%
New Ross Port Company 4 0 0.0% 0 0.0%
Port of Cork Company 111 4 3.6% 4 3.4%
Port of Waterford Company 30 0 0.0% 0 0.0%
Railway Procurement Agency 171 5 2.9%
Railway Safety Commission 9 0 0.0% 0 0.0%
Road Safety Authority 314 6 1.9% 10 3.1%
Shannon Foynes Port Company 43 2 4.7% 2 4.5%
Shannon Group Plc 467 17 3.6% 17 3.6%
25
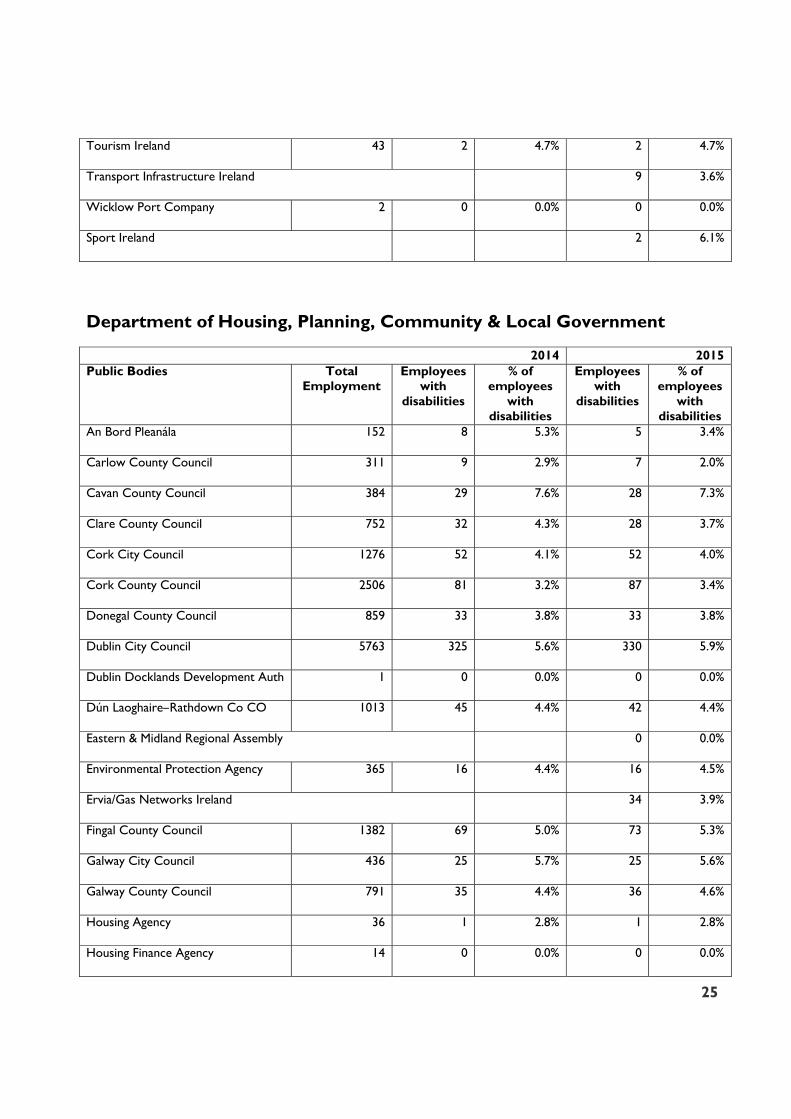
Tourism Ireland 43 2 4.7% 2 4.7%
Transport Infrastructure Ireland 9 3.6%
Wicklow Port Company 2 0 0.0% 0 0.0%
Sport Ireland 2 6.1%
Department of Housing, Planning, Community & Local Government
2014 2015 Public Bodies Total
Employment Employees
with disabilities
% of employees
with disabilities
Employees with
disabilities
% of employees
with disabilities
An Bord Pleanála 152 8 5.3% 5 3.4%
Carlow County Council 311 9 2.9% 7 2.0%
Cavan County Council 384 29 7.6% 28 7.3%
Clare County Council 752 32 4.3% 28 3.7%
Cork City Council 1276 52 4.1% 52 4.0%
Cork County Council 2506 81 3.2% 87 3.4%
Donegal County Council 859 33 3.8% 33 3.8%
Dublin City Council 5763 325 5.6% 330 5.9%
Dublin Docklands Development Auth 1 0 0.0% 0 0.0%
Dún Laoghaire–Rathdown Co CO 1013 45 4.4% 42 4.4%
Eastern & Midland Regional Assembly 0 0.0%
Environmental Protection Agency 365 16 4.4% 16 4.5%
Ervia/Gas Networks Ireland 34 3.9%
Fingal County Council 1382 69 5.0% 73 5.3%
Galway City Council 436 25 5.7% 25 5.6%
Galway County Council 791 35 4.4% 36 4.6%
Housing Agency 36 1 2.8% 1 2.8%
Housing Finance Agency 14 0 0.0% 0 0.0%

26
Irish Water 660 5 0.8% 24 3.2%
Irish Water Safety 6 0 0.0% 0 0.0%
Kerry County Council 1365 77 5.6% 81 5.9%
Kildare County Council 914 63 6.9% 65 7.0%
Kilkenny County Council 528 23 4.4% 23 4.4%
Laois County Council 375 18 4.8% 21 5.3%
Leitrim County Council 272 8 2.9% 8 3.0%
Limerick City & County Council 1180 37 3.1% 40 3.3%
Local Government Mgmt Agency 97 7 7.2% 7 7.0%
Longford County Council 286 17 5.9% 15 5.2%
Louth County Council 792 35 4.4% 35 4.5%
Mayo County Council 1114 71 6.4% 71 6.4%
Meath County Council 678 25 3.7% 25 3.6%
Monaghan County Council 397 25 6.3% 26 6.5%
Northern & Western Reg Assembly 12 0 0.0% 0 0.0%
Offaly County Council 391 13 3.3% 13 3.3%
Private Residential Tenancies Board 19 1 5.3% 1 4.8%
Roscommon County Council 429 20 4.7% 20 4.7%
Sligo County Council 437 5 1.1% 5 1.2%
South Dublin County Council 1170 36 3.1% 39 3.4%
Southern Regional Assembly 23 0 0.0% 0 0.0%
Tipperary County Council 1089 34 3.1% 34 3.2%
Waterford City & County Council 973 33 3.4% 33 3.3%
Western Development Commission 11 0 0.0% 0 0.0%
Westmeath County Council 447 21 4.7% 22 4.8%
Wexford County Council 917 51 5.6% 66 7.2%
Wicklow County Council 728 23 3.2% 22 3.1%

27
28
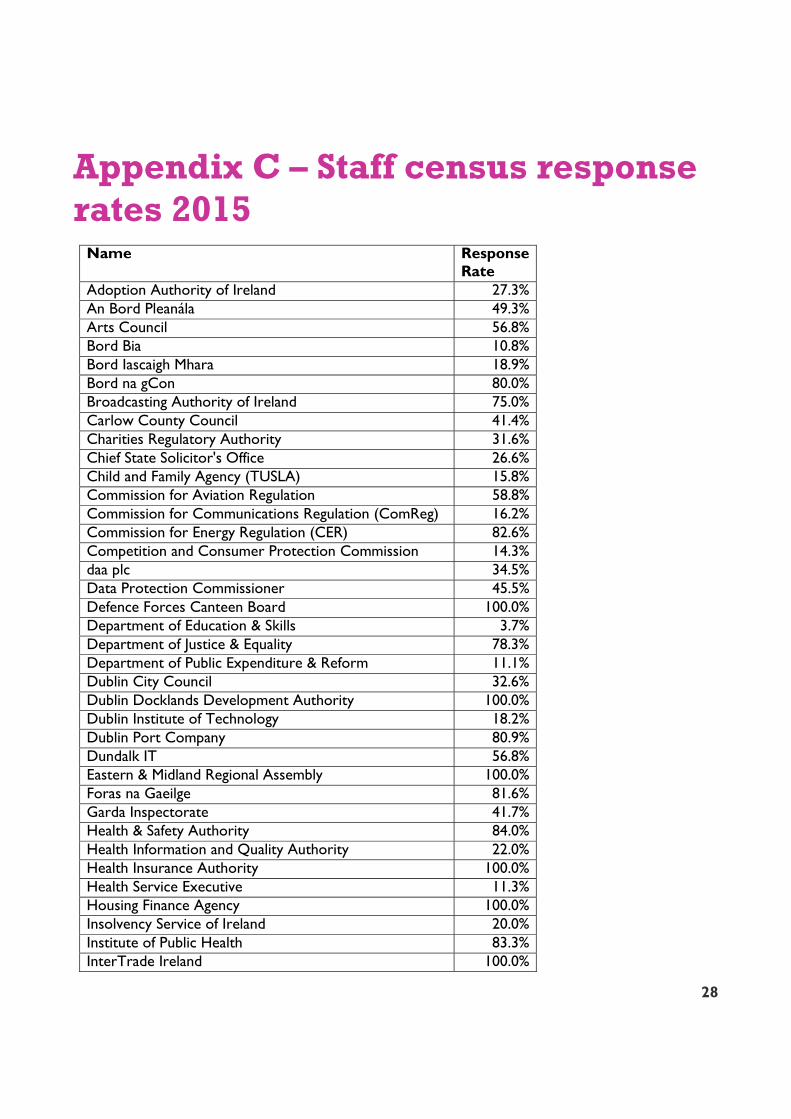
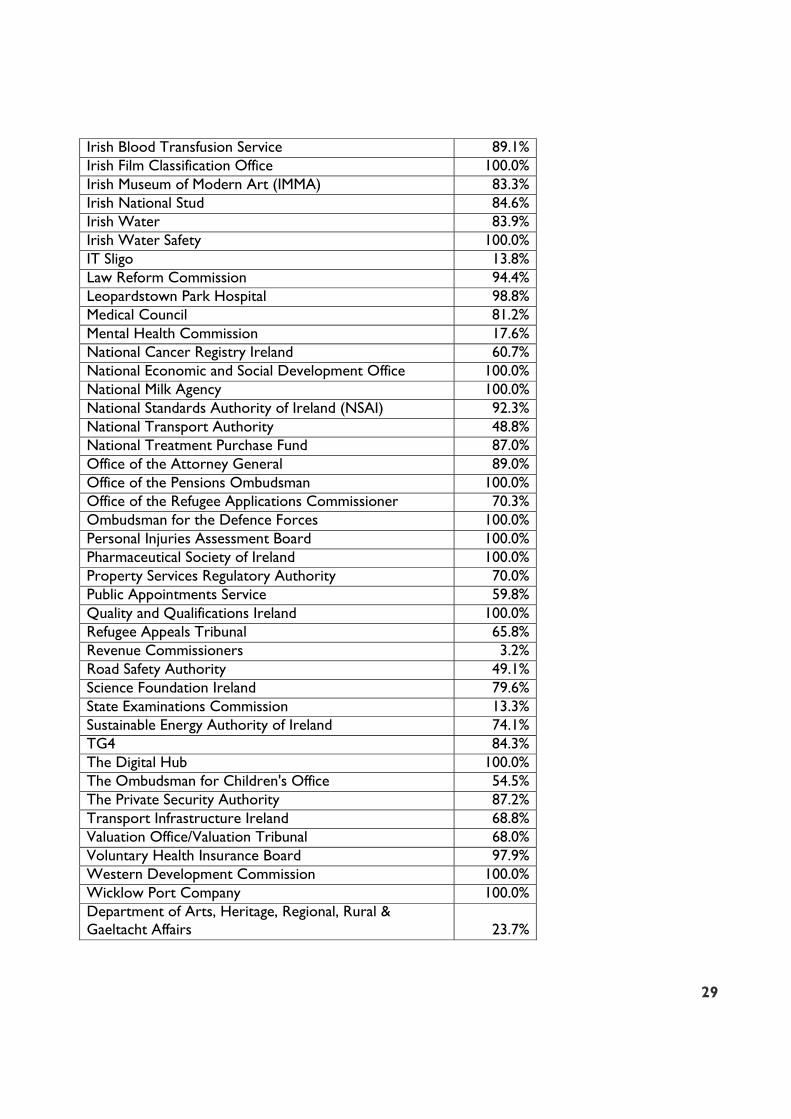
Appendix C – Staff census response rates 2015
Name Response Rate
Adoption Authority of Ireland 27.3% An Bord Pleanála 49.3% Arts Council 56.8% Bord Bia 10.8% Bord Iascaigh Mhara 18.9% Bord na gCon 80.0% Broadcasting Authority of Ireland 75.0% Carlow County Council 41.4% Charities Regulatory Authority 31.6% Chief State Solicitor's Office 26.6% Child and Family Agency (TUSLA) 15.8% Commission for Aviation Regulation 58.8% Commission for Communications Regulation (ComReg) 16.2% Commission for Energy Regulation (CER) 82.6% Competition and Consumer Protection Commission 14.3% daa plc 34.5% Data Protection Commissioner 45.5% Defence Forces Canteen Board 100.0% Department of Education & Skills 3.7% Department of Justice & Equality 78.3% Department of Public Expenditure & Reform 11.1% Dublin City Council 32.6% Dublin Docklands Development Authority 100.0% Dublin Institute of Technology 18.2% Dublin Port Company 80.9% Dundalk IT 56.8% Eastern & Midland Regional Assembly 100.0% Foras na Gaeilge 81.6% Garda Inspectorate 41.7% Health & Safety Authority 84.0% Health Information and Quality Authority 22.0% Health Insurance Authority 100.0% Health Service Executive 11.3% Housing Finance Agency 100.0% Insolvency Service of Ireland 20.0% Institute of Public Health 83.3% InterTrade Ireland 100.0%
29
Irish Blood Transfusion Service 89.1% Irish Film Classification Office 100.0% Irish Museum of Modern Art (IMMA) 83.3% Irish National Stud 84.6% Irish Water 83.9% Irish Water Safety 100.0% IT Sligo 13.8% Law Reform Commission 94.4% Leopardstown Park Hospital 98.8% Medical Council 81.2% Mental Health Commission 17.6% National Cancer Registry Ireland 60.7% National Economic and Social Development Office 100.0% National Milk Agency 100.0% National Standards Authority of Ireland (NSAI) 92.3% National Transport Authority 48.8% National Treatment Purchase Fund 87.0% Office of the Attorney General 89.0% Office of the Pensions Ombudsman 100.0% Office of the Refugee Applications Commissioner 70.3% Ombudsman for the Defence Forces 100.0% Personal Injuries Assessment Board 100.0% Pharmaceutical Society of Ireland 100.0% Property Services Regulatory Authority 70.0% Public Appointments Service 59.8% Quality and Qualifications Ireland 100.0% Refugee Appeals Tribunal 65.8% Revenue Commissioners 3.2% Road Safety Authority 49.1% Science Foundation Ireland 79.6% State Examinations Commission 13.3% Sustainable Energy Authority of Ireland 74.1% TG4 84.3% The Digital Hub 100.0% The Ombudsman for Children's Office 54.5% The Private Security Authority 87.2% Transport Infrastructure Ireland 68.8% Valuation Office/Valuation Tribunal 68.0% Voluntary Health Insurance Board 97.9% Western Development Commission 100.0% Wicklow Port Company 100.0% Department of Arts, Heritage, Regional, Rural & Gaeltacht Affairs 23.7%
30
National Disability Authority
25 Clyde Road, Dublin 4
Telephone: (01) 608 0400
Fax: (01) 660 9935
www.nda.ie
National Disability Authority is the
independent state body providing
expert advice on disability policy and
practice to the Government, and promoting
Universal Design in Ireland.