Embed Size (px)
Citation preview
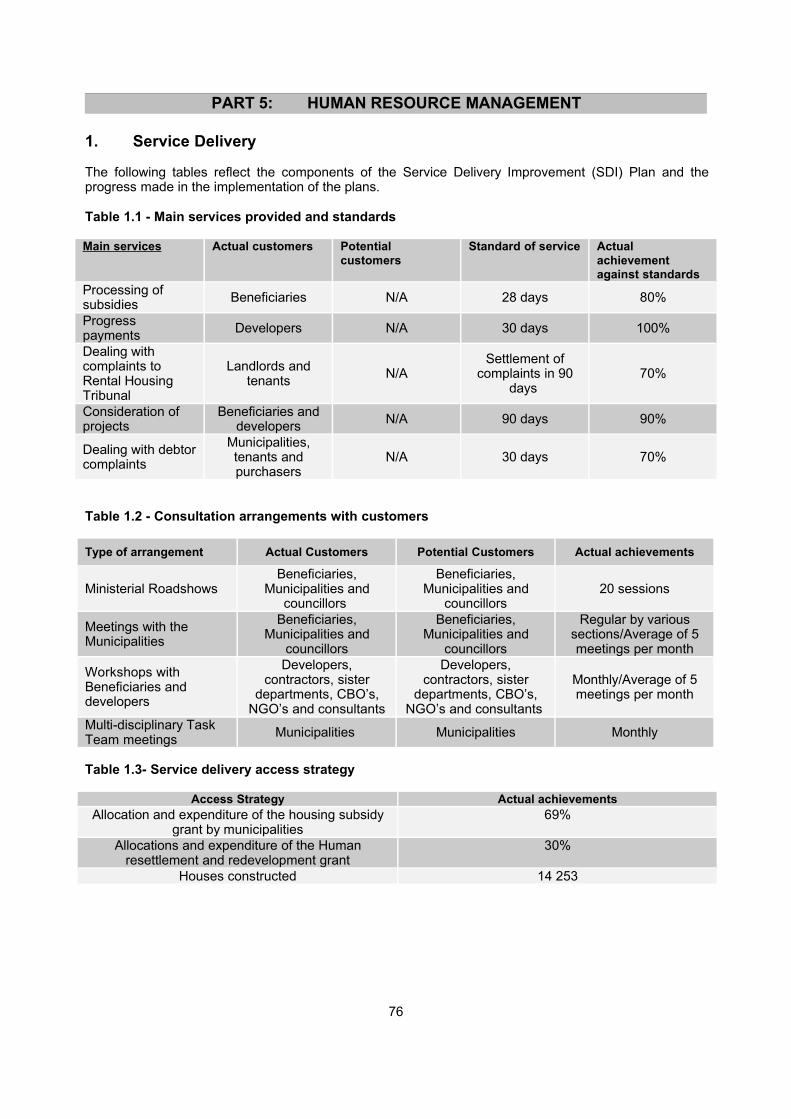
PART 5: HUMAN RESOURCE MANAGEMENT
1. Service Delivery
The following tables reflect the components of the Service Delivery Improvement (SDI) Plan and theprogress made in the implementation of the plans.
Table 1.1 - Main services provided and standards
Main services Actual customers Potentialcustomers
Standard of service Actualachievementagainst standards
Processing ofsubsidies Beneficiaries N/A 28 days 80%
Progresspayments Developers N/A 30 days 100%
Dealing withcomplaints toRental HousingTribunal
Landlords andtenants N/A
Settlement ofcomplaints in 90
days 70%
Consideration ofprojects
Beneficiaries anddevelopers N/A 90 days 90%
Dealing with debtorcomplaints
Municipalities,tenants andpurchasers
N/A 30 days 70%
Table 1.2 - Consultation arrangements with customers
Type of arrangement Actual Customers Potential Customers Actual achievements
Ministerial RoadshowsBeneficiaries,
Municipalities andcouncillors
Beneficiaries,Municipalities and
councillors20 sessions
Meetings with theMunicipalities
Beneficiaries,Municipalities and
councillors
Beneficiaries,Municipalities and
councillors
Regular by varioussections/Average of 5meetings per month
Workshops withBeneficiaries anddevelopers
Developers,contractors, sister
departments, CBO’s,NGO’s and consultants
Developers,contractors, sister
departments, CBO’s,NGO’s and consultants
Monthly/Average of 5meetings per month
Multi-disciplinary TaskTeam meetings Municipalities Municipalities Monthly
Table 1.3- Service delivery access strategy
Access Strategy Actual achievementsAllocation and expenditure of the housing subsidy
grant by municipalities69%
Allocations and expenditure of the Humanresettlement and redevelopment grant
30%
Houses constructed 14 253
76

Table 1.4 - Service information tool
Types of information tool Actual achievementsWebsite Up and running
Housing Subsidy System Not fully operationalHelp Desk Fully operational
Debtor System Fully operational with limitations
Table 1.5 - Complaints mechanism
Complaints Mechanism Actual achievementsHelpdesk maintained Continuously in place
Ministerial enquiries Timely response
77
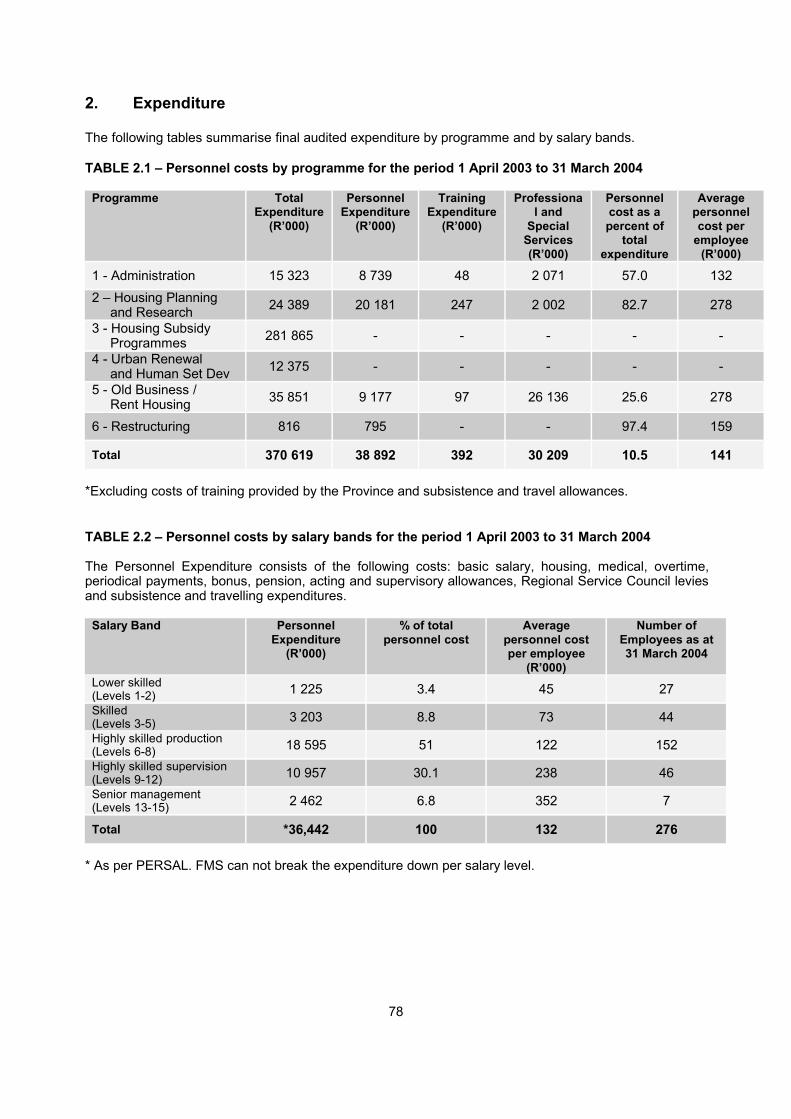
2. Expenditure
The following tables summarise final audited expenditure by programme and by salary bands.
TABLE 2.1 – Personnel costs by programme for the period 1 April 2003 to 31 March 2004
Programme TotalExpenditure
(R’000)
PersonnelExpenditure
(R’000)
TrainingExpenditure
(R’000)
Professional and
SpecialServices(R’000)
Personnelcost as apercent of
totalexpenditure
Averagepersonnelcost per
employee(R’000)
1 - Administration 15 323 8 739 48 2 071 57.0 1322 – Housing Planning and Research 24 389 20 181 247 2 002 82.7 278
3 - Housing Subsidy Programmes 281 865 - - - - -
4 - Urban Renewal and Human Set Dev 12 375 - - - - -
5 - Old Business / Rent Housing 35 851 9 177 97 26 136 25.6 278
6 - Restructuring 816 795 - - 97.4 159
Total 370 619 38 892 392 30 209 10.5 141
*Excluding costs of training provided by the Province and subsistence and travel allowances.
TABLE 2.2 – Personnel costs by salary bands for the period 1 April 2003 to 31 March 2004
The Personnel Expenditure consists of the following costs: basic salary, housing, medical, overtime,periodical payments, bonus, pension, acting and supervisory allowances, Regional Service Council leviesand subsistence and travelling expenditures.
Salary Band PersonnelExpenditure
(R’000)
% of totalpersonnel cost
Averagepersonnel costper employee
(R’000)
Number ofEmployees as at31 March 2004
Lower skilled(Levels 1-2) 1 225 3.4 45 27Skilled(Levels 3-5) 3 203 8.8 73 44Highly skilled production(Levels 6-8) 18 595 51 122 152Highly skilled supervision(Levels 9-12) 10 957 30.1 238 46Senior management(Levels 13-15) 2 462 6.8 352 7
Total *36,442 100 132 276
* As per PERSAL. FMS can not break the expenditure down per salary level.
78
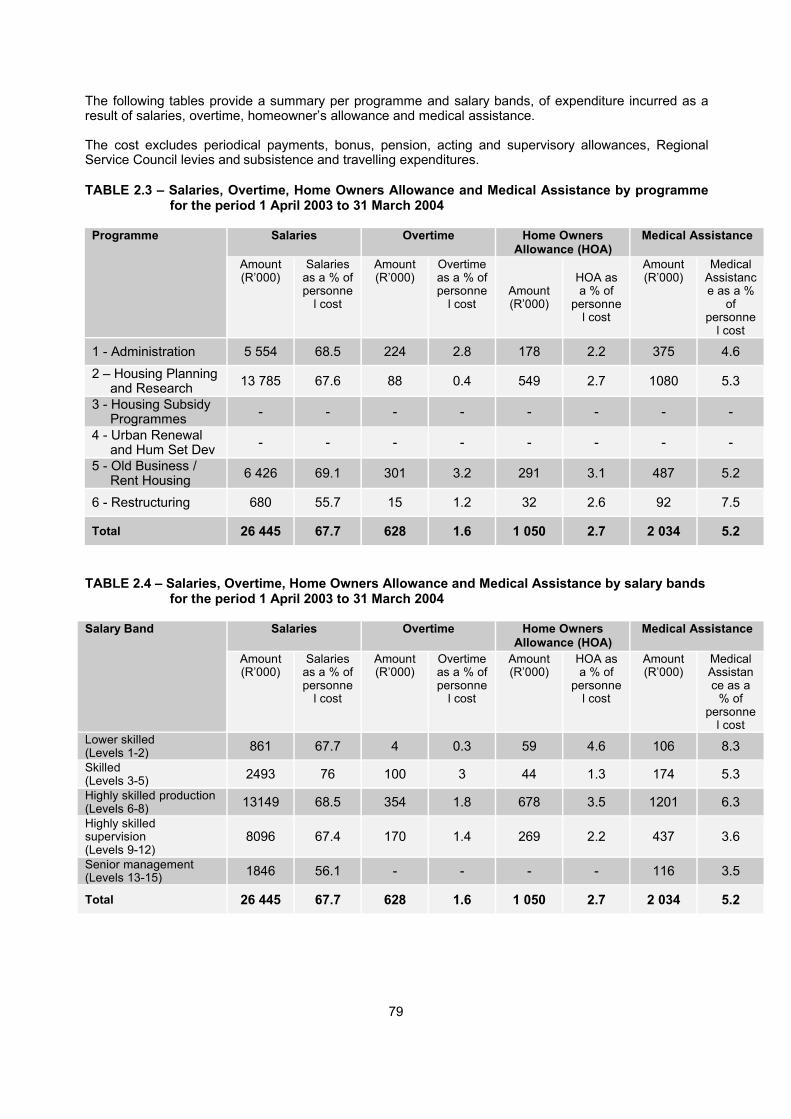
The following tables provide a summary per programme and salary bands, of expenditure incurred as aresult of salaries, overtime, homeowner’s allowance and medical assistance.
The cost excludes periodical payments, bonus, pension, acting and supervisory allowances, RegionalService Council levies and subsistence and travelling expenditures.
TABLE 2.3 – Salaries, Overtime, Home Owners Allowance and Medical Assistance by programmefor the period 1 April 2003 to 31 March 2004
Programme Salaries Overtime Home OwnersAllowance (HOA)
Medical Assistance
Amount(R’000)
Salariesas a % ofpersonne
l cost
Amount(R’000)
Overtimeas a % ofpersonne
l costAmount(R’000)
HOA asa % of
personnel cost
Amount(R’000)
MedicalAssistance as a %
ofpersonne
l cost
1 - Administration 5 554 68.5 224 2.8 178 2.2 375 4.62 – Housing Planning and Research 13 785 67.6 88 0.4 549 2.7 1080 5.3
3 - Housing Subsidy Programmes - - - - - - - -
4 - Urban Renewal and Hum Set Dev - - - - - - - -
5 - Old Business / Rent Housing 6 426 69.1 301 3.2 291 3.1 487 5.2
6 - Restructuring 680 55.7 15 1.2 32 2.6 92 7.5
Total 26 445 67.7 628 1.6 1 050 2.7 2 034 5.2
TABLE 2.4 – Salaries, Overtime, Home Owners Allowance and Medical Assistance by salary bandsfor the period 1 April 2003 to 31 March 2004
Salary Band Salaries Overtime Home OwnersAllowance (HOA)
Medical Assistance
Amount(R’000)
Salariesas a % ofpersonne
l cost
Amount(R’000)
Overtimeas a % ofpersonne
l cost
Amount(R’000)
HOA asa % of
personnel cost
Amount(R’000)
MedicalAssistance as a
% ofpersonne
l costLower skilled(Levels 1-2) 861 67.7 4 0.3 59 4.6 106 8.3Skilled(Levels 3-5) 2493 76 100 3 44 1.3 174 5.3Highly skilled production(Levels 6-8) 13149 68.5 354 1.8 678 3.5 1201 6.3Highly skilledsupervision(Levels 9-12)
8096 67.4 170 1.4 269 2.2 437 3.6
Senior management(Levels 13-15) 1846 56.1 - - - - 116 3.5
Total 26 445 67.7 628 1.6 1 050 2.7 2 034 5.2
79

3. Employment and Vacancies
The organogram indicates the macro structure of the Department of Housing and the approved posts asat 31 March 2004.
80
DirectorateHuman Resource Management and Administration
( 41 posts)
DirectorateFinancial Management
(43 posts)
DirectorateProfessional and Technical Services
(82 posts)
DirectorateHousing Management
(58 posts)
DirectorateHousing Settlement
(88 posts)
Chief DirectorateHousing(5 posts)
Department of Housing(5 posts)
Minister of Housing
Office of the MinisterHousing(6 posts)

The following tables summarise the number of posts on the establishment, the number of employees, thevacancy rate and staff that are additional to the establishment. This information is presented in terms ofthree key variables:- programme, salary band and critical occupations. The Department has identifiedcritical occupations that need to be monitored.
TABLE 3.1 – Employment and vacancies by programme as at 31 March 2004
Programme Number of posts Number of posts filled
Number ofpermanent
posts
* Numberof
approvedcontract
posts
Number ofposts filled
withpermanentemployees
Number ofposts filled
withcontract
appointments
VacancyRate
Numberof posts
filledadditional
to theestablish
ment
1 - Administration 95 54 2 41.1 122 – Housing Planning and Research 143 2 120 1 16.6 5
3 - Housing Subsidy Programmes - - - - - -
4 - Urban Renewal and Human Set Dev - - - - - -
5 - Old Business / Rent Housing 82 6 66 6 18.2 3
6 - Restructuring - - - - - 5
Total
320 8 240 9
328 249 24.1 25
1. Eight contract posts were created on the establishment for functions that are to be devolved tomunicipalities. Seven officials were appointed in the said posts and are reflected in Programme 2 and5. Two personnel members in the Ministry of Housing have been appointed on contract in terms ofprescripts pertaining to ministerial staff as reflected in Programme 1. The total of 9 officials arereflected in the column “Number of posts filled with contract appointments”.
2. Of the 25 posts filled additional to the establishment, 5 are officials who were declared in excess. TheDepartment also made use of 20 contract appointees to assist the line managers in concluding workthat was a once off project, which had a definite start and end date.
81
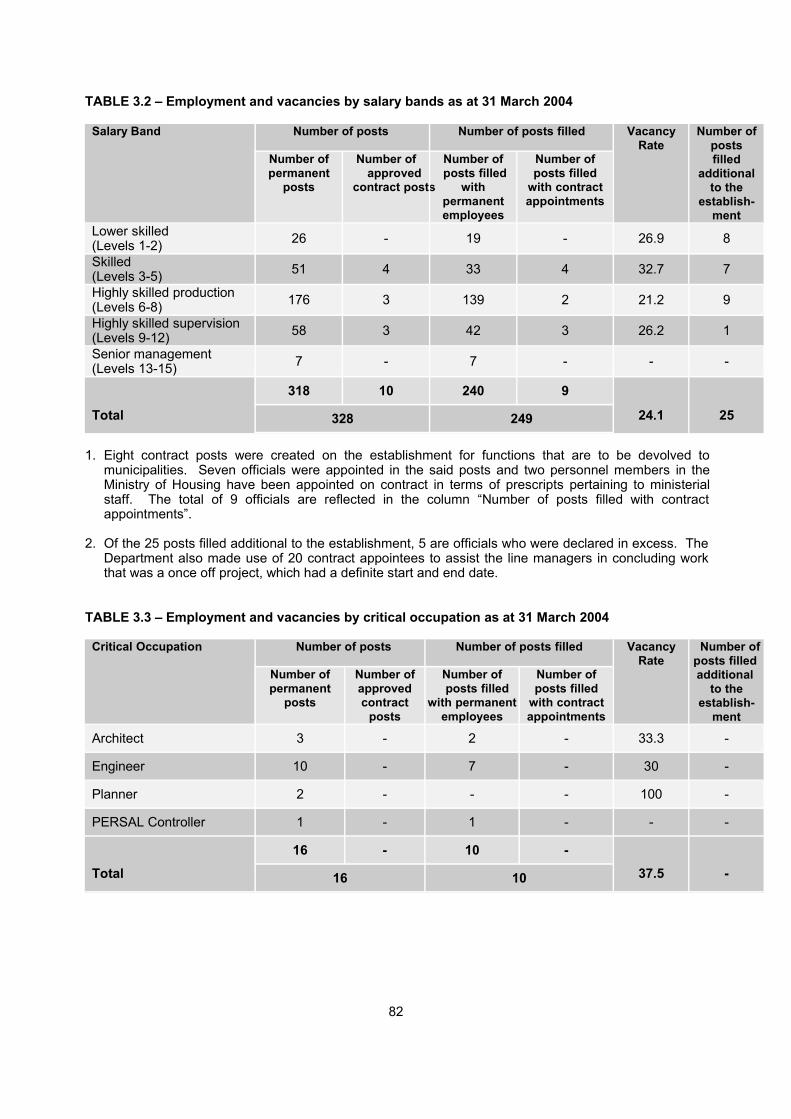
TABLE 3.2 – Employment and vacancies by salary bands as at 31 March 2004
Salary Band Number of posts Number of posts filled
Number ofpermanent
posts
Number ofapproved
contract posts
Number of posts filled
withpermanentemployees
Number ofposts filled
with contractappointments
VacancyRate
Number ofpostsfilled
additionalto the
establish-ment
Lower skilled(Levels 1-2) 26 - 19 - 26.9 8
Skilled(Levels 3-5) 51 4 33 4 32.7 7
Highly skilled production(Levels 6-8) 176 3 139 2 21.2 9
Highly skilled supervision(Levels 9-12) 58 3 42 3 26.2 1
Senior management(Levels 13-15) 7 - 7 - - -
Total
318 10 240 9
328 249 24.1 25
1. Eight contract posts were created on the establishment for functions that are to be devolved tomunicipalities. Seven officials were appointed in the said posts and two personnel members in theMinistry of Housing have been appointed on contract in terms of prescripts pertaining to ministerialstaff. The total of 9 officials are reflected in the column “Number of posts filled with contractappointments”.
2. Of the 25 posts filled additional to the establishment, 5 are officials who were declared in excess. TheDepartment also made use of 20 contract appointees to assist the line managers in concluding workthat was a once off project, which had a definite start and end date.
TABLE 3.3 – Employment and vacancies by critical occupation as at 31 March 2004
Critical Occupation Number of posts Number of posts filled
Number ofpermanent
posts
Number ofapprovedcontract
posts
Number of posts filled
with permanentemployees
Number ofposts filled
with contractappointments
VacancyRate
Number ofposts filledadditional
to theestablish-
ment
Architect 3 - 2 - 33.3 -
Engineer 10 - 7 - 30 -
Planner 2 - - - 100 -
PERSAL Controller 1 - 1 - - -
Total
16 - 10 -
16 10 37.5 -
82
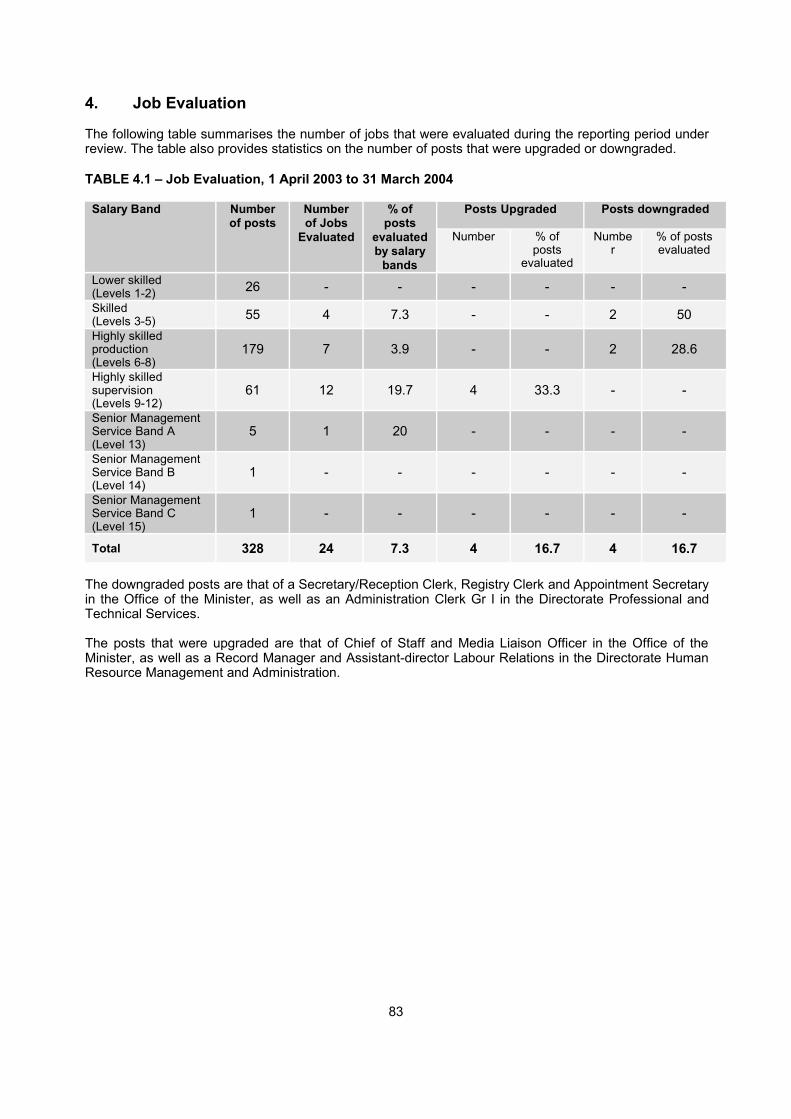
4. Job Evaluation
The following table summarises the number of jobs that were evaluated during the reporting period underreview. The table also provides statistics on the number of posts that were upgraded or downgraded.
TABLE 4.1 – Job Evaluation, 1 April 2003 to 31 March 2004
Salary Band Numberof posts
Numberof Jobs
Evaluated
% ofposts
evaluatedby salary
bands
Posts Upgraded Posts downgraded
Number % ofposts
evaluated
Number
% of postsevaluated
Lower skilled(Levels 1-2) 26 - - - - - -Skilled(Levels 3-5) 55 4 7.3 - - 2 50Highly skilledproduction(Levels 6-8)
179 7 3.9 - - 2 28.6
Highly skilledsupervision(Levels 9-12)
61 12 19.7 4 33.3 - -
Senior ManagementService Band A(Level 13)
5 1 20 - - - -
Senior ManagementService Band B(Level 14)
1 - - - - - -
Senior ManagementService Band C(Level 15)
1 - - - - - -
Total 328 24 7.3 4 16.7 4 16.7
The downgraded posts are that of a Secretary/Reception Clerk, Registry Clerk and Appointment Secretaryin the Office of the Minister, as well as an Administration Clerk Gr I in the Directorate Professional andTechnical Services.
The posts that were upgraded are that of Chief of Staff and Media Liaison Officer in the Office of theMinister, as well as a Record Manager and Assistant-director Labour Relations in the Directorate HumanResource Management and Administration.
83

The following table provides a summary of the number of employees whose salary positions wereupgraded due to their posts being upgraded.
TABLE 4.2 – Profile of employees whose salary positions were upgraded due to their posts beingupgraded, 1 April 2003 to 31 March 2004
Beneficiaries African Asian Coloured White Total
Female - - - - -
Male - - 1 1 2
Total - - 1 1 2
Employees with a disability -
The following table summarises the number of cases where remuneration levels exceeded the gradedetermined by Job Evaluation. Reasons for the deviation are provided in each case.
TABLE 4.3 – Profile of employees per occupational classification whose salary level exceeded thegrade determined by Job Evaluation, 1 April 2003 to 31 March 2004
Occupation Number ofemployees
Job evaluationlevel
Remunerationlevel
Reason for deviation
Secretary / Reception Clerk 1 6 7 Rank / leg promotion
Registry Clerk 1 4 6 Rank / leg promotion
Total Number of Employees whose salaries exceeded the level determined by job evaluation in 2003/2004
Percentage of total employment (245) 0.8
TABLE 4.4 – Profile of employees per race and gender whose salary level exceed the gradedetermined by job evaluation, 1 April 2003 to 31 March 2004
Beneficiaries African Asian Coloured White Total
Female - - 1 1 2
Male - - - - -
Total - - 1 1 2
Employees with a disability -
84
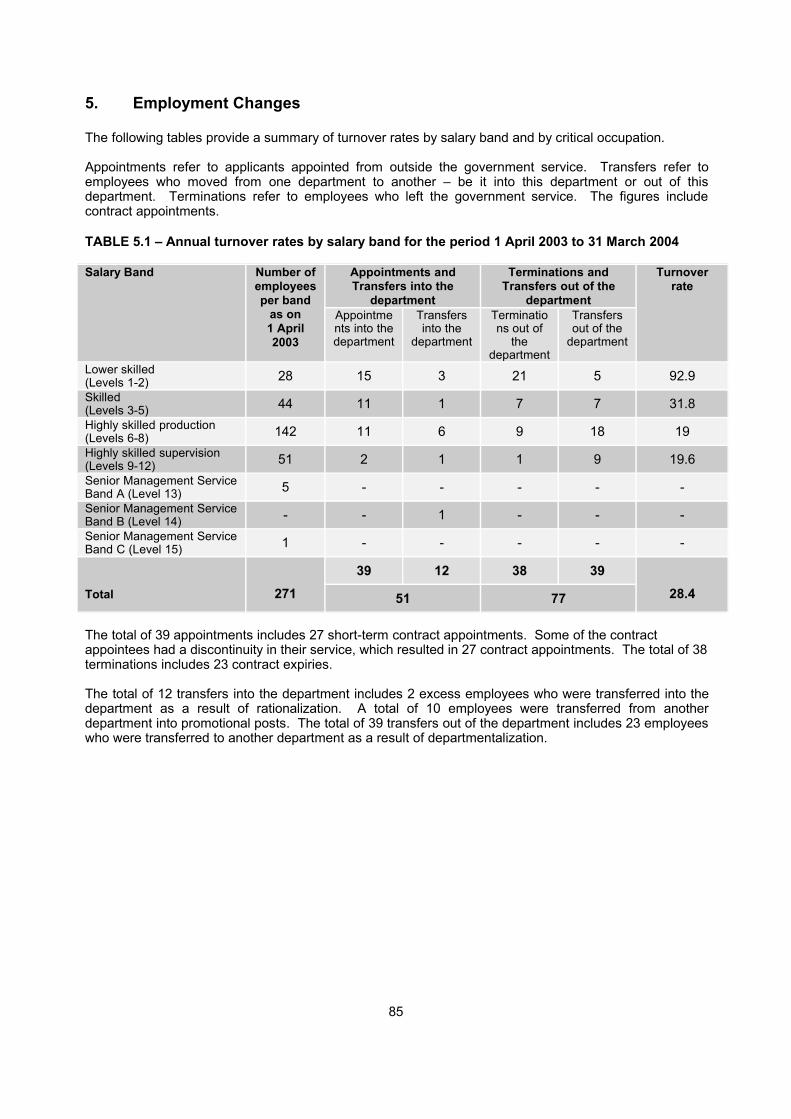
5. Employment Changes
The following tables provide a summary of turnover rates by salary band and by critical occupation.
Appointments refer to applicants appointed from outside the government service. Transfers refer toemployees who moved from one department to another – be it into this department or out of thisdepartment. Terminations refer to employees who left the government service. The figures includecontract appointments.
TABLE 5.1 – Annual turnover rates by salary band for the period 1 April 2003 to 31 March 2004
Salary Band Number ofemployeesper band
as on1 April2003
Appointments andTransfers into the
department
Terminations andTransfers out of the
departmentAppointments into thedepartment
Transfersinto the
department
Terminations out of
thedepartment
Transfersout of the
department
Turnoverrate
Lower skilled(Levels 1-2) 28 15 3 21 5 92.9Skilled(Levels 3-5) 44 11 1 7 7 31.8Highly skilled production(Levels 6-8) 142 11 6 9 18 19Highly skilled supervision(Levels 9-12) 51 2 1 1 9 19.6Senior Management ServiceBand A (Level 13) 5 - - - - -Senior Management ServiceBand B (Level 14) - - 1 - - -Senior Management ServiceBand C (Level 15) 1 - - - - -
Total 27139 12 38 39
51 77 28.4
The total of 39 appointments includes 27 short-term contract appointments. Some of the contractappointees had a discontinuity in their service, which resulted in 27 contract appointments. The total of 38terminations includes 23 contract expiries.
The total of 12 transfers into the department includes 2 excess employees who were transferred into thedepartment as a result of rationalization. A total of 10 employees were transferred from anotherdepartment into promotional posts. The total of 39 transfers out of the department includes 23 employeeswho were transferred to another department as a result of departmentalization.
85

TABLE 5.2 – Annual turnover rates by critical occupation for the period 1 April 2003 to 31 March2004
CriticalOccupation
Number ofemployees
peroccupation
as on 1 April2003
Appointments andTransfers into the
department
Terminations andTransfers out of the
departmentAppointment
s into thedepartment
Transfersinto the
department
Terminations out of thedepartment
Transfersout of the
department
Turnover rate
Architect 2 - - - - -
Engineer 12 - - - 5 41.7
Planner - - - - - -PERSALController 1 - - - - -
Total 15
- - - -
- 5 33.3
TABLE 5.3 – Reasons why staff left the department for the period 1 April 2003 to 31 March 2004
Termination Type Number % of total
Death 2 2.6
Resignation 8 10.4
Expiry of contract 19 24.7
Dismissal – operational changes - -
Dismissal – misconduct - -
Dismissal – inefficiency - -
Discharged due to ill-health 1 1.3
Retirement 4 5.2
Transfers to other Public Service Departments 39 50.6
Others (Severance Packages Res 7/2002) 4 5.2
Total 77 100
Total number of employees who left (77) as a % of the total employment (271) 28.4
86

The following are the reasons for resignations for the period 1 April 2003 to 31 March 2004
Termination Type Reason for Termination ofService
Number of Events
Resignations Other occupation Better remuneration 8
This section provides information on the different age groups with regard to personnel who retired fromservice for the period 1 April 2003 to 31 March 2004
Total of Retirements Ages 55 - 59 Ages 60 - 64 Age 65
Four (4) 1 1 2
TABLE 5.4 – Promotions by critical occupation for the period 1 April 2003 to 31 March 2004
Critical Occupation Employeesas at 1 April
2003
Promotionsto anothersalary level
Salary levelpromotions
as a % ofemployees by
occupation
Progressionsto another
notch withina
salary level
Notchprogressions
as a % ofemployees by
occupation
Architect 2 - - - -
Engineer 12 - - - -
Planner - - - - -
PERSAL Controller 1 - - - -
Total 15 - - - -
87

TABLE 5.5 – Promotions by salary band for the period 1 April 2003 to 31 March 2004
Salary Band Employeesas at 1 April
2003
Promotionsto anothersalary level
Salary bandspromotions
as a % ofemployees by
salary level
Progressionsto another
notch withina
salary level
Notchprogressions
as a % ofemployees bysalary band
Lower skilled(Levels 1-2) 28 - - - -Skilled(Levels 3-5) 44 - - - -Highly skilled production(Levels 6-8) 142 - - - -Highly skilled supervision(Levels 9-12) 51 1 2 - -Senior management(Levels 13-15) 6 - - - -
Total 271 1 0.4 - -
88
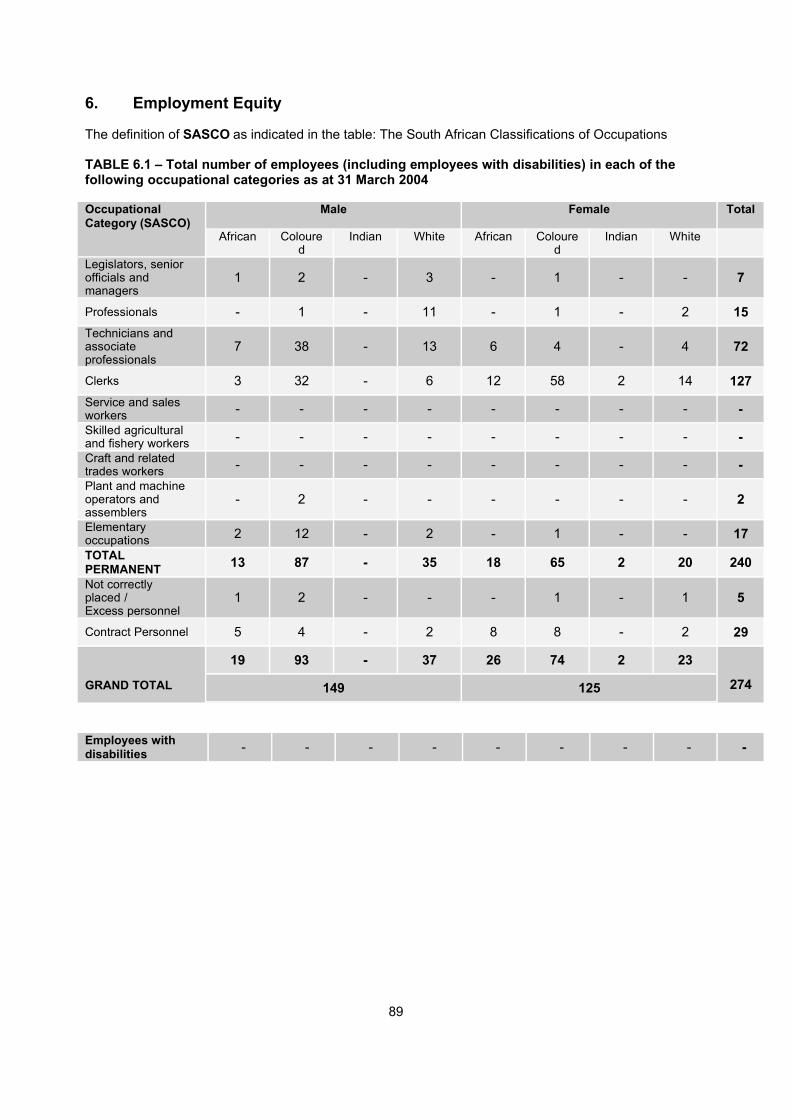
6. Employment Equity
The definition of SASCO as indicated in the table: The South African Classifications of Occupations
TABLE 6.1 – Total number of employees (including employees with disabilities) in each of thefollowing occupational categories as at 31 March 2004
OccupationalCategory (SASCO)
Male Female Total
African Coloured
Indian White African Coloured
Indian White
Legislators, seniorofficials andmanagers
1 2 - 3 - 1 - - 7
Professionals - 1 - 11 - 1 - 2 15Technicians andassociateprofessionals
7 38 - 13 6 4 - 4 72
Clerks 3 32 - 6 12 58 2 14 127Service and salesworkers - - - - - - - - -Skilled agriculturaland fishery workers - - - - - - - - -Craft and relatedtrades workers - - - - - - - - -Plant and machineoperators andassemblers
- 2 - - - - - - 2
Elementaryoccupations 2 12 - 2 - 1 - - 17TOTALPERMANENT 13 87 - 35 18 65 2 20 240Not correctlyplaced /Excess personnel
1 2 - - - 1 - 1 5
Contract Personnel 5 4 - 2 8 8 - 2 29
GRAND TOTAL
19 93 - 37 26 74 2 23
149 125 274
Employees withdisabilities - - - - - - - - -
89

TABLE 6.2 – Total number of employees (including employees with disabilities) in each of thefollowing occupational bands as at 31 March 2004
Occupational Band Male Female Total
African Coloured
Indian White African Coloured
Indian White
Top Management(Salary levels 14 –15)
1 1 - - - - - - 2
Senior Management(Salary level 13) - 1 - 3 - 1 - - 5Professionallyqualified andexperiencedspecialists andmiddle management(Salary Levels 11 –12)
1 4 - 12 - - - 3 20
Skilled technical andacademicallyqualified workers,junior management,supervisors, foremenand superintendents(Salary levels 8 –10)
2 25 - 12 3 15 - 4 61
Semi-skilled anddiscretionarydecision making(Salary levels 4 – 7)
7 42 - 8 12 42 2 13 126
Unskilled anddefined decisionmaking (Salary levels 1 – 3)
2 14 - - 3 7 - - 26
TOTALPERMANENT 13 87 - 35 18 65 2 20 240Not correctlyplaced /Excess personnel
1 3 - - - 2 - 1 5
Contract Personnel 5 4 - 2 8 8 - 2 29
GRAND TOTAL
19 93 - 37 26 74 2 23
149 125 274
Employees withdisabilities - - - - - - - - -
90
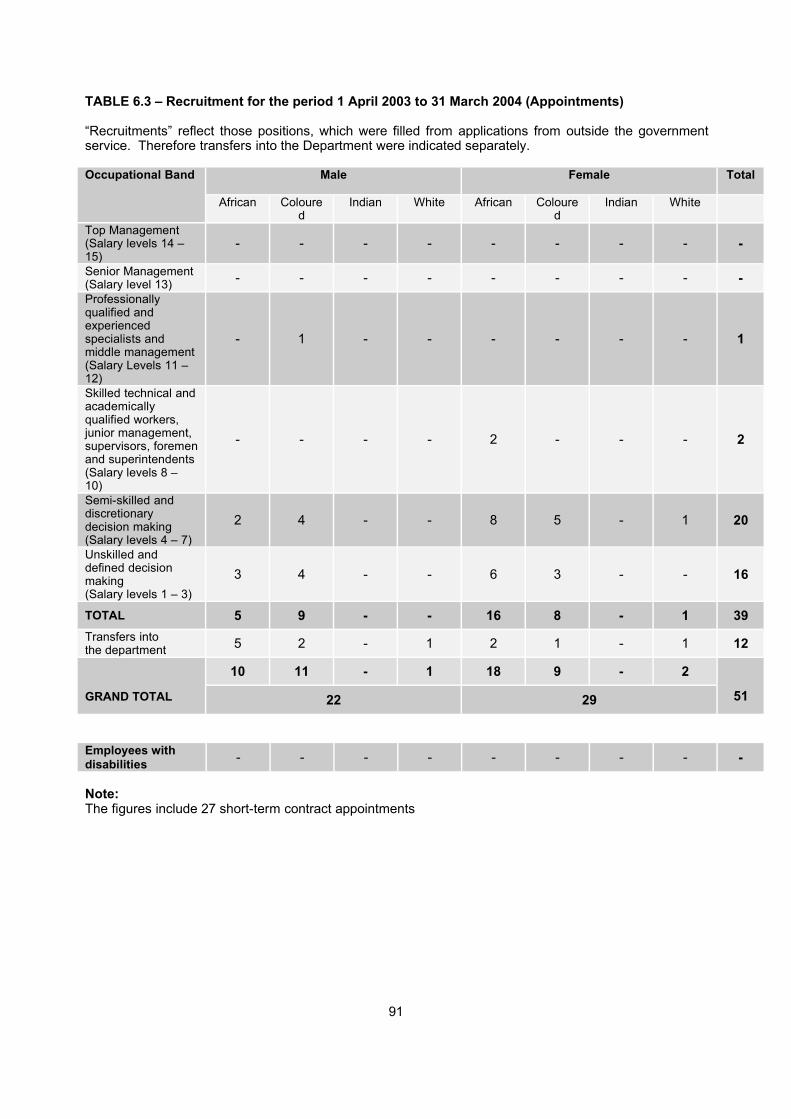
TABLE 6.3 – Recruitment for the period 1 April 2003 to 31 March 2004 (Appointments)
“Recruitments” reflect those positions, which were filled from applications from outside the governmentservice. Therefore transfers into the Department were indicated separately.
Occupational Band Male Female Total
African Coloured
Indian White African Coloured
Indian White
Top Management(Salary levels 14 –15)
- - - - - - - - -
Senior Management(Salary level 13) - - - - - - - - -Professionallyqualified andexperiencedspecialists andmiddle management(Salary Levels 11 –12)
- 1 - - - - - - 1
Skilled technical andacademicallyqualified workers,junior management,supervisors, foremenand superintendents(Salary levels 8 –10)
- - - - 2 - - - 2
Semi-skilled anddiscretionarydecision making(Salary levels 4 – 7)
2 4 - - 8 5 - 1 20
Unskilled anddefined decisionmaking (Salary levels 1 – 3)
3 4 - - 6 3 - - 16
TOTAL 5 9 - - 16 8 - 1 39Transfers intothe department 5 2 - 1 2 1 - 1 12
GRAND TOTAL
10 11 - 1 18 9 - 2
22 29 51
Employees withdisabilities - - - - - - - - -
Note:The figures include 27 short-term contract appointments
91

TABLE 6.4 – Promotions for the period 1 April 2003 to 31 March 2004
“Promotions” reflect those positions, which were filled from within the Department.
Occupational Band Male Female Total
African Coloured
Indian White African Coloured
Indian White
Top Management(Salary levels 14 –15)
- - - - - - - - -
Senior Management(Salary level 13) - - - - - - - - -Professionallyqualified andexperiencedspecialists andmiddle management(Salary Levels 11 –12)
- - - - - - - - -
Skilled technical andacademicallyqualified workers,junior management,supervisors, foremenand superintendents(Salary levels 8 –10)
- - - - - 1 - - 1
Semi-skilled anddiscretionarydecision making(Salary levels 4 – 7)
- - - - - - - - -
Unskilled anddefined decisionmaking (Salary levels 1 – 3)
- - - - - - - - -
TOTAL
PERMANENT
- - - - - 1 - -
- 1 1
Employees withdisabilities - - - - - - - - -
92
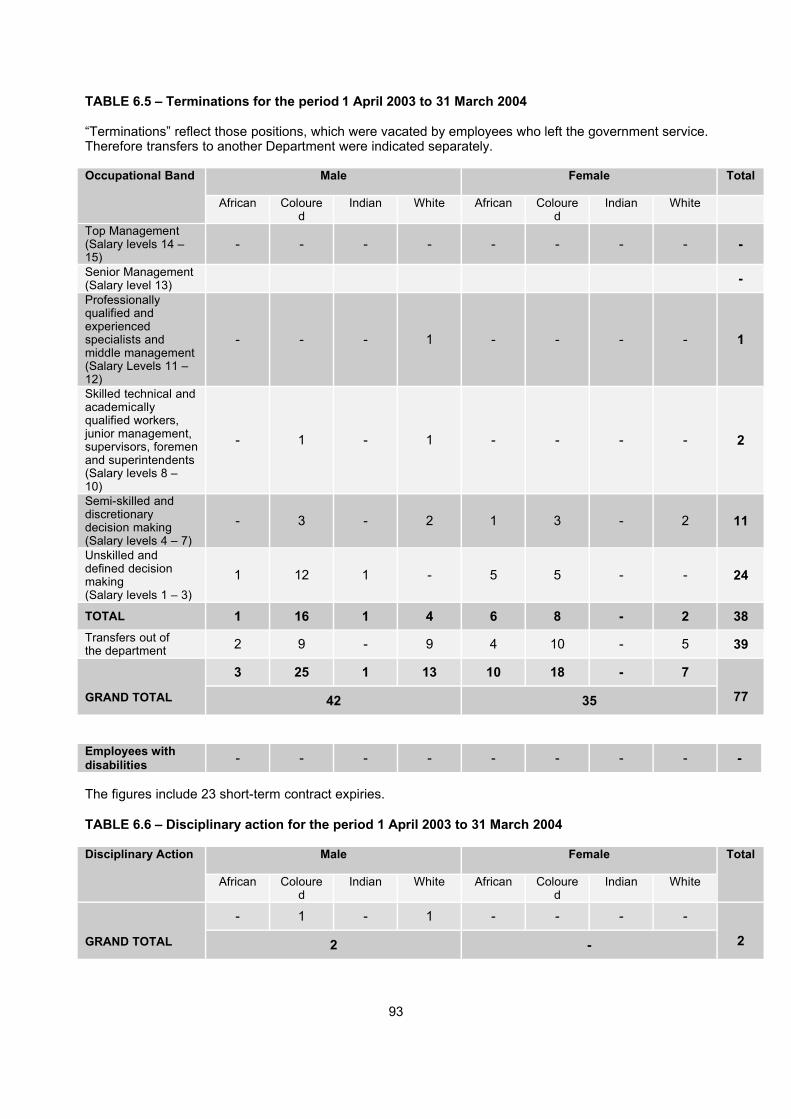
TABLE 6.5 – Terminations for the period 1 April 2003 to 31 March 2004
“Terminations” reflect those positions, which were vacated by employees who left the government service.Therefore transfers to another Department were indicated separately.
Occupational Band Male Female Total
African Coloured
Indian White African Coloured
Indian White
Top Management(Salary levels 14 –15)
- - - - - - - - -
Senior Management(Salary level 13) -Professionallyqualified andexperiencedspecialists andmiddle management(Salary Levels 11 –12)
- - - 1 - - - - 1
Skilled technical andacademicallyqualified workers,junior management,supervisors, foremenand superintendents(Salary levels 8 –10)
- 1 - 1 - - - - 2
Semi-skilled anddiscretionarydecision making(Salary levels 4 – 7)
- 3 - 2 1 3 - 2 11
Unskilled anddefined decisionmaking (Salary levels 1 – 3)
1 12 1 - 5 5 - - 24
TOTAL 1 16 1 4 6 8 - 2 38Transfers out ofthe department 2 9 - 9 4 10 - 5 39
GRAND TOTAL
3 25 1 13 10 18 - 7
42 35 77
Employees withdisabilities - - - - - - - - -
The figures include 23 short-term contract expiries.
TABLE 6.6 – Disciplinary action for the period 1 April 2003 to 31 March 2004
Disciplinary Action Male Female
African Coloured
Indian White African Coloured
Indian White
Total
GRAND TOTAL
- 1 - 1 - - - -
2 - 2
93

TABLE 6.7 – Skills development for the period 1 April 2003 to 31 March 2004
“Skills development” reflects the total number of officials trained in one or more of the variousprogrammes and short courses, as well as those that underwent training as provided by externalproviders. The implication is that an official can be reflected more than once for the period 1 April 2003 to31 March 2004.
OccupationalCategory
Male Female Total
African Coloured
Indian White African Coloured
Indian White
Legislators, seniorofficials andmanagers
- - - 2 - - - - 2
Professionals 5 1 - 37 - - - 8 51
Technicians andassociateprofessionals
12 95 - 10 15 30 - 3 165
Clerks 9 73 - 8 38 71 - 12 211
Service and salesworkers - - - - - - - - -
Skilled agriculturaland fishery workers - - - - - - - - -
Craft and relatedtrades workers - - - - - - - - -
Plant and machineoperators andassemblers
- - - - - - - - -
Elementaryoccupations 19 14 1 - 29 30 - - 93
TOTAL
PERMANENT
45 183 1 57 82 131 - 23
286 236 522
Employees withdisabilities - - - - - - - - -
94
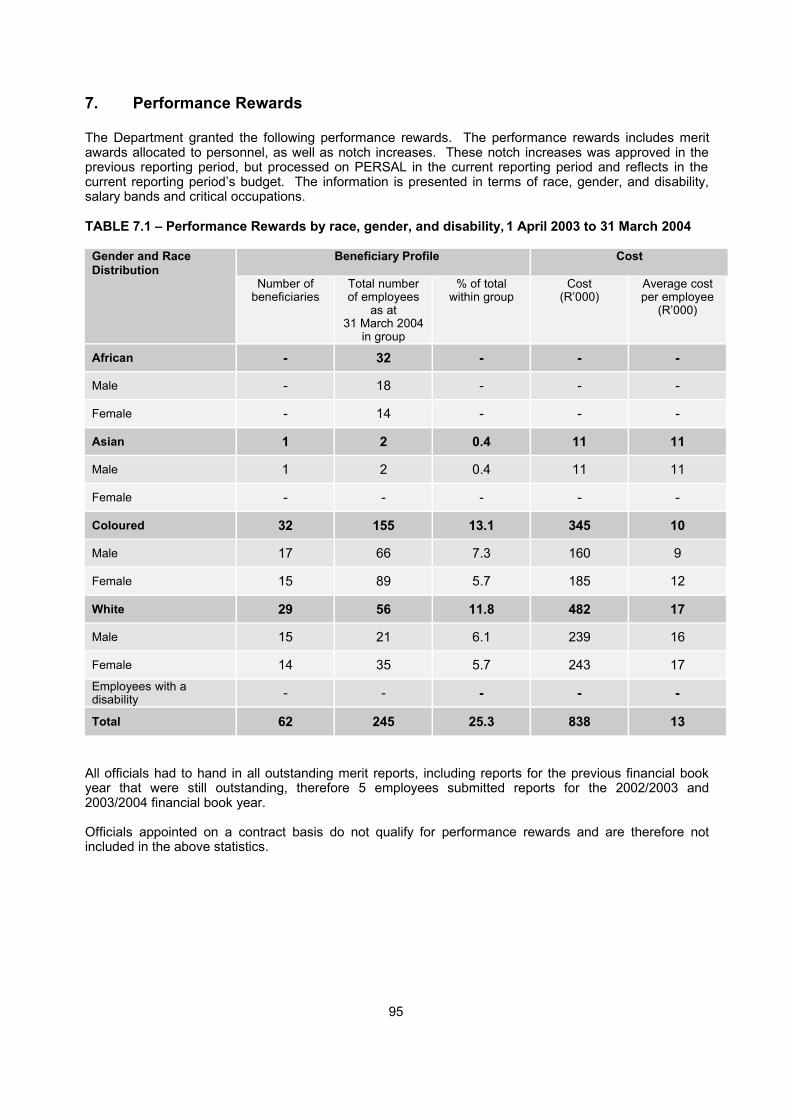
7. Performance Rewards
The Department granted the following performance rewards. The performance rewards includes meritawards allocated to personnel, as well as notch increases. These notch increases was approved in theprevious reporting period, but processed on PERSAL in the current reporting period and reflects in thecurrent reporting period’s budget. The information is presented in terms of race, gender, and disability,salary bands and critical occupations.
TABLE 7.1 – Performance Rewards by race, gender, and disability, 1 April 2003 to 31 March 2004
Gender and RaceDistribution
Beneficiary Profile Cost
Number ofbeneficiaries
Total numberof employees
as at31 March 2004
in group
% of totalwithin group
Cost(R’000)
Average costper employee
(R’000)
African - 32 - - -
Male - 18 - - -
Female - 14 - - -
Asian 1 2 0.4 11 11
Male 1 2 0.4 11 11
Female - - - - -
Coloured 32 155 13.1 345 10
Male 17 66 7.3 160 9
Female 15 89 5.7 185 12
White 29 56 11.8 482 17
Male 15 21 6.1 239 16
Female 14 35 5.7 243 17Employees with adisability - - - - -
Total 62 245 25.3 838 13
All officials had to hand in all outstanding merit reports, including reports for the previous financial bookyear that were still outstanding, therefore 5 employees submitted reports for the 2002/2003 and2003/2004 financial book year.
Officials appointed on a contract basis do not qualify for performance rewards and are therefore notincluded in the above statistics.
95

TABLE 7.2 – Performance Rewards by salary bands for personnel below Senior ManagementService, 1 April 2003 to 31 March 2004
Salary Band Beneficiary Profile Cost
Number ofbeneficiarie
s
Number ofemployees
as at 31March 2004
% of totalwithin salary
bands
Total Cost(R’000)
Averagecost per
employee(R’000)
Total costas a % ofthe total
personnelexpenditureof R36,442
Lower skilled(Levels 1-2) 1 19 0.4 5 5 -Skilled(Levels 3-5) 7 34 2.9 43 6 0.1Highly skilled production(Levels 6-8) 28 143 11.8 284 10 0.8Highly skilled supervision(Levels 9-12) 23 42 9.7 464 20 1.3
Total 59 238 24.8 796 13 2.2
All officials had to hand in all outstanding merit reports, including reports for the previous financial bookyear that were still outstanding, therefore 5 employees submitted reports for the 2002/2003 and2003/2004 financial book year.
The above figures exclude contract appointments.
TABLE 7.3 – Performance Rewards by critical occupations, 1 April 2003 to 31 March 2004
Critical Occupation Beneficiary Profile Cost
Number ofbeneficiarie
s
Number ofemployees
as at 31March 2004
% of totalwithin
occupation
Total Cost(R’000)
Averagecost per
employee(R’000)
Total costas a % ofthe total
personnelexpenditureof R36,442*
Architect - 2 - - - -
Engineer 5 7 71.4 134 27 0.4
PERSAL Controller - - - - - -
Planner - 1 - - - -
Total 5 10 50 134 27 0.4* As per PERSAL
All officials had to hand in all outstanding merit reports resulting into reports handed in for the previousfinancial book year that were still outstanding, therefore 1 employee, appointed in a critical post, submittedreports for the 2002/2003 and 2003/2004 financial book year.
96

TABLE 7.4 – Performance related rewards (cash bonus), by salary band, for Senior ManagementService
Salary Band Beneficiary Profile Cost
Number ofbeneficiarie
s
Number ofemployees
% of totalwithin band
Total Cost(R’000)
Averagecost per
employee(R’000)
Total costas a % ofthe total
personnelexpenditureof R2,462
Band A 2 5 60 24 8 1
Band B - 1 - - - -
Band C 1 1 100 17 17 0.7
Total 3 7 57.1 41 10 1.7
97
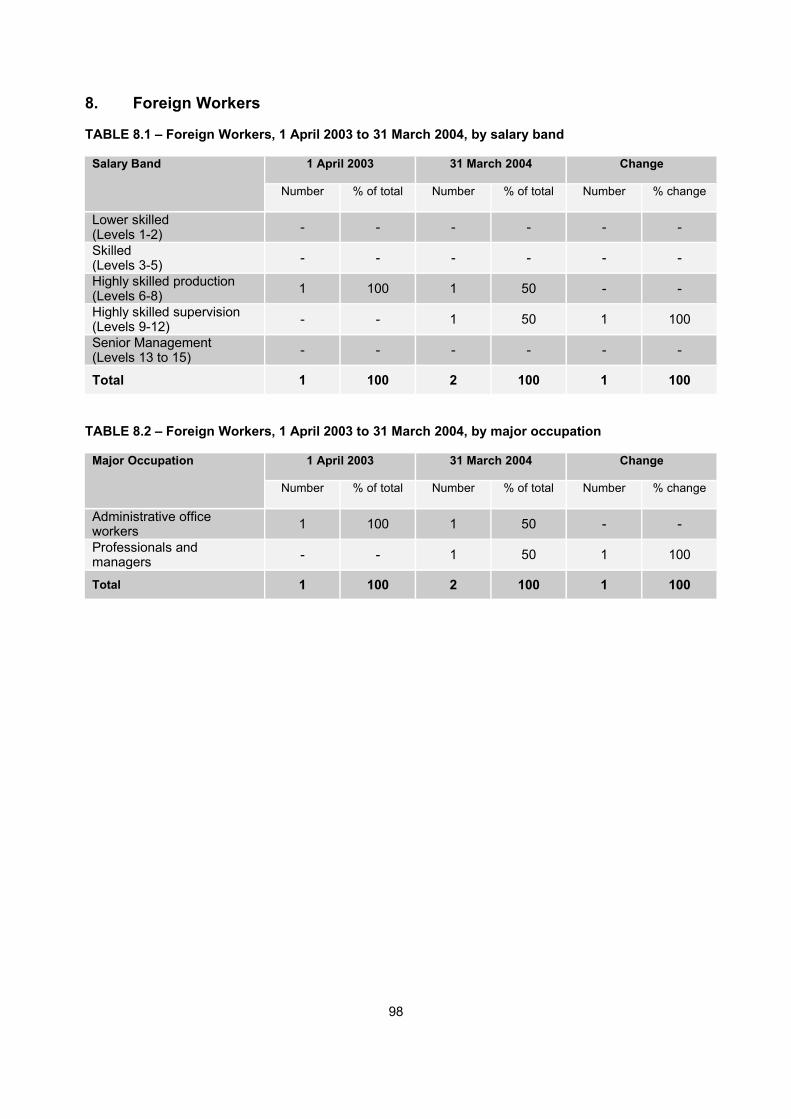
8. Foreign Workers
TABLE 8.1 – Foreign Workers, 1 April 2003 to 31 March 2004, by salary band
Salary Band 1 April 2003 31 March 2004 Change
Number % of total Number % of total Number % change
Lower skilled(Levels 1-2) - - - - - -
Skilled(Levels 3-5) - - - - - -
Highly skilled production(Levels 6-8) 1 100 1 50 - -
Highly skilled supervision(Levels 9-12) - - 1 50 1 100
Senior Management(Levels 13 to 15) - - - - - -
Total 1 100 2 100 1 100
TABLE 8.2 – Foreign Workers, 1 April 2003 to 31 March 2004, by major occupation
Major Occupation 1 April 2003 31 March 2004 Change
Number % of total Number % of total Number % change
Administrative officeworkers 1 100 1 50 - -
Professionals andmanagers - - 1 50 1 100
Total 1 100 2 100 1 100
98
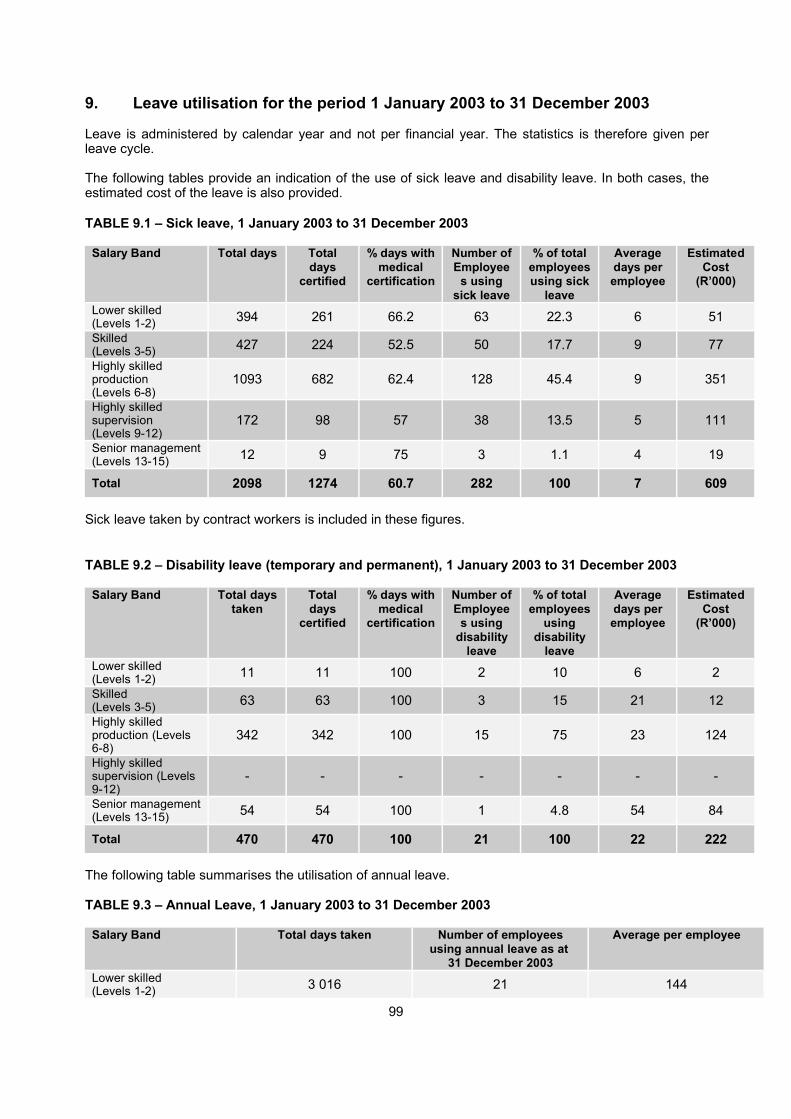
9. Leave utilisation for the period 1 January 2003 to 31 December 2003
Leave is administered by calendar year and not per financial year. The statistics is therefore given perleave cycle.
The following tables provide an indication of the use of sick leave and disability leave. In both cases, theestimated cost of the leave is also provided.
TABLE 9.1 – Sick leave, 1 January 2003 to 31 December 2003
Salary Band Total days Totaldays
certified
% days withmedical
certification
Number ofEmployee
s usingsick leave
% of totalemployeesusing sick
leave
Averagedays peremployee
EstimatedCost
(R’000)
Lower skilled(Levels 1-2) 394 261 66.2 63 22.3 6 51Skilled(Levels 3-5) 427 224 52.5 50 17.7 9 77Highly skilledproduction(Levels 6-8)
1093 682 62.4 128 45.4 9 351
Highly skilledsupervision(Levels 9-12)
172 98 57 38 13.5 5 111
Senior management(Levels 13-15) 12 9 75 3 1.1 4 19
Total 2098 1274 60.7 282 100 7 609
Sick leave taken by contract workers is included in these figures.
TABLE 9.2 – Disability leave (temporary and permanent), 1 January 2003 to 31 December 2003
Salary Band Total daystaken
Totaldays
certified
% days withmedical
certification
Number ofEmployee
s usingdisability
leave
% of totalemployees
usingdisability
leave
Averagedays peremployee
EstimatedCost
(R’000)
Lower skilled(Levels 1-2) 11 11 100 2 10 6 2Skilled(Levels 3-5) 63 63 100 3 15 21 12Highly skilledproduction (Levels6-8)
342 342 100 15 75 23 124
Highly skilledsupervision (Levels9-12)
- - - - - - -
Senior management(Levels 13-15) 54 54 100 1 4.8 54 84
Total 470 470 100 21 100 22 222
The following table summarises the utilisation of annual leave.
TABLE 9.3 – Annual Leave, 1 January 2003 to 31 December 2003
Salary Band Total days taken Number of employeesusing annual leave as at
31 December 2003
Average per employee
Lower skilled(Levels 1-2) 3 016 21 144
99

Skilled(Levels 3-5) 1 579 31 51Highly skilled production(Levels 6-8) 3736 146 26Highly skilled supervision(Levels 9-12) 1075 46 23Senior management(Levels 13-15) 154 7 22
Total 9 560 251 38
Employees are allocated 22 or 26 working days annual leave, depending on their length of service.Unused leave of a cycle can be utilised within the first six months of the next year. Hence leave takenmight exceed the allocated 22 or 26 working days. Leave taken by contract workers is included in thestatistics.
TABLE 9.4 – Capped leave, 1 January 2003 to 31 December 2003
Salary Band Numberof employees as at31 December 2003
Total daysof capped
available as at31 December
2003
Total days ofcapped leave
taken
Average numberof days takenper employee
Average cappedleave per
employee as at31 December
2003Lower skilled(Levels 1-2) 21 538 11 1 26Skilled(Levels 3-5) 31 736 63 2 24Highly skilledproduction(Levels 6-8)
146 5 895 342 2 40
Highly skilledsupervision(Levels 9-12)
46 2 690 - - 58
Senior management(Levels 13-15) 7 963 - - 138
Total 251 10822 416 2 43
TABLE 9.5 – Leave payouts for the period 1 April 2003 to 31 March 2004
Reason Total Amount(R’000)
Number ofEmployees
Average paymentper employee
(R’000)* Leave payout for 2003 due to non-utilisation of leave for the previous cycle 12 3 4
Current leave payout on termination of service for 2003/04 312 16 20 Leave payouts for 2003/04 due to Long Service Recognition for 20/30 years service 23 3 8
Total 347 22 16
100

10. HIV/AIDS & Health Promotion Programmes
TABLE 10.1 – Steps taken to reduce the risk of occupational exposure
Units/categories of employees identified to be at high risk ofcontracting HIV & related diseases (if any)
Key steps taken to reduce the risk
Not known
TABLE 10.2 – Details of Health Promotion and HIV/AIDS Programmes
Question Yes No Details, if yes
1. Has the department designated a member of the SMS to implement theprovisions contained in Part VI E of Chapter 1 of the Public ServiceRegulations, 2001? If so, provide her/his name and position.
Mr GK Erasmus (SMS)Mr D Swanson (HIV/AIDSCo-ordinator
2. Does the department have a dedicated unit or has it designated specificstaff members to promote the health and well being of your employees? Ifso, indicate the number of employees who are involved in this task and theannual budget that is available for this purpose.
One official per floor level-5 Members of SHEcommittee with specificreference to HIV/Aids.
3. Has the department introduced an Employee Assistance or HealthPromotion Programme for your employees? If so, indicate the keyelements/services of this Programme.
No specific health budget.
4. Has the department established (a) committee(s) as contemplated inPart VI E.5 (e) of Chapter 1 of the Public Service Regulations, 2001? If so,please provide the names of the members of the committee and thestakeholder(s) that they represent.
SHE Members have aspecific role to play.Labour and EmployeeRelations Section hasbeen specifically taskedwith the above. H Davids K Vrede N Wentzel AJ Canham M van Niekerk
5. Has the department reviewed its employment policies and practices toensure that these do not unfairly discriminate against employees on thebasis of their HIV status? If so, list the employment policies/practices soreviewed.
All policies explicitlyprohibit any form of unfairdiscrimination.
6. Has the department introduced measures to protect HIV-positive employees or those perceived to be HIV-positive from discrimination? Ifso, list the key elements of these measures.
1. HIV/AIDS Programmes- 21/10/2003 till
03/11/2003- 03/03/2004 till
11/03/20042. Knowledge
empowerment, understanding and removal of unfounded perceptions.
7. Does the department encourage its employees to undergo VoluntaryCounseling and Testing? If so, list the results that you have achieved. 4 VCT
8. Has the department developed measures/indicators to monitor &evaluate the impact of its health promotion programme? If so, list thesemeasures/indicators.
- Baseline KAB Survey- Pre & Post Test
Counseling (VCT)
Safety & Health Environment (SHE) & HIV and AIDS CommitteeKnowledge, Attitude and Behaviour (KAB)
101

11. Labour Relations
No collective agreements were entered into with trade unions within the Department.
TABLE 11.1 – Misconduct and disciplinary hearings finalised, 1 April 2003 to 31 March 2004
Outcomes of disciplinary hearings Number % of total
Correctional counselling - -
Verbal warning - -
Written warning 1 50
Final written warning - -
Suspended without pay 1 50
Fine - -
Demotion - -
Dismissal - -
Not guilty - -
Case withdrawn - -
Total 2 100
TABLE 11.2 – Types of misconduct addressed at disciplinary hearings for the period 1 April 2003to 31 March 2004
Type of misconduct Number % of total
Unauthorised absence - -
Refusal to obey lawful instruction - -
Unauthorised use of Government vehicle - -
Under influence - -
Unbecoming conduct 1 100
Total 1 100
102

TABLE 11.3 – Precautionary suspensions for the period 1 April 2003 to 31 March 2004
Number of people suspended 1
Number of people whose suspension exceeded 30 days 1
Average number of days suspended 61
Cost (R’000) of suspensions -
There were no costs involved during the reporting period as the salary of the suspended officer was frozenduring the suspension period.
103

12. Skills development
The tables reflect the training needs as at the beginning of the period under review and the actual trainingprovided. The Cape Administrative Academy (CAA) at the Provincial Administration Western Capepresents skills programmes and other short courses. The other forms of training reflect training providedby external providers, e.g. computer training, job-specific courses, etc.
TABLE 12.1 – Training needs identified for the period 1 April 2003 to 31 March 2004
OccupationalCategory
Gender Number ofemployees asat 1 April 2003
Training needs identified at start of reporting period
Learner ships SkillsProgrammes &
other shortcourses
Other forms oftraining
Total
Legislators,senior officialsand managers
Female 1 - 3 - 3
Male 5 - 3 - 3
ProfessionalsFemale 5 - 3 - 3
Male 18 - 5 - 5
Techniciansand associateprofessionals
Female 7 - 17 1 18
Male 59 - 14 - 14
ClerksFemale 120 - 50 3 53
Male 66 - 52 2 54
Service andsales workers
Female - - - - -
Male 1 - - - -Skilledagricultureand fisheryworkers
Female - - - - -
Male - - - - -
Craft andrelated tradesworkers
Female - - - - -
Male - - - - -Plant andmachineoperators andassemblers
Female - - - - -
Male 2 - - - -
Elementaryoccupations
Female 4 - - 1 1
Male 19 - - - -
Sub TotalFemale 137 - 73 5 78
Male 170 - 74 2 76
Total 307 - 147 7 154
104
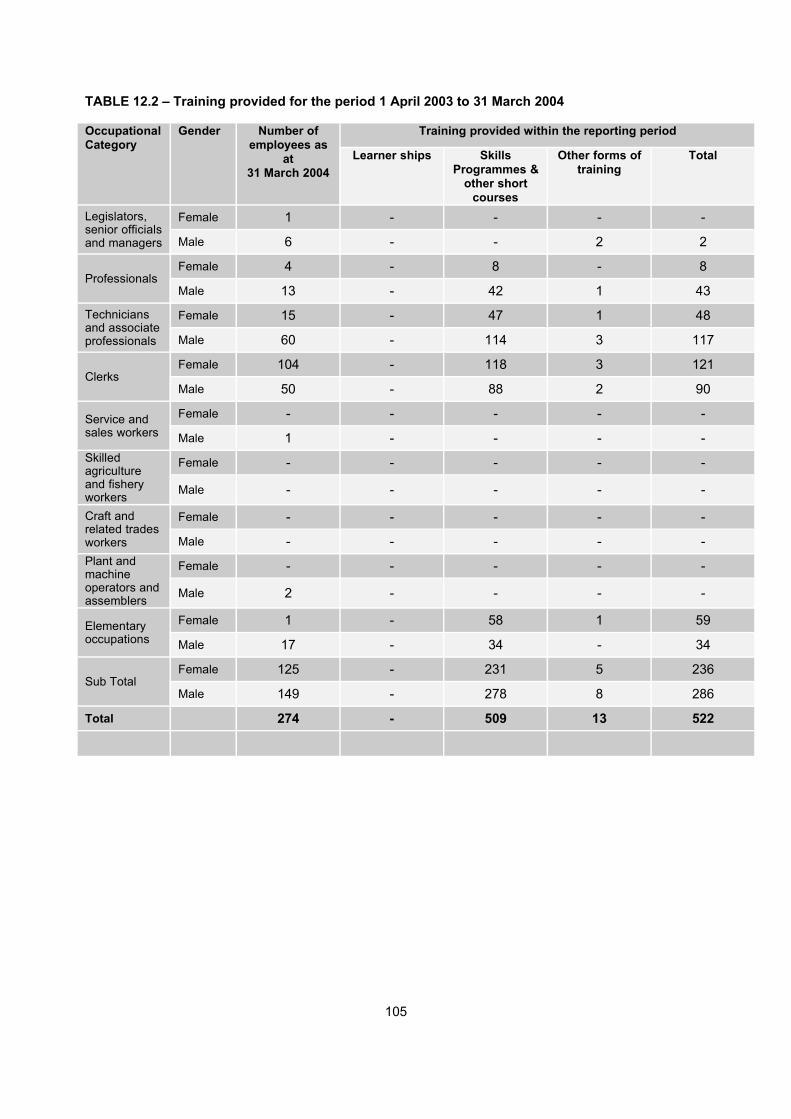
TABLE 12.2 – Training provided for the period 1 April 2003 to 31 March 2004
OccupationalCategory
Gender Number ofemployees as
at31 March 2004
Training provided within the reporting period
Learner ships SkillsProgrammes &
other shortcourses
Other forms oftraining
Total
Legislators,senior officialsand managers
Female 1 - - - -
Male 6 - - 2 2
ProfessionalsFemale 4 - 8 - 8
Male 13 - 42 1 43
Techniciansand associateprofessionals
Female 15 - 47 1 48
Male 60 - 114 3 117
ClerksFemale 104 - 118 3 121
Male 50 - 88 2 90
Service andsales workers
Female - - - - -
Male 1 - - - -Skilledagricultureand fisheryworkers
Female - - - - -
Male - - - - -
Craft andrelated tradesworkers
Female - - - - -
Male - - - - -Plant andmachineoperators andassemblers
Female - - - - -
Male 2 - - - -
Elementaryoccupations
Female 1 - 58 1 59
Male 17 - 34 - 34
Sub TotalFemale 125 - 231 5 236
Male 149 - 278 8 286
Total 274 - 509 13 522
105

13. Injury on duty
TABLE 13.1 – Injury on duty, 1 April 2003 to 31 March 2004
Nature of injury of duty Number % of total
Required basic medical attention only 5 100
Temporary Total Disablement - -
Permanent Disablement - -
Fatal - -
Total 5 100
14. Utilisation of Consultants
No consultants were used to perform normal departmental functions for the period under review.
106