Embed Size (px)
DESCRIPTION
In the mid to late 1990's, the United States Air Force responded to a General Accounting Office inquiry regarding what has become known as the "Roswell Incident" with two reports explaining the Air Force's version of the events. The "Roswell Incident" refers to witness accounts of debris from an Unidentified Flying Object (UFO) and alien corpses from the alleged UFO crash near the town of Roswell, New Mexico. The second of the reports addresses the likelihood that the "alien corpses" seen in the New Mexico desert were actually anthropomorphic dummies from high-altitude parachute drops conducted with dummies from the Aero Medical Laboratory at Wright Air Development Center. Both are available here at NavyUFO.org for you to download.
Citation preview

WADC/WADD Digital Collection at the Galvin Library, IIT
The Roswell Report Fact Vs. Fiction in the New Mexico Desert
The Roswell Report was divided into five parts due to the large size of the document. At the beginning and end of each division we have included a page to facilitate access to the other parts. In addition we have provided a link to the entire report. In order to save it, you should right-click on it and choose save target as. This is considered the best way to provide digital access to this document.
To go back to the previous part of this document, click here
This document, along with WADC/WADD technical reports, and further research materials are available from Wright Air Development Center Digital Collection at the Galvin Library, Illinois Institute of Technology at:
http://www.gl.iit.edu/wadc
8. Memo, Brig Gen Tom C. Rives to Maj Gen Curtis LeMay, subj: Relief of Major R.T. Crane as Project Officer for MOGUL and TORRID, June 18, 1946
9. Memo, Maj Gen Curtis E. LeMay to Maj Gen L.C. Craigie, April 16, 1947
10. New York University, Constant Level Balloons, Final Report, March 1, 1951
11. New York University, Constant Level Ba/loons, Section 1, General, November 15, 1949
12. New York University, Constant Level Balloons, Section 3, Summary of Flights, July 15, 1949
13. New York University, Technical Report No. 1, Constant Level Balloon, April 1, 1948
14. Athelstan F. Spilhaus, C.S. Schneider, C.B. Moore, “Controlled-Altitude Free Balloons,” Journal of Meteorology, Vol. 5, August 1948
15. New York University, Progress Report No. 6, Constant Level Balloon, Section II, June 1947
16. New York University, Special Report No. I, Constant Level Balloon, May 1947
17. Personal Journal of Albert P. Crary 18. New York University, Progress Report [No. 71, Constant Level Balloon,
Section II, July 1947 19. New York University, Progress Report No. 4, Radio Transmitting,
Receiving and Recording System for Constant Level Balloon, [Section I], April 2, 1947
20. Interview, Co1 Jeffrey Butler and 1st Lt James McAndrew with Professor Charles B. Moore, June 8, 1994
21. Report, Holloman AFB, “Progress Summary Report on U.S.A.F. Guided Missile Test Activities,” August 1, 1948
22. Interview, [Co1 Jeffrey Butler and 1st Lt James McAndrew with] Co1 Albert CTrakowski, USAF (Ret., June 29, 1994
23. Report, Cambridge Field Station, Air Materiel Command, “Review of Air Materiel Command Geophysical Activities by Brigadier General D.N. Yates, and Staff, of the Air Weather Service,” February 10, 1949
24. New York University, Constant Level Balloons, Section 2, Operations, January 31, 1949
25. Combined History, 509th Bomb Group and Roswell Army Airfield, September I-30, 1947
Attachment to Colonel Weaver’s Report of Air Force Research: 33. Mensuration Working Paper, with Drawing and Photo
xiv
New York University Constant Level Balloons Section 3, Summary of Flights July 15, 1949

Technical Report No. 93.02
CONSTANTLZVELSALLOOM Section 3
SUbMRY OF FLIGHTS
Constant Level Balloon Project New York University
Prepared in Accordance with provisions of Contract W28-099-ac-241, between
Watson Laboratories, Red Bank, New Jersey and
New York University
The research reported in this document has been nade possible through support and eponsorship extended by the Geophysical Research Directorate of the Cambridge Field Station, m, U. S. Air Force, under Contract No. W28-099 ac-241. It is published for technical infornaticn only and does not rspre- sent recommendations or conclusions of the sponsoring agency.
Prepared by: hw 7;.
James R. Smith
Dr. Harold K. Work Director of the Research Division
College of Blgineering New York University
15 July 1949 New York 53, New York
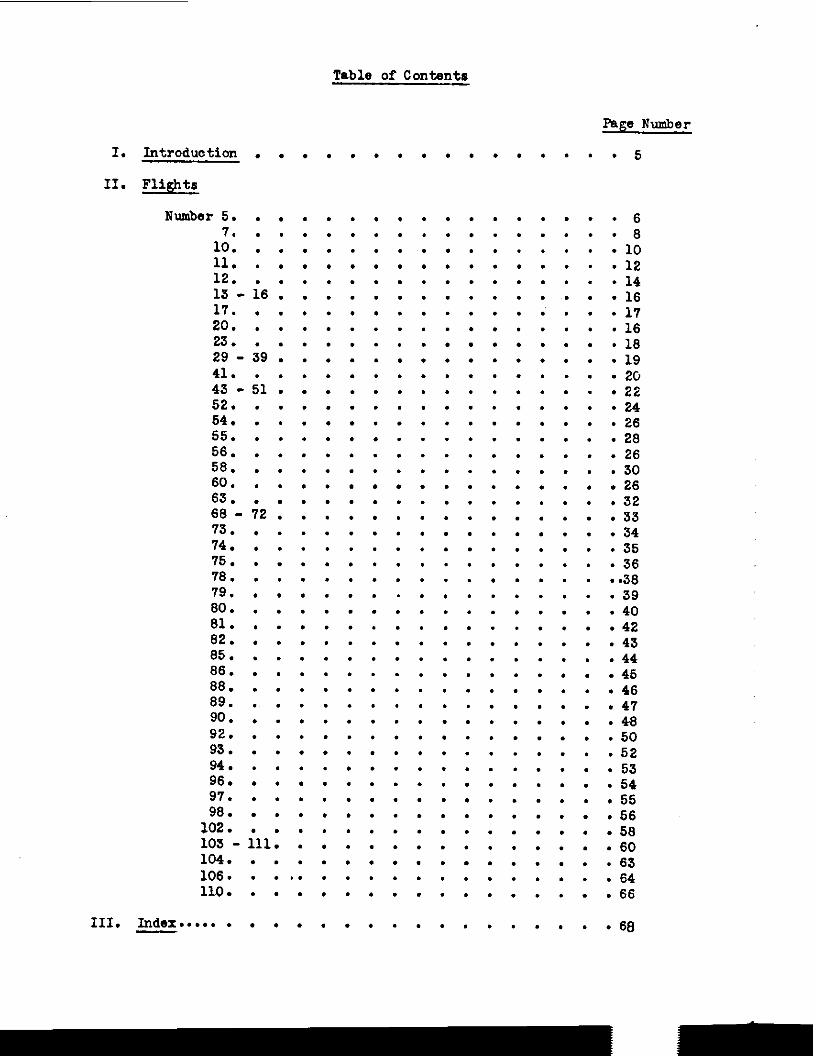
Table of Contents
Page Number
I. Introduction . .
II. Flights
lhmbsr 5. . .
1:: : : 11. . . 12. 13 - i6 1 17. . . 20. . . 2s. . . 29 - 39 . 41. . . 43 - 51 . 52. . . 54. . . 55. . . 56. . . 50. . . 60. . . 63. . 66 - ;2 . 73. . . 74. . . 75. . . 76. . . 79. . . 80. . . 61. . . 62. . . 65. . . 66. . . 66. . . 89. .~ . so. l .
92. . .
93. . .
94. . .
96. . . 97. . .
12 : : 103 - 111. 104. . .
.
.
.
. . . . . . . . . . . . . . . . . . . . . . . . . . . . . . . . . . . . . . . .
106. . . . . 110. . . .
III. Index..... . . . . .
.
.
.
.
.
. . . . . . . . . . . . . . . . . . . . . . . . . . . . . . . . . . . . . . . .
.
. . . . . . . . . . . . . . . . . . . . . . . . . . . . . . . . . . . . . . . . . . . .
.
.
.
.
.
.
.
.
.
.
.
.
.
.
. . . . . . . . . . . . . . . . . . . . . . . . . . . . . . .
.
.
.
.
.
.
.
.
.
.
.
.
.
. . . . . . . . . . . .
.
. . . . . . . . . . . . . . . . . .
. . . .
.
.
.
.
.
.
.
.
.
. . . . . . . . . . . . . . . . . . . . . . . . . . . . . . . . . . . .
.
.
.
.
.
.
.
.
.
. . . . . . . . . . . . . . . . . . . . . . . . . . . . . . . . . . . . .
.
.
.
.
.
. . . . . . . . . . . . . . . . . . . . . . . . . . . . . . . . . . . . . . . .
.
.
.
. . . . . . . . . . . . . . . . . . . . . . . . . . . . . . . . . . . . . . . . . .
. . .
.
.
.
.
.
.
.
.
.
.
.
.
.
. . . . . . . . . . . . . . . . . . . . . . . . . .
.
. . . . . . . . . . . . . . . . . . . . . . . . . . . . . . . . . . . . . . . . . . . .
.
.
.
.
.
.
.
.
.
.
.
. . . . . . . . . . . . . . . . . . . . . . . . . . . . . . . . . .
.
.
.
.
.
.
.
.
.
.
.
.
.
.
. . . . . . . . . . . . . . . . . . . . . . . . . . . . . . .
l 5
.6
.6
. 10
. 12 * 14 l 16 * 17 . 16 . 16 * 19 . 2G l 22 l 24 . 26 . 26 . 26 . 30 . 26 . 32 . 33 . 34 . 35 . 36 ..36 . 39 . 40 . 42 . 43 . 44 . 45 . 46 . 47 .46 . 50 . 52 . 53 . 54 . 55 . 56 . 56 . 60 . 63 . 64 . 66
. . . l 68
Introduction
In November, 1946 the Besearoh Division of the College of Engineering of New York University contraoted with Watson laboratories, AX, to develop and fly oonstant-level instrument-carrying balloons. lhis is the third part of the final report on the work accomplished and describes the experimental balloon flights which wers made.
In reviewing the flights a nmaber of analytioal aomments may be made. In most flights one objective was the maintenance of the balloon at a constant pressure level for as long as possible. On many flights balloon behavior was affected by inetrmuental controls of one kind or another while on some flights no controlsat all were used.
Balloons of varying sizes and of different principles of construction have been launched singly, ,d.n tandem and in clusters. On 8ome. tempreturea eere measured and on others the flight Perth was an objeot of special study. To explain certain obsewed flight data a careful analysis of atmospheric stability has been made, while other flights have special significance be- oause they demonstrate the effect of superheat on the lifting gas or some other feature of analytical importanoe.
Since over 100 flights have been made, it is diffioult to tabulate the important results obtained on each specific flight. To present the data u%ich has been collected each significant flight is presented chronologlaally, with drawings and details where necessary, and a summary of the .flight results is,given.
To render this information useful, an index has been prepared with re- ference made to flights which shoe typioal or important results in each
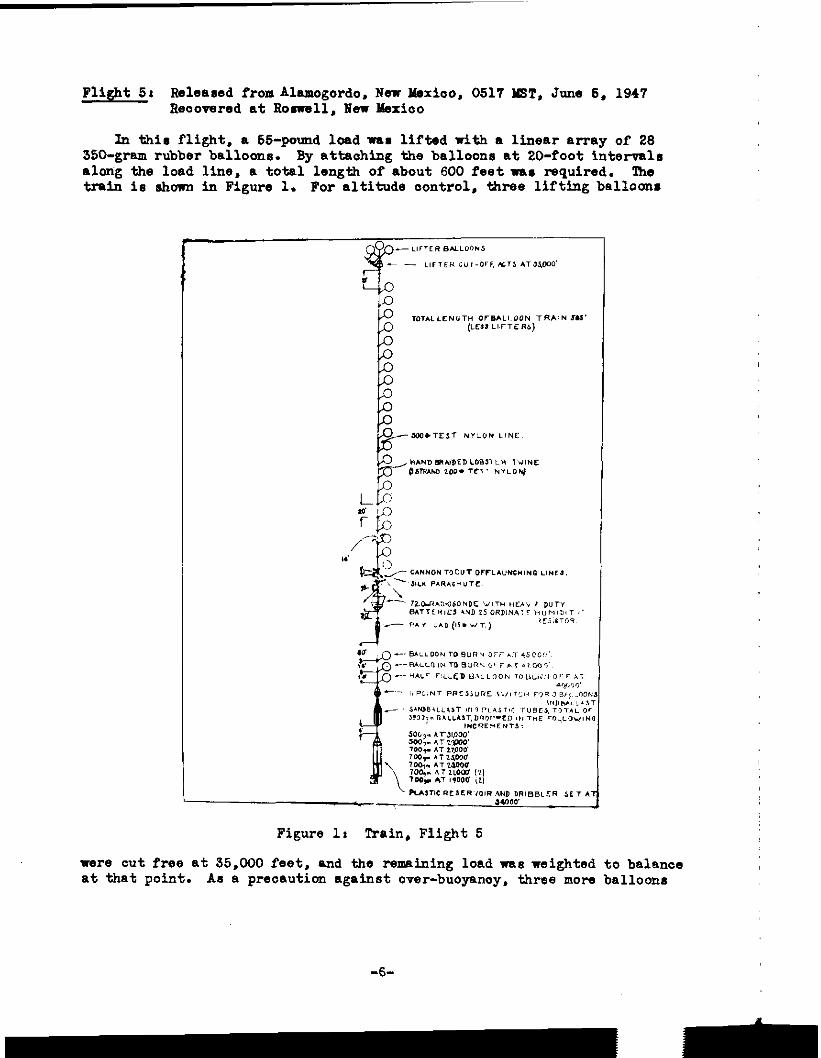
Released from Almnogordo, New Wxioo, 0517 YST. June 5. 1947 Flight 5: Recovered at Roswll, Nm Mexico
In thir flight, a SS-pound load mum lifted with a linear array of 28 350-gram rubber balloons. By attaohing the balloons at 20-foot intervalr alozig the load line, a total length of about 600 feet was required. 'lhe train is shown in Figure 1. For altitude oontrol, three lifting ballocnr
were cut free at 35,000 feet, and the remaining load ma weighted to balance at that point. As a precaution against over-buoyanoy. three more balloon8
- -
rrere to be freed at 40,000, 42,000 and 45,000 feet. The use of sand ballast, to be dropped in increments upon desaent to altitudes below 31,000 feet, wus supplemented by an early model of the automatic ballast valve set to dx- pend liquid ballast at 34,000 feet.
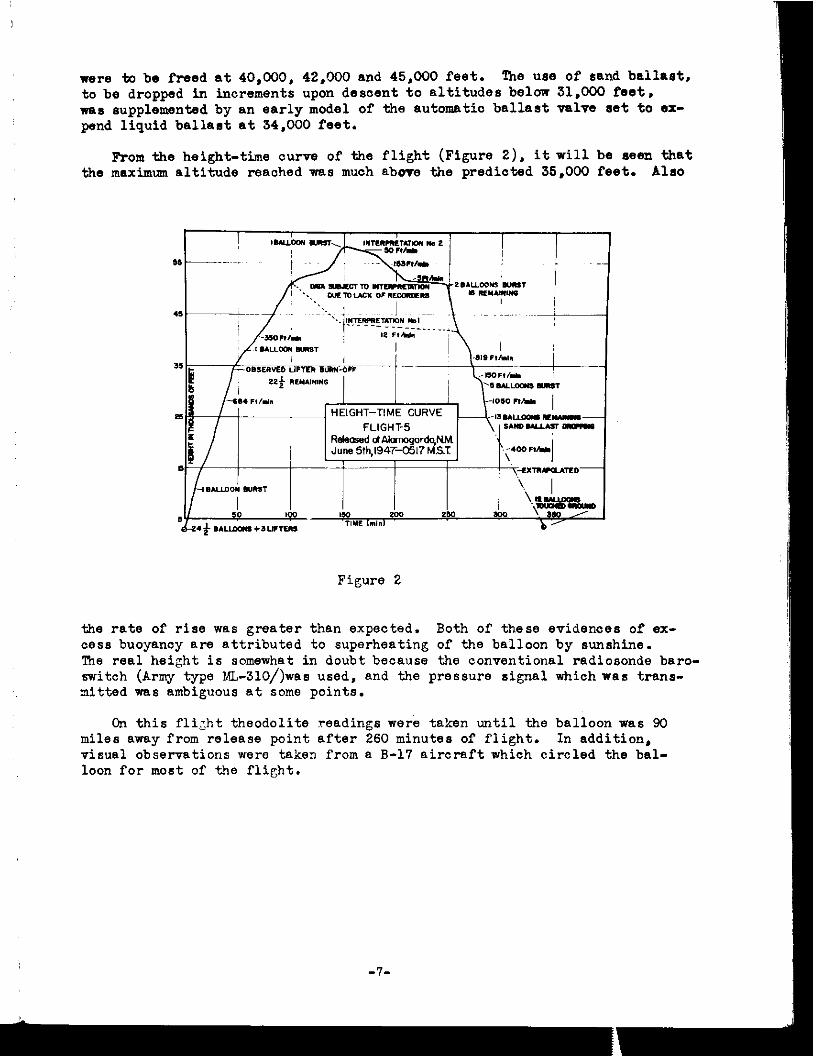
From the height-time curve of the flight (Figure 2). itwill be seen that the maximum altitude reaohed was much above the prediated 35,000 feet. Also
Figure 2
the rate of rise was greater than expected. Both of these evidences of ex- cess buoyanoy are attributed to superheating of the balloon by sunshine. The real height is somewhat in doubt because the conventional radiosonde baro- switch (Army type ML-3lO/)was used, and the pressure signal which was trans- mitted ~8 ambiguous at some points.
On this flight theodolite readings were taken until the balloon v8.s 90 miles away from release point after 260 minutes of flight. In addition, visual observations were taken from a B-17 aircraft which circled the bal- loon for most of the flight.
-7-
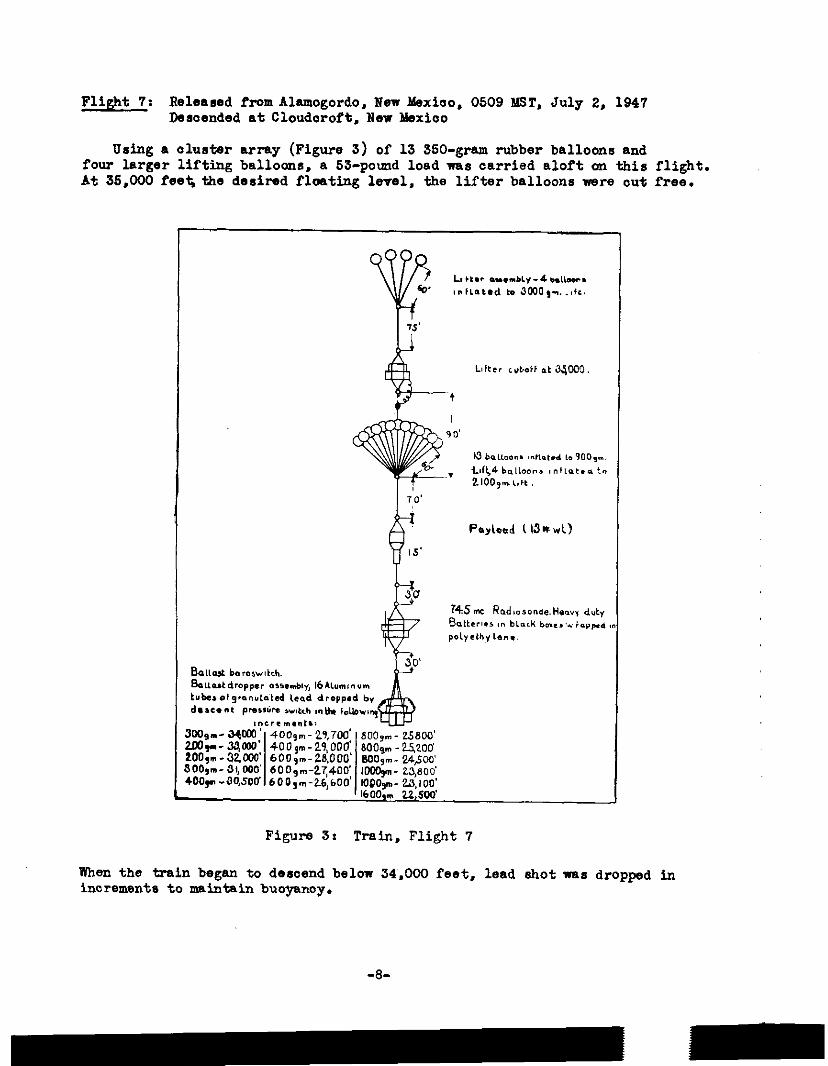
Flight 7: Released fromblamogordo, Hew Mexico, 0509 ?d3T, July 2, 1947 Descended at Cloudoroft, Raw Mexico
Using a olustm array (Figure 3) of 13 350-gram rubber balloons and four larger lifting balloons, a 53-pound load was carried aloft ~II this flight. At 35,000 fee< the desired floating level, the lifter balloons were cut free.
f& Payload t l3cwt)
1600,m 22,500'
Figure 3: Train,Flight7
laden the train began to desaend below 34.000 feet, lead shot was dropped in increments to maintain buoyanoy.
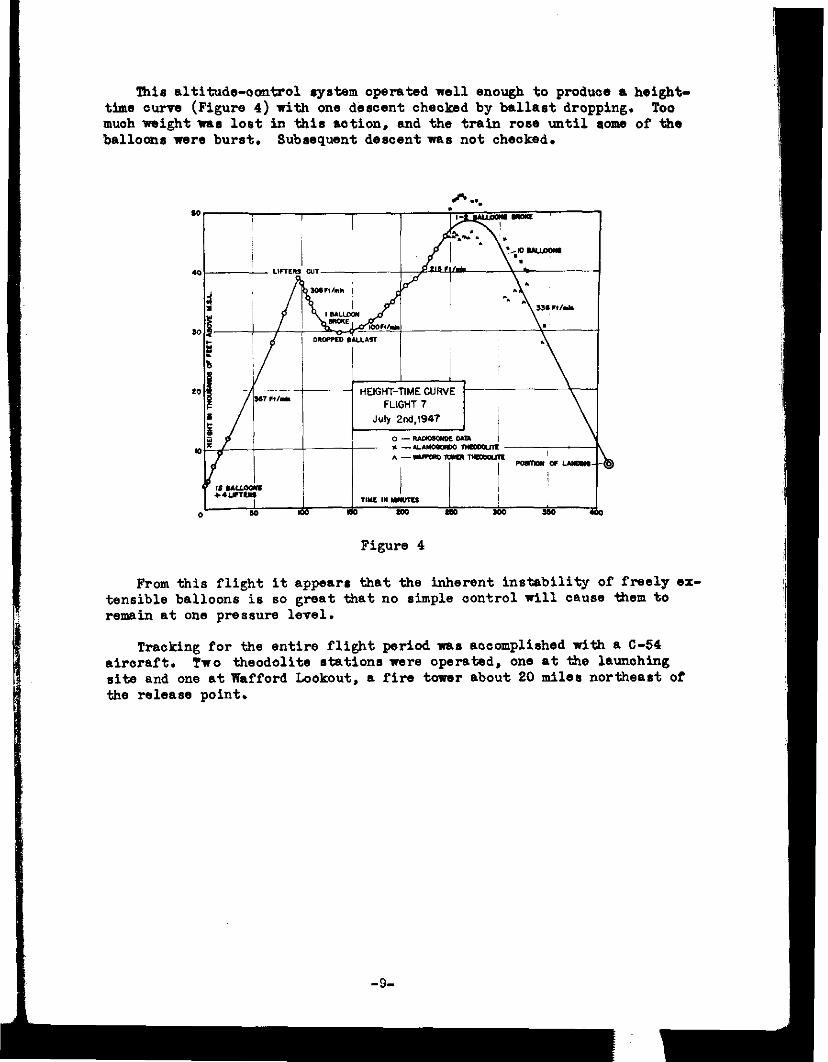
This altitude-oontrol rystem operated well enough to produoe a height- time ourw (Figure 4) with one descent checked by ballast dropping. Too muoh vsight war lost in this uotion, and the train rosa until some of the balloons were burst. Subsequent descent was not cheoked.
I B
Figure 4
From this flight it appears that the inherent instability of freely ex- tensible balloons is so great that no simple control will cause &em to remain at one pressure level.
Tracking for the entire flight period nap accomplished with a C-54 airoraft. Two theodolite stations were operated, one at the launching site and one atmafford Lookout, a fire toner about 20 miles northeast of the release point.
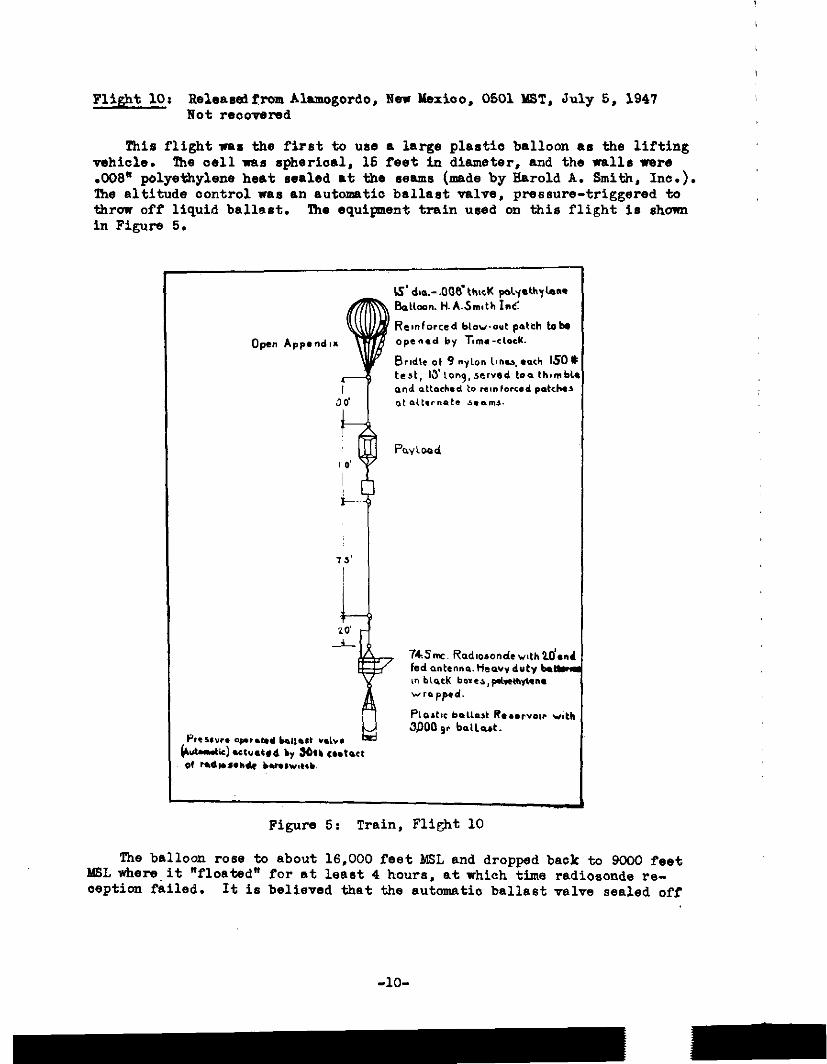
Plight 10: Releasedfrom Alamogordo, New liexioo, OS01 YLST, July 5, 1947 Not recovered
This flight was the first to use a large plaatio balloon as the lifting vehicle. The cell was spheriaal, 15 feet in diameter, and the walls were ,008' polyethylene heat sealed at the seams (made by Harold A. Smith. Ina.). lhe altitude control was an automatic ballast valve, pressure-triggered to throw off liquid ballast. lhe equiwent train used on this flight is shown in Figure 5:
Figure 5: Train, Flight 10
The balloon rosa to about 16,000 feet M6L and dropped back to 9000 feet MSL whara.it "floated" for at least 4 hours, at which time radiosonde re- oaption failed. It is believed that the automatio ballast valve sealed off
-lO-
properly at 12,000 feet, but the air entrapped,in its aneroid was hoeted and oauwd the operating level to be at the lower value. 'hia would correspond to a superheat of SWC above the air t-3mperatum.
Later flights showed that the type of load n%tUobUBnt used on tbia hallow wan unsatisfahx-y; how-r, with proper rigging. oslla of .008" thiolmess were good vehioles as they urually shoued r~ry 10lr diffusion and gas leakage.
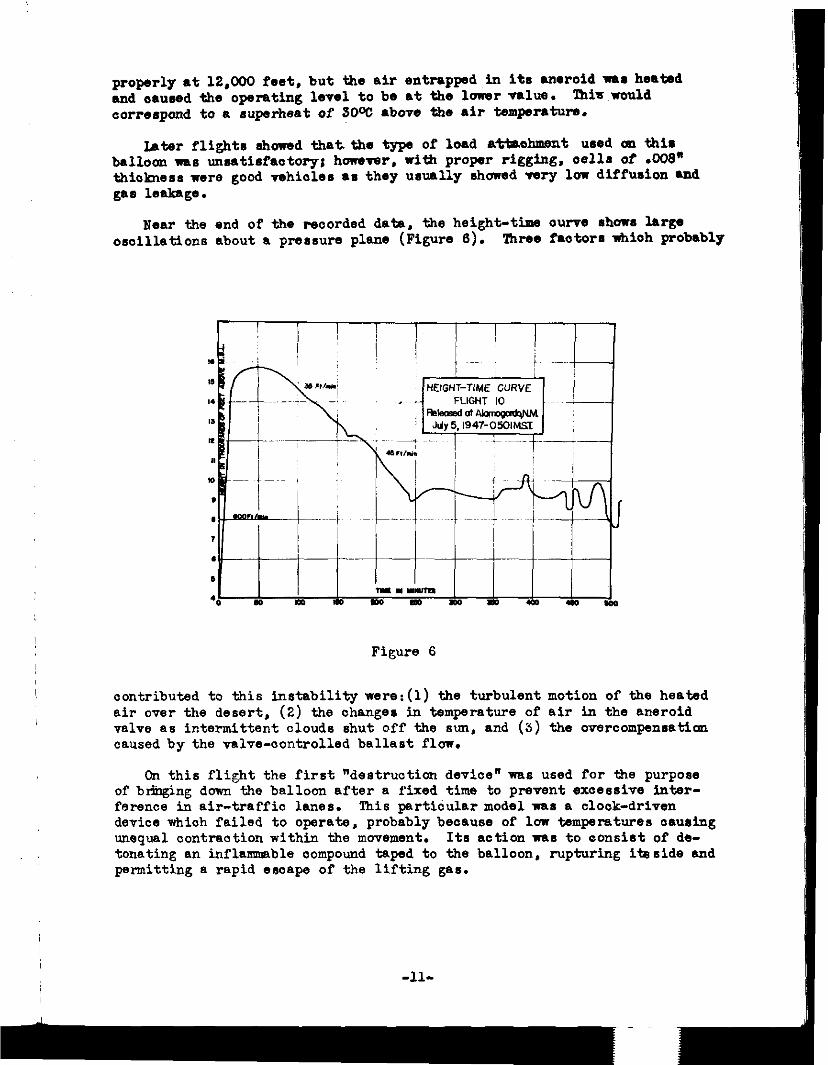
Near the end of the recorded data, the height-time ourve 8hows large osolllations about a pressure plane (Figure 6). lhres faotora nbioh probably
HEIGHT-TIME CURVE
Figure 6
oontributed to this instability were:(l) the turbulent motion of the heated air over the desert, (2) the changes in temperature of air in the aneroid valve as intermittent clouds shut off the sun, and (3) the overcompensatica caused by the valve-controlled ballast flow.
On this flight the first "destruction device" was used for the purpose of br5hging down the balloon after a fixed time to prevent excessive inter- ference in air-traffic lanes. This particular model was a clock-driven device which failed to operate, probably beoause of low temperatures oauring unequal contraction within the movement. Ita action was to consist of de- tonating an inflammable compound taped to the balloon, rupturing iteside and permitting a rapid eaoape of the lifting gas.
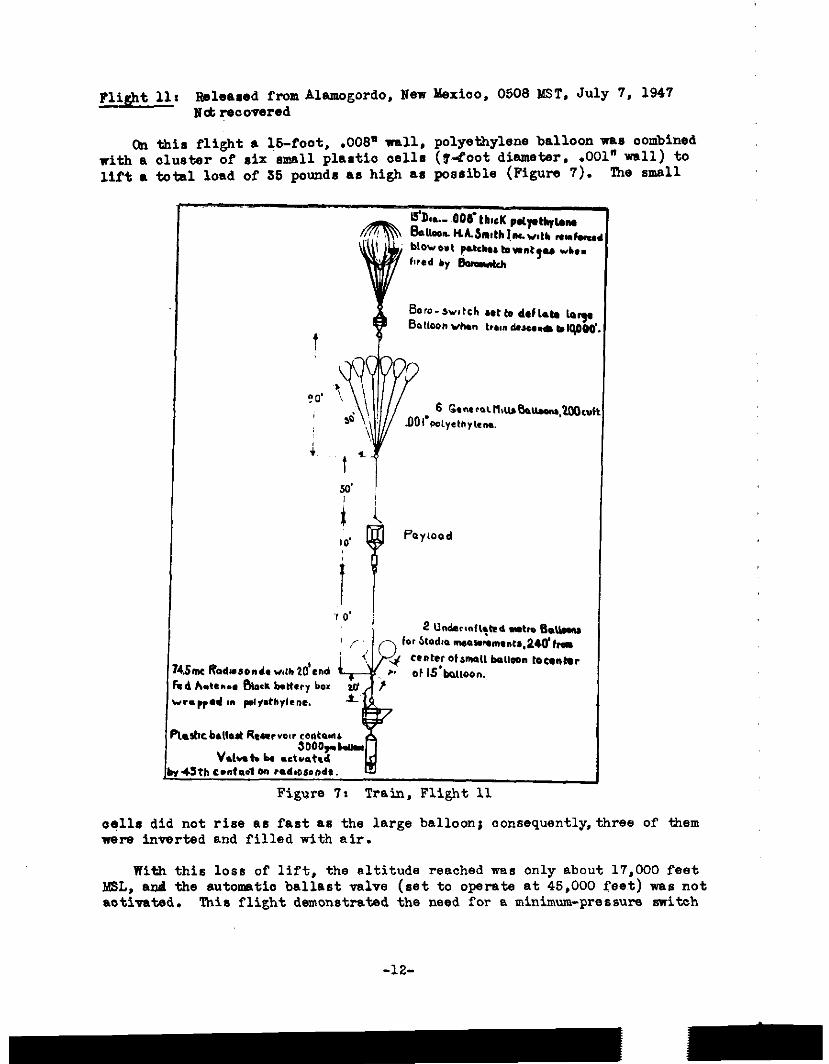
Flight 11: Rsleared from Alamgordo, New &xico, 0508 MST, July 7, 1947 N&recovered
On this flight n 16-foot. .008* wall, polyethylene balloon wan combined with a cluster of six'small plarti-o as118 (@foot diameter, .OOl" wall) to lift. total load of 55 pounds ae high aa possible (Figure 7). The small
14&m fbdmbond. ,,a, 2drnd hd Aden.. 6k.k bttwv box tc
wr.ppd I” pdv*thvlrne. 2 7
Figure 7: Train, Flight 11
o+s did not rise as fast as the large balloon; consequently,three of them were inverted and filled with air.
With this loss of lift, the altitude reached was only about 17,000 feet MSL, and the automatic ballast valve (set to operate at 45,000 feet) was not aotivatad. This flight demonstrated the need for a minimum-pressure switch
-12-
to activate the ballast valve. A fixed ballast leak of about 400 grams per hour was caused' by a defective valve fitting and this was sufficbnt to maintain the balloon at nearly constant level until all the ballast was exhausted. Following this experience, the use of a preset fixed leak wae employed on many flights.
The very unstable "floating" seen on Flight 10, when the automatic ballast valve controlled the flight, is not found on this flight Nhere the vehicle used only a fixed-leak control. This eliminates both the over- oompensation and the serious effects of temperature changes on the aneroid capsule,whioh are found when the automatic ballast valve is used.
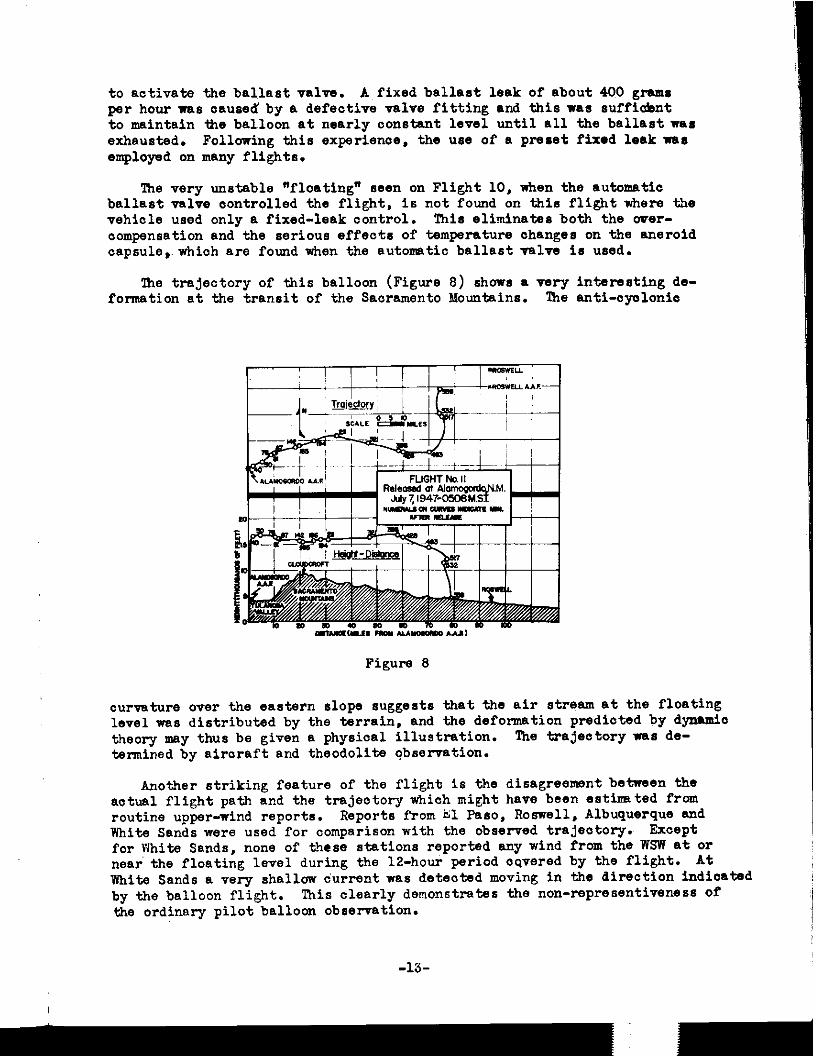
lhe trajectory of this balloon (Figure 8) shows a very interesting de- fornation at the transit of the Sacramento Mountains. The anti-cyolonic
Figure 8
curvature over the eastern slope suggests that the air stream at the floating level was distributed by the terrain, and the deformation predicted by dynamio theory may thus be given a physical illustration. !l'he trajeatory was de- termined by airoraft and theodolite observation.
Another striking feature of the flight is the disagreement between the actual flight path and the trajeatory which might have been estixated from routine upper-wind reports. Reports from hl Paso, Roswell, Albuquerque and White Sands were used for comparison with the observed trajectory. Except for White Sands, none of these stations reported any wind from the WSW at or near the floating level during the 12-hoti period covered by the flight. At bhite Sands a very shallow durrent was detected moving in the direction indicated by the balloon flight. This clearly demonstrates the non-representiveness of the ordinary pilot balloon observation.
-1%
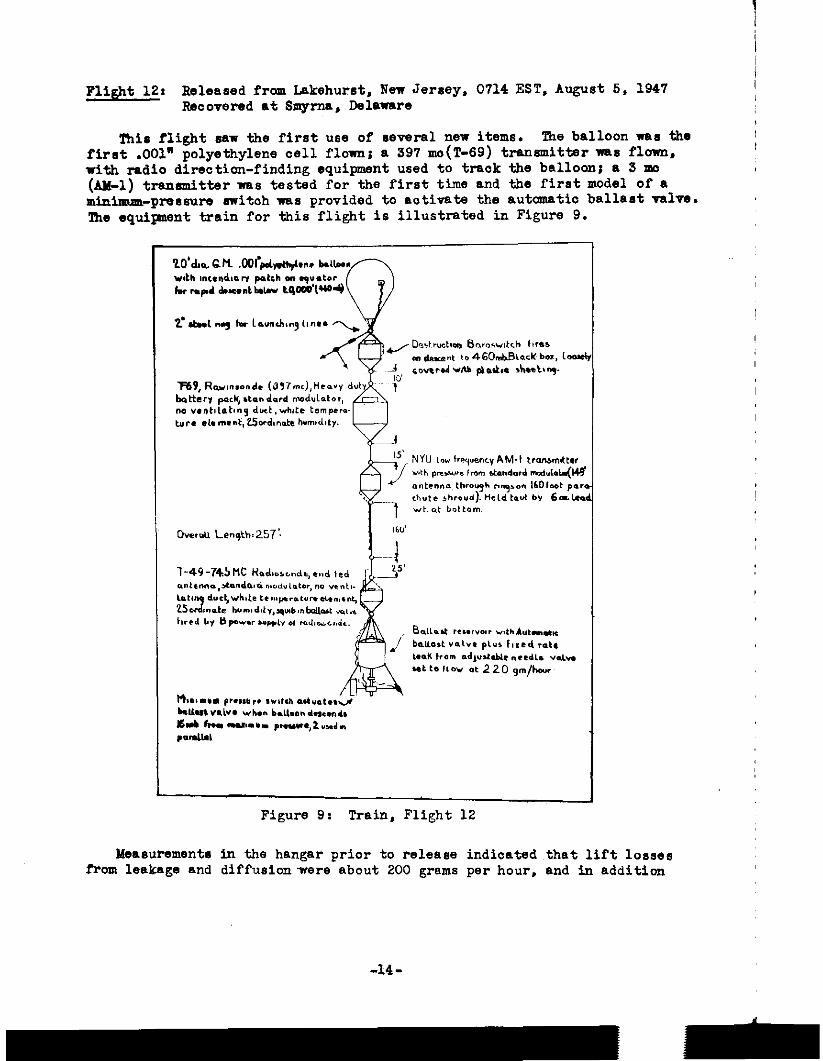
Flight 12: Released from Lakehurst, New Jersey. 0714 EST, August 5. 1947 Reaovemd at Smyrm, Delaware
This flight saw the first use of several new items. The balloon ms the first .OOl" polyethylene cell flowni a 397 mo(T-69) tnnsmitter was flom. with radio direction-finding equipment used to track the ballooni a 3 m (AM-l) transmitter was tested for the first time and the first model of a minimum-pmasure switch was provided to aotiwte the automa.tic ballast ral~e. The equipment train for this flight is illustrated in Figure 9.
Figure 9: Train, Flight 12
Measummento in the hangar prior to release indicated that lift losses from leakage and diffusionwere about 200 grams per hour, and in addition
I, to the automatic ballast valve system, a fixed-flow needle valve lgs set to discharge ballast slightly in ~~088s of the erpeoted 1088. Both ryskrms failed to keep the balloon afloat, and a slow desoant from its maximum alti- , tude of 14,000 feet MSL rasultsd. Ihe axpeoted altitude of 38,000 feet. ms not reached, and this is believed to be due to mixing of the air with the lifting gas during rising. Ihe bottom of the balloon was open with no protecting skirt or valve to keep out air. Sinoe the thin fabric would rupture with an internal pressure of 0.017 psi, sons form of skirt or ax- ternal appendix was suggested for future flights.
Radio reaeption with the 3 mo transmitter was excellent and far sur- passed the performance of either the 72 mo or 594 mo transmitters which wera also flovm.
Because of the low elevation angle of tbs transmitter, the single SCR-658 radio direction-finding equipnt was not of much use for positioning. Traoking by aircraft was satisfaotory throughout the flight.
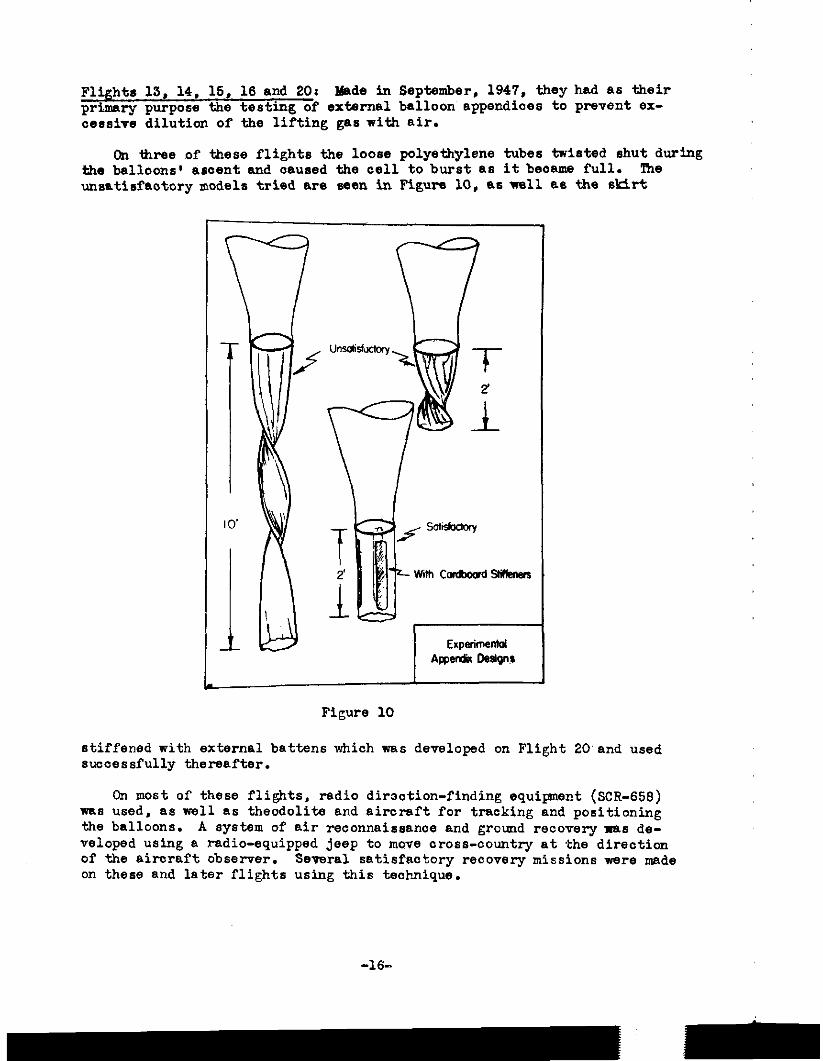
Flights 13, 14, 15, 16 and 20: Made in September, 1947, they had as their primary purpose the testing of external balloon appendices to prevent ex- oessive dilution of the lifting gas with air.
@I three of these flights the loose polyethylene tubes twisted shut during the balloons* ascent and caused the cell to burst as itbeoams full. The unsatisfactory models triad am seen in Figure 10, as well as the skirt
I E~pwimen!d Amrdk 08Sqnr
Figure 10
stiffened with external battens which was developed on Flight 20,and used successfully thereafter.
On most of these flights, radio dirsotion-finding equipment (SCR-656) TM used, as well as theodolits and aircraft for tracking and positioning the balloons. A system of air reconnaissance and grcund recovery nas de- veloped using a radio-equipped jeep to mxe cross-country at the direction of the aimraft observer. Sewral satisfactory recovery missions were made on these and later flights using this technique.
-16-
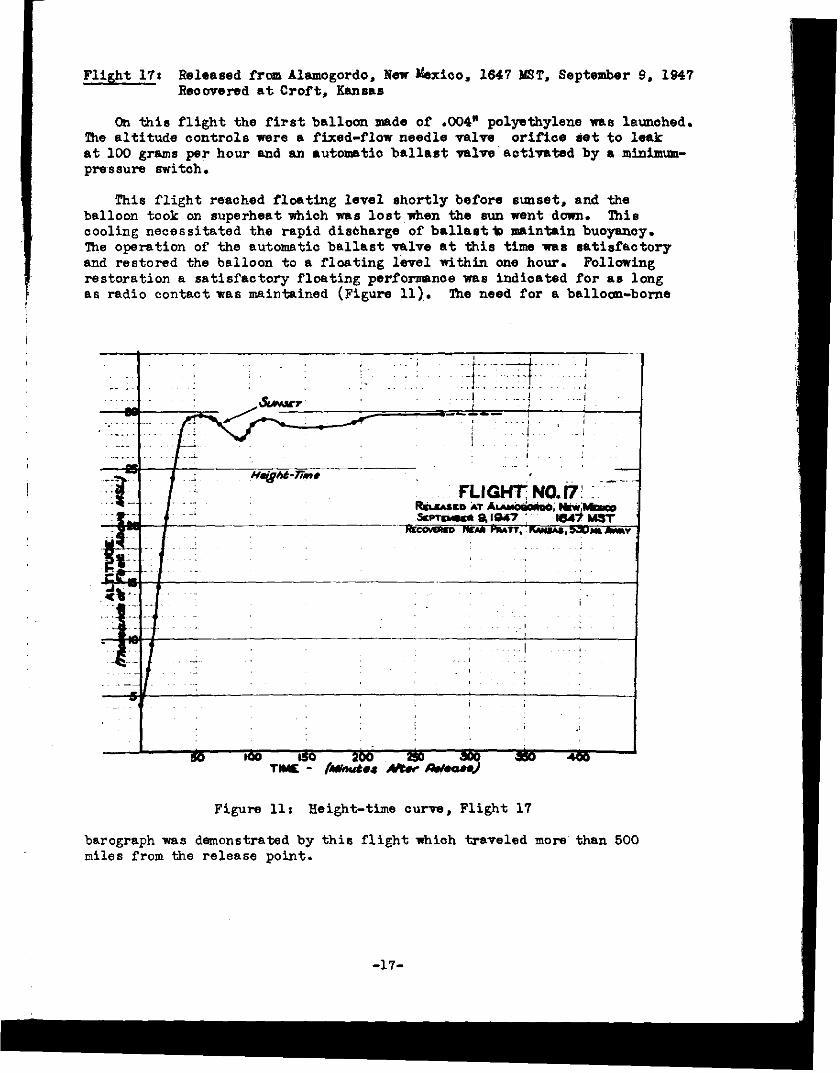
Flight 17: Released from Alamogordo, New &cioo, 1647 MST, September 9, 1947 Recovered at Croft, Kensas
Cn this flight the first balloon made of .004" polyethylene -88 launched. The altitude controls were a fixed-flow needle valve orifice &et to leak at IOC grams per hour and an automatic ballast valve activated by a minimum- prcssurc switch.
This flight reached floating level shortly before sunset, and the balloon took on superheat which NIIS lost,lrhen the sun went dcnn. This cooling necessitated the rapid disbharge of ballast* maintain buoyancy. lbe operation of the automatic ballast valve at this time was satisfactory and restored the balloon to s floating level tithin one hour. Following restoration a satisfactory floating performance was indioated for as long as radio contactras maintained (Figure II),. l'ne need for a balloon-borne
Figure 11: Height-time curve, Flight 17
barograph vms demonstrated by this flightwhioh traveled more than 500 miles from the release point.
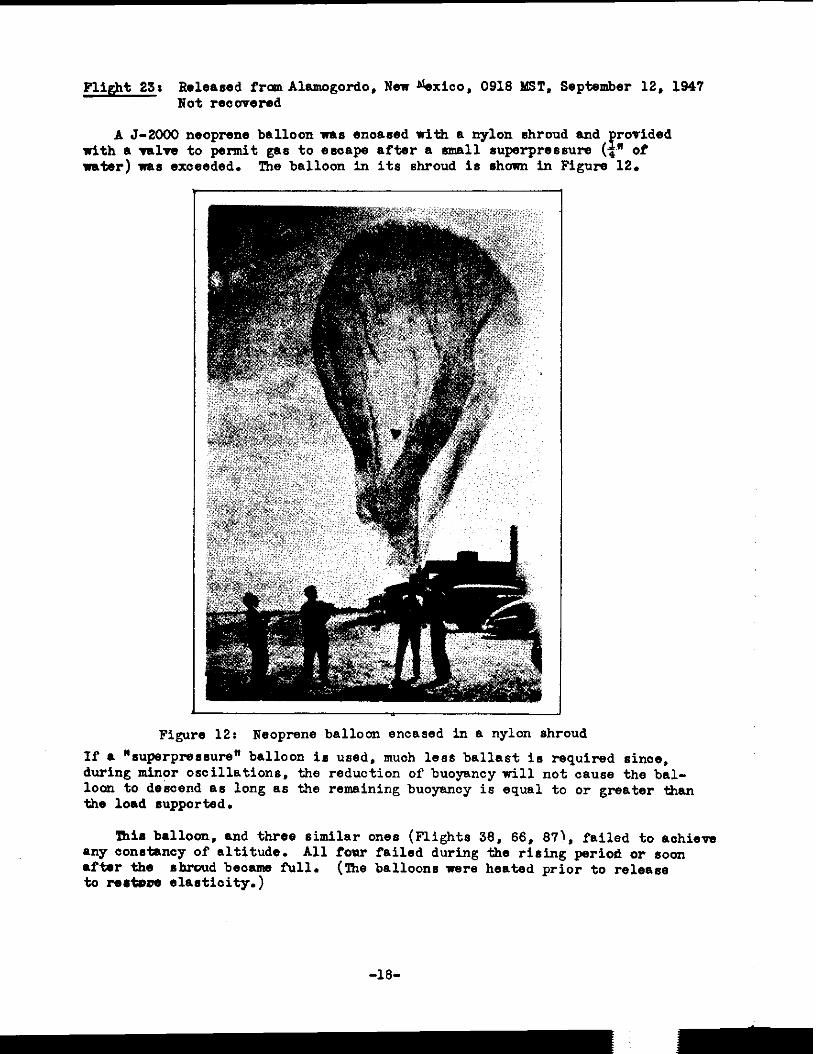
23: Flight, Released from Alamogordo, New udxico, 0916 MST, September 12, 1947 Not recovered
A J-2000 neoprene balloon VIUS enossed with a nylon shroud and P
rovided with a ralw to permit gas to esaape after a wall ruperpressure (,' of ratar) wa6 exceeded. The balloon in its shroud is shown in Figure 12.
Figure 12: Neoprene balloon encased in a nylon shroud If a 'superpressure" balloon ir used, muah less ballast is required sinoe, during minor oscillations, the reduction of buoyancy nil1 not cause the bal- loon to descend as long as the remaining buoyancy is equal to or greater than the load supported.
'Bis balloon, and three similar ones (Flights 36, 66, 67). failed to aohiew any aonstuncy of altitude. All four failed during the rising period or soon aftar the shroud beoams full. t0 lWEtBD6 6166tiOity.)
(Ihe b6lhon6 were heated prior to release
-16-
- -
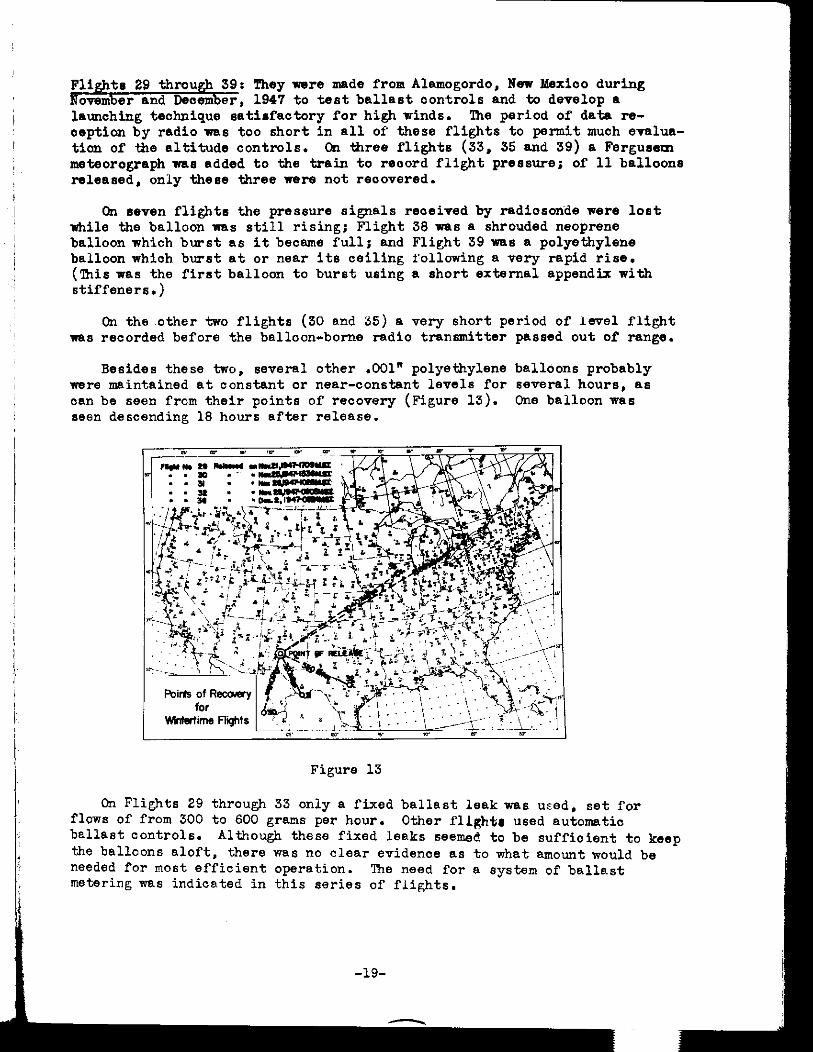
Flight6 29 through 39: They l~lre made from Alamogordo, New AWxioo during iSovember and December, 1947 to test ballast controls and to develop a launching technique satisfactory for high winds. 'Ihe period of data re- aeption by radio was too short in all of these flights to permit much evalua- tion of the altitude controls. On three flights (33, 35 and 39) 8 Fergusem meteorograph wae added to the train to reoord flight pressure; of 11 balloons released, only these three were not recovered.
On eeven flights the pressure signals reoeived by radiosonde were lost tiile the balloon nae still rising; Flight 36 was a shrouded neoprene balloon which burst as it became fulls end Flight 39 was a polyethylene balloon whioh burst at or near its ceiling following 8 very rapid rise. (This was the first balloon to burst using a short external appendix with stiffeners.)
On the.other two flights (30 and 35) B very short period of level flight was recorded before the balloon-borne radio transmitter passed out of renge.
Besides these two. several other .OOl" polyethylene balloons probably vv1-8 maintained at constant or near-constant levels for several hours, as can be seen from their points of recovery (Figure 13). One balloon was 8een descending 18 hours after release.
Figure 13
On Flights 29 through 33 only a fixed ballast leak was used, set for flows of from 300 to 600 grans per hour. Other fllghtm used automatic ballast controls. Although these fixed leaks seemed to be sufficient to keep the balloons aloft, there was no clear evidenae as to what amount would be needed for most efficient operation. !i%e need for e. system of ballast metering was indicated in this series of flights.
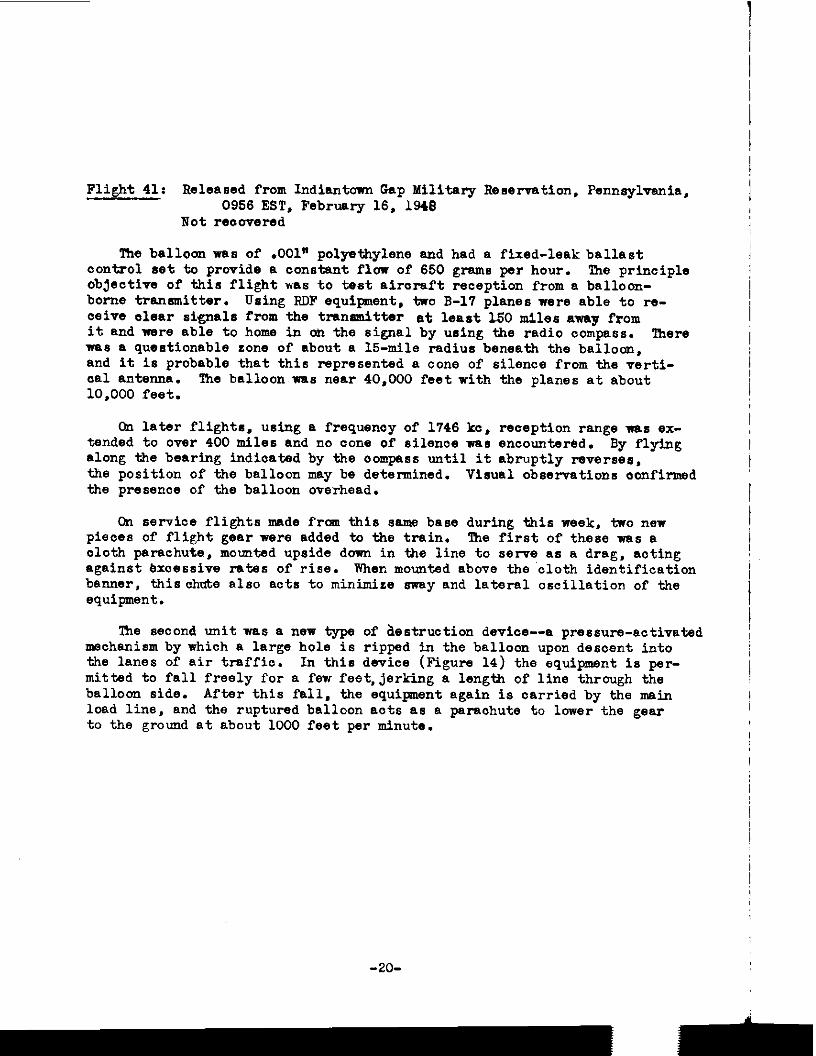
Flight 41: Released from Indiantown Gap Military Reaervetion, Pennsylvania, 0956 EST, February 16, 1948
Hot recovered
The balloon wss of .OOl" polyethylene and had a fixed-leak ballast control set to provide a constant flow of 650 grams per hour. The principle objective of this flight was to test airoraft reoeption from a balloon- borne transmitter. Using RDF equipnent, two B-17 planes were able to re- oeive olsar signals from the transmitter at least 150 miles aHag from it end were able to home in oh the signal by using the radio compass. nlero was a questionable zone of about a 15-mile radius beneath the balloon, and it is probable that this represented a cone of silence from the verti- cal antenna. The balloon ms near 40,000 feet with the planes at about 10.000 feet.
On later flights, using B frequenoy of 1746 kc. reception range was ex- tended to over 400 miles and no ocane of silence -8 encountered. By flying along the bearing indicated by the oompass until it abruptly reverses, the position of the balloon may be determined. Visual observations oonfirmed the presence of the balloon overhead.
On service flights made from this same bass during this week, two new pieoes of flight gear wre added to the train. Ihe first of these was a cloth parachute, mounted upside down in the line to serve as a drag. acting against Bxcessive rates of rise. When mounted above the cloth identification banner, thischute also acts to minimize sway and lateral oscillation of the equipment.
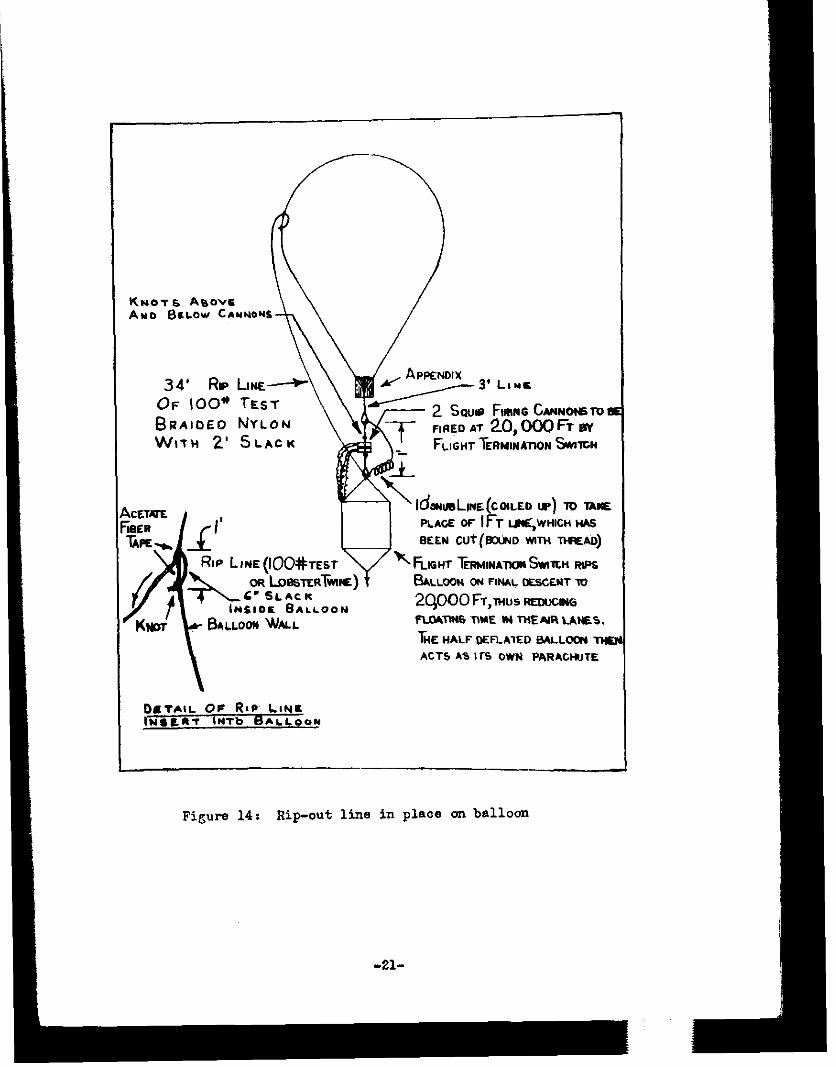
Ihe second unit was a new Qpe of destruction device--a pressure-activated mechanism by which a large hole is ripped in the balloon upon descent into the lanes of air traffic. In this davioe (Figure 14) the equipment is per- mitted to fall freely for a few feet,jerking a length of line through the balloon side. After this fall. the equipment again is carried by the main load line, and the ruptured balloon acts as B paraohute to lower the gear to the ground at about 1000 feet per minute.
-2o-
KNOTS ABOVE
OF loo* TEST
BRAIDED NYLON IS F~mrws hNNON5 TO EE
WITH 2’ SLACK FIRED ~A1 20, ooo FT BY
FLIGHT TERWINATK)N Swx;w
Ide+,mtms(couo up) x) RIQ PLACE DF IFT W,WHICH MS ELCN CUi(fb24.M WITH ME@)
lk HALF DWLAlED SALLOW 1w13,
I 1 ACTS A9 IrS OWN PARACWTE
FiEum 14: Ripout line in place on balloon
-21-
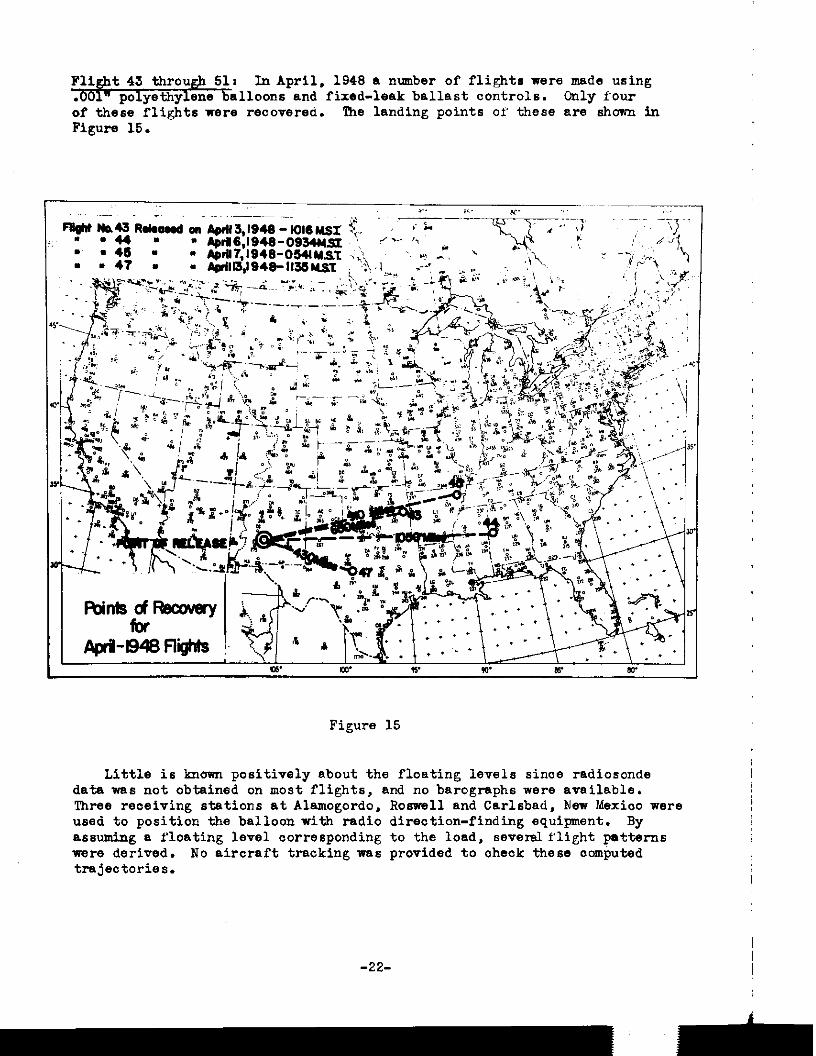
Flight 43 through 51: In April, 1948 a number of flights were made using . 1" polyethylene balloons and fixed-leak ballast controls. Only four of these flights were recovered. 'The landing points of these are shown in Figure 15.
Figure 15
Little is known positively about the floating levels since radiosonds data was not obtained on most flights, and no barographs were available. Three receiving stations at Alamogordo, Rome11 and Carlsbad, New Mexioo were used to position the balloon with radio direction-finding equipment. By assuming a floating level oorresponding to the load, several flight patterns were derived. No aircraft tracking was provided to check these computed trajectories.
-22-
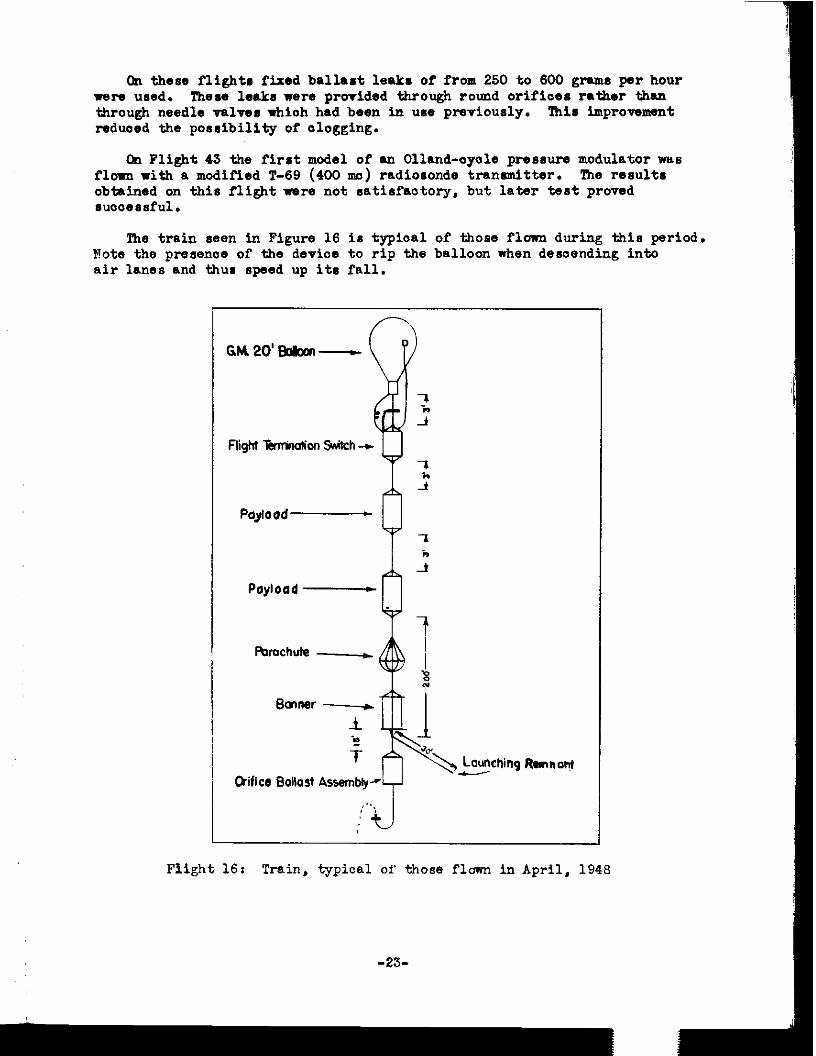
&I these flights fixed ballast leaks of from 250 to 600 grams par hour were used. These leaks were provided through round orifices rather than through needle valves mhioh had been in use previously. This improvement reduced the possibility of ologging.
(In Flight 4S the first model of an Olland-ayole pressure modulator was flown with a modified T-69 (400 me) radiosonde transmitter. The results obtained on this flight mre not satisfaotory. but later test proved suoaessful.
The train seen in Figure 16 is typioal of those flcmm during this period. Xote the ~reaen~e of the device to riu the balloon when descending into air lanes-and thus speed up its fall.-
GM20'Wnon-
Flight Tminotion S&h-t 7 *
Paylo ad f Payload -
&nner ------h i
;
Ckiflcr Bollost AssemMy-- Launching Ramam
Flight 16: Train, typical of those flown in April, 1948
-2s-
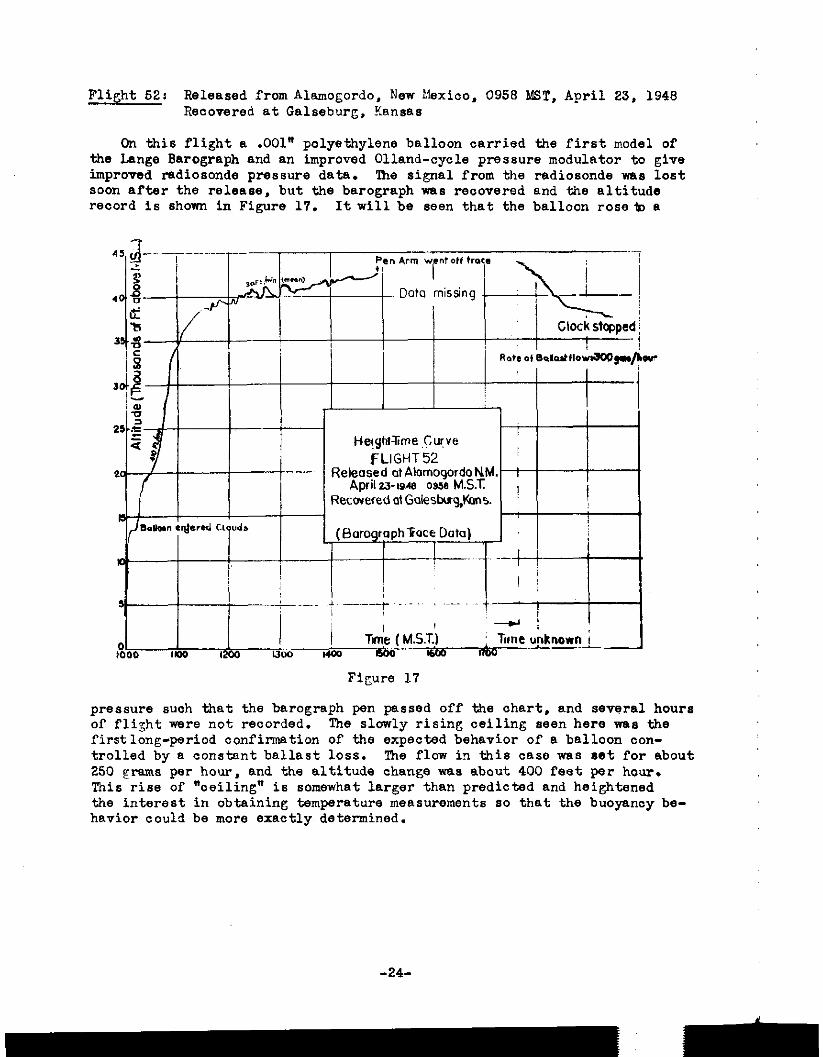
Flight 52~ Released from Alamogordo, New k~ico, 0958 MST. April 23, 1948 Recovered et Galseburg, Vansas
On this flight a .OOl" polyethylene balloon oarried the first model of the Lange Barograph and an improved Olland-cycle pressure moduletar to give improved radiosonde pressure data. lhe signal from the radiosonde WBB lost soon after the release, but the barograph we.8 recovered and the altitude record is shown in Figure 17. Itwill be seen that the balloon roselo B
Figure 17
pressure suoh that the barograph pan passed off the ohart, and several hours of flight wwe not recorded. The slowly rising ceiling seen here was the firstlong-period confirmation of the expected behavior of a balloon oon- trolled by a constant ballast loss. The flow in this case was set for about 250 grams per hour, and the altitude change was about 400 feet par hour. This rise of "ceiling" is somewhat larger than predicted and heightened the interest in obtaining temperature measurements 80 that the buoyancy be- havior could be more exactly determined.
-24-
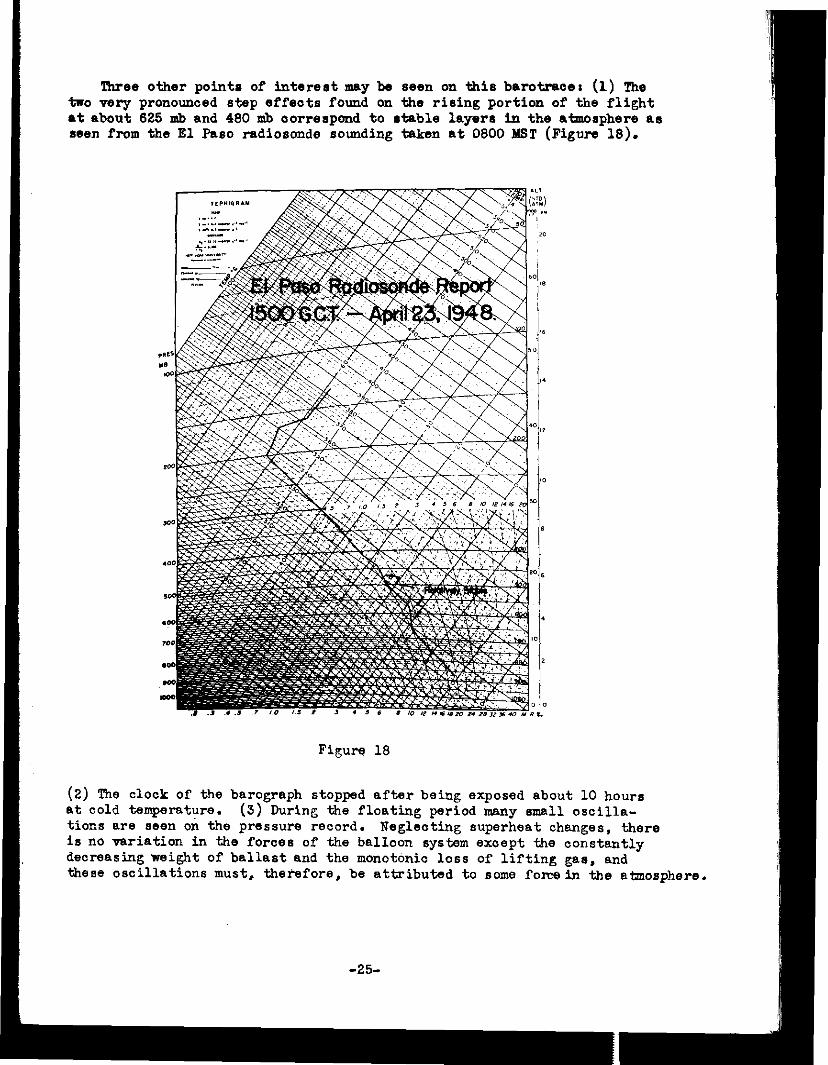
l%ree other points of interest may be aeon on this barotraoer (1) The two very pronounced stop effeats found on the rising portion of the flight atebout 625 mb and 460 mb aorrespond to l table layers in the atmosphere aa seen from the El Paso radiosonde sounding taken at 0600 M6T (Figure 16).
Figure 16
(2) The clock of the barograph stopped after being exposed about 10 hours at cold temperature. (3) During the floating period many small oscilla- tions ara seen on the pressure record. Neglecting superheat changes, there is no variation in the foraes of the balloon system except the constantly decreasing weight of ballast and the monotonic loss of lifting gas, and these oscillations must, theiefore, be attributed to so1318 fowin the atzaosphere.
-25-
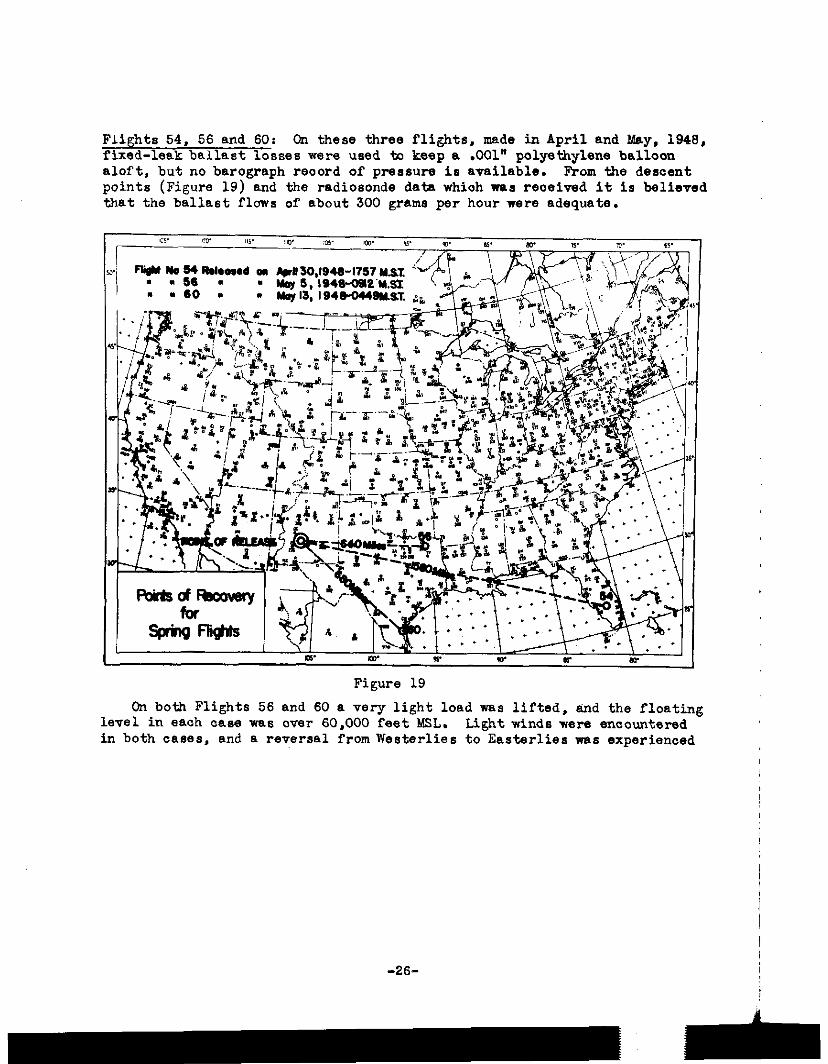
Flights 54, 56 and 60: On these three flights, made in April and b&y, 1948, fixed-leak ballast losses were used to keep a ,001" polyethylene balloon aloft, but no barograph record of pre8sm-e is available. FYom the descent points (Figure 19) and the radiosonde data whiah was received it is believed that the ballast flows of about 300 grams per hour ware adequate.
1 ..io. .
Figure 19
On both Flights 56 and 60 a very light load was lifted, and the floating level in each case was over 60,000 feet MSL. Light winds were encountered in both cams, and a reversal from Westerlies to Easterlies was experienced
near the floating level on Flight 60. With a relatively slight change in elevation, the balloon passed from Westerlies (below) to Easterlies (above) with the result that the balloon was still visible from the launching site (Alamogordo, New Mexico) at sunset, 14; hours after released. l'ne finder reported seeing the balloon desoend 35 hours after release.
Since the ballast flowing to maintain buoyancy would have been exhausted in only 5 hours, this flight provided the first evidence that such a bal- loon in the stratosphere meintains buoyancy much longer than at lower levels. The two factors which contribute to this are the heat added to the helium by adiabatic oornpression when descending and the aimiWdiffusion of lifting gas at a low pressure.
On Flights 56 and 60, a three-station network was set up to receive pressure signals on radio direction-finding (SCR-658) equiment. In addition, theodolites were used for several~urs in each case.
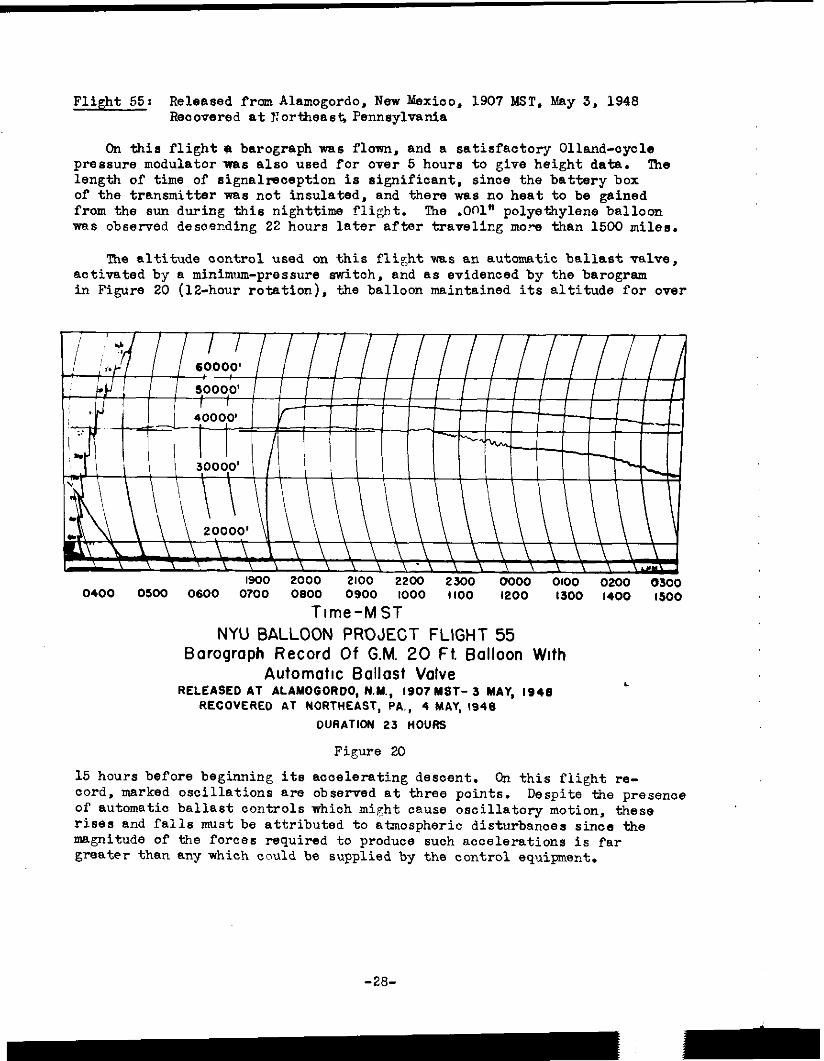
Flight 55: Released from Alamogordo. New B6exico. 1907 MST, May 3, 1948 Recovered at~crtbeast, Pennsylvania
On this flight a barograph was flown, and a satisfactory Ollmd-aycle pressure modulator was also used for over 5 hours to give height data. lhe length of time of signalleception is significant, since the battery box of the trsnsmitter was not insulated, and there was no heat to be gained from the sun during this nighttime flight. The .OOl" polyet?~ylene balloon we6 observed descending 22 hours later after travelicg more than 1500 miles.
The altitude control used on this flight was an automatic ballast valve, activated by a minimum-pressure switch, and as evidenced by the barogram in Figure 20 (12-hour rotation), the bsllocn maintained its altitude for ever
1900 2000 2100 2200 2300 0000 0100 0200 0300 0400 OS00 0600 0700 0600 0900 1000 I100 1200 1300 1400 1300
Time-MST NYU BALLOON PROJECT FLIGHT 55
Barograph Record Of G.M. 20 Ft. Balloon With Automatic Ballast Valve
RELEASED AT ALAMOGORDO, NM, 1907 MST- 3 MAY, IS46 L
RECOVERED AT NORTHEAST, PA., 4 MAY, !946
DURATION 23 HOURS
Figure 20 15 hours before beginning its acaelerating descent. On this flight re- cord, marked oscillations are cbset-ved at three points. Despite the presence of automatic ballast controls which might cause oscillatory motion, these rises and falls must be attributed to atmospheric disturbames since the magnitude of the forces required to produce such accelerations is far greater than any which could be supplied by the control equipment.
-20-
- -
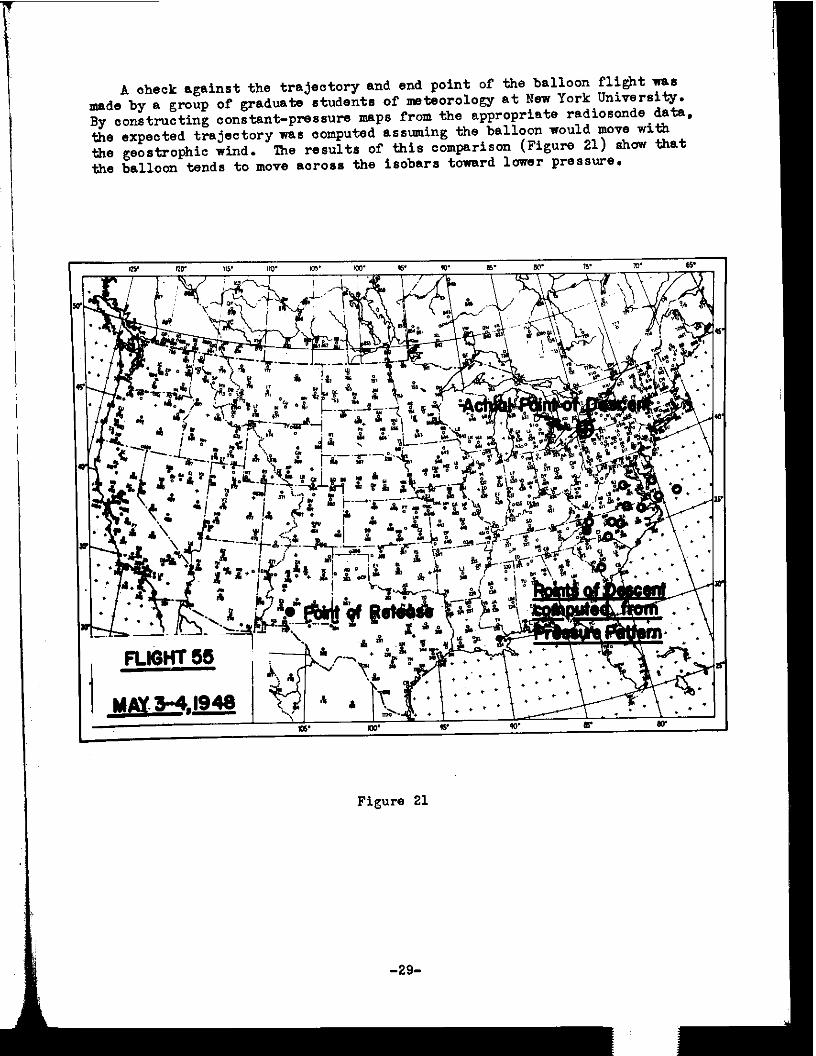
A aheck against the trajectory and end point of the balloon flight "8 made by a group of graduate students of meteorology at New York Unlverslty. By constructing constant-pressure maps from the appropriate radiosonde.data, the expected trajectory was oomputed assuming the balloon would move nlth the geostrophic wind. 'lbe results of this oomparism (Figure 21) show that the balloon tends to move aorom the isobars toward lower pressure.
Figure 21
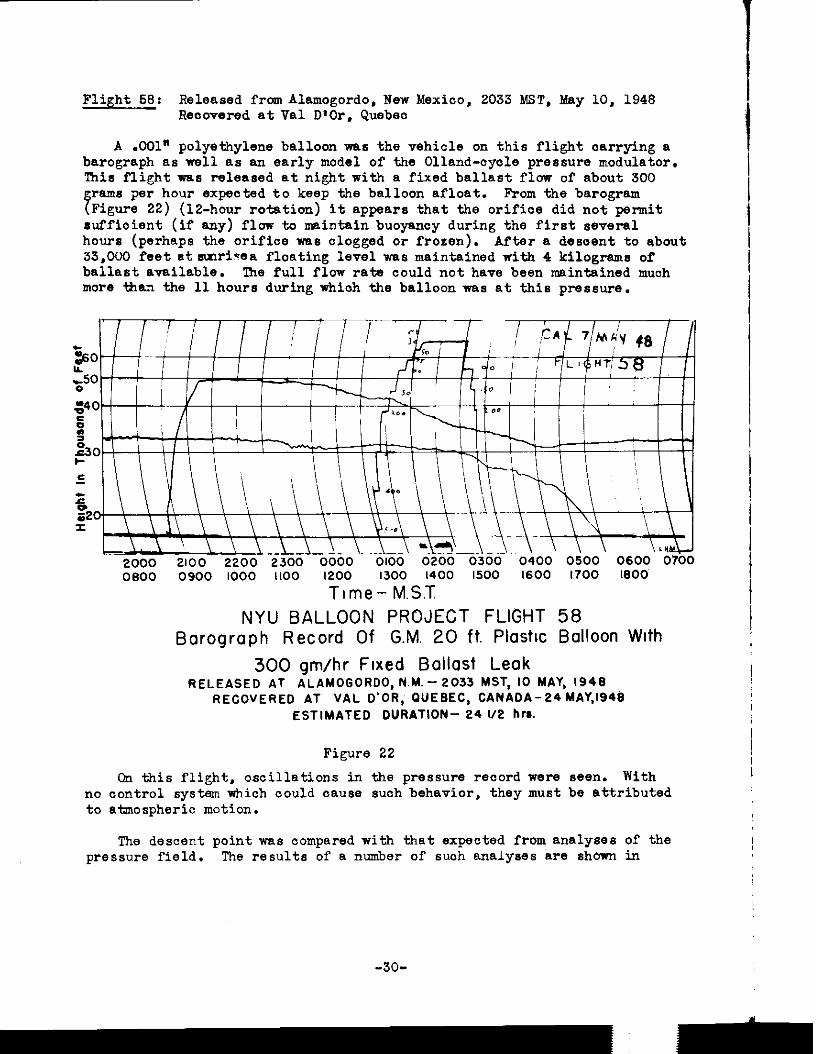
Flight 68: Released from Alamogordo. Nmv Mexico, 2033 MST. M6.y 10, 1948 Recovered atVa1 D'Or, Quebec
A .OOl" polyethylene balloon was the vehicle on this flight carrying a barograph a6 ~611 a6 an early mod61 of the Olland-cycle pressure modulator. lhis flight was released at night with a fixed ballast flow of about 300
7 ram per hour expected to keep the balloon afloat. From the barogram Figure 22) (l2-hour rotsticm) it appears that the orifice did not permit
6ufficient (if any) flow to maintain buoyancy during the first ssveral hours (perhaps the orifice ~1x6 clogged or frozen). After a dssaent to about 33,000 feet atrnnricea floating level wae maintained with 4 kilOgm6 of ballast available. 'lb6 full flow rat6 could not have been maintained much more Wan the 11 hour6 during whioh the balloon was at this pressure.
0600 0900 1000 1100 1200 I300 1400 1500 1600 1700 IGOO
Time- M.S.T. NYU BALLOON PROJECT FLIGHT 58
Barograph Record Of G.M. 20 ft. Plastic Balloon With
300 gm/hr Flxed Ballast Leak RELEASED AT ALAMOGORDO, N.M.- 2033 MST, ID MAY, 1948
RECOVERED AT VAL D’OR, QUEBEC, CANADA-24 MAY,1948 ESTIMATED DURATION- 24 I12 hr6.
Figure 22 Cn this flight, oscillation6 in the pressure reaord w6r6 men. With
no control system which oould cau66 such behavior, they must be attributed to atmospheric motion.
The descant point was compared with that expected from analyses of the pressure field. The results of a number of suoh analyses are shown in
-3o-
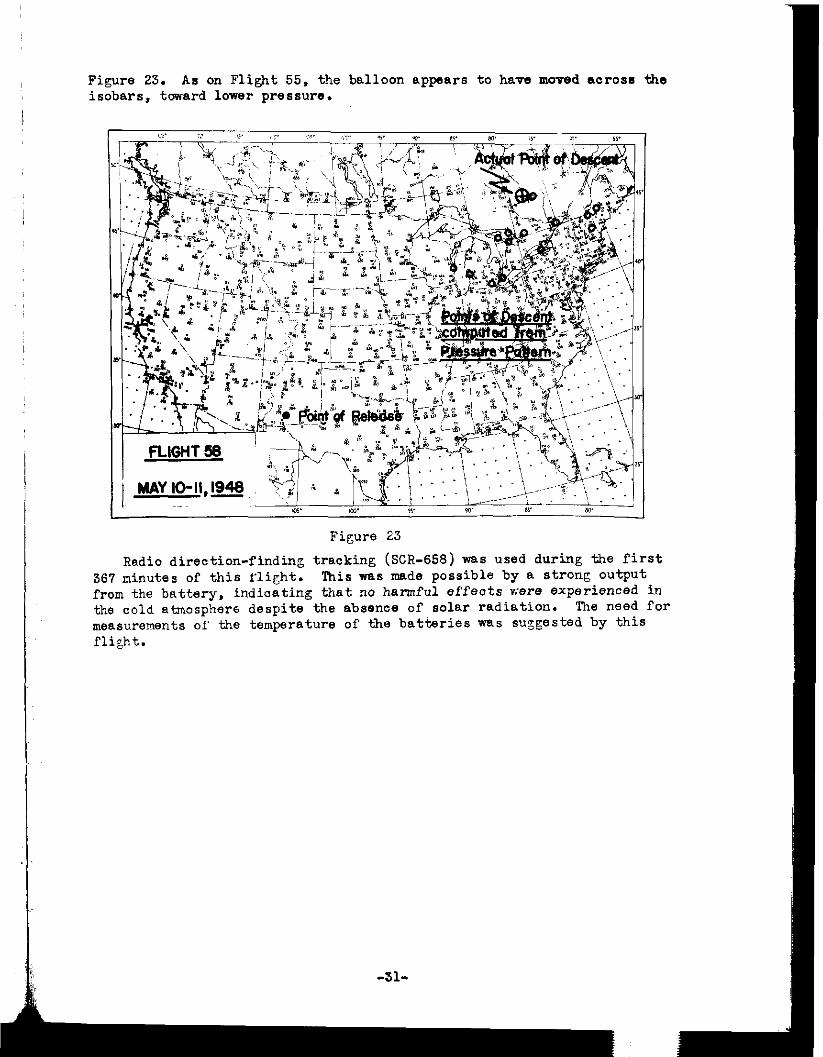
Figure 23. As cm Flight 55. the balloon appears to have moved mross the isobars, toward lower pressure.
Figure 23
Radio direction-finding tracking (SCR-658) was used during the first 367 minutes of this flight. This was made possible by a strong output from the battery. indicating that no harmful effects were experienced in the cold etmosphers despite the absence of solar radiation. The need for measuremnts pi' the temperature of the batteries was suggested by this flight.
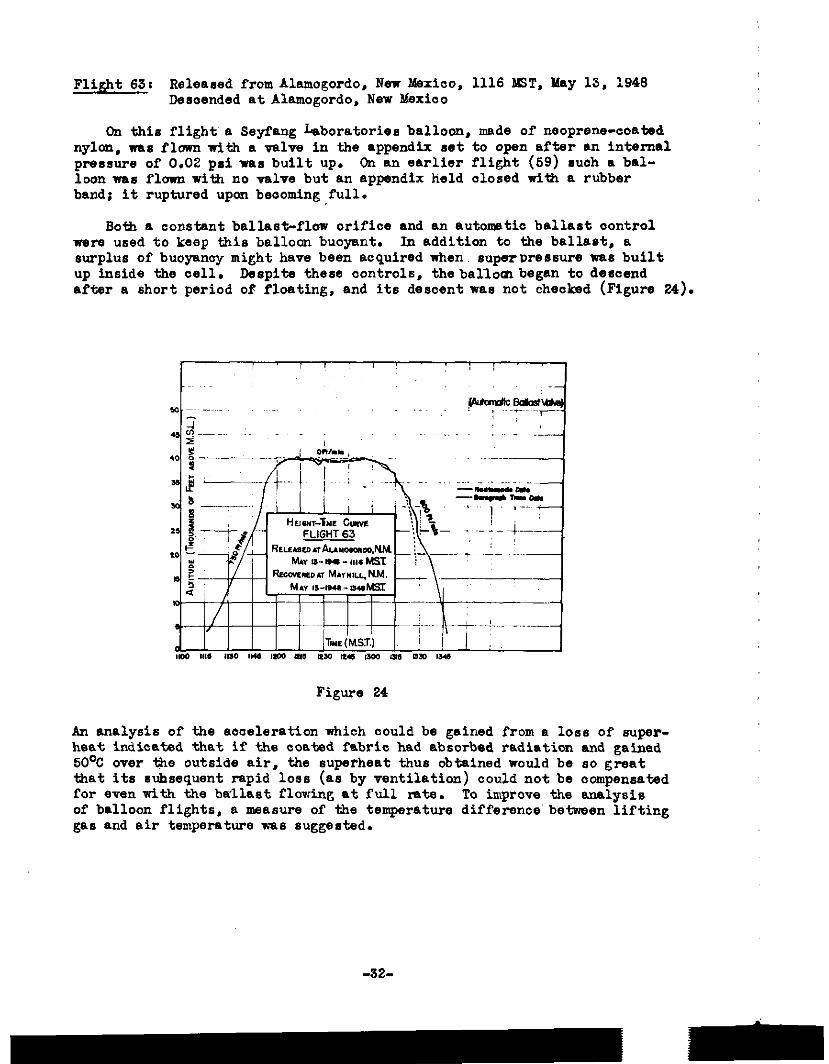
Flight 63: Released from Alamogordo, New Mexico, 1116 MST, YIay 13. 1948 Desoended at Alamogordo, New h%xieo
Cm this flight~a Seyfang hboratoriea balloon, made of neoprene-coated nylon, nas flown with a wlve in the appendFx set to open after an internal pressure of 0.02 pairas built up. On an earlier flight (59) rush a bal- loon WIW flown with no valve but an appendix held closed with a rubber band; it ruptured upon becoming full.
Both a constant ballasGflow orifioe and an automatic ballast oontrol were used to keep this balloa buoyant. In addition to the ballast, a surplus of buoyancy might have been acquired when. supeturessure 1(1s built up inside the cell. Despite these oontrols, theballocllbegan to descend aftw a short period of floating, and its descent was not checked (Figure 24).
Figure 24
An analysis of the aaoelerntion which could be gained from a loss of super- heat indicated that if the coated fabric had absorbed radiation and gainad 50°C over the outside air, the superheat thus obtained would be 80 great that its subsequent rapid loss (88 by ventilation) could not be compensated for even with the brrllast flowing at full rate. To improve the analysis of balloon flights, a measure of the temperature difference'betwaen lifting gas and air temperature *me suggested.
I
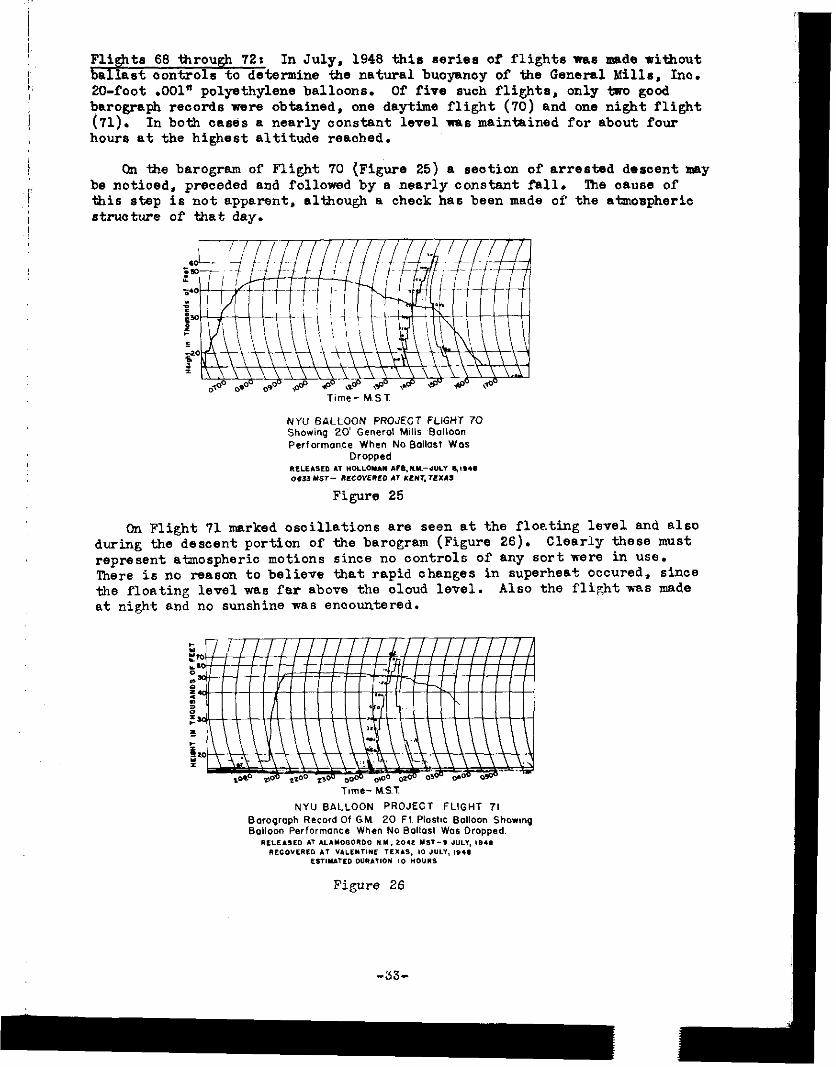
I (, Flights 68 through 72: In July, 1948 this series of flights was made without
ballast oontrols to determine the natural buoyancy of the General Milla. Ino. 20-foot .OOl" polyethylene balloons. Of five such flights, only two good
I barograph records were obtained, one daytime flight (70) and one night flight (71). In both cases a nearly aonstant level was maintained for about four
I hours at the highest altitude reached.
j On the barogram of Flight 70 (Figure 25) a section of arrested descent may k be noticed, preceded and followed by a nearly constant fall. The caum of
this step is not apparent, although a check has been made of the atmospheric ! struature of that day.
On Flight 71 marked oscillations am seen at the floating level and also during the descent portion of the barogram (Figure 26). Clearly these must represent atmospheric motions since no oontrols of any sort were in use. There is no reason to believe that rapid ohanges in superheat occured, since the floating level was far above the aloud level. Also the flight was made at night and no sunshine was encountered.
Figure 26
-33-
- d
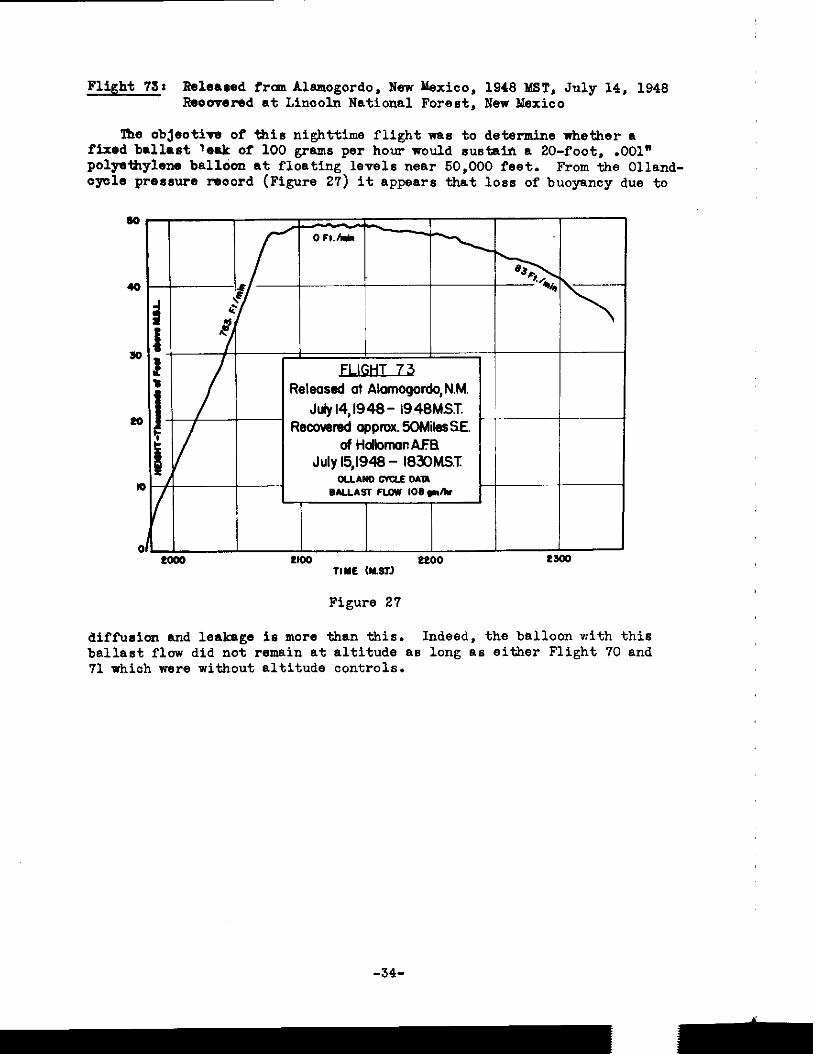
Flight 73: Relearsd froln Alamogordo, New Ilexico, 1948 MST, July 14, 1948 Reoorered at Linooln National Forest, New Mexico
The objeotive of this nighttime flight was to determine whether a fixad ballast leak of 100 gram per hour would sustain a 20-foot, .OOl* polye~ylem ball&n at floating levels near 50,000 feet. From the Olland- ayule pressure record (Figure 27) it appears that loss of buoyancy due to
I\ \ T
Figure 27
diffusion and leakage is more than this. Indeed, the balloon with this ballast flow did not remain at altitude BB long a8 either Flight 70 and 71 which were without altitude controls.
-34-
- I
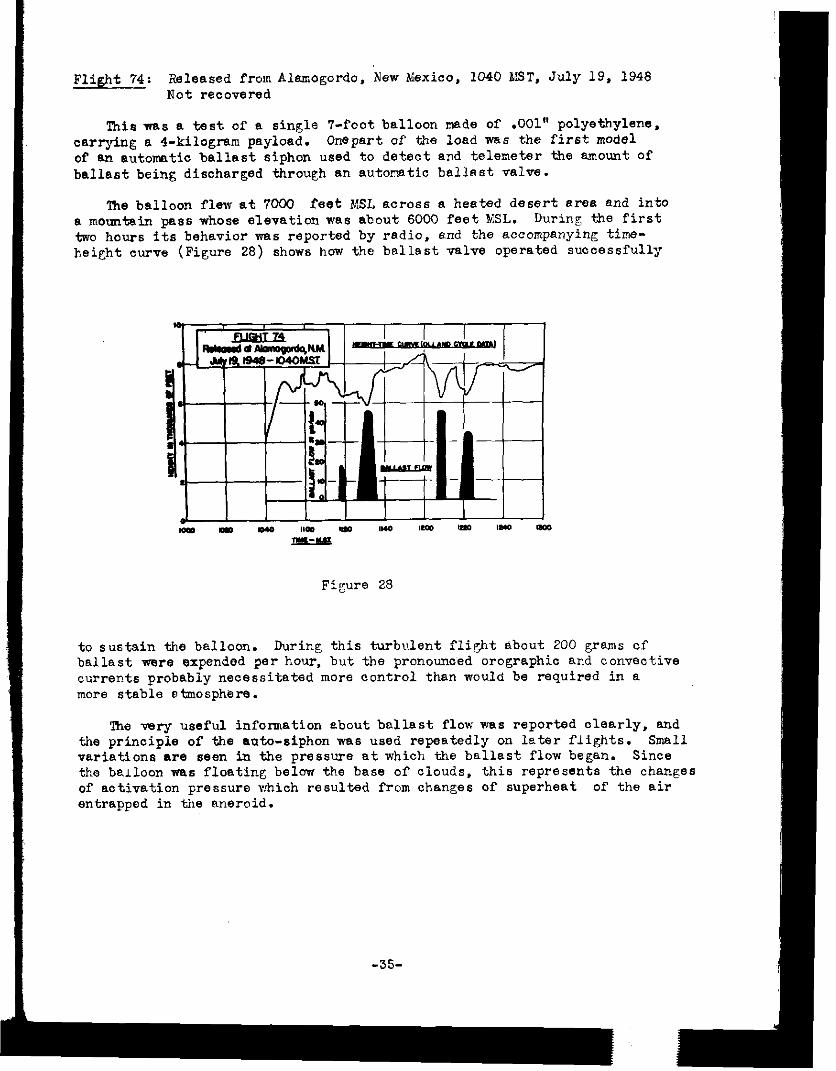
74: Flight Released PromAls.magordo. New Mexico, 1040 MST, July 19, 194% Not recovered
This was a test of a single 'I-foot balloon made of .OOl" polyetbylens, carrying a 4-kilogram payload. Onepart of the load was the first model of an automatic ballast siphon used to detect and telemeter the amount of ballast being discharged through an autoratio ballast valve.
lbe balloon flew at 7ooO feet MSL across a heated desert area and into a mountain pass whose elevation was about 6000 feet MSL. During the first two hours its behavior ms reported by radio, and the accompanying time- height curve (Figure 28) shows how the ballast valve operated successfully
Figure 28
to sustain the balloon. During this turbulent fli$t about 200 grams of ballast ware expended per hour, but the pronounced orographic and convective currents probably necessitated more control than would be required in a more stable stmosphara.
The very useful information about ballast flm was reported clearly, and the principle of the auto-siphon 1~8s used repeatedly on later flights. Small variations am seen in the pressure at which the ballast flow began. Since the balloon was floating below the base of clouds, this represents the changes of activation pressure which resulted from changes of superheat of the air entrapped in the aneroid.
-35-
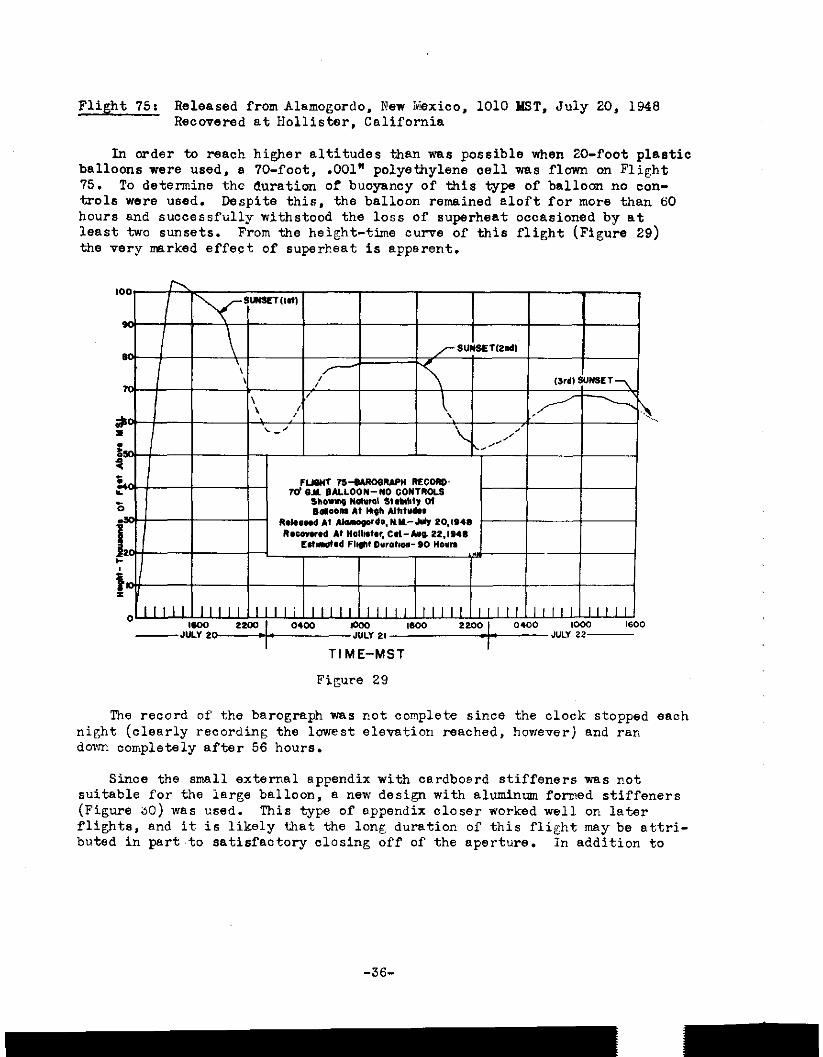
Flight 75: Released from Alamogordo. New YLxico, 1010 YIST, July 20, 1946 Recovered at Hollistar, California
In order to reach higher altitudes than was possible when 20-foot plastic balloons were used, a 70-foot, .OOl" polyethylene cell was flown on Flight 75. To determine the duration of buoyancy of this type of ballot no con- trols were used. Despite this, the balloon remained aloft for more than ti0 hours and suocessfully withstood the loss of superheat occasioned by at least two sunsets. From the height-time curve of this flight (Figure 29) the very wrked effect of superheat is apparent.
The record of the barograph was not complete since the clock stopped each night (clearly recording the lowest elevation reached, however) and ran down completely after 56 hours.
Since the small external appendix with cardbosrd stiffeners was not suitable for the large balloon, a new design with aluminum formed stiffeners (Figure 80) was used. This type of appendix closer worked well on later flights, and it is likely that the long duration of this flight may be attri- buted in part,to satisfactory closing off of the aperture. In addition to
-36-
- -
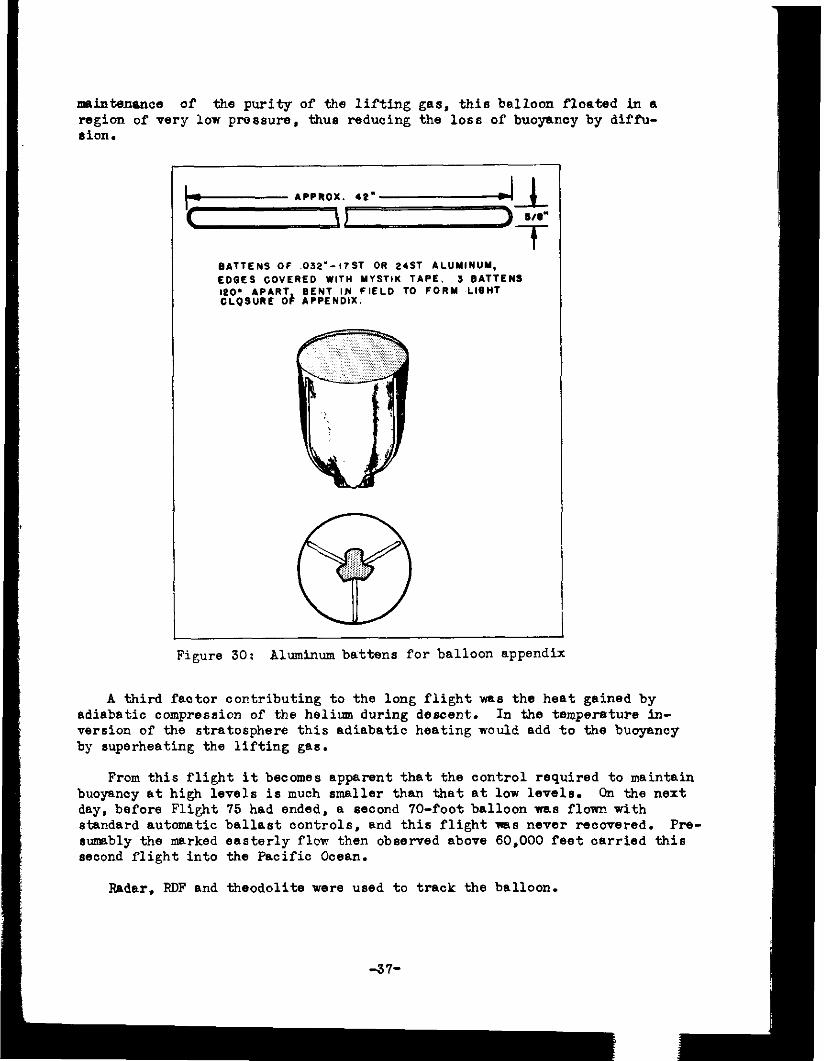
maintenance of the purity of the lifting gas, this balloon floated in a region of very low pressure, thus reducing the loss of buoyancy by diffk- 6iOn.
A third factor contributing to the long flight xas the heat gained by adiabatic compression of the helium during descent. In the temperature in- version of the stratosphere this adiabatic heating would add to the buoyancy by 6up6rh66ting the lifting g66.
From this flight it becomes apparent that the control required to maintain buoyancy at high levels is much smaller than that at low levels. On the next day, before Flight 75 had ended, a second 70-foot balloon ~6.6 flown with standard autonetic ballast controls, and this flight was never recovered. Pre- sumbly the marked easterly flow then observed above 60,000 feet carried this second flight into the Pacific Ocean.
Radar, RDF and theodolite w6r6 used to track the balloon.
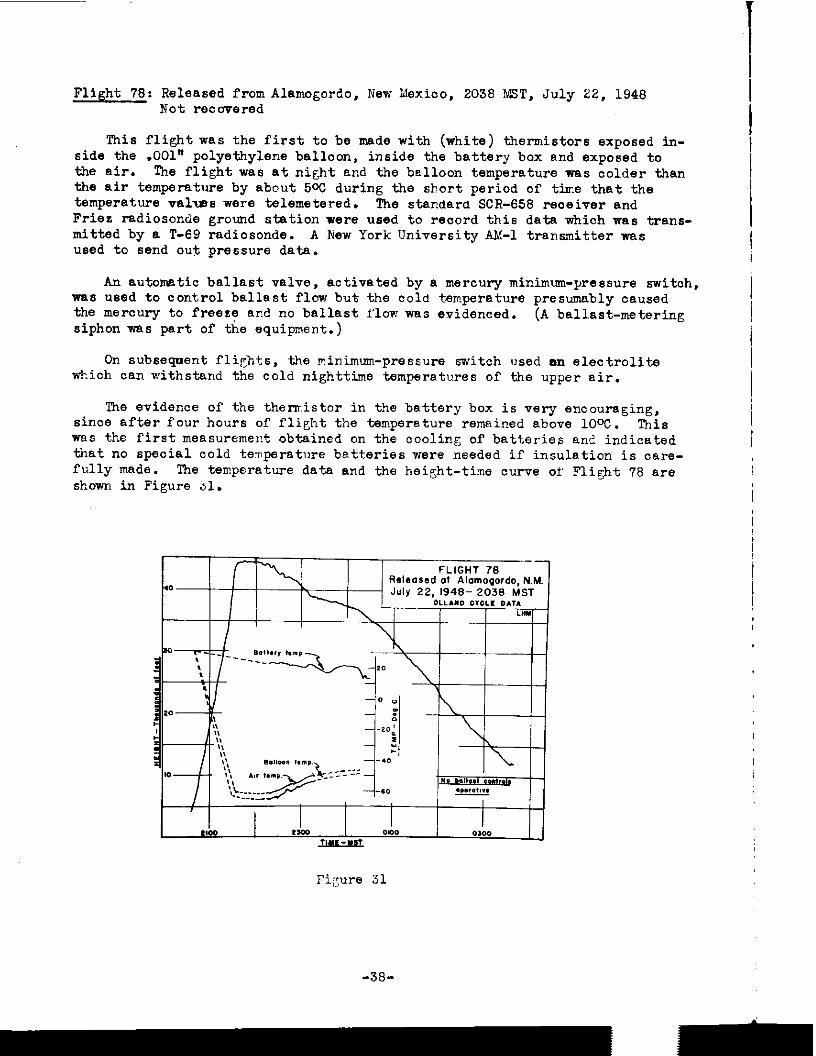
Flight 78: Released from Alamogordo, New Mexico, 2038 MST, July 22, 1948 Not recovered
This flight was the first to be made with (white) thermistors exposed in- side the .OOl" polyethylene balloon, inside the battery box and exposed to the air. The flight was at night and the belloon temperature was colder than the air temperature by about 5oC during the short period of the that the temperature vales were telemetered. The standard SCR-658 receiver and Fries radiosonde ground station were used to record this data which was trans- mitted by a T-69 radiosonde. A kew York University m-1 transmitter was used to send out pressure data.
An au+xnatic ballast valve, activated by a mercury minimum-pressure switch, mxs used to control ballast flow but the cold temperature,presumably caused the mercury to freeze and no ballast flow was evidenced. siphon lvgs part of the equipment.)
(A ballast-metering
On subsequent flights, the minimum-pressure switch used an electrolite which can withstand the cold nighttime temperatures of the upper air.
The evidence of the thermistor in the battery box is very encouraging, sinoe after four hours of flight the temperature remained above 1OoC. This was the first measurement obtained on the cooling of batteries an2 indicated that no special cold tenperature betteries were needed if insulation is care- fully made. The temperature data and the height-tine curve of Flight 78 are shown in Figure sl.
FLIGHT 78 Rslaarsd 01 Alomogordo, N.M.
22. 1948- 2038 MST D.T.
-38-
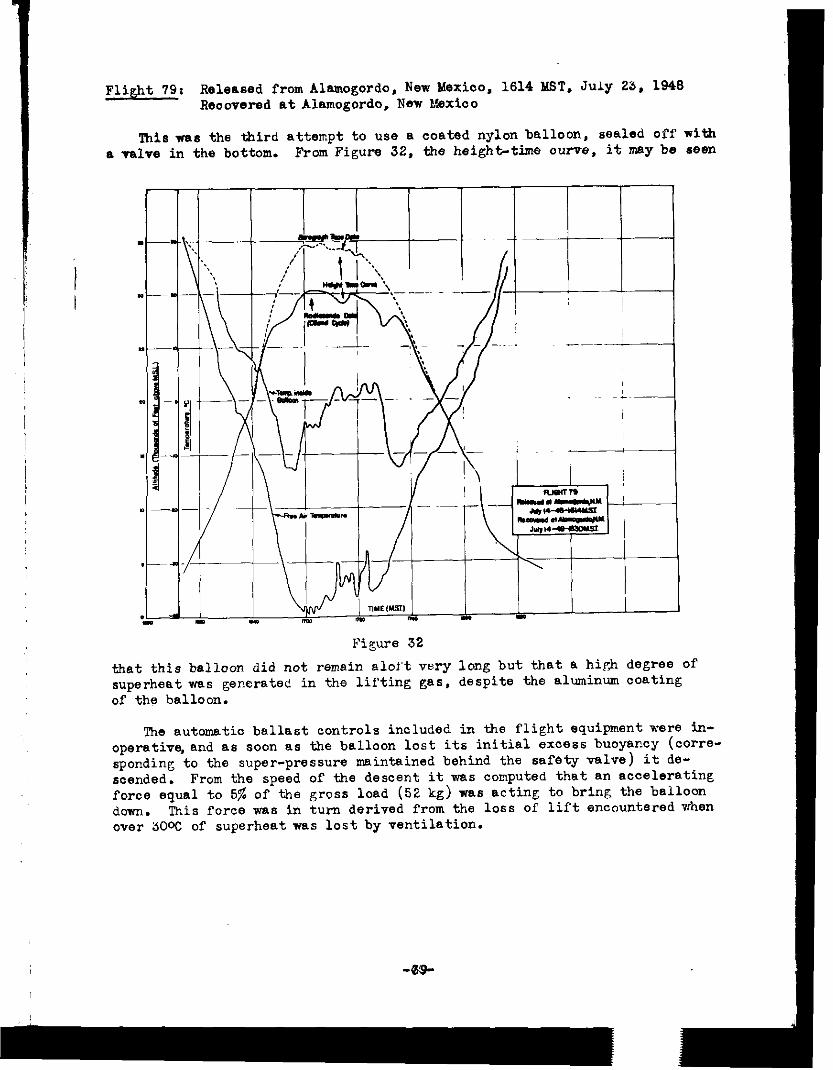
Flight 79: Released from Alamogordo, New Mexico, 1614 MST. July 23, 1946 Recovered at Almogordo, New Elexico
This mu the third attempt to use a coated nylon balloon, sealed off with a valve in the bottom. From Figure 32. the heighttime oume. it my be zwm
-BS-
I
I
7
Figure 32 that this balloon did not remain alof't very long but that a hi& degree of superheat was gemrated in the lifting gas. despite the aluminum coating of the balloon.
The automatic ballast controls included in the flight equipment were in- operative, and as won as the balloon lost its initial excess buoyancy (corre- spooding to the super-pressure maintained behind the safety valve) it de- scended. From the speed of the descent it was computed that an accelerating force equal to 5% of the gross load (52 kg) was acting to bring the balloon down. This force was in turn derived from the loss of lift encountered Then over YCW of superheat was lost by ventilation.
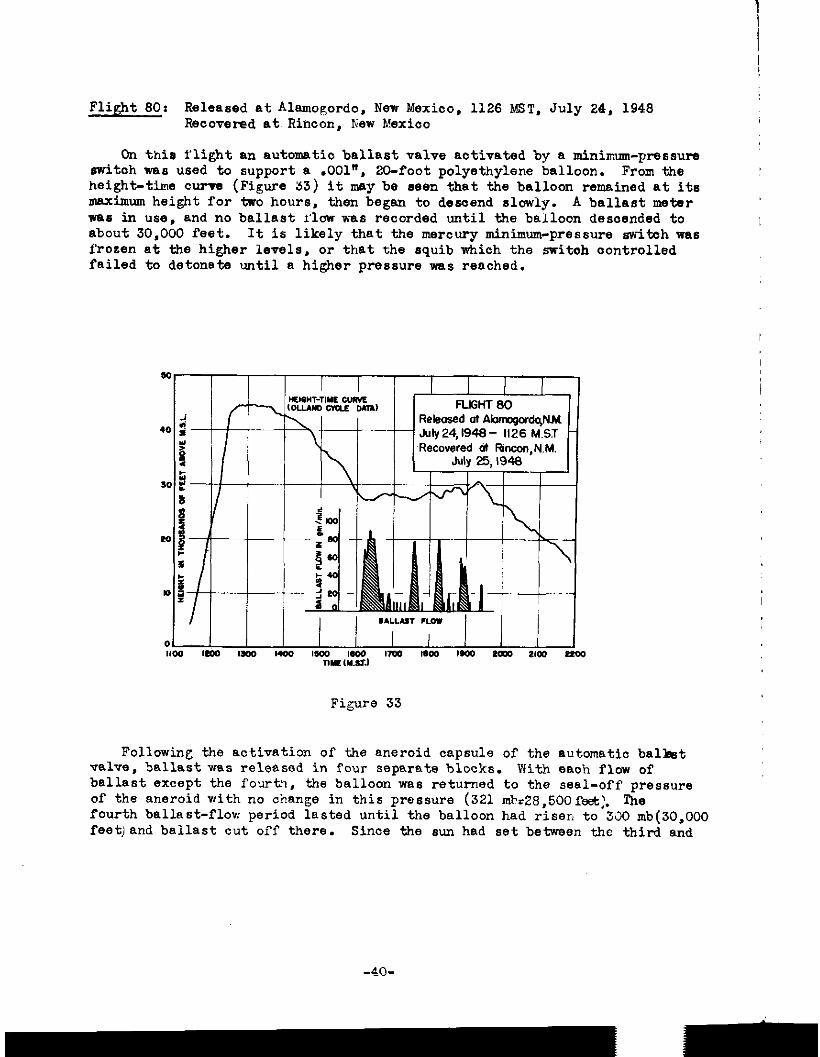
Flight SO: Released at Alamogordo, New Mexico, 1126 MST. July 24. 1948 Recovered at Rincon, Kew Mexico
On this flight an automatic ballast valve activated by a minimm-pressure switch 'NBB used to support a .OOl", 20-foot polyethylene balloon. From the height-time curve (Figure 33) it may be seen that the balloon remained at its maximum height for two hours, then began to desoend slowly. A ballast meter was in "be, and no ballast xlovr was recorded until the balloon descended to about 30,000 feet. It is likely that the mercury minimum-pressure switch maa frozen at the higher levels, or that the squib which the switch controlled failed to detonate until a higher pressure was reached.
Figure 33
Follcnving the activation of the aneroid capsule of the automatic balk?& valve, ballast was released in four separate blocks. ylith each flow of ballast except. the fox&?, the balloon was returned to the seal-off pressure of the aneroid with no change in this pressure (321 m~r26,500f&~. The fourth ballast-flow period lasted until the balloon had risen to 330 mb(30,OOO feetland ballast cut off there. Since the sun had set between the third and
-4O-
- -
fourth ballast-flow periods, this rise in "ceiling" is attributed to the xooling of the air entrapped &I the aneroid of the automatic ballast wlve. Tnis decrease of' pressure of 21 mb corresponds to a loss of 8oC of superheat. In each of the four periods of ballast flow, there was enough unnecessary ballast lost to cause an overshoot v.+~;hen the balloon returned to its floating level. lhis excess ballast was that used during the period when the balloon had begun to rise but was still below activation altitude of the automatic ballast valve. The inefficient use of ballast was one of the major objections to such a control :iysten.
On this flight the ballast load of 3 kilograms was exhausted in only three hours. indicating B large loss of gas from this particular balloon. It is believed that the large initial acceleration provided by the rapid de- scent of the balloon caused the restoring force, and the subsequent over- shoot, to be WI-J large, and the high ballast flow is probably much greater than was the loss of buoyancy on this flight.
-41-
-
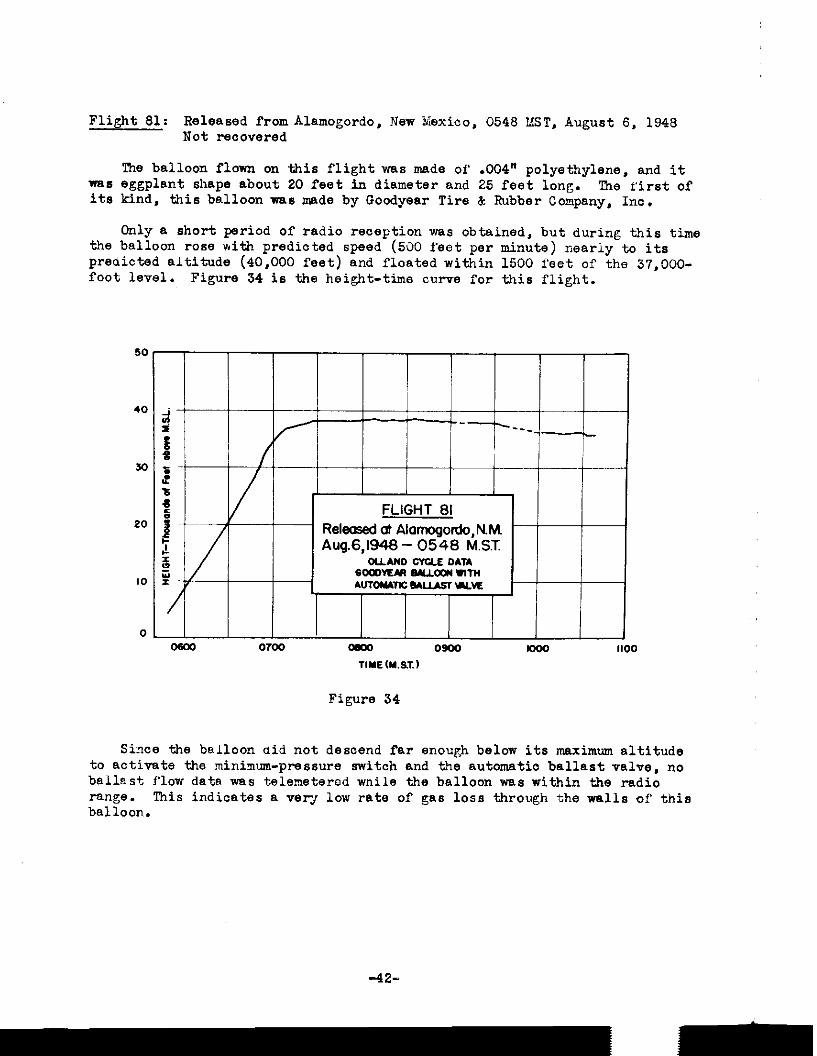
Flight 81: Released from Alamogordo, New Mexico, 0548 LET, August 6, 1948 Not recovered
The balloon flown on this flight was made of .004" polyethylene, and it ms eggplant shape about 20 feet in diameter and 25 feet long. Ihe Sirst of its kind, this balloon was made by Goodyear Tire & Rubber Company, Inc.
Only a short period of radio reception vas obtained, but during this time the balloon rose with predicted speed (500 feet per minute) nearly to its predicted altitude (40,000 feet) and floated within 1500 feet of the 37,000- foot level. Figure 34 is the height-time curve for this flight.
50
40
30
20
10
0
FLIGHT 81 Released at Alamogotdo,N.M. - Aug.6,1948 - 0548 M.S.T.
wAN(D OYUE o&m EOODWLIR -ecu nm
Figure 34
Since the balloon aid not descend far enough below its maximum altitude to activate the minimum-pressure switch and the automatic ballast valve, no ballast flow date was telemetered wnile the balloon ~88 within the radio range. This indicates a VW-J low rate of gas loss through the w&l18 of this balloon.
42-
- m
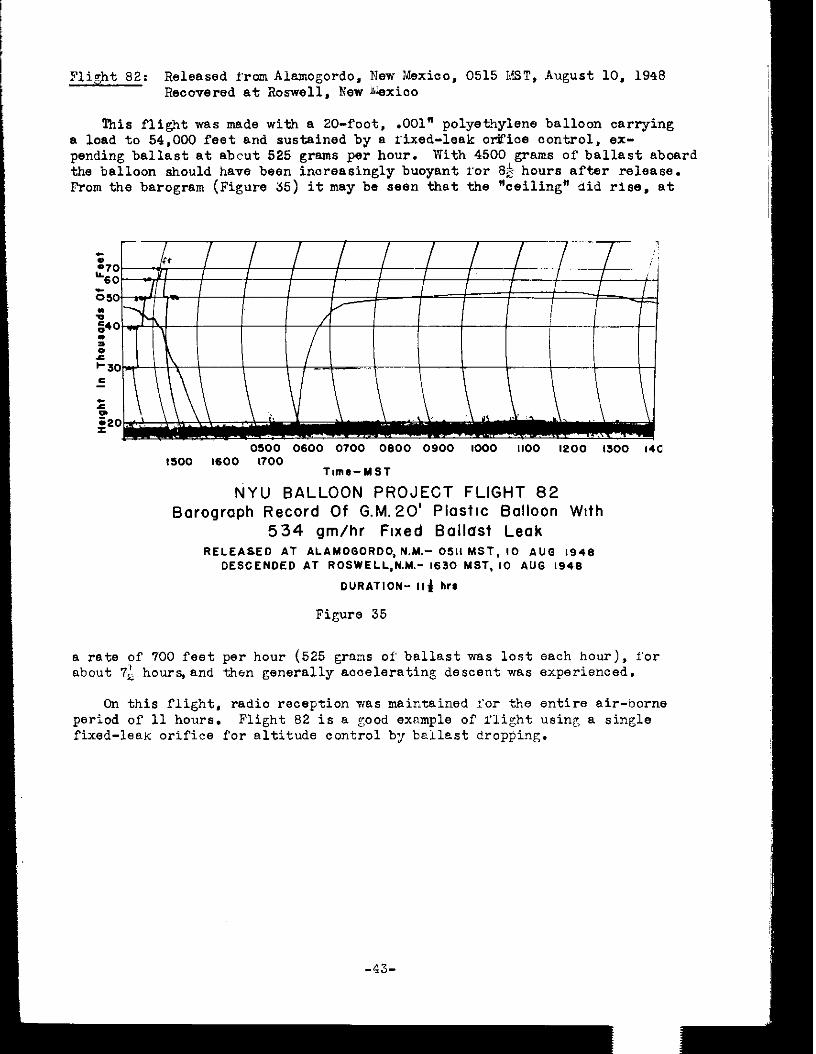
Flight 82: Released from Almogordo, New Gxioo, 0515 MST, August 10, 1948 Recovered at Romvell. New Gxico
This flight was made with a ZO-foot, .OOl" polyethylene balloon carrying a load to 54,000 feet and sustained by a rixed-leak orVice control, ex- pending ballast at abcut 525 grams per hour. With 4500 grams of ballast aboard the balloon should have been increasingly buoyant i'or 82 hours after release. From the barogram (Figure 35) it may be seen that the "ceiling" did rise, at
0500 0600 0700 OGOO 0900 1oco 1100 I200 I300 ,500 1600 1700
Tame-MST
NYU BALLOON PROJECT FLIGHT 82 Barograph Record Of G.M.20’ PlaStlc Balloon With
534 gm/hr Flxed Ballast Leak RELEASED AT ALAMOGORDO, N.M.- 0611 MST, 10 A”6 ,946
DESCENDED AT ROSWELL,N.M.- 1630 MST, 10 AU0 ,946
DURATION- 111 hr8
Figure 35
a rate of 700 feet per hour (5.25 gram of ballast was lost each hour), :'or about 7; hours,snd then generally accelerating descent was experienced.
On this flight, radio reception was maintained for the entire air-borne period of 11 hours. Flight 82 is a good exnmple of flight using a single fixed-leaic orifice for altitude control by bailest dropping.
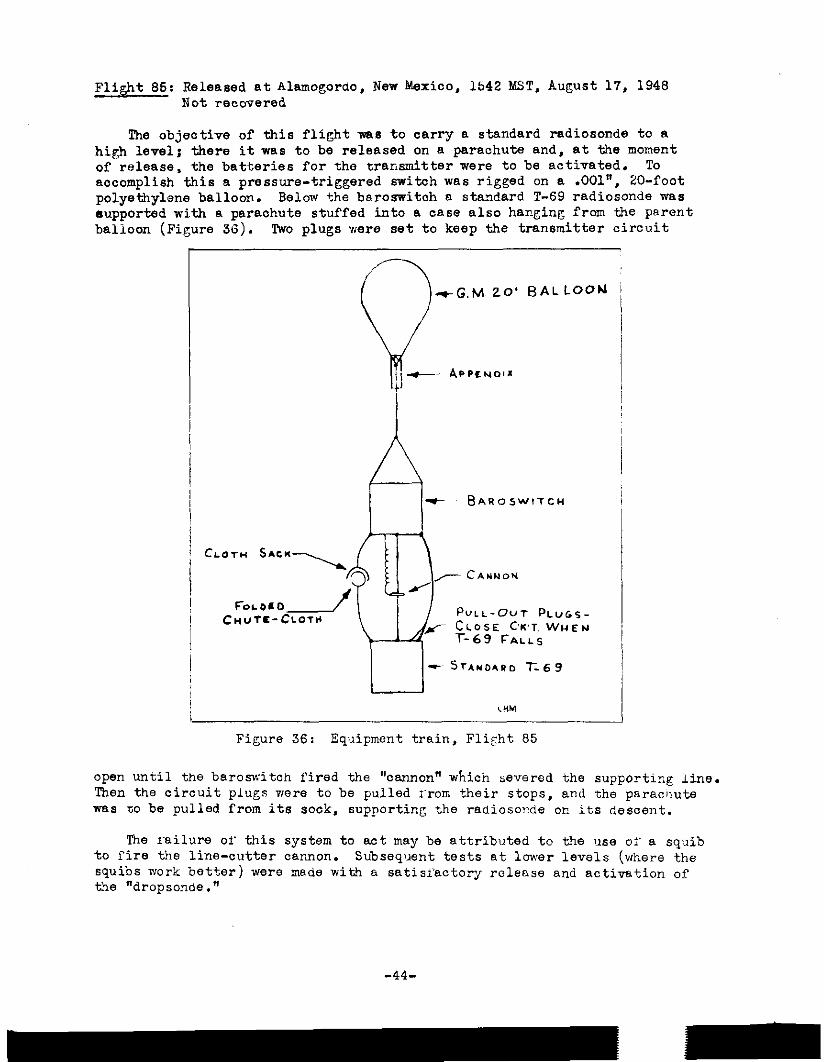
Flight 85: ~~~~ec~~8erts~larnogordo, New Mexico, 1542 MST, August 17, 1946
The objective of this flight was to carry a standard radiosonde to a high level; there it was to be released on a parachute and, at the moment of release, the batteries for the transmitter were to be activated. To accomplish this a. pressure-triggered switch was rigged on a .OOl", 20-foot polyethylene balloon. Below the baroswitch a stmdard T-69 radiosonde was supported with a parachute stuffed into e. case also hanging from the parent balioon (Figure 36). Two plugs were set to keep the transmitter circuit
0 -~G.t420’ BALLOON
Figure 36: Equipment train, Flight 65
open until the baromitch fired the "cannon" which severed the supporting line. Then the circuit plugs mere to be pulled prom their stops, and the paracnute PYLLS m be pulled from its sock, supporting the radiosonde op. its descent.
The milure of this system to act may be attributed to the use oi' a squib to fire the line-cutter cannon. Subsequent tests at lower levels (where the squibs pork better) were made with a satisi'actory release and activation of the "dropsonde."
-44-
- -
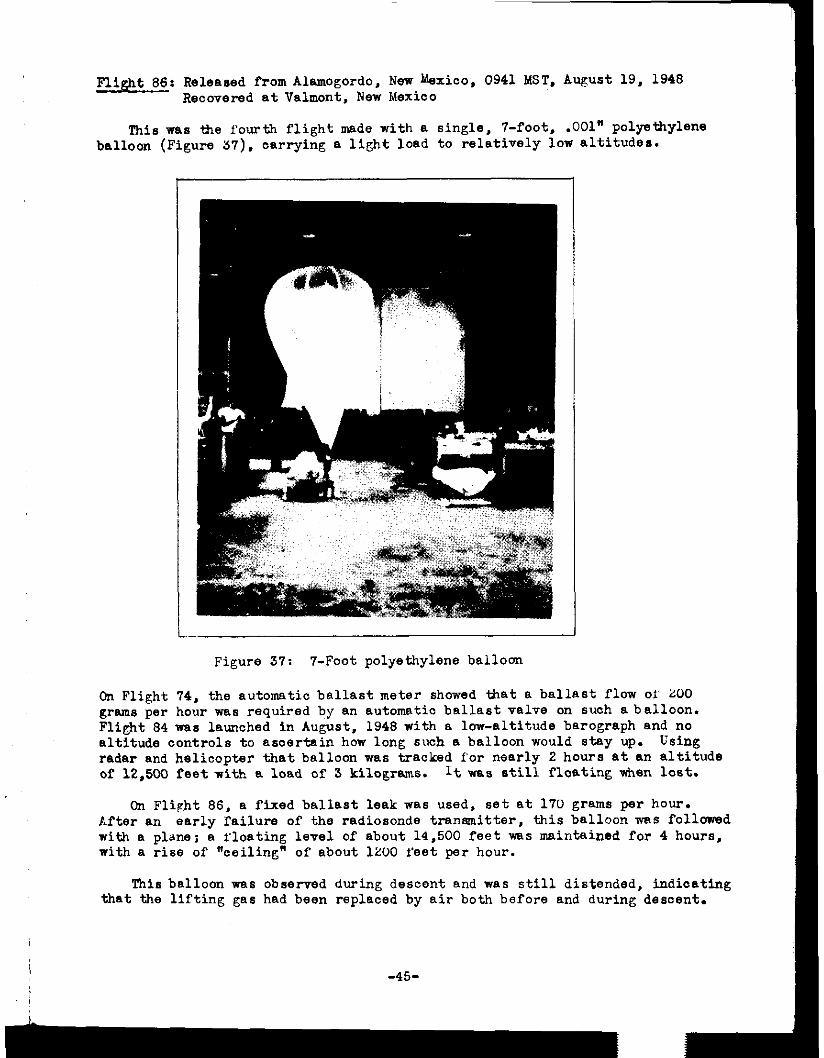
Flight 86: Released from Almogordo, New hxico, 0941 MST, August 19, 1948 Recovered at Valmont, New Mexico
This was the fourth flight made with a single, 'I-foot, .001" polyethylene balloon (Figure 37). darrying B light load to relatively low altitudes.
r
Figure 37: 'I-Foot polyethylene balloon
On Flight 74, the automatic ballast meter showed that B ballast flow oi' 200 grams per hour was required by an automatic ballast valve on such aballoon. Flight 84 was launched in August. 1948 with a low-altitude barograph and no altitude controls to ascertain how long such a balloon would stay up. Using radar and helicopter that balloon was tracked for nearly 2 hours at an altitude of 12,500 feet with a load of 3 kilograms. lt was still floating when lost.
On FliE.ht 86, a fixed ballast leak was used, set at 170 grams per hour. After an early failure of the radiosonde transmitter, this balloon PIRS folloned with a plane; B i'loating level of about 14,500 feet was maintained for 4 hours, with a rise of "ceiling" of about 1200 !'eet per hour.
This balloon was observed during descent and was still distended, indicating that the lifting gas had been replaced by air both before and during descent.
-45-
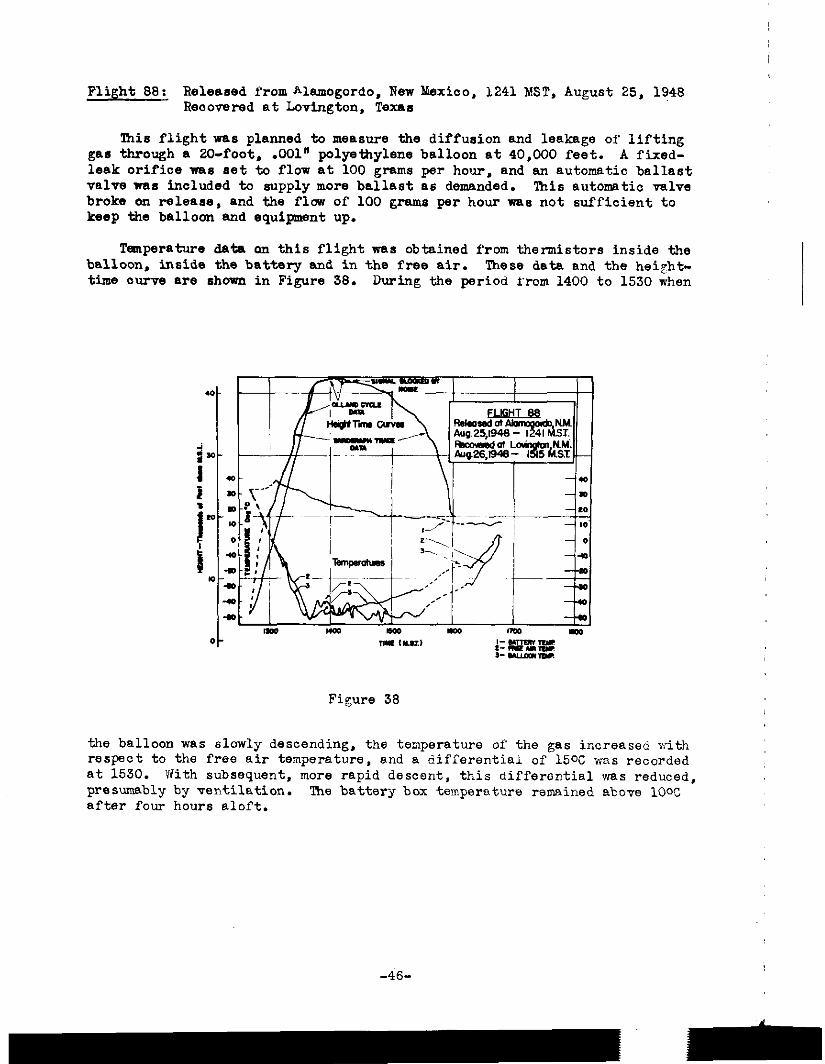
Flight 88: Released from Alamogordo, New Mexico, 1241 MST, August 25, 1948 Recovered at Lovington. Texas
lhie flight was planned to measure the diffusion and leakage of lifting gas through a 20-foot, .OOl' polyethylene balloon at 40,000 feet. A fixed- leak orifice ma set to flow at 100 grams per hour, and an automatic ballast valve was included to supply more ballast as demanded. This automatic valve broke on releaas, and the flav of 100 grams per hour was not sufficient to keep the balloon and equipment up.
Temperature data on this flight-s obtained from thermistors inside the balloon, inside the battery and in the free air. These data and the height- time curve are shown in Figure 38. During the period rrom 1400 to 1530 when
Figure 38
the balloon was slowly descending, the tenperature of the gas increased with respect to the free air temperature, and a differential of 15oC ms recorded at 1530. With subsequent, more rapid descent, this differential was reduced, presumably by ventilation. The battery box temperature remained above 10% after four hours aloft.
-46-
- -
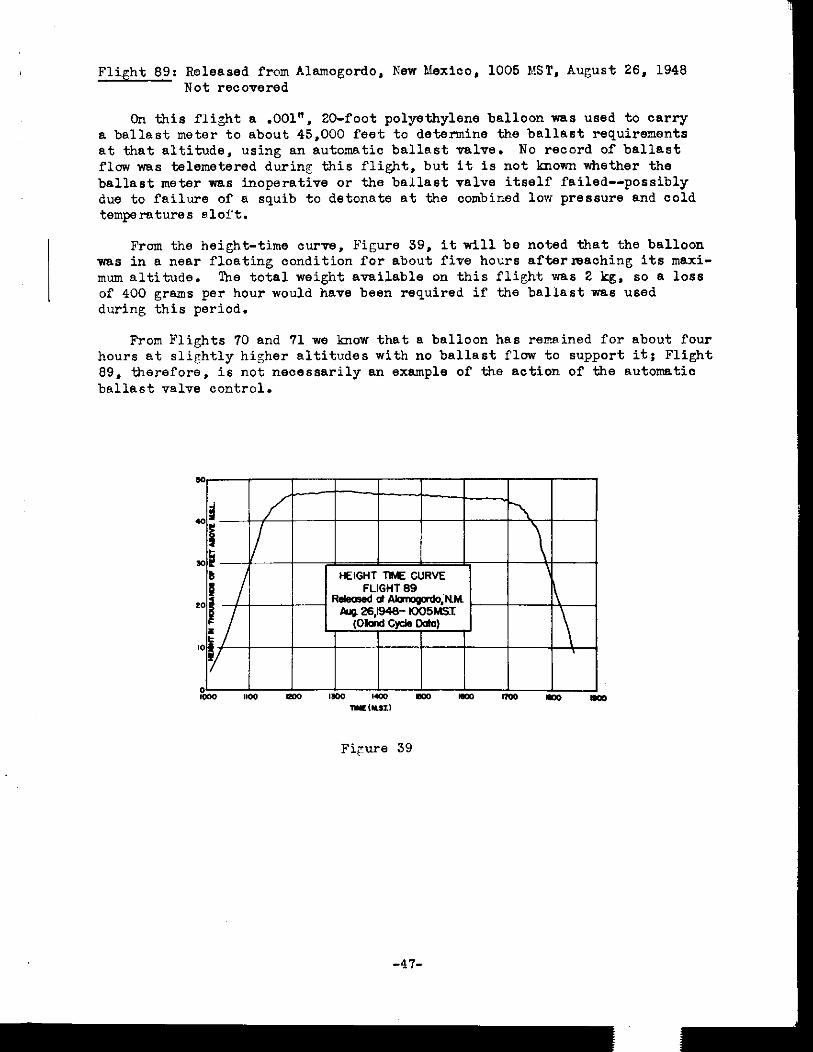
Flight 69: Released from Alamogordo, Kew Mexico. 1005 MST, August 26, 1946 Not recovered
On this fligkt e. .OOl", ZO-foot polyethylene balloon was used to carry a ballast meter 'cc about 45,000 feet to determine the ballast requirements at that altitude, using an automatic ballast valve. No record of ballast flow was telemetered during this flight, but it is not known whether the ballast meter was inoperative or the ballast valve itself failed--possibly due to failure of a squib to detonate at the combined low pressure and cold temperatures 81Cfx.
From the height-time curve, Figure 39, itwill be noted that the balloon was in a near floating condition for about five hours afterlsaching its maxi- mum altitude. The total weight available cn this flight was 2 kg, so a loss of 400 grams per hour would have been required if the ballast was used during this period.
From Flights '70 and 71 we know that a balloon has rerwined for about four hours at slightly higher altitudes with no ballast flow to support it; Flight 69, therefore, is not necessarily an example of the action of the automatic ballast valve control.
FiGwe 39
-47-
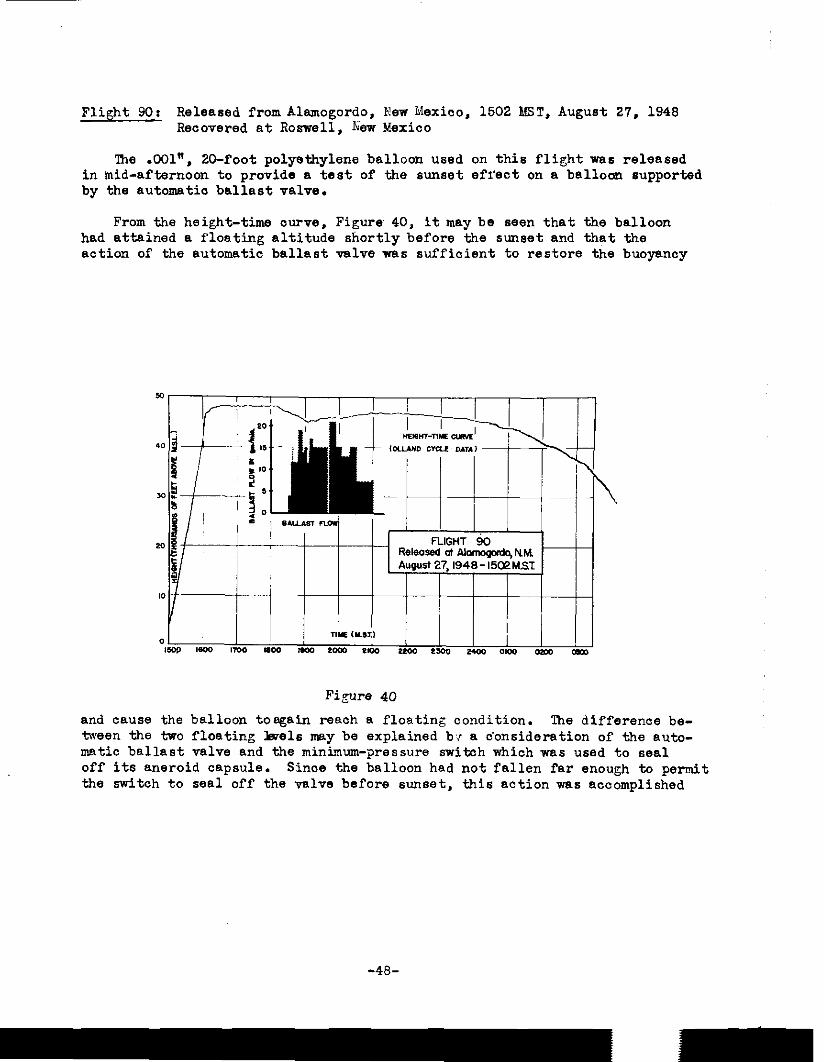
Flight 90: Released from Alamogordo, New Mexico, 1502 MST, August 27, 1948 Recovered at Roswell, km Mexico
The .oa”, 20-foot polyethylene balloon used on this flight was released in mid-afternoon to provide a test of the sunset effect on a ballom supported by the automatia ballast valve.
From the height-time curve, Figure 40, it may be seen that the balloon had attained a floating altitude shortly before the sunset and that the action of the automatic ballast valve was sufficient to restore the buoyancy
Auqusi 2?,1948-1502MSK
I r; x) Figure 40
and cause the balloon toagain reach a floating condition. The difference be- tween the two floating keels may be explained br a Consideration of the auto- matic ballast valve and the minimum-pressure switch which was used to seal off its aneroid capsule. Since the balloon had not fallen far enough to petit the switoh to seal off the valve before sunset, this action was accomplished
-48-
+ m
s
during the sunset descent (caused when the superheated helium lost the sun's heating effeat). A further descent of 5 mb (500 feet at this level) was re- quired to start the flow of ballast. By this time, the balloon had lost oonsiderable lift and in exchange had acquired a downward velocity of about 120 feet per minute. To check this descent a ballast rlow was required for about 40 minutes. During the next hour the balloon was buoyant and climbing baok to the seal-off pressure of the automatic ballast valve. The ineffi- ciency of this valve system is demonstrated by the ballast whiah was lost after the balloon had regained its buoyancy and had begun to rise. More ballast was wasted than ms required to check the descent. Indeed, the entire 3000 grams available vms expended at this time. acaording to the evi- dence of the ballast meter.
On this flight there was no apparent change in the activation pressure of the automatic ballast aneroid between the times when ballast flow began and ended. This indicates that the efitrapped air had not experienced any signi- ficant temperature change during the,two hours of ballast operation.
-43-
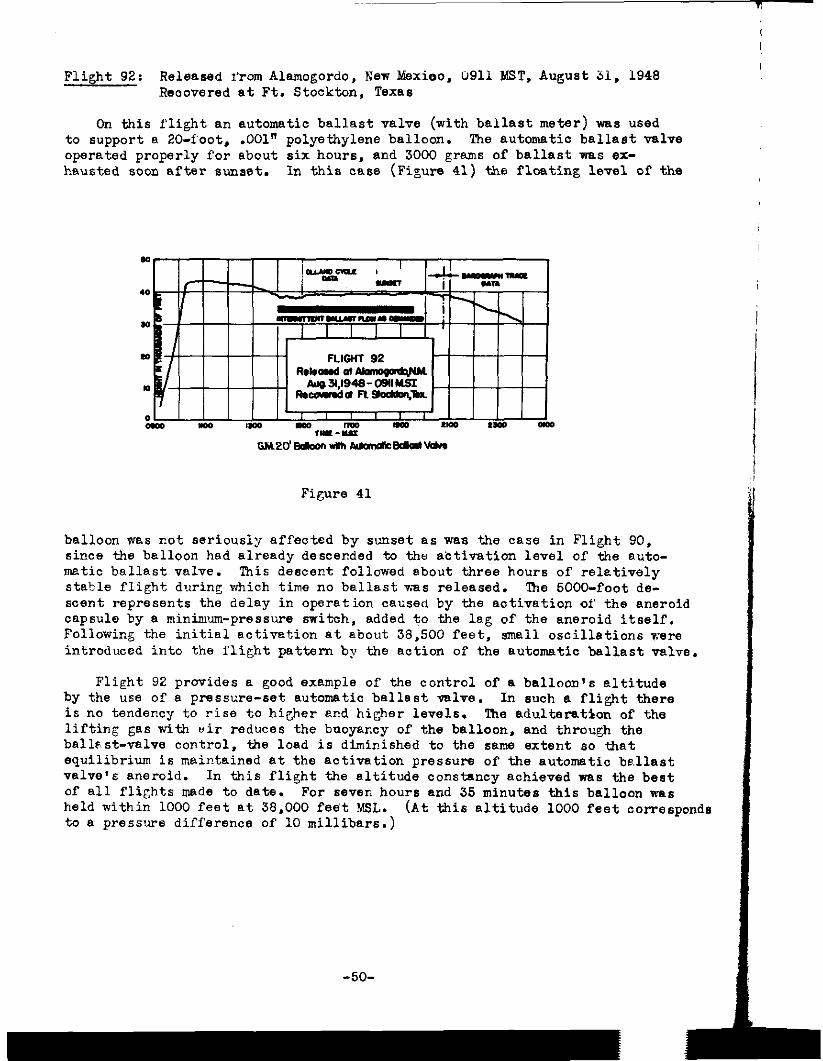
92: Flight Released ~'rcm Alamogordo, New Mexioo. 0911 MST. August 31, 1948 Recovered at Ft. Stockton, Texas
On this flight an automatic ballast valve (with ballast meter) was used to support a 20-foot, .OOl" polyethylene balloon. The automatic ballast valve operated properly for about six hours, end 3000 grams of ballast was ex- hausted soon after sunset. In this case (Figure 41) the floating level of the
Figure 41
balloon was cot seriously effected by suxet as was the case in Flight 90, since the balloon had already descended to the abtivation level of the nuto- metic ballast valve. This descer.t followed about three hours of reletively stakle flight during which time no ballast ~-as released. 'lb 5000-foot de- scent represents the delay in operation caused by the aotivation of the aneroid capsule by a minimum-pressure switch, added to the lag of the aneroid itself. Following the initial activation at about 38,500 feet, small oscillations were introduced into the flight pattern by the action of the automatic ballast valve.
Flight 92 provides 8 good example of the control of a balloon's altitude by the use of e pressure-set automatic ballast valve. In such a flight there is no tendency to rise to higher end higher levels. 'Ihe adulteration of the lifting gas with air reduces the buoyancy of the balloon. and through the ballast-valve control, the load is diminished to the same extent so that equilibrium is maintained at the activation pressure of the automatic ballast valve's aneroid. In this flight the altitude constancy achieved was the best of all flights made to date. For seven hours and 35 minutes this balloon was held within 1000 feet at 38,000 feet YSL. to a pressure difference of 10 millibars.)
(At this altitude 1000 feet corresponds
-5o-
The sunset effect resulted in a rise of about 500 feet (6 mb) in the floating level of the balloon at 1890 MST. This seems to be due to a change in the effeotive seal-off pressure of the aneroid capsule of the auto- matic ballast valve which was the consequence of a decrease in the temperature of the trapped air inside. The rise in altitude experienced corresponds to a decrease of temperature of about WC, the superheat of the aneroid, which was lost at sunset. 'Ibis valve may be oomparsd with the 30°C found on Flight 10. On the earlier flight a black valve was used while on this flight tbs equipsntwas polished aluminum, with a highly reflective surface.
-
-517
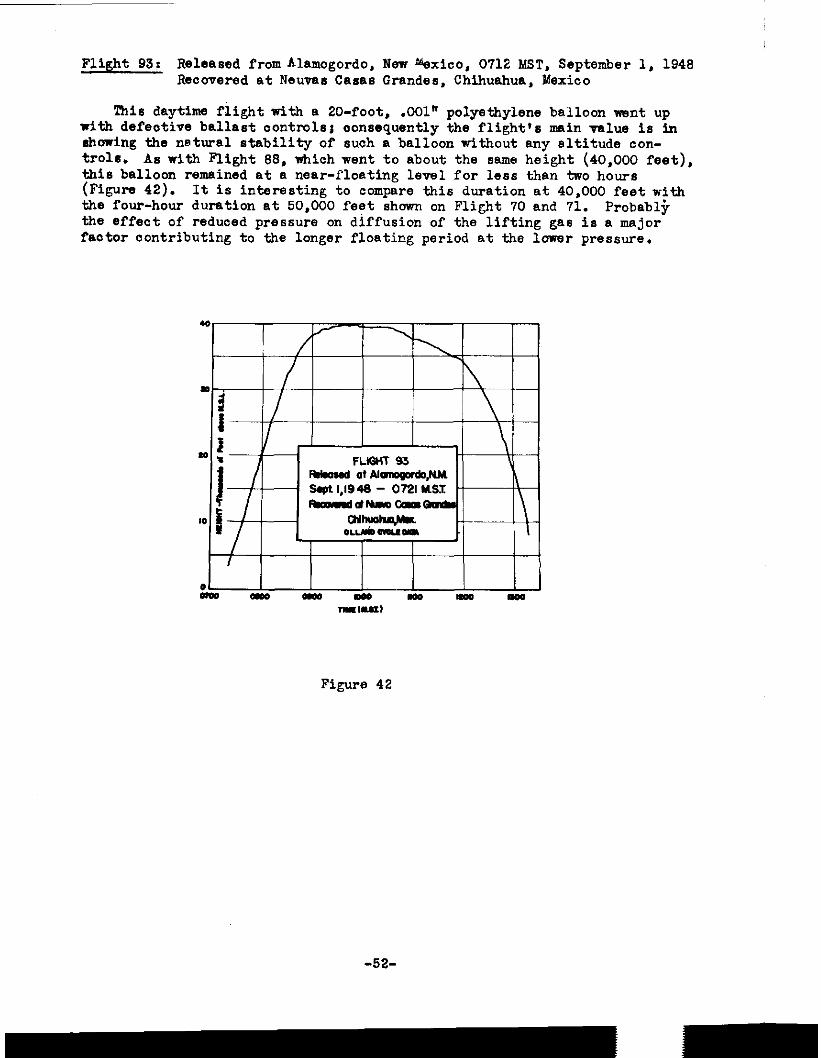
Flight 93: Released from Alamogordo, New Mexico, 0712 MST. September 1. 1948 Recovered at Newas Cams Grandes. Chihuahua, Mexico
This daytime flight with a 20-foot, .OOl" polyethylene balloon wsnt up with defective ballast oontrolsi aonsequently the flight's main value is in showing the natural stability of such a balloon without any altitude con- trols. As with Flight 88, which went to about the same height (40,000 feet), this balloon remained at a near-floating level for less than two hours (Figure 42). It is interesting to compare this duration at 40,000 feet with the four-hour duration at 50,000 feet shown on Flight 70 and 71. Probabljr the effect of reduced pressure on diffusion of the lifting gas is a major factor contributing to the longer floating period at the lower pressure.
Figure 42
-52-
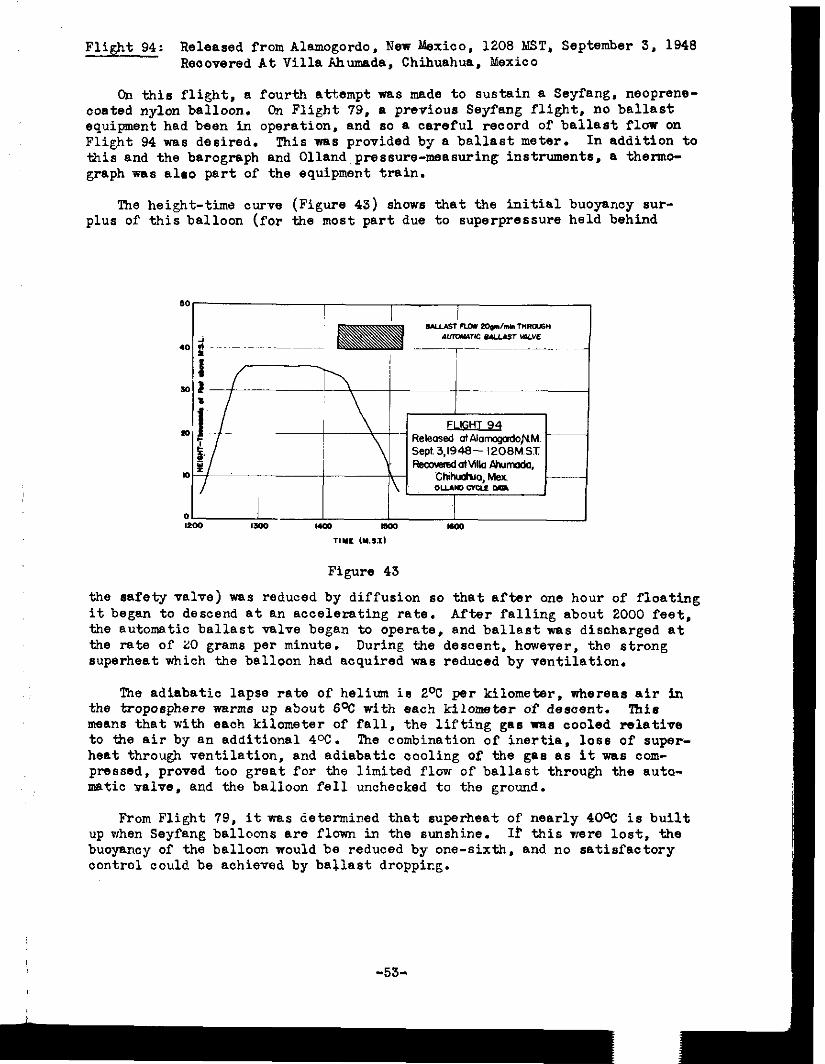
94: Flight Released from Alamogordo, New Mexico, 1208 MST, September 3, 1948 Reoovered At Villa khumada, Chihuahua, Mexico
On this flight, a fourth attempt was made to sustain a Seyfang. necprene- coated nylon balloon. On Flight 79, a previous Seyfang flight, no ballast equipment had bsen in operation, and 80 a cwreful record of ballast flow on Flight 94 was desired. This was provided by B ballast meter. In addition to this and the barograph and Olland~pressure-measuring instruments, a thermo- graph was also part of the equipment train.
The height-time curve (Figure 43) shows that the initial buoyancy sur- plus of this balloon (for tbe most part due to superpressure held behind
Figure 43
the safety valve) was reduced by diffusion 60 that after one hour of floating it began to descend at an accelerating rate. After falling about 2000 feet, the automatic ballast valve began to operate, and ballast was discharged at the rata of 20 grams per minute. During the descent, however, the strong superheat which the balloon had acquired was reduced by ventilation.
The adiabatic lapse rate of helium ia 2OC per kilometer, whereas air In the troposphere warms up about 6% with each kilometer of descent. This means that with each kilometer of fall, the lifting gas was cooled relative to the air by an additional 4oC. lhe combination of inertia, loss of super- heat through ventilation, and adiabatic cooling OE the gP8 as it was com- pressed, proved too great for the limited flow of ballast through the auta- matic valve. and the balloon fell unchecked to the ground.
From Flight 79, it was determined that superheat of nearly 4OoC is built up when Seyfang balloons are flown in the sunshine. If‘ this were lost, the buoyancy of the balloon would be reduced by one-sixth, and no satisfactory oontrol could be achieved by ballast dr0ppir.g.
I -53-
-
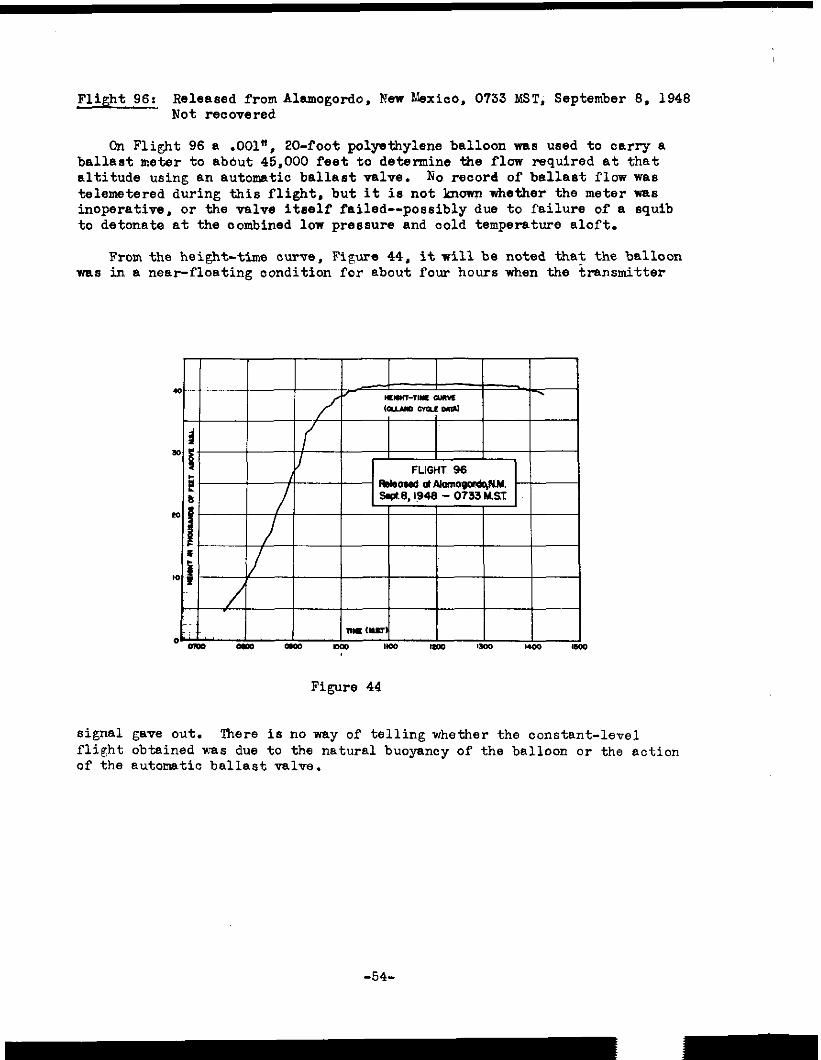
Flight 96: Released from dlamogordo, New Mexico. 0733 MST, September 6, 1946 Not reoovered
On Flight 96 e .OOl", ZO-foot polyethylene balloon was used to oarry a ballast meter to abdut 45,000 feet to determine the flow required at that altitude using en automatic ballast valve. Ko record of ballast flow was telemetered during this flight, but it is not lawen whether the meter was inoperative, or the valve Itself failed--possibly due to failure of a squib to detonate at the oombined low pressure and cold temperature aloft.
From the height-time curve, Figure 44. it will be noted that the balloon was in a near-floating condition for about four hours when the &ansmitter
Figure 44
signal gave out. lhere is no way of telling whether the constant-level flight obtained wae due to the natural buoyancy of the balloon or the action of the automatic ballast valve.
-56
- ~-
I,
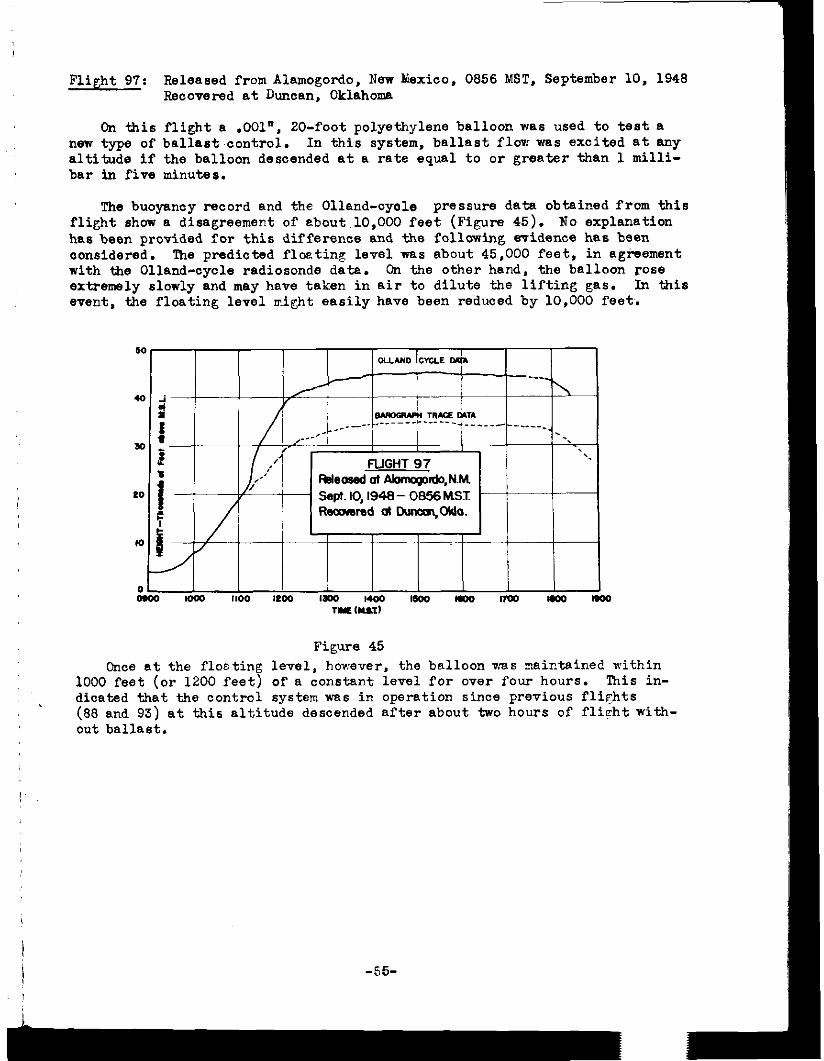
Figure 45
Flight 97: Released from dlamogordo, New &xioo. 0856 MST, September 10. 1948 Recovered at Duncan, Oklahoma
On *is flight a .OOl", ZO-foot polyethylene balloon was used to test a new type of ballast.control. In this system, ballast flow was excited et any altitude if the balloon descended at a rate equal to or greeter than 1 milli- bar in five minutes.
The buoyancy record and the Olland-cyole pressure data obtained from this flight show a disagreement of ebout,lO,OOO feet (Figure 45). No explanation has been provided for this difference and the following evidence has been considered. The predicted fluting level was about 45,000 feet, in agiwement with the Olland-cycle radiosonde data. On the other hand, the balloon rose extremely slowly and may have taken in air to dilute the lifting gas. In this event, the floating level might easily have been reduced by 10,000 feet.
Once et the floating level, however, the balloon was mairtained within 1000 feet (or 1200 feet) of a constant level for over four hours. This in- dicated that the control system web in operation since previous flights (88 and 93) at this altitude descended after about two hours of flight nith- out ballast.
-55-
-
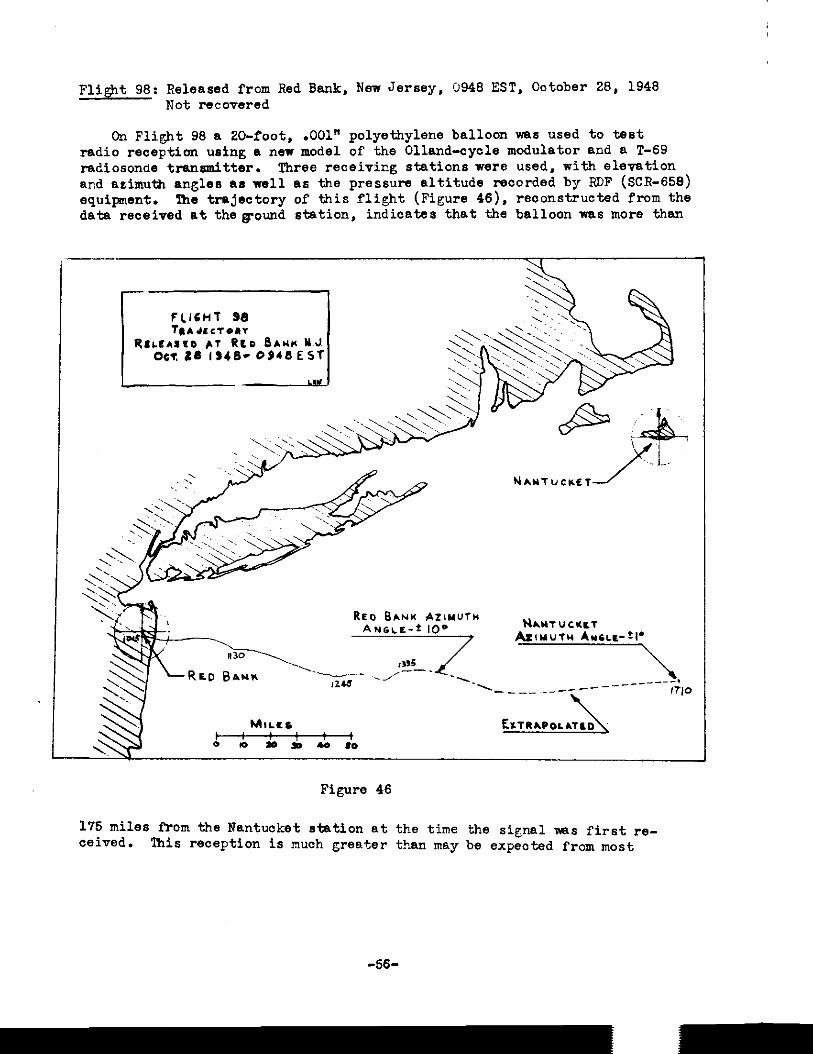
Fli@,t 90: Released from Red Bank, New Jersey, 0948 EST, Cctcber 20, 1948 Not recovered
Cm Flight 98 a ZO-foot. .OOl" polyethylene balloon vme used to test radio reception using a new model of the Ollmd-cycle modulator and a T-69 radiosonde transmitter. Three receiving stations were used, with elevation and azimuth angles ae well (18 the pressure altitude recorded by RDF (SCR-658) equi&mvmt. Ihe trajectory of this flight (Figure 46). reconstructed from the date received at thegolmd station, indiaates that the balloon was more than
RED Blur.
Figure 46
175 miles from the Nantucket station at the time the signal vas first re- ceived. his reception is much greeter than nay be expected from most
-56-
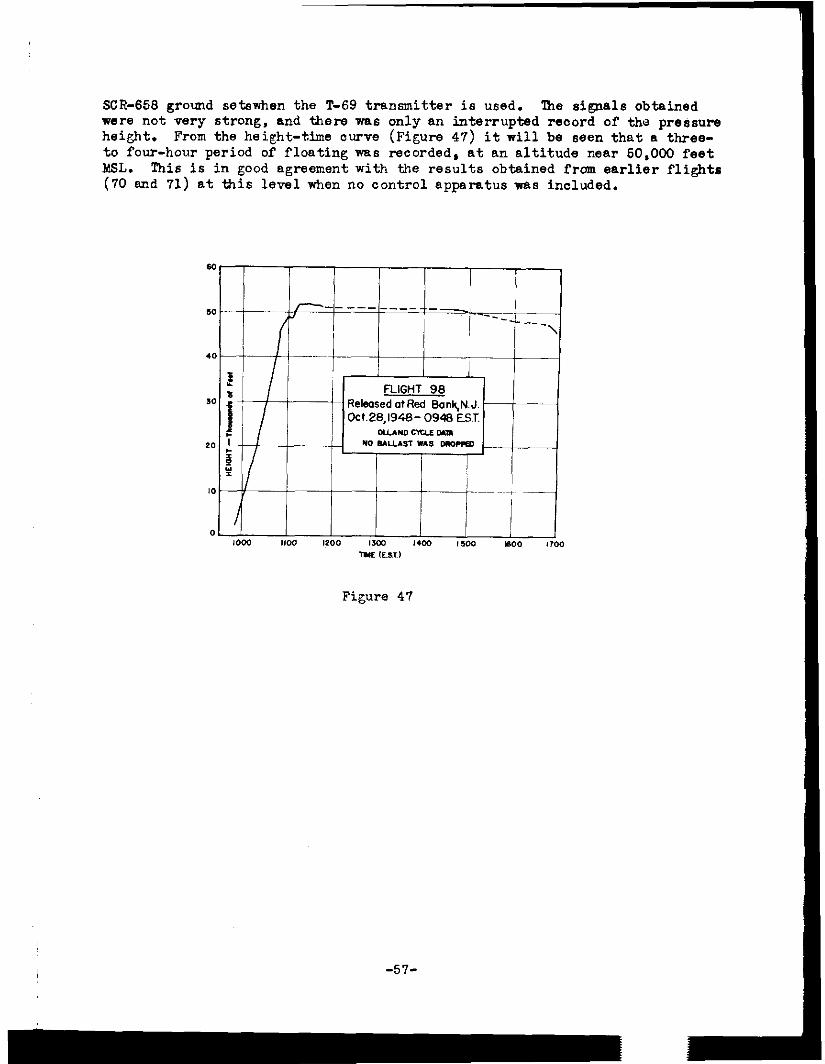
SCR-656 ground setwhen the T-69 transmitter is used. 'lhe signals obtained were not very strong, and there was only an interrupted record of the pretisure height. From the height-time curve (Figure 47) it will be seen that a three- to four-hour period of floating was recorded, tit an altitude near 50,000 feet M6L. This is in good agreement with the results obtained from earlier flights (70 and 71) at this level when no control apparatus was included.
\ -57-
-
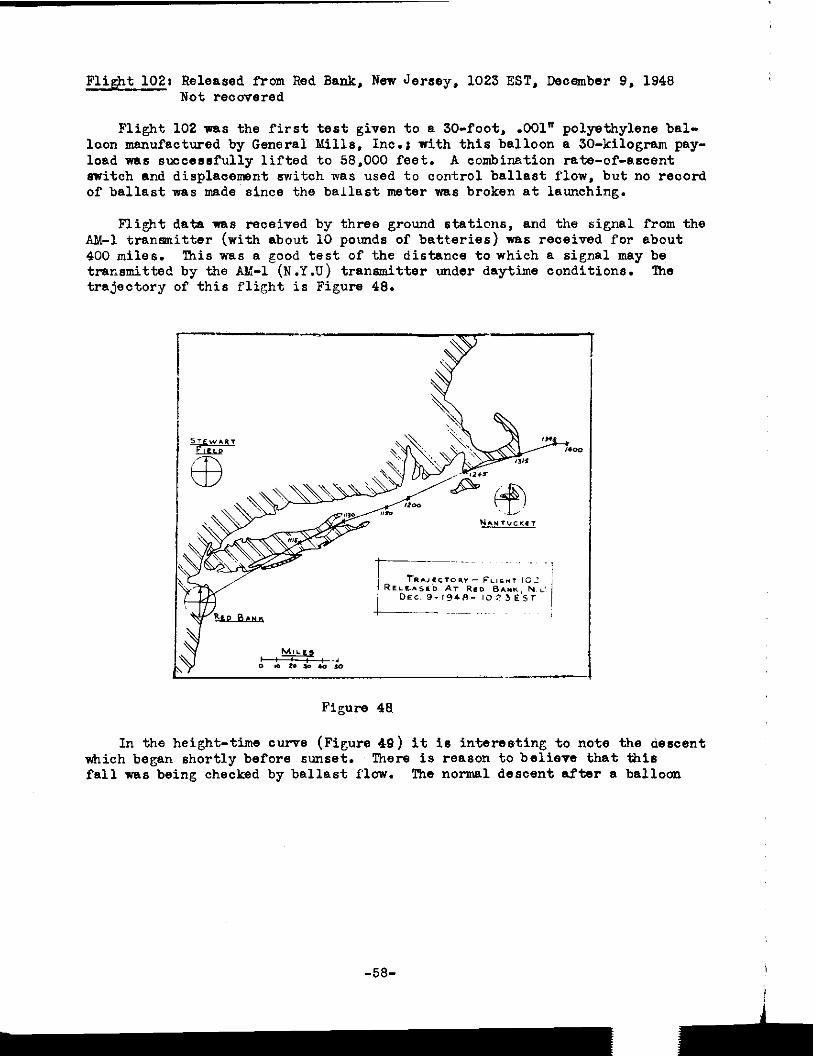
Flight 102: Released from Red Bank, New Jersey, 1023 EST, December 9, 1948 Not recovered
Flight 102 was the first test given to a 30-foot, .OOl" polyethylene bal- loon manufactured by General Mills, Inc.; with this balloon a JO-kilogram pay- load was suocs8sfully lifted to 58.000 feet. A combination rate-of-ascent snitch and displacemnt switch was used to oontrol ballast flow, but no record of ballast was made since the ballast meter was broken at launching.
Flight data was received by three ground stations, and the signal from the AM-1 transmitter (with about 10 pounds of batteries) was received for about 400 miles. ‘his was a good test of the distance to which a signal may be tracsmittad by the AK-1 (N.Y.U) transmitter under daytime conditions. The trajectory of this flight is Figure 48.
Figure 48
In the height-time curve (Figure 49) it is intereesting to note the descent which began shortly before sunset. There is reason to believe that this fall was being checked by ballast flow. The normal descent after a balloon
-58- ,
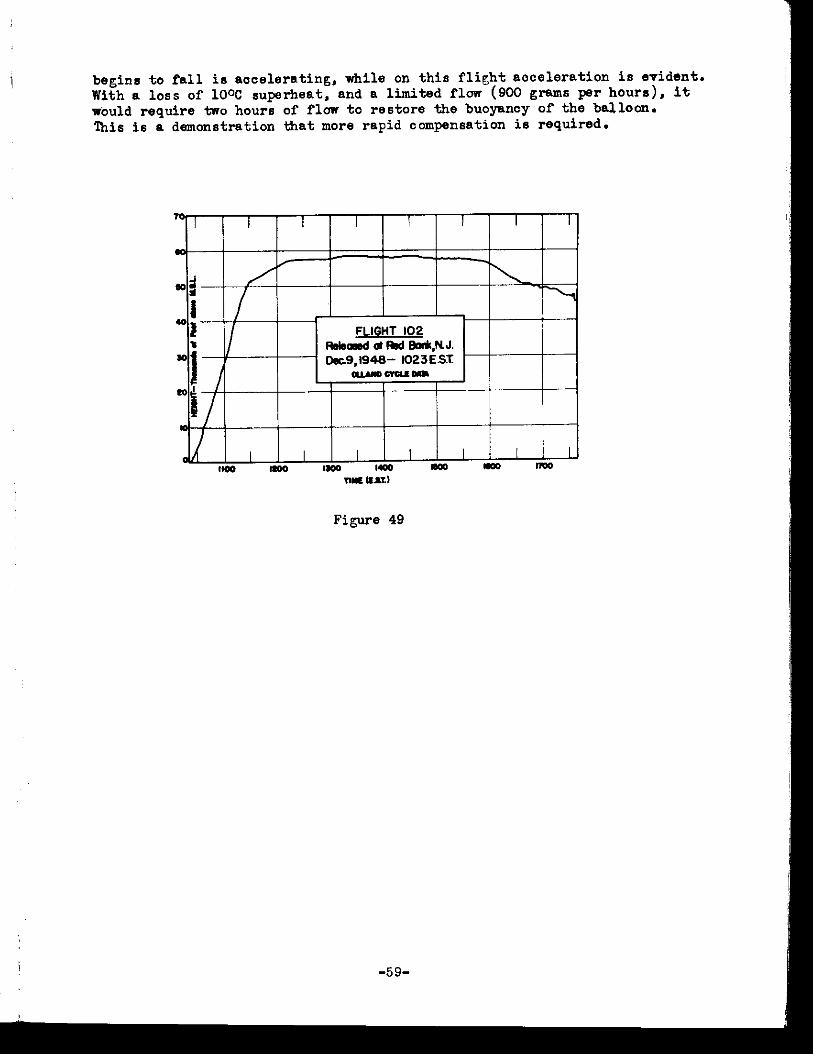
begins to fall is accelerating, while on this flight acceleration is evident. With a loss of 10% superheat. and a limited flow (900 grams per hours), it w&Ad require two hours of flow to restore the buoyancy of the balloon. lhis is a demonstration that more rapid compensation is required.
Figure 49
-59-
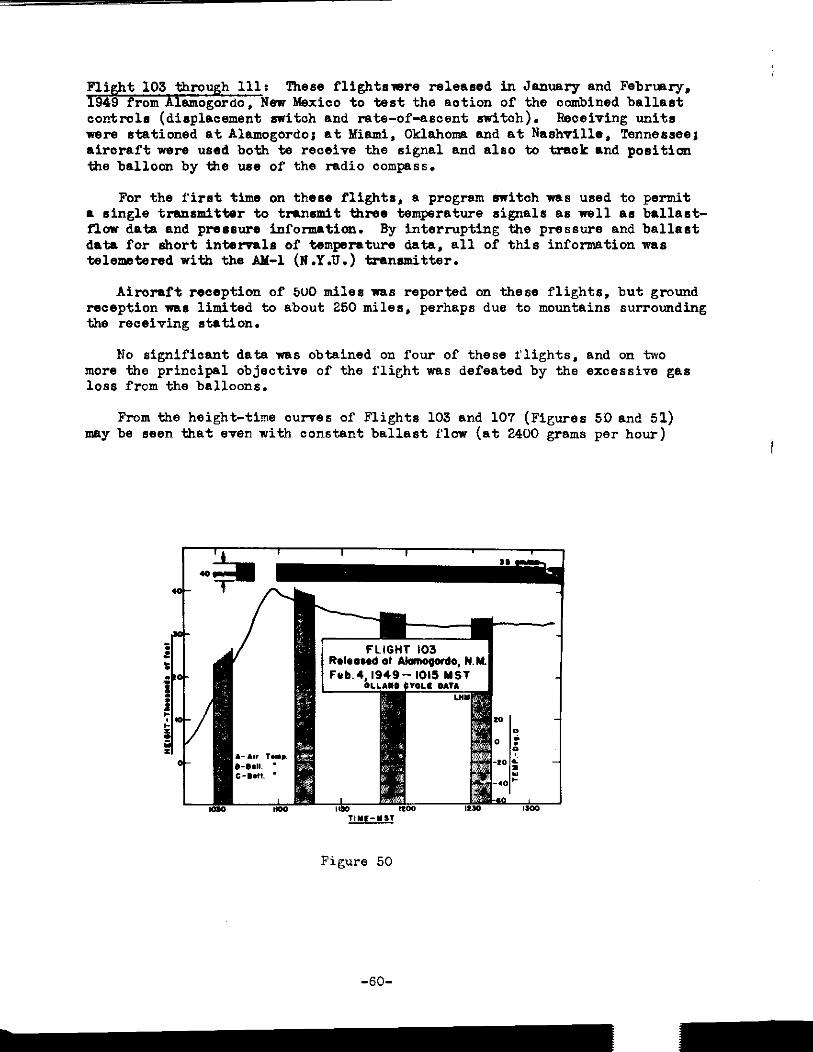
Flight 103 through 111: These flightsware released in January and February, ‘I949 from Alamogordo, New Mexiao to test the action of the combined ballast controls (displacement switch and rata-of-ascent switch). Receiving units wwe stationed at Alamogordoi at Miami, Oklahoma and at Nashville, Tennessee; airaraftnere used both ta reosivs the signal and also to track and poeitia the balloon by the use of the radio compass.
For the first time on these flights, a program switch was used to permit a single transmitter to tnnsmit three temperature signals as well as ballast- flow data and pressure information. By interrupting the pressure and ballast data for short intsrvals of temperature data, all of this information was telemetered with the AH-1 (N.Y.U.) transmitter.
Airoraft reception of 500 miles rnrs reported on these flights. but ground reception wae limited to about 250 miles, perhaps due to mountains surrounding the receiving station.
No significant data lras obtained on four of these rlights, and on two more the principal objective of the flight was defeated by the excessive gas loss from the balloons.
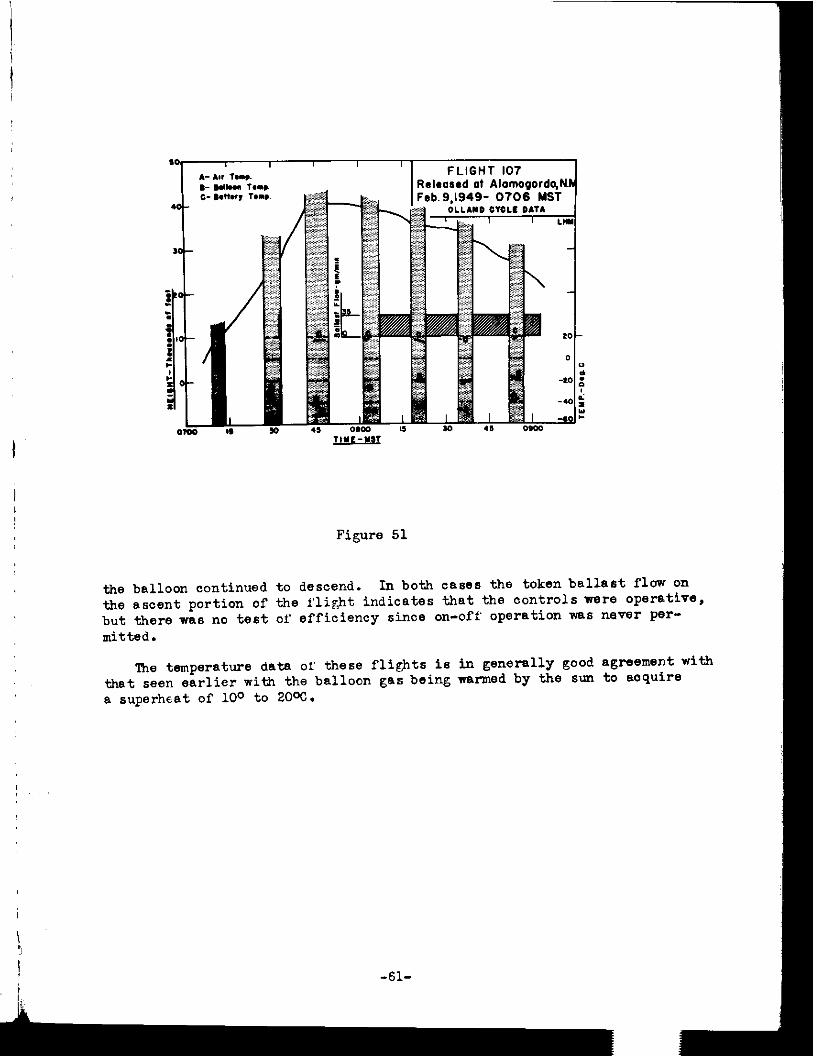
From the height-time curves of Flights 103 and 107 (Figures 5D and 51) may be seen that even with constant ballast flow (at 2400 grams per hour)
Figure 50
-6O-
Released ot Alomo9ordqN 49- 0706 MST
Figure 51
the balloon continued to descend. In both cases the token ballast flew on the ascent portion of the flight indicates that the controls were operative. but there was nc test of efficiency since on-off' operation was never per- mitted.
lhe temperature data or these flights is in generally good agreement with that seen earlier with the balloon gas being warmed by the sun to acquire a superheat of 100 to 20.X.
! -61-
,
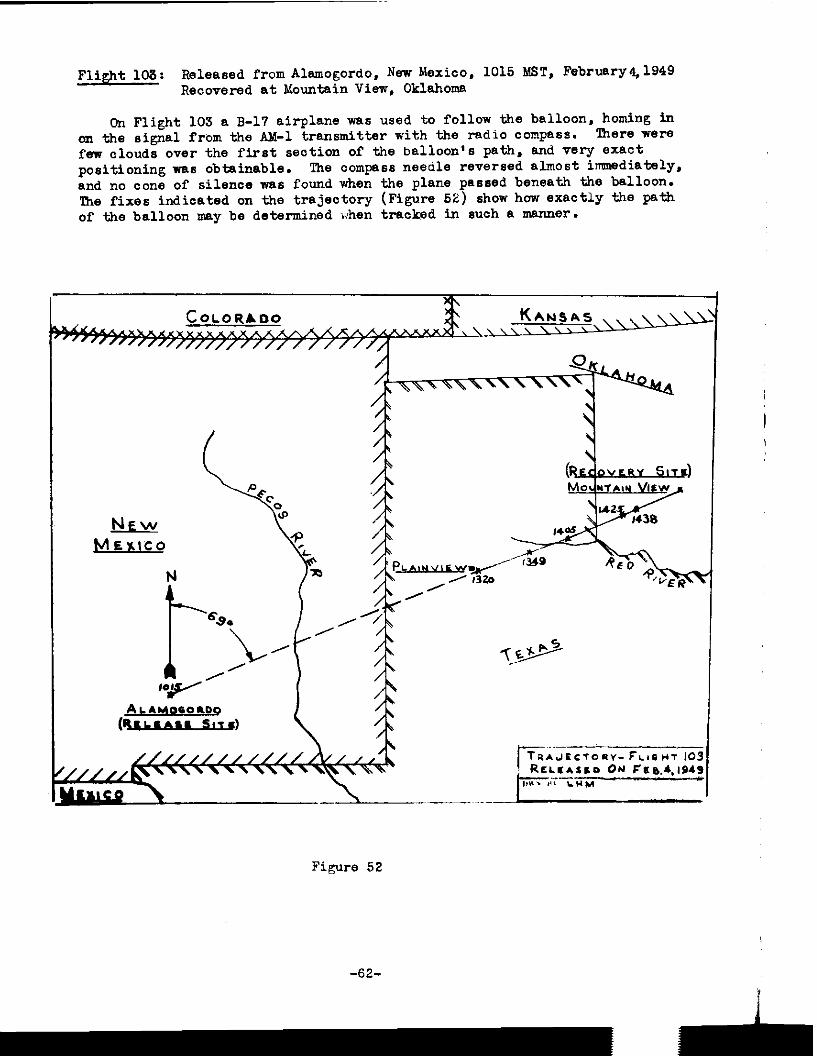
Flight 103: Released from Alamogordo, New Mexico, 1015 MST, February&1949 Recovered at Mountain View, Oklahoma
On Flight 103 a B-17 airplane ~88 used to follow the balloon. homing in cm the signal from the AM-1 transmitter with the radio ccnpass. There were few clouds ever the first section of the balloon's path, and very exact positioning 1~s obtainable. The ocmpass needle reversed almost imdiately. and no cone of silence was found when the plane passed beneath the balloon. Ihe fixes indicated on the trajectory (Figure 52) show how exactly tbe path of the balloon my be determined when tracked in such a manner.
C_OLORADO KANSAS
Figure 52
-62-
1
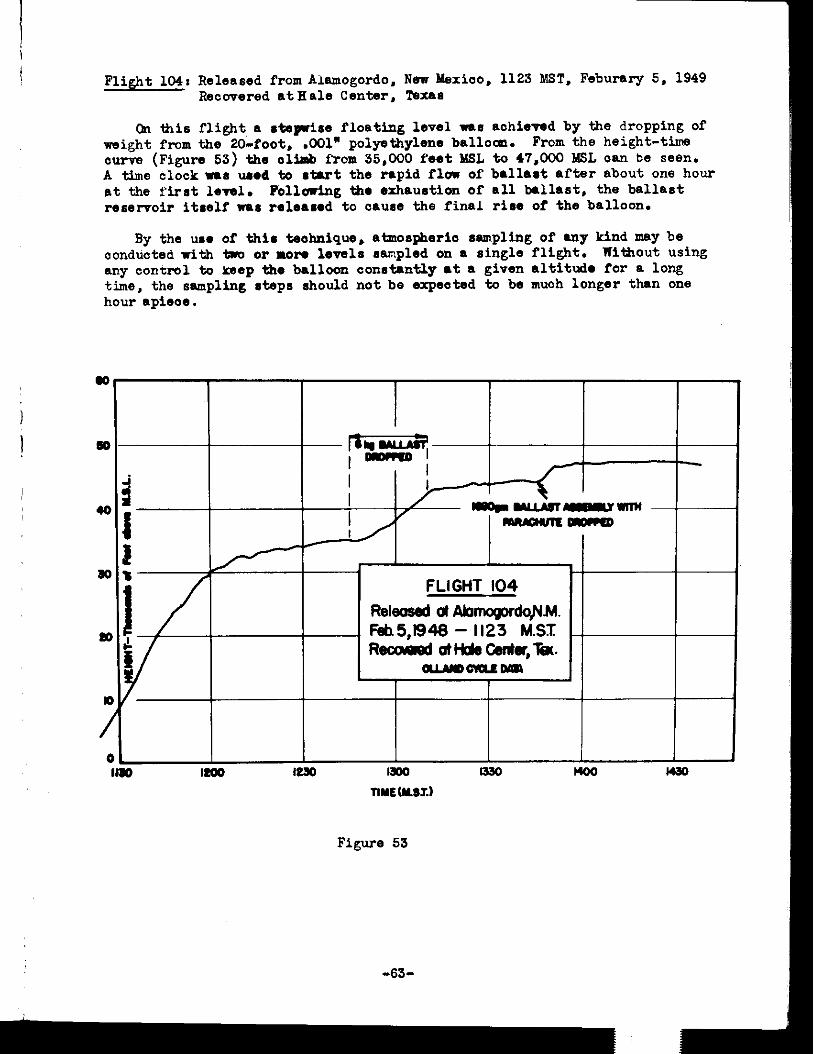
Flight 104: Released from Aiamogordo, New Mexico, 1123 MST, Feburary 5. 1949 Recovered atHale Center, hxa6
Cn tiis flight a 6tspiEe floating level -6 achieved by the dropping Of might fmm the 20-foot, .OOl' polyethylene balloon. From the height-time ourw (Figure 55) the olM from 35,000 feet MSL to 47,COC MSL OM be seen. A time o'lock wa6 u6ed to 6tart the rapid flow of ballart after about on6 hour at the first 10-l. ~Olb,d.ng the eXhaU6tioZI Of all ballast, the b&last reservoir itrelf war releared to cau6e the final rise of the balloon.
By the ~6. Of thi6 t&Ohnique, atmO6pheriO Empling Of any kind my be conducted with two or more leWl6 Earnpled on a sing16 flight. WithOUt Using 6ny oontrol to keep the balloon constantly at a given altitude for a long time, the sampling rteps should not be expeoted to be much longer than one hour apieoe.
-I FLIGHT 104 Releosd d Abmogorwhl. Fsh 5,lS‘M - II23 MST RM dHdO&iW,TiX.
alAmau.ElLloI
,
lo Iwo IW I300 I330 l400 l4.m
Figure 53
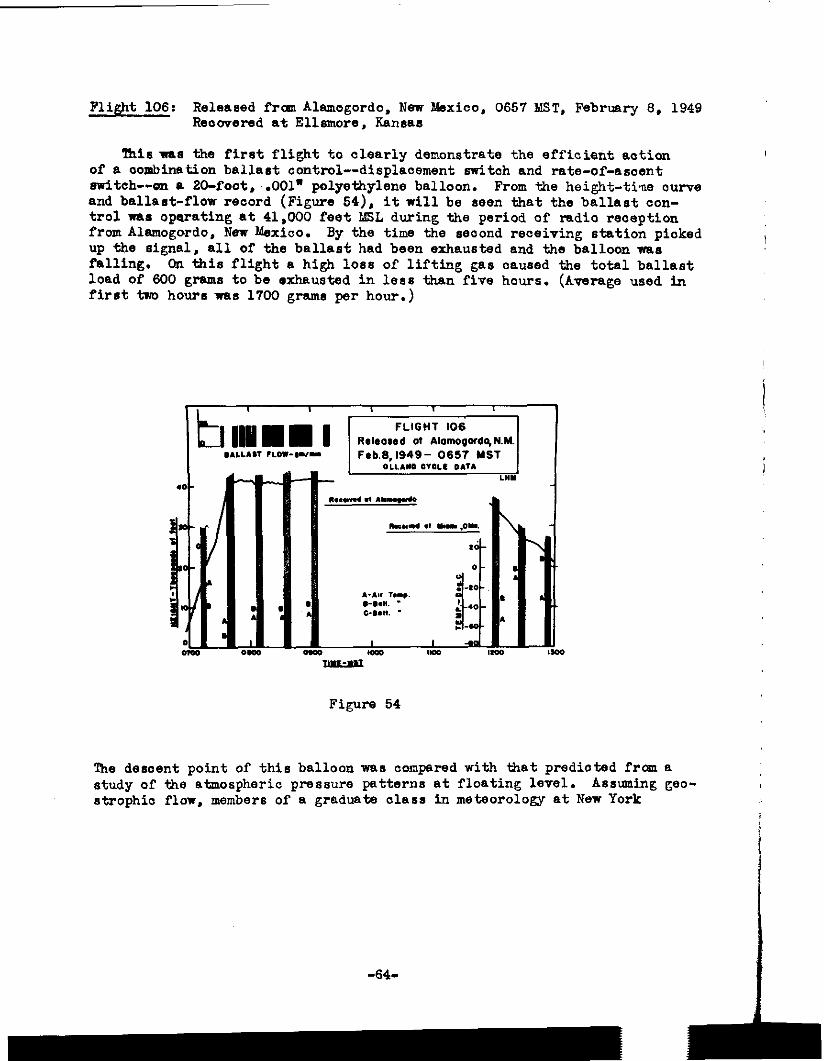
Flight 106: Released from Alamogordo, New Mexico. 0657 M8T. February 8. 1949 Reocvered at Ellsmore, Kansas
This maa the first flight to clearly dencnstrate the efficient aoticn , of a combination ballast control--displacement switoh and rate-of-ascent switch--en a 20-foot , .OOl" polyethylene balloon. From the height-tiw curve and ballast-flow record (Figure 54), it will be seen that the ballast ccn- trol naa operating at 41,000 feet M8L during the period of radio reception from Alamogwdo. New Mexico. By the time the second receiving station picked up the signal, all of the ballast had been exhausted and the balloon W(LLI I falling. On this flight a high loss of lifting gas caused the total ballast load of 600 grams to be exhausted in leas than five hours. (Average used in first tan hours aa# 1700 grams per hour.)
Figure 54
The desaent point of this balloon maa compared with that predicted fragn a study of the atmospheric pressure patterns at floating level. Assuming gec- , strophic flew, members of a graduate olasa in meteorology at New York
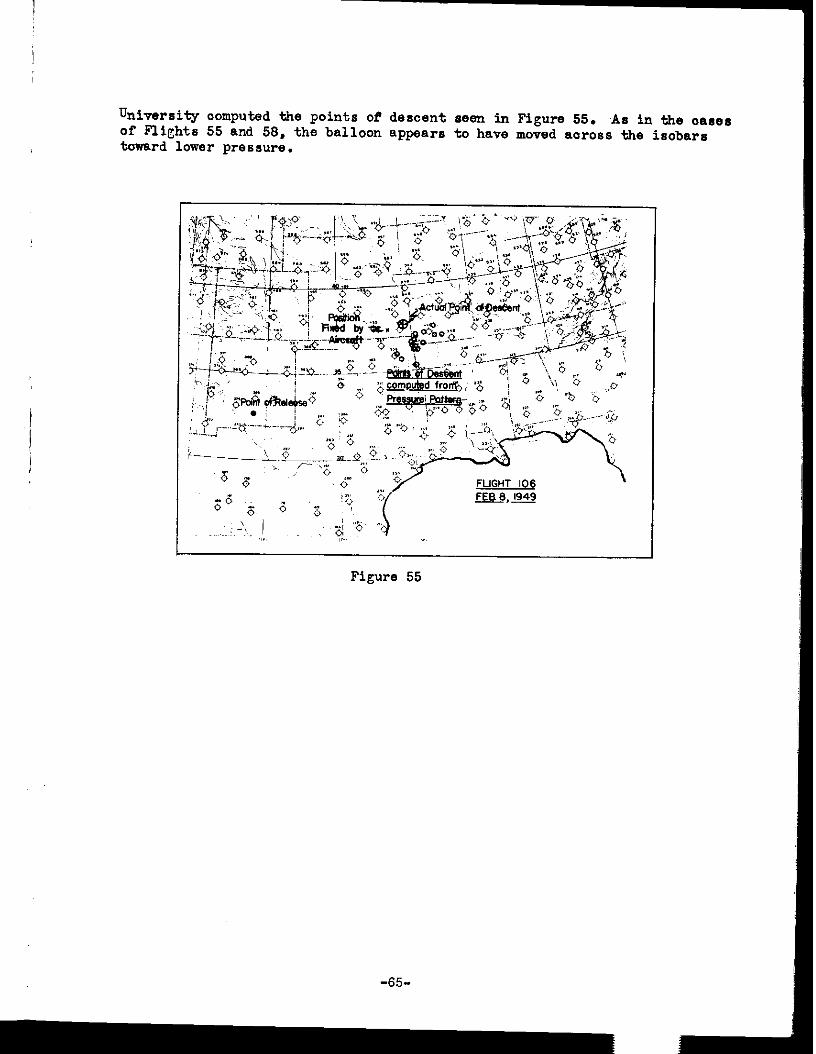
University computed the points of' descent seen in Figure 55. As in the CBIJB~ of Flights 55 and 58, the balloon appears to have moved aoross the isobars toward lower pressure.
1949 FEE 8.
Figure 55
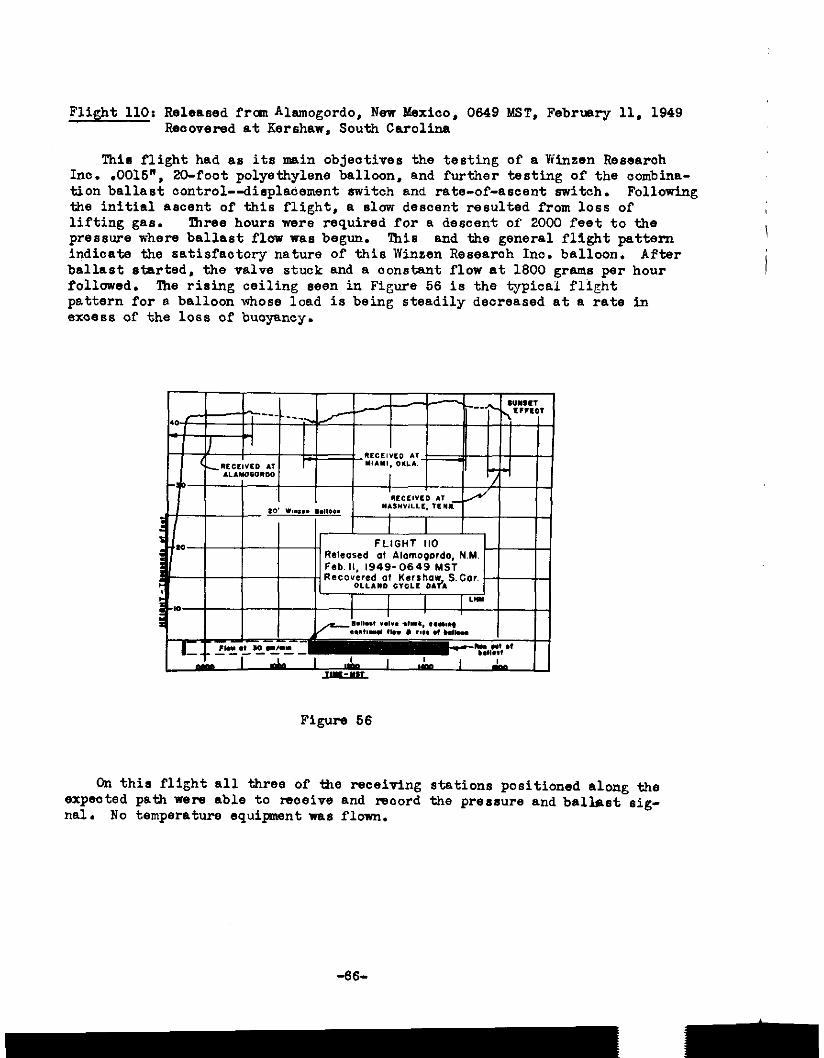
Flight 110: Released Proan Alamogordo, New Mexico, 0649 MST, February 11, 1949 Recovered at Kershaw, South Carolina
This flight had as its main objectives the testing of a Winzen Research Inc. .0015", ZO-foot polyethylene balloon, and further testing of the combina- tion ballast control--3iaplaoement switoh and rate-of-ascent switch. Following the initial ascent of this flight, a slow descent resulted from loss of lifting gas. 'lbree hours were required for a descent of' 2000 feet to the pressure where ballast flow was begun. This and the general flight pattern indicate the satisfactory nature of this Winsen Researah Inc. balloon. After ballast started, the valve stuck and a constant flow at 1600 grams per hour followed. The rising ceiling 8een in Figure 56 is the typical flight pattern for a balloon whose load is being steadily decreased at a rate in 8xoe.w of the loss of buoyancy.
FLIGHT 110
Figure 56
On this flight all three of the receiving stations positioned along the expected path were able to receive and maord the pressure and ballast, eig- nal. No temperature equipnt was flown.
-66-
- -
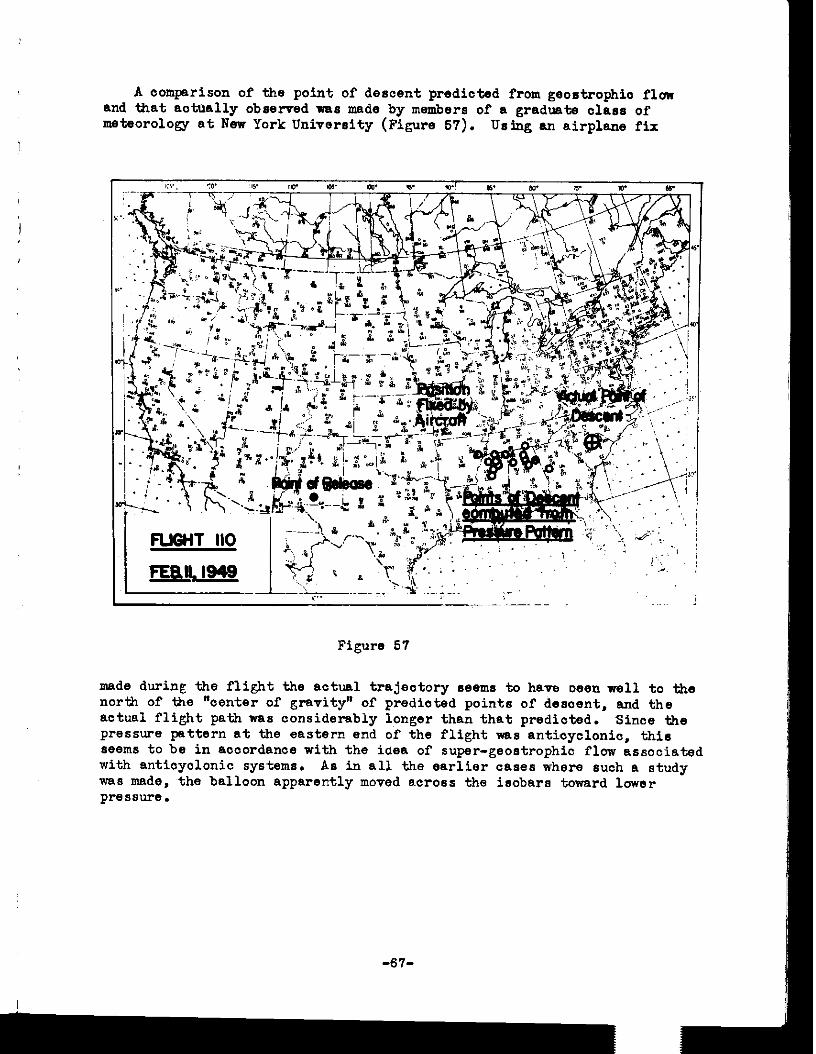
A comparison of the point of descent predicted from geostrophio flom and that actually observed nes made by members of a graduate class of meteorology at New York University (Figure 57). Using an airplane fix
Figure 57
made during the flight the actual trajectory seems to have seen well to the north of the "center of gravity" of prediated points of descent, and %he actual flight path was considerably longer than that predicted. Since the pressure pattern at the eastern end of the flight was anticyclonic, this seems to be in accordance with the idea of super-geostrophic flow associated with anticyclonic systems. As in all the earlier case8 where such a study was made, ~the balloon apparently moved across the isobara toward lower pressure.
-67-
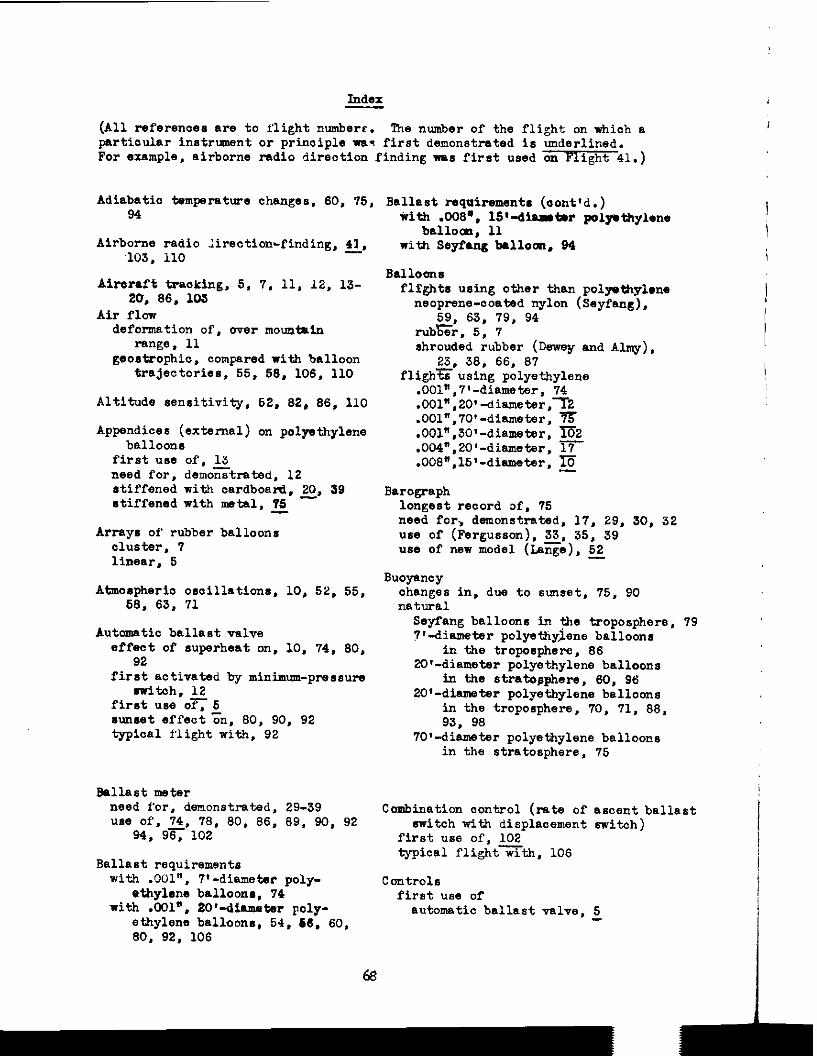
(All references are to flight numberr. The number of the flight on which a particular instrrrment or prinoiple nay first denonatrated is underlined. For example, airborne radio direction finding 1~8 first used on Flight 41.)
Adiabatio temperature changes, 60, 94
76. Ballast mquiremsnt6 (oont'd.) iith .006~, 15'-diu*r polyethylene I
ballom. 11 \ Airborne radio lirecticn-finding, fi,
,103, 110 with SeyfGg balloon, 94
B alloons flfghts using other than polgsthyl*ne
neoprene-ooabed nylon (Sayfang). 59, 63, 79, 94
rub&, 5, 7 shrouded rubber (Dewey and Almy),
g, 36, 66, 67 fli,ghts using polyethylene
.001',7'-diameter, 74
.001",201-diameter,= .001".70'-diameter, 75 .001",30'-diameter, m2 .004".20'-diameter. 17 .006".15'-diameter, m
Airwaft tmoking. 5. 7, 11. 12. 13- 20, 66, 103
Air flew deformation of, ever mountain
range, 11 goostrophic, compared with balloon
trajectories, 55. 66, 106, 110
Altitude sensitivity, 52, 62, 66, 110
Appendices (external) on polyethylene balloons
first use of, 13 need for, deno?&-ated, 12 stiffened with cardboard, g, 39 stiffened with metal, 75 -
Arrays of rubber balloons cluster. 7 linear. 5
Atmospheric osoill~ticns. 10, 52. 55, 56, 63, 71
A,utcmatic ballast valve effect of superheat on, 10, 74. 60,
92 first activated by mininan-pressure
witch, 12 first use op; 5 sun8et effect&, 60, 90, 92 typical flight with, 92
Ballast meter need for, demonstrated, 23-39 "80 of, 74, 78, 60. 66, 69, SO, 32
94. SK.102
Ballast requirements with .OOl", 7'-diameter poly-
ethylene balloona, 74 with .OOl', 20'-dimMtar pcly-
ethylene balloons, 54, 66, 60, 60, 92, 106
Barograph longest record af, 75 need for, demonstrated. 17, 29, 30, 32 use of (Fergusscn), 33, 35, 39 use of new model (Lange), 52
Buoyancy changes in. due to snset., 75, SO natural
Seyfang balloons in $he troposphere, 79 7'-diameter polyethylene balloons
in the troposphere, 66 20'-diameter polyethylene balloons
in the strata@phere, 60, 96 20'-diameter polyethylene balloons
in the troposphere, 70, 71, 66, 93, 96
7O'-diametar polyethylene balloons in the stratosphere, 75
Combination control (rate of ascent ballast switch with displacement switch)
first use of, 102 typical flightxtb. 106
Controls first use of
automatic ballast valve, 5
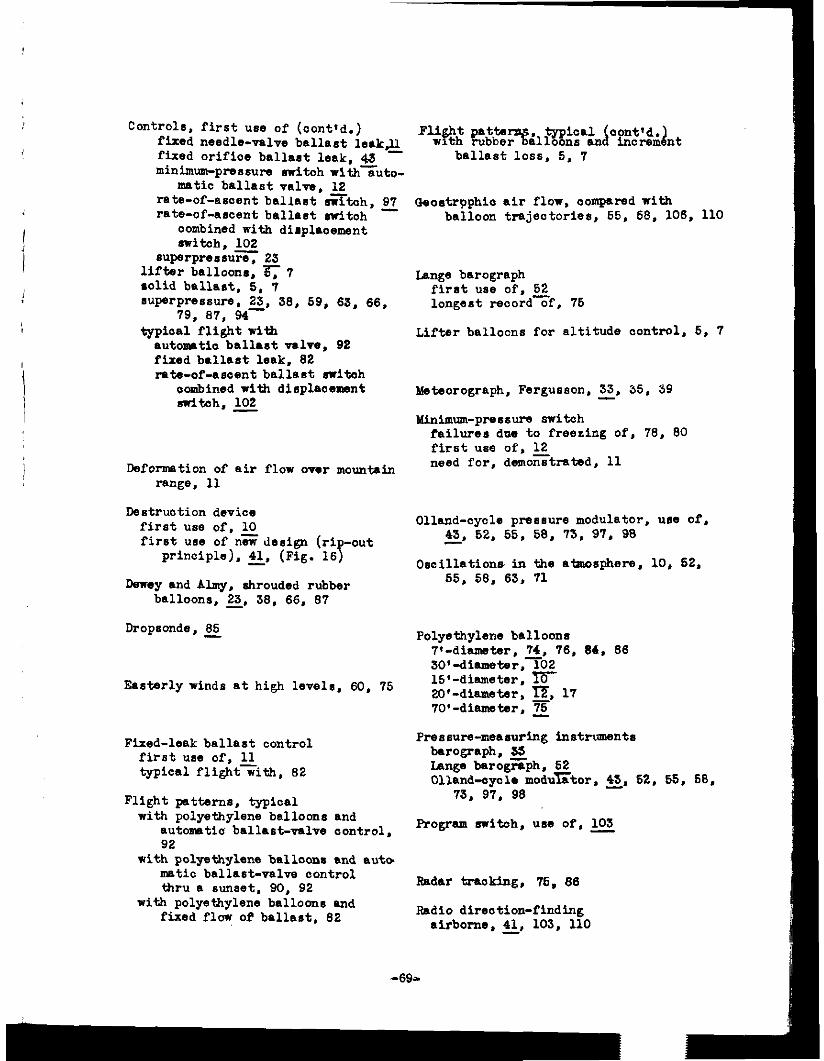
CCntrCls. first u110 of (oont'd.) fixed needle-valve ballast leak,& fixed orifice ballast leak, 43 minimum-pressure mitch with-&to-
matic ballast valvs, 12 rate-of-ascent ballast atih, 2 rate-of-ascent ballast switch
Combined with dirplaoemnt mitoh. 102
supsrpressu~ 23 lifter balloona, 3;T 7 solid ballast, 5. 7 auperpreasure, 2j. 36, 59, 63, 66.
79. 67. 96 typioal~flight with
autcaatic ballast valve, 92 fixed ballast leak, 62 rate-of-asoent ballast mitch
ocmbined with displacement mltch. 102 -
Dsformtion of air flow over mountain range, 11
Destruction device first um of. 10 first "8.3 of nGdesign (ri -cut
principle). 4& (Fig. 16 P
Dewey and Almy. shrouded rubber balloons, 3, 36, 66, 67
Dropscnds, 65 -
Easterly winds at high levels. 60, 75
Geoetrpphic air flow. compared with balloon trajectories, 55, 56. 106. 110
Lange barograph first U88 of. z longest record of, 75
Lifter balloons for altitude control, 5. 7
Meteorograph, Fergusson, 2, 35, 39
Minimum-pressure switch failures due to freezing of, 76. 60 first use of, 12 need for, dmcfiirtrated, 11
Olland-cycle presaurs modulator, um of, 49, 52, 55. 68. 13. 91. 96
Oscillations in the atmosphere. 10~, 62. 55. 56. 63, 71
~olyethylsna balloons 7'-dianmter, ", 76. 66. 66 30'-diamter, 102 15'-diameter, 10 20'-diameter. E. 17 'IO'-diameter, E
Fixed-leak ballast control Pressure-measuring instruments first u*e of. 11 barograph. Jj typical PlightTith, 62 Lange barograph. 52
OlIand-cycle mcdu=tor. ss. 52, 55. 56.
Flight patterns, typical 73, 97, 96
with polyethylene balloons and autcmtia ballast-valve control. Program mitoh, "se of. 103 - 92
with polyetbylsne balloons and au+ mtic ballast-valve control en-u a sunset, 90, 92 Radar tracking, 75, 86
with polyethylene balloons and fixed flow of ballast, 62 Radio dirsoticn-finding
airborne. g, 103, 110
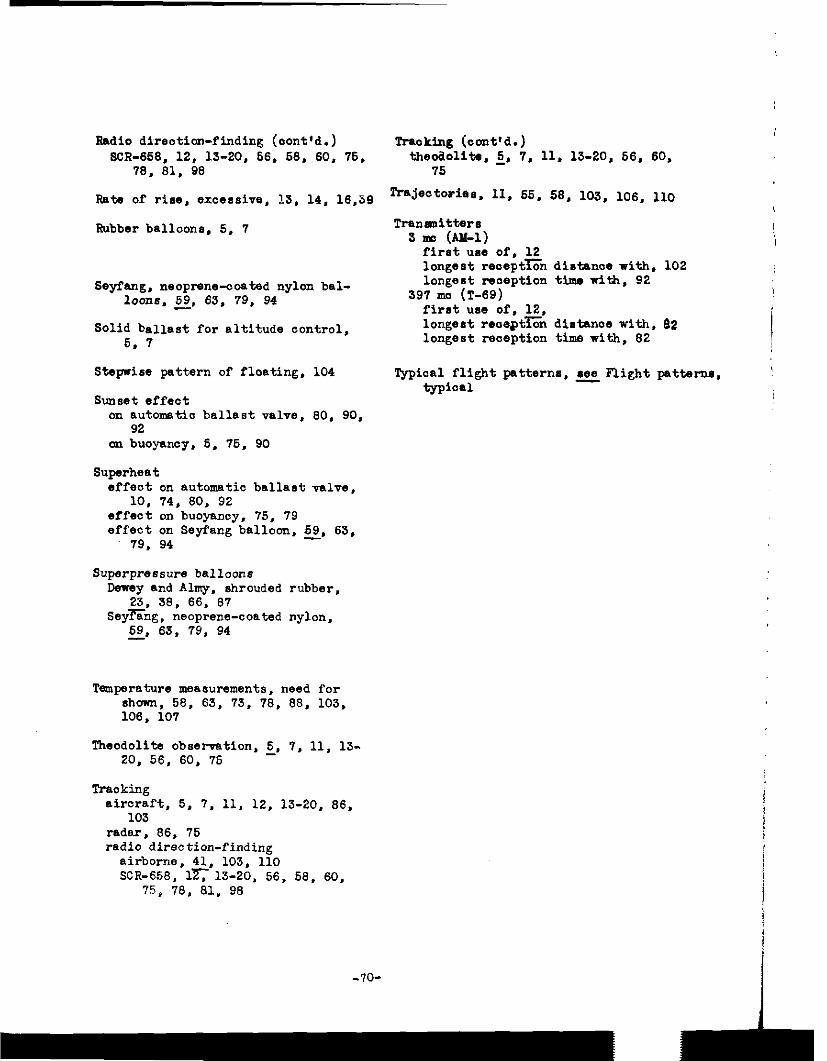
Radio directian-finding (cont'd.) Tmckin(; (ccmt'd.) SCR-558, 12. 13-20, 55, 68, 50, 75, thecdolita, 2, 7, 11, 13-20, 65, 50.
78. 51, 95 75
Rata of rise. excessive, 13. 14, 15.39 Traject=ies, 11. 65. 58, 103, 105, 110 \
=----- balloons, 5. 7 Tranmittera 3 Em (AM-l)
I
first, um of. 12 longest receptT7in dintame with, 102
Seyfmg, neopr8ne-cce.ted nylon bal- longest reoeption tims with, 92 / loons. ", 53. 79, 94 397 rL0 (T-59)
first um of. 12. Solid ballast for altitude control, longest recept% di&ance with. 82
5. 7 longest reception time with, 52
Stepwise pattern of floating, 104
Sunset effect on autcmtic ballast valve, 50, 90,
92 on buoyancy, 5, 75. 90
Superheat effect on automatic ballast valve,
10, 74, 80, 92 effect cm buoyancy. 75. 79 effect on Seyfeng balloon, ", 53,
79. 94
6&y and Almy. shrouded rubber, 23, 38. 55. 87
Sey?.kg, neoprene-coated nylon. 59, 53. 79. 94
Ttrmpsrature measurements. need for shcm, 58, 53, 73. 75, 58, 103, 105, 107
Tbeodolits observation. 5, 7, 11, 13~ 20, 55, 50. 75
hacking aircraft, 5, 7, 11, 12, 13-20, 85,
103 radar, 55, 75 radio direction-finding
airborne, 41, 103, 110 SCR-555, lz 13-20, 55, 58. 50,
75, 78, 51. 98
Typical flight patterns, me Flight patterna, typical
-
New York University Technical Report No. I Constant Level Balloon April 1, 1948
13

TECHNICAL REPORT NC?. 1
Balloon Group, Constant Level Balloon Projsat
New York University
Covering the psriod Nov. 1, 1946 to Jan. 1. 1946
CONSTANT LEVEL BALLOON
Research Division, Project No. 93
Prepared in Accordance with Provisions of Contraa@ W2h-09%ac-241, between
Watson Laboratories. Red Bank, New Jersey and
New York University
Prepared by: Charles B. Moore, James R. Smith, and Seymour Gcldstcin
Approved by: larks S. Schneider, Project Director and
Prof. AtheIstan F. Spilhaus Director of Research
Research Division. College of Engineering, New York University.
April 1. 1946
New York 63. New York
-
m
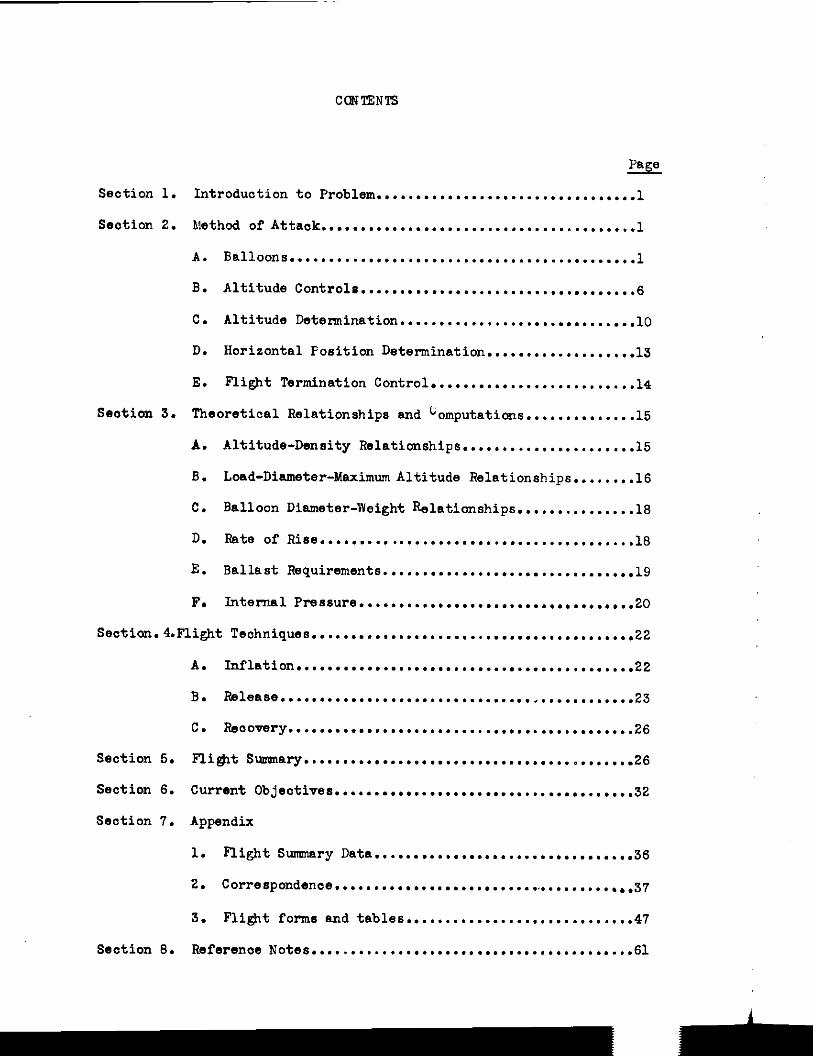
Section 1. Introduction to Problem . . . . . . . . . . . . . . . . . . . . . . . . . . . . . . . ..l
section 2. Method of Attack . . . . . . . . . . . . . . . . . . . . . . . . . . . . . . . . . . . . . . ..l
A. Balloons . . . . . . . . . . . . . . . . . . . . . . . . . . . . . . . . . . . . . . . . . . ..l
B. Altitude Controls . . . . . . . . . . . . . . . . . . . . . . . . . . . . . . . . . ...6
C. Altitude Determination . . . . . . . . . . . . . . . . . . . . . . . . . . . . . ..lO
D. Horizontal Position Determination...................13
E. Flight Termination Control . . . . . . . . . . . . . . . . . . . . . . . ...14
Se&ion 3. Theoretical Relationships and Computatims..............15
A. Altitude-Density Relationships......................15
B. Load-Diameter-Maximum Altitude Relationships........16
C. Balloon Diameter-Weight Relationships...............18
D. Rate of Rise . . . . . . . . . . . . . . . . . . . . . . . . . . . . . . . . . . . . . . ..xl
E. Ballast Requirements . . . . . . . . . . . . . . . . . . . . . . . . . . . . . ...19
F. Internal Pressure . . . . . . . . . . . . . . . . . . . . . . . . . . . . . . . . ...20
Section.CFlight Techniques . . . . . . . . . . . . . . . . . . . . . . . . . . . . . . . . . . . . . . ...22
A. Inflation . . . . . . . . . . . . . . . . . . . . . . . . . . . . . . . . . . . . . . . . ...22
B. Release . . . . . . . . . . . . . . . . . . . . . . . . . . . . . . . . . . . . . . . . . . ...23
C. Reeowry . . . . . . . . . . . . . . . . . . . . . . . . . . . . . . . . . . . . . . . . . . ...26
Seation 5. Fli&tSmmnary . . . . . . . . . . . . . . . . . . . . . . . . . . . . . . . . . . . . . . . . ...26
Section 6. Current Objectives . . . . . . . . . . . . . . . . . . . . . . . . . . . . . . . . . . . ...32
Section 7. Appendix
1. Flight Sunmary Data . . . . . . . . . . . . . . . . . . . . . . . . . . . . . . ...36
2. Correspondence . . . . . . . . . . . . . . . . . . . . . . . . . . . . . . . . . . . . ...37
3. Flight forms and tables . . . . . . . . . . . . . . . . . . . . . . . . . . ...47
section 6. Referenas Notes . . . . . . . . . . . . . . . . . . . . . . . . . . . . . . . . . . . . . . ...61
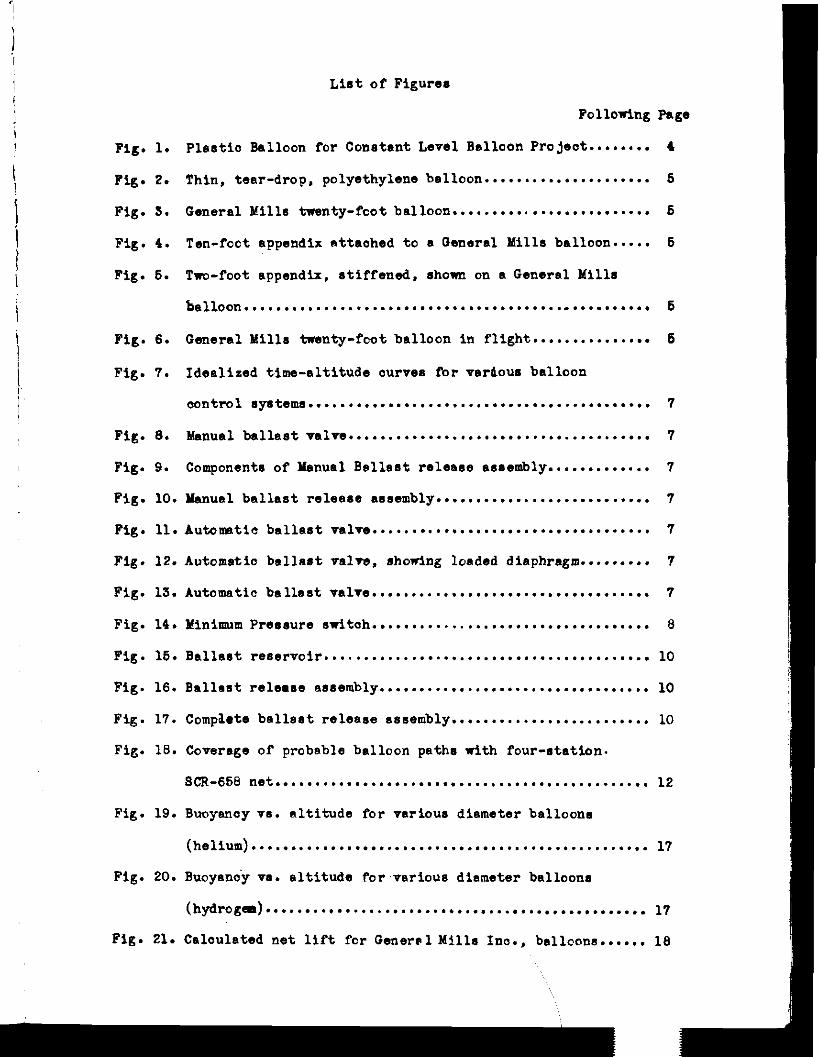
Lint of Figures
Fig. 1.
Fig. 2.
Fig. S.
Fig. 4.
Fig. 6.
Fig. 6.
Fig. 7.
Fig. 6.
Fig. 9.
Fig. 10.
Fig. 11.
Fig. 12.
Fig. 13.
Fig. 14.
Fig. 16.
Fig. 16.
Fig. 17.
Fig. 18.
Fig. 19.
Fig. 20.
Fig. 21.
Following Page
plastic Balloon for Constant Lavel Bslloon Project ........ 4
Thin, tear-drop, polyethylene balloon ..................... 6
General Mills twenty-fcot balloon.........~ ............... 6
Ten-fact appendix rttaohed to a General Mills balloon ..... 5
Two-foot appendix. stiffened. shown on . General Mills
balloon ................................................... 6
General Mills twenty-foot balloon in flight ............... 6
Idealized time-sltitude curwa for vardour balloon
oontro1 systems ........................................... 7
Manual ballast valve ...................................... 7
Components of Manual Bellbst release assembly ............. 7
Hanusl ballast release assembly ........................... 7
Automtio ballast valve ................................... 7
Automatic ballnst valve, showing loaded diaphragm ......... 7
Automatic ballast valve ................................... 7
Minkurn Pressure sritah ................................... 6
Ballast reservoir ......................................... 10
Ballast release nssambly .................................. 10
Compaeta ballaat release assembly ......................... lo
Coversge of probable balloon paths with four-station.
SCR-666 net ............................................... 12
Buoyancy xv. altitude for various dialoster balloona
(helium) .................................................. 17
Buoyan&y ~8. altitude for,vsrious diameter balloons
(hydmd ................................................ 17
Calouleted net lift for Goner@1 Mills Ina., ballcons ...... 16
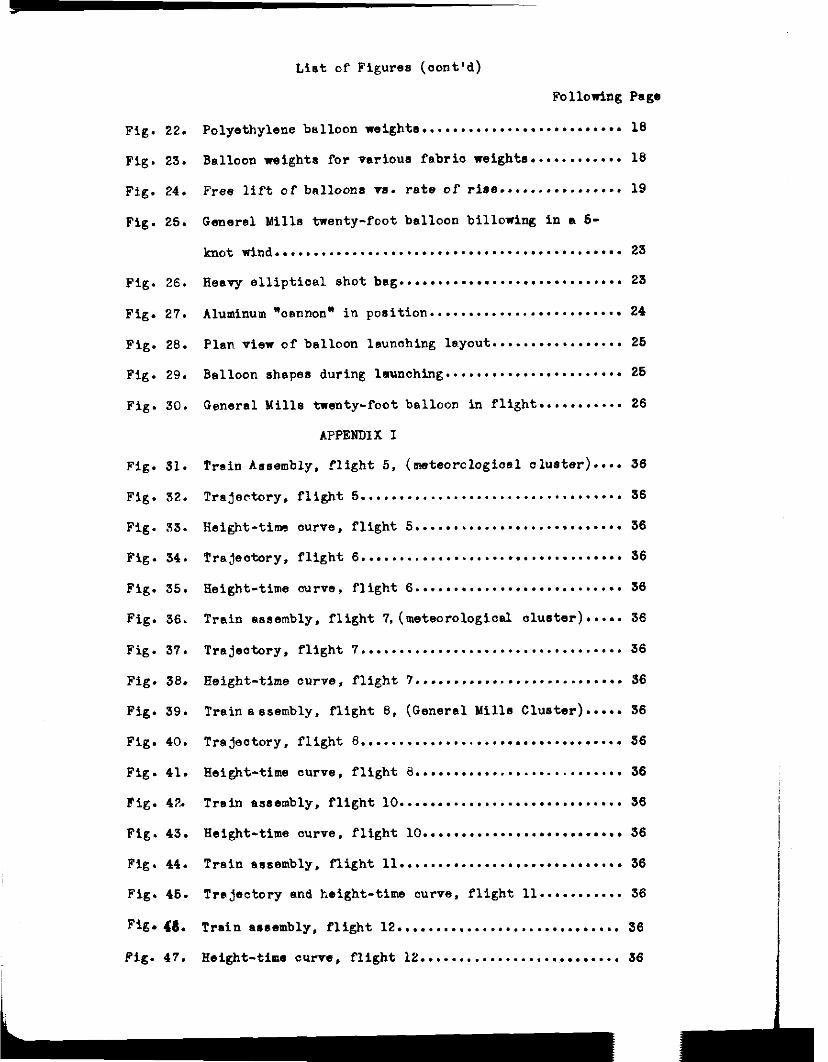
Fig. 22.
Fig. 25.
Fig. 24.
Fig. 25.
Fig. 26.
Fig. 27.
Fig. 20.
Fig. 29.
Fig. 30.
Fig. 51.
Fig. 52.
Fig. 33.
Fig. 34.
Fig. 35.
Fig. 36.
Fig. 37.
Fig. 38.
Fig. 39.
Fig. 40.
Fig. 41.
Fig. 42.
Fig. 43.
Fig. 44.
Fig. 45.
Fig. 46.
Fig. 47.
List of Figure8 (oont'd)
Following Page
Polyethylene balloon weights .......................... 18
Balloon weights for various fabrio weighta ............ 18
Free lift of bnlloons ve. rate of rise.. .............. 19
Goners1 Mills twenty-foot balloon billowing in . 6-
hot wind ............................................. 29
Hesvy elliptical shot bag ............................. 25
Aluminum "or~nnon" in position ......................... 24
Plan view of balloon launohing layout ................. 26
Balloon shapes during launching ....................... 26
General Mills twenty-foot balloon in flight ........... 26
APPENDIX I
Train Assembly, flight 6. (metecrclogicsl cluster) .... 36
Trajectory, flight 6 .................................. $6
Height-tinm ourve, flight 6 ........................... 56
Trajectory, flight 6 .................................. $6
Height-time ourv'e, flight 6 ........................... $6
Train assembly, flight 7,(meteorologicnl clueter) ..... 36
Trajectory. flight 7 .................................. 36
Beight-time curve, flight 7 ........................... 36
Train assembly. flight 8, (General Mills Cluster) ..... 96
Trajeotory. flight 8 .................................. 56
Height-time curve, flight 8 ........................... 36
Train assembly, flight 10 ............................. 36
Height-time curve, flight 10 .......................... $6
Train assembly, flight 11 ............................. 36
Trajectory and height-tine curve. flight ll........... 36
Train awambly, flight 12 ............................. 56
Height-time curve, flight 12 .......................... 56
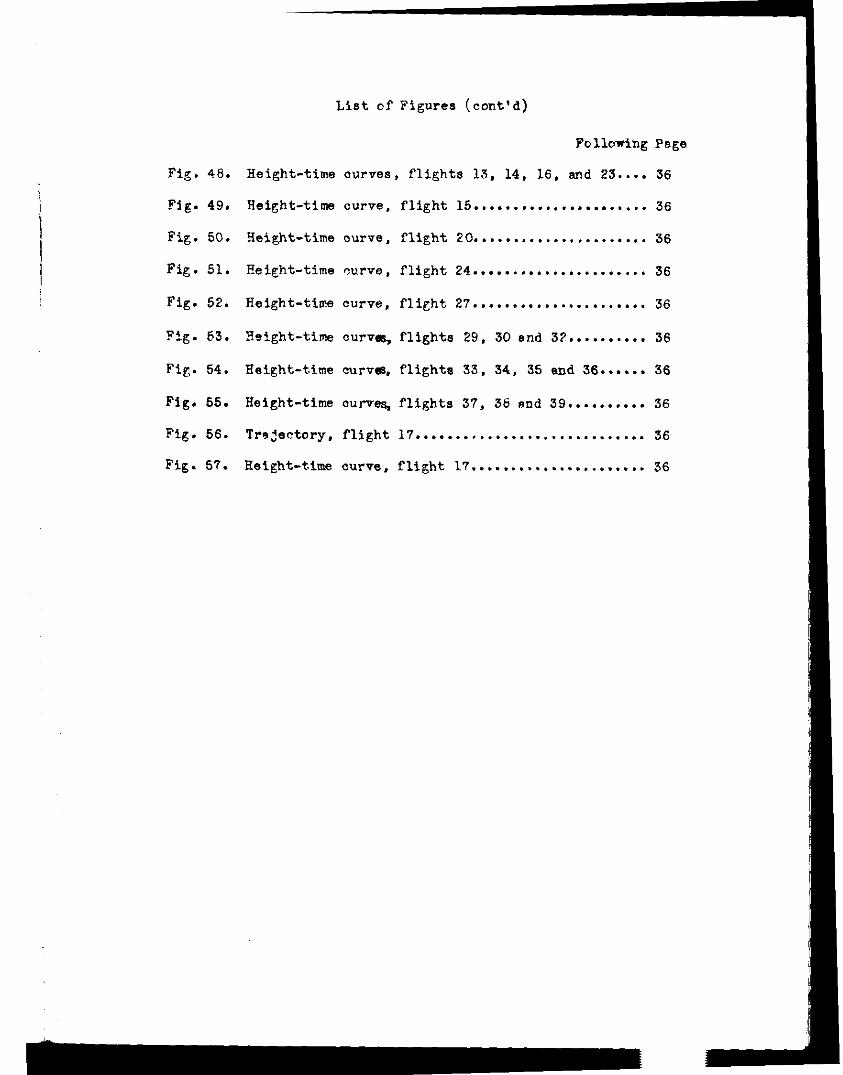
List of Figures (oant'd)
Fig. 46.
Fig. 49.
Fig. 50.
Fig. 51.
Fig. 52.
Fig. 53.
Fig. 54.
Fig. 55.
Fig. 56.
Fig. 57.
Pollolting Psge
Height-time curves, flights 13, 14. 16, and 23 .... 36
Height-time curve, flight 15 ...................... 36
Yeight-time ourve, flight 20 ...................... 36
Height-time curve. flight 24 ...................... 36
Height-time curve, flieht 27 ...................... 36
Height-time curves, flighta 29, 30 end 32 .......... 36
Height-time CUI‘V~, flights 33, 34, 35 and 36 ...... 36
Height-time curves, flights 37, 3b and 39 .......... 36
Tr*$xtcry, flight 17 ............................. 36
Height-time curve, flight 17 ...................... 36
List of Tables
1. Properties of Fabric8 used for bnllcon manufacture........... 3
II. Types and number of bslloons ordered......................... 4
III. Average wind values abov? selected stations in the
Southwest . . . . . . . . . . . . . . . . . . . . . . . . . . . . . . . . . . . . . . . . . . . . . . . . . . . ..lZ
IV. Buoynficy per Pound Mol of Gas . . . . . . . . . . . . . . . . . . . . . . . . . . . . . . ..lS
V. Glossary of Terms . . . . . . . . . . . . . . . . . . . . . . . . . . . . . . . . . . . . . . . . . ...21
VII. Summsry of Flight Data . . . . . . . . . . . . . . . . . . . . . . . . . . . . . . . . . . . . . . . Appendix I Follonlng Page 36
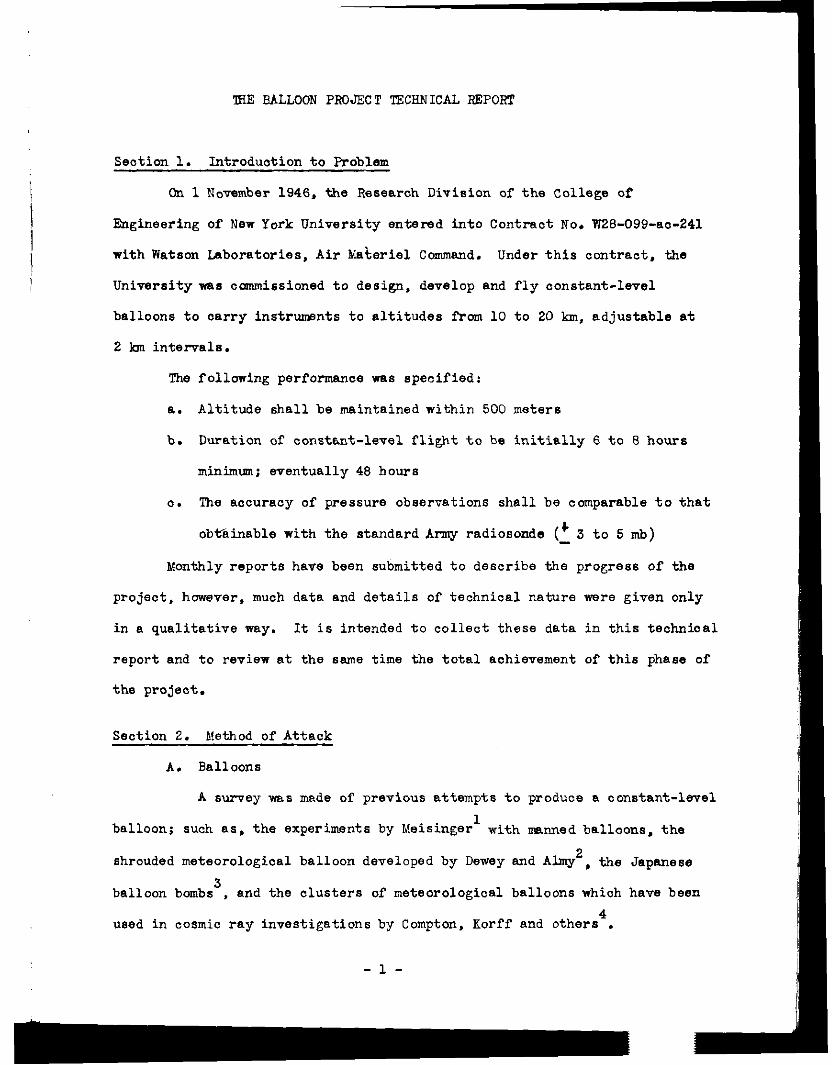
I
lFIE BALLOON PROJECT TECRNICAL REPORT
Section 1. Introduction to Problem
On 1 November 1946. the Research Division of the College of
Engineering of New York University entered into Contract No. W26-099-ac-241
with Watson Laboratories, Air F?aterial Command. Under this contract. the
University was canmissioned to design, develop and fly constant-level
balloons to carry instrwnts to altitudes from 10 to 20 la, adjustable et
2 km intervals.
The following perfo-ce ~8 specified:
a. Altitude shall be maintained within 500 meters
b. Duration of constant-level flight to be initially 6 to 6 hours
minimm; eventually 46 hours
C. The accuracy of pressure observations shall be comparable to that
obtiinable with the standard Army radiosonde ('3 to 5 mb)
Monthly reports have been submitted to describe the progress of the
project, however. much data and details of technical nature were given only
in a qualitative way. It is intended to collect these data in this technical
report and to review at the 8ame time the total achievement of thie phase of
the project.
Section 2. Method of Attack
A. Balloons
A survey was made of previous attempts to produce a constant-level
balloon; such 88, the experiments by Meisinger' with mnned balloons, the
shrouded meteorological balloon developed by Dewey and Almy2, the Japanese
balloon bombs3. and the clusters of meteorological balloons which have been
used in cosmic ray investigations by Compton. Korff and others4.
-l-
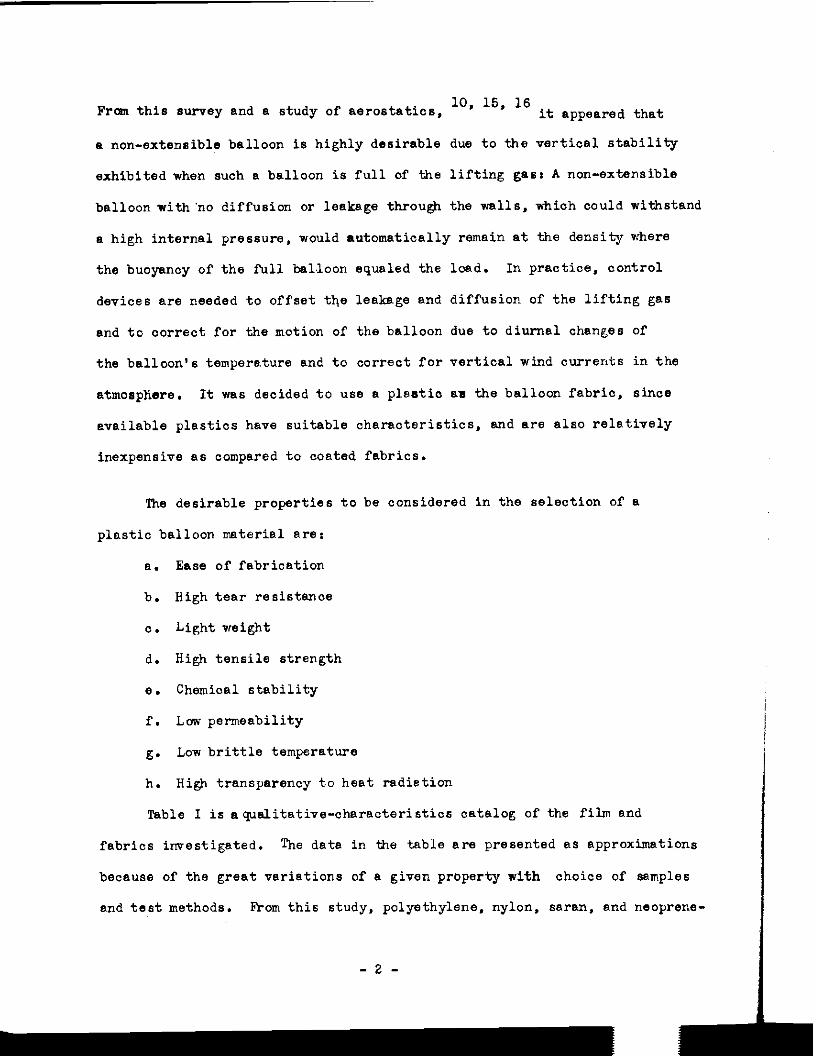
Fran this survey and a study of aerostatics, 10. 16. 16 it appeared that
8 non-extensible balloon is highly desirable due to the vertical stability
exhibited when such e balloon is full of the lifting gasr A non-extensible
balloon rith'no diffusion or leakage through the walls, which could withstand
a high internal pressure, would automatically remain at the density where
the buoyancy of the full balloon equaled the load. In practice, control
devices are needed to offset the leakage and diffusion of the lifting gas
and to correct for the motion of the balloon due to diurnal changes of
the balloon's temperature and to correct for vertical wind currents in the
atmospliere. It was decided to use a plsstio aa the balloon fabric, since
mailable plastics have suitable characteristics, end are also relatively
inexpensive as compared to coated fabrics.
The desirable properties to be considered in the selection of a
plastic balloon material are:
a. Ease of fabrication
b. High tear resistance
c. Light weight
d. High tensile strength
8. Chemical stability
f. Low permeability
g. Low brittle temperature
h. High transparency to heat radietion
Table I is aqualitative-characteristics catalog of the film and
fabrics investigated. The data in the table ere presented as approximations
because of the great variations of B given prbperty with choice of samples
and test methods. from this study. polyethylene, nylon. ssrm, and neoprene-
-2-
r A
coated nylon seem to be most generally satisfaotory. Eighteen plastics
and balloon fabrication ccrmpanies were contacted in an attempt to secure
fabricators.
Fabric
Polyethylene
Saran
Srla
Vinylite
Tsflon
Ethocellulose
Pliofilm
Nylon or silk fabrio coated with:
1. Neoprene 2. Sutyl
rubber
Table I
Ease of Low Temp. Permea- Tensile Tear Fabrica- Stability to Properties bility Strength Resistance tion Ultraviolet
Good
Fair
Good
Very poor
Believed good
Good
Poor
Fair
Good
Medium Low
LOW High
LOW High
Medium Medium
LaR High
Very LOW high
High Poor
Lo&V High
LOW High S. Folyethylene lhhown - 4. Saran unknorm --
GOOd
Poor
LoTi
Good
Good
Fair
Fair
Fair
Fair
Good Good
Fair Fair
Good Good
Good Good
cannot be Good fabricated
GOOd Good
Good Poor
Egir
Fair
Fair
Good
-3-
Table11 shows the balloons which have been purchased irom those
manufacturers who expressed an interest in the problem.
Table II
Film type. thiokness, Company diameter, shape
8. A. Smith .004 Polyethylene coatings, Inc. 3 feet diameter
spherical
H. A. Smith .OOS Polyethylene coatings, Inc. 15 feet diameter
spherical
H.A. Smith .004 1olyethylsne Coatings. Inc. 15 feet diameter
spherical
General Mills,Inc. .OOl Polyethylene 7 feet diameter Teardrop.
General Mills,Inc. .OOl Polyethylene 20 feet diameter Teardrop.
Dsrelr&Almy A spherical nylon Chemical 00. cloth shroud around
a neoprene balloon.
Special Unit Delivered Features cost to date
Proto- $150.00 type
LOW $630.00 Permeability
LOW $530.00 Permeability
Stressed $20.00 tap type seam
Stressed $125.00 tape type seam
$339.00
4
5
5
25
47
2
Table II is based upon final or modified orders in those cases where
the rapid progress of flight technique rendered certain fe&lrss obsolete
before the balloons on order were delivered.
Figure 1 shows the spherical balloon as originally designed. This
type of balloon was made of .004 and .OOS inch, heat-sealed. polyethylene.
It had several good characteristics, such as very low leakage, but the method
of load attachnmnt furnished by H.A. Smith, Inc., was not satisfactory. Of
the six balloons of this type which were used. two ripped free from the shroud
lines during launching.
-4-
PLASTIC BALLOON FOR EC’NSTANT LEVEL BALLOON PRDiCCT AT NY”
A..,L ‘T 1947 Srrr. : J’i 3’0”
FIG. I
Figures 2 and 3 show the tear-drop cell of the stressed taps
design developed by General Mills, Inc. '&he film is ,001 inch polyethylene,
butt-welded, with scotch tape laid along the seam to reinforce the seal and
to carry and distribute the load. These strips, which converge to the load
ring at the bottom, actually support the load.
The overloading of a General Xills ZO-foot balloon on Flight 12 at
Lakehurst kept the lower end of tb balloon open during ascent. Ihe
ceiling was greatly reduced by the resulting dilution of the helium with
air. On later flights an unsuccessful attempt to minimize this mixing
was made, using a lo-foot external appendix passing through the shroud
lines. This appendix fouled in the rigging and twisted completely shut,
causing the balloon to burst at pressure-altitude. A modificationwith
a lo-foot appendix outside the shroud lines also failed in actual flight.
Figwe 4 shows this appendix construction on a General M 11s balloon which
is being inflated. The final style is shown in Figures 5 and 6. It con-
sists of a Z-foot external appendix stiffened with cardboard battens.
This is taped on the outside of the load ring. It serves 86 B one-w.y
valve which excludes air during ascent but allows the extra helium to
valve freely when the balloon is full. Eo external appendix canbe used
whenever the rats of rise exceeds 600 feet per minute. For optimum balloon
psrformancs. it has been determined that: 1) the equipment load for the
Ger.eral Mills ZO-foot balloon should be held under 30 pounds; 2) rates of
rise should be less than 900 feet per minute; and 3) for maximum altitudes
an external appendix is needed; hence tie limiting rate of rise is about
600 feet per minute in this case.
Several experimental flights have been made using shrouded Dewey
and Almy neoprene balloons, as well as small and large experimental cells in
-5-
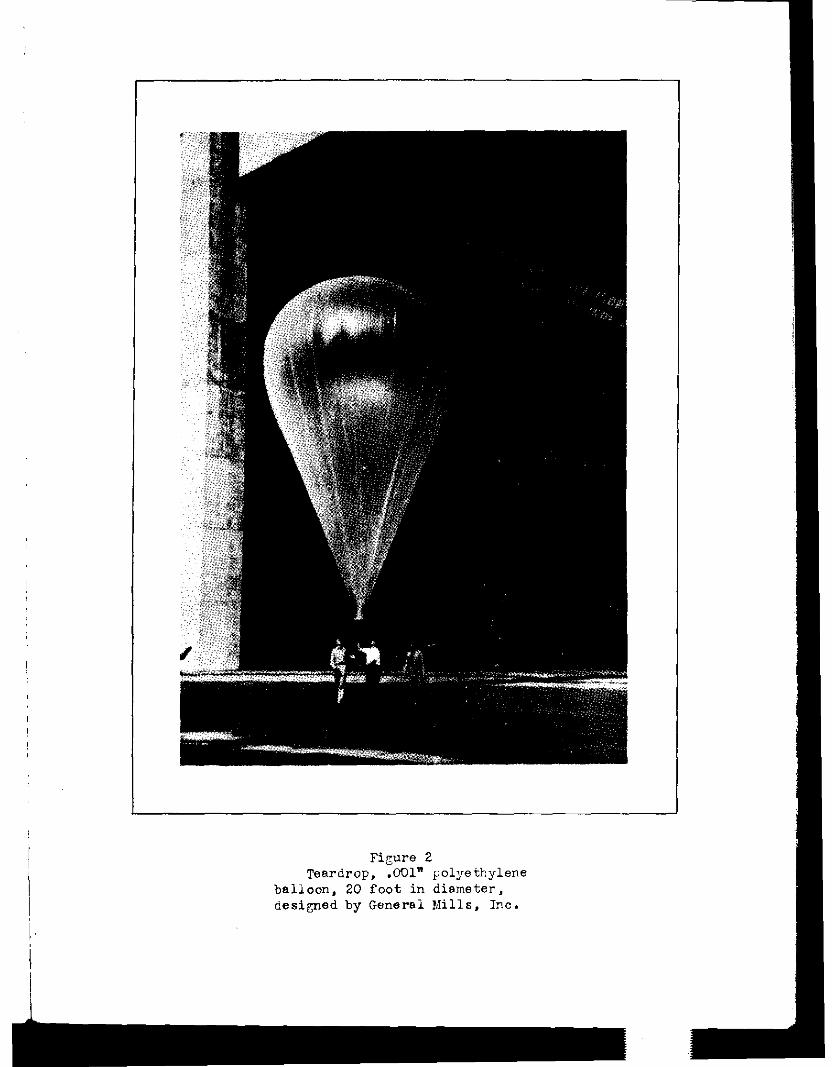
FiGUi-6 2 Teardrop. .001" polyethylene
balloon, 20 foot in diameter, designed by General Mills. Inc.
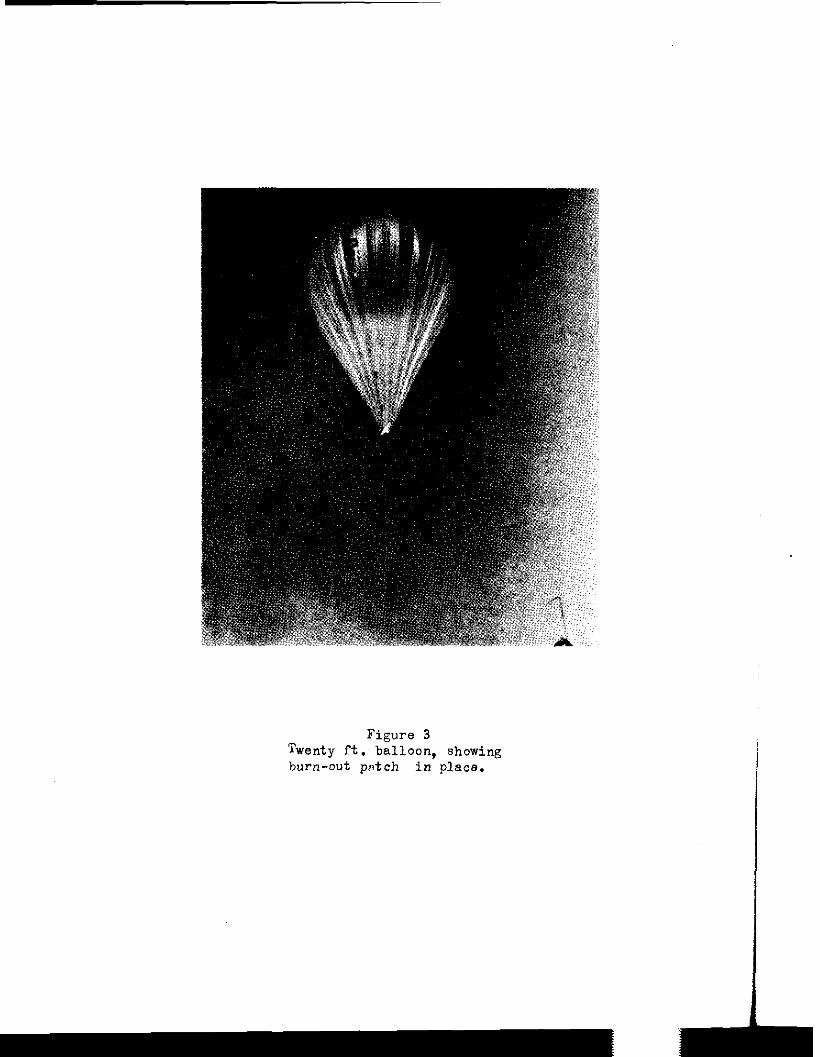
Figure 3 Twenty ft. balloon, showing burn-out patch in place.
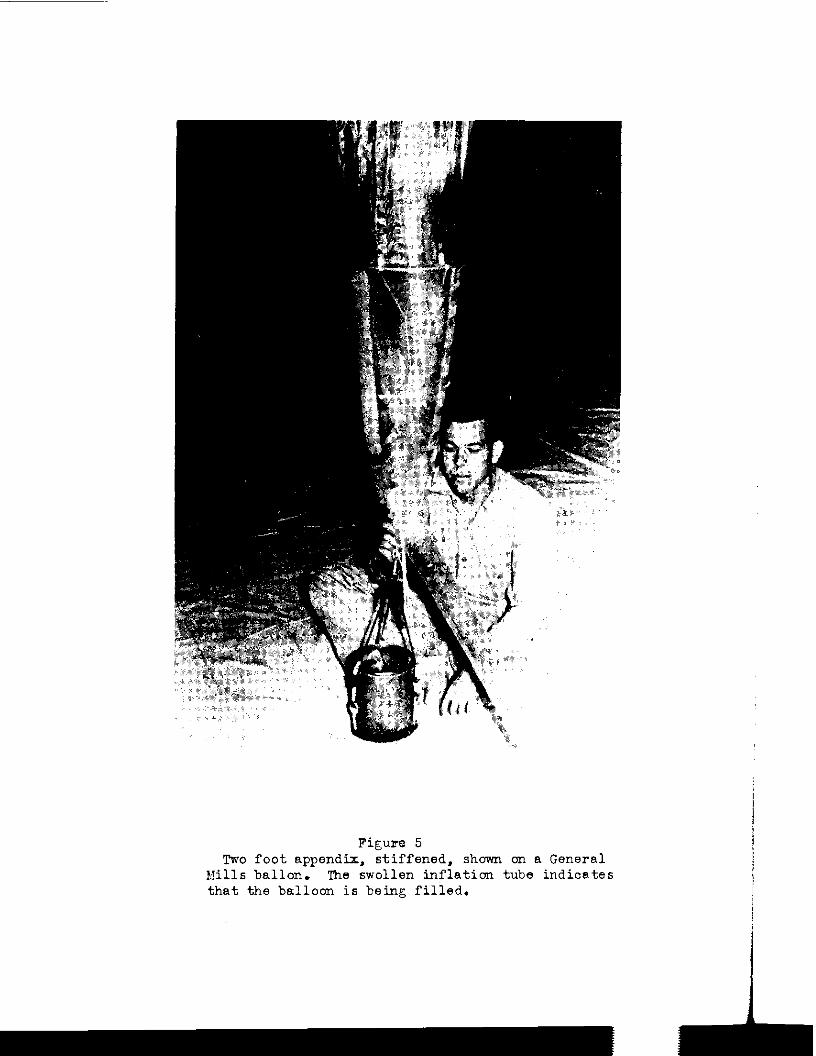
Figme 5 Two foot appendix, stiffened, shown on a General
Kills ballon. The swollen inflation tube indicates that the balloon is being filled.
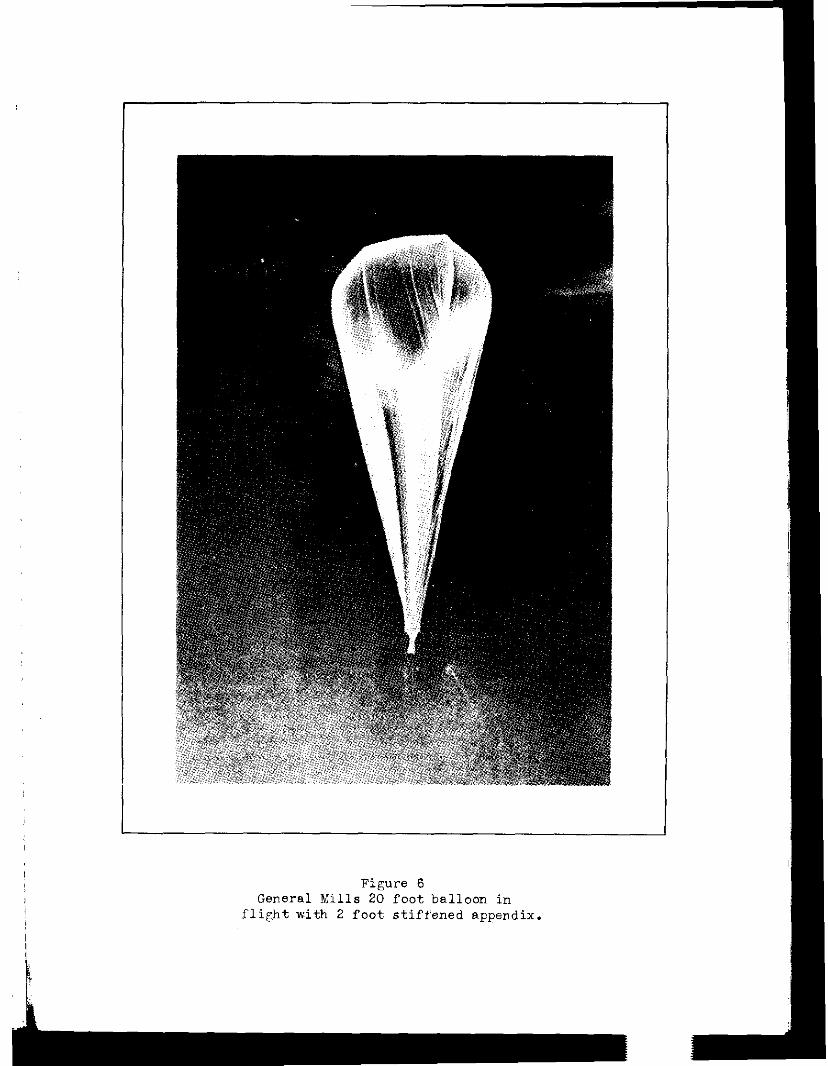
L
Figure 6 General Kills 20 foot balloon in
flight with 2 foot stiffened appendix.
various cluster arrangements. None of these have been too satisfactory
but further investigationwill be made in the field of shrouded or ooated
films.
B. Altitude Controls
Given a balloon capable of carrying the instruments to a desired
altitude (the theory and computations involved are discussed in Section 3).
there remains the problem of maintaining the sell at a constant level. The
buoyancy of a gas-filled cell will decrease as the gas leaks or diffuses
through the balloon wall. To hold an absolutely ocmstant altitude, the
volume of lifting gas entrapped must be maintained in an atmosphere of
unvarying horizontal density, with no change in the total weight supported
by the balloon and with no fluctuations of the temperature of the gas with
respect to the air. lhe best approximation to these conditicns may possibly
be achieved through the use of liquified hydrogen, which would be permitted
to evaporate at a rate in exoess of gas leakage. %e weight of equipment
required to control this evaporation rate appears to be prohibitive. Liquid
hydrogen, also, is not safe to handle.
Two practical methods of keeping B balloon at nminally constant
altitude have been devised, both using the liquid ballast dropping technique.
(Solid ballast, such as sand, does not flovi well and is liable to absorb
moisture tiichwill freeze at the temperatures experienced at high altitudes.
Although B few preliminary flights ware made with desiccated sand, a highly
refined water-free kerosene-type petroleum prcduct,ccmpass fluid,was found
to be mere satisfactory),
In the simpler control system, ballast is dropped at a pre-determined
rate, aimed to sli&tly exceed tie loss of lift of the balloon due to leakage
and diffusion. If this method is successfully used, the balloon stays full
because the remaining gas in the balloon has less load to support; therefore,
-6-
I the balloon can rise slowly until the balloa is again full and the
equilibrilrm is again reached between the buoyancy and the load. In tl73
General Mills ZO-foot balloon, for example. diffusion losses equal about
300 grams per hours the balloon at its ceiling of 50,000 feet, with a
30-pound payload, risea about 900 feet with each kilogram of ballast
dropped. This means that a balloon, using the simple ballast-dropping
technique, will float at B ceilingwhich rises at the rate of about 360
feet per hour. 141 idbalized flight of this type is shown in the Solid
ourve of Fig. 7., neglecting the oscillation shoRn at sunset.
The "manual ballast valve" which IWS developed for this simple
control system is shown in Fig. 8. This valve can be adjusted prior to
balloon release to allow any predetermined flew of compass fluid up to
2000 g-am per hour. The filter housing and ballast reservoir used
with this valve are sbonm in Figures 9 and 10. This method is good where
1) a slcwly rising ceiling can be tolerated, and 2) the flight does not
have to go thrcugh a sunset while at its ceiling.
For economy of ballast, hence longer flight duration, it is desirable
tc keep the constant flew as close as possible to the total loss of buoyancy
resulting from diffusion and leakage. Thii means that whenever rapid loss
of buoyancy cocurs, due to ohanges in solar radiation, the manual ballast
valve alone will not sustain the balloon. When the balloon is suddenly
cooled, due tc sunset or clouds cutting off ingolation (loss of superheat),
the heavy loss will start the balloon downward and only a rapid expenditure
of ballast will check its fall and restore its stability.
The second type of ballast dropping control has bean devised to
operate on a demand basis, when such a descent cowrs. Ihis control is
called the automatic ballast valve. Figures 11, 12 and 13 show the ap-
pearance and design of this pressure-actuated needle valve.
-?-
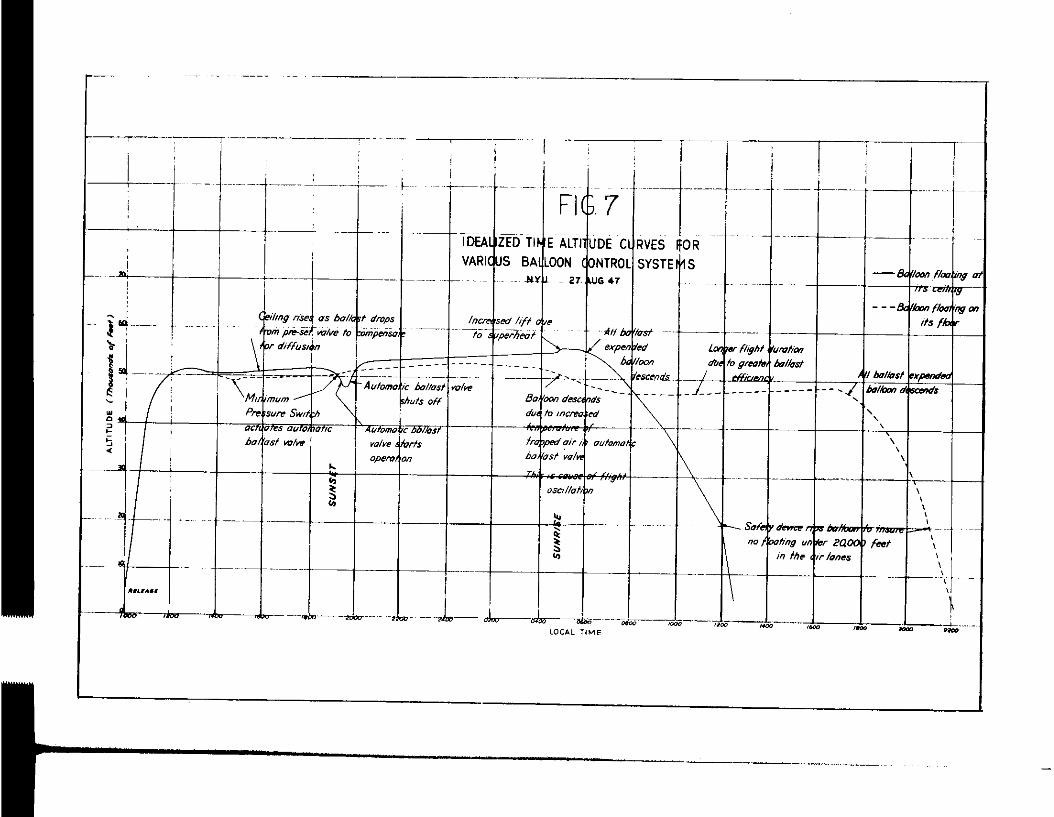
--.__
I 1
1 VARl&s BAdLOON &NTROL/SYSTE~~~S
-r-r
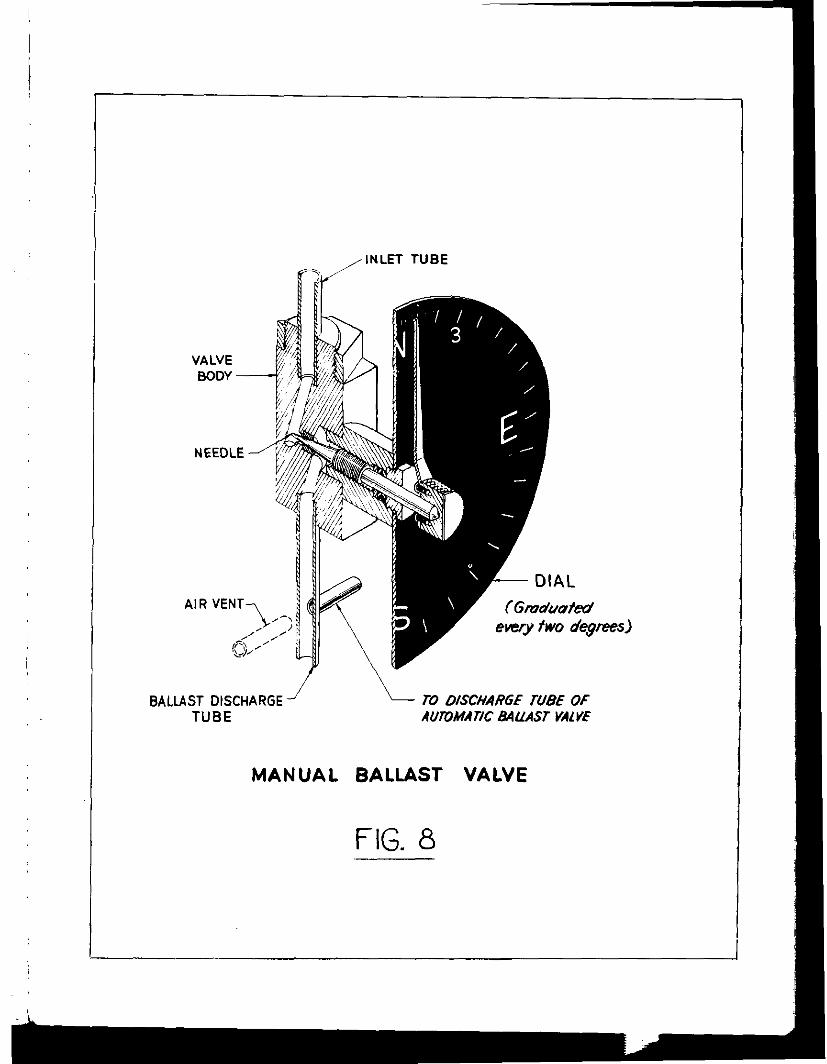
VALVE BODY
Al R VENT
,J-,:
(Cl), , /’
INLET TUBE
BALLAST DISCHARGE TO OISCHARGE TUBE OF TUBE mvmmc ti.d~~sT VALVE
MANUAL BALLAST VALVE
FIG. 8
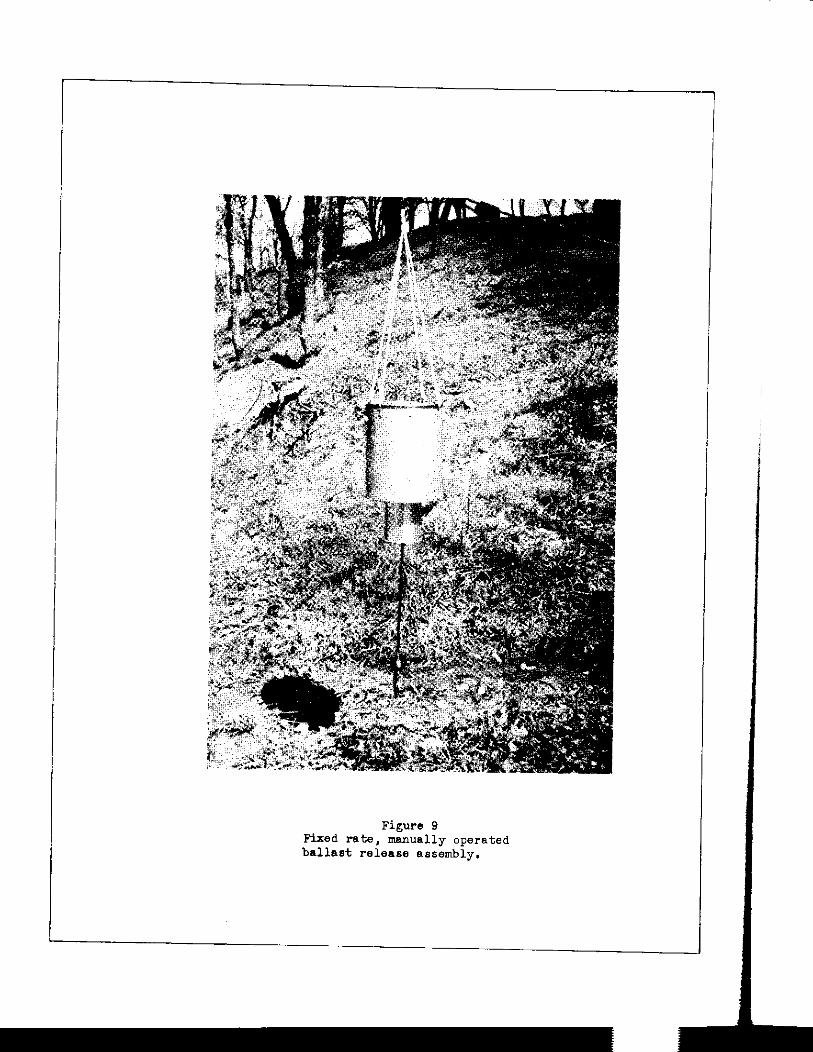
Figure 9 Fixed rate, manually operated
bdh8t release assembly.
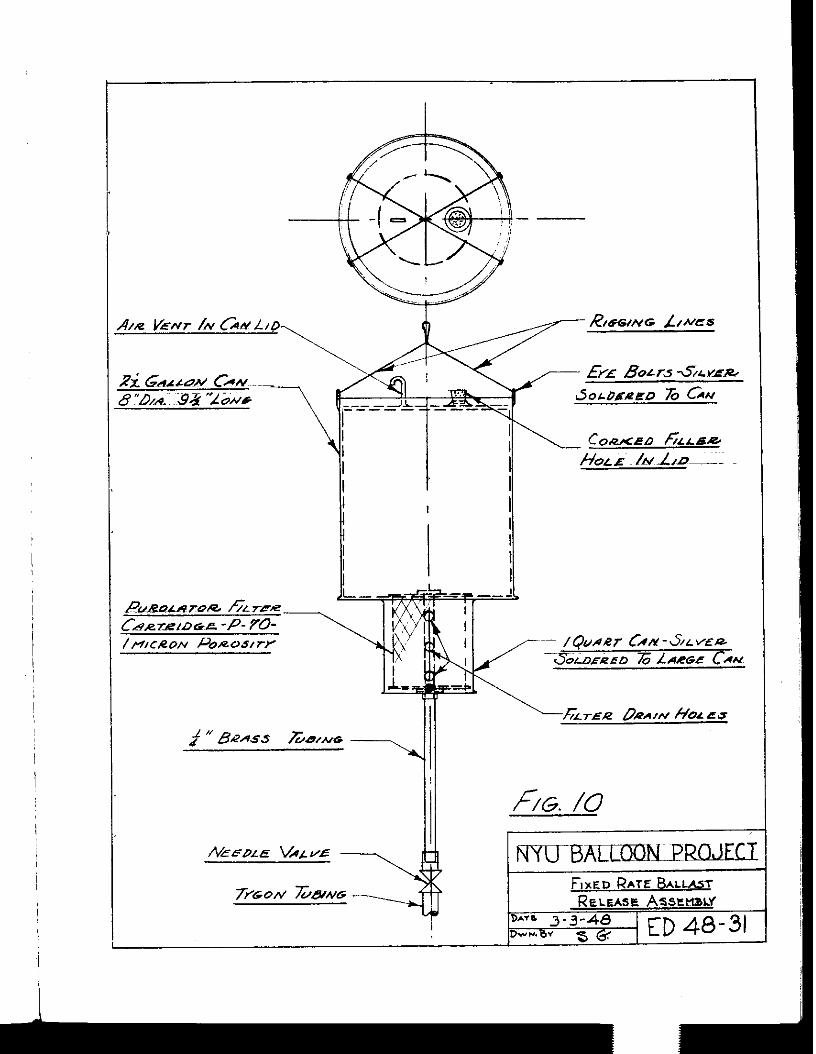
-
-
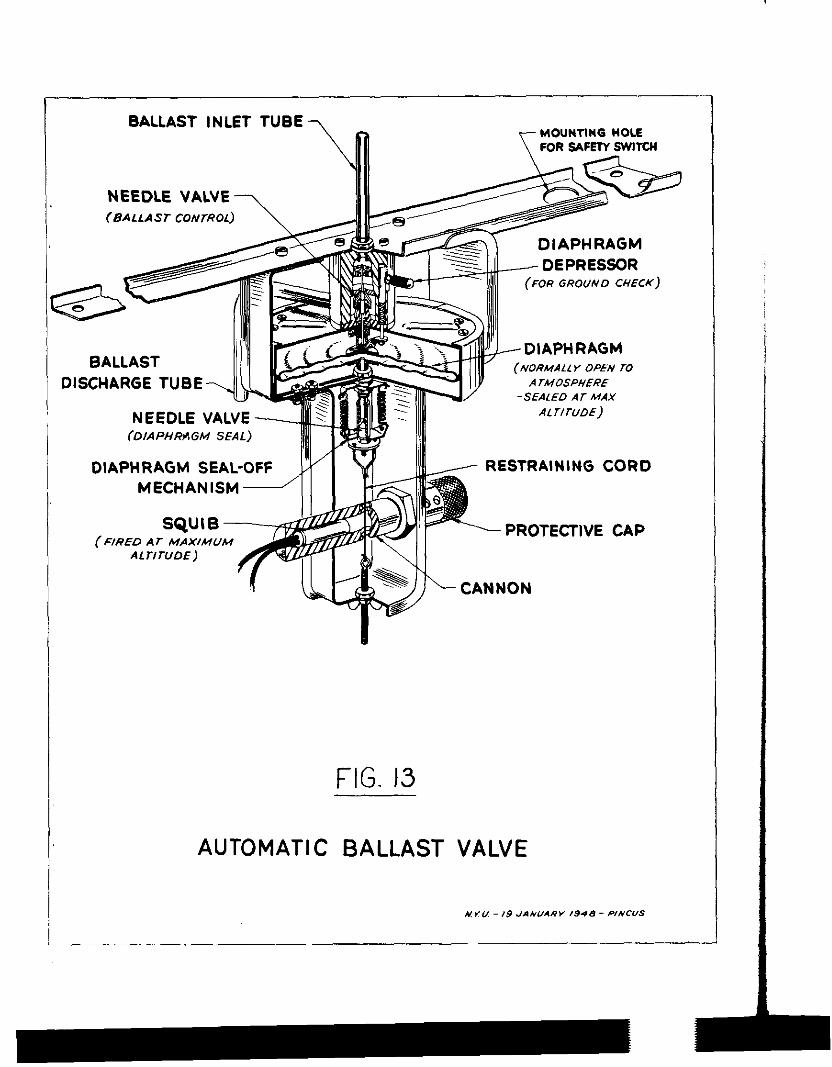
BALLAST I N LET
NEEDLE VALVE - (BALLAST cosmos)
TUBE
\
R GROUND CHECK)
BALLAST DISCHARGE TUBE ArUOSPHERE
-SEALED A,- MAY
Al WUOE)
(~IAPHR~GU s
DIAPHRAGM SEAL- RESTRAINING CORD MECHANISM
(FIRED AT MAX/M”&, PROTECTIVE CAP
FIG. 13
AUTOMATIC BALLAST VALVE
When the atmospheric pressure outside the diaphragm increases to
5 mb. above the internal pmssure, cmpass fluid will be discharged at
the rate of 160 grams per minute under a l-foot head. When theautomatic
ballast valve is completely open (at 6.6 nib. pressure differential), 300
grams per minute will flow.
The automatically operated needle valve is held closed by a loaded
diaphragm until tie balloon reaches altitude. lhis diaphrap is open to
the atmosphere until the balloon descends from the minimum atmospheric
~essurs attained. At that time, an electrical contact is aade, firir.g
a squib which seals the diaphragm mechanically from any further ~~~886 to
the external air. Zhereafter, the capsule contains a volume of air Hllich
has been trapped at the pressure and temperature existing& the time of
operation of the sealing ewitch. When the ambient pressure increases to
the point when, the e&rapped air is compressed below this original volume.
the diaphragm will withdraw the ballast control needle valve allowing
ballast discharge to ccour.
Figure 14 shcws the ninimum pressure switch Which makes the electrical
contact at the time of seal-off. It consists of atreppsd volme of air that
is allowed to escape through a mercury pool as long a8 the outside pressure
is decreasing. As soon 88 the exterior pressure increases, mercury is
drwn into the tuba making the seal off contact between two electrodes.
Ihe dimensions of the air chamber and capillary tubing 81-e chosen so
that during operation the change in the volume of the air would be less tian
cm one-thoussndth of the originel volume. %?e distance between the two
electrodes (one under mercury, the other within the capillary tubing) was
influenced by considerationa of safety and sensitivity. If the distance is
less than 6 mm., shaking during launching is likely to mcve the mercury
-6-
,/
sufficiently to omae,a short between the electrodes, firing the squib
prematurely. If the distance is too large. however, therewill be too
great a height difference between the time of minimum pressure and the
time ths electrodes are shorted. For instance, a spacing of 10 mm. would
delay the firing of the squib until the pressure reached 13.3 mb. above
the minimum pressure. At an altitude of 50,000 feet, the equivalent height
(standard atmosphere) would be about 2300 feet. It is obvious that for high
level flights, a less dense and lower freszing electrolyte for the minimum
pressure switch will be needed to obtain the desired sensitivity of 2000
feet.
By adding the pressure-activated automatic ballast valve to the
ma.nua.3 ballast valve, the complete pattern of the solid cur%e in Figure 7
maybe achieved ideally. At sunset tile rapid cooling omses de8cent which
cannot be cmpensated for by the manual ballast valve. As soon es the seal-
off pressure of the autanatio ballast valve is exceeded by the atmospheric
pressure, ballast flow is begun, xhioh restores tke balloon to its ceiling.
Ihe dashed curve in Figure 7 shows the action of a balloon when the
automatic ballast valve alone is used for control purposes. In tiis wise
the balloon will sink slowly from its ceiling (where full buoyancy just
equuals the load) to the level where the autowtic ballast valve drops
ballast at a rate equal to the diffusion (the floor). It will be noted
that a flight which is controlled in this mnner is less wasteful of
ballast end results in a correspondingly longer flight. Ihe "floor"
determined by this valve varies diurnally es the temperature (hence pressure)
of the air entrapped in the diaphragm is affected by solar radiation. Tb
amplitude of this diurnal oscillation may be as much as 6000 feet, the ni@t
level being higher than the day level.
-
To reduce the effect of varying fluid heads and a corresponding
variation in valve calibration, a ballast reservoir mounting vms devised
to limit the head values. This ballast reservoir, after several mcdifica-
tions, aonsists of a spun aluminum tank with filter, mounted on 16-inch
legs. It is shown in Figure 15. The legs serve as supports for the other
control units and a head of at least one foot is provided by tubing to the
automatic ballast valve. The capacity of the reservoir is approximately
five gallons. Figures 16 and 17 show the complete ballast release assembly.
One other system of altitude control may be mentioned. This is the
method used by Xorff and others4 to roughly approximate constant level
flights for cosmic ray investigations. A numberd meteorological balloons
are inflated until they will just support U-B flight load. A few other balloons
are added to the train to give B free lift appropriate for the desired rate
of rise (see Computations, Section 3). At some time after release these
"lifter" balloons burst due to over-inflaticn, or are released by a pressure
or time-activated mechanism. If the original balance wa.s correct. and the
effects of superheat and diffusion oanuel each other. the oluster of cells
may float. When one or more of the balloons breaks, or leaks excessively,
the train will descend. Although this method was used in early experimntal
flights it proved to be useful only as a stop-gap method of carrying gear
aloft for test purposes. No modification of this basic technique seems likely
to produce even e consistant flight pattern due to the uncertainty of properties
and behavior of these inherently unstable balloons.
C. Altitude Detemination
In order to evaluate the performance of the basic control
apparatus, an investigation of pressure-measuring equipment and telemetering
gear has been made: The problems of measuring upper-air conditions in general
- 10 -
--RESERVOIR
FILTER -~ ASSEMBLY
WIRE FILTER CLOTH
BALLAST RESERVOIR
FIG. 15
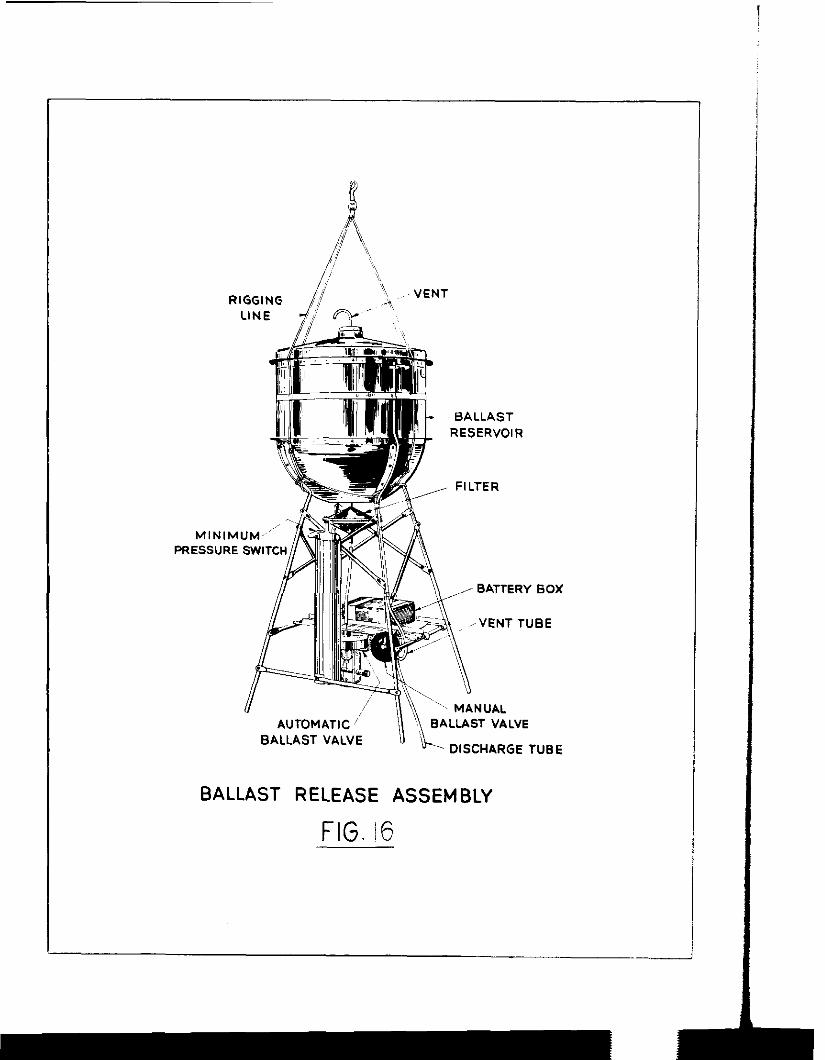
RIGGING LINE
d BALLAST RESERVOIR
*
, FILTER
BATTERY 60x
-VENT TUBE
-‘-,, MANUAL AUTOMATIC ” \\ ‘4 BALLAST VALVE
BALLAST VALVE u ‘v&, DISCHARGE TUBE
BALLAST RELEASE ASSEMBLY
FIG. I6
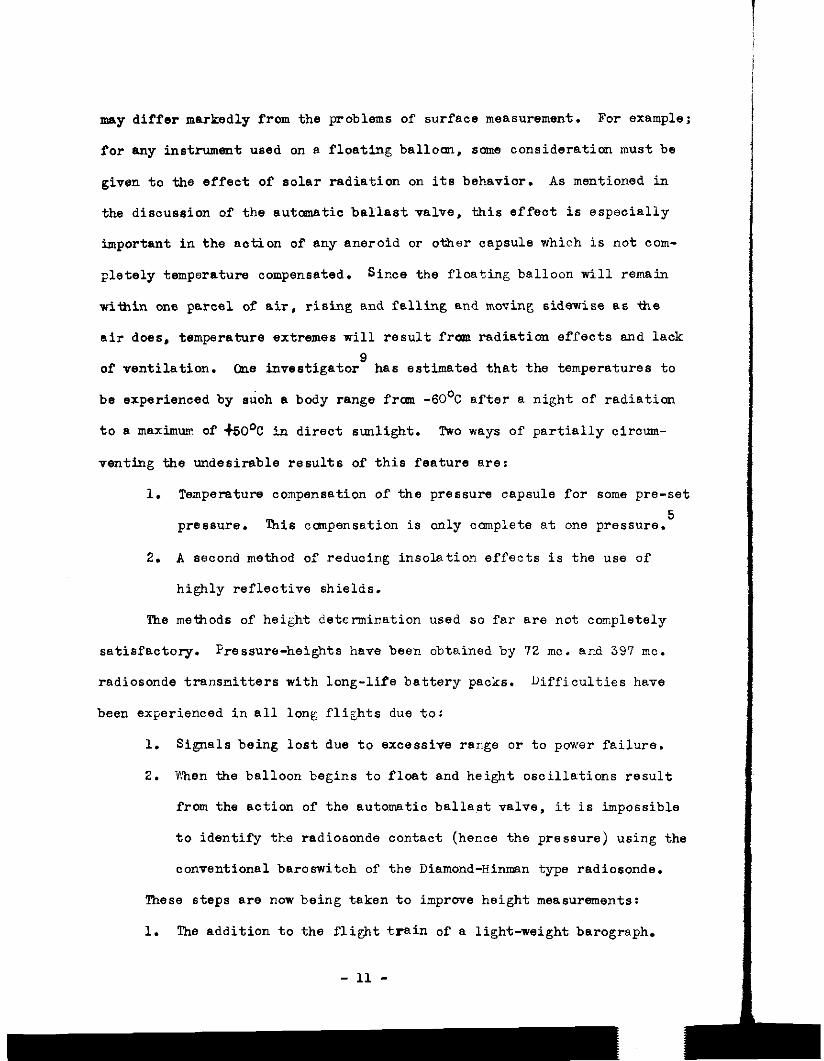
may differ markedly from the problems of surface measurement. For example;
for any instrument used on B floating bellow, some consideration must be
given to the effect of solar radiation on its behavior. As mentioned in
the discussion of the sutcenatic ballast valve, this effect is especially
important in the action of any aneroid or other capsule which is not com-
pletely temperature compensated. Since the floating balloon will remain
within one parcel of air, rising and falling and moving sidewise as the
air does, temperature extremes will result from radiation effects and lack
of ventilation. Cne investigator' has estimated that the temperatures to
be experienced by s;oh a body range from -6O'C after a night of radiation
to e meximm of &O°C in direct sunlight. Two ways of partially ciroum-
venting the undesirable results of this feature are:
1. Temperature ooznpensation of the pressure capsule for some preset
pressure. lhis canpensation is only oamplete at one press~re.~
2. A second method of reducing insolation effects is the use of
highly reflective shields.
The methods of height determination used so far are not cozxpletely
satisfactory. Pressure-heights have been obtained by 72 mc. ard 397 mc.
radiosonde transmitters with long-life battery packs. Difficulties have
been experienced in all long flights due to:
1. Signals being lost due to excessive rage or to power failure.
2. NPSI the balloon begins to float and height oscillations result
from the action of the automatic ballast valve, it is impossible
to identify the radiosonde contact (hexa the pressure) using the
conventional baroswitch of the Diamond-Hinman type radiosonde.
These steps are now being taken to improve height measurements:
1. The addition to the flight train of a light-weight barograph.
- 11 -
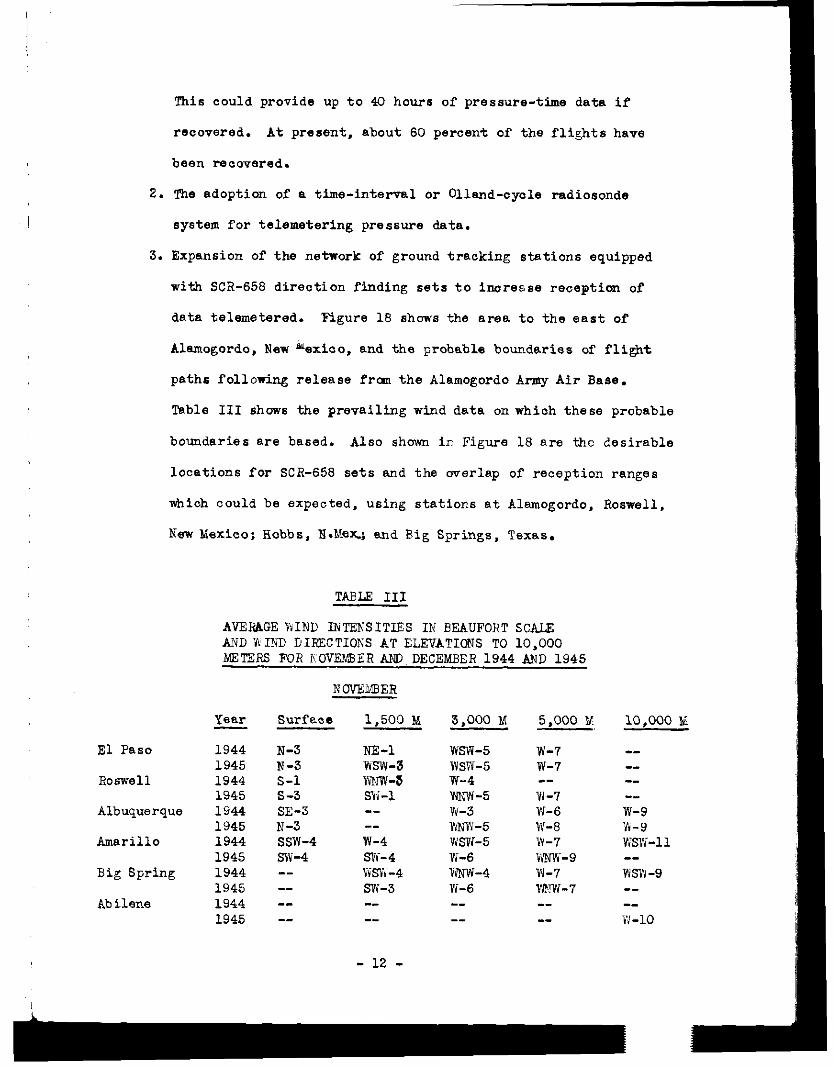
This could~ provide up to 40 hours of pressure-time data if
recovered. At present, about 60 percent of the flights have
been recovered.
2. The adoption of a time-interval or Olland-cycle radioscnde
system for telemetering pressure data.
3. Expansion of the network of ground tracking stations equipped
with SCR-656 direction finding sets to increase reoepticn of
data telemetered. Figure 16 shows the area to the east of
Alamogordc, New %mioo, and the probable boundaries of flight
paths following release fram the Alamogcrdc Army Air Base.
Table III shows the prevailing wind data on which these probable
boundaries are based. Also shcm ir Figure 18 are the desirable
locations for SCR-658 sets and the overlap of reception ranges
which could be expected, using stations at Alamogordo, Roswell,
New Uhexico; Hobbs, B.b!e~; and Big Springs, Texas.
TABLE III
AVERAGE WIND IXTENSITIES IN BEAUFORT SCALE MD WIVD DIRECTIOIU'S AT ELEVATIONS TO 10,000 METERS FOR KOVEXBERAND,DECEMBER 1944 AND 1945
El Paso
Rome11
Albuquerque
Amarillo
Big Spring
Abilene
year
1944 1945 1944 1945 1944 1945 1944 1945 1944 1945 1944 1945
SUl-fW.e 1,500 M
N-3 NE-1 N-3 YVSW-3 S-l VVNN-3 s-3 SW-1 SE-3 -- N-3 -- ssv-4 w-4 m-4 m-4 -- WVf-4 -- SPI-3 -- -- -- --
- 12 -
3,000 M
mw-5 wsvi-5 w-4 WNW-5 w-3 wii-5 Wsvf-5 W-6 VW-4 W-6 -- --
5,000 M
W-7 w-7 -- w-7 W-6 W-8 w-7 ww-9 w-7 WV{-7 -- --
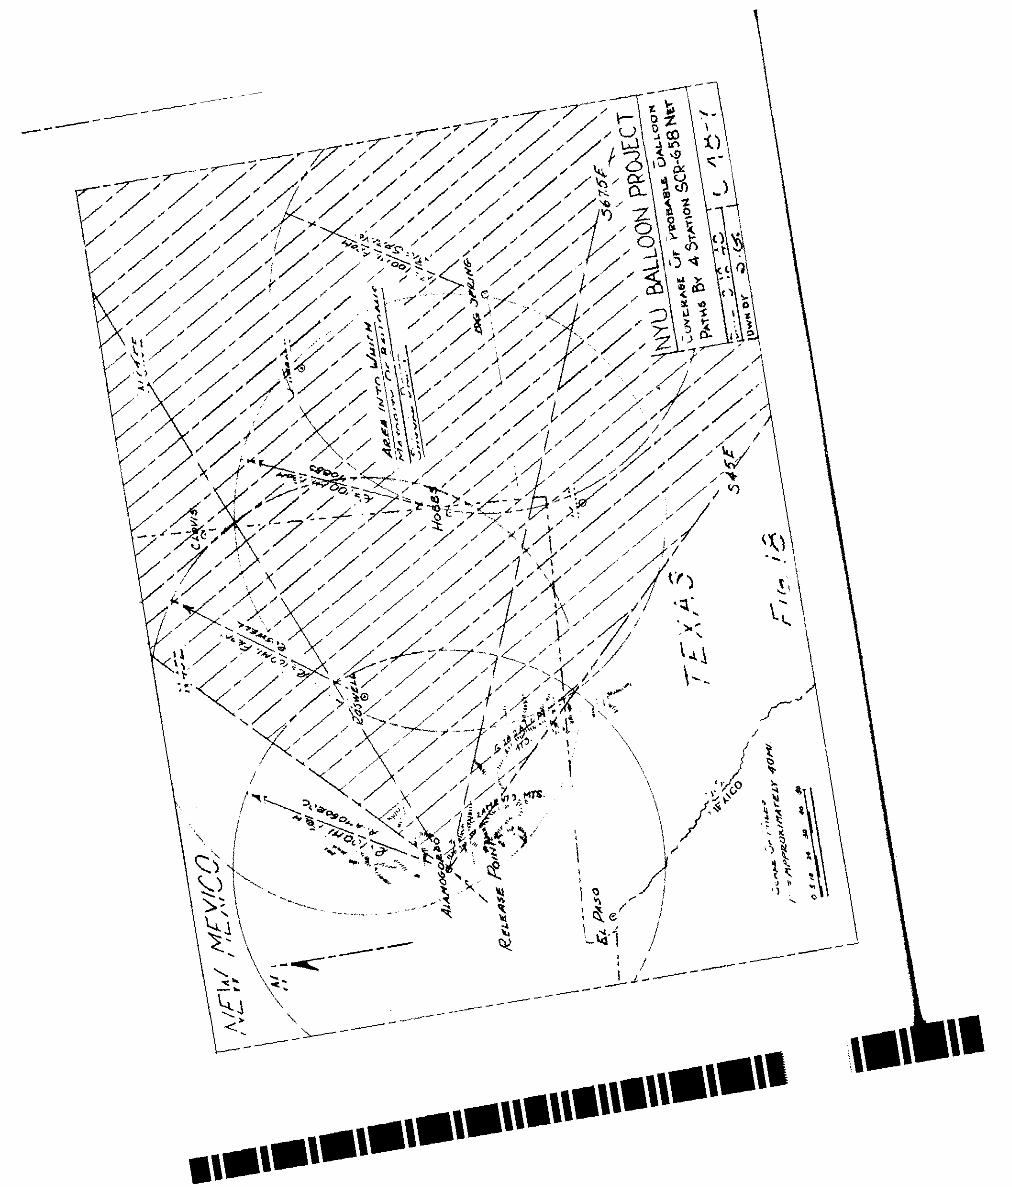
--
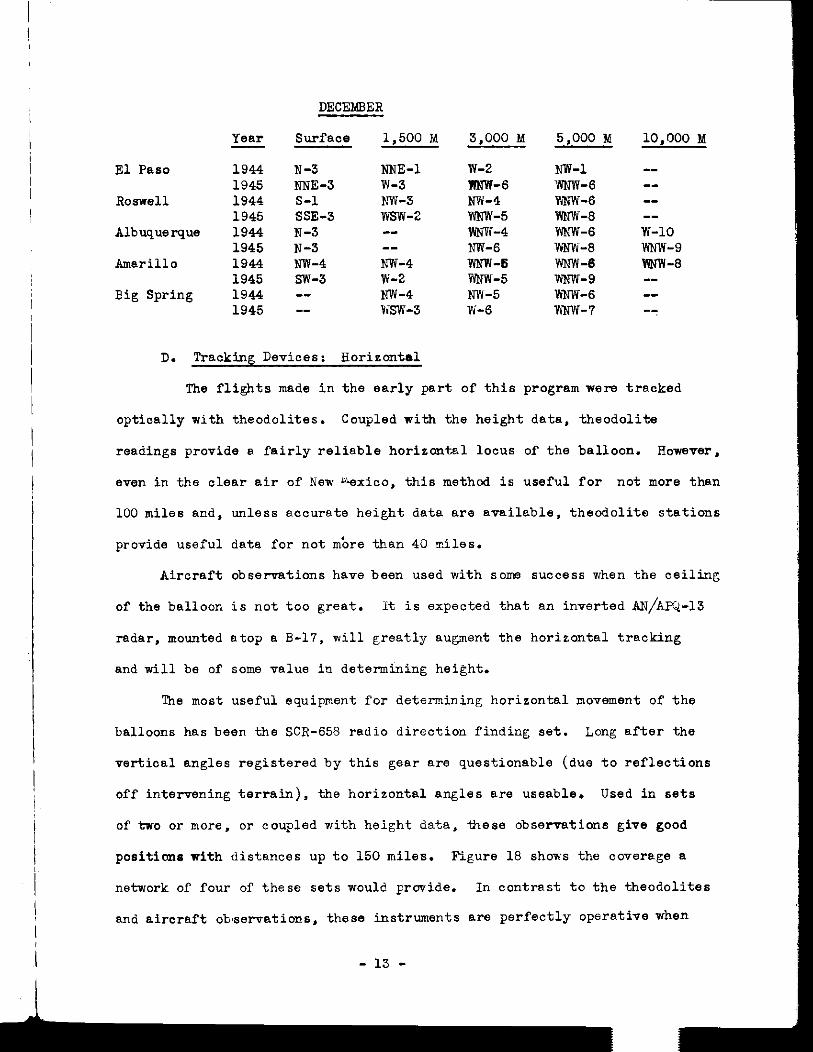
YeFll-
El Paso 1944 1945
Rome11 1944 1945
Albuquerque 1944 1945
Amarillo 1944 1945
Eig Spring 1944 1945
DECEMBER
Surface 1,500 M
N-3 NNE-1 hWE-3 w-3 S-l h'w-3 SSE-3 WSW-2 N-3 -- N-3 -- NW-4 NW-4 SW-3 w-2 -- NW-4 -- WSW-3
3,000 Id
w-2 FNW-6 NW-4 m-5 m-4 NW-6 ViNW-5 WNW-5 NW-5 W-6
5,000 M 10,000 M
NW-1 -- WNW-6 -- YIW-6 -- nNw-6 -- r&w-s w-10 WW-6 VWN-9 W-8 WNW-6 m-s -- WNW-6 -- WNW-7 --
D. Tracking Devices: Horizontal
The flights made in the early part of this program were tracked
optically with theodolites. Coupled with the height data, theodolite
readings provide 8~ fairly reliable horizontal locus of the balloon. However,
evm in the clear air of New %xico, this method is useful for not more than
100 miles and, unless accurate height date. are available, thecdolite stations
provide useful data for not mbre than 40 miles.
Aircraft observations have been used with some success when the ceiling
of the balloon is not too great. it is expected that an inverted AN/AFd-13
radar, mounted atop a B-17, will greatly augment the horizontal tracking
and will be of some value in determining height.
lhe most useful equipment for determining horizontal movement of the
balloons has been the SCR-658 radio direction finding set. Long after the
vertical angles registered by this gear are questionable (due to reflections
off intervening terrain), the horizontal angles are ussable. Used in sets
of two or more, or coupled with height data. these observations give good
positicm with distances up to 150 miles. Figure 16 shows the coverage a
network of four of these sets would provide. In contrast to the theodolites
end aircraft obgsemations, these instruments are perfectly operative when
- 13 -
the balloon is not visible due to haze. cloud c.over. etc. Ground mdar
has been used, when available, with fair results, particularly when radar
targets we added to the flight train.
E. Flight Termination Control
Due to the size and weight of the balloons and the flight gear,
the Civil Aeronautics Authority was advised ofthe testing program. At a
meeting in New York cm 20 March 1947. the New York Air Space Sub-Committee
prescribed a procedure which was designed to minimize the hazard to air
traffic. Similarly. the Fort north Sub-Committee established a procedure
for flights made within the Fort l"orth region of the CAA. Pertinent cor-
respondence with the CM is included in the Appendix, Fart 2. owing to
the size of these cells, e very slow rate of descent should be expected
after all ballast has been expended and the flight control devices have
ceased to operate. Thus a. large balloon and several heavy pieces of
equipment might take an hour or more to descend through the levels of
air travel. Despite the extreme improbability of midair collision, it is
obviously desirable to take all possible precautions against such mishap
and current flights have the following safeguards: (1) Flights are released
on days hhen cloud cover is forecast to be light, thus permitting visual
contact. (2) Notices to airmen are to be issued if the balloon is descending
within designated regions of dense air traffic. (3) To reduce the time
involved in a final descent, a special device called the "blowout patch"
has been&veloped. This is an igniting squib which is fastened to the
side of the cell, on the equator. Sealed iii with the squib, which is fired
electrically whenthe cell descends below 20,000 feet. is a quantity of
gunpowder and magnesium. When the squib is fired, the incendiary patch
blows out, allowing e rapid escape of gas through the opening. Since the
- 14 -
patch is on the equator. the cell does not collapse but serves as a
parachute to prevent extremely rapid fall and damge to the instruments.
Figure 3 shcws this patch in positicm on a balloon. Due to prewtwe
firings, a time switch has been built into the circuit to prevent misfiring
in launching. A rip device will be developed to replace the incendiary on
all future flights.
Section 3. theoretical Relationships and Computations
A. Altitude-Density Relationships
An investigation into the relationship between density of the
atmosphere and altitude. with the seasonal and gsograplical variations
experienced,ms made. 'Ihe basic data, mean serological soundings, were
taken from the h:cnthly Weather Review, 19436. These basic data consisted
of observed temperatures, pressures. and humidities for altitudes from the
surface up to the bursting height of balloons. normally 50,000 to 60,000
feet. For altitude above this height, the highest reported temperatures
for the stations under consideration were used and the pressure data were
taken for the remaining altitudes up to 100,000 feet, from the E.A.C.A.
Standard Atmosphere7.
Density nas expressed inversely in terms of poun$ molar volumes,
as this relates volume in cubic feet to buoyancies of gases of varying
purity, using fundamental data. Using the simple gas laws, the molar
volume of dry air at each altitude was computed in the following manner:
Given: (1) The pound molar volume of any gas at standard
conditions=359 ft.3
- 15 -
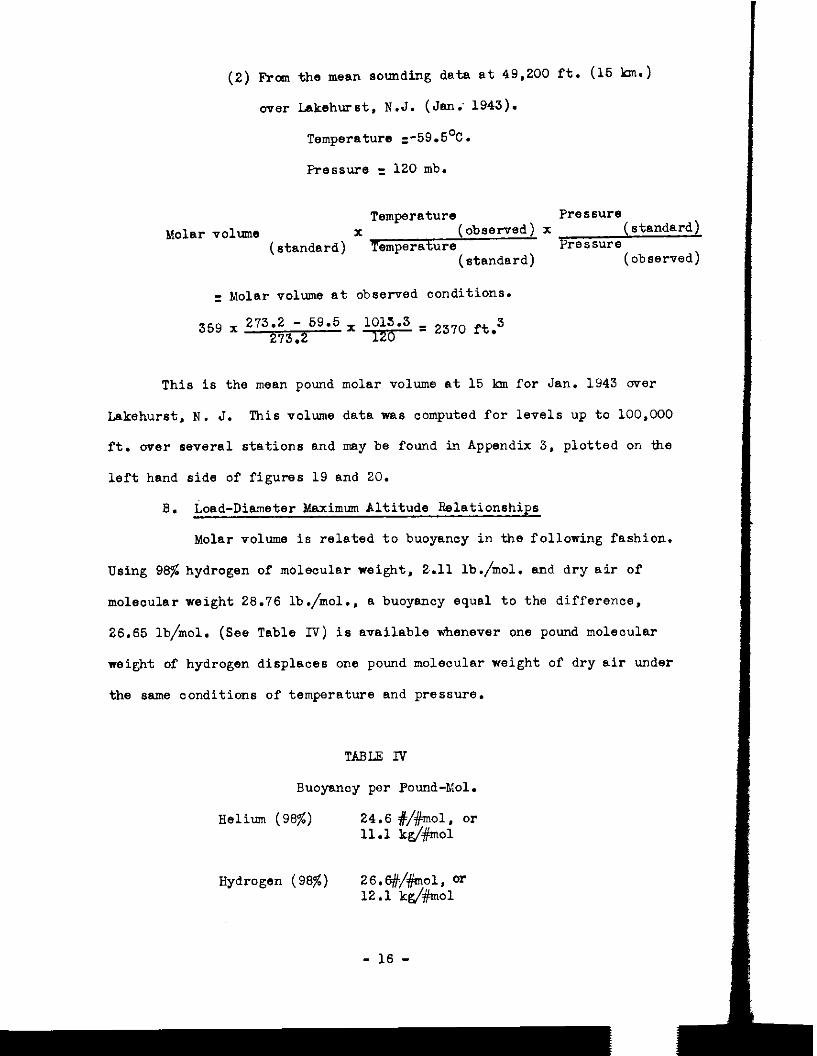
(2) F-ran the mean sounding data et 49.200 ft. (15 !a.)
over Lakehurst. N.J. (Jan; 1943).
Temperature z-59.5%.
~essure = 120 mb.
Temperature PF3SSUl-e
Molar volume (standard) x 'Temperature
(observed) x (standard) PrEiSSUre
(standard) (observed)
= Molar volume at observed conditions.
35g x 273.2 - 59.5 x l;;"o." _ 2370 ft,3 273.2
This is the mean pound molar volume et 15 km for Jan. 1943 over
Lakehurst, N. J. This volume data wae computed for levels up to 100.000
ft. over several stations and may be found in Appendix 3, plotted on tie
left hand side of figures 19 and 20.
B. Load-Diameter Maximum Altitude Relationships
solar volume is related to buoyancy in the following fashion.
Using 98% hydrogen of molecular weight, 2..11 lb./mol. and dry air of
moleoular weight 28.76 lb./mol., a buoyancy equal to the difference,
26.65 lb/mol. (See Table IV) is available whenever one pound molecular
weight of hydrogen displaces one pound molecular weight of dry air under
the same conditions of temperature and pressure.
TABLE IV
Buoyancy per Pound-Kol.
Helium (98%) 24.6 #/#ml, or 11.1 k$#mol
Hydrogen (9%) 26.6#/#mol. or 12.1 k$#mol
- 16 -
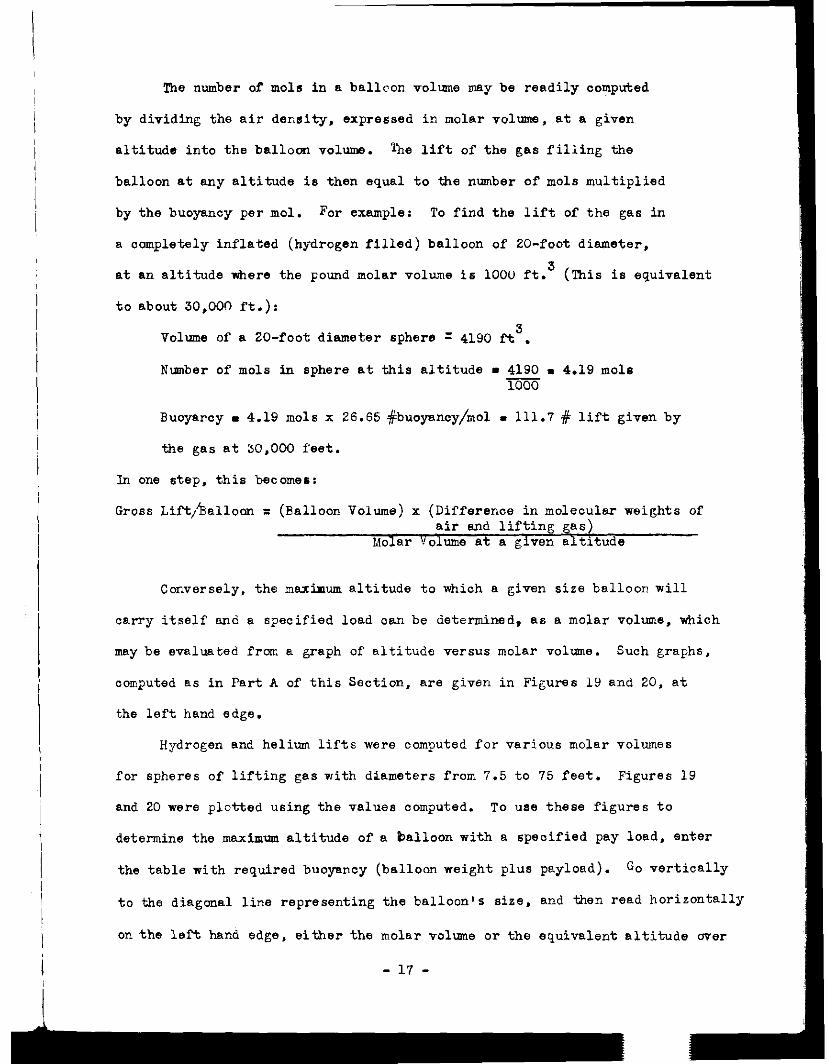
The number of mols in a ballcon vollrme my be readily computed
by dividing the air demity. expressed in molar volume, at a given
altitude into the balloon volume. %a lift of the gas filling the
balloon at any altitude is then equal to the nmber of mols multiplied
by the buoyancy per mol. For example: To find the lift of the gas in
a completely inflated (hydrogen Pilled) balloon of ZO-foot diameter,
at an altitude nllere the pound molar volume is 1000 ft.3 (This is equivalent
to about 30,000 ft.):
Volume of a ZO-foot diameter sphere = 4190 ft'.
Number of mols in sphere at this altitude I 4190 I 4.19 mcls mm
Buoyancy I 4.19 mols x 26.65 #buoyancy/ml I 111.7 # lift given by
the gas at 30,000 feet.
In one step, this becomes:
Gross Lift/Balloon = (Balloon Volume) x (Difference in molecular weights of air and lifting gas
Molar Volume at a given altitude
Conversely, the maximum altitude to which B given size balloon will
carry itself and a specified load oan be determined, as a molar volume, which
may be evaluated fron a graph of altitude versus molar volume. Such graphs,
computed as in Part A of this Section. are given in Figures 19 and 20. at
the left hand edge.
Hydrogen and helium lifts were computed for various molar volumes
for spheres of lifting gas with diameters from 7.5 to 75 feet. Figures 19
and 20 were plotted using the values computed. To use these figures to
determine the maximum altitude of a 'balloon with a specified pay load, enter
the table with required buoyancy (balloon weight plus payload). Go vertically
to the diagonal line representing the balloon's size, and then read horizontally
on the left hand edge, either the molar volume 01 the equivalent altitude over
- 17 -
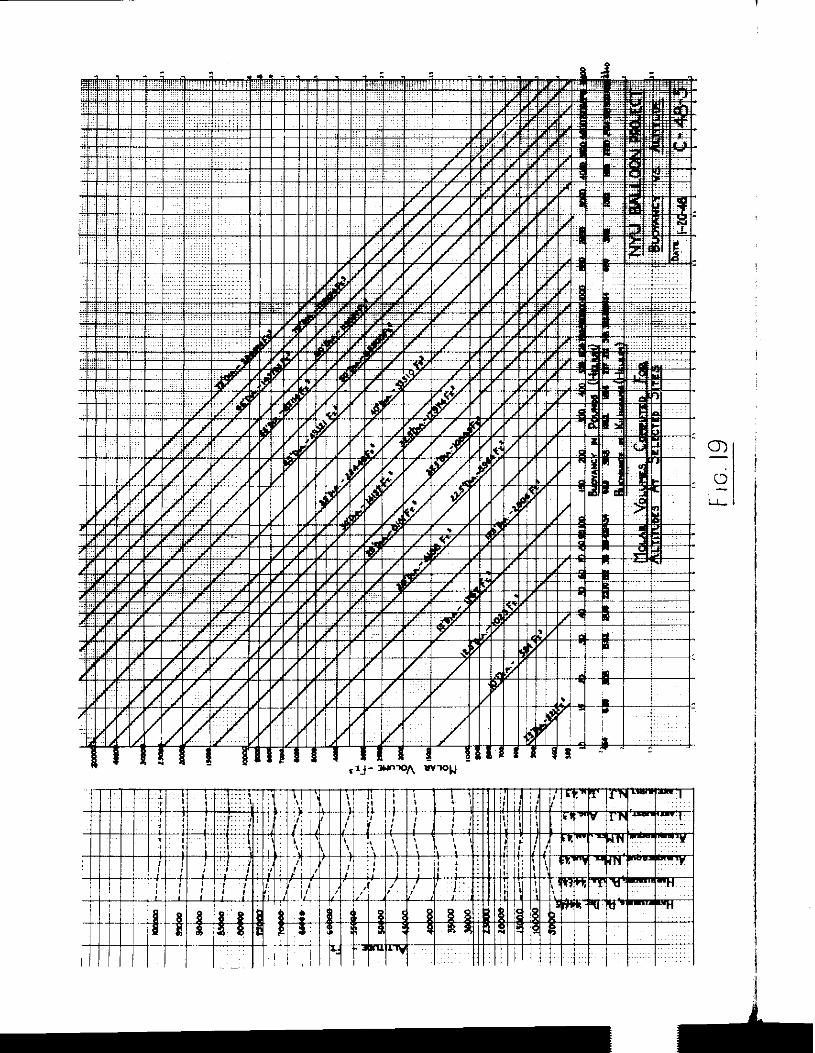
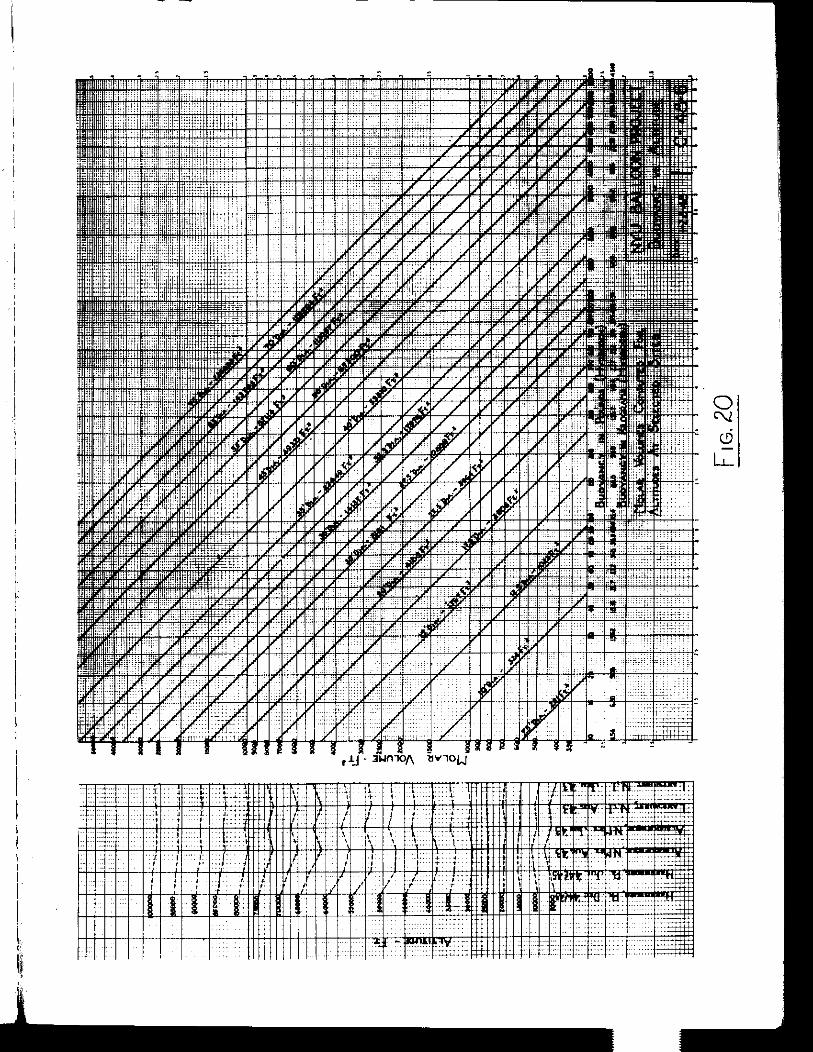
- -
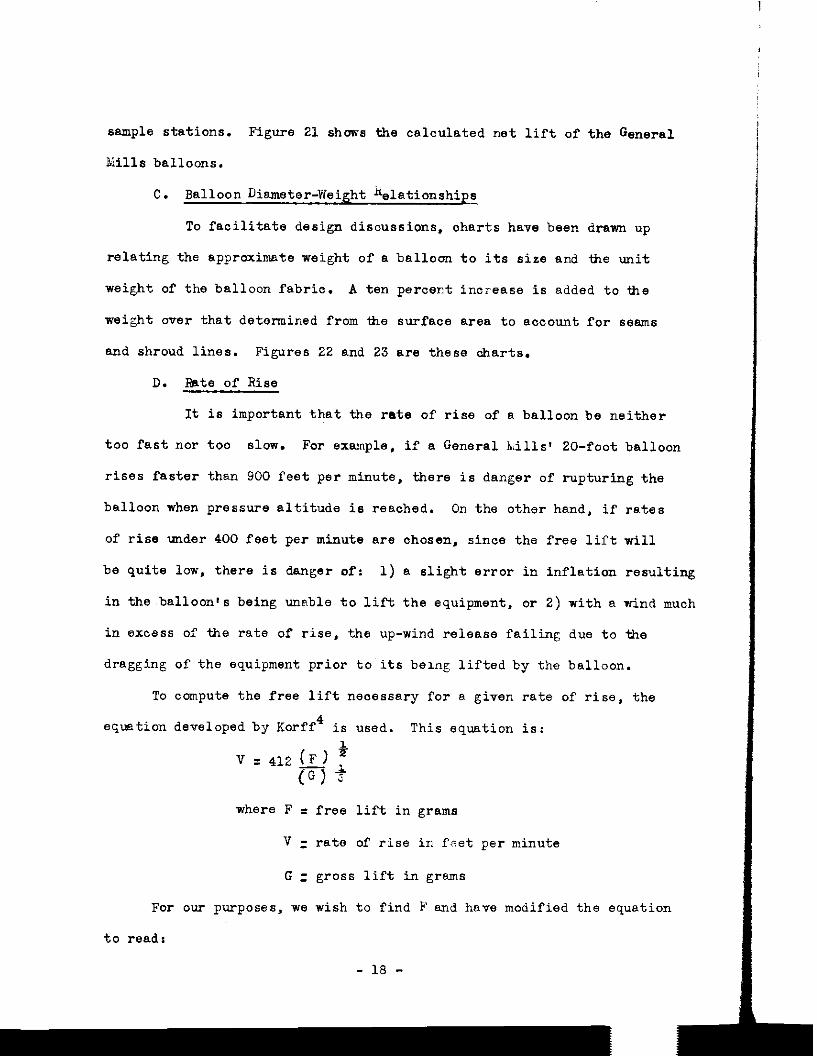
sample stations. Figure 21 shows the calculated net lift of the General
Mills balloons.
C. Balloon Diameter-Weight Glationships
To facilitate design discussions, charts have been dram up
relating the approximate weight of a balloon to its size and the unit
weight of the balloon fabric. A ten percent increase is added to tie
weight over that determined from tie surface area to account for seams
and shroud lines. Figures 22 and 23 are these charts.
D. Bta of Rise
It is important that the rate of rise of a balloon be neither
too fast nor too slow. For example, if e. General b&ills' ZO-foot balloon
rises faster than 900 feet per minute, there is danger of rupturing the
balloon when pressure altitude is reached. On the other hand, if rates
of rise under 400 feet per minute are chosen. since the free lift will
be quite low, there is danger of: 1) * slight error in inflation resulting
in the,balloon's being unable to lift the equipment, or 2) with B wind much
in excess of the rate of rise, the up-wind release failing due to the
dragging of the equipment prior to its bemg lifted by the balloon.
To compute the free lift necessary for B given rate of rise, the
equation developed by Korff4 is used. This equation is:
V. 412 (F) 2%
(G) +
where F = free lift in grams
v= rate of rise in f<yet per minute
GZ gross lift in grams
For our purposes, we wish to find F and have modified the equation
to readr
- 18 -
F (&)Z(G,” (Approximate)
where G I gross load
A chart. Figure 24, has beendrawn up. based on this equation. expressing free
lift as a percentage of gross load, allowing the rate of rise to be approximately
predetermined.
E. Ballast Requirements
The amount of ballast which must be dropped through the wnual
ballast valve to keep the balloon at its ceiling. can be approximately
determined by the following measurements: a balloon of similar size and
construction is inflated and its loss of lift with time is measured with
correction for variation of temperature. This inflation. is r-ot complets,
but is of the same magnitude as that of a balloon ready for release,
approximately 14% of full inflation in the case of a General ~Xills balloon.
The loss of lift per hour, multiplied by a factor representing the increase
of the surface which results from total inflation, is thus obtained. This
factor is the reciprocal of the fraction of inflation raised to the two-thirds
power for a spherical balloon, and is approximately the same for the tear-drop
shaped General Mills balloons.
Field experience has shown that ballast leak pre-set to slightly exceed
the computed loss of lift is insufficient. A ballast leak of double the
computed loss of lift has usually been adequate. It is believed that increased
liquid viscosity and valve closure caused by the 'colder temperatures of the
high atmosphere are responsible for the need for this higher ballast setting.
An investigation into temperature effects on the ballast release systems has
been started.
!lhe amount of ballast which must be released opt sunset to compensate
for the loss of superheat, may be computed as follows:
- 19 -
I:
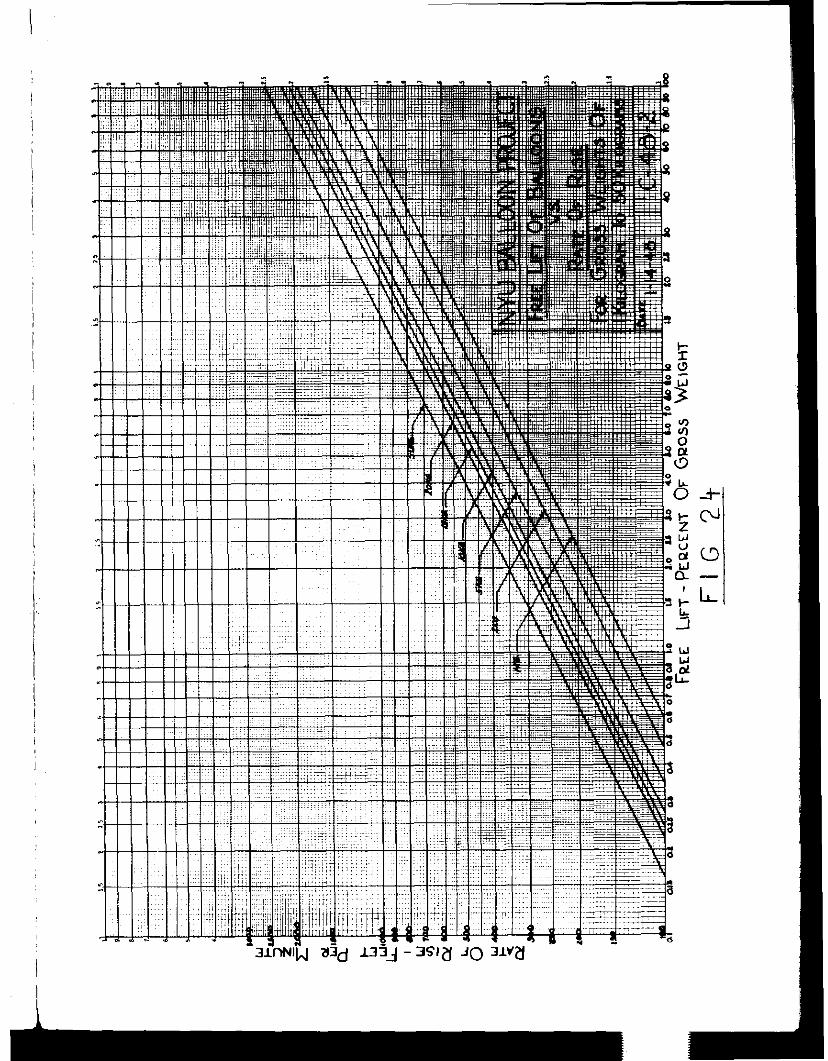
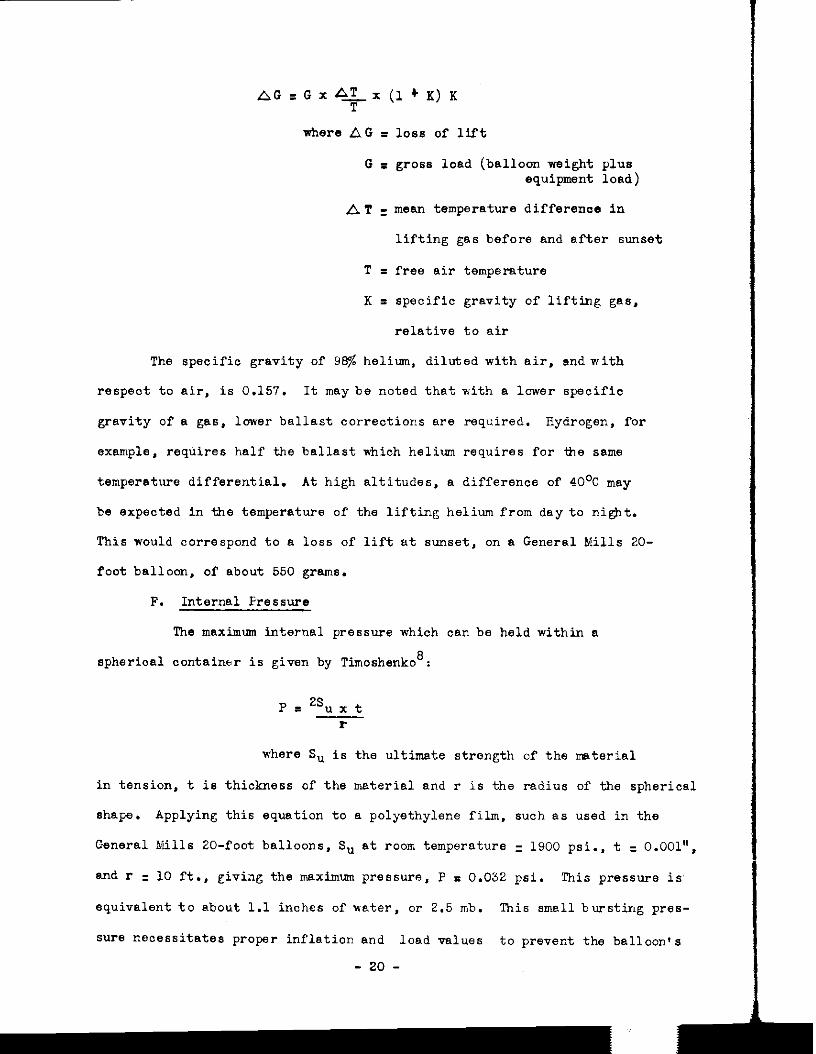
AG= GxA+x(~+K)K
where AG I loss of lift,
G = gross load (balloon weight plus equipment load)
AT z mean temperature difference in
lifting gas before and after sunset
T = free air temperature
K = specific gravity of lifting gas,
relative to air
The specific gravity of 9% helium. diluted with air, endwith
respect to air, is 0.157. It may be noted that with a lower specific
gravity of a gas, lower ballast corrections are required. Hydrogen, for
example, requires half the ballast which helium requires for tie same
temperature differential. At high altitudes, a difference of 40% may
be expected in the temperature of the lifting helium from day to ni@t..
This would correspond to a loss of lift ut sunset, on a Genersl Mills ZO-
foot balloon, of about 550 grams.
F. Internal Pressure
The maximum internal pressure which can be held within a
spherical container is given by TimoshenkoS:
where S, is the ultimate strength of the material
in tension, t is thickness of the materiel and r is the radius of the spherical
shape. Applying this equation to a polyethylene film, such as used in the
General Mills ZO-foot balloons, S, at room temperature = 1900 psi.. t = 0.001".
and r = lo ft., giving the maximum pressure, P = 0.032 psi. This pressure is,
equivalent to about 1.1 inches of water, or 2.5 mb. This small bursting pres-
sure nece.5Sitetes proper inflation and load values to prevent the balloon's
- 20 -
bursting at pressure altitude.
A series of forms which have been used to facilitate computations
have been drawn up. 'key are included in Appendix 3, together with (L table
6 of altitudes based on the N.A.C.A. Standard Atmosphere , and other useful
reference tables.
Glosses
Equipmen$ load: Weight of all equipment. rigging, and ballast hung from
the balloon shrouds not including balloon or its integral
parts.
Gross load: Load on the gas at release (Balloon plus equipment load weight).
Free lift: Net lift of the balloon with the equipment load attached.
Gross lift: Lift of ali of the gas in the balloon et release (Equals weight
of the balloon, equipment load plus the free lift).
Balloon inflation: Gas inflation to be given the balloon in terms of
initial lift of the balloon (equals weight of equip-
ment load plus free lift plus allowance for gas
losses~before launching).
Floor: The locus of altitudes at which a balloon will float when lift
losses are exactly compensated for on a demand basis by ballast
dropping. In practice, this is determined byths operation of
the automatic ballast release and is some altitude below the ceiling.
Ceiling: The locus of pressure altitudes at which B non-extensible balloon
will float when gas losses are sli&htly over-compensated for by
ballast losses.
Pressure Altitude: lhe altitude at which a non-extensible balloon becomes
fully inflated.
- 21 -
Pressure Height: The height above mean sea level as determined frann I
presau-e measurements used in this work with the
E.A.C.A. Standard Atmosphere.
Section 4. night Techniques
The general techriiques of preparing and launching controlled altitude
balloons are patterned after those of the smaller radiosonde balloons. The I
treatment of large, manned balloons has been studied, however, and information
of considerable value has been gleaned; as from the Wational Geographic Society
reports of the flights of Explorer I and Explorer II 11.12
, and from the bock
by Upson and Chandler 15
. Fran these and other studies 13, 14
'and fran original
experimentation with General Kills advice, 8. satisfactory technique of handling
controlled-altitude balloons has been developed.
A. Inflation
The lifting gas used for these large balloons has been helium.
The choice of gas was made on safety considerations. Hydrogen, however,
has several advantages over &zlium. it will lift 9% more than helium and,
due to its lower specific gravity. requires but 50% of the ballast release
that helium requires to correct for disappearance of superheat at sunset.
Helium, on the other hand, leaks and diffuses at a rate but 7% that of
hydrogen. However, for long flights, hydrogen would probably have mere
over-all economy of ballast.
Inflation has been made through a low-pressure, diffusing manifold,
feeding from a number of helium tanks simultaneously to the balloon. The
smaller balloons have been inflated inside a ~hangar. permitting very exact
weigh-off of the balloon's free lift, thus predetermining the rate of rise
fairly well. The plastic balloons larger than 15 feet in diameter have
generally been inflated cut-of-doors. as no hangar large enough for interior
- 22 -
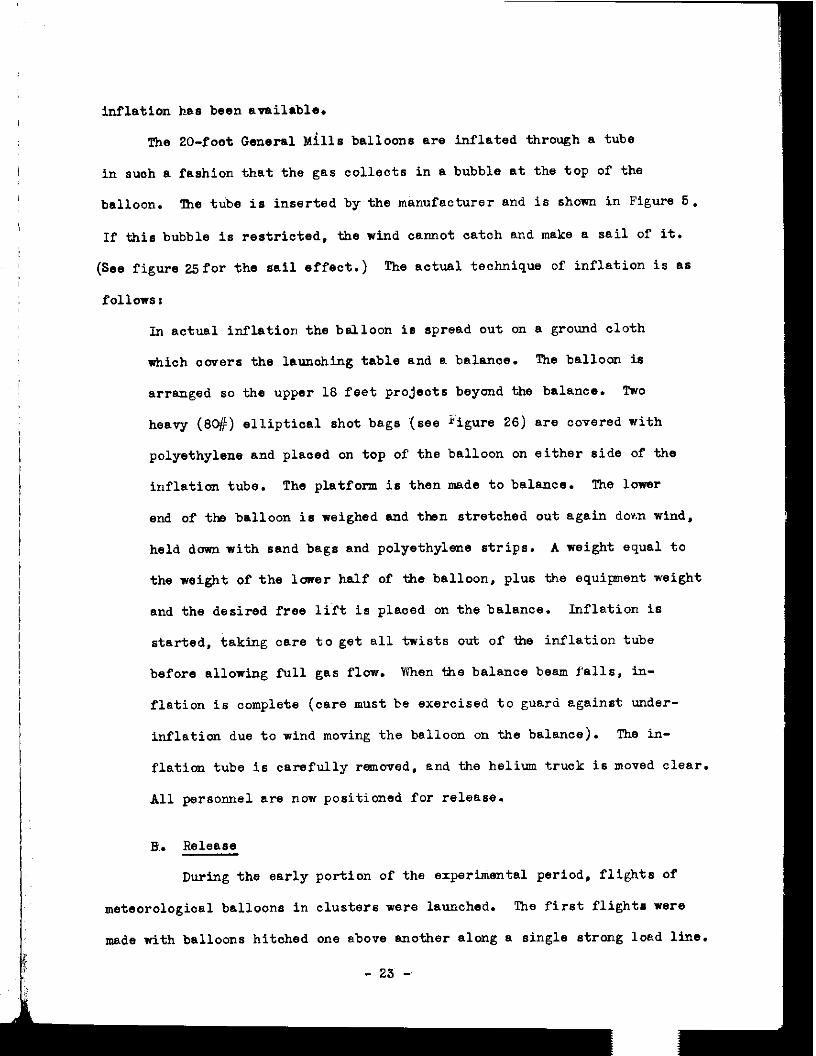
inflation b.as been available.
The ZO-foot General Mills balloons are inflated through a tube
in such B fashion that the gas collects in 6. bubble at the top of the
balloon. !lhe ttibe is inserted by the manufacturer and is shcm in Figure 5.
If this bubble is restricted, the wind cannot catch and make a sail of it.
(See figure 25for the sail effect.) The actual technique of inflation is es
follcwsr
In actual inflation the balloon is spread out on a ground cloth
which 001781‘s the launobing table and 8. balance. The balloon is
arranged 80 the upper 18 feet projects beyond the balance. Two
heavy (SC#) elliptical shot bags '(see k'igure 26) are covered with
polyethylene and placed on top of the balloon on either side of the
inflation tube. The platform is then made to balance. The lonsr
end of the balloon is weighed and then stretched out again dmn wind,
held dcm with sand bags and polyethylene strips. A weight equal to
the weight of the lower half of the balloon, plus the equi&nnent weight
and the desired free lift is placed on the balance. Inflation is
started. taking care to get all twists out of ihe inflation tube
before allowing full gas flew. When the balance beam falls, in-
flation is complete (care must be exercised to guard egainst under-
inflation due to wind moving the balloon on the balance). The in-
flation tube is carefully rmcved, and the helium truck is moved clear.
All personnel are new positioned for release.
B. Release
During the early portion of the expertimtal period, flights of
meteorological balloons in clusters were launched. The first flights were
made with balloons hitched one above another along B single strong load line.
- 23 -
Figure 25 General Mills 20 foot balloon billowing in a five knot wind.
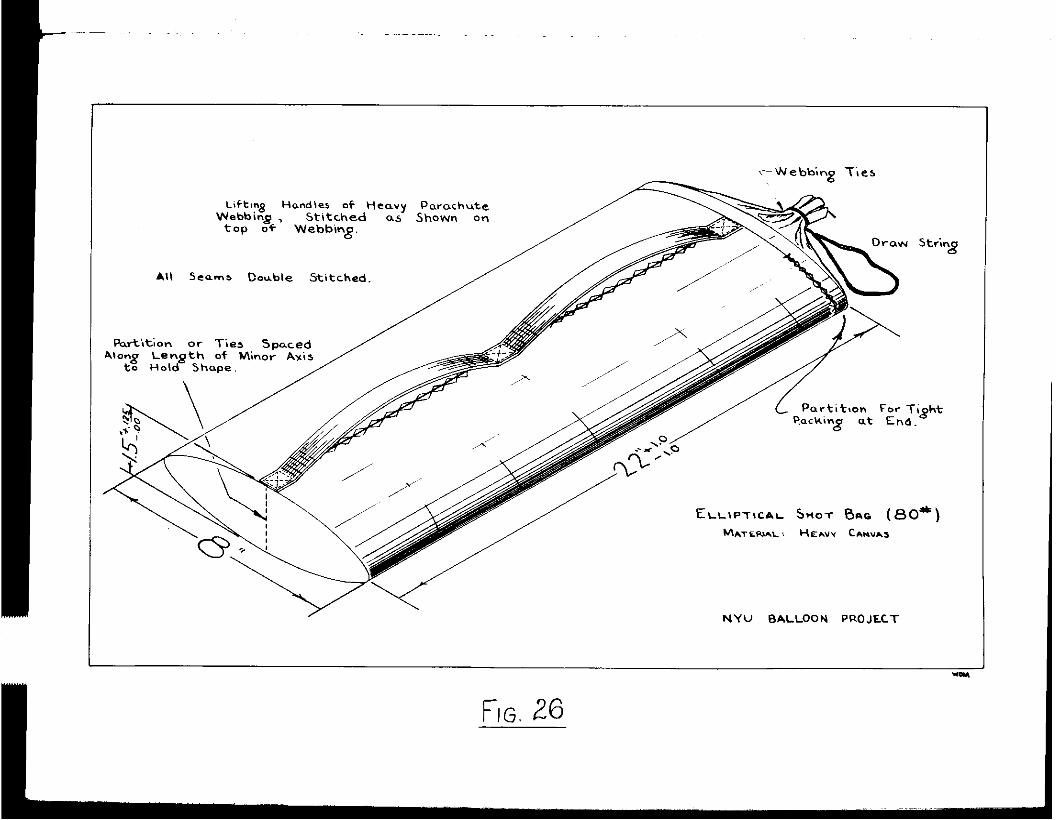
Lifting Handler of “eavy Parochute Webbing , Stitched as Shown on
top of Webbing.
All Scams Couble Stitched.
Along Length of Minor Axis to Hold Shape.
String
NYU BALLOON PROJECT
FIG. 26
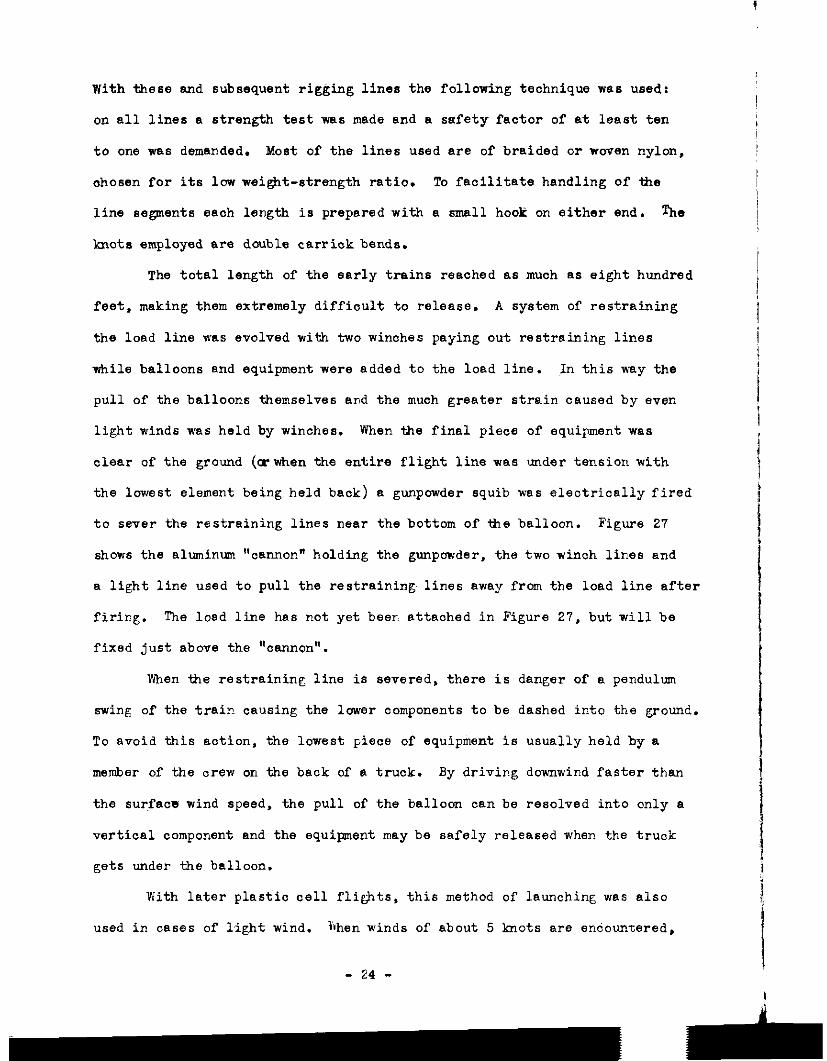
With these and subsequent rigging lines the following technique ~86 used:
on all lines a strength test was made end a safety factor of at least ten
to one was demanded. Most of the lines used are of braided or wcwm nylon,
chosen for its low weight-strength ratio. To facilitate handling of the
line segments each length is prepared with a small ho& on either end. The
knots employed are double carriok bends.
The total length of the early trains reached as much es eight hundred
feet, making them extremely diffioult to release. A system of restraining
the load line was evolved with two winches paying out restraining lines
tiile balloons end equipment were added to the load line. In this way the
pull of the balloons themselves and the much greater strain caused by Eden
light winds was held by winches. When the final piece of equipment ms
clear of the ground (arwhen the entire flight line was under tension with
the lowest element being held back) 8 gunpcwder squib was electrically fired
to sever the restraining lines near the bottom of the balloon. Figure 27
shows the aluminum "cannor." holding the gunpowder, the two winch lines and
a light line used to pull the restraining lines away from the load line after
firir?g. The load line has not yet beer. attached in Figure 27, but will be
fixed just above the "cannon".
When the restraining line is severed, there is danger of a pendulum
swing of the train causing the lower components to be dashed into the ground.
To avoid this action, the lowest piece of equipment is usually held by a
member of the orew on the back of B truck. By driving downwind faster than
the sur,feca wind speed, the pull of the balloon can be resolved into only a
vertical component and the equipat may be safely released when the truck
gets under the balloon.
With later plastic cell flights, this method of launching was also
used in cases of light wind. Yrhen winds of about 5 lmots are endountered,
- 24 -
Y
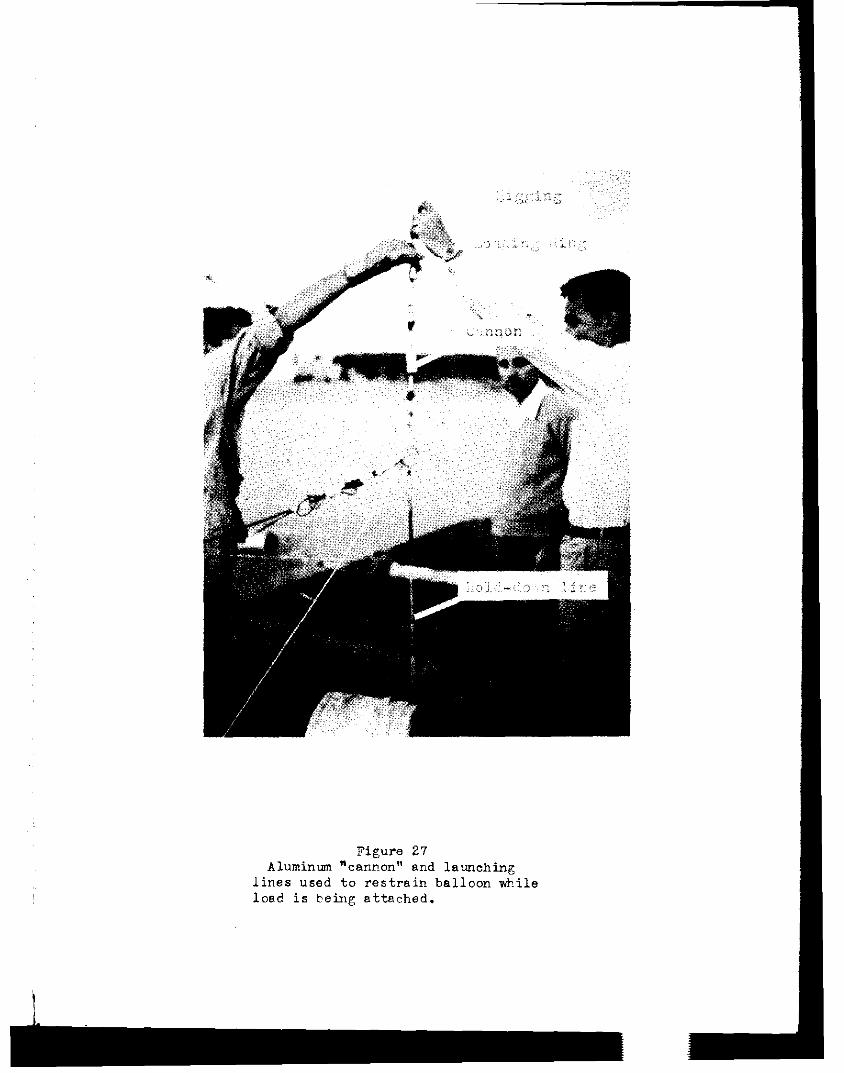
Figure 27 Aluminum "cannon" and launching
lines used to restrain balloon while load is being attached.
the total strain on rigging lines and even on the balloon itself becomes
sxoessive. With the thin polyethylene film of the General Mills' balloons,
such a wind form causes the balloon first to billow, sail-like, as ih Figure
25, then to tear.
To eliminate surface failures on days when the wind is not calm, the
following release technique is employed: The equipment train is laid out
parallel to the wind direction, with the balloon in the lee of a large build-
ing and the other components stretched out downwind. The central portion of
the balloon rests on a platform balance 8r.d the lower portion rests on a
sloping elevepfoot table whose top is level with ths platform and whose
bottom rests upon the grcmd. The upper portion of the balloon usually
lies on mother table, level with the platform. zxcept for this upper
portion, the balloon is held dam on tie scales and sloping table by bags
of sand and lead shot. In addition, one sand bag ia fastened to the lead
thimble of the balloon by B short line tiich is kept taut during inflation.
This layout is shown in Figure 28.
When the balloon is inflated, it is held down at the weighing-off
scales by the shot bags. Fersonnel requirea for the launching consist of two
men at the hold-dam shot bags (who lift the bags at the release signal), on6
man near the large sand bag (who cuts the line to the load thimble when the
balloon rises above him), one man at each piece of sensitive equipment on the
train (to support end protect the equipent until it is airborne), one man
at the lower end of the hold don line (who fires the cannon severing the
last 1ir.e wher. the gear is all safely lifted).
If each operation is performed tien the balloon is directly overhead
and if the train has been accurately laid out downwind. the entire train is
sent off with a minimum of oscillation of the load. Figure 29 shows suooessive
positions of the balloon and gear during release.
- 25 -
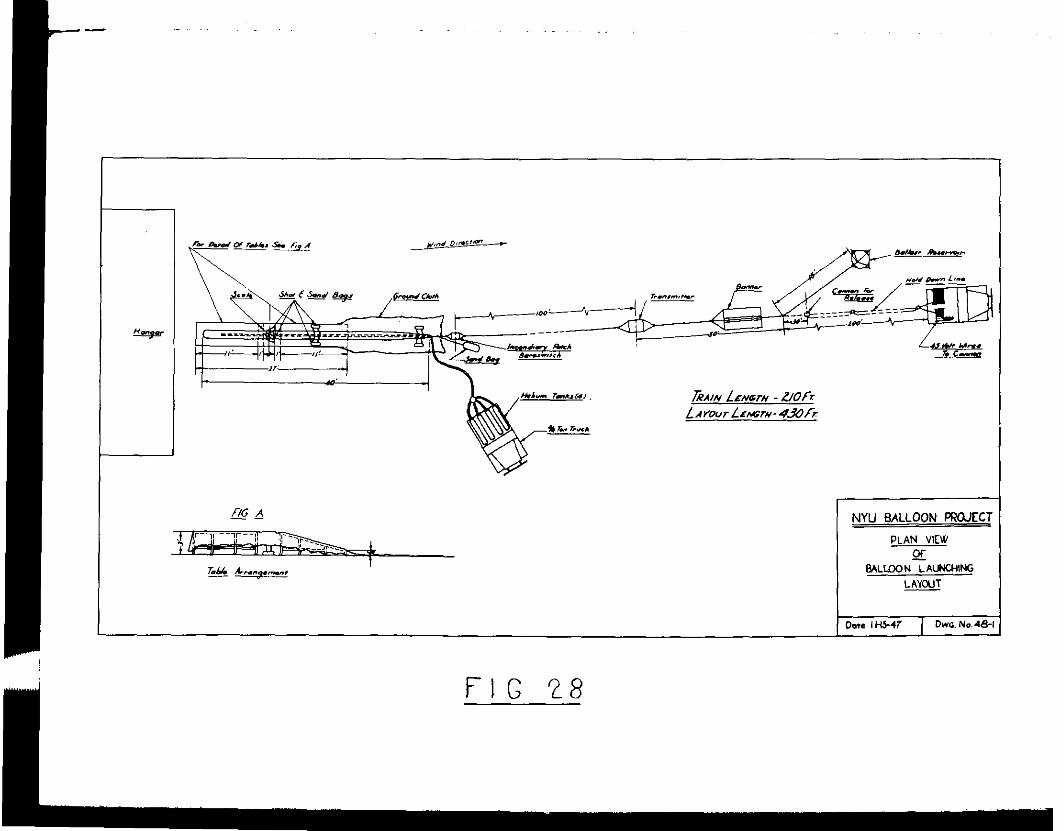
NYU BALLOON FRJJECT
PLAN VIEW or
BALLOON LAIJNCMING LAYCUT
hr. I ~5-41 1 DWG. N..48-
FIG 28
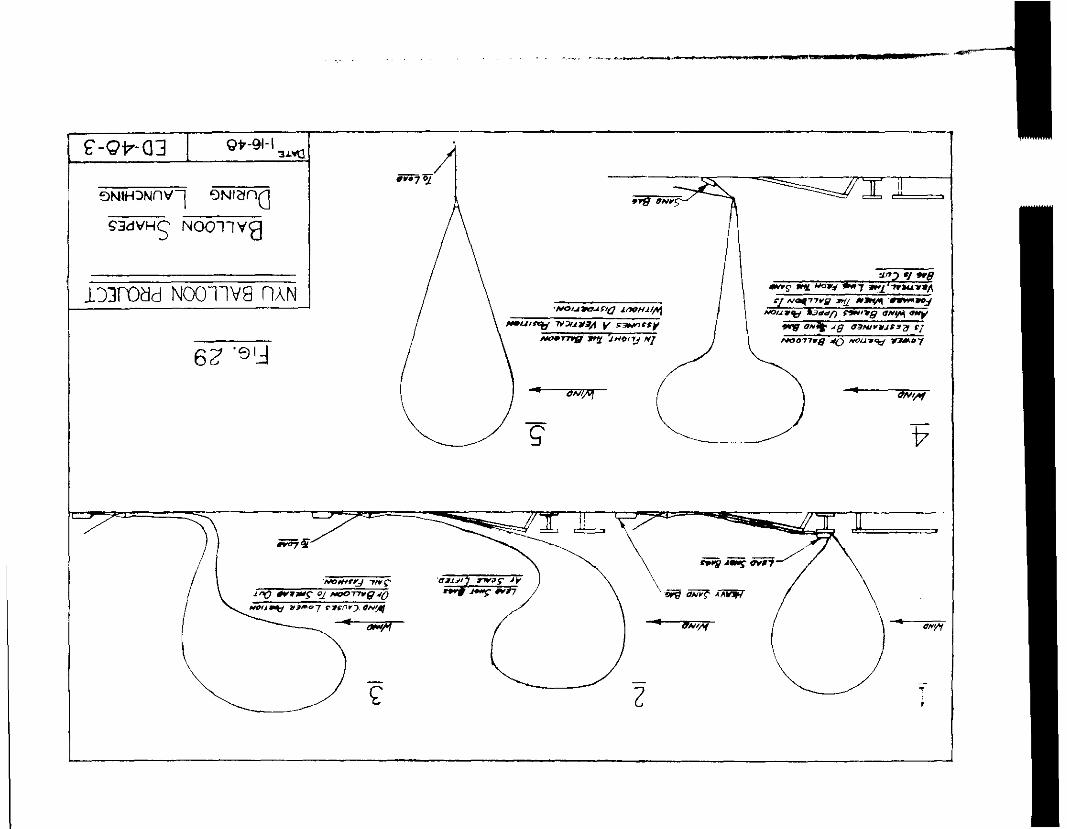
A ._,. . .l~
133i-Otld NCXIllV9 flhN
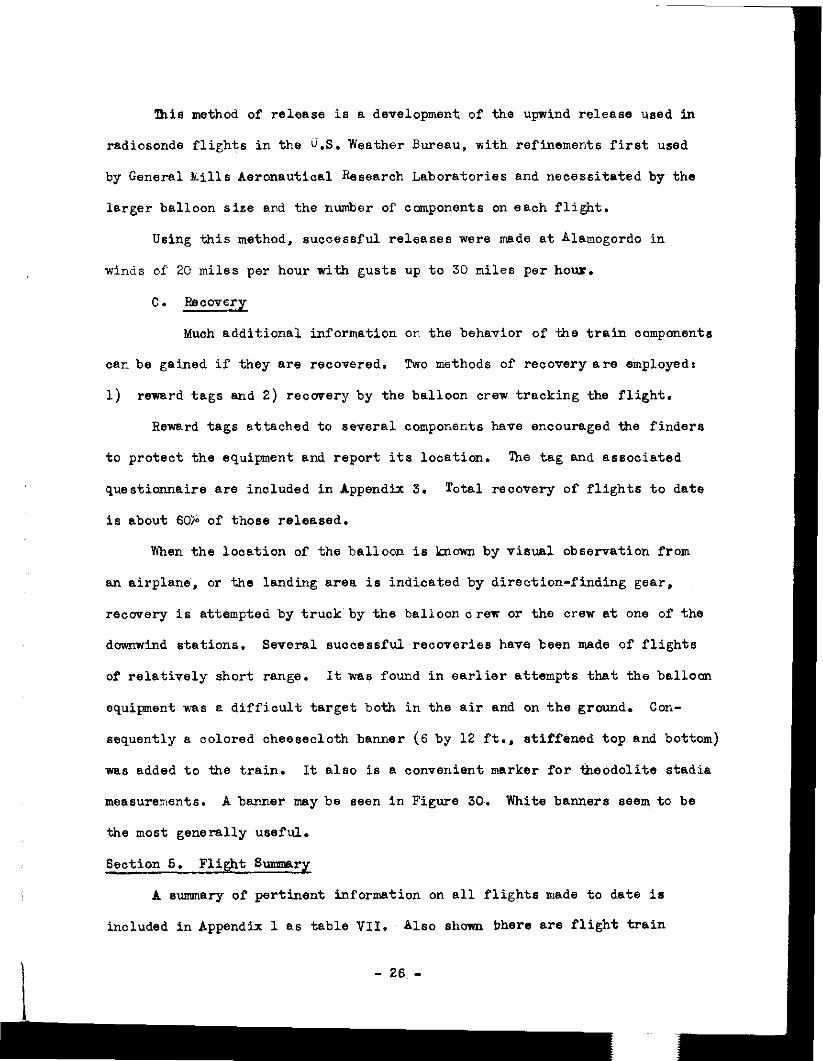
'&is method of release is a development of the upwind release used in
radiosonde flights in the U.S. Weather Bureau, with refinements first used
by General Kills Aeronautical Hesearch Laboratories and necessitated by the
larger balloon size and the number of components on eaoh flight.
Using this method, successful releases were made at Almogordo in
winds of 20 miles per hour with gusts up to 30 miles per hour.
C. Recovery
Muoh additional information on the behavior of the train oomponents
can be gained if they are recovered. Two methods of recovery are employed:
1) reward tags and 2) recovery by the balloon crew tracking the flight.
Reward tags attached to several components have encouraged the finders
to protect the equipment and report its location. '&he tag and associated
questionnaire are included in Appendix 3. Total recovery of flights to date
is about 60% of those released.
When the location of the balloon is known by visual observation from
an airplane, or the landing area is indicated by direction-finding gear,
recovery is attempted by truck'by the balloon crm or the crew at one of the
dovmwind stations. Several successful recoveries have been made of flights
of relatively short range. It was found in earlier attempts that the balloon
eq"iIemnt was a difficult target both in the air and on the ground. Con-
sequently a colored cheesecloth banner (6 by 12 ft., stiffened top and bottom)
vm8 added to the train. It also is a convenient marker for iheodolite stadia
measursnents. A banner may be seen in Figure 30.. White banners seem to be
the most generally useful.
Section 5. Flight Sumwry
A surenary of pertinent information on all flights made to date is
included in Appendix 1 as table VII. Also shonn bhere are flight train
- 26 -
Figure 30 General Mills 20 foot balloon
in flip$t. showings banner and other flight train components.
diagrams, time-height curvesr trajectories and photographs of signi-
ficant flights, grouped by fli@t numbers. The flight numbering system
has been revised since its inception and now only those flights in which
an attempt was made to control the altitude of the balloon are included
in the sunrmary. Excluded are flights made to test special gear and
launchings which mre not successful.
Flights A, B, 1, 6, 6 and 7 all made use of meteorological balloons
in various arrangements and combinations. Each flight included one or
more "lifting balloons" hich were to be released from the train when
the desired altitude was reached, the other balloons then theoretically
supporting the load at the constant altitude.
Figures 31 and 36 show the two methods used to group the balloons
in clusters. Figure 31 shows the linear array borrowed from cosmic ray
flight techniques; figure 36 shows the modified "Helios Cluster" in tiich
lines from the balloons are joined at a central ring at the top of the
load lice.
lhe Helios cluster was by far the easier to handle because of the
simpler rigging ard the reduced launching strains.
Flight 7 v.m~ the only one of this group in which anything approach-
ing a controlled altitude was attained. lhe previous flights failed to
level off when the lifting balloons broke loose. In flights 1, 5 and 6,
wbsre ballast dropping dev:oes were included, the ballast either did not
drop, or the dropping did nothave the desired effect. In flight 7,
however, the cluster rose till the lifters were cut off, descended until
sufficient ballast was dropped to ca"s8 the cluster to rise to a still
higher altitude. There several balloons burst, resulting in a final
descent. The time-height curve for this flight is shown as figure 38.
lhis flight pattern represents the best approximation to constant
level flight that we have obtained with meteorological clusters.
Flights 8 and 11 each employed more than one polyethylene balloon
in an attempt to reach higher altitude than possible with the single
balloons then available. Figure 39, 40, 41, 44 and 45 show the type
and arrangement of balloons and their flight behavior. In both flights,
the maximm altitude was not high enough to cause. activation of the
autamtio ballast wlve. Consequently, there was Rio compensation for
diffusion other than the steady lea!mge of ballast through the imperfect
seating of the valve. In flight 8, after one hour, this leak was not
suffioient to maintain a constant altitude, so the flight terminated.
However, in fli&t 11, constant altitude was maintained at 16.000 ft.
+ 1500 feet for 7 hours until all of the ballast vms expended.
Flight 10, in contrast to flights 6 and 11. did reach an altitude
at which the automatio ballast control was actuated. resulting in a
flight of perhaps more than 26 hours. Although the maximum altitude
reached by this heavy spherical cell was 15,000 feet, the ballast control
was effective at a level of 5000 feet. The expected difference between
activation level and operation level was prdbably exceeded because of the
temperature effect of the air entrapped in the pressure capsule.
Figure 42 shows the train, and figure 43 shows the time-altitude
curve for the 512 minutes of radiosonde data.
The oscillations around 9000 feet during the last two hours of
data my be attributed to the changing buoyancy of the balloon as cloud
masses intermittently shielded it from the sun's rays. An unco2lfirned
report was received to the effect that this balloon was still floating
26 hours later 'over Pueblo, Colorado.
- 28 -
Flight 12 was designed to overccme the difficulties enoountered
in flights 8 and 11. and, by the use of a thin tear-drop balloon (General
Mills balloon) to carp the load to a higher altitude than flight 10.
To guarantee a predetermined constant ballast flow, the manual ballast
valve was added to the flight train. The minimum pressure switch
replaced the fixed pressure switch to activate the atitomatic ballast
valve, whether or not a predetermined activation altitude was reached.
Figure 46 shows the train; figure 47 shows the time-altitude curve, which
exhibits a marked departure from the ideal. The minimum pressure switah
failed to operate or operated near surface pressure, effectively preventing
the operation of the automatic ballast valve. The manual ballsst valve did
not provide sufficient flow to prevent the gradual dasoent of the balloon.
Finally, the heavy load necessitated almost complete inflation of the
balloon at the surface. lhis distention permitted continual mixing of
air through the open bottom of the balloon. Instead of reaching the pre-
calouleted 38,000 feet maximum altitude, this flight had a peak of 14.000
feet from which it slowly descended. Since the blowout patch was set to
act upor descent to 20.000 feet, it also failed to operate.
Five of the succeeding flights (nos. 13. 14. 15, 16 and 20) had as
a prime objective the development of B satisfactory appendix to overoome
the loss of buoyancy due to mixing during launching and asoent. The types
considered have beer, discussed in Section II, Part A of this, report and
the (two foot) appendix stiffened with battens. which was finally evolved.
is shown in figure 5. Figures 48, 49 and 50 show the time-altitude ourves
for these flights. Either short flight or limited radio reception curtailed
the trajectory data.
In flight 19, the danger to persane of the blowout patch was
- 29 -
dramatically demonstrated by its firing 30 Geconds after release. Launching
shocks caused the baroswitch pen-arm to fall off its shelf, completing contact
prematurely. In later flights, a time delay switch was placed in series with
the baroswitch to prevent a recurrtince of this action.
Flights 21, 22, 24, 26 and 27, although carrying altitude control
devices, were flown to test gear for associated projects. Either no pressure
reporting gear was carried or the data from modified gear proved unreliable.
Her.ce few performance data charts are presented.
Flight 21, using a late-model General Xills 20 foot thin cell and
an automatic ballast valve, is Imown to have lasted for ten hours, descending
at Marietta, Oklahoma.
Flight 22, included an earlier model General hills balloon with a
high rate of gas leakage, and an automatic ballast valve. The ballast control
kept the balloon aloft, but for only six hours.
Flight 24, including an automatic ballast valve, is believed to have
maintained constant level, + 1,000 feet, for 122 minutes. It stayed aloft
for at least 3.k hours, when transmission ceased. The time-altitude curve
is shown in figure 51.
Flignt 27 employed B fixed rate of leak rather than an automatic
ballast valve. me r~nual control dia not provide sufficient ballast flow,
accounting for the time-altitude curve shov.n in figure 52.
Flights 29 through 37 and flight 39 were undertaken to test the
downwind launching procedure. to try for highor constant level altitudes,
and to determine the feasibility of using the General Xills thin cells for
freq:ioat service flights. Flights 37 and 3S burst early. %a former was
released during a,rainstorm and balloon failure occured at the seams.
- 30 -
Flight 29, with a manual ballast valve. was I;eleased just before
sunset on 22 November. It was obsewed descending 50 miles north of
Toronto, Ontario, Canada, 14 hours later. %he average wind was 130 mph.
Radio receiption was for 69 minutes.
Of the other recent flights, satisfactory radio performance was
enjoyed only on flight 36. Before any more flights we made, a better
transmitter and battery pack will be needed. Even on this flight the
signal was lost after 135 ninutes, due to excessive range. Tne lest
plotted position was northeast ofTu+xanoari, Il.& This flight was recovered
from Burlington, Iowa.
Time-height curves of this series are included in figures 53, 54
and 55. Despite the limited data, some results can be determined. For
example, flight 32 is believed to have floated for at least 7G minutes
within 1,000 feet of a constant level above 40,000 feet VSL.
Flight 35 also exhibited 32 minutes of constant-level flight before
the radio sipal was lost. From the remarkable distances that some of
the otners traveled (See flight *munary Table VI, Appendix I) it is almost
certain that they floated for long periods.
These flights included a simple-filter manual ballast valve assembly
(Figure 9) designed to reduce equipment weight and cost. 2he perf ormence
of this equipment justifies its continued use for relatively short flights.
Cocsiderable difficulty was experienced with the t;ipe of'filter used.
Experiments are now being conducted to improve the filter.
Because of limited data received from earlier flights, rncdified
Fergusson metsorographe were added to the equipment train on flights 33,
35 and 39. As of January 1. 1948 none of these instruments have been
recovered.
- 31 -
Flight 17, using a fifteen-foot balloon of ,004 Polyethylene is
worthy of special consideration. ?he thiclmess of this type of cell
eliminates much of the prbblem of appendix design since mere internal
pressure can be withstood. Despite this factor, end the low permeability
oftha fabric, balloons of this type are too heavy and costly to be used
for high altitude flights.
'Ihe trajeotory and time-altitude curve of this flight are shown
in figure 56 and 57. This controlled-e.ltitude flight demonstrates that
the automatic ballast valve combined with a fixed leak, will successfully
maintain constant altitude through a sunset. The balloon floated at 29,000
feet: 500 feet for at least three hours, after whichthe excessive range
prevented further radio reception. Here again the necessity of a barograph
was demonstrated as the balloon was recovered from Pratt, Kansas, 530 miles
*my. Two flights, 23 and 38. were made using the shrouded Dewey and Alny
J-2000 Neoprene balloon. Both of these flights were failures. Flight23
(see figure 48) attained a maximwn altitude at 50,700 feet and began to
descend inmediately. Flight 38 (see figure 55) was observed from a B-25,
and the balloon was seen to burst rrithin the shroud.
Section 6. Current Objectives
In order to meet the requirements for future flights, improvement
must be made in three phases:
1. Performance data for too many flights have beer either uncertain
or of too short duration. Before mere flights e.re undertaken,
altitude-measuring instruments must be improved and increased.
To this erd, four specific improvements are being nrdcrtnken:
A. To supplement the pressure data received by radio, c
lightweight barograph will be added to those fli;lht
trains in the future vrher! fli$ts of more thr:i R few
hours' duration 81-e attempted.
- 32 -
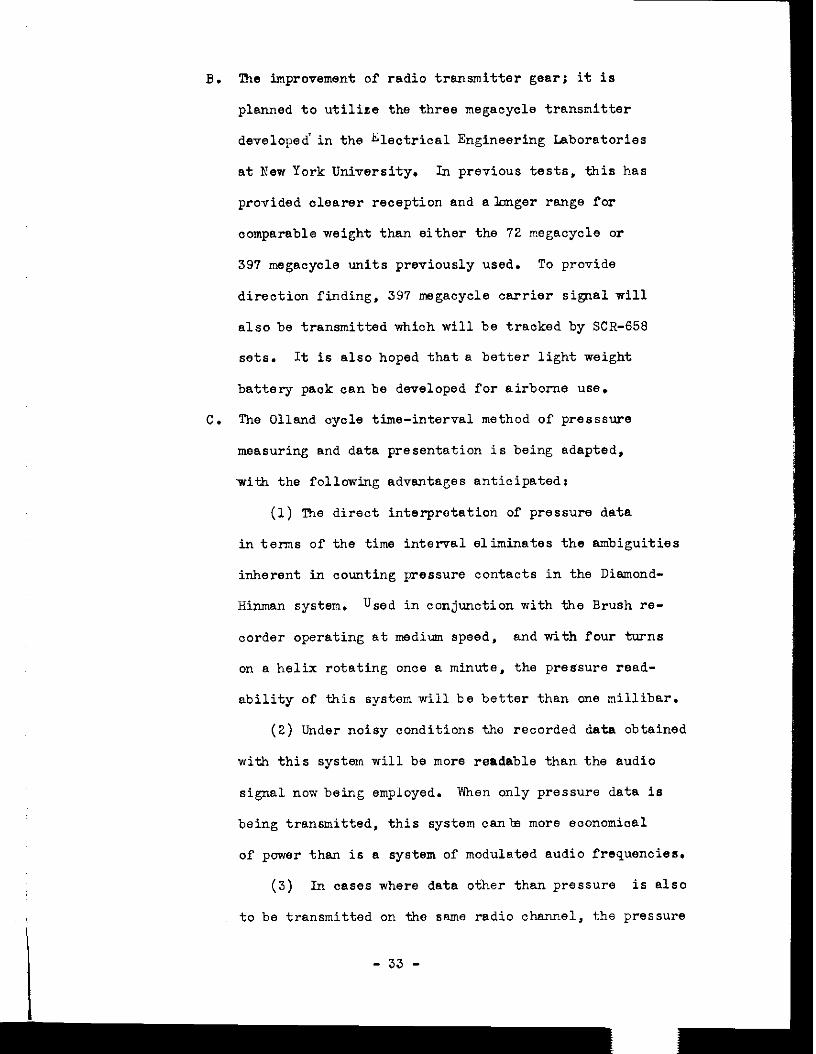
B. The improvement of radio transmitter gear; it is
planned to utilize the three megacycle transmitter
developed in the Electrical Engineering Laboratories
at K'ew York University. In previous tests, this has
provided clearer reception and alonger range for
comparable weight than either the 72 rregacycle or
397 megacycle units previously used. To provide
direction finding. 397 megacycle carrier signal will
also be transmitted which will be tracked by SC%658
sets. It is also hoped that a better light weight
battery pack can be developed for airborne use.
C. The Olland cycle time-interval method of presssure
measuring and data presentation is being adapted,
with the following advantages anticipated:
(1) The direct interpretation of pressure data
in terms of the time interval eliminates the ambiguities
inherent in counting pressure contacts in the Diamond-
Himnan system. Used in conjunction with the Brush re-
corder operating at medium speed. and with four turns
on a helix rotating once a minute, the pressure read-
ability of this system will be better than one millibar.
(2) Under noisy conditions the recorded data obtained
with this system will be more readable than the audio
signal now being employed. When only pressure data is
being transnitted, this system can& more economical
of power than is a system of modulated audio frequencies.
(3) In ceses where data other than pressure is also
to be transmitted on the same radio channel, the pressure
- 33 -
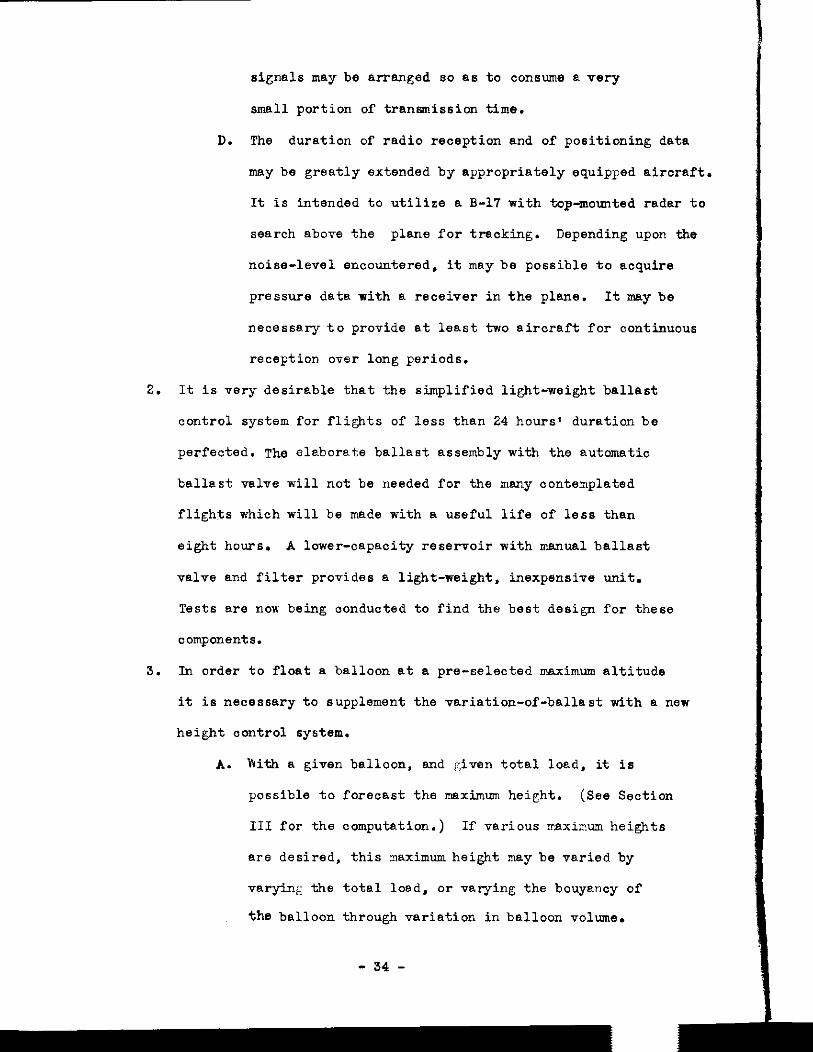
2.
signals may be arranged so as to consume a very
small portion of tranwission time.
D. The duration of radio reception and of positioning data
may be greatly extended by appropriately equipped aircraft.
It is intended to utilize a B-17 with top-mounted radar,to
search above the plane for tracking. Depending upon the
noise-level encountered, it may be possible to acquire
pressure data with a receiver in the plane. It may be
necessary to provide at least two aircraft for continuous
reception over long periods.
It is very desirable that the simplified light-weight ballast
control system for flights of less than 24 hours' duration be
perfected. The eleborate ballast assembly with the automatic
ballast valve will not be needed for the many contemplated
flights which will be made with a useful life of less than
eight hours. A lower-capacity reservoir with manual ballast
valve and filter provides a light-weight, inexpensive unit.
Tests we nox being conducted to find the best design for these
components.
3. In order to float a balloon at a pre-selected maximum altitude
it is necessary to supplement the variation-of-ballast with a new
height control system.
A. Yrith a given balloon, and given total load, it is
possible to forecast the maximum height. (See Section
III for the computation.) If various rraximum heights
are desired. this maximum height may be varied by
varying the total load, or varying the bouyancy of
the balloon through variation in balloon volume.
- 34 -
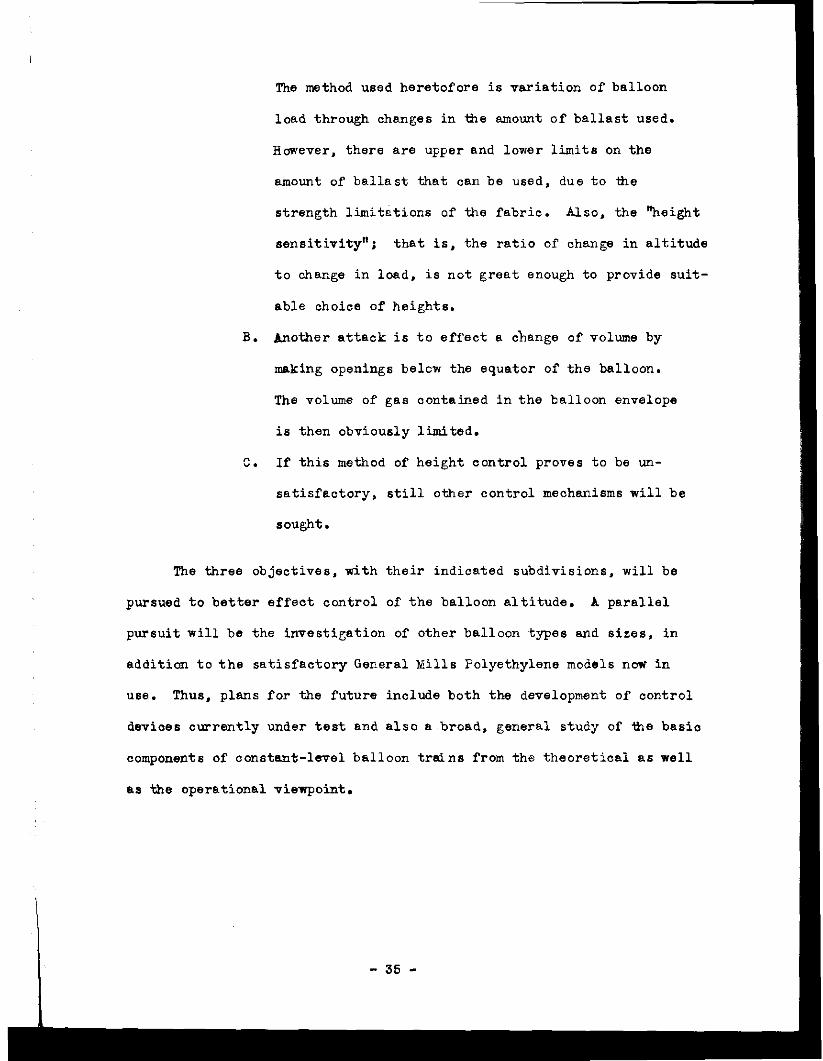
The method used heretofore is variation of balloon
load through changes in tie amount of ballast used.
Hmever, there are upper and lower limits on the
amount of ballast that cm be used, due to the
strength limitetions of the fabric. Also, the "height
sensitivity"; that is, the ratio of change in altitude
to change in load, is not great enough to provide suit-
able choice of heights.
B. Another attack is to effect B change of volume by
making openings belcw the equator of the balloon.
The volume of gas contained in the balloon envelope
is then obviously limited.
c. If this method of height control proves to be un-
satisfactory, still other control mechanisms will be
sought.
Tim three objectives, with their indicated subdivisions, will be
pursued to better effect control of the balloon altitude. A parallel
pursuit will be the investigation of other balloon ,types and sizes. in
addition to the satisfactory General Kills Polyethylene models now in
use. Thus, plans for the future include both the development of oontrol
devices currently under test and also a~broad, general study of the basic
components of constant-level balloon trains from the theoreticai as well
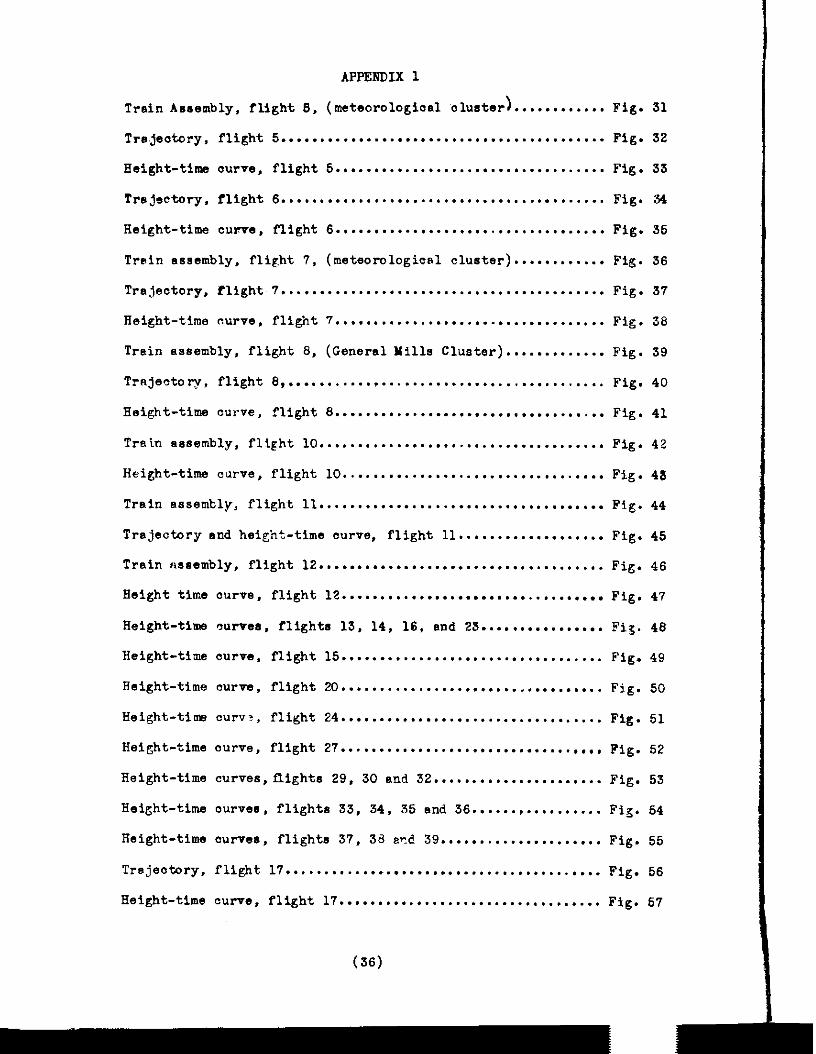
APPENDIX I
Train Assembly, fIlght 6, (meteorologloal aluster ) ............ Fig. 31
Trs,jeatcry, flight 5 .......................................... Fig. 32
Height-time ourve, flight 6 ................................... Fig. 33
Trejectory, flight 6 .......................................... Fig. 34
Height-time curve, flight 6 ................................... Fig. 36
Tr~ln assembly, flight 7, (meteorological cluster) ............ Fig. 36
Trajectory, flight 7 .......................................... Fig. 37
Height-time ourve. flight 7 ................................... Fig. 36
Train assembly, flight 6. (General Hills Cluster) ............. Fig. 39
Trnjeltory, flight 6 .......................................... Fig. 40
Height-time curve, flight 6 ................................... Fig. 41
Train sssembly. flight 10 ..................................... Fig. 42
Height-time curve, flight 10 .................................. Fig. 43
Train essently, flight 11 ..................................... Fig. 44
Trajectory and height-time curve, flight ll................... Fig. 46
Train rtssembly, flight 12 ..................................... Fig. 46
Height time ourve, flight 12 .................................. Fig. 47
Height-time ourtea, flights 13, 14, 16, end 23 ................ Fig. 46
Height-tl;ne curve, flight 15 .................................. Fig. 49
Height-time curve. flight 20 .................................. Fig. 60
Eelght-tlnrt cur"?, flight 24 .................................. Fig. 51
Height-time ourve, flight 27 ............................ ..'.... Fig. 52
Height-time curves, fllghta 29. 30 and 32 ...................... Fig. 53
Iielght-time ourvea, flights 33, 34. 35 end 36 ................. Fig. 54
Height-time curves, flights 37, 38 s?d 39 ..................... Fig. 55
Trajeotory, flight I7 ......................................... Fig. 56
Height-time curve, flight 17 .................................. Fig. 67
(36)
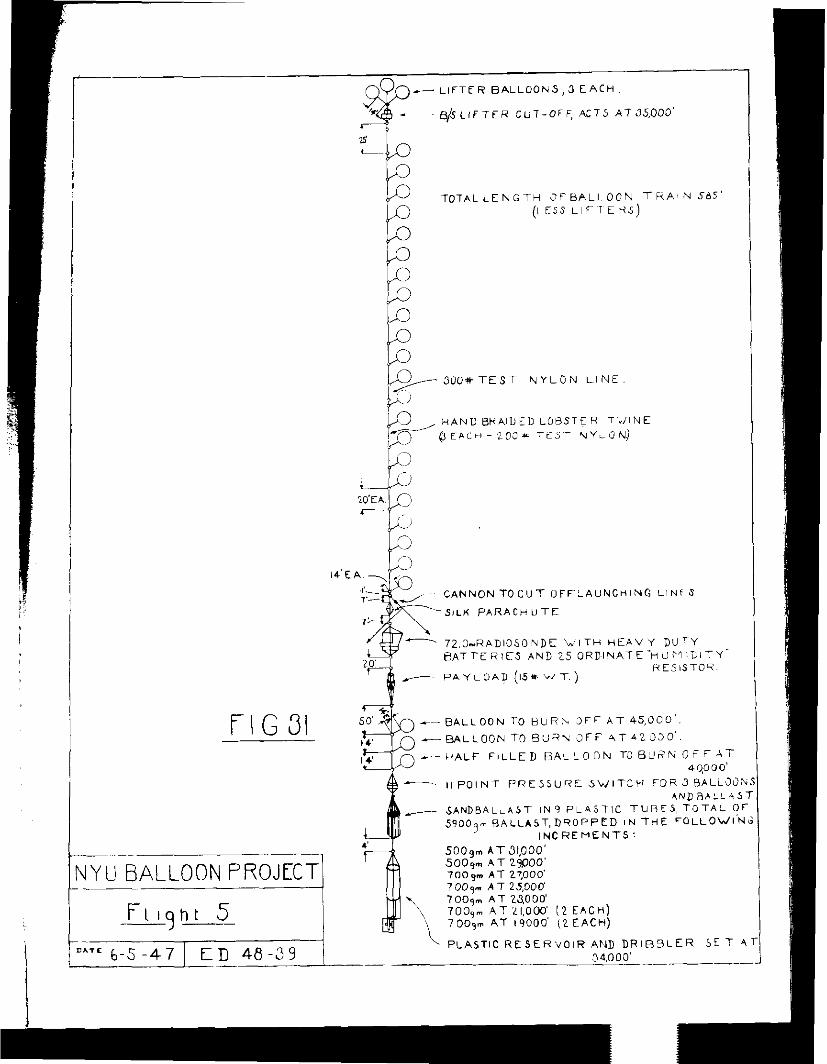
300#TEST NYLON LINE
CANNON TOCUT OFFLAUNCHING LINF 8
SALK PARACH “TE
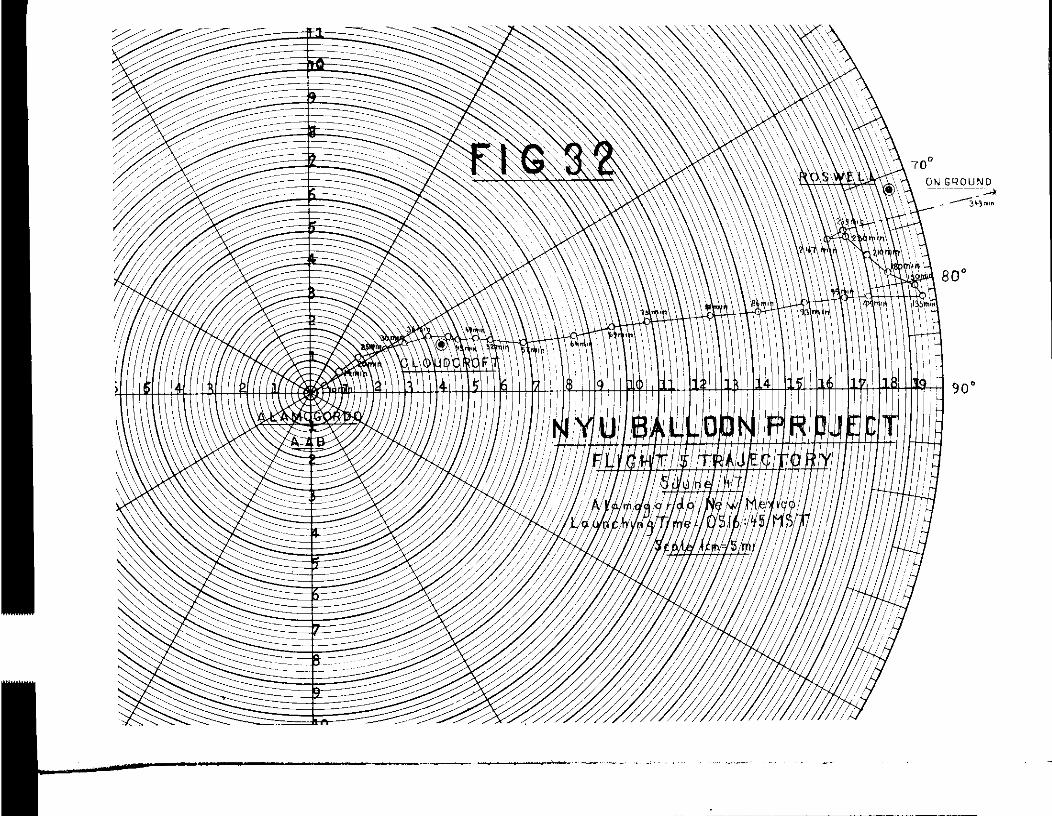
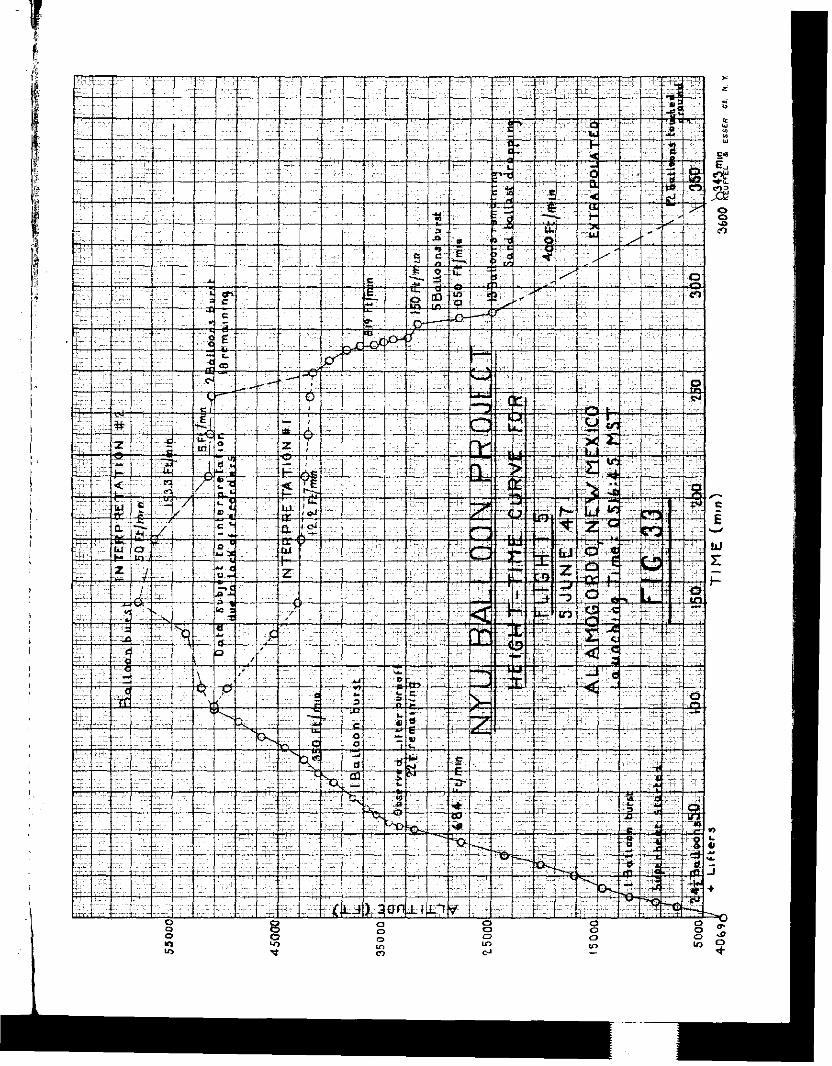
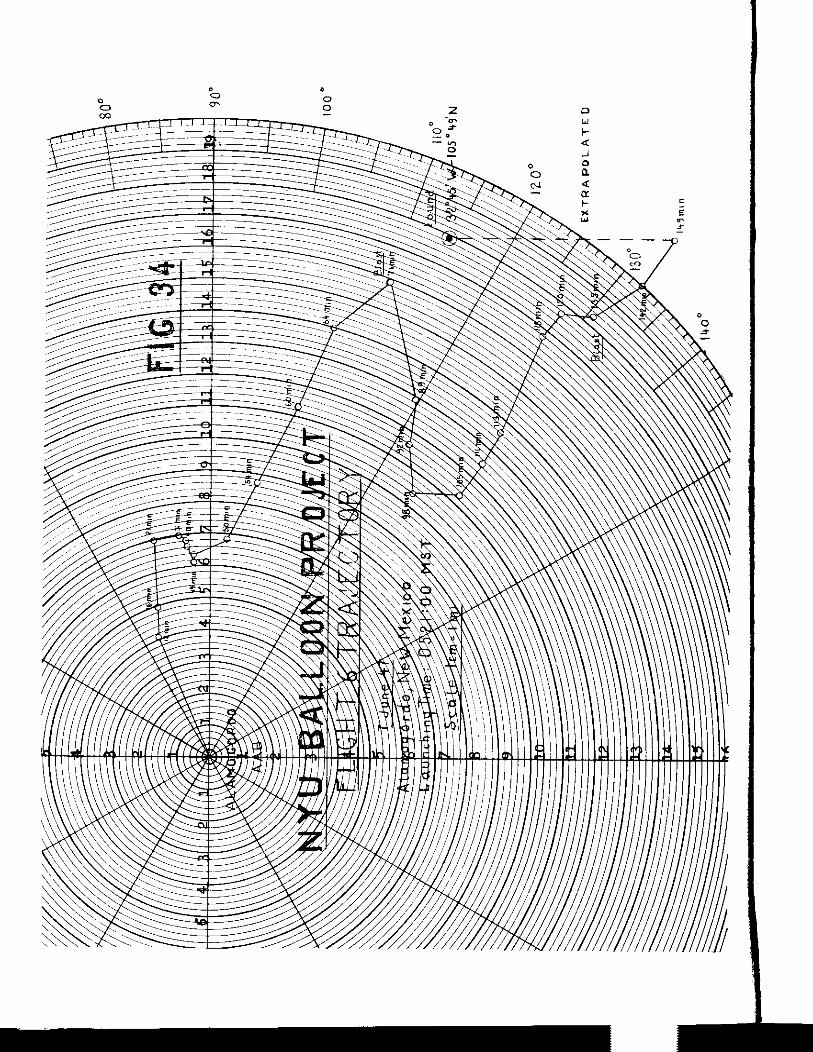
T- LI tter assembLy-4 balloona 60, ,nfLated to 3000gm.lIft.
7.5’
j 12e~. batLoons inftctted to 900gm.
w,4ea. balloona \ nftsted to 2l00gm.l~tt.
70' 6’ Payload ,n picture frame mount andt ransmltter. (h3 "wt.)
15'
74.5 mc Radlosonde.Heavy duty
Batteries ,n bLacK bowi wrapped
p~olyethy Lene.
3oOgm- 34000 400gm- 29,700 BOCgm- 25800' 200 9m- 33,000 400ym-29,000' $OOym -25,200' 20gln: - 32,000' 60Dgm-2E,GCO' SOOgm- 24,500'
/ 3003m- 31, 000' 600ym-27,400: IOOOgm- 23,800' 1 WJogm- 30,500 600~,m-26,600 1000 m 23,100' IL.-.--- l6oo:m- 22,500'
FIG 36
NYU BALLOON PROJEC
FLIGHT 7
D9te: 7-Z-47 ED-48-44
;T 1
0” -
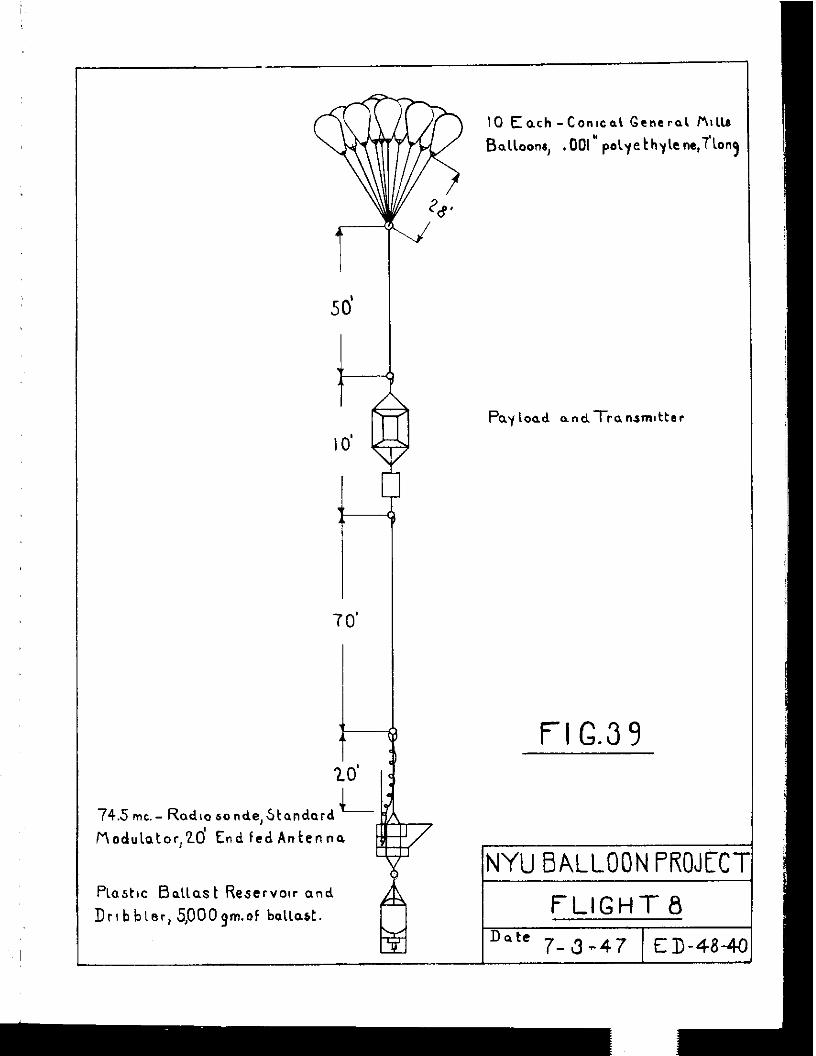
10 Each -Conical General P\~lls
Balloona, .OOl” palye k hylc ne,7’lon3
Payload andTransmttsr
74Smc.- Radlooonde,Standard
Modulotor,ZO’ End fed Antenna
Ptastlc Batlas t Reservoir and
DrIbbier, 5,000gm.of ballast.
FI G.3 9
INYU BALLOON PROJIFC1
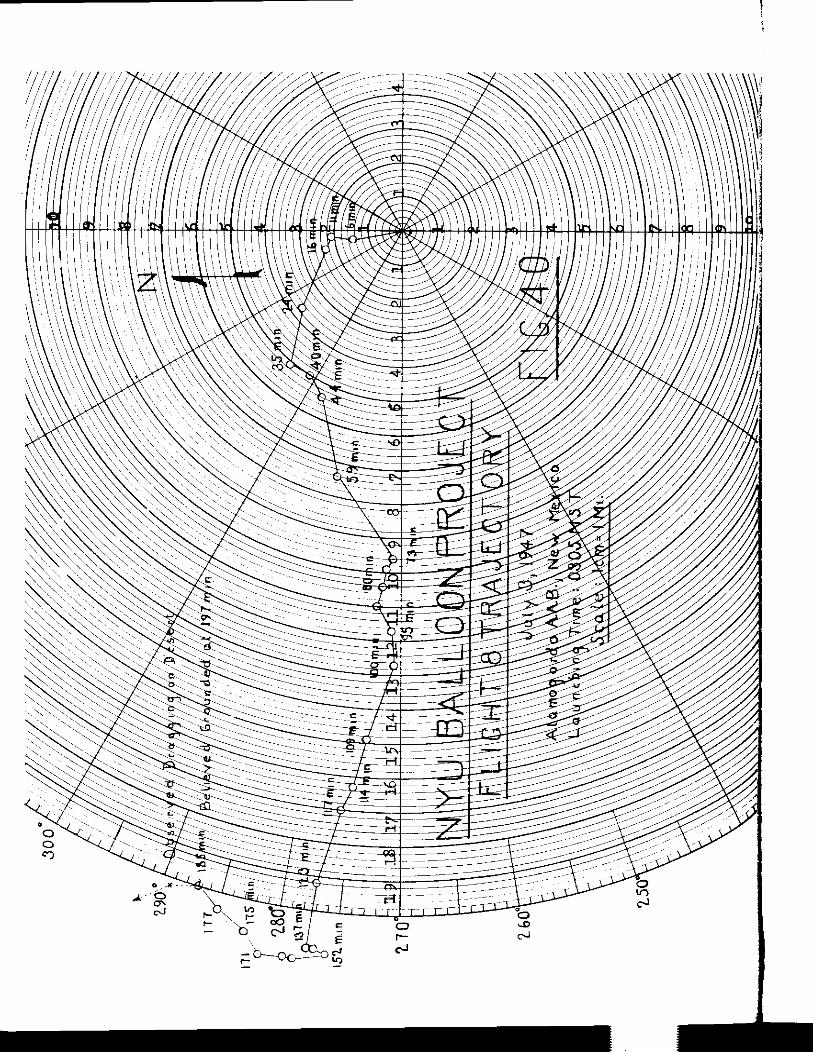
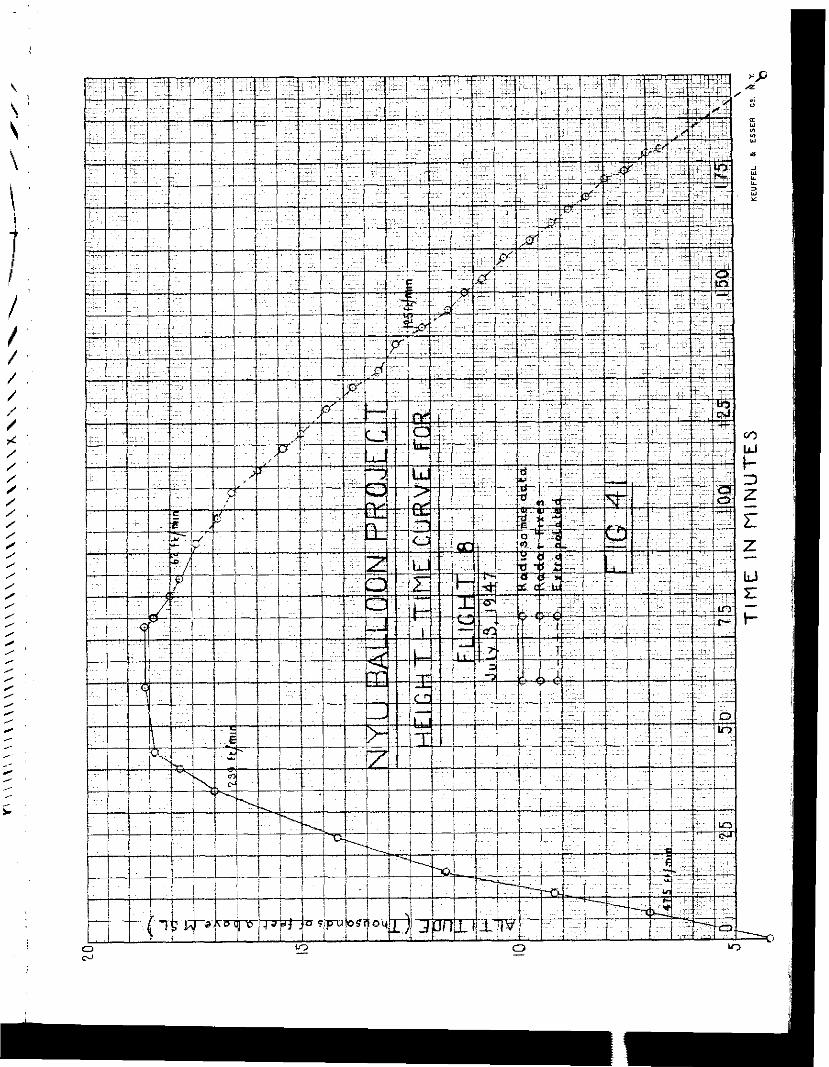
/ / I i i i I
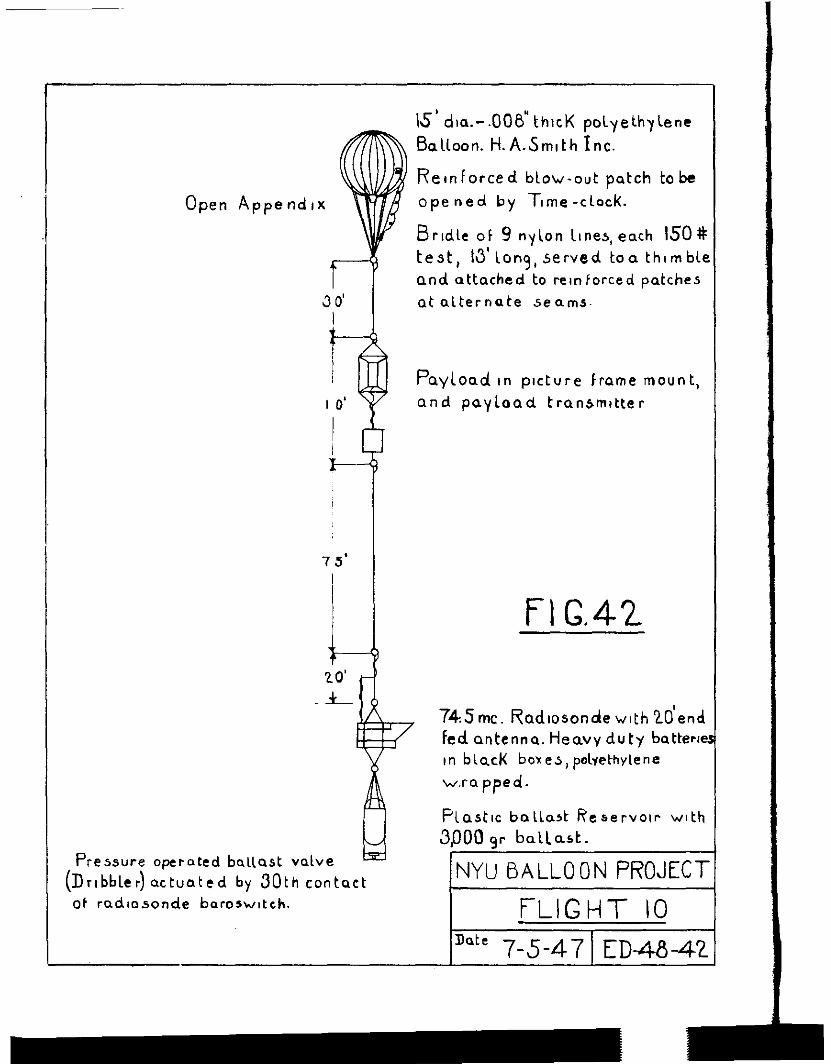
15’ dla .-,008” thtcK polyethylene
Balloon. H.A.5mlth Inc.
Open Append 1
Reinforced blow-out patch tobc opened by Time -clock.
Bridle ot 9 nylon lines, each 150# test, 13’long, served toa thtmble
and attached to reinforced patches at alternate seams-
Payload In picture frame mount,
and payload transmitter
FI G.42
745mc. Radlosonde with ZO’end fed antenna. Heavy duty batterle in blacK boxes, pðylene
w.rapped.
Pressure operated ballast valve (Dribbler) actuated by 30th contact
of radlosonde baroswltch.
PLastx ballast Reservoir with 3,000 9~ ballast.
NYU BALLOON PROJECT
FLIGHT IO
Dote 7-5-471 ED-4842
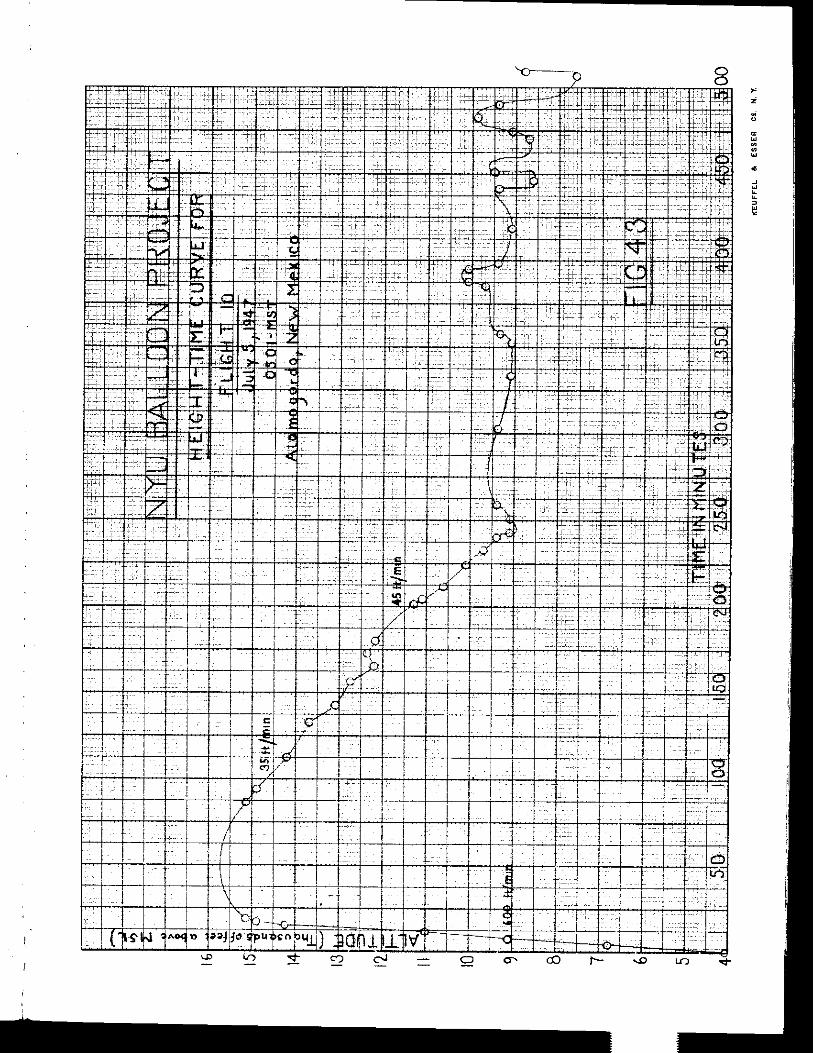
I
1.
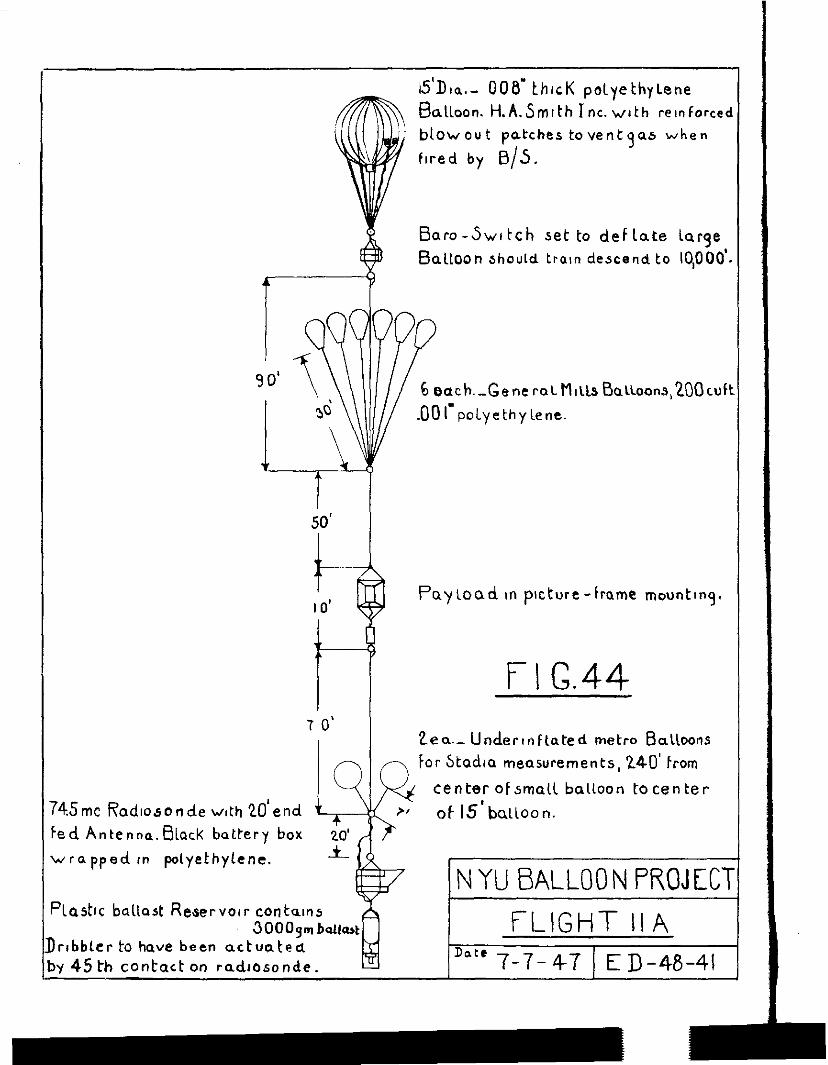
‘45mc Radlosonde with 20’end
.ed Antenna.BLack battery box
tea.- Underlnftated metro Balloons For Stadla measurements, 240’ from
center ofsmall balloon tocenter
of is’balloo n.
\ ~/rapped tn polyethylene.
f ‘tostlc ballast Reservoir contains
D 3OOOym baas
Ircbbler to have been actuated I2 my 45 th contact on radtosonde. .-
NYU BALLOON PROJKI FLIGHT II A
DatC 7-7-47 1 ED-48-41
F I G.44
15’Dm.- 008’thlcK polyethylene
B II a oon. H.A.Smlth Inc. wrth reInforced
blowout patches toventgas when
flred by 6/s.
Bare-SwI tch set to deflate large
BatLoon Jhould train descend to 10,000’.
6 each.-Gene ra~f’l~~& Bauoons,200cuf\
impoLyethylene.
Payload In picture-frame mountlny.
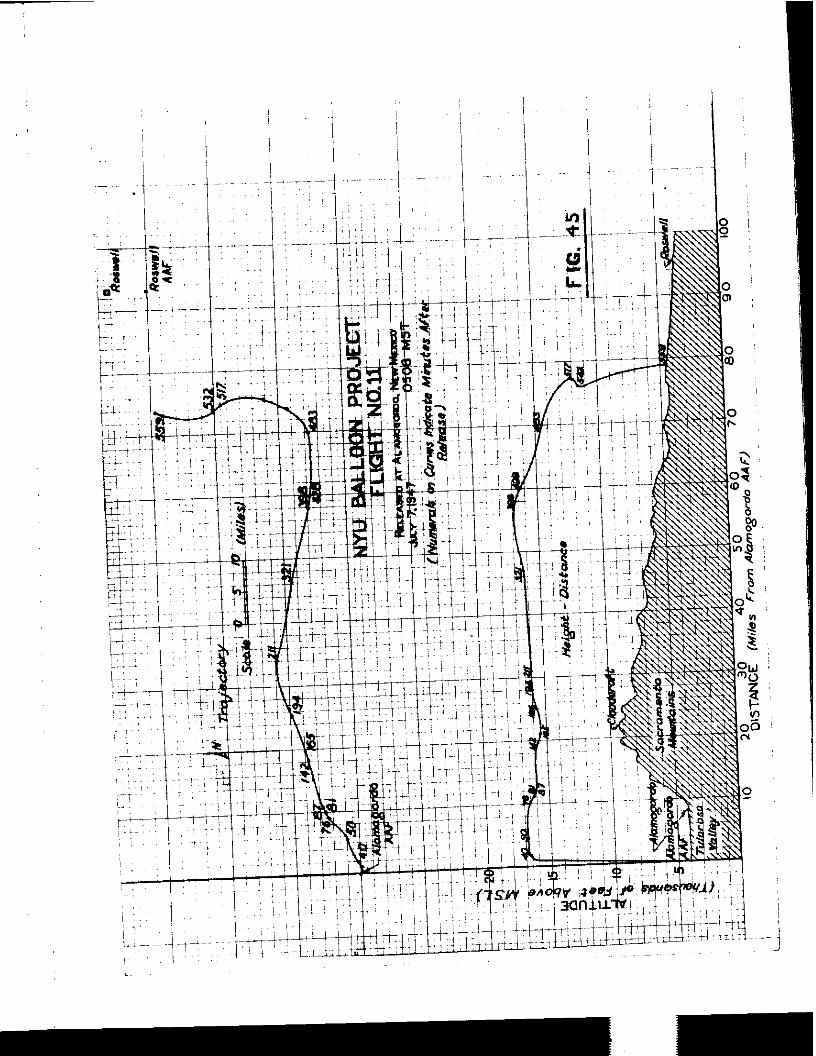
I
/
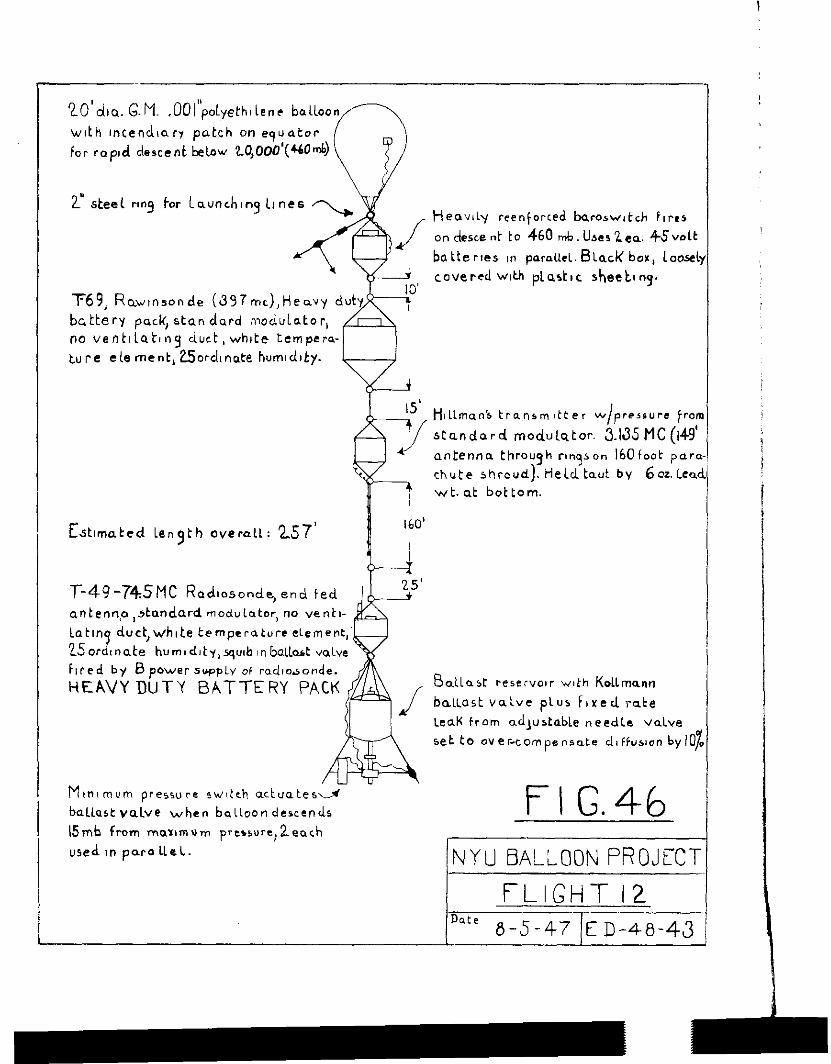
2O”dn. G.M. .0~&w+~th,lene balloon
wlkh Incendlarr patch on equator
for rapad descent below ?J,oo0’(4’~“b)
T-49~?+5MC Radlosonde, end ted antennp,standard modulator, no venta-
Latin duct white tempcraturcekmevt, 25orinat.i humldlty,squlbinbatLsbt valve fired by 0 power supply OF radtofionde.
HEAVY DUTY BATTERY PACK
D
2 steel nny for Lounchfny tines
T69, Raw,nsonde (337mc),He~vy dut battery pock, stan dcird modulator, no ventltatlng duct,whtte tempera- ture eLement,Z5ord1nate humldlty.
Heavit~ ccenforced baroswltch F,res
on desce nt to 460 mb. Uses 2ea. 45volt
batteries 10 paratkt.B~acK box, LOOS& covered wkh ptastlc st,eet,nq.
msn’s trcarlsmtter u4 ple5l”re I pm
standard moduistor. 3.135MC(l49’ antenna through rlngaon 160foot para chute shroud). Held taut by 602.~~~~ wt. at bottom.
Estimated length ovcratL: 257'
8allo.st reservovr wth Kollmonn
baLLost valve plus flued rate
LeaK from adiustable needle valve
set to over-compensate daffusaon bylO?
FIG.46 NYU BALLOON PROJECT
FLIGHT 12 Date s-5-47.7E D-40-43
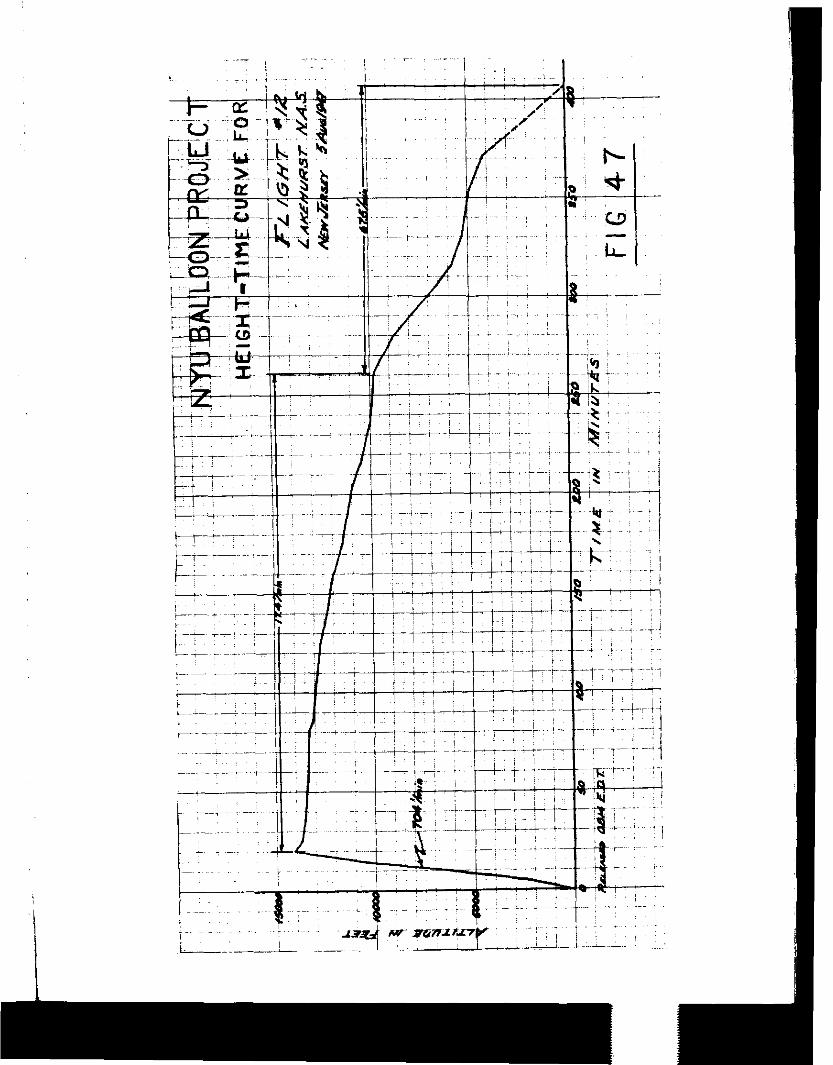
- - -
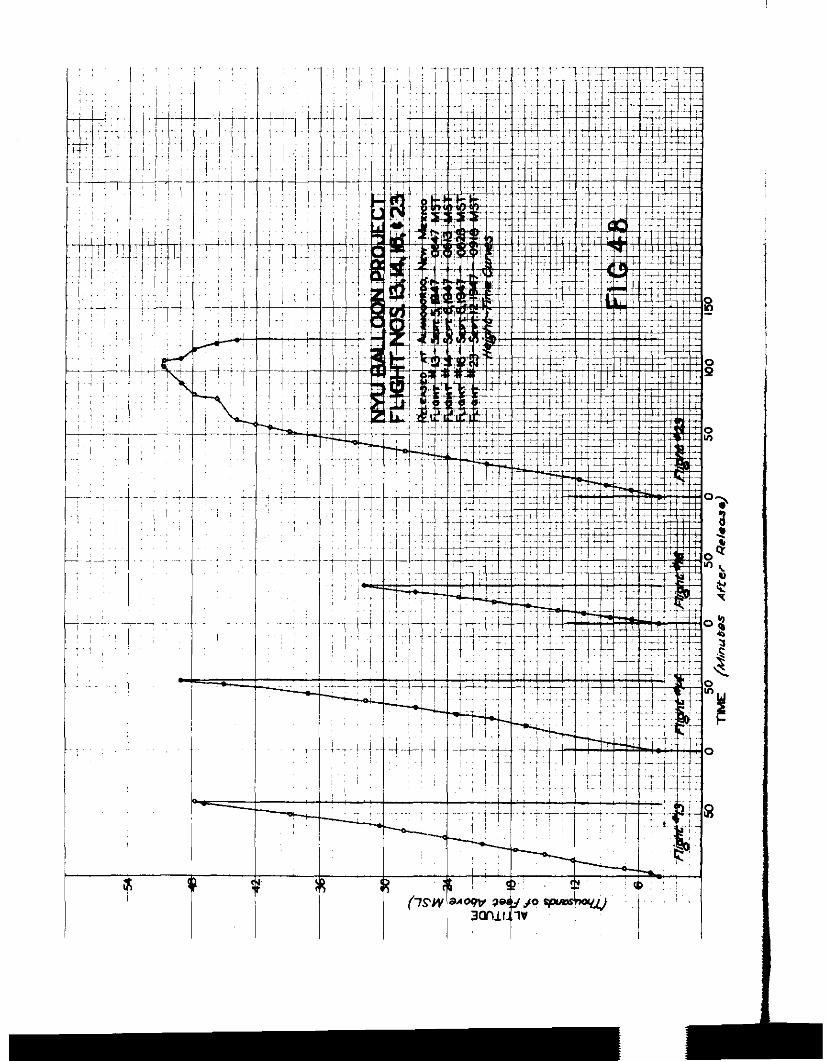
l-
+
1 P
---w
1’
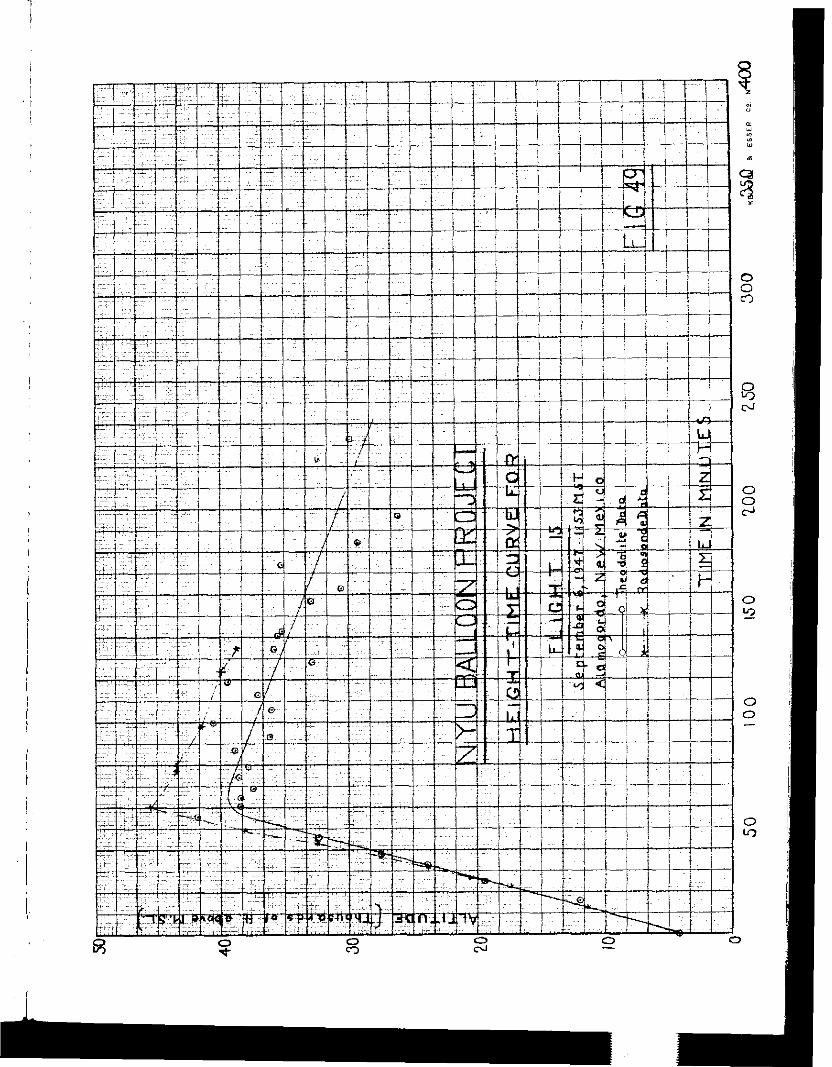
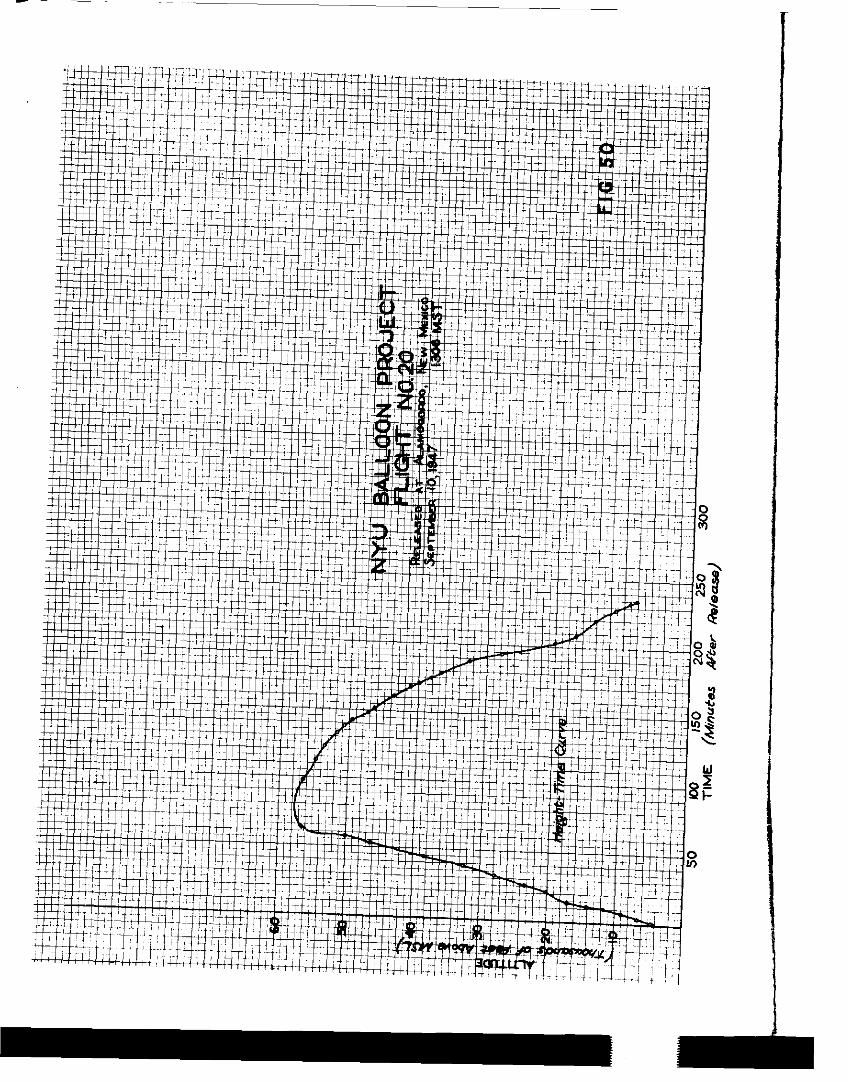
i
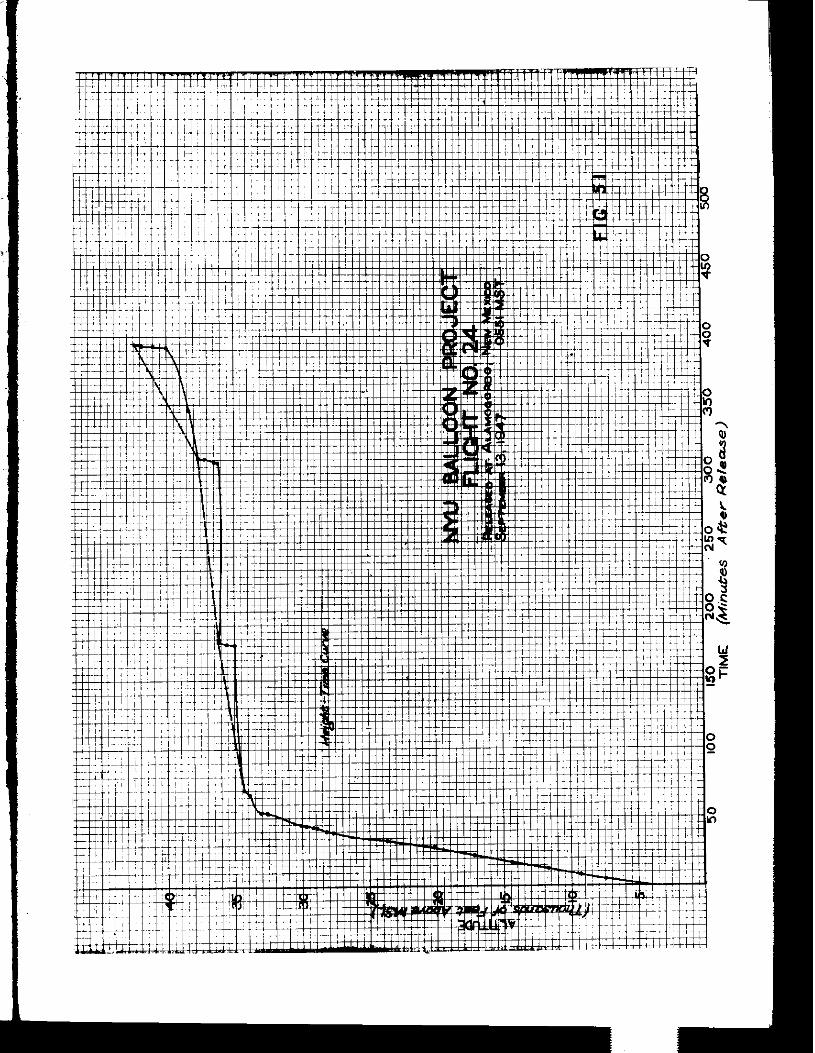
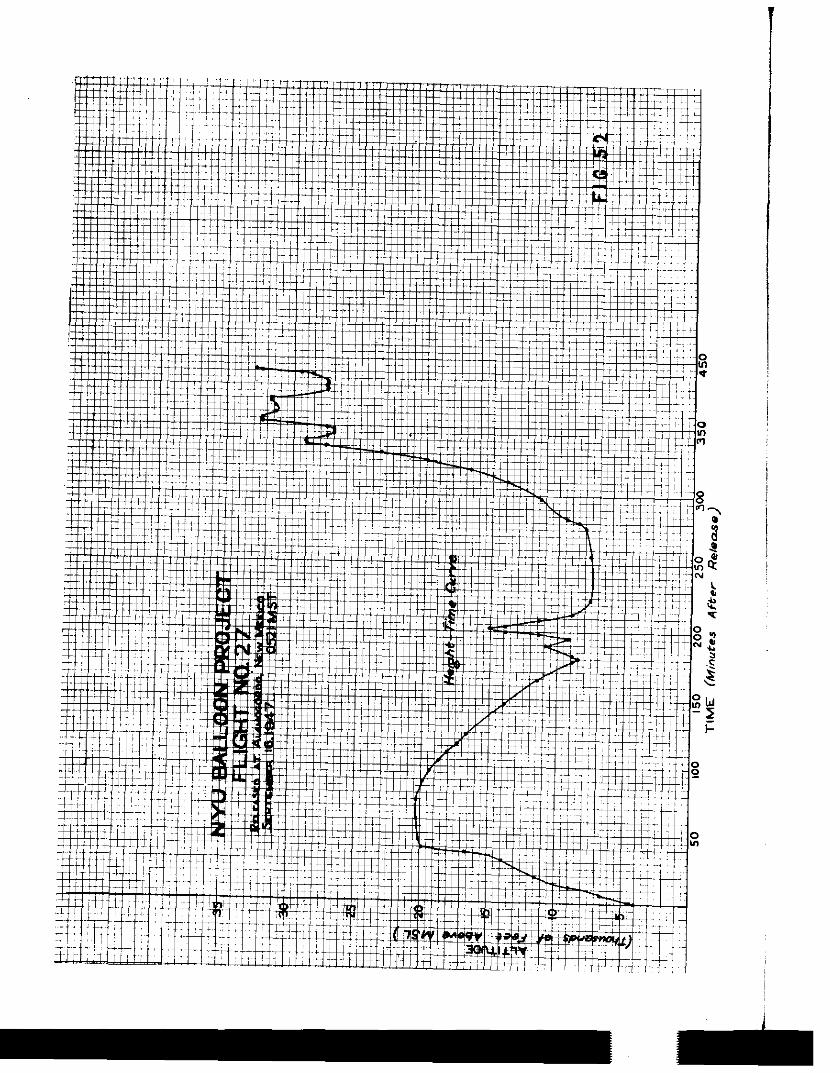
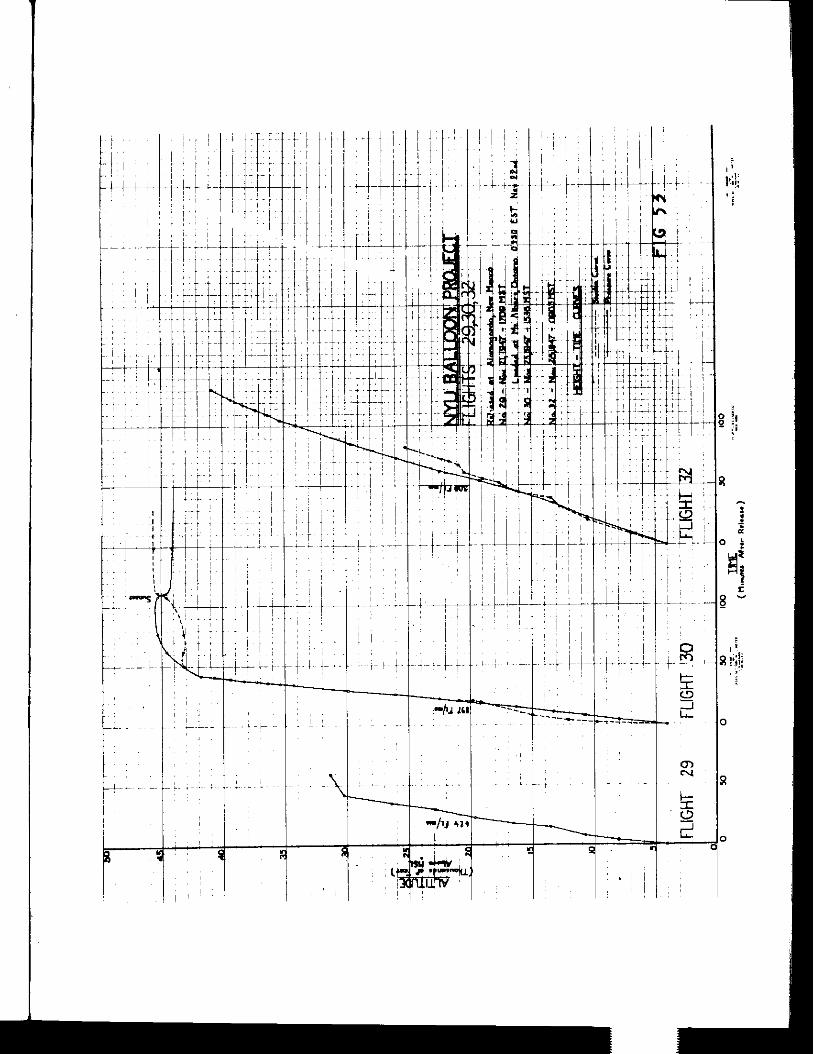
i
t
6
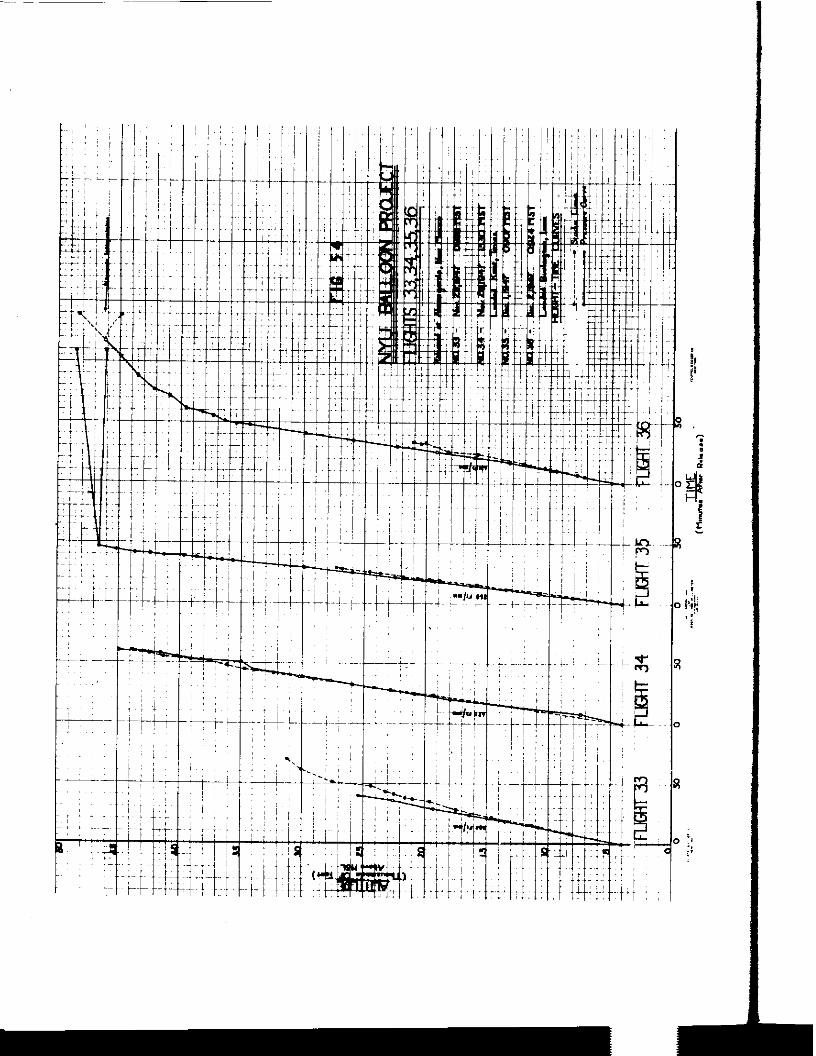
-t .I:
t t:
t
I
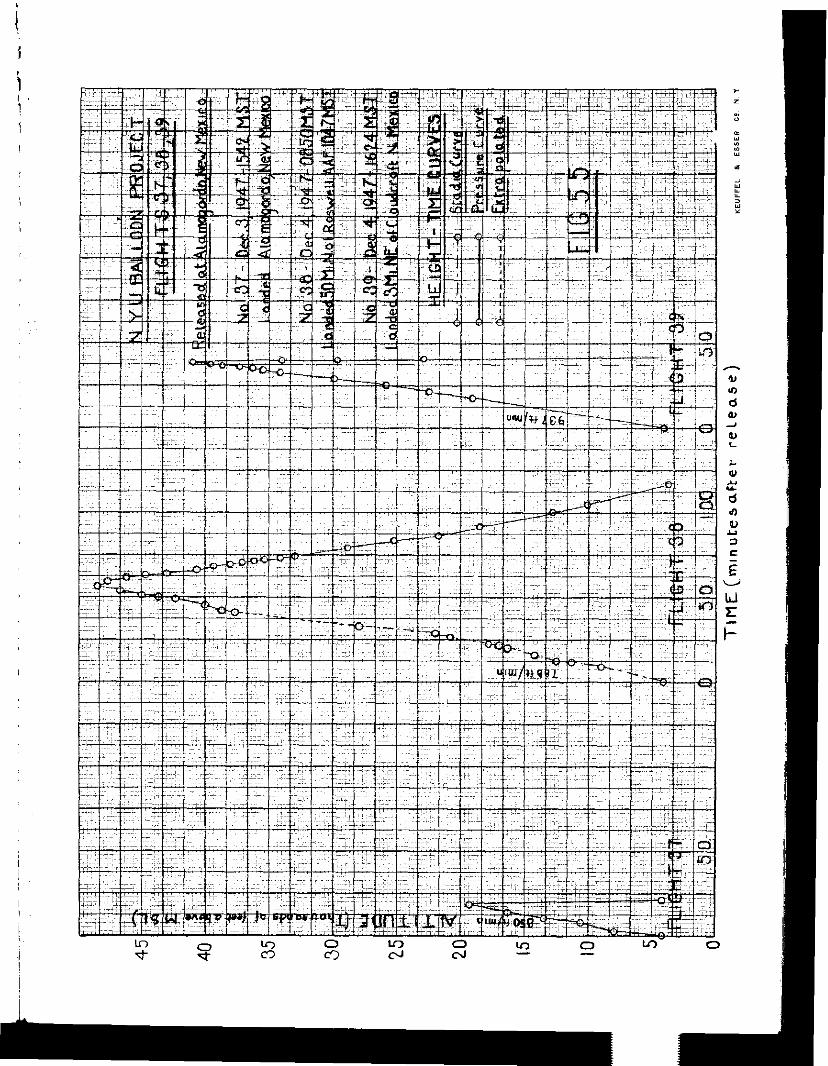
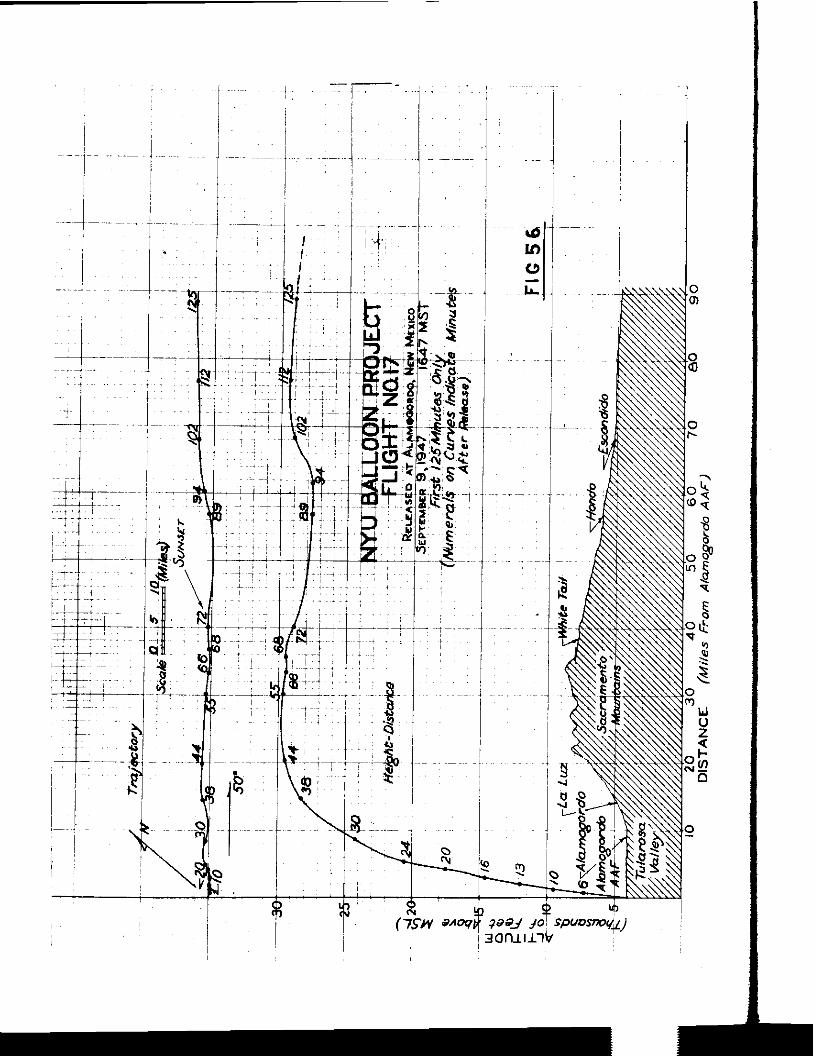
-
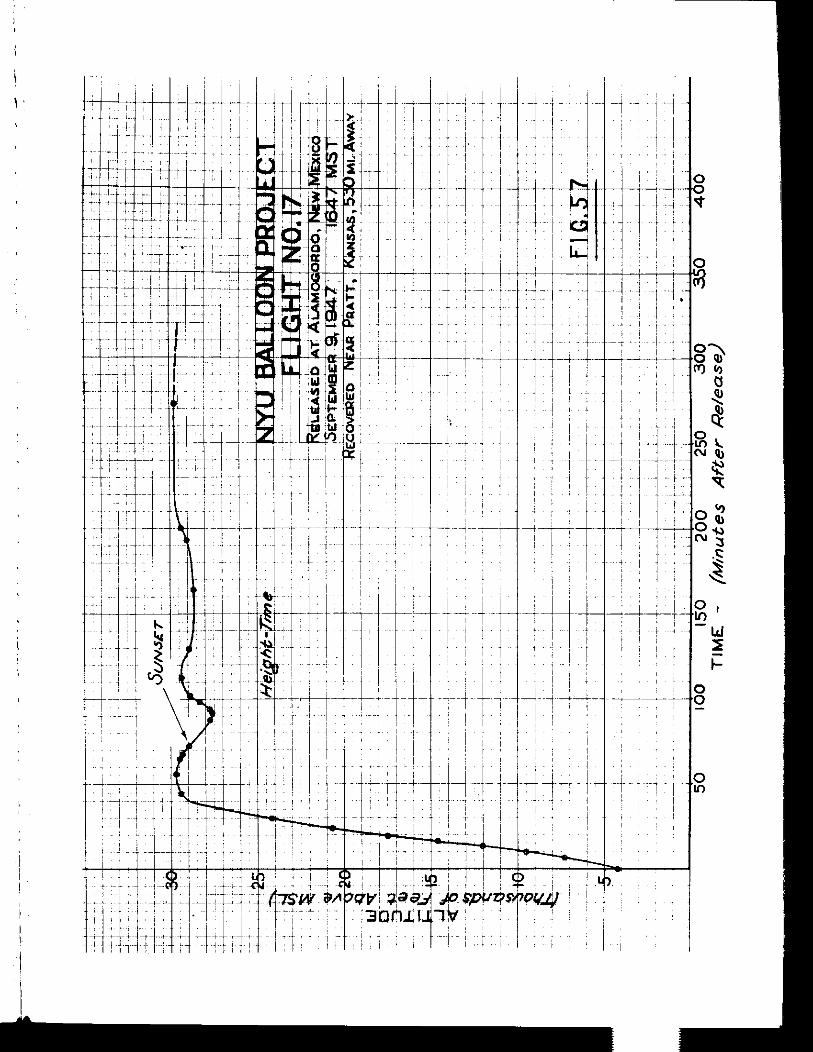
-
-.-
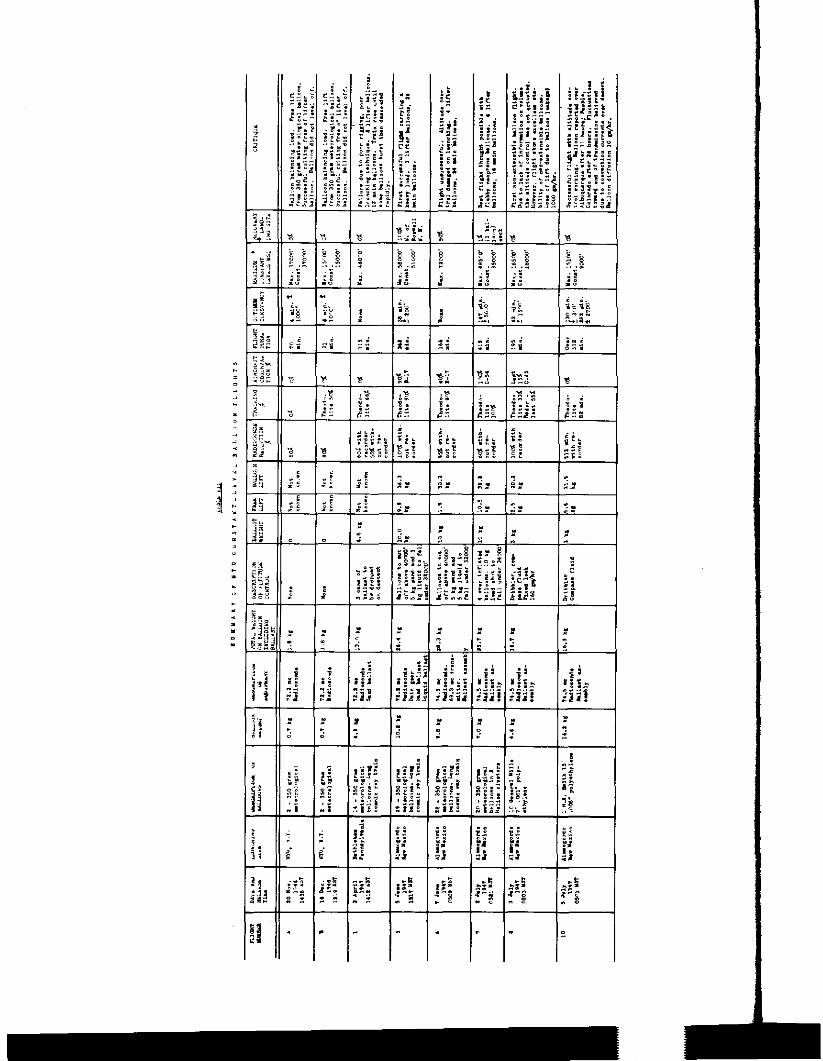
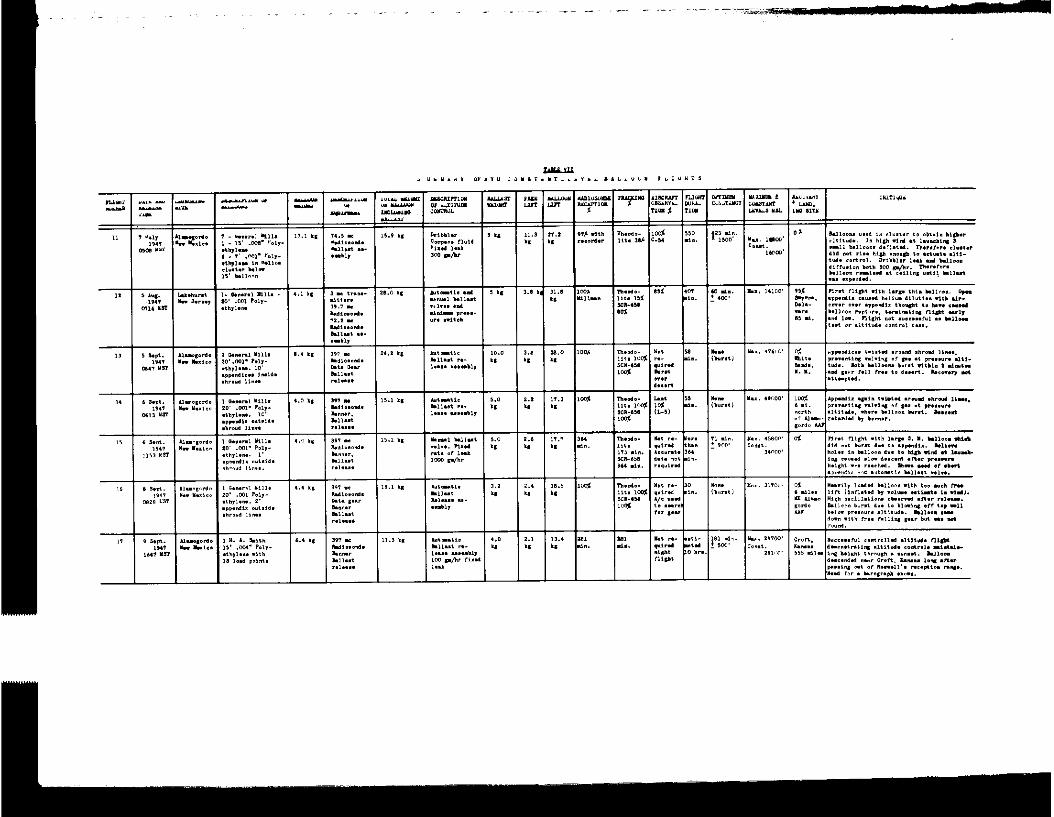
-I-
‘:
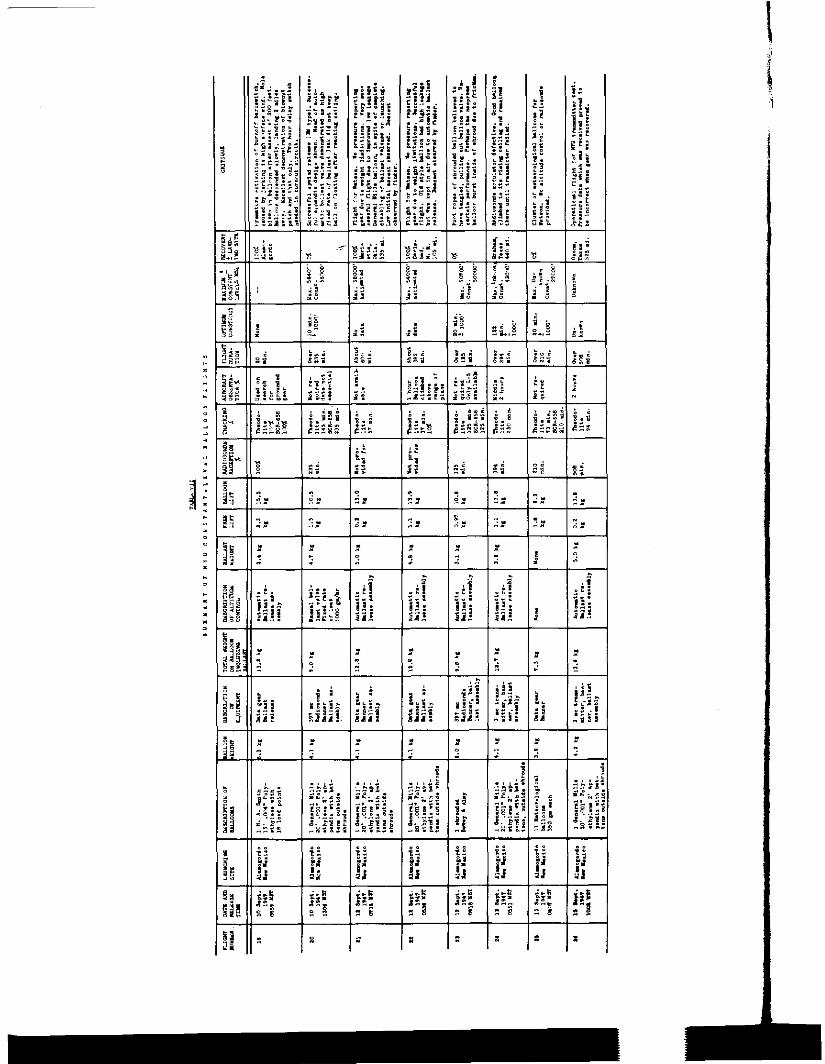
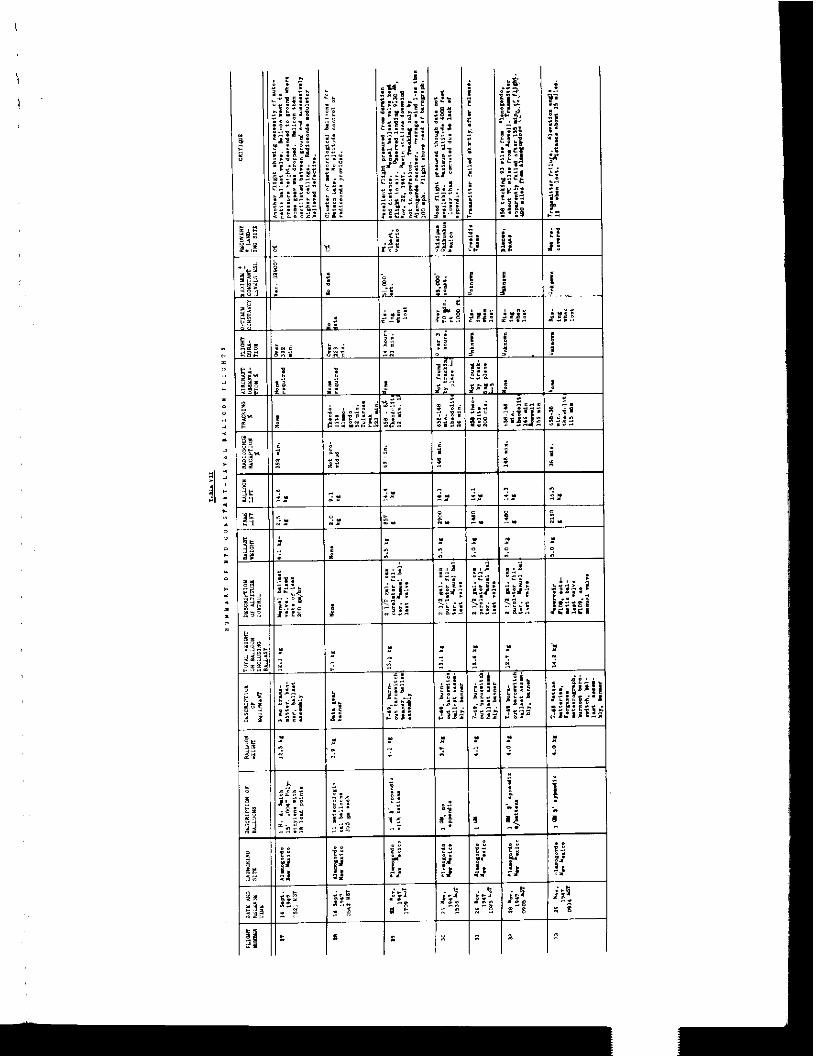
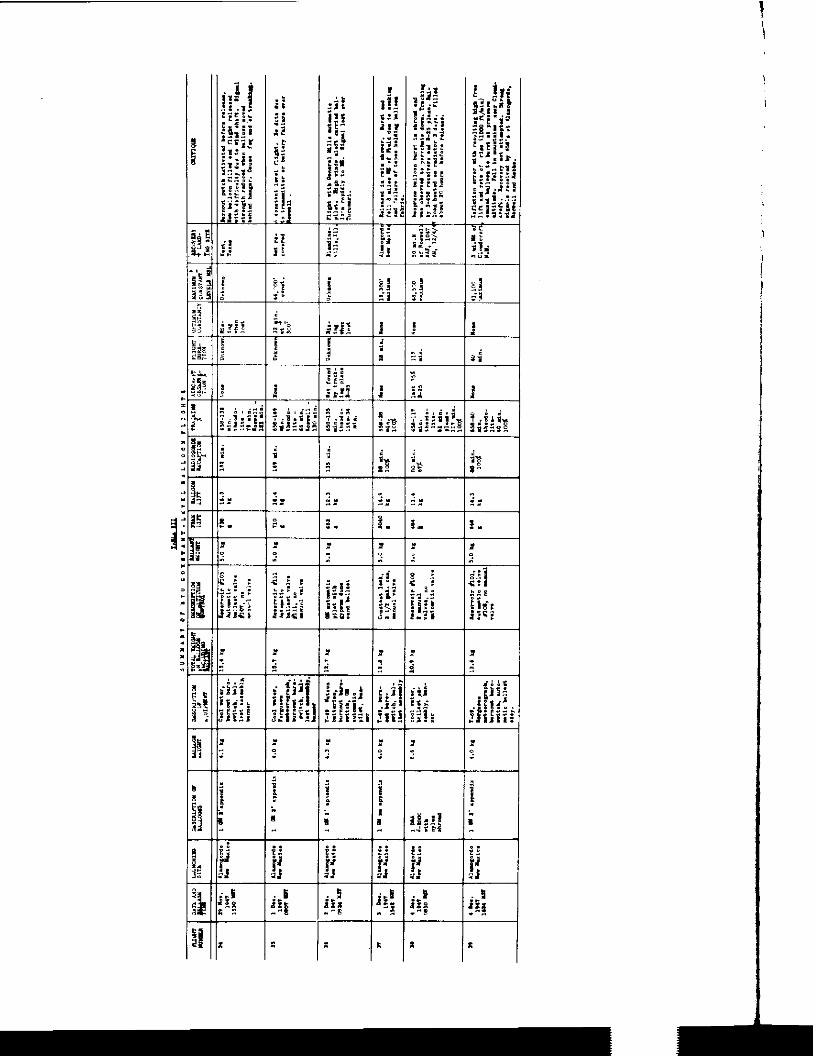
i
3.
2.
3.
4.
5.
APPENDIX2
Correspondence
I
= Abstract from: Air Coordinating Cmittee, New York Sub- committee on Airspace. Rules of the Air and Air Traffic Control. Subject: Approval to release free balloons from Allentown. Pa. and Lakehurst. N. J . . . . . . . . . . . . . . . . . . . . . . . . . . . . . . . . . . . . . . . . . . . . . . . . . . . . . ...38
Letter to the Secretary, New York Subcommittee on Airspace. Subject: Request for interpretation of agreement on conditions of release of free balloons from Allentown, Pa. and Lakehurst, N.J........41
Reply from the Secretary, New York Subcommittee on Airspace. Subject: Same 8s above . . . . . . . . . . . . . . . . . . . . . . . . . . . . . . . . . . . . . . . . . ...*... 42
Extract from: Air Coordinating Cmmittee, Fort Worth Regioml Airspace Subcommittee. Subject: Obstructions to 'air navigation . . . . . . . . . . . . . . . . . . . . . . . . . . . . ...43
Memorandum from the Chairman. Fort Worth Regional Airspace Sub- comdtte. Subject: Procedure for Release of free balloons in the White Sands Danger Area . . . . . . . . . . . . . . . . . . . . . . . . . . . . . . . . . . . . . . . . . . . . . . . . . . . ...45
(37)
COPY
Abstract frarm:
AIR CCXIRDINATING COWITTEE NEW YORK SUBCO~ITTEE ON AIRSPACE
RULES OF ME AIR AND AIR TRAFFIC COFTROL 385 Medison Avenue New York 17. N. Y.
20 W.roh 1947
N. Y. Meeting No. 12
1. The Secretary of the Subcommittee presented a request from the War Department member in behalf of New York University for approval to release free halloons from Allentown, Pa. and Lakehurst. 8. J.
DISCUSSIrX
2. The subject project is broken down into two phases 86 described below:
A. PHASE I.
(1) The type balloon. to be used in this phase of the project will be 6 ft. in diameter, hydrogen filled, encompassed by B nylon shroud with black and white panels 24" wide. Radio instruments weighing approxi- mately 3 lbs. will be suspended approximately 50 ft. below the balloon and equipped with parachute device so that upon separation from the balloon, the attached equipment will float dovm towards the earth rather than become a freely falling body.
(2) It is anticipated that two flights will be required in this phase of operation, the release to be made during weather conditions in which the sky is free of clouds and the visibility et least three miles at all altitudes up to 20.000 feet.. within afourhour cruising radius from Allentown. Pa.
(3
(4
The balloon, during these flights, shall be convoyed by suitable aircraft to maintain air-ground communica- tions on the balloon trajectory and equipped to effect destruction of the balloon et the termination of four hours flight or at such time that the balloon may become hazardous either to aircraft flight operations or the persons or property of others or, the surface.
New York University will file B Notice to Airmen at least twelve (12)hours in advance of balloon release and B second notice will be filed at the time of release with the Allentown. Pa. Airvmys Communications Station.
B. FRASE II.
(1)
(2
(3
(4)
(5)
(6)
The type balloon to be used in this phase of the project will be a 15 to 40 ft. diameter plastic balloon. hydrogen filled. Radio equi&nnent weighing approximately 25 lbs., will be suspended approximately 100 ft. below the balloon. 3he balloon till be towed to high altitude. levels (above 20,000 feet) by three auxilliary lifting balloons fastened together with a 4 lb. weight. All equipment attached to the balloon willbs equipped with parachute device so that upon separatior. from the balloon, the attached equipment will float down towards the earth rather than become a freely falling body. upon attaining the desired altitude, the auxilliary lifting balloons will be released from the bmin balloon.
It is anticipated that a maximum of ten flights will be required in this phase of operation, 2 to 5 releases to be made from Allentown, Pa. and 2 to 5 releases tobe made from Lakehurst, N. J. Release will be made during weather conditions in which the sky is free of clouds and the visibility at least three miles at all altitudes up to 20,000 feet.
lhe racge of flight during this phase of operation will be between 30,000 and 60,000 feet. A period of six hours will be the maximum duration of flight.
E'ew York University will provide an operator for tracking of the balloon during period of flight and will furnish information on its position to the N.Y. Air Traffic Control Center during period of flight.
New York University will file a Notice to Airmen at least twelve (12) hours in advance of balloon release and a second notice will be filed at time of release with either the Allentcvm, Pa. or Lakehurst. N.J. Ccnmmica- ticns stations.
Destruction of the balloon will be predetermined to be effected over mater where hazards are not present. .Aerial oonvcy will not be effected durinE this phase of operation inasmuch as balloon flights will be conducted in excess of 20.000 feet.
3. The War Department member requests that balloon operations along the lines of Phase II be presented to the Washington Subcommittee for clearance with all other Regional Airspace Subcommittees. in consideration of Vvar Department plans to continue the Phe'se 11 type of operation from White Sands, New Mexico, upon completion of the 12 proposed releases described herein. Ihe type of balloon releases proposed cut of Vvhite Sands, N. Hex., will involve flight through other regions.
!
RECOMMFJDED ACTION
4. That the release of free balloons by New York University as described above in Paragraph Z-A (Phase I), Subparagraphs (L) - (4) inclusive, be approved.
5. '&at the release of free balloons by New York University a8 described above in Paragraph 2-B (Phase II). Subparagraphs (1) - (6) inclusive, be approved.
6. lhat the hashington Airspaoe Subcommittee present the Phase II operation to other Regional Airspace Subcommittees for clearance, in view of War Department plans to continue the Phase II type of operation from vvhite Sands, New Mexico.
(40)
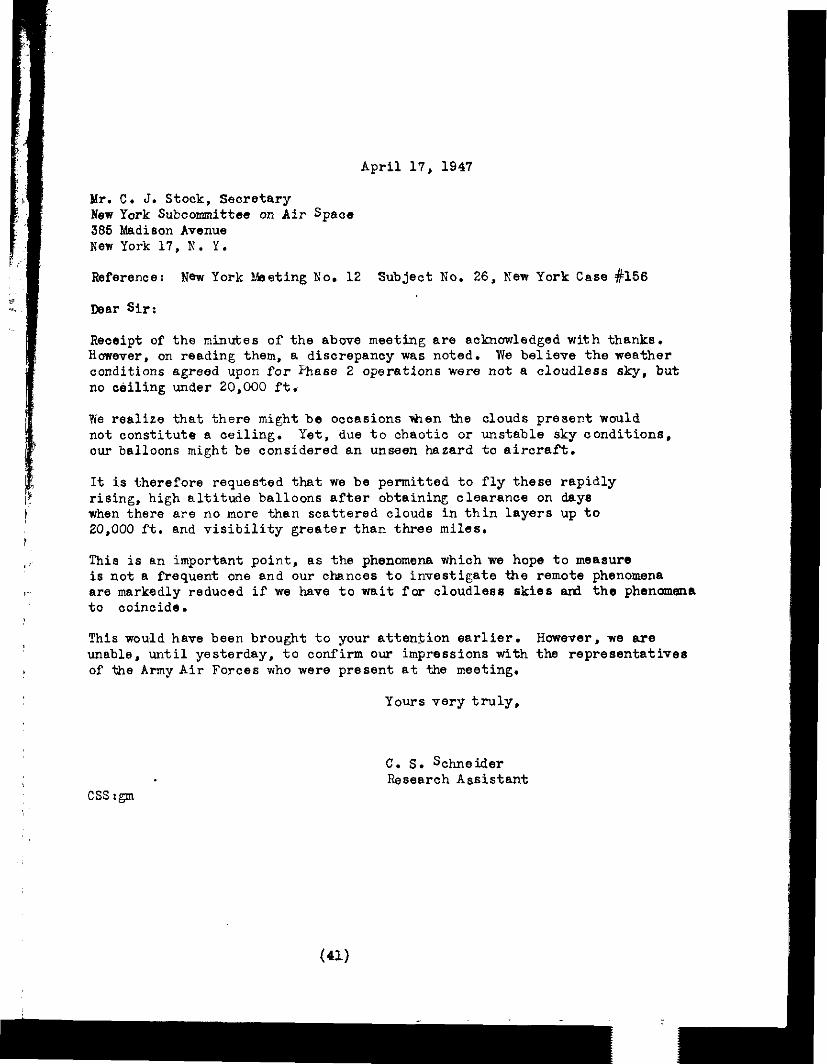
April 17, 1947
Mr. C. J. Stock, Secretary New York Subcommittee on Air Space 365 Madison Avenue New York 17, N. Y.
Reference: New York Meeting No. 12 Subject No. 26, New York Case #X6
Dear Sir:
Receipt of the minutes of the above meeting are acknowledged with thanks. Homwer, on reading them, a discrepancy was noted. We believe the weather conditions agreed upon for Ehase 2 operations were not B cloudless sky, but no okding under 20,000 ft.
We realize that there might be occasions &en the clouds present would not constitute a ceiling. Yet, due to chaotic or unstable sky oonditions, our balloons might be considered an unseen hazard to aircraft.
It is therefore requested that we be permitted to fly these rapidly rising, high altitude balloons after obtaining clearance on days when there are no more than scattered clouds in thin layers up to 20,000 ft. and visibility greater than three miles.
Thia is an important point, as the phenomena which we hope to measure is not a frequent one and our chances to investigate the remote phenomena are markedly reduced if we have to wait for cloudless skies ti the phenomena to coincide.
This would have been brought to your attention earlier. However, we are unable. until yesterday, to confirm our impressions with the representatives of the Army Air Forces who were present at the meeting.
Yours very truly,
CSSIgP
C. S. Schneider Research Assistant
(41)
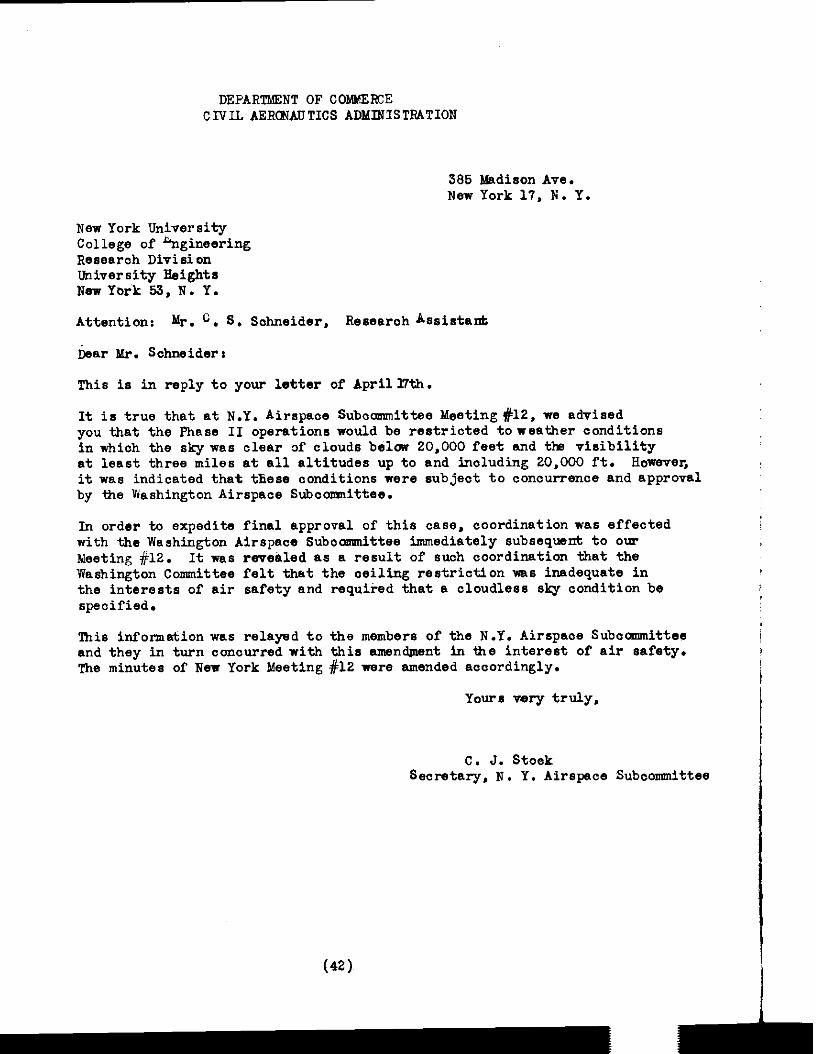
DEPARTMENT OF CObMERCE CIVIL AERONAUTICS ADMINISTRATION
385 h@dison Ave. New York 17. N. Y.
New York University College of %gineering Research Division University fIeights New York 53, N. Y.
Attention: Mr. c. S. Sohneidar, Research Assistant
l&r Mr. Sohneiderr
This is in reply to your letter of Aprill7th.
It is true that at N.Y. Airspace Subcanmittee Meeting#lZ. we advised you that the Phase II operations would be restricted toweather conditions in ruhich the sky was clear 3f clouds belcnr 20,000 feet and th, visibility at least three miles at all altitudes up to and including 2O,C00 ft. However, it was indicated that t6ese conditions were subject to concurrence and approval by the Washington Airspaoe Subcommittee.
In order to expedite final approval of this case, coordination was effected with the Washington Airspace Suboonnnittee immediately subsequent to OUT Nceting #lZ. It was r-e&led 88 a result of such coordination that the Washington Committee felt that the ceiling restriction ‘~88 inadequate in the interests of air safety end requiied that a cloudless sky condition be specified.
lhis information was relayed to the members of the N.Y. Airspace Subcommittee and they in turn concurred with this amendment in tie interest of air safety. The minutes of New York Meeting #12 were amended accordingly.
Yours very truly,
C. J. Stoek Secretary, N. Y. Airspace Suboonmittee
(42)
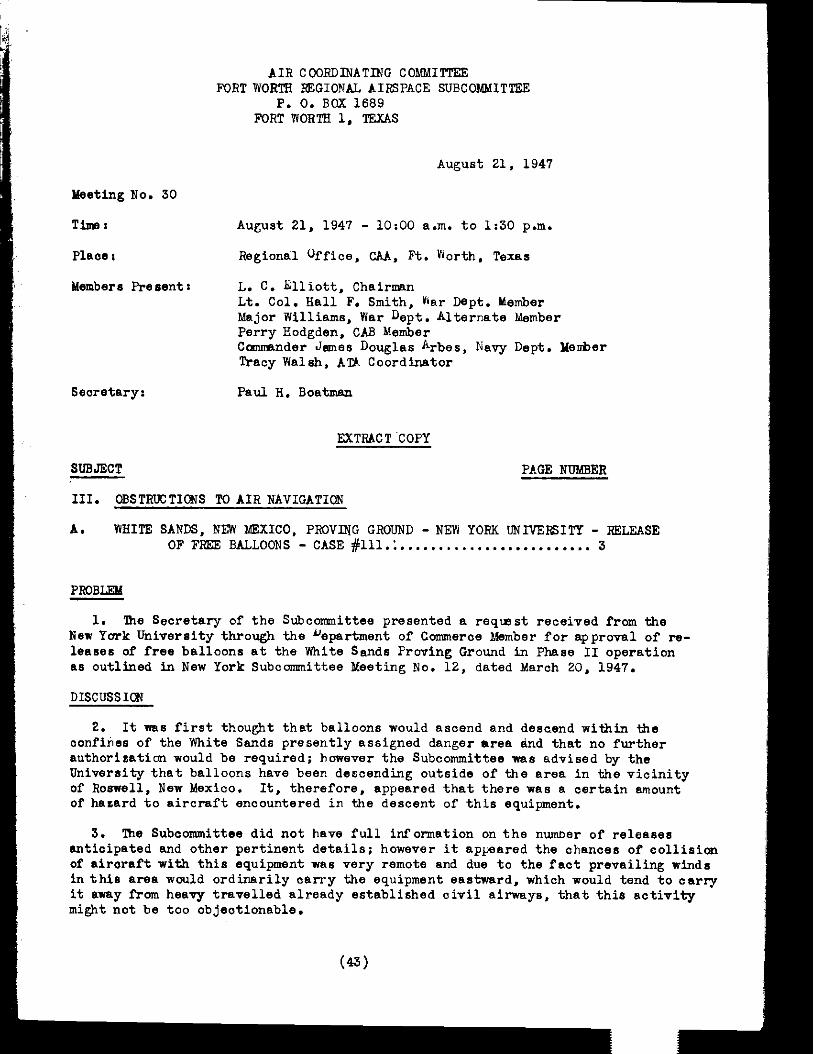
AIR COORDINATING COMMI'IT!&E FORT WORTH REGIONAL AIRSPACE SUBCOMMITTEE
P. 0. BOX 1689 FORT WORTB 1, TEXAS
August 21. 1947
YIeetlng No. 30
Tims: August 21, 1947 - 1O:OO a.m. to 1:30 p.m.
Plaoe: Regional Office. CAA. Ft. worth, Texas
Member a Present : L. C. Elliott, Chairman Lt. Col. Hall F. Smith, bar Dept. Member Major Williams, War Dept. Alternate Member Perry Hodgden, CAB Member C-nder Jsrmes Douglas Arbes, Navy Dept. Mar&r Tracy Walsh. AM Coordinator
Secretary: Paul H. Boatman
BXTRACT.COPY
SUBJECT PAGE NUMBER
III. OBSTRDCTIONS TO AIR NAVIGATION
A. WHITE SANDS, NEW MEXICO, PROVING GROUND - NEW YORK UNIVERSITY - RELEASE OF FREE BALLOONS - CASE #ill .:......................... 3
PROBLEM
1. llze Secretary of the Subcommittee presented a reqmst received from the New York University through the "epartment of Commeroe Member for approval of re- leases of free balloons at the White Sands Proving Ground in Phase II operation a8 outlined in New York Subconnnittee Meeting No. 12, dated March 20, 1947.
DISCUSSION
2. It was first thought that balloons would ascend and descend within the confines of the White Sands presently assigned danger area elnd that no further authorisaticm would be required; however the Subcommittee was advised by the University that balloons have been descending outside of the area in the vicinity of Roswell, New Mexico. It, therefore, appeared that there ~88 a certain amount of hazard to aircraft encountered in the descent of this equipment.
3. Ihe Subcommittee did not have full information on the numoer of releases anticipated and other pertinent details; however it appeared the chances of oollision of aircraft with this equipment was very remote and due to the fact prevailing rinda in this area would ordinarily carry the equipment eastward, which would tend to carry it e.nay from heavy travelled already established civil airways, that this activity might not be too objectionable.
(43)
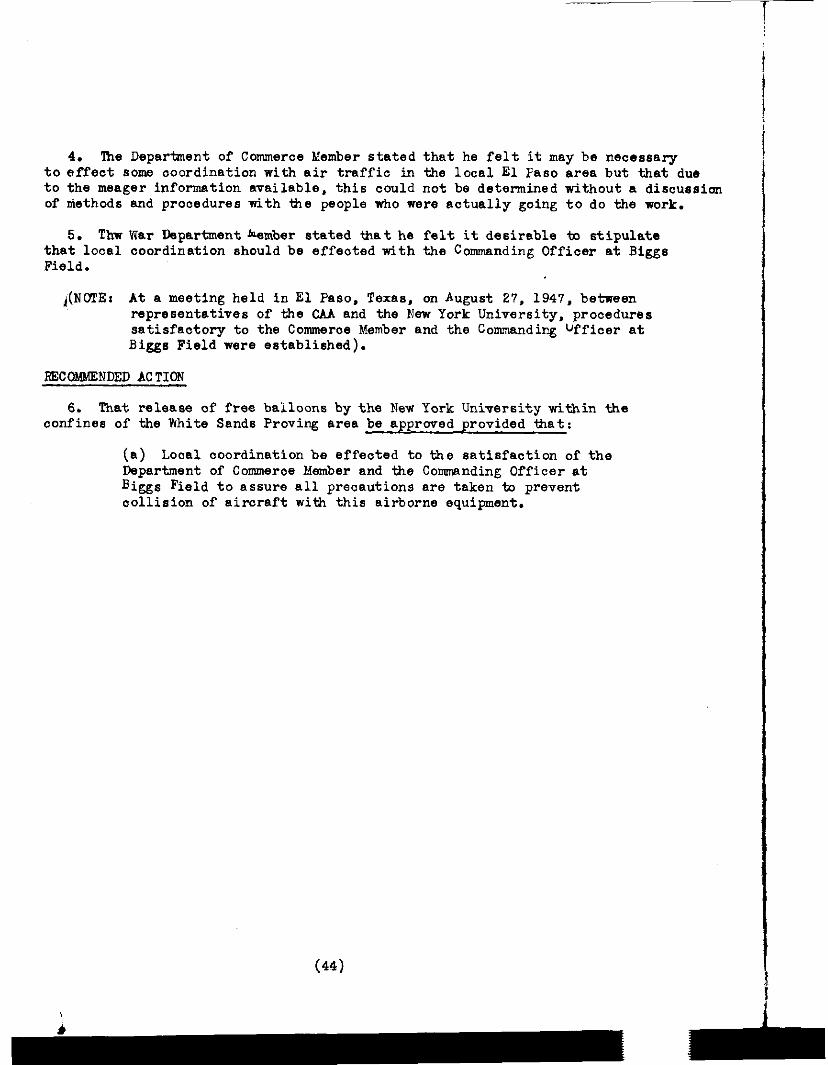
4. lhe Department of Commerce Yember stated that ha felt it may be necessary to effect some ooordination with air traffic in the local El Paso area but that due to the meager information available, this could not be determined without a discussion of niethods and procedures tith tie people who were actually going to do the work.
5. Thw mar Departmentlhember stated tAat he felt it desirable tc stipulate that local coordination should be effected with the Commanding Officer et Biggs Field.
i(NOTEt At a meeting held in El Paso. Texas, on August 27, 1947, between representatives of the CM and the New York University, procedures satisfactory to the Commeroe Member and the Commanding ufficer at Biggs Field wera established).
FJ2COMMENDED ACTION
6. That release of free balloons by the New York University within the confines of the Plhite Sands Proving area be approved provided that:
(a) Local coordination be effeated to the satisfaction of the Department of Commerce Member and the Cormnanding Officer at Biggs Field to assure all precautions ara taken to prevent oollisicn of aircraft with this airborne equipment.
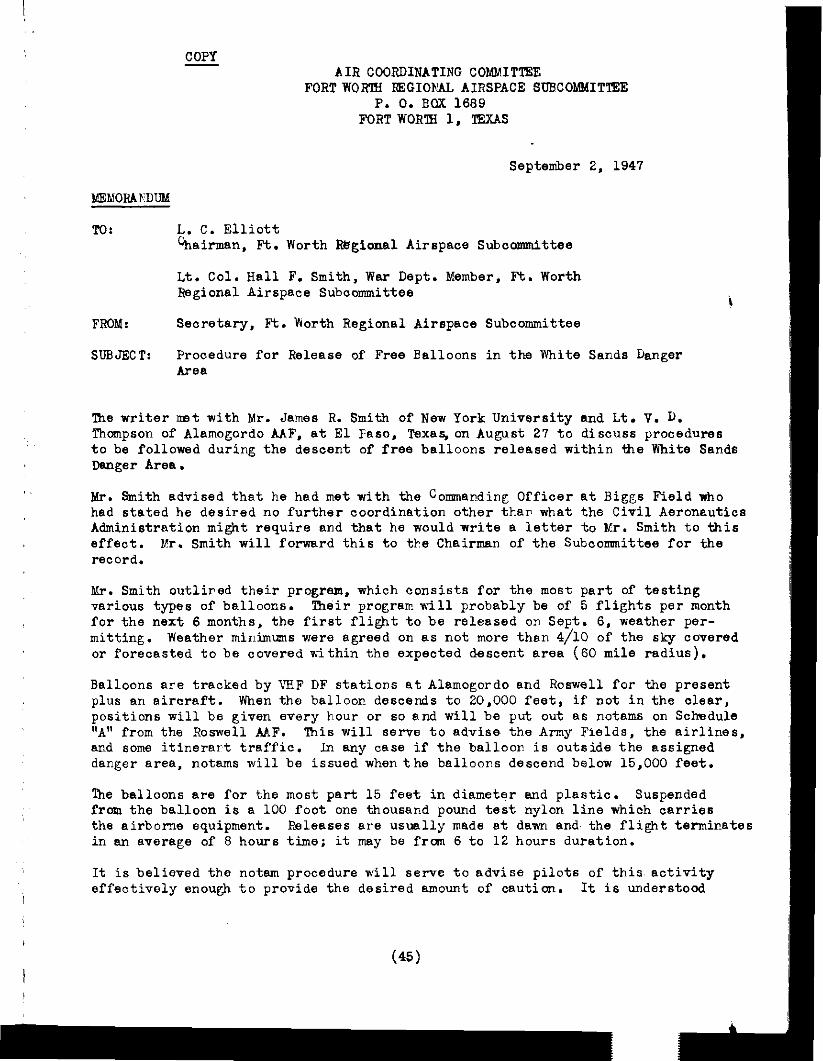
COPY AIR COORDINATING COMMITTEE
FORTWORl% XEGIORAL AIRSPACE GWCOMMITTEE P. 0. BOX 1669
FORT WOR'IB 1, TEXAS
September 2, 1947
To! L. C. Elliott Chairman, Ft. Worth wgional Airspace Subccmnittee
Lt. Ccl. Hall F. Smith, War Dept. Member, Ft. Worth Regional Airspace Subaomittee
FROM: Secretary, Ft. Worth Regional Airspace Subcommittee
SUBJECT: Procedure for Release of Free Belloons in the White Sands Danger Area
'l?m writer mt with Mr. James R. Smith of New York University and Lt. V. D. Thcmpson of Alamogordo MF, at El Faso. Taxas,cn August 27 to discuss procedures to be followed during the descent of free balloons released within the White Sands Danger Area.
Mr. Smith advised that he had met with the Commar?ding Officer at Biggs Field who had stated he desired no further coordination other tbap what the Civil Aeronautics Administmticn might require and that he would write a letter to Kr. Smith to this effect. vr. Smith will forward this to the Chairman of the Subcommittee for the record.
Mr. Smith outlired their prcgrm, which consists for the most part of testing various types of balloons. Their prcgrm nil1 probably be of 5 flights per month for the next 6 months, the first flight to be released on Sept. 6. weather per- mitting. Weather minimums were agreed on as not more than 4/10 of the se covered or forecasted to be covered within the expected descent area (60 mile radius).
Balloons are tracked by VRF DF stations at Alamogordo and Rcswell for the present plus en aircraft. When the balloon descends to 20.000 feet, if not in the clear, positions will be given every hour or so and will be put out as notams on Schedule "A" from the Rcswell AAF. This will servo to advise the Army Fields, the airlines, and some itinerart traffic. In any case if the balloon is outside the assigned danger area, notms will be issued when the balloons descend below 15,000 feet.
The balloons are for the most part 15 feet in diameter and plastic. Suspended from the balloon is a 100 foot one thousand pound test nylon line which carries the airborne equipment. Releases m-e usually made at dawn and. the flight terminates in an average of 6 hours time; it may be from 6 to 12 hours duration.
It is believed the notam procedure will serve to advise pilots of this.%activity effectively enough to provide the desired amount of caution. It is understood
(45) I
the airlines have some instrument fli&ts through this area at 20,000 feet; bon- ever these are for the most part at night and to the north of the expeoted balloon traok.
/S/ Paul H. Boatman PAULH. BOAW
Searetary, Ft. Worth Regional Airspace Subccmnittse
C 0 P Y
(46)
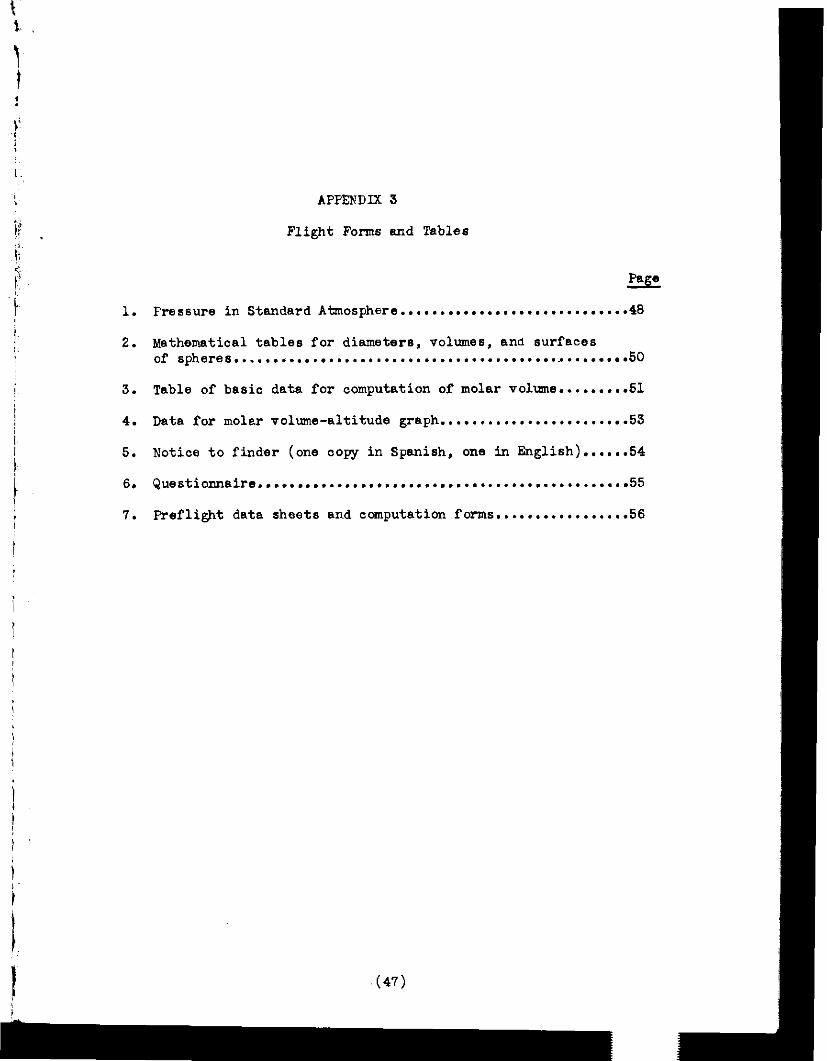
APPEXDM 3
Flight Forms and Tables
Et2
1. Fressure in Standard Atmosphere ........................... ..4 s
2. Methemtical tables for diameters. volumes, end surfaces of spheres .................................................. SO
3. Table of basic data for computation of molar volume.........5 1
4. Data for moler volume-altitude graph..............;.........5 3
5. Notice to finder (one copy in Spanish, one in English)......5 4
6. Questionnaire ............................................. ..5 5
'7. Preflight data sheets and computation forms.................5 6
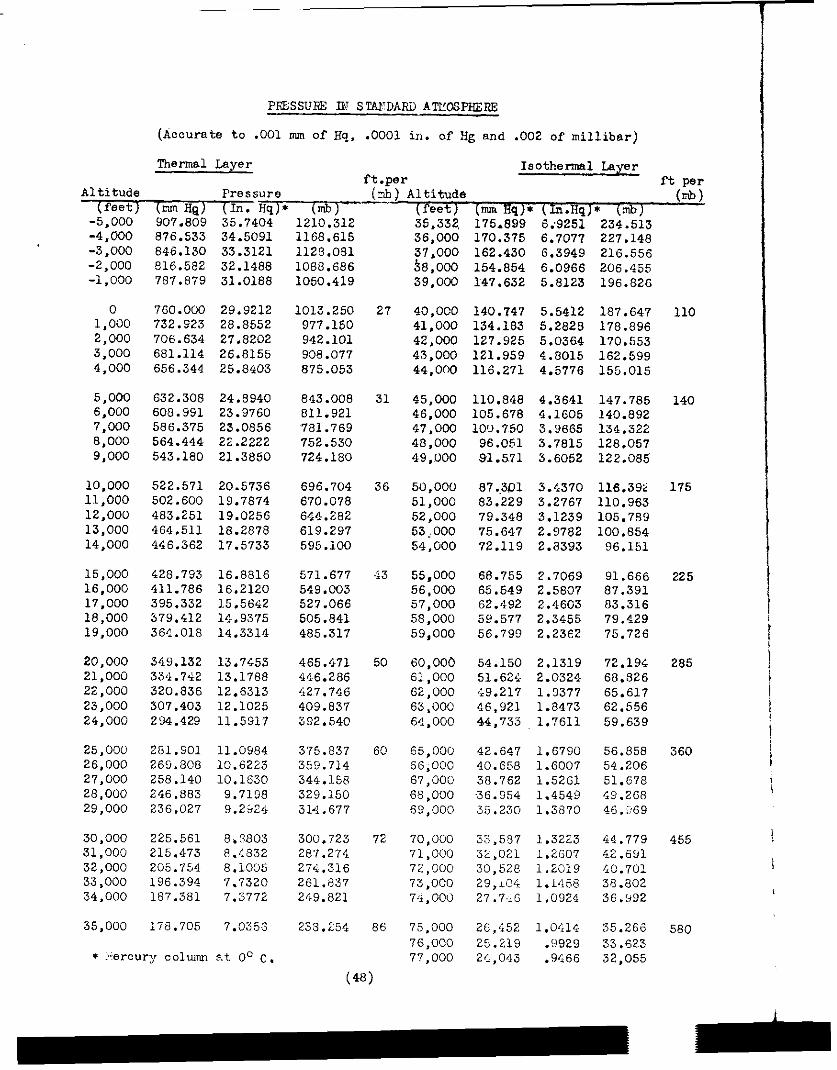
PFESSURE IN STAEDARD ATWSP~~
(Accurate to .OOl mm of Hq, .OOOl in. of Hg and .002 of millibar)
Thermal Layer Isothermal Layer e.per
Altitude (c&j Altitude ft per
Pi-eSSUre (feet) ( nm IiQ) (In. fIq)* (IrIb) --
w;lb) (feet) (m Eq)* (In.Hq)* (mb) 35.332 175,899 CT;9251 234.513 -5,000 907.809 ?z.,,oi
-4.000 676.533 34.5091 -3;ooo -2,000 -1,000
846.130 33.3121 916.582 32.1488 787.879 31.0168
1210.~12 1168.615 1128.091
36,000 37.000 ~8,003 39.000
170.375 162.430 154.854 f47.632
6.7077 6.3943 6.0966 5.8123
227.148 216.556 206.455 196.82~6
1088.686 1050.419
0 760.000 29.9212 1,000 732.923 28.8552 2,000 706.634 27.8202 3,000 681.114 26.8155 4.000 656.344 25.8403
1013.250 27 977.150 942.101 908.077 875.053
5,000 632.308 24.8940 6.000 608.991 23.9760 7.000 586.375 23.0856 8,000 564.444 22.2222 9,000 543.180 21.3850
843.008 31 611.921 '781.769 752.530 724.180
40,000 41,000 42,000 43,000 44,000
140.747 134.183 127.925 121.959 116.271
696.704 36 670.078 644.282 619.297 595.100
45,000 46.000 47,000 48,000 49,000
5.5412 5.2828 5.0364 4.8015 4.5776
110.848 105.678 lOc).750
96.051 91.571
187.647 178.896 170.553 162.599 155.015
5o,ooo 51,000 52,000 53,000 54,000
4.3641 4.1605 3.9665 3.7815 3.6052
87..301 83.229 79.348 75.647 72.119
147.785 140.892 134.322 128.057 122.085~
10.000 522.571 20.5736 11,000 502.600 19.7874 12,000 483.251 19.0256 13,000 464.511 16.2879 14.000 446.362 17.5733
3.4370 3.2767 3.1239 2.9782 2.a393
116.3% 110.963 105.789 100.854
96.151
15,000 428.793 16.8816 571.677 43 55,000 68.755 2.7069 91.666 16,000 411.786 16.2120 549.003 56,000 65.549 2.5807 87.391 17,000 395.332 15.5642 527.066 57,000 62.492 2.4603 83.316 16,000 379.412 14.9375 505.841 58,000 59.577 2.3455 79.429 19,000 364.016 14.3314 485.317 59,000 56.799 2.2362 75.726
20,000 349.132 13.7453 465.471 50 60,000 54.150 2.1319 72.194 21,000 334.742 13.1788 446.286 61,000 51.624 2.0324 68.926 22,000 320.836 12.6313 427.74G 62,000 49.217 1.9377 65.617 23,000 307.403 12.1025 409.837 63,000 46,921 1.0473 62.556 24,000 294.423 11.5917 392.540 64.000 44,733 1.7611 53.639
25,000 26,000 27,000 28,000 29,000
375.837 60 65,000 42.647 1.G790 56.858 359.714 66.000 40.658 1.6007 54.206 344.158 67,000 38.762 1.5261 51.678 329.150 FS,OOO 36.954 1.4549 49.2G8 314.677 69,000 35.230 1.3870 46.?69
30,000 31,000 32,000 33,000 34,000
281.901 11.0984 269.800 10.6223 258.140 10.1630 246.883 9.7138 236.027 9.2324
225.561 8,0803 215.473 8.4832 205.754 8.1005 196.394 7.7320 187.381 7.3772
178.705 7.0356
-y colwm Rt 00 c.
300.723 72 70,000 33,587 1.3223 44.779 287.274 71,000 32,021 1.2G07 42.651 274.316 72,000 30,528 1.2019 40.701 261.637 73,000 29,iPi 1.1456 38.a02 219.821 74 ) 000 27.7.;G 1.0924 36.392
35,000
* :ercw
239.254 86
(46)
75.000 21;,452 l,Oi,14 35.266 76,000 25.219 .9929 33.623 77,000 2c,o43 .X66 32.055
225
285
360
455
580
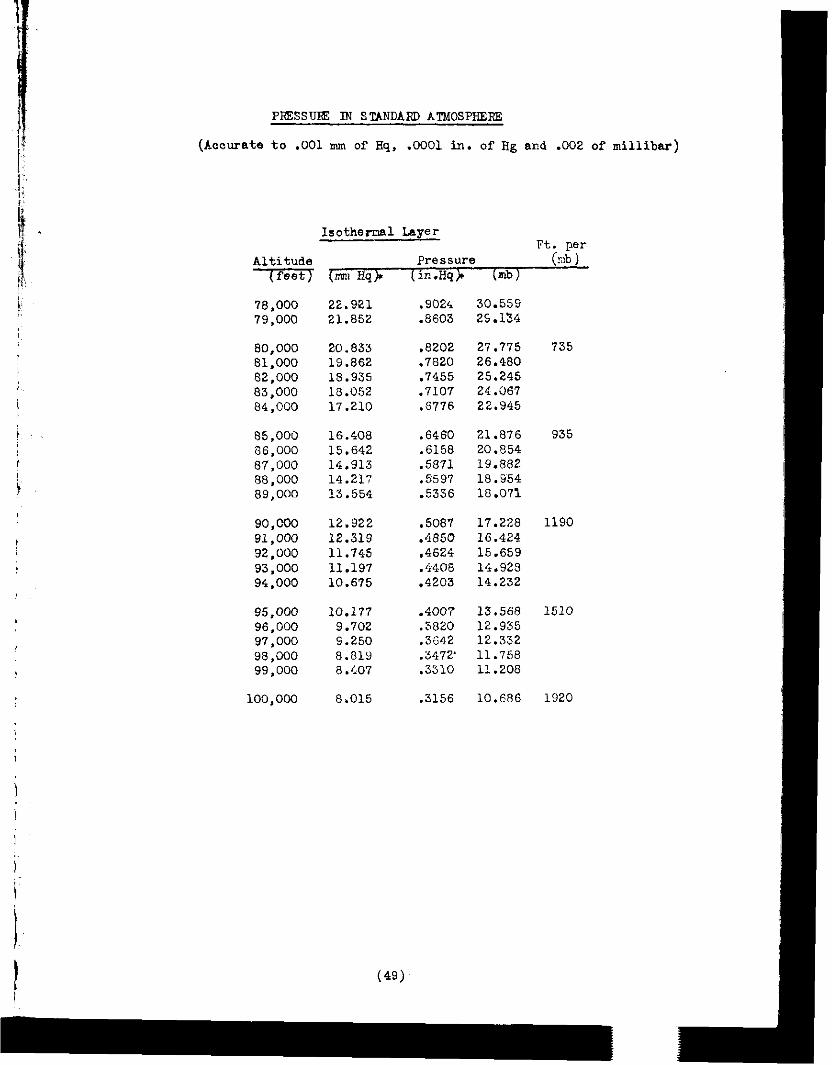
PIIESSUE IN STANDARD ATMOSPHERE
(Accurate to .OOl mm of Hq, .OOOl in. of Hg end .002 of millibar)
Isothermal Layer Ft. per
Altitude Pl-eSSUre (r.lb ) ( (null Hq> (in.Hq)r (mb)
78,000 79,000
80,000 81.000 82,000 83,000 84,000
85,000 86.000 07,000 88,000 89,000
90,ooo 91,000 32,000 93.000 94,000
95,000 96,000 97,000 98,000 99,000
100,000
22,921 21.852
20.833 19.862 18.935 10.052 17.210
16.408 15.642 14.913 14.217 13.554
12.922 12.319 11.745 11.197 10.675
10.177 9.702 5.250 8.SlY 8 .407
8.015
.9024 30.559
.8603 25.134
.8202 27.775
.7820 26.480
.7455 25.245
.7107 24.067
.5776 22.945
.6460 21.876 .6158 20.854 .5871 19.882 .5597 18.854 .5336 10.079
.5087 17.228
.4850 16.424
.4624 15.659
.4408 14.928
.4203 14.232
-4007 13.568 .3820 12.935 .3642 12.332 .3472 11.758 .3310 11.208
.3156 10.686
735
335
1190
1510
1920
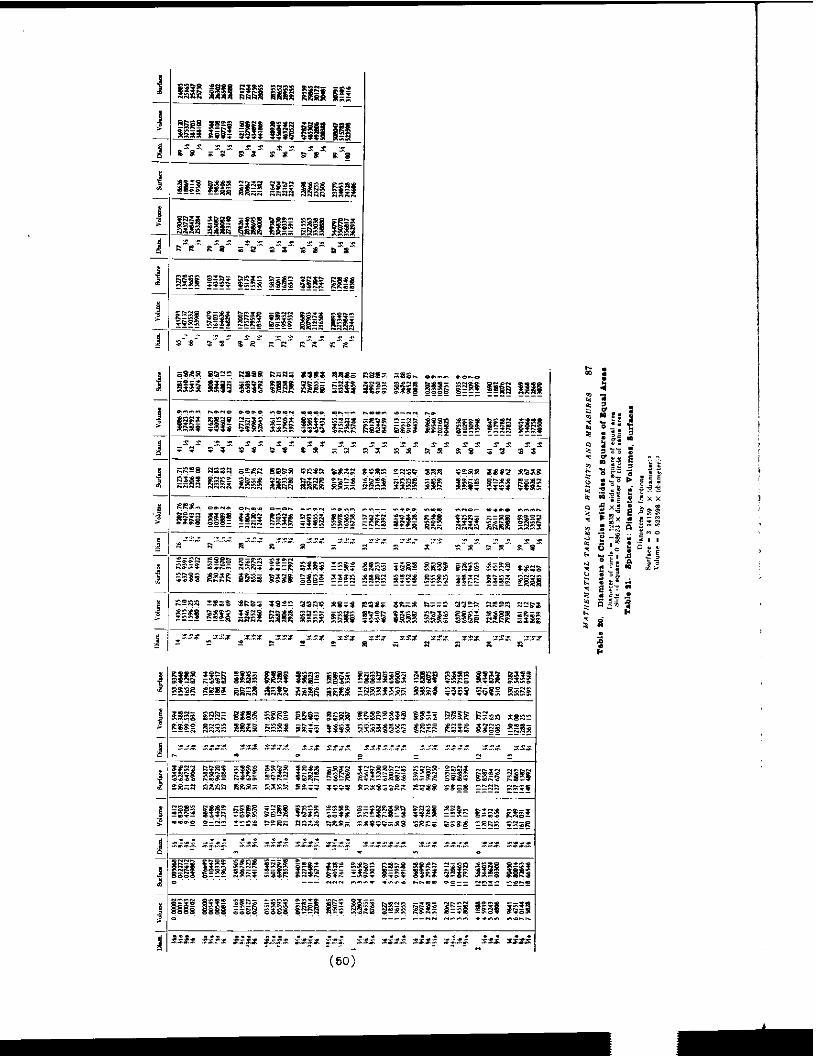
--
I-
.-
I
- I
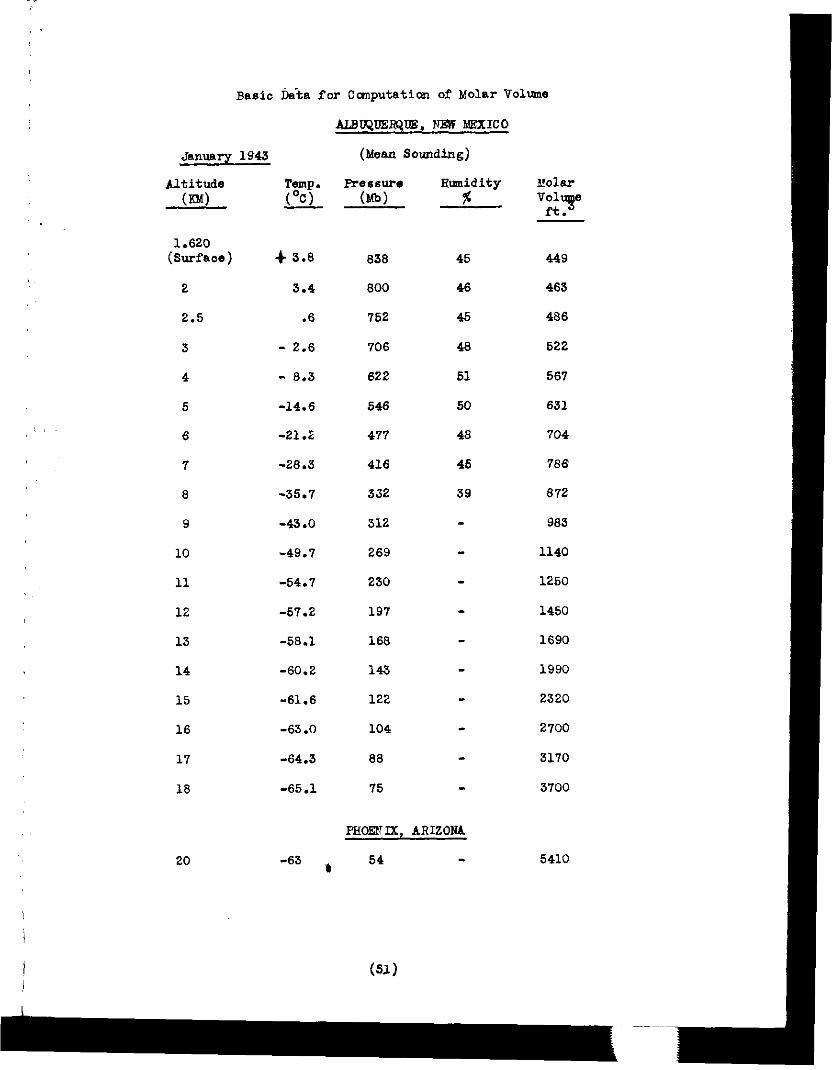
Basic l&&a for Cmputation of Molar Volume
January 1943 (Mean Sounding)
Altitude m)
1.620 (Slxfaoe)
2
2.5
3
4
5
6
7
6
3
10
11
12
13
14
15
16
17
18
20
+ 3.6 636
3.4 600
.6 752
- 2.6 706
- 0.3 622
-14.6 546
-21.2 477
-26.3 416
-35.7 332
-43 .o 312
-49.7 269
-54.7 230
-57.2 197
-56.1 166
-60.2 143
-61.6 122
-63.0 104
-64.3 66
-65.1 75
45
46
45
48
51
50
46
46
39
PHOENIX, ARIZONh
-63 , 54
l,!olar Vol
ft?
449
463
466
522
567
631
704
766
672
963
1140
1250
1460
1690
1990
2320
2700
3170
3700
5410
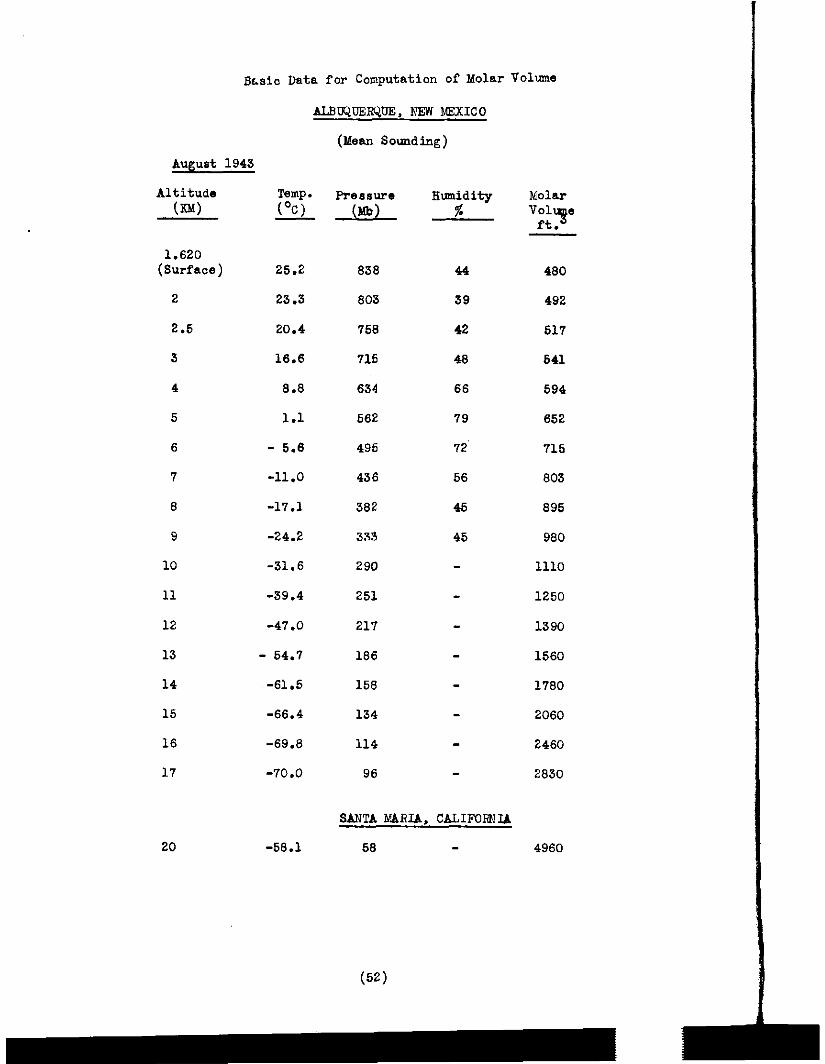
Bcalc Data for Computation of Molar Volume
(Mean Sounding)
August 1943
Altitude @JO
1.620 (Surface)
2
2.6
3
4
5
6
7
8
9
10
11
12
13
14
15
16
17
20
Temp. F-ressure (QC)
Humidity A!!L %
25.2 038
23.3 803
20.4 758
16.6 716
a.0 634
1.1 562
- 5.6 495
-11.0 436
-17.1 382
-24.2 333
-31.6 290
-39.4 251
-47.0 217
- 64.7 186
,-61.5 158
-66.4 134
-69.6 114
-70.0 96
44
39
42
48
66
79
72,
56
45
45
480
492
517
541
594
652
715
803
895
980
1110
1250
1390
1560
1780
2060
2460
2830
SANTA MARIA, CALIFUIhIA
-58.1 58 4960
(52)
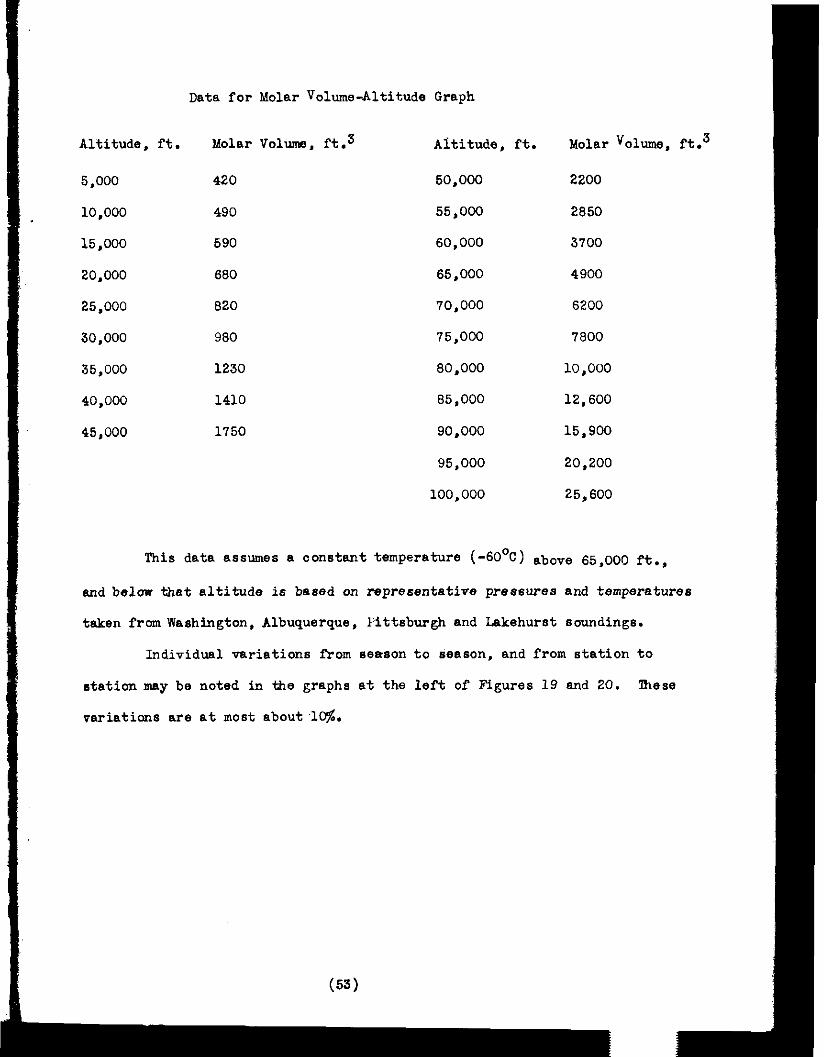
Data for Molar Volume-Altitude Graph
Altitude, ft. Molar Volume, ft.3 Aititude, ft.
5,000 420 50,000
10,000 490 55,000
15,000 590 60,000
20,000 680 65,000
25,000 820 70,000
30,000 980 75,000
35,000 1230 80,000
40,000 1410 85,000
45,000 1750 90,000
95,000
100,000
Molar Volume, ft.3
2200
2850
3700
4900
6200
7800
10,000
12,600
15,900
20,200
25,600
This data assumes a oonstant temperature (-6O'C) above 65,000 ft.,
and below that altitude is based on representative pressures and temperatures
taken from Washington, Albuquerque, Pittsburgh and Lakehurst soundings.
Individual variations from 8e~son to mason, and from station to
station nay be noted in the graphs at the left of' Figures 19 and 20. 9le.W
variations are at most about ,lO$.
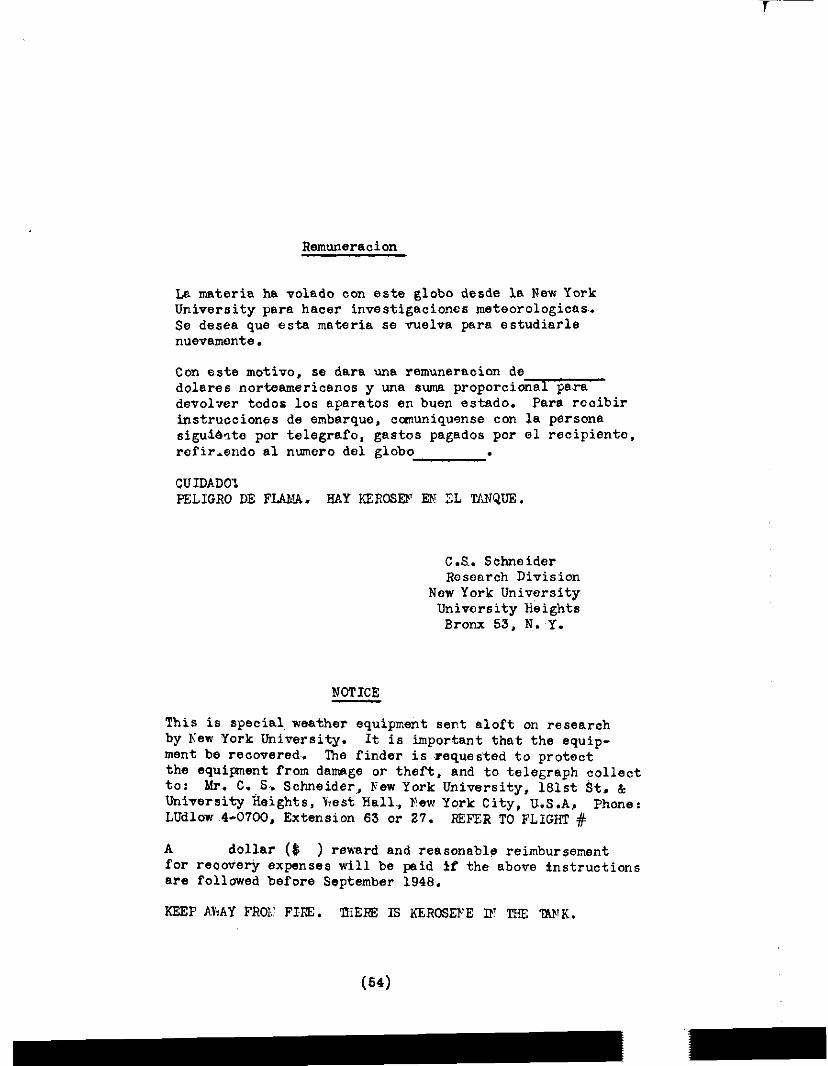
Remuneration
La materia ha volado con sste globe desde la New York University para hater investigacicnes meteorologicas-. Se desea que esta matsria~se vuelva para estudiarle nuevamonte .
Con est.0 motive. se dara una remuneracicn de dolares norteamericanos y una 8uma proporcicnal para devolver todos 10s aparatos en buen estado. Para rccibir instruccicnes de embarque. ccmuniquense con la persona siguiente por telegrafo, gastos pagados per 01 recipiente. rofir,endo al numero de1 glcbo .
CUIDADO'! PELIGRO DE FL&%. RAY IOZROSEI' EN EL TANQUE.
C.S. Schneider Research Division
New York University University Heights
Bronx 53, N. Y.
NOTICE
This is special.weather equiprrent sent aloft on research by Few York University. ment be recovered.
It is important that the equip- The finder is requested to protect
the equipment from damage or theft, and to telegraph collect ~to: b!r. C. S, Schneider,, Few York University, 1Slst St, & University &eights, best hall., Few York City, U.S.A,, Phone: Ludlow 4-0700, Extension 63 or 27. REFER TO FLIGHT #
A dollar ($ ) reward and reasonable reimbursement for reccvery expenses will be paid if the above fnstructicns are followed before September 1948.
KEEP AhAY FROL: FIFE. TZERE IS EEROSEPE IX TRB 'DWK.
(54)
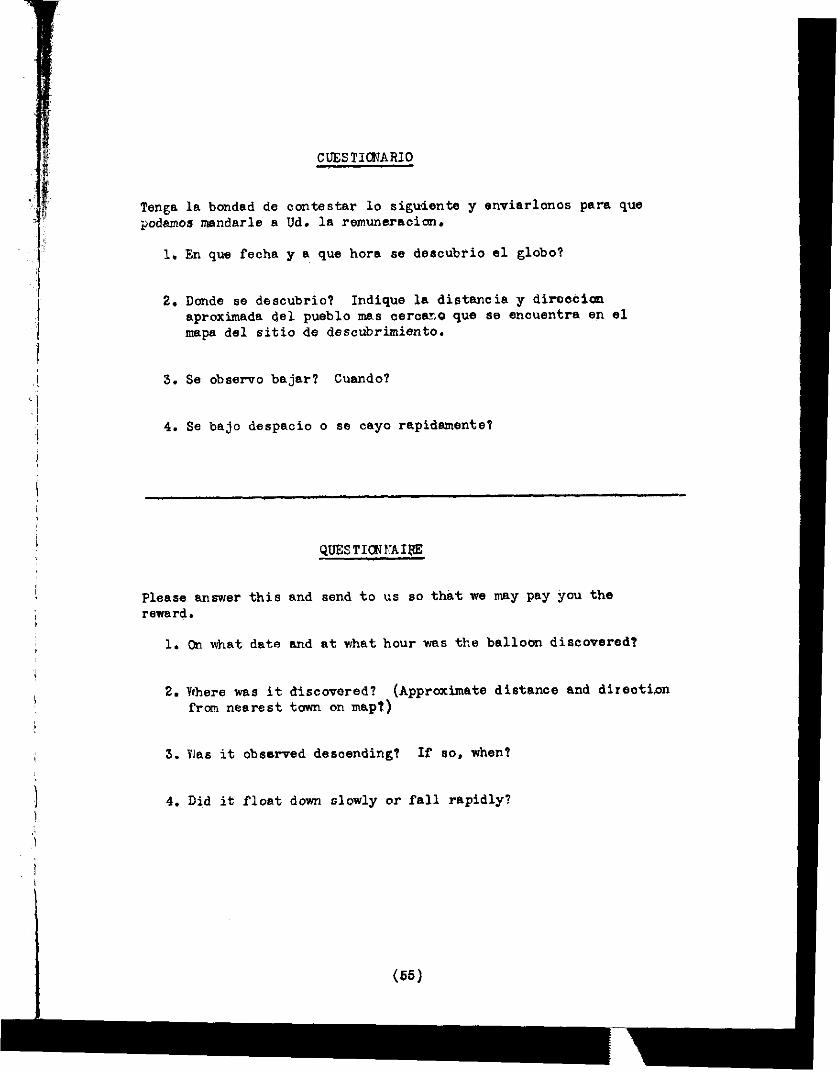
CUESTICNARJO
Tenga la bondad de contester lo sigueiente y enviarlonos ,para que podamos mendarle e Ud. la remuneraoion.
1, En que fecha y a que hora ee descubiio el globo?
2. Donde se descubrio? Indique le. distancia y dirochim aproximada de1 pueblo mes oerowo que se encuentra en el mape de1 sitio de dsscubrimiento.
4. Se bajo despacio o se cayo rapidamente?
3. Se observe bajar? Cuendo?
Please answer this and send to us 80 that we may pay you the rewerd.
1. Cm what date and at what hour wee the balloon discovered?
2. Where was it discovered? (Approximate distance and direatian from nearest town on map?)
3. Was it observed descending? If 80. when?
I , I
/
j
1
I
(55)
4. Died it float down olowly or fall rapidly?
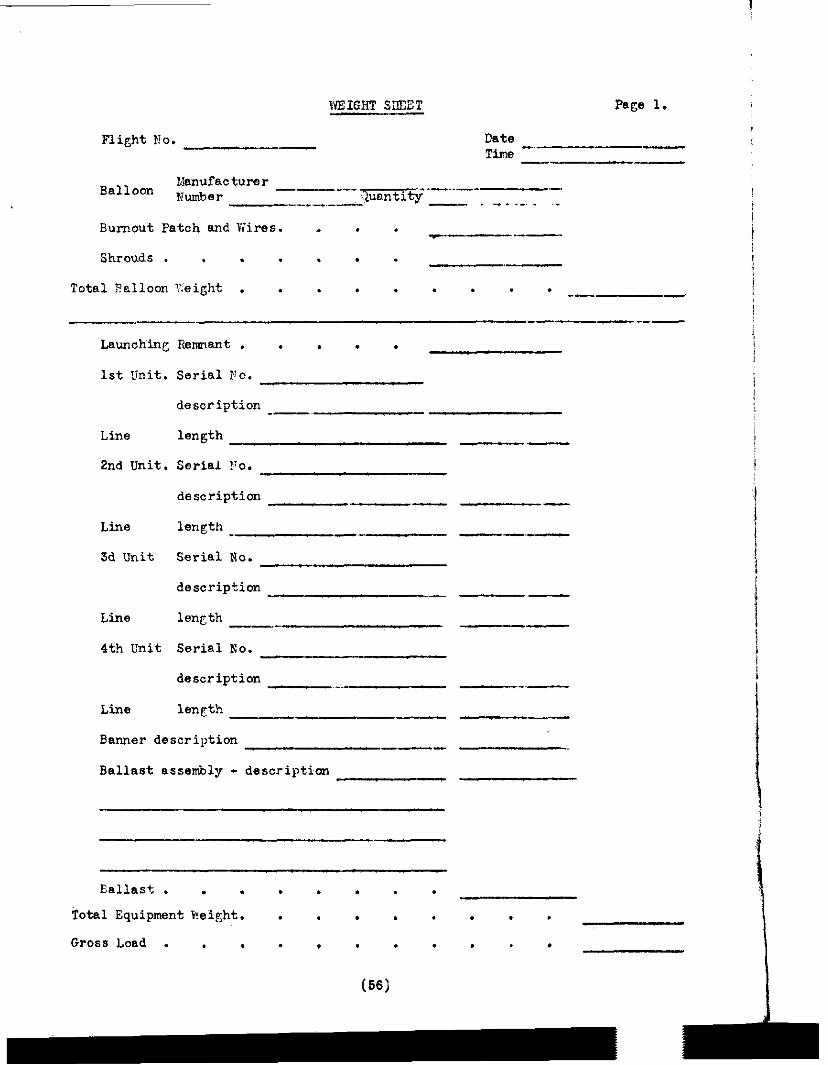
WEIGHT SIIfXT Page 1.
Flight >!o. Date Tim -.
-- -
Belloon Manufacturer --_--~~ .-.-..- Number :&mtity -_,__- - . -_ .-. . ._
Burnout Patch and Wires. . . . *.-P
Shrouds .......
Total l?!elloon Feieht ......... -- -
Lamohin~ Remnant. . . . .
1st Unit. Serial 30.
desoription _-~
Line length
2nd Unit. Serial ?o.
description
Line len@h _
3d Unit Serial No.
description
Line 1enet.h --
4th Wit Serial No.
--
- --_c
--
description
Line km@
Banner description
Ballast assembly - descripticm
-.-
---
Eallast . . . . . . . .
Total Equipment Weight. . , , . . . . .
Gross Load . . . . , . . . . . .
(56)
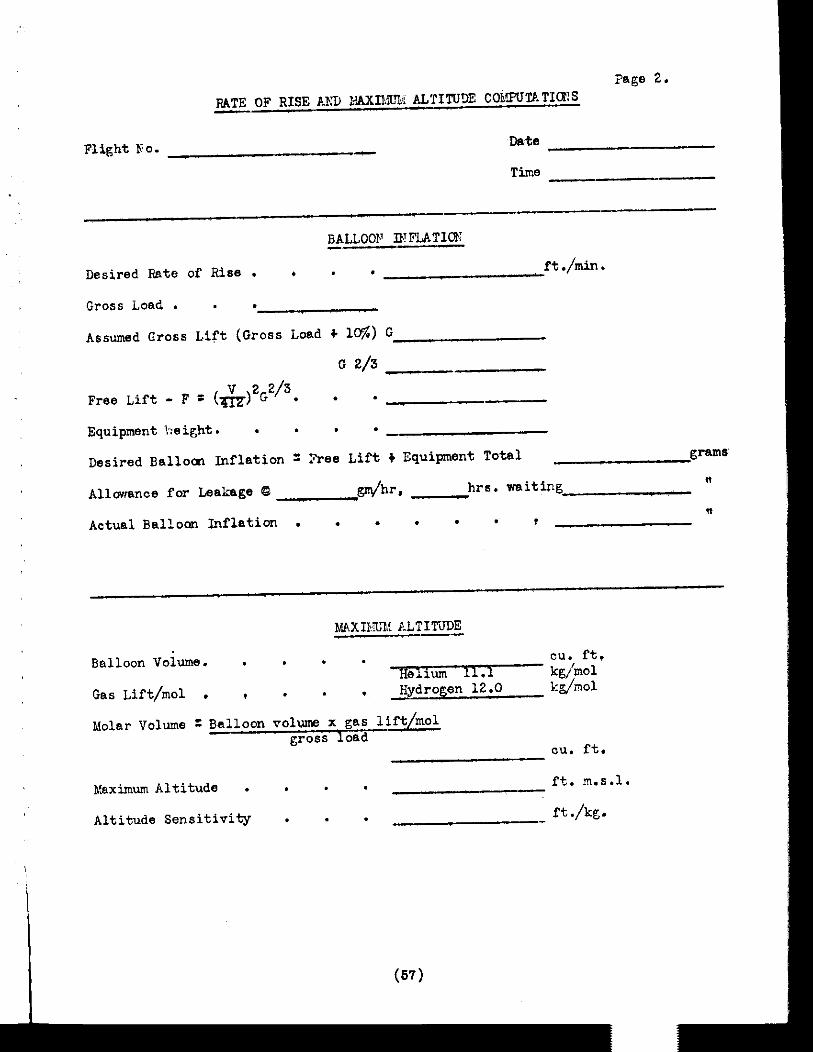
Tage 2.
Flight Yo. Date
Time
eLL001" ll!FLATI(R?
Desired Rate of Rise . . . l rt./min.
Gross Load . . .
Assumed G~ross Lift (Gross Load + 1%) G
G 2/3
v 2 2/3 Free Lift - F 3 (m) G . - -
Equipment bight. . a . a
Desired Ballot Inflation : Yree Lift + Equipment Total
Allowance for Leakage Q em/hr. hrs. waiting
grams
"
" Actual Balloon Inflation . . . . . . 7
Balloon voitm. . . . . EU. ft. Helix 11.1
Gas Lift/no1 . , . . v Aydrogen 12.0
Molar v01ums : Balloon volume x gas lift/m01 gross load
Vaxirnum Altitude . . . . ft. m.s.1.
Altitude Sensitivity . . - _ ft./kg.
(57)
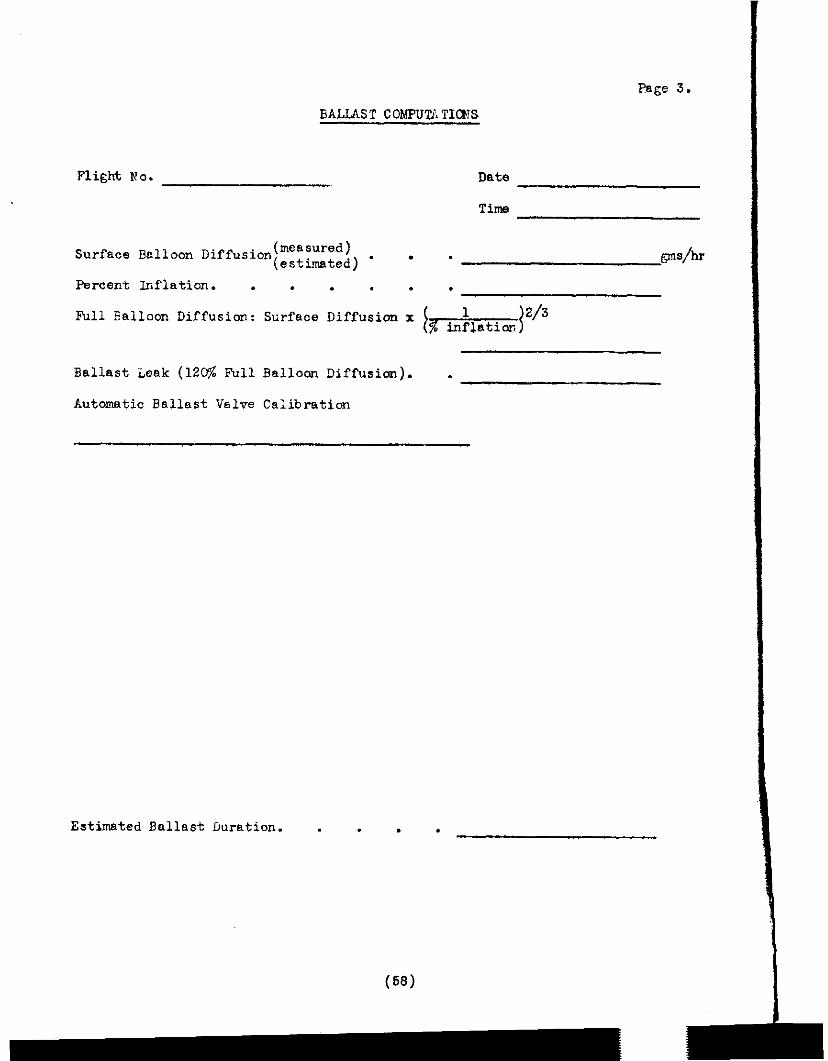
Page 3.
BALLhST COMPUTATIIXS
Flight h'o. Date
Time
Surface Belloon Diffusion (measured) (estimated) * ' -
Percent Inflation. . . . . . .
Full Ealloon Diffusion: Surface Diffusion x [% inLitic.n I"/"
Ballast Leak (120% Full Balloon Diffusion). .
Automatic Ballast Valve Calibration
E;ms/hr
Estimated Ballast Duration. . . . .
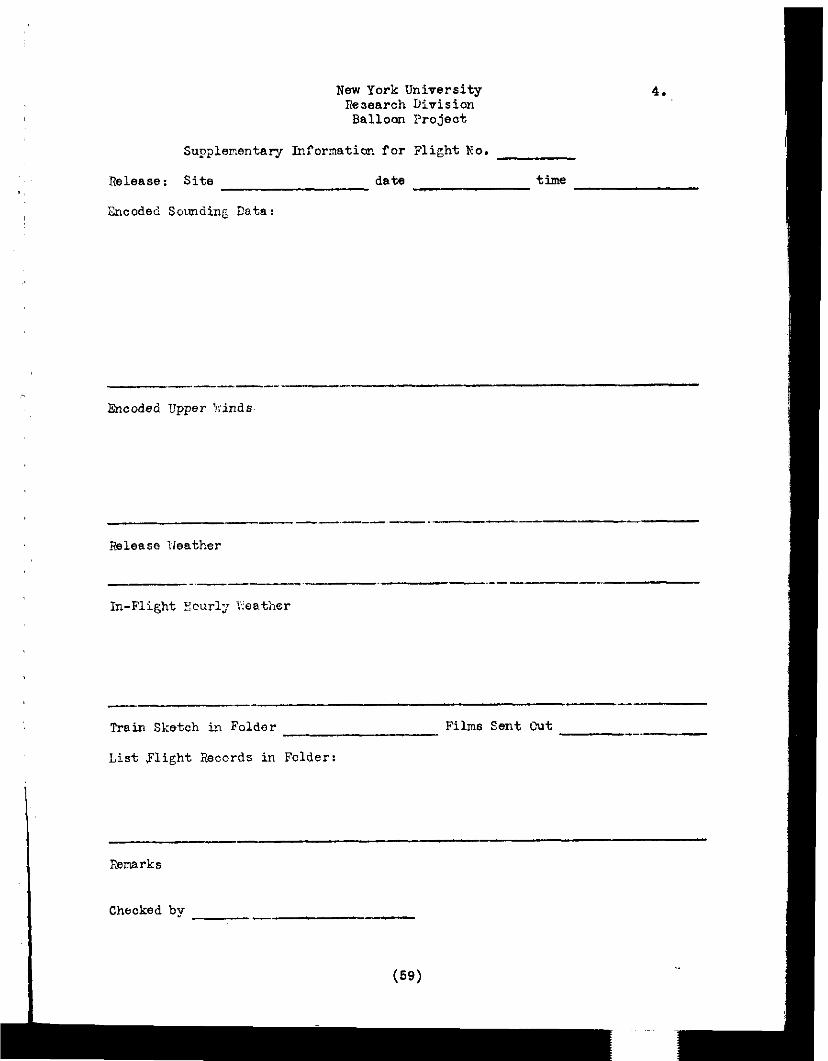
New York TJniversity Research Division
Balloon "reject
4.
Supplementary Informtion for Flight Xo.
Release: Site
'&coded Sounding Data:
date time
_.-_- ---
Encoded Upper 'r:inds.
&marks
-
Train Sketch in Foldor
--
Films Sent Cut --.
List Flight &cords in Folder:
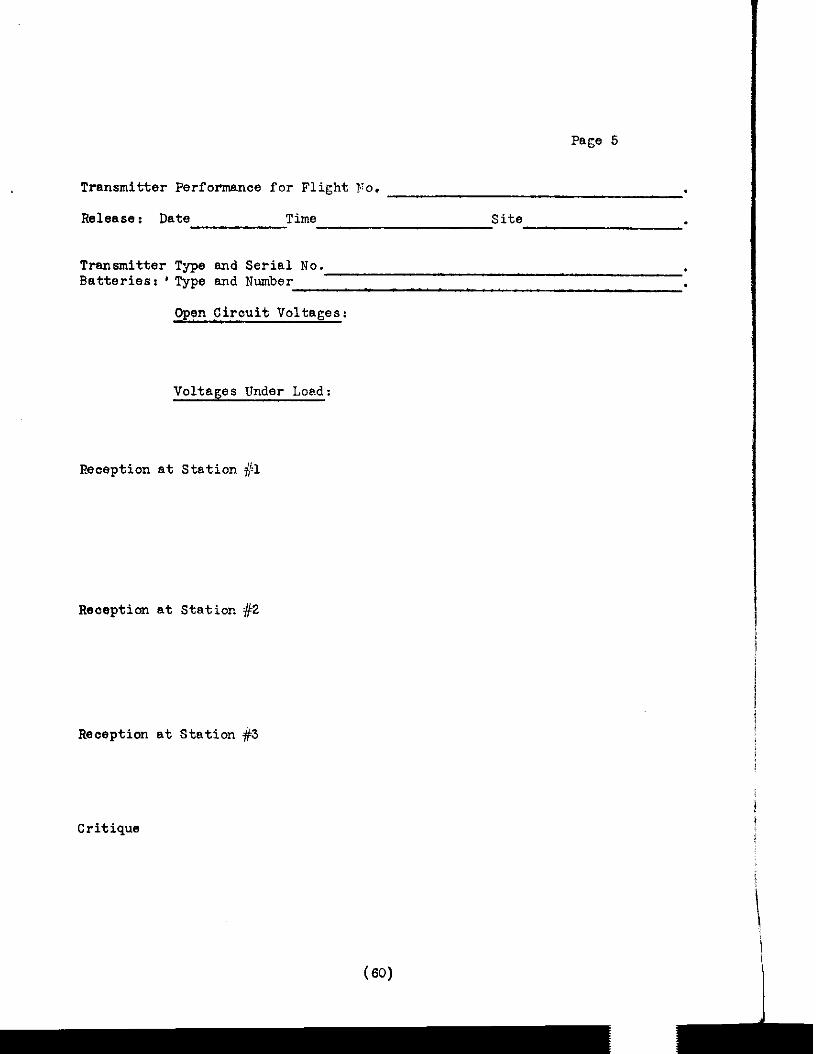
Page 5
Transmitter Performance for Flight Yjo.
Release: Date Time Site .
Transmitter Type and Serial No. Batteriesr ' Type and Number
Open Circuit Voltages:
Voltages Under Load:
Reception at Station #1
Reception at Station #2
Reception at Station #3
Critique
i
1.
2.
3.
4.
5.
6.
7.
8.
9.
10.
11.
12.
REFERENCES
M&singer, C. L. "Constant Elevation Free-balloon Flights from Fort
Qnehe," Monthly Weather Review, Vol. 47, pp. 535-538. 1919.
'Progress in Developing a Constant-Level Balloon", Report by Dewey and
Almy Chemical Company, Cambridge, Massachusetts. June 15. 1944.
"Analysis of Japanese Weather Service", Air sheather Service 'Mchnical
Report 45-1, Langley Field, Virginia, May, 1946.
Clarke, E.T., Korff, S.A., "The Rsdiosonds: The Stratosphere Laboratory".
Journal of the Franklin Institute, Vol. 232. No. 3, September, and No. 4,
October, 1941.
Middleton, W.G.K., Meteorologiaal Instruments, Toronto, Canada. 1941, p. 46.
"Aerological Observations", Monthly Weather Review, Vol. 71, pp. 202-3. 1943.
Brombacher, W. G., "Altitude-Pressure Tables Based on the United States
Standard Atmosphere". Report No. 538, National Advisory Committee for
Aeronautics, Washington, D. C. September, 1935.
Timoshenko. MacCullough, Elements of Strength of Eaterials, Vol. 1, p. 51.
Lange. K. 0.. Unpubli6hed Report, Lexington, Kentucky, 1947.
Warner, E. P., Aerostatics, 'lhe Roland Press io., New York, 1926.
"'Ihe National Geographic Society - "U.S. Atiy Air Corps Stratosphere Flight
of 1934 in the Balloon 'Explorer'". Contributed Technical Papers of the
National Geographic Society. Washington, 1935.
I?xe National Geographic Society - "U.S. Army Air Corps Stratosphere @light
in the Balloon 'Explorer II"', Contributed Technical Papers of the National
Geographic Society. Iiashington, 1936.
I
- 61 -
13. 13. Lugeon, Jean, Lugeon, Jean, "Le Paste Aerologique de la Station Centrale de "Le Paste Aerologique de la Station Centrale de
Meteorologic a Payerne et les nourelles methodes ruisses de Meteorologic a Payerne et 166 nourelles methodes ruisses de
rediosmdage", rediosmdage", Extrait des Amales de la Station Centrale Suisse de Extrait des Amales de la Station Centrale Suisse de - -
keteorologie, 1941; Zurich, 1942 keteorologie, 1941; Zurich, 1942
14. 14. Lugeon, Jean, Lugeon, Jean, "Quelques Innovations aw. Methodes Suisses de Radiosondage," "Quelques Innovations aw. Methodes Suisses de Radiosondage,"
Tirage a part des Annales de la Station Centrale Suisse de Meteoro- Tirage a part des Ax-males de la Station Centrale Suisse de Meteoro-
logic, 1942, Zurich, 1943. logic, 1942, Zurich, 1943.
15. 15. Up&XXl, Up&XXl, R.. Chandler. C. R.. Chandler. C. Free and Captive Balloons. Ihe bland Press Free and Captive Balloons. Ihe bland Press
Co., New York 1926. Co., New York 1926.
16. 16. Prmdtl, L., Tietjens, O.G., Prmdtl, L., Tietjens, O.G., Fundamentals of Hydra-and Aeromechanics, Fundamentals of Hydra-and Aeromechanics,
the Ngple Press Co., York, Pa. the Ngple Press Co., York, Pa.
(62) (62)

WADC/WADD Digital Collection at the Galvin Library, IIT
The Roswell Report Fact Vs. Fiction in the New Mexico Desert
The Roswell Report was divided into five parts due to the large size of the document. At the beginning and end of each division we have included a page to facilitate access to the other parts. In addition we have provided a link to the entire report. In order to save it, you should right-click on it and choose save target as. This is considered the best way to provide digital access to this document.
To continue on to the next part of this document, click here
This document, along with WADC/WADD technical reports, and further research materials are available from Wright Air Development Center Digital Collection at the Galvin Library, Illinois Institute of Technology at:
http://www.gl.iit.edu/wadc


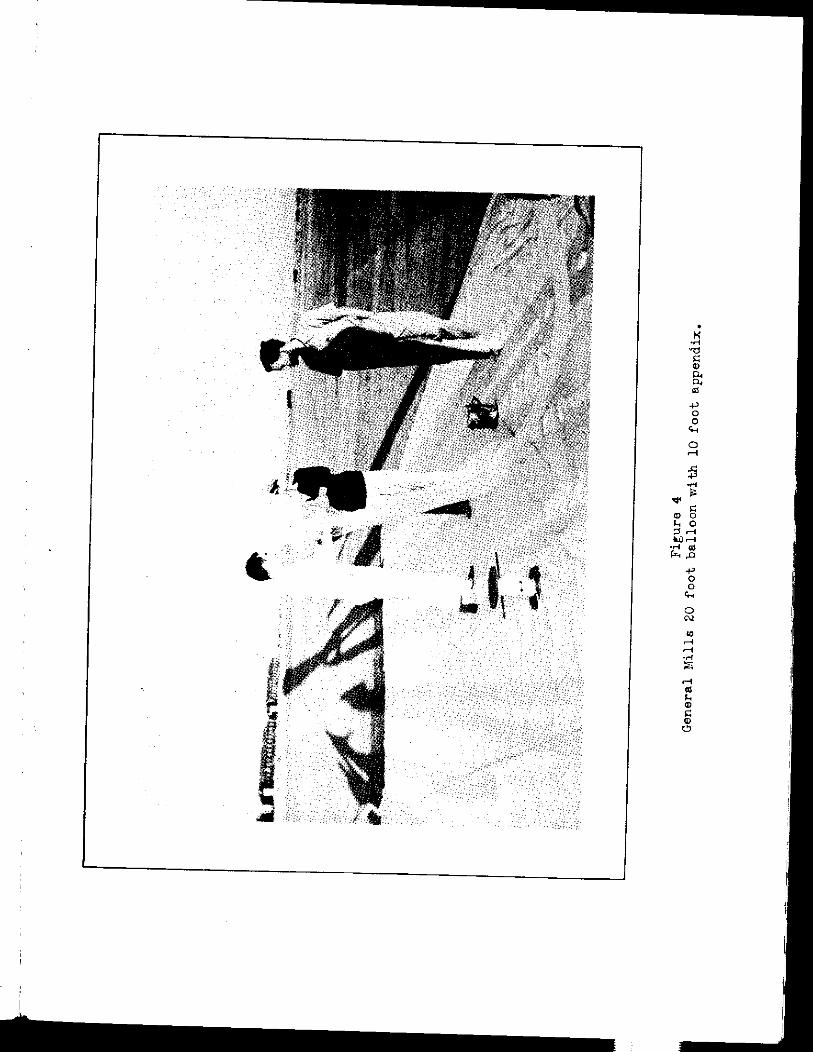
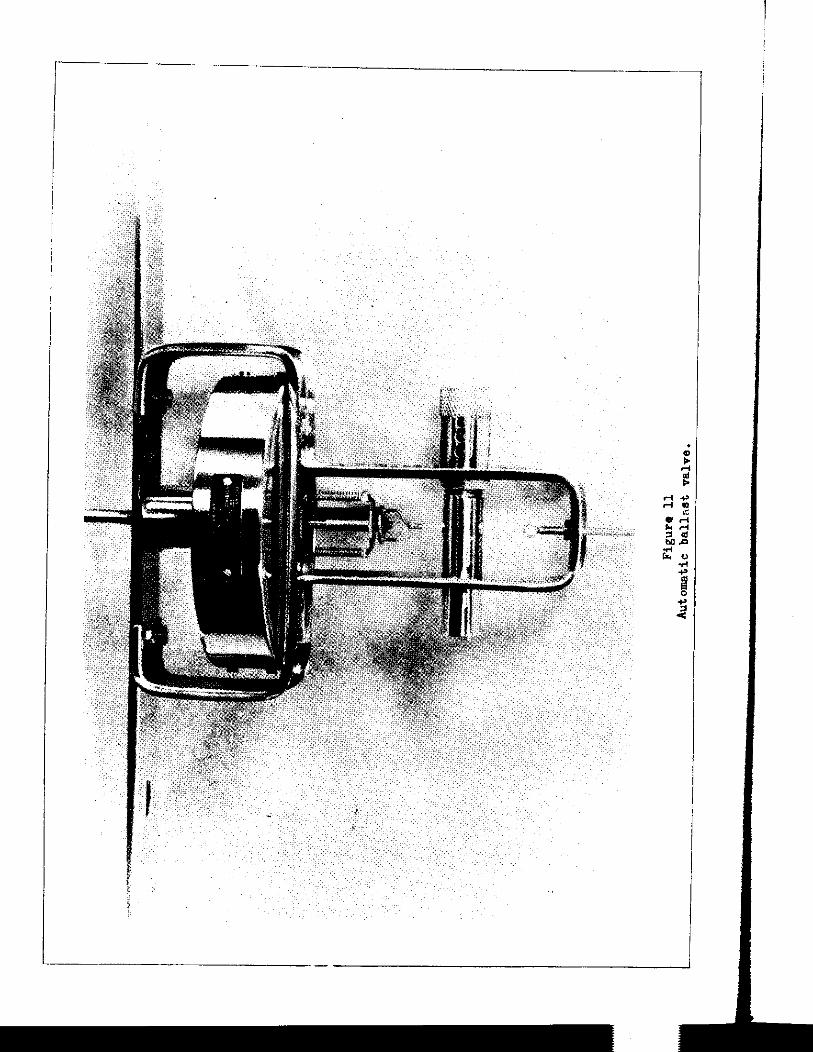


![Roswell [reparado]](https://img.pdfslide.us/doc/110x75/55c2611abb61eb356a8b47e9/roswell-reparado.jpg)