Embed Size (px)
Citation preview
79
Part 4 Financial statementsIndependent Auditor’s Report 80
Statement by the Secretary and Chief Financial Officer 84
Statement of comprehensive income 85
Statement of financial position 86
Statement of changes in equity 87
Cash flow statement 89
Administered schedule of comprehensive income 90
Administered schedule of assets and liabilities 91
Administered reconciliation schedule 92
Administered cash flow statement 93
Notes to and forming part of the financial statements 94
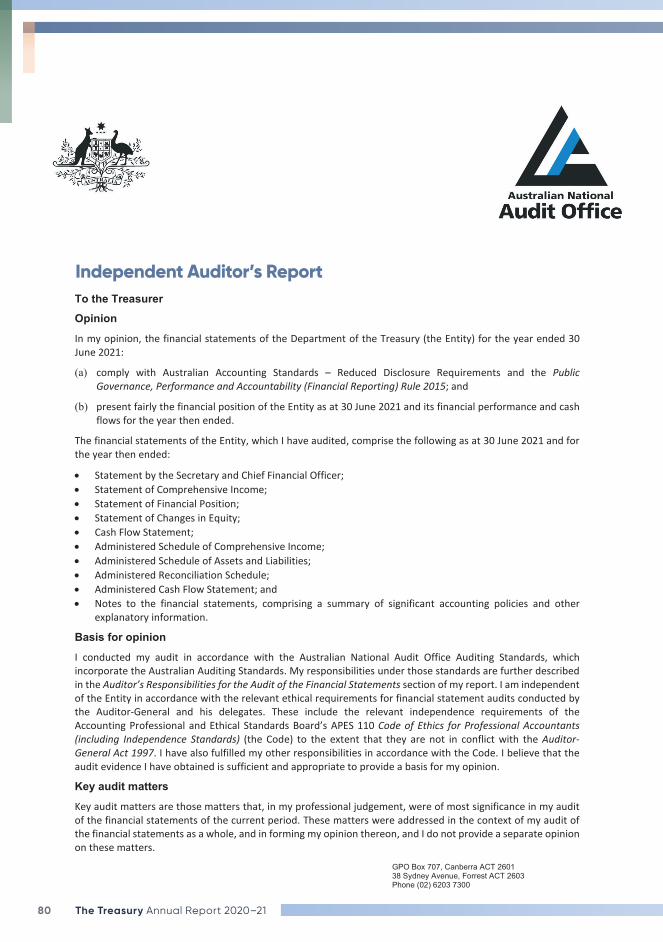
80 The Treasury Annual Report 2020–21
GPO Box 707, Canberra ACT 2601 38 Sydney Avenue, Forrest ACT 2603 Phone (02) 6203 7300
INDEPENDENT AUDITOR’S REPORT
To the Treasurer Opinion In my opinion, the financial statements of the Department of the Treasury (the Entity) for the year ended 30 June 2021:
(a) comply with Australian Accounting Standards – Reduced Disclosure Requirements and the Public Governance, Performance and Accountability (Financial Reporting) Rule 2015; and
(b) present fairly the financial position of the Entity as at 30 June 2021 and its financial performance and cash flows for the year then ended.
The financial statements of the Entity, which I have audited, comprise the following as at 30 June 2021 and for the year then ended:
• Statement by the Secretary and Chief Financial Officer; • Statement of Comprehensive Income; • Statement of Financial Position; • Statement of Changes in Equity; • Cash Flow Statement; • Administered Schedule of Comprehensive Income; • Administered Schedule of Assets and Liabilities; • Administered Reconciliation Schedule; • Administered Cash Flow Statement; and • Notes to the financial statements, comprising a summary of significant accounting policies and other
explanatory information.
Basis for opinion
I conducted my audit in accordance with the Australian National Audit Office Auditing Standards, which incorporate the Australian Auditing Standards. My responsibilities under those standards are further described in the Auditor’s Responsibilities for the Audit of the Financial Statements section of my report. I am independent of the Entity in accordance with the relevant ethical requirements for financial statement audits conducted by the Auditor-General and his delegates. These include the relevant independence requirements of the Accounting Professional and Ethical Standards Board’s APES 110 Code of Ethics for Professional Accountants (including Independence Standards) (the Code) to the extent that they are not in conflict with the Auditor-General Act 1997. I have also fulfilled my other responsibilities in accordance with the Code. I believe that the audit evidence I have obtained is sufficient and appropriate to provide a basis for my opinion.
Key audit matters Key audit matters are those matters that, in my professional judgement, were of most significance in my audit of the financial statements of the current period. These matters were addressed in the context of my audit of the financial statements as a whole, and in forming my opinion thereon, and I do not provide a separate opinion on these matters.
Independent Auditor’s Report
GPO Box 707, Canberra ACT 2601 38 Sydney Avenue, Forrest ACT 2603 Phone (02) 6203 7300
INDEPENDENT AUDITOR’S REPORT
To the Treasurer Opinion In my opinion, the financial statements of the Department of the Treasury (the Entity) for the year ended 30 June 2021:
(a) comply with Australian Accounting Standards – Reduced Disclosure Requirements and the Public Governance, Performance and Accountability (Financial Reporting) Rule 2015; and
(b) present fairly the financial position of the Entity as at 30 June 2021 and its financial performance and cash flows for the year then ended.
The financial statements of the Entity, which I have audited, comprise the following as at 30 June 2021 and for the year then ended:
• Statement by the Secretary and Chief Financial Officer; • Statement of Comprehensive Income; • Statement of Financial Position; • Statement of Changes in Equity; • Cash Flow Statement; • Administered Schedule of Comprehensive Income; • Administered Schedule of Assets and Liabilities; • Administered Reconciliation Schedule; • Administered Cash Flow Statement; and • Notes to the financial statements, comprising a summary of significant accounting policies and other
explanatory information.
Basis for opinion
I conducted my audit in accordance with the Australian National Audit Office Auditing Standards, which incorporate the Australian Auditing Standards. My responsibilities under those standards are further described in the Auditor’s Responsibilities for the Audit of the Financial Statements section of my report. I am independent of the Entity in accordance with the relevant ethical requirements for financial statement audits conducted by the Auditor-General and his delegates. These include the relevant independence requirements of the Accounting Professional and Ethical Standards Board’s APES 110 Code of Ethics for Professional Accountants (including Independence Standards) (the Code) to the extent that they are not in conflict with the Auditor-General Act 1997. I have also fulfilled my other responsibilities in accordance with the Code. I believe that the audit evidence I have obtained is sufficient and appropriate to provide a basis for my opinion.
Key audit matters Key audit matters are those matters that, in my professional judgement, were of most significance in my audit of the financial statements of the current period. These matters were addressed in the context of my audit of the financial statements as a whole, and in forming my opinion thereon, and I do not provide a separate opinion on these matters.
81Part 4 Financial statements
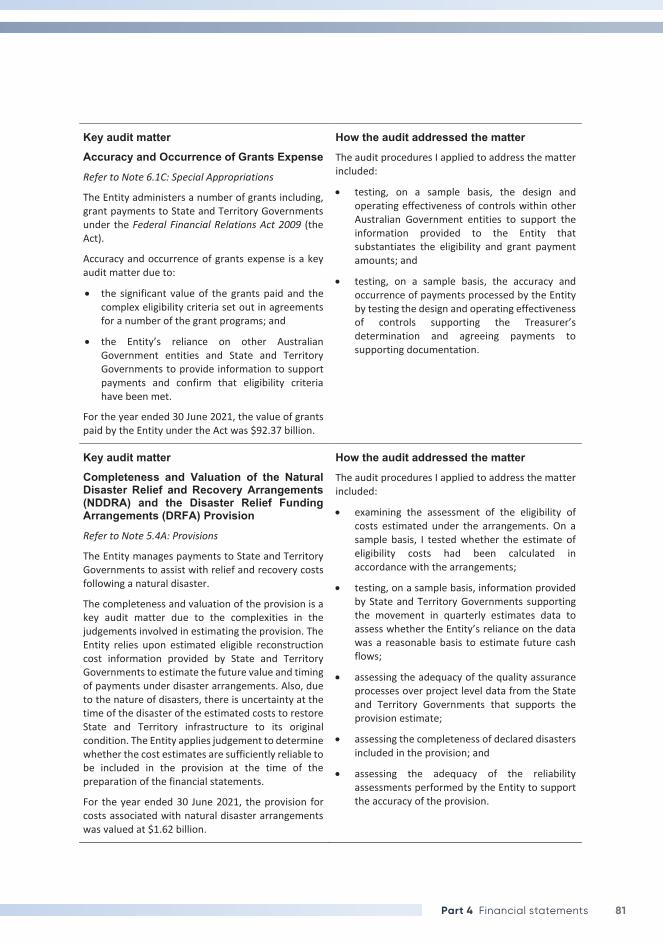
Key audit matter Accuracy and Occurrence of Grants Expense Refer to Note 6.1C: Special Appropriations
The Entity administers a number of grants including, grant payments to State and Territory Governments under the Federal Financial Relations Act 2009 (the Act).
Accuracy and occurrence of grants expense is a key audit matter due to:
• the significant value of the grants paid and the complex eligibility criteria set out in agreements for a number of the grant programs; and
• the Entity’s reliance on other Australian Government entities and State and Territory Governments to provide information to support payments and confirm that eligibility criteria have been met.
For the year ended 30 June 2021, the value of grants paid by the Entity under the Act was $92.37 billion.
How the audit addressed the matter The audit procedures I applied to address the matter included:
• testing, on a sample basis, the design and operating effectiveness of controls within other Australian Government entities to support the information provided to the Entity that substantiates the eligibility and grant payment amounts; and
• testing, on a sample basis, the accuracy and occurrence of payments processed by the Entity by testing the design and operating effectiveness of controls supporting the Treasurer’s determination and agreeing payments to supporting documentation.
Key audit matter Completeness and Valuation of the Natural Disaster Relief and Recovery Arrangements (NDDRA) and the Disaster Relief Funding Arrangements (DRFA) Provision Refer to Note 5.4A: Provisions
The Entity manages payments to State and Territory Governments to assist with relief and recovery costs following a natural disaster.
The completeness and valuation of the provision is a key audit matter due to the complexities in the judgements involved in estimating the provision. The Entity relies upon estimated eligible reconstruction cost information provided by State and Territory Governments to estimate the future value and timing of payments under disaster arrangements. Also, due to the nature of disasters, there is uncertainty at the time of the disaster of the estimated costs to restore State and Territory infrastructure to its original condition. The Entity applies judgement to determine whether the cost estimates are sufficiently reliable to be included in the provision at the time of the preparation of the financial statements.
For the year ended 30 June 2021, the provision for costs associated with natural disaster arrangements was valued at $1.62 billion.
How the audit addressed the matter The audit procedures I applied to address the matter included:
• examining the assessment of the eligibility of costs estimated under the arrangements. On a sample basis, I tested whether the estimate of eligibility costs had been calculated in accordance with the arrangements;
• testing, on a sample basis, information provided by State and Territory Governments supporting the movement in quarterly estimates data to assess whether the Entity’s reliance on the data was a reasonable basis to estimate future cash flows;
• assessing the adequacy of the quality assurance processes over project level data from the State and Territory Governments that supports the provision estimate;
• assessing the completeness of declared disasters included in the provision; and
• assessing the adequacy of the reliability assessments performed by the Entity to support the accuracy of the provision.
82 The Treasury Annual Report 2020–21
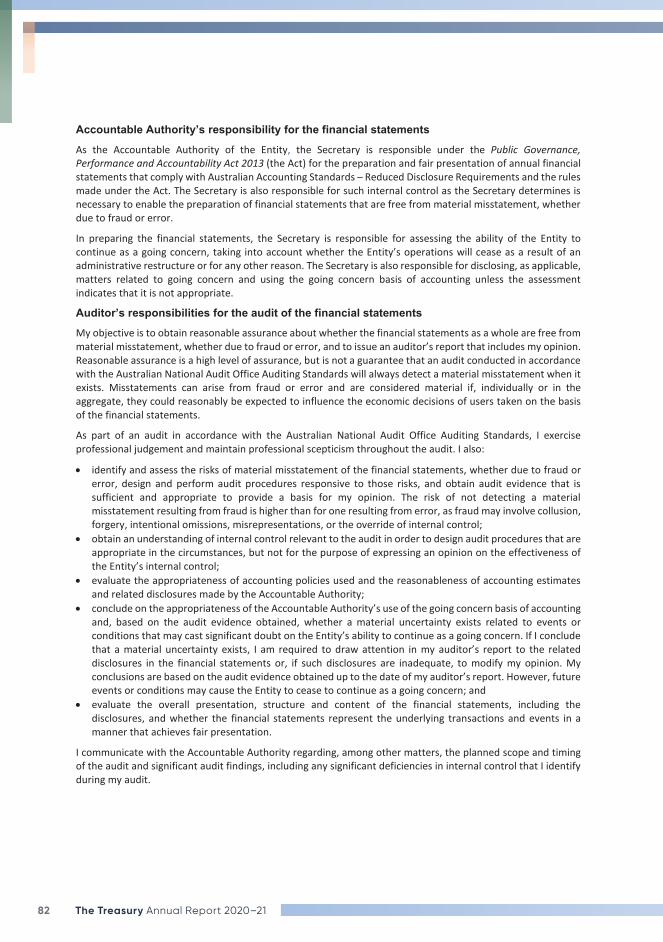
Accountable Authority’s responsibility for the financial statements As the Accountable Authority of the Entity, the Secretary is responsible under the Public Governance, Performance and Accountability Act 2013 (the Act) for the preparation and fair presentation of annual financial statements that comply with Australian Accounting Standards – Reduced Disclosure Requirements and the rules made under the Act. The Secretary is also responsible for such internal control as the Secretary determines is necessary to enable the preparation of financial statements that are free from material misstatement, whether due to fraud or error.
In preparing the financial statements, the Secretary is responsible for assessing the ability of the Entity to continue as a going concern, taking into account whether the Entity’s operations will cease as a result of an administrative restructure or for any other reason. The Secretary is also responsible for disclosing, as applicable, matters related to going concern and using the going concern basis of accounting unless the assessment indicates that it is not appropriate.
Auditor’s responsibilities for the audit of the financial statements My objective is to obtain reasonable assurance about whether the financial statements as a whole are free from material misstatement, whether due to fraud or error, and to issue an auditor’s report that includes my opinion. Reasonable assurance is a high level of assurance, but is not a guarantee that an audit conducted in accordance with the Australian National Audit Office Auditing Standards will always detect a material misstatement when it exists. Misstatements can arise from fraud or error and are considered material if, individually or in the aggregate, they could reasonably be expected to influence the economic decisions of users taken on the basis of the financial statements.
As part of an audit in accordance with the Australian National Audit Office Auditing Standards, I exercise professional judgement and maintain professional scepticism throughout the audit. I also:
• identify and assess the risks of material misstatement of the financial statements, whether due to fraud or error, design and perform audit procedures responsive to those risks, and obtain audit evidence that is sufficient and appropriate to provide a basis for my opinion. The risk of not detecting a material misstatement resulting from fraud is higher than for one resulting from error, as fraud may involve collusion, forgery, intentional omissions, misrepresentations, or the override of internal control;
• obtain an understanding of internal control relevant to the audit in order to design audit procedures that are appropriate in the circumstances, but not for the purpose of expressing an opinion on the effectiveness of the Entity’s internal control;
• evaluate the appropriateness of accounting policies used and the reasonableness of accounting estimates and related disclosures made by the Accountable Authority;
• conclude on the appropriateness of the Accountable Authority’s use of the going concern basis of accounting and, based on the audit evidence obtained, whether a material uncertainty exists related to events or conditions that may cast significant doubt on the Entity’s ability to continue as a going concern. If I conclude that a material uncertainty exists, I am required to draw attention in my auditor’s report to the related disclosures in the financial statements or, if such disclosures are inadequate, to modify my opinion. My conclusions are based on the audit evidence obtained up to the date of my auditor’s report. However, future events or conditions may cause the Entity to cease to continue as a going concern; and
• evaluate the overall presentation, structure and content of the financial statements, including the disclosures, and whether the financial statements represent the underlying transactions and events in a manner that achieves fair presentation.
I communicate with the Accountable Authority regarding, among other matters, the planned scope and timing of the audit and significant audit findings, including any significant deficiencies in internal control that I identify during my audit.
83Part 4 Financial statements
From the matters communicated with the Accountable Authority, I determine those matters that were of most significance in the audit of the financial statements of the current period and are therefore the key audit matters. I describe these matters in my auditor’s report unless law or regulation precludes public disclosure about the matter or when, in extremely rare circumstances, I determine that a matter should not be communicated in my report because the adverse consequences of doing so would reasonably be expected to outweigh the public interest benefits of such communication.
Australian National Audit Office
Mark Vial Acting Executive Director
Delegate of the Auditor-General
Canberra
16 September 2021
84 The Treasury Annual Report 2020–21
The TreasuryStatement by the Secretary and Chief Financial OfficerIn our opinion, the attached financial statements of the year ended 30 June 2021 comply with subsection 42(2) of the Public Governance, Performance and Accountability Act 2013 (PGPA Act), and are based on properly maintained financial records as per subsection 41(2) of the PGPA Act.
In our opinion, at the date of this statement, there are reasonable grounds to believe that the Treasury will be able to pay its debts as and when they fall due.
Dr Steven Kennedy PSM Secretary to the Treasury 16 September 2021
Tarnya Gersbach Chief Financial Officer 16 September 2021
85Part 4 Financial statements
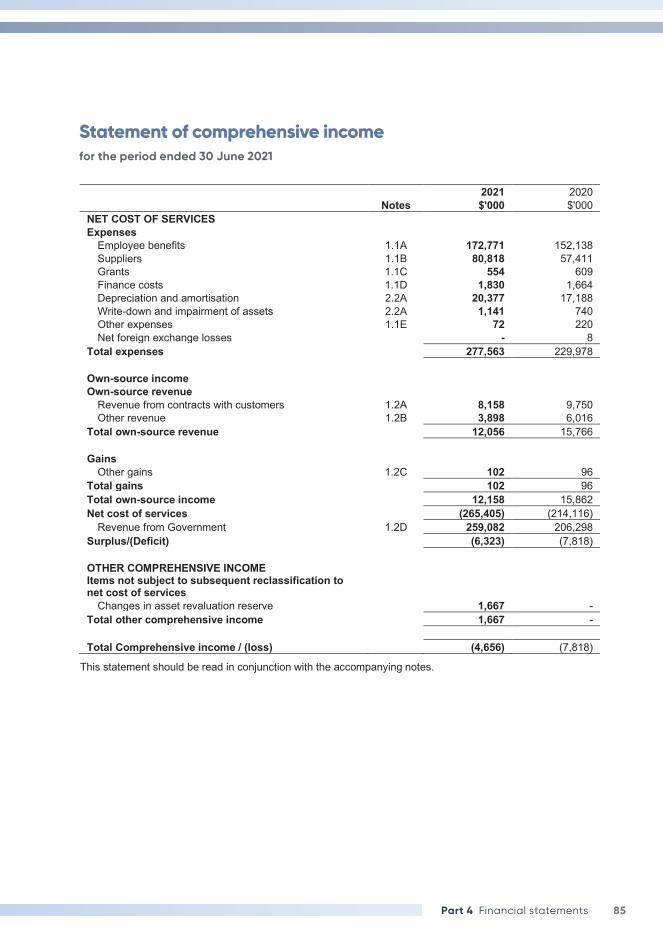
Statement of comprehensive incomefor the period ended 30 June 2021
Statement of Comprehensive Income for the period ended 30 June 2021
2021 2020 Notes $'000 $'000 NET COST OF SERVICES Expenses
Employee benefits 1.1A 172,771 152,138 Suppliers 1.1B 80,818 57,411 Grants 1.1C 554 609 Finance costs 1.1D 1,830 1,664 Depreciation and amortisation 2.2A 20,377 17,188 Write-down and impairment of assets 2.2A 1,141 740 Other expenses 1.1E 72 220 Net foreign exchange losses - 8
Total expenses 277,563 229,978 Own-source income Own-source revenue
Revenue from contracts with customers 1.2A 8,158 9,750 Other revenue 1.2B 3,898 6,016
Total own-source revenue 12,056 15,766 Gains
Other gains 1.2C 102 96 Total gains 102 96 Total own-source income 12,158 15,862 Net cost of services (265,405) (214,116)
Revenue from Government 1.2D 259,082 206,298 Surplus/(Deficit) (6,323) (7,818) OTHER COMPREHENSIVE INCOME Items not subject to subsequent reclassification to net cost of services
Changes in asset revaluation reserve 1,667 - Total other comprehensive income 1,667 - Total Comprehensive income / (loss) (4,656) (7,818)
This statement should be read in conjunction with the accompanying notes.
86 The Treasury Annual Report 2020–21
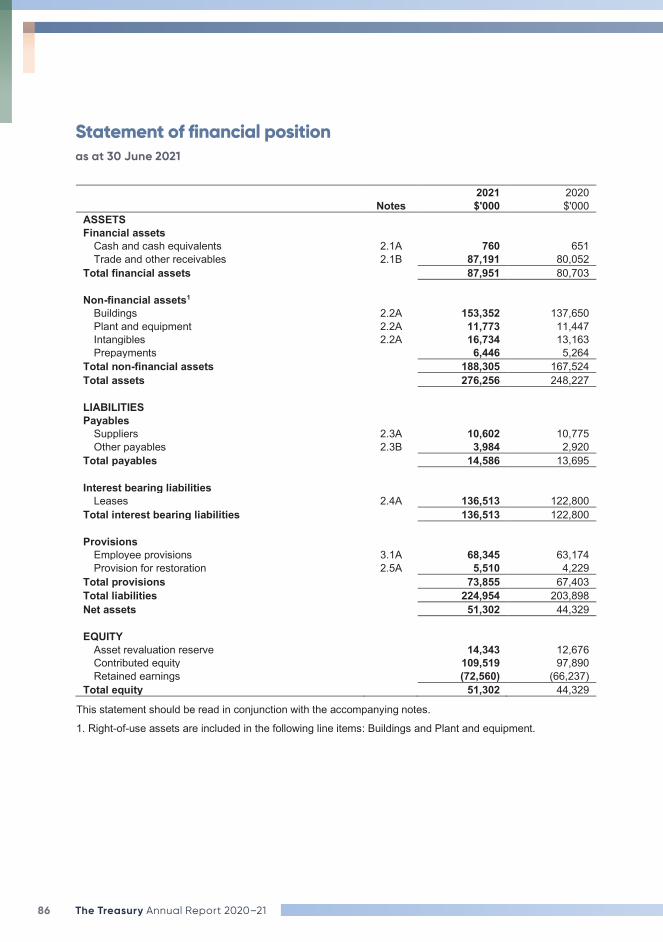
Statement of financial positionas at 30 June 2021
Statement of Financial Position as at 30 June 2021
2021 2020 Notes $'000 $'000 ASSETS Financial assets
Cash and cash equivalents 2.1A 760 651 Trade and other receivables 2.1B 87,191 80,052
Total financial assets 87,951 80,703 Non-financial assets1
Buildings 2.2A 153,352 137,650 Plant and equipment 2.2A 11,773 11,447 Intangibles 2.2A 16,734 13,163 Prepayments 6,446 5,264
Total non-financial assets 188,305 167,524 Total assets 276,256 248,227 LIABILITIES Payables
Suppliers 2.3A 10,602 10,775 Other payables 2.3B 3,984 2,920
Total payables 14,586 13,695 Interest bearing liabilities
Leases 2.4A 136,513 122,800 Total interest bearing liabilities 136,513 122,800 Provisions
Employee provisions 3.1A 68,345 63,174 Provision for restoration 2.5A 5,510 4,229
Total provisions 73,855 67,403 Total liabilities 224,954 203,898 Net assets 51,302 44,329 EQUITY
Asset revaluation reserve 14,343 12,676 Contributed equity 109,519 97,890 Retained earnings (72,560) (66,237)
Total equity 51,302 44,329
This statement should be read in conjunction with the accompanying notes.
1. Right-of-use assets are included in the following line items: Buildings and Plant and equipment.
87Part 4 Financial statements
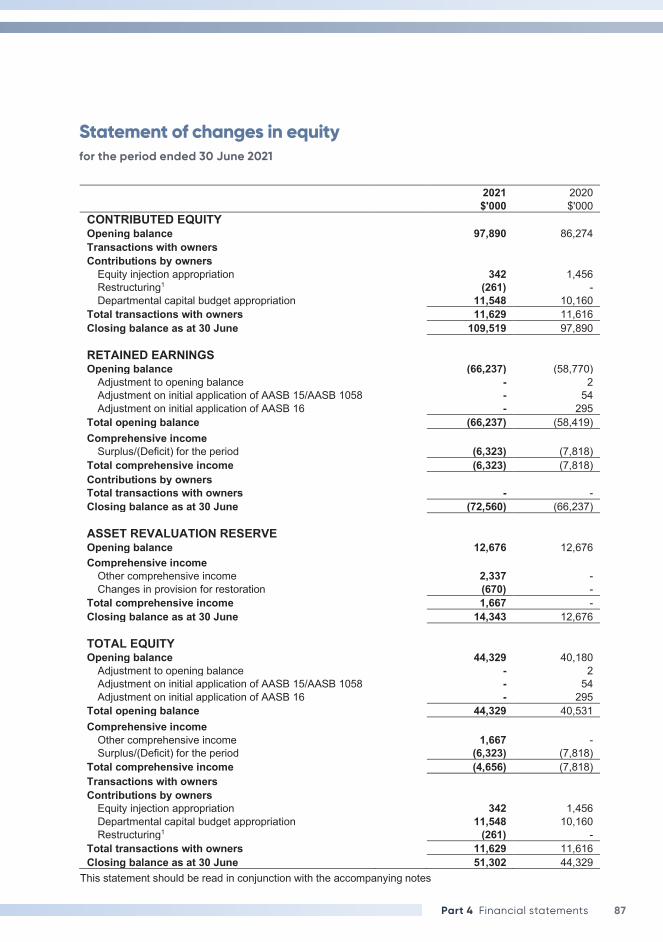
Statement of changes in equityfor the period ended 30 June 2021
Statement of Changes in Equity for the period ended 30 June 2021
2021 2020 $'000 $'000 CONTRIBUTED EQUITY Opening balance 97,890 86,274 Transactions with owners Contributions by owners
Equity injection appropriation 342 1,456 Restructuring1 (261) - Departmental capital budget appropriation 11,548 10,160
Total transactions with owners 11,629 11,616 Closing balance as at 30 June 109,519 97,890 RETAINED EARNINGS Opening balance (66,237) (58,770)
Adjustment to opening balance - 2 Adjustment on initial application of AASB 15/AASB 1058 - 54 Adjustment on initial application of AASB 16 - 295
Total opening balance (66,237) (58,419) Comprehensive income
Surplus/(Deficit) for the period (6,323) (7,818) Total comprehensive income (6,323) (7,818) Contributions by owners Total transactions with owners - - Closing balance as at 30 June (72,560) (66,237) ASSET REVALUATION RESERVE Opening balance 12,676 12,676 Comprehensive income
Other comprehensive income 2,337 - Changes in provision for restoration (670) -
Total comprehensive income 1,667 - Closing balance as at 30 June 14,343 12,676 TOTAL EQUITY Opening balance 44,329 40,180
Adjustment to opening balance - 2 Adjustment on initial application of AASB 15/AASB 1058 - 54 Adjustment on initial application of AASB 16 - 295
Total opening balance 44,329 40,531 Comprehensive income
Other comprehensive income 1,667 - Surplus/(Deficit) for the period (6,323) (7,818)
Total comprehensive income (4,656) (7,818) Transactions with owners Contributions by owners
Equity injection appropriation 342 1,456 Departmental capital budget appropriation 11,548 10,160 Restructuring1 (261) -
Total transactions with owners 11,629 11,616 Closing balance as at 30 June 51,302 44,329
This statement should be read in conjunction with the accompanying notes
88 The Treasury Annual Report 2020–21
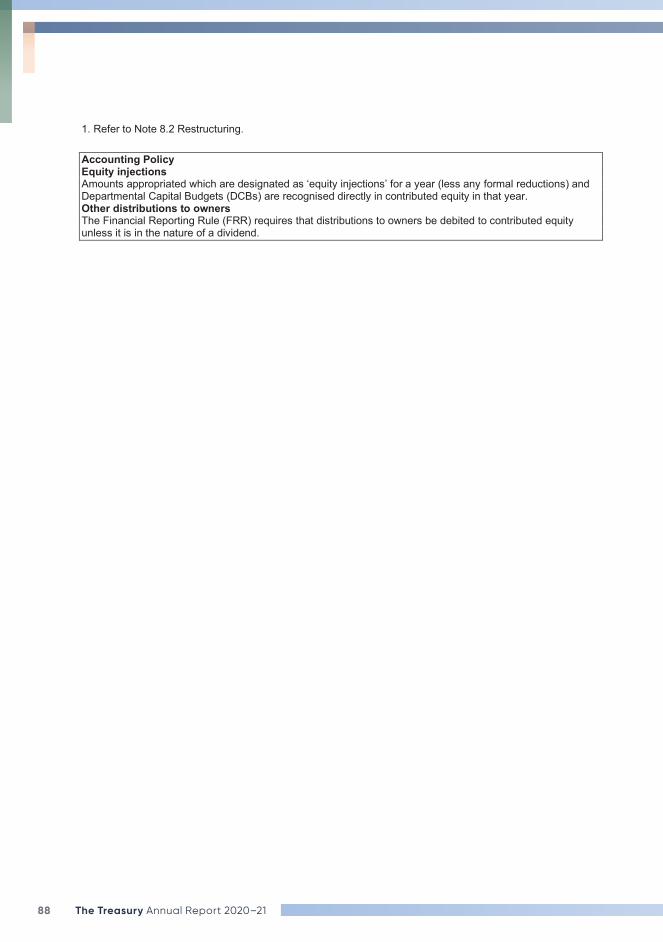
1. Refer to Note 8.2 Restructuring. Accounting Policy Equity injections Amounts appropriated which are designated as ‘equity injections’ for a year (less any formal reductions) and Departmental Capital Budgets (DCBs) are recognised directly in contributed equity in that year. Other distributions to owners The Financial Reporting Rule (FRR) requires that distributions to owners be debited to contributed equity unless it is in the nature of a dividend.
89Part 4 Financial statements
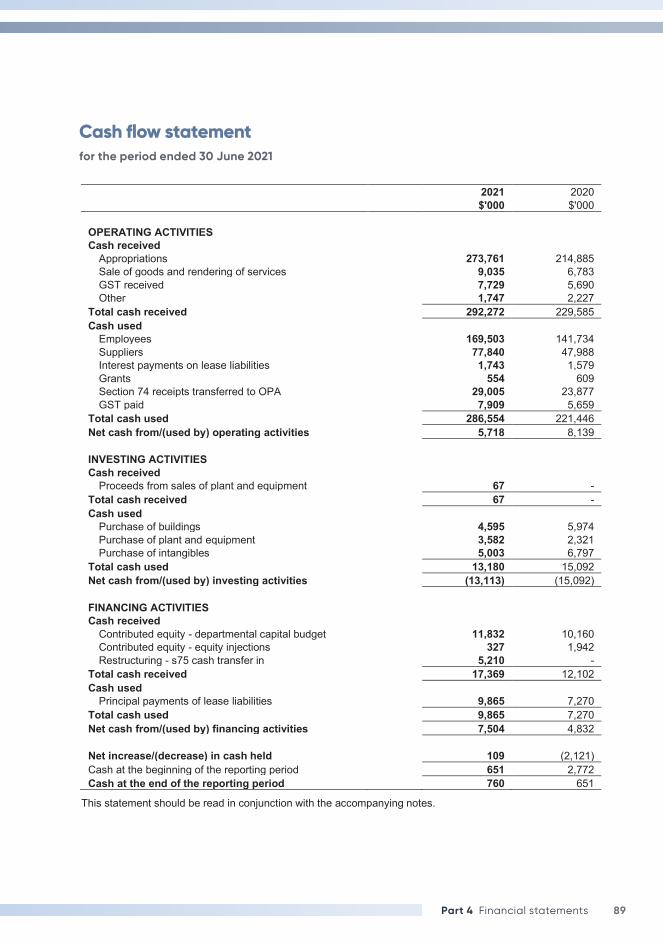
Cash flow statementfor the period ended 30 June 2021
Cash Flow Statement for the period ended 30 June 2021
2021 2020 $'000 $'000 OPERATING ACTIVITIES Cash received
Appropriations 273,761 214,885 Sale of goods and rendering of services 9,035 6,783 GST received 7,729 5,690 Other 1,747 2,227
Total cash received 292,272 229,585 Cash used
Employees 169,503 141,734 Suppliers 77,840 47,988 Interest payments on lease liabilities 1,743 1,579 Grants 554 609 Section 74 receipts transferred to OPA 29,005 23,877 GST paid 7,909 5,659
Total cash used 286,554 221,446 Net cash from/(used by) operating activities 5,718 8,139 INVESTING ACTIVITIES Cash received
Proceeds from sales of plant and equipment 67 - Total cash received 67 - Cash used
Purchase of buildings 4,595 5,974 Purchase of plant and equipment 3,582 2,321 Purchase of intangibles 5,003 6,797
Total cash used 13,180 15,092 Net cash from/(used by) investing activities (13,113) (15,092) FINANCING ACTIVITIES Cash received
Contributed equity - departmental capital budget 11,832 10,160 Contributed equity - equity injections 327 1,942 Restructuring - s75 cash transfer in 5,210 -
Total cash received 17,369 12,102 Cash used
Principal payments of lease liabilities 9,865 7,270 Total cash used 9,865 7,270 Net cash from/(used by) financing activities 7,504 4,832 Net increase/(decrease) in cash held 109 (2,121) Cash at the beginning of the reporting period 651 2,772 Cash at the end of the reporting period 760 651
This statement should be read in conjunction with the accompanying notes.
90 The Treasury Annual Report 2020–21
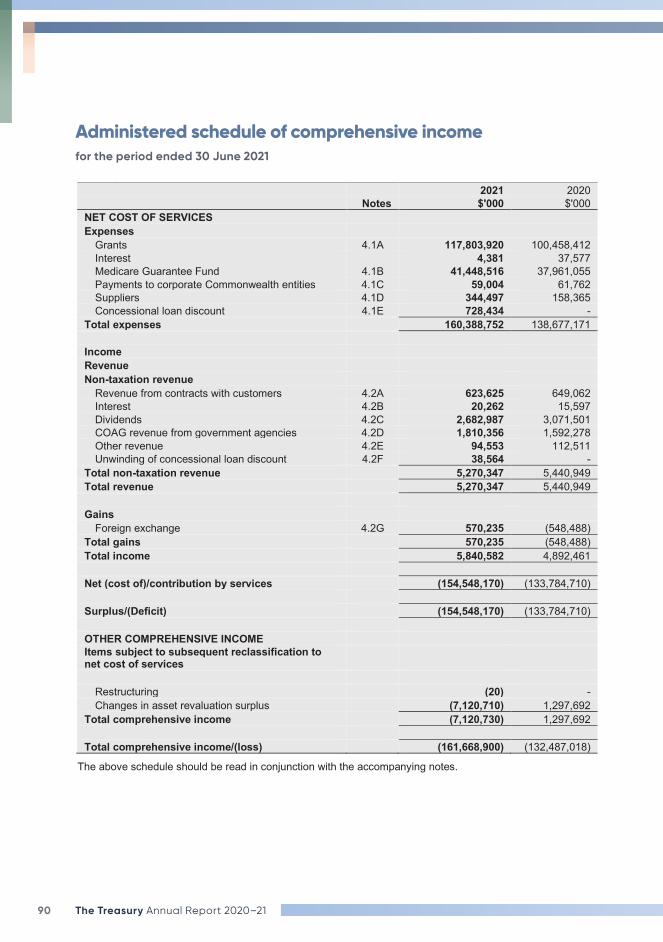
Administered schedule of comprehensive incomefor the period ended 30 June 2021
Administered Schedule of Comprehensive Income for the period ended 30 June 2021
2021 2020 Notes $'000 $'000 NET COST OF SERVICES Expenses
Grants 4.1A 117,803,920 100,458,412 Interest 4,381 37,577 Medicare Guarantee Fund 4.1B 41,448,516 37,961,055 Payments to corporate Commonwealth entities 4.1C 59,004 61,762 Suppliers 4.1D 344,497 158,365 Concessional loan discount 4.1E 728,434 -
Total expenses 160,388,752 138,677,171 Income Revenue Non-taxation revenue
Revenue from contracts with customers 4.2A 623,625 649,062 Interest 4.2B 20,262 15,597 Dividends 4.2C 2,682,987 3,071,501 COAG revenue from government agencies 4.2D 1,810,356 1,592,278 Other revenue 4.2E 94,553 112,511 Unwinding of concessional loan discount 4.2F 38,564 -
Total non-taxation revenue 5,270,347 5,440,949 Total revenue 5,270,347 5,440,949 Gains
Foreign exchange 4.2G 570,235 (548,488) Total gains 570,235 (548,488) Total income 5,840,582 4,892,461 Net (cost of)/contribution by services (154,548,170) (133,784,710) Surplus/(Deficit) (154,548,170) (133,784,710) OTHER COMPREHENSIVE INCOME Items subject to subsequent reclassification to net cost of services
Restructuring (20) - Changes in asset revaluation surplus (7,120,710) 1,297,692
Total comprehensive income (7,120,730) 1,297,692 Total comprehensive income/(loss) (161,668,900) (132,487,018)
The above schedule should be read in conjunction with the accompanying notes.
91Part 4 Financial statements
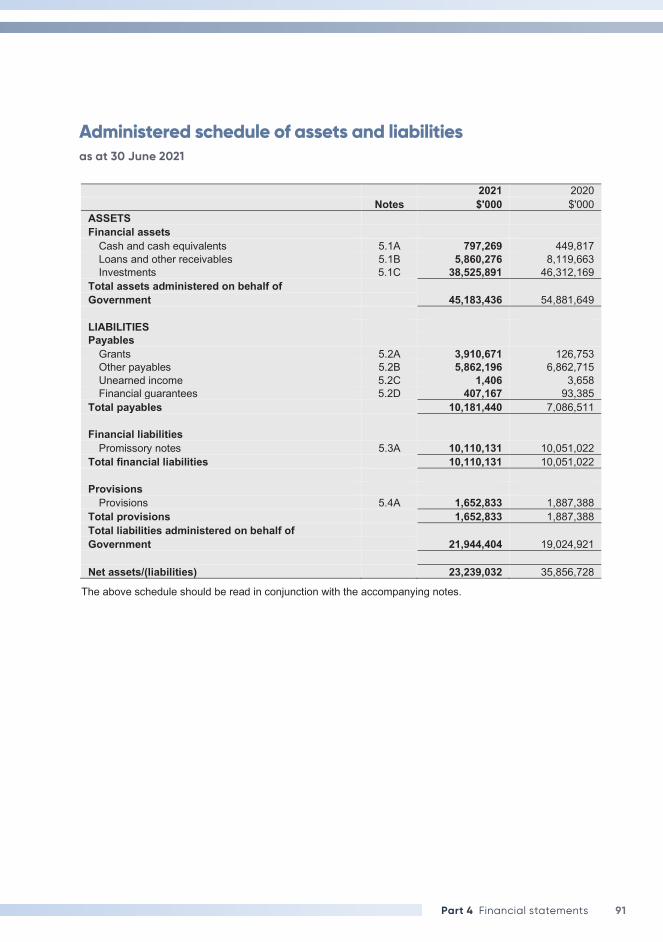
Administered schedule of assets and liabilities as at 30 June 2021
Administered Schedule of Assets and Liabilities as at 30 June 2021
2021 2020 Notes $'000 $'000 ASSETS Financial assets
Cash and cash equivalents 5.1A 797,269 449,817 Loans and other receivables 5.1B 5,860,276 8,119,663 Investments 5.1C 38,525,891 46,312,169
Total assets administered on behalf of 45,183,436 54,881,649 Government
LIABILITIES Payables
Grants 5.2A 3,910,671 126,753 Other payables 5.2B 5,862,196 6,862,715 Unearned income 5.2C 1,406 3,658 Financial guarantees 5.2D 407,167 93,385
Total payables 10,181,440 7,086,511 Financial liabilities
Promissory notes 5.3A 10,110,131 10,051,022 Total financial liabilities 10,110,131 10,051,022
Provisions
Provisions 5.4A 1,652,833 1,887,388 Total provisions 1,652,833 1,887,388 Total liabilities administered on behalf of
21,944,404 19,024,921 Government Net assets/(liabilities) 23,239,032 35,856,728
The above schedule should be read in conjunction with the accompanying notes.
92 The Treasury Annual Report 2020–21
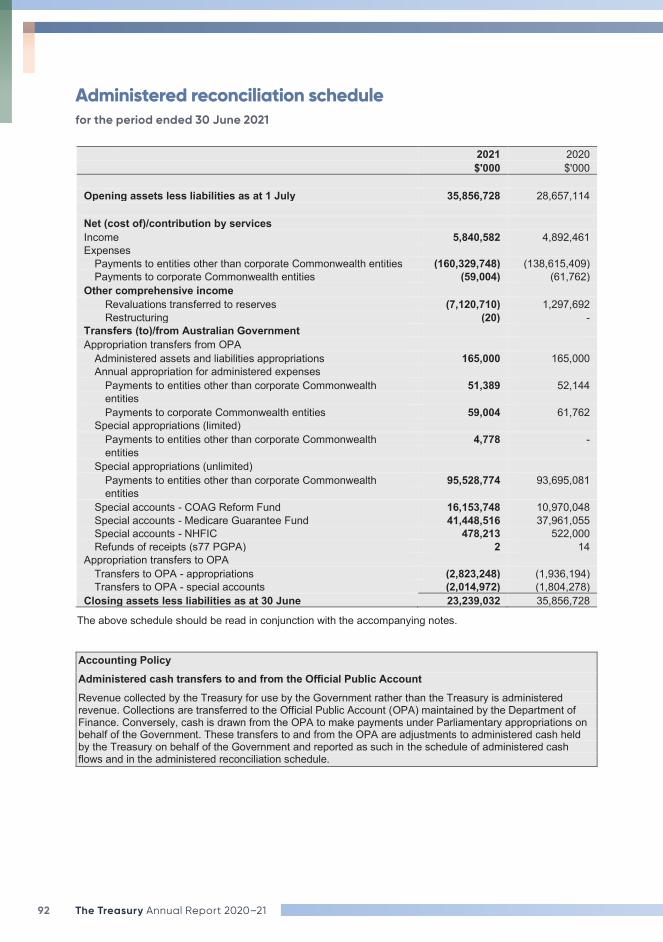
Administered reconciliation schedulefor the period ended 30 June 2021
Administered Reconciliation Schedule for the period ended 30 June 2021
2021 2020 $'000 $'000 Opening assets less liabilities as at 1 July 35,856,728 28,657,114 Net (cost of)/contribution by services Income 5,840,582 4,892,461 Expenses
Payments to entities other than corporate Commonwealth entities (160,329,748) (138,615,409) Payments to corporate Commonwealth entities (59,004) (61,762)
Other comprehensive income Revaluations transferred to reserves (7,120,710) 1,297,692 Restructuring (20) -
Transfers (to)/from Australian Government Appropriation transfers from OPA
Administered assets and liabilities appropriations 165,000 165,000 Annual appropriation for administered expenses
Payments to entities other than corporate Commonwealth 51,389 52,144 entities Payments to corporate Commonwealth entities 59,004 61,762
Special appropriations (limited) Payments to entities other than corporate Commonwealth 4,778 - entities
Special appropriations (unlimited) Payments to entities other than corporate Commonwealth 95,528,774 93,695,081 entities
Special accounts - COAG Reform Fund 16,153,748 10,970,048 Special accounts - Medicare Guarantee Fund 41,448,516 37,961,055 Special accounts - NHFIC 478,213 522,000 Refunds of receipts (s77 PGPA) 2 14
Appropriation transfers to OPA Transfers to OPA - appropriations (2,823,248) (1,936,194) Transfers to OPA - special accounts (2,014,972) (1,804,278)
Closing assets less liabilities as at 30 June 23,239,032 35,856,728
The above schedule should be read in conjunction with the accompanying notes.
Accounting Policy Administered cash transfers to and from the Official Public Account Revenue collected by the Treasury for use by the Government rather than the Treasury is administered revenue. Collections are transferred to the Official Public Account (OPA) maintained by the Department of Finance. Conversely, cash is drawn from the OPA to make payments under Parliamentary appropriations on behalf of the Government. These transfers to and from the OPA are adjustments to administered cash held by the Treasury on behalf of the Government and reported as such in the schedule of administered cash flows and in the administered reconciliation schedule.
93Part 4 Financial statements
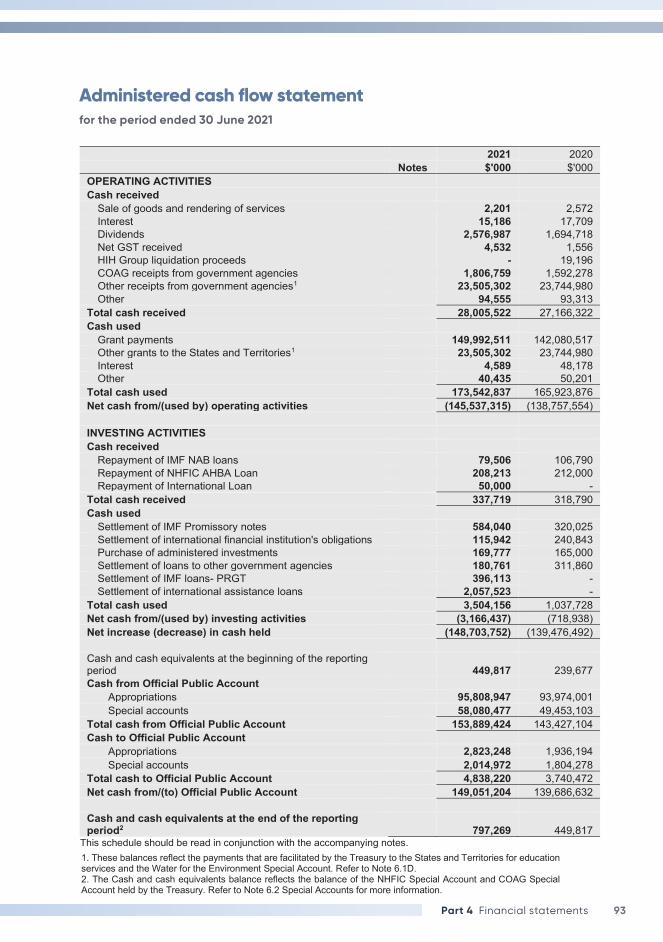
Administered cash flow statementfor the period ended 30 June 2021
Administered Cash Flow Statement for the period ended 30 June 2021
2021 2020 Notes $'000 $'000 OPERATING ACTIVITIES Cash received
Sale of goods and rendering of services 2,201 2,572 Interest 15,186 17,709 Dividends 2,576,987 1,694,718 Net GST received 4,532 1,556 HIH Group liquidation proceeds - 19,196 COAG receipts from government agencies 1,806,759 1,592,278 Other receipts from government agencies1 23,505,302 23,744,980 Other 94,555 93,313
Total cash received 28,005,522 27,166,322 Cash used
Grant payments 149,992,511 142,080,517 Other grants to the States and Territories1 23,505,302 23,744,980 Interest 4,589 48,178 Other 40,435 50,201
Total cash used 173,542,837 165,923,876 Net cash from/(used by) operating activities (145,537,315) (138,757,554) INVESTING ACTIVITIES Cash received
Repayment of IMF NAB loans 79,506 106,790 Repayment of NHFIC AHBA Loan 208,213 212,000 Repayment of International Loan 50,000 -
Total cash received 337,719 318,790 Cash used
Settlement of IMF Promissory notes 584,040 320,025 Settlement of international financial institution's obligations 115,942 240,843 Purchase of administered investments 169,777 165,000 Settlement of loans to other government agencies 180,761 311,860 Settlement of IMF loans- PRGT 396,113 - Settlement of international assistance loans 2,057,523 -
Total cash used 3,504,156 1,037,728 Net cash from/(used by) investing activities (3,166,437) (718,938) Net increase (decrease) in cash held (148,703,752) (139,476,492) Cash and cash equivalents at the beginning of the reporting period 449,817 239,677 Cash from Official Public Account
Appropriations 95,808,947 93,974,001 Special accounts 58,080,477 49,453,103
Total cash from Official Public Account 153,889,424 143,427,104 Cash to Official Public Account
Appropriations 2,823,248 1,936,194 Special accounts 2,014,972 1,804,278
Total cash to Official Public Account 4,838,220 3,740,472 Net cash from/(to) Official Public Account 149,051,204 139,686,632 Cash and cash equivalents at the end of the reporting period2 797,269 449,817
This schedule should be read in conjunction with the accompanying notes.
1. These balances reflect the payments that are facilitated by the Treasury to the States and Territories for education services and the Water for the Environment Special Account. Refer to Note 6.1D. 2. The Cash and cash equivalents balance reflects the balance of the NHFIC Special Account and COAG Special Account held by the Treasury. Refer to Note 6.2 Special Accounts for more information.
94 The Treasury Annual Report 2020–21
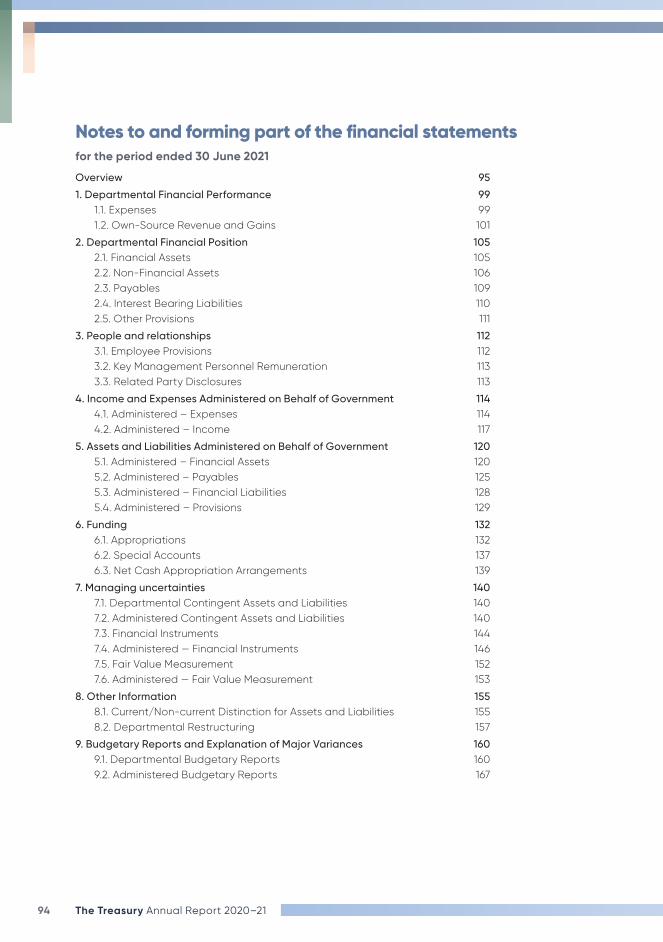
Notes to and forming part of the financial statementsfor the period ended 30 June 2021
Overview 95
1. Departmental Financial Performance 991.1. Expenses 991.2. Own-Source Revenue and Gains 101
2. Departmental Financial Position 1052.1. Financial Assets 1052.2. Non-Financial Assets 1062.3. Payables 1092.4. Interest Bearing Liabilities 1102.5. Other Provisions 111
3. People and relationships 1123.1. Employee Provisions 1123.2. Key Management Personnel Remuneration 1133.3. Related Party Disclosures 113
4. Income and Expenses Administered on Behalf of Government 1144.1. Administered – Expenses 1144.2. Administered – Income 117
5. Assets and Liabilities Administered on Behalf of Government 1205.1. Administered – Financial Assets 1205.2. Administered – Payables 1255.3. Administered – Financial Liabilities 1285.4. Administered – Provisions 129
6. Funding 1326.1. Appropriations 1326.2. Special Accounts 1376.3. Net Cash Appropriation Arrangements 139
7. Managing uncertainties 1407.1. Departmental Contingent Assets and Liabilities 1407.2. Administered Contingent Assets and Liabilities 1407.3. Financial Instruments 1447.4. Administered — Financial Instruments 1467.5. Fair Value Measurement 1527.6. Administered — Fair Value Measurement 153
8. Other Information 1558.1. Current/Non-current Distinction for Assets and Liabilities 1558.2. Departmental Restructuring 157
9. Budgetary Reports and Explanation of Major Variances 1609.1. Departmental Budgetary Reports 1609.2. Administered Budgetary Reports 167
95Part 4 Financial statements
Overview
Objectives of the Department of the TreasuryThe Department of the Treasury is an Australian Government controlled entity. It is a not-for-profit entity. The objective of the Department of the Treasury, known as ‘the Treasury’, is to support and implement informed decisions on policies for the good of the Australian people, consistent with achieving strong, sustainable economic growth and fiscal settings.
The Basis of Preparation The financial statements are general purpose financial statements and are required by section 42 of the Public Governance, Performance and Accountability Act 2013.
The financial statements have been prepared in accordance with:
� Public Governance, Performance and Accountability (Financial Reporting) Rule 2015; and
� Australian Accounting Standards and interpretations – Reduced Disclosure Requirements issued by the Australian Accounting Standards Board (AASB) that apply for the reporting period.
The Treasury has applied the Reduced Disclosure Requirements issued by the AASB with the exception of disclosures for administered activities prepared under the following accounting standards, as required under Subsection 18(3) of the Public Governance, Performance and Accountability (Financial Reporting) Rule 2015:
� AASB 7 Financial Instruments: Disclosure;
� AASB 12 Disclosure of Interests in Other Entities; and
� AASB 13 Fair Value Measurement.
The financial statements have been prepared on an accrual basis and in accordance with the historical cost convention, except for certain assets at fair value. Except where stated, no allowance is made for the effect of changing prices on the results or the financial position. The financial statements are presented in Australian dollars. The financial statements are rounded to the nearest thousand.
Reporting of administered activities Administered revenues, expenses, assets, liabilities and cash flows are disclosed in the administered schedules and related notes.
Except where otherwise stated, administered items are accounted for on the same basis and using the same policies as for departmental items, including the application of Australian Accounting Standards.
Appropriations of administered capital are recognised in administered equity when the amounts appropriated by Parliament are drawn down. For the purposes of the Treasury annual report, administered equity transactions are not disclosed separately.
96 The Treasury Annual Report 2020–21
Impact of Restructuring 2020–21On 15 April 2021, an Executive Order was made to abolish the Infrastructure and Project Financing Agency (IPFA) as an Executive Agency from the completion of 30 April 2021.
Financial reporting and accounting disclosures have been prepared in accordance with the requirements of the Public Governance, Performance and Accountability Rule 2014, which details the reporting and disclosure requirements when a restructure occurs. Accordingly, the Treasury has prepared a single set of financial statements as if IPFA was part of the Treasury for the entire 2020–21 reporting period, including the financial results attributable to the IPFA function from 1 July 2020 to 30 April 2021. Refer to IPFA’s 2019–20 Annual Report for IPFA comparative information.
Details of assets and liabilities transferred are included at note 8.2B.
New accounting standardsNo accounting standard has been adopted earlier than the application date as stated in the standard.
All new standards that were issued prior to the signing of the statement by the Departmental Secretary and Chief Financial Officer, and are applicable to the current reporting period did not have a material effect on the Treasury’s financial statements:
Standard/InterpretationNature of change in accounting policy, transitional provisions, and adjustment to financial statements
AASB 1059 Service Concession Arrangements: Grantors
AASB 1059 became effective from 1 July 2020.
The new standard addresses the accounting for a service concession arrangement by a grantor that is a public sector entity by prescribing the accounting for the arrangement from a grantor’s perspective.
Prior to the issuance of AASB 1059, there was no definitive accounting guidance in Australia for service concession arrangements, which include a number of public private partnerships (PPP) arrangements. The AASB issued the new standard to address the lack of specific accounting guidance and based the content thereof broadly on its international equivalent: International Public Sector Accounting Standard 32: Service Concession Arrangements: Grantor.
The details of the changes in accounting policies, transitional provisions and adjustments are disclosed below and in the relevant notes to the financial statements.
Application of AASB 1059 Service Concession Arrangements: Grantors
The Treasury has adopted AASB 1059 using the modified retrospective approach at 1 July 2020.
For arrangements within the scope of AASB 1059, on transition and at initial recognition a public sector grantor is required to record the asset(s) used in the service concession arrangement at current replacement cost in accordance with the cost approach to Fair Value under AASB 13 Fair Value Measurement, with a related liability, which could be a financial liability, an accrued revenue liability or a combination of both.
After initial recognition, service concession assets are measured applying the Treasury’s property, plant and equipment and intangible assets subsequent measurement accounting policies.
97Part 4 Financial statements
The Treasury has reviewed all arrangements (including leasing arrangements) that are controlled and administered by the Treasury to assess whether AASB 1059 applies. The Treasury identified no arrangements within the scope of AASB 1059.
TaxationThe Treasury is exempt from all forms of taxation except Fringe Benefits Tax (FBT) and the Goods and Services Tax (GST).
Foreign currencyTransactions denominated in a foreign currency are converted at the exchange rate at the date of the transaction. Foreign currency receivables and payables are translated at the exchange rates current as at balance date.
Compliance with Statutory Conditions for Payments from the Consolidated Revenue FundDuring 2020–21 Treasury reviewed its exposure to the risk of not complying with statutory conditions on payments from appropriations, namely section 83 of the Constitution. To minimise potential breaches, Treasury continues to monitor and adapt its verification procedures as necessary, particularly in relation to payments under the Federal Financial Relations Act 2009 and COAG Reform Fund Act 2008.
Treasury identified that 25 potential technical payments made between 7 August 2019 and 9 November 2020, totalling $85.5 million ($59.4 million in 2019–20 and $26.1 million in 2020–21, out of total National Partnership Payments of $6.8 billion in 2019–20 and $11.5 billion in 2020–21) were potentially in breach of section 83 of the Constitution. The payments relate to eight Commonwealth-State funding agreements administered by four Commonwealth agencies. After milestones in project agreements were achieved, Commonwealth agency senior officials certified that they had been met and provided representations to Treasury that appropriate ministerial authorisations existed for payment. However, it was subsequently identified that these senior officials did not have written ministerial authorisation to exercise this function.
The potential technical breaches were identified following Treasury’s recent review of authorisations for all payments made in 2019–20 and 2020–21. Treasury has worked with the relevant Commonwealth agencies to ensure that there is now written ministerial authorisation in place for senior officials to assess the achievement of project milestones on the minister’s behalf. Treasury has also strengthened its controls over payment authorisations and commenced a review of its risk assessment framework for Commonwealth-State funding agreements to safeguard against future potential breaches. Treasury will continue to monitor its level of compliance with section 83 of the Constitution across all legislation for which it is administratively responsible.
98 The Treasury Annual Report 2020–21
Events After the Reporting PeriodThere are no known events occurring after the reporting period that could impact on the financial statements.
Glossary of abbreviationsThe following abbreviations are standardised throughout the financial statements:
� ACCC — Australian Competition and Consumer Commission
� ASBFEO — Australian Small Business and Family Enterprise Ombudsman
� ATO — Australian Taxation Office
� COAG — Council of Australian Governments
� CSIRO — The Commonwealth Scientific and Industrial Research Organisation
� DRFA — Disaster Recovery Funding Arrangements (applicable to events after 1 November 2018)
� IMF — International Monetary Fund
� IPFA — Infrastructure and Project Financing Agency
� MOV — Maintenance of Value
� NDRRA — Natural Disaster Relief and Recovery Arrangements (applicable to events prior to 1 November 2018)
� NHFIC — National Housing Finance and Investment Corporation
� PRGT — Poverty Reduction and Growth Trust
� SME — Small and Medium Enterprises
� SDR — Special Drawing Rights
99Part 4 Financial statements
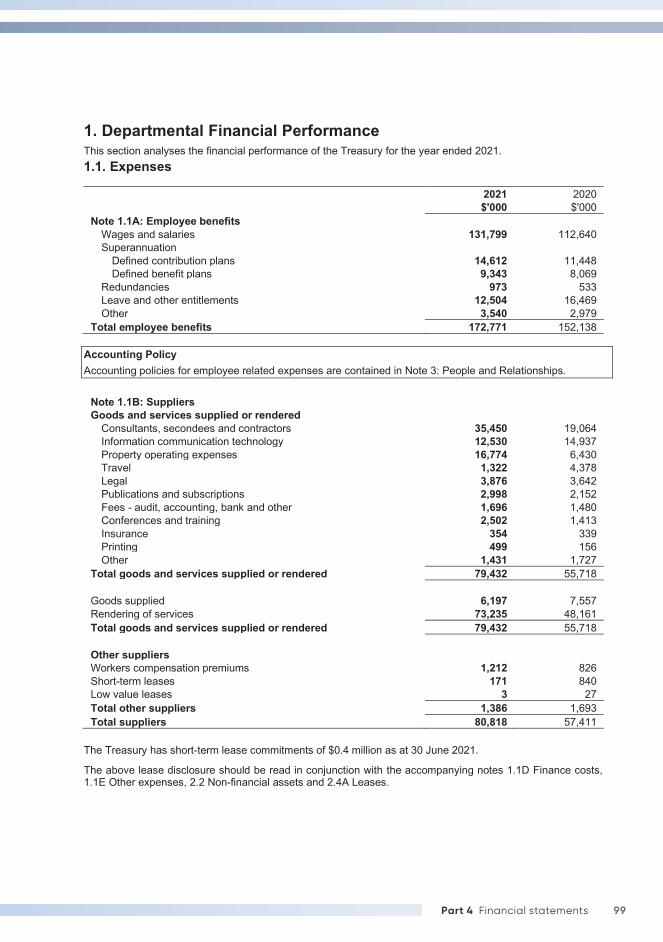
1. Departmental Financial Performance This section analyses the financial performance of the Treasury for the year ended 2021. 1.1. Expenses
2021 2020 $'000 $'000 Note 1.1A: Employee benefits
Wages and salaries 131,799 112,640 Superannuation
Defined contribution plans 14,612 11,448 Defined benefit plans 9,343 8,069
Redundancies 973 533 Leave and other entitlements 12,504 16,469 Other 3,540 2,979
Total employee benefits 172,771 152,138 Accounting Policy Accounting policies for employee related expenses are contained in Note 3: People and Relationships.
Note 1.1B: Suppliers Goods and services supplied or rendered
Consultants, secondees and contractors 35,450 19,064 Information communication technology 12,530 14,937 Property operating expenses 16,774 6,430 Travel 1,322 4,378 Legal 3,876 3,642 Publications and subscriptions 2,998 2,152 Fees - audit, accounting, bank and other 1,696 1,480 Conferences and training 2,502 1,413 Insurance 354 339 Printing 499 156 Other 1,431 1,727
Total goods and services supplied or rendered 79,432 55,718 Goods supplied 6,197 7,557 Rendering of services 73,235 48,161 Total goods and services supplied or rendered 79,432 55,718 Other suppliers Workers compensation premiums 1,212 826 Short-term leases 171 840 Low value leases 3 27 Total other suppliers 1,386 1,693 Total suppliers 80,818 57,411
The Treasury has short-term lease commitments of $0.4 million as at 30 June 2021.
The above lease disclosure should be read in conjunction with the accompanying notes 1.1D Finance costs, 1.1E Other expenses, 2.2 Non-financial assets and 2.4A Leases.
100 The Treasury Annual Report 2020–21
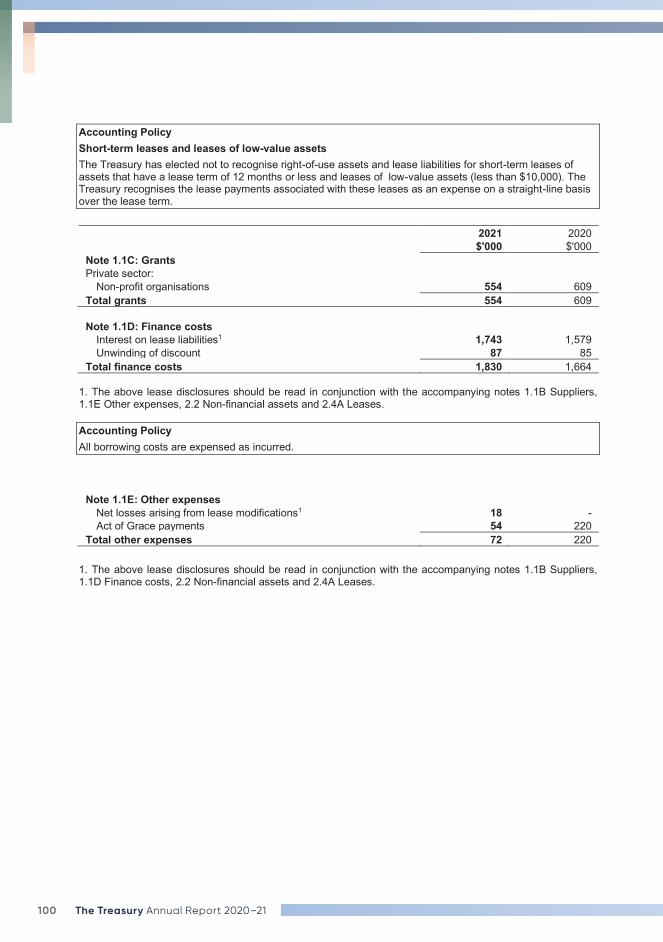
Accounting Policy Short-term leases and leases of low-value assets The Treasury has elected not to recognise right-of-use assets and lease liabilities for short-term leases of assets that have a lease term of 12 months or less and leases of low-value assets (less than $10,000). The Treasury recognises the lease payments associated with these leases as an expense on a straight-line basis over the lease term.
2021 2020 $'000 $'000 Note 1.1C: Grants Private sector:
Non-profit organisations 554 609 Total grants 554 609
Note 1.1D: Finance costs
Interest on lease liabilities1 1,743 1,579 Unwinding of discount 87 85
Total finance costs 1,830 1,664 1. The above lease disclosures should be read in conjunction with the accompanying notes 1.1B Suppliers, 1.1E Other expenses, 2.2 Non-financial assets and 2.4A Leases. Accounting Policy All borrowing costs are expensed as incurred.
Note 1.1E: Other expenses Net losses arising from lease modifications1 18 - Act of Grace payments 54 220
Total other expenses 72 220 1. The above lease disclosures should be read in conjunction with the accompanying notes 1.1B Suppliers, 1.1D Finance costs, 2.2 Non-financial assets and 2.4A Leases.
101Part 4 Financial statements
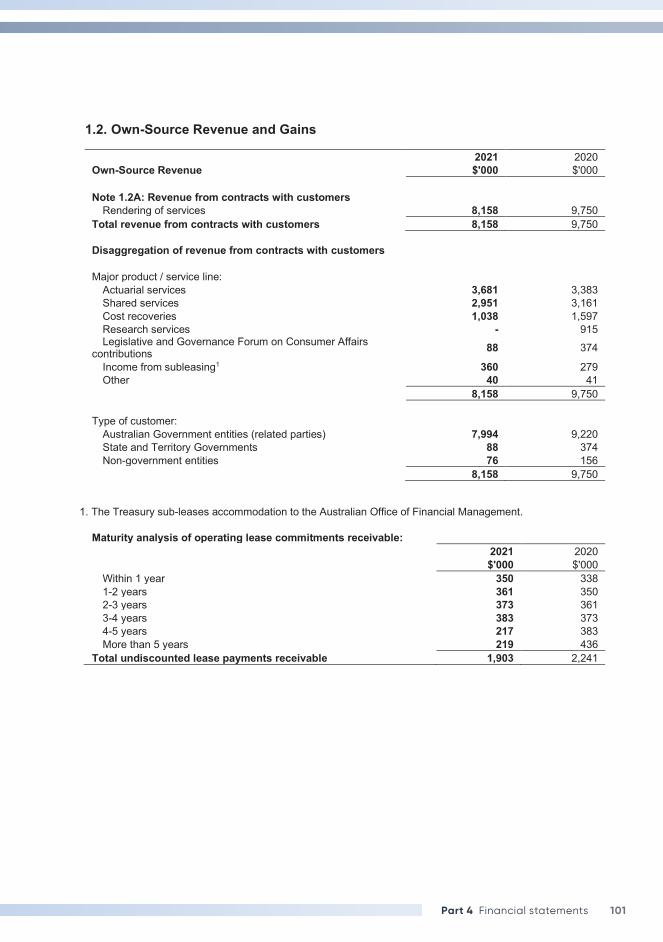
1.2. Own-Source Revenue and Gains
2021 2020 Own-Source Revenue $'000 $'000 Note 1.2A: Revenue from contracts with customers
Rendering of services 8,158 9,750 Total revenue from contracts with customers 8,158 9,750
Disaggregation of revenue from contracts with customers Major product / service line:
Actuarial services 3,681 3,383 Shared services 2,951 3,161 Cost recoveries 1,038 1,597 Research services - 915 Legislative and Governance Forum on Consumer Affairs
contributions 88 374
Income from subleasing1 360 279 Other 40 41
8,158 9,750 Type of customer:
Australian Government entities (related parties) 7,994 9,220 State and Territory Governments 88 374 Non-government entities 76 156
8,158 9,750 1. The Treasury sub-leases accommodation to the Australian Office of Financial Management.
Maturity analysis of operating lease commitments receivable: 2021 2020 $'000 $'000 Within 1 year 350 338 1-2 years 361 350 2-3 years 373 361 3-4 years 383 373 4-5 years 217 383 More than 5 years 219 436
Total undiscounted lease payments receivable 1,903 2,241
102 The Treasury Annual Report 2020–21
Accounting Policy Revenue from contracts with customers is recognised when control of the goods or services are transferred to the customer at an amount that reflects the consideration to which the Treasury expects to be entitled in exchange for those goods or services. The Treasury has concluded that it is the principal in all of its revenue arrangements because it controls the goods or services before transferring them to the customer. Actuarial Services This revenue stream relates to services performed by the Australian Government Actuary division to other Commonwealth entities. The Treasury recognises revenue upon the completion of the services (that is, at a point in time) as defined by the underlying contract as this is when the customer obtains the ability to direct the use of, and obtain substantially all of the benefits from the services (typically a report or other deliverable). Invoicing occurs in line with the underlying agreement and can be in advance or in arrears. Shared Services This revenue stream relates to the Treasury providing finance, payroll and IT function services to other Commonwealth entities. The Treasury recognises revenue on the basis of expenses incurred to complete the service (that is, over time) because the customer simultaneously receives and consumes the benefits provided to them. The Treasury uses the input method in measuring progress of the services because there is a direct relationship between the Treasury’s effort (that is, expenditure incurred) and the transfer of the service to the customer. Invoicing occurs in line with the underlying agreement and can be in advance or in arrears.
103Part 4 Financial statements
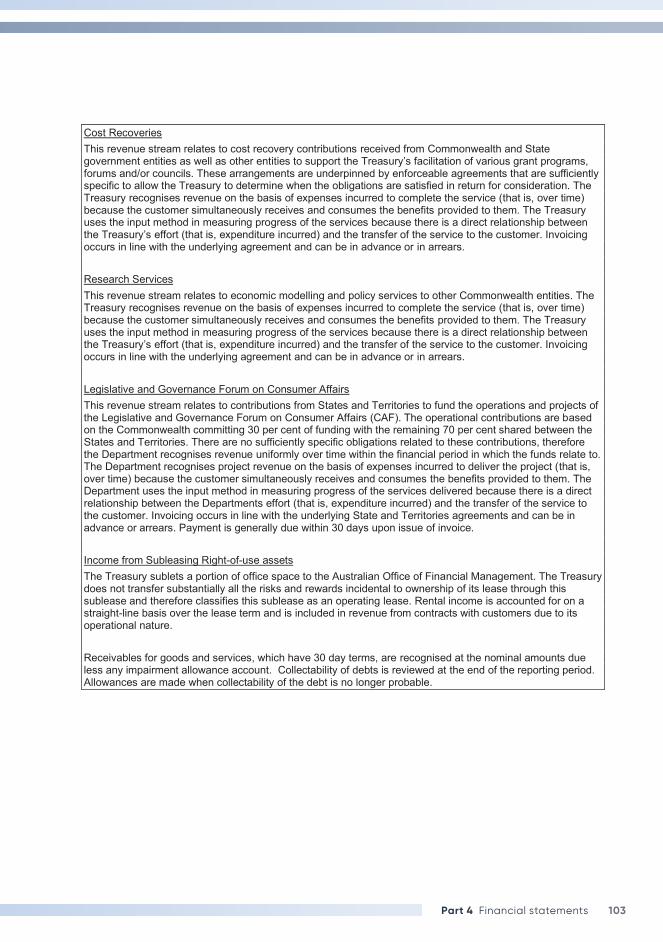
Cost Recoveries This revenue stream relates to cost recovery contributions received from Commonwealth and State government entities as well as other entities to support the Treasury’s facilitation of various grant programs, forums and/or councils. These arrangements are underpinned by enforceable agreements that are sufficiently specific to allow the Treasury to determine when the obligations are satisfied in return for consideration. The Treasury recognises revenue on the basis of expenses incurred to complete the service (that is, over time) because the customer simultaneously receives and consumes the benefits provided to them. The Treasury uses the input method in measuring progress of the services because there is a direct relationship between the Treasury’s effort (that is, expenditure incurred) and the transfer of the service to the customer. Invoicing occurs in line with the underlying agreement and can be in advance or in arrears. Research Services This revenue stream relates to economic modelling and policy services to other Commonwealth entities. The Treasury recognises revenue on the basis of expenses incurred to complete the service (that is, over time) because the customer simultaneously receives and consumes the benefits provided to them. The Treasury uses the input method in measuring progress of the services because there is a direct relationship between the Treasury’s effort (that is, expenditure incurred) and the transfer of the service to the customer. Invoicing occurs in line with the underlying agreement and can be in advance or in arrears. Legislative and Governance Forum on Consumer Affairs This revenue stream relates to contributions from States and Territories to fund the operations and projects of the Legislative and Governance Forum on Consumer Affairs (CAF). The operational contributions are based on the Commonwealth committing 30 per cent of funding with the remaining 70 per cent shared between the States and Territories. There are no sufficiently specific obligations related to these contributions, therefore the Department recognises revenue uniformly over time within the financial period in which the funds relate to. The Department recognises project revenue on the basis of expenses incurred to deliver the project (that is, over time) because the customer simultaneously receives and consumes the benefits provided to them. The Department uses the input method in measuring progress of the services delivered because there is a direct relationship between the Departments effort (that is, expenditure incurred) and the transfer of the service to the customer. Invoicing occurs in line with the underlying State and Territories agreements and can be in advance or arrears. Payment is generally due within 30 days upon issue of invoice. Income from Subleasing Right-of-use assets The Treasury sublets a portion of office space to the Australian Office of Financial Management. The Treasury does not transfer substantially all the risks and rewards incidental to ownership of its lease through this sublease and therefore classifies this sublease as an operating lease. Rental income is accounted for on a straight-line basis over the lease term and is included in revenue from contracts with customers due to its operational nature. Receivables for goods and services, which have 30 day terms, are recognised at the nominal amounts due less any impairment allowance account. Collectability of debts is reviewed at the end of the reporting period. Allowances are made when collectability of the debt is no longer probable.
104 The Treasury Annual Report 2020–21
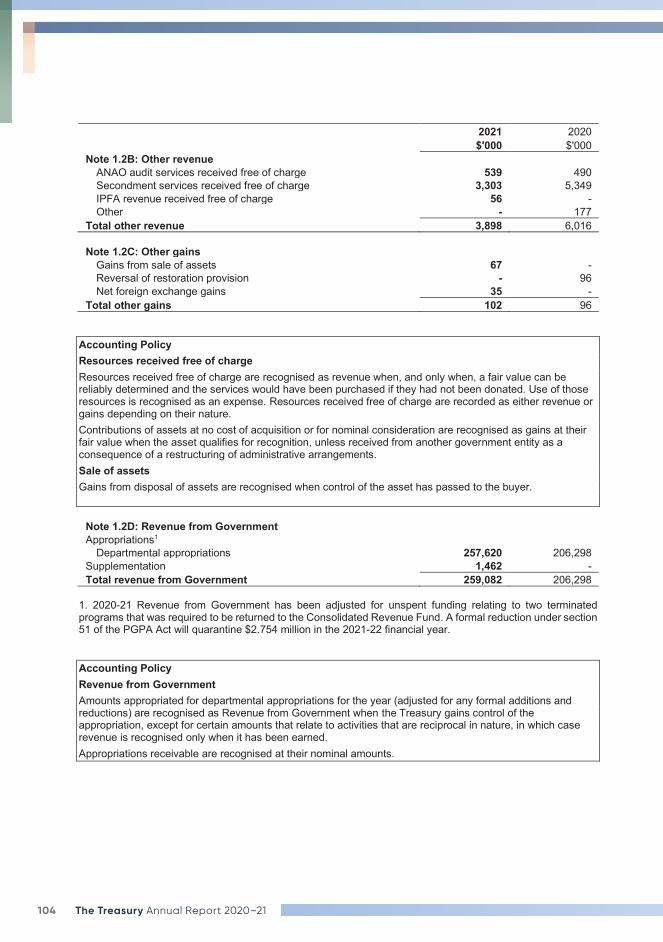
2021 2020 $'000 $'000 Note 1.2B: Other revenue
ANAO audit services received free of charge 539 490 Secondment services received free of charge 3,303 5,349 IPFA revenue received free of charge 56 - Other - 177
Total other revenue 3,898 6,016
Note 1.2C: Other gains Gains from sale of assets 67 - Reversal of restoration provision - 96 Net foreign exchange gains 35 -
Total other gains 102 96 Accounting Policy Resources received free of charge Resources received free of charge are recognised as revenue when, and only when, a fair value can be reliably determined and the services would have been purchased if they had not been donated. Use of those resources is recognised as an expense. Resources received free of charge are recorded as either revenue or gains depending on their nature. Contributions of assets at no cost of acquisition or for nominal consideration are recognised as gains at their fair value when the asset qualifies for recognition, unless received from another government entity as a consequence of a restructuring of administrative arrangements. Sale of assets Gains from disposal of assets are recognised when control of the asset has passed to the buyer.
Note 1.2D: Revenue from Government Appropriations1
Departmental appropriations 257,620 206,298 Supplementation 1,462 - Total revenue from Government 259,082 206,298
1. 2020-21 Revenue from Government has been adjusted for unspent funding relating to two terminated programs that was required to be returned to the Consolidated Revenue Fund. A formal reduction under section 51 of the PGPA Act will quarantine $2.754 million in the 2021-22 financial year.
Accounting Policy Revenue from Government Amounts appropriated for departmental appropriations for the year (adjusted for any formal additions and reductions) are recognised as Revenue from Government when the Treasury gains control of the appropriation, except for certain amounts that relate to activities that are reciprocal in nature, in which case revenue is recognised only when it has been earned. Appropriations receivable are recognised at their nominal amounts.
105Part 4 Financial statements
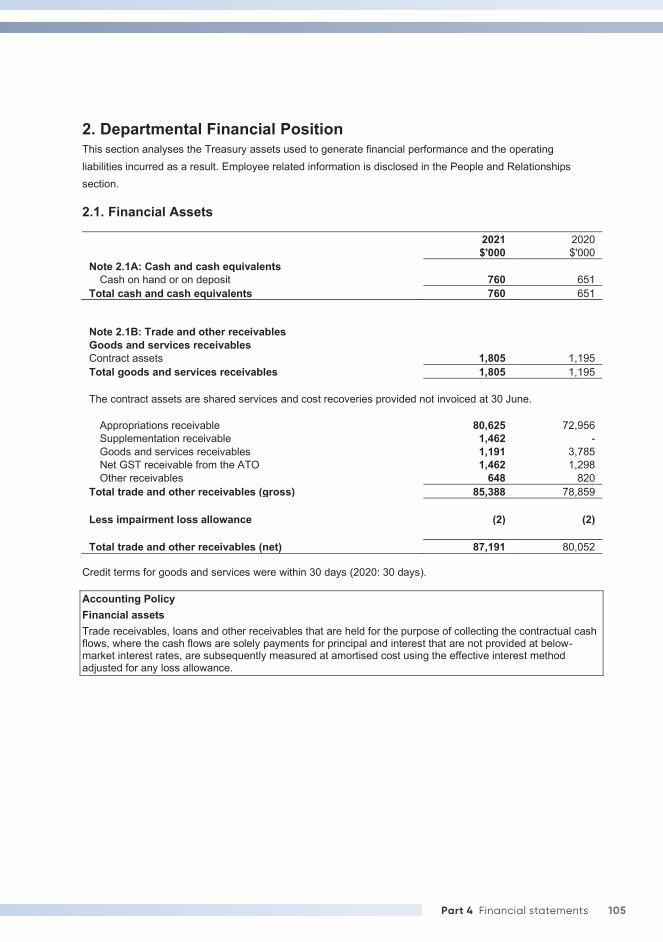
2. Departmental Financial Position This section analyses the Treasury assets used to generate financial performance and the operating liabilities incurred as a result. Employee related information is disclosed in the People and Relationships section. 2.1. Financial Assets
2021 2020 $'000 $'000 Note 2.1A: Cash and cash equivalents
Cash on hand or on deposit 760 651 Total cash and cash equivalents 760 651
Note 2.1B: Trade and other receivables Goods and services receivables Contract assets 1,805 1,195 Total goods and services receivables 1,805 1,195 The contract assets are shared services and cost recoveries provided not invoiced at 30 June.
Appropriations receivable 80,625 72,956 Supplementation receivable 1,462 - Goods and services receivables 1,191 3,785 Net GST receivable from the ATO 1,462 1,298 Other receivables 648 820
Total trade and other receivables (gross) 85,388 78,859 Less impairment loss allowance (2) (2) Total trade and other receivables (net) 87,191 80,052
Credit terms for goods and services were within 30 days (2020: 30 days). Accounting Policy Financial assets Trade receivables, loans and other receivables that are held for the purpose of collecting the contractual cash flows, where the cash flows are solely payments for principal and interest that are not provided at below-market interest rates, are subsequently measured at amortised cost using the effective interest method adjusted for any loss allowance.
106 The Treasury Annual Report 2020–21
2.2.
Non
-Fin
anci
al A
sset
s
Note
2.2
A: R
econ
cilia
tion
of th
e op
enin
g an
d cl
osin
g ba
lanc
es o
f pro
perty
, pla
nt a
nd e
quip
men
t and
com
pute
r sof
twar
e (2
020-
21)
Bu
ildin
gs
Plan
t and
eq
uipm
ent
Com
pute
r so
ftwar
e in
tern
ally
de
velo
ped
Com
pute
r so
ftwar
e pu
rcha
sed
Tota
l
$’00
0 $’
000
$’00
0 $’
000
$’00
0 As
at 1
Jul
y 20
20
G
ross
boo
k va
lue
152,
021
18
,977
26
,268
9,
222
20
6,48
8
Accu
mul
ated
dep
reci
atio
n / a
mor
tisat
ion
and
impa
irmen
t (1
4,37
1)
(7,5
30)
(13,
712)
(8
,615
) (4
4,22
8)
Tota
l val
ue a
s at
1 J
uly
2020
13
7,65
0
11,4
47
12,5
56
607
16
2,26
0
Addi
tions
25
,211
3,
582
5,
517
29
34
,339
Pu
rcha
sed
4,59
5
3,58
2
- 29
8,
206
In
tern
ally
dev
elop
ed
- -
5,51
7
- 5,
517
R
ight
-of-u
se a
sset
s 20
,616
-
- -
20,6
16
Adju
stm
ent t
o th
e R
OU
reco
gnis
ed in
net
cos
t of s
ervi
ces
(65)
-
- -
(65)
R
eval
uatio
ns re
cogn
ised
in o
ther
com
preh
ensi
ve in
com
e 2,
336
1
-
- 2,
337
Fr
om re
stru
ctur
ing
(RO
U)1
2,26
3
- -
- 2,
263
D
epre
ciat
ion
and
amor
tisat
ion
(3,1
51)
(3,0
07)
(3,9
51)
(259
) (1
0,36
8)
Dep
reci
atio
n on
righ
t-of-u
se a
sset
s (9
,997
) (1
2)
- -
(10,
009)
D
ispo
sal o
f rig
ht-o
f-use
ass
ets
(669
) -
- -
(669
) Im
pairm
ents
reco
gnis
ed in
net
cos
t of s
ervi
ces
(2)
(203
) (9
0)
- (2
95)
Dis
posa
ls
(811
) (3
5)
- -
(846
) Fr
om re
stru
ctur
ing1
587
-
2,32
5
- 2,
912
To
tal a
s at
30
June
202
1 15
3,35
2
11,7
73
16,3
57
377
18
1,85
9
Tota
l as
at 3
0 Ju
ne 2
021
repr
esen
ted
by:
G
ross
boo
k va
lue
172,
044
12
,487
31
,208
7,
958
22
3,69
7
Fair
valu
e 20
,035
11
,345
-
- 31
,380
At
cos
t 14
9,23
3
34
25,0
83
7,95
8
182,
308
U
nder
con
stru
ctio
n 2,
776
1,
108
6,
125
10,0
09
Accu
mul
ated
dep
reci
atio
n / a
mor
tisat
ion
and
impa
irmen
t (1
8,69
2)
(714
) (1
4,85
1)
(7,5
81)
(41,
838)
To
tal a
s at
30
June
202
1 15
3,35
2
11,7
73
16,3
57
377
18
1,85
9
Car
ryin
g am
ount
of r
ight
-of-u
se a
sset
s 13
0,58
8
15
- -
130,
603
107Part 4 Financial statements
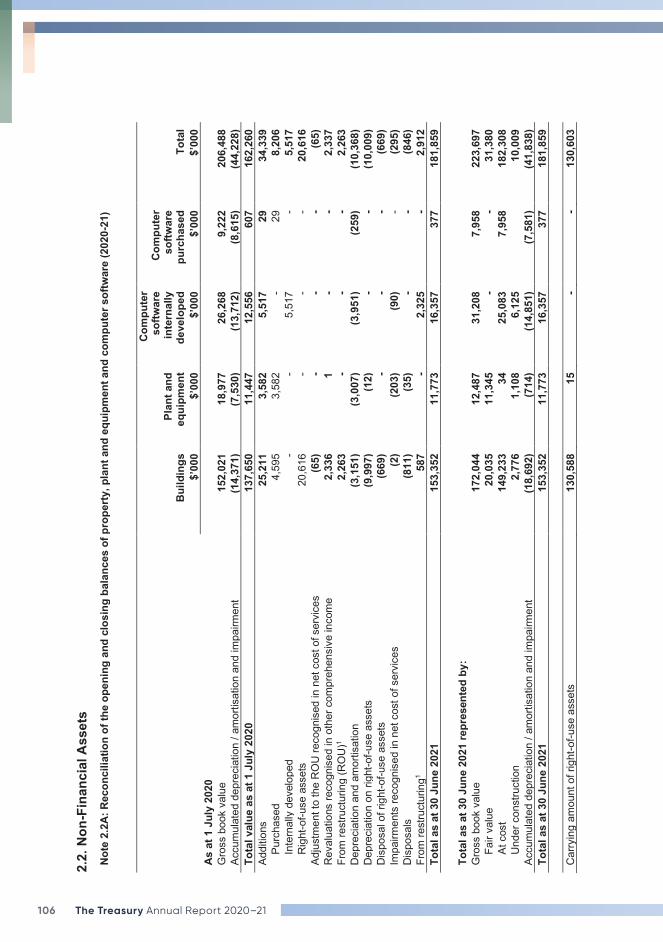
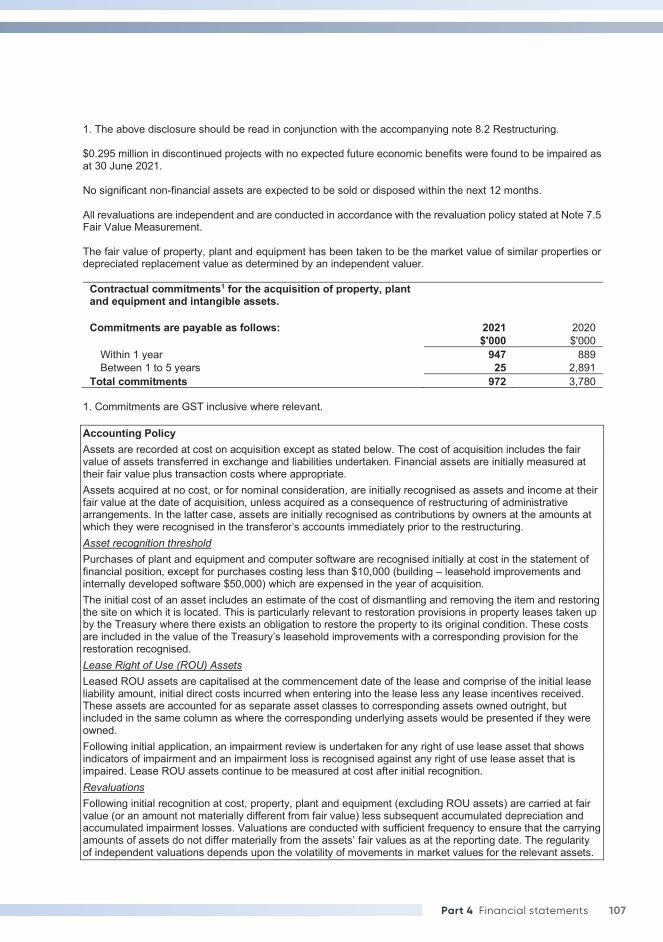
1. The above disclosure should be read in conjunction with the accompanying note 8.2 Restructuring. $0.295 million in discontinued projects with no expected future economic benefits were found to be impaired as at 30 June 2021. No significant non-financial assets are expected to be sold or disposed within the next 12 months. All revaluations are independent and are conducted in accordance with the revaluation policy stated at Note 7.5 Fair Value Measurement. The fair value of property, plant and equipment has been taken to be the market value of similar properties or depreciated replacement value as determined by an independent valuer.
Contractual commitments1 for the acquisition of property, plant and equipment and intangible assets. Commitments are payable as follows: 2021 2020 $'000 $'000
Within 1 year 947 889 Between 1 to 5 years 25 2,891
Total commitments 972 3,780 1. Commitments are GST inclusive where relevant. Accounting Policy Assets are recorded at cost on acquisition except as stated below. The cost of acquisition includes the fair value of assets transferred in exchange and liabilities undertaken. Financial assets are initially measured at their fair value plus transaction costs where appropriate. Assets acquired at no cost, or for nominal consideration, are initially recognised as assets and income at their fair value at the date of acquisition, unless acquired as a consequence of restructuring of administrative arrangements. In the latter case, assets are initially recognised as contributions by owners at the amounts at which they were recognised in the transferor’s accounts immediately prior to the restructuring. Asset recognition threshold Purchases of plant and equipment and computer software are recognised initially at cost in the statement of financial position, except for purchases costing less than $10,000 (building – leasehold improvements and internally developed software $50,000) which are expensed in the year of acquisition. The initial cost of an asset includes an estimate of the cost of dismantling and removing the item and restoring the site on which it is located. This is particularly relevant to restoration provisions in property leases taken up by the Treasury where there exists an obligation to restore the property to its original condition. These costs are included in the value of the Treasury’s leasehold improvements with a corresponding provision for the restoration recognised. Lease Right of Use (ROU) Assets Leased ROU assets are capitalised at the commencement date of the lease and comprise of the initial lease liability amount, initial direct costs incurred when entering into the lease less any lease incentives received. These assets are accounted for as separate asset classes to corresponding assets owned outright, but included in the same column as where the corresponding underlying assets would be presented if they were owned. Following initial application, an impairment review is undertaken for any right of use lease asset that shows indicators of impairment and an impairment loss is recognised against any right of use lease asset that is impaired. Lease ROU assets continue to be measured at cost after initial recognition. Revaluations Following initial recognition at cost, property, plant and equipment (excluding ROU assets) are carried at fair value (or an amount not materially different from fair value) less subsequent accumulated depreciation and accumulated impairment losses. Valuations are conducted with sufficient frequency to ensure that the carrying amounts of assets do not differ materially from the assets’ fair values as at the reporting date. The regularity of independent valuations depends upon the volatility of movements in market values for the relevant assets.
108 The Treasury Annual Report 2020–21
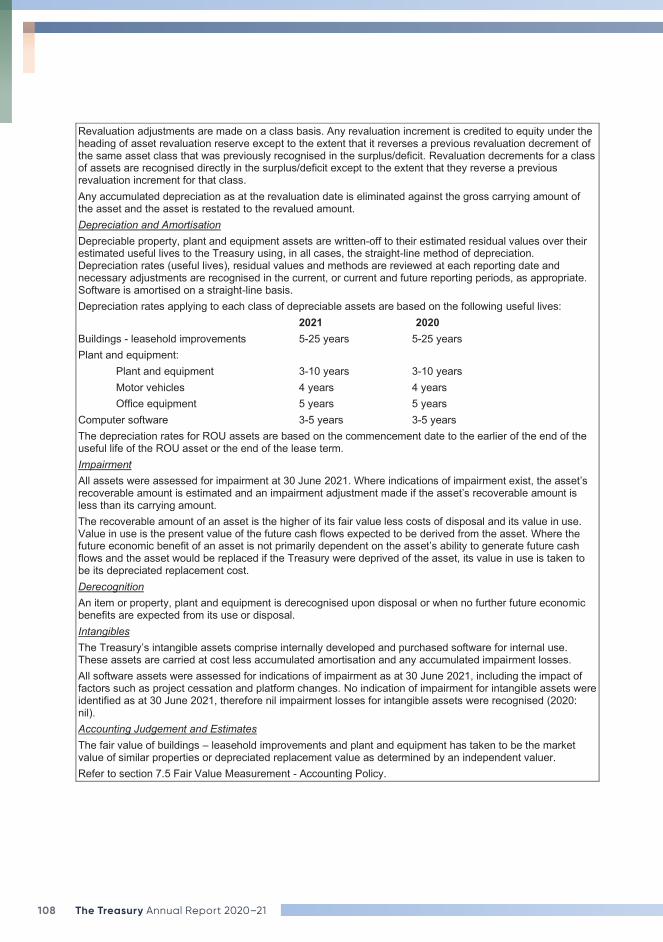
Revaluation adjustments are made on a class basis. Any revaluation increment is credited to equity under the heading of asset revaluation reserve except to the extent that it reverses a previous revaluation decrement of the same asset class that was previously recognised in the surplus/deficit. Revaluation decrements for a class of assets are recognised directly in the surplus/deficit except to the extent that they reverse a previous revaluation increment for that class. Any accumulated depreciation as at the revaluation date is eliminated against the gross carrying amount of the asset and the asset is restated to the revalued amount. Depreciation and Amortisation Depreciable property, plant and equipment assets are written-off to their estimated residual values over their estimated useful lives to the Treasury using, in all cases, the straight-line method of depreciation. Depreciation rates (useful lives), residual values and methods are reviewed at each reporting date and necessary adjustments are recognised in the current, or current and future reporting periods, as appropriate. Software is amortised on a straight-line basis. Depreciation rates applying to each class of depreciable assets are based on the following useful lives: 2021 2020 Buildings - leasehold improvements 5-25 years 5-25 years Plant and equipment:
Plant and equipment 3-10 years 3-10 years Motor vehicles 4 years 4 years Office equipment 5 years 5 years
Computer software 3-5 years 3-5 years The depreciation rates for ROU assets are based on the commencement date to the earlier of the end of the useful life of the ROU asset or the end of the lease term. Impairment All assets were assessed for impairment at 30 June 2021. Where indications of impairment exist, the asset’s recoverable amount is estimated and an impairment adjustment made if the asset’s recoverable amount is less than its carrying amount. The recoverable amount of an asset is the higher of its fair value less costs of disposal and its value in use. Value in use is the present value of the future cash flows expected to be derived from the asset. Where the future economic benefit of an asset is not primarily dependent on the asset’s ability to generate future cash flows and the asset would be replaced if the Treasury were deprived of the asset, its value in use is taken to be its depreciated replacement cost. Derecognition An item or property, plant and equipment is derecognised upon disposal or when no further future economic benefits are expected from its use or disposal. Intangibles The Treasury’s intangible assets comprise internally developed and purchased software for internal use. These assets are carried at cost less accumulated amortisation and any accumulated impairment losses. All software assets were assessed for indications of impairment as at 30 June 2021, including the impact of factors such as project cessation and platform changes. No indication of impairment for intangible assets were identified as at 30 June 2021, therefore nil impairment losses for intangible assets were recognised (2020: nil). Accounting Judgement and Estimates The fair value of buildings – leasehold improvements and plant and equipment has taken to be the market value of similar properties or depreciated replacement value as determined by an independent valuer. Refer to section 7.5 Fair Value Measurement - Accounting Policy.
109Part 4 Financial statements
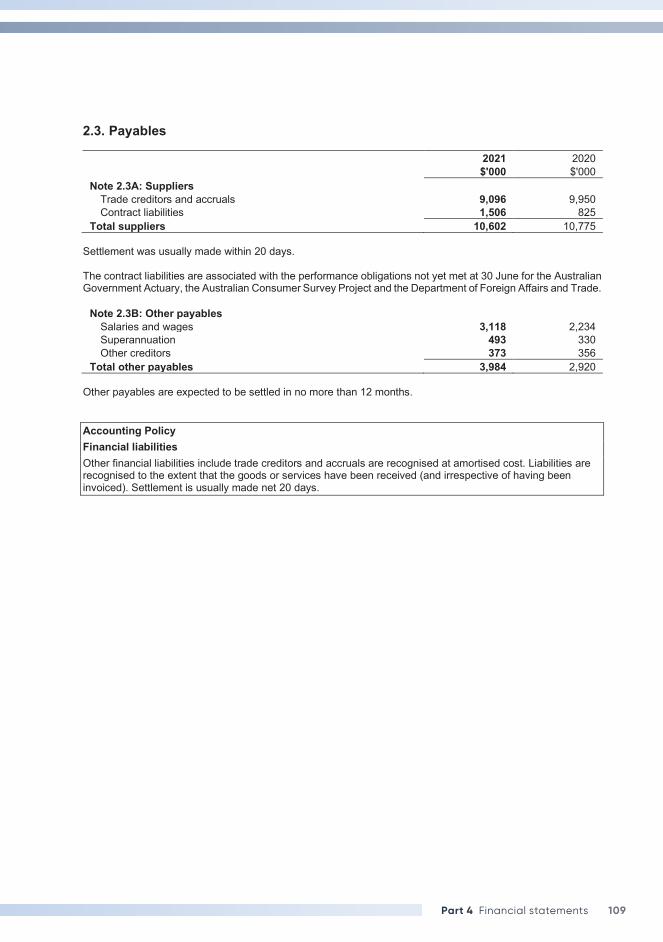
2.3. Payables
2021 2020 $'000 $'000 Note 2.3A: Suppliers
Trade creditors and accruals 9,096 9,950 Contract liabilities 1,506 825
Total suppliers 10,602 10,775 Settlement was usually made within 20 days. The contract liabilities are associated with the performance obligations not yet met at 30 June for the Australian Government Actuary, the Australian Consumer Survey Project and the Department of Foreign Affairs and Trade.
Note 2.3B: Other payables Salaries and wages 3,118 2,234 Superannuation 493 330 Other creditors 373 356
Total other payables 3,984 2,920 Other payables are expected to be settled in no more than 12 months. Accounting Policy Financial liabilities Other financial liabilities include trade creditors and accruals are recognised at amortised cost. Liabilities are recognised to the extent that the goods or services have been received (and irrespective of having been invoiced). Settlement is usually made net 20 days.
110 The Treasury Annual Report 2020–21
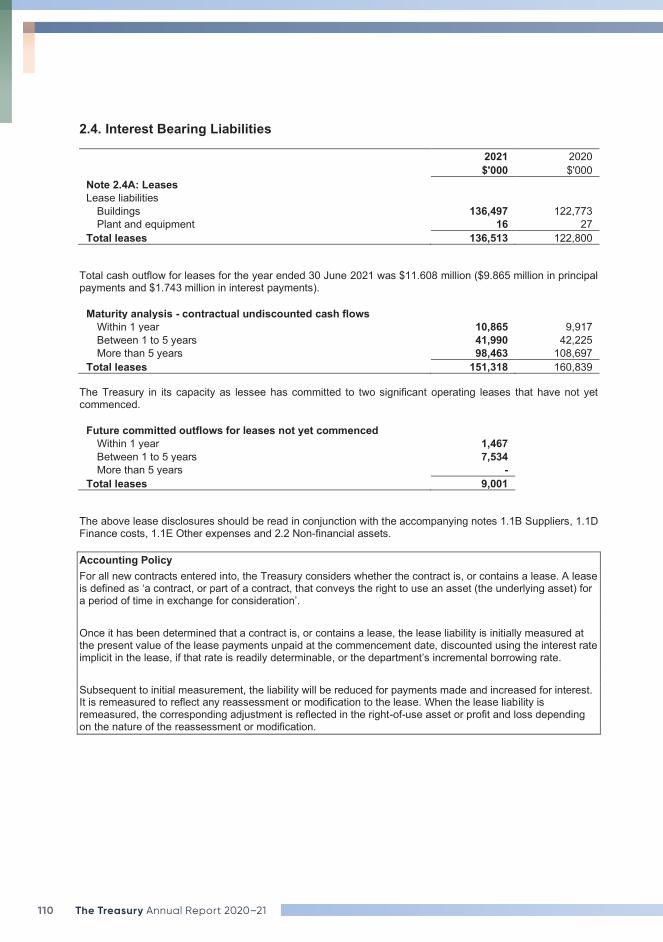
2.4. Interest Bearing Liabilities
2021 2020 $'000 $'000 Note 2.4A: Leases Lease liabilities
Buildings 136,497 122,773 Plant and equipment 16 27
Total leases 136,513 122,800 Total cash outflow for leases for the year ended 30 June 2021 was $11.608 million ($9.865 million in principal payments and $1.743 million in interest payments).
Maturity analysis - contractual undiscounted cash flows Within 1 year 10,865 9,917 Between 1 to 5 years 41,990 42,225 More than 5 years 98,463 108,697
Total leases 151,318 160,839 The Treasury in its capacity as lessee has committed to two significant operating leases that have not yet commenced.
Future committed outflows for leases not yet commenced Within 1 year 1,467 Between 1 to 5 years 7,534 More than 5 years -
Total leases 9,001 The above lease disclosures should be read in conjunction with the accompanying notes 1.1B Suppliers, 1.1D Finance costs, 1.1E Other expenses and 2.2 Non-financial assets. Accounting Policy For all new contracts entered into, the Treasury considers whether the contract is, or contains a lease. A lease is defined as ‘a contract, or part of a contract, that conveys the right to use an asset (the underlying asset) for a period of time in exchange for consideration’. Once it has been determined that a contract is, or contains a lease, the lease liability is initially measured at the present value of the lease payments unpaid at the commencement date, discounted using the interest rate implicit in the lease, if that rate is readily determinable, or the department’s incremental borrowing rate. Subsequent to initial measurement, the liability will be reduced for payments made and increased for interest. It is remeasured to reflect any reassessment or modification to the lease. When the lease liability is remeasured, the corresponding adjustment is reflected in the right-of-use asset or profit and loss depending on the nature of the reassessment or modification.
111Part 4 Financial statements
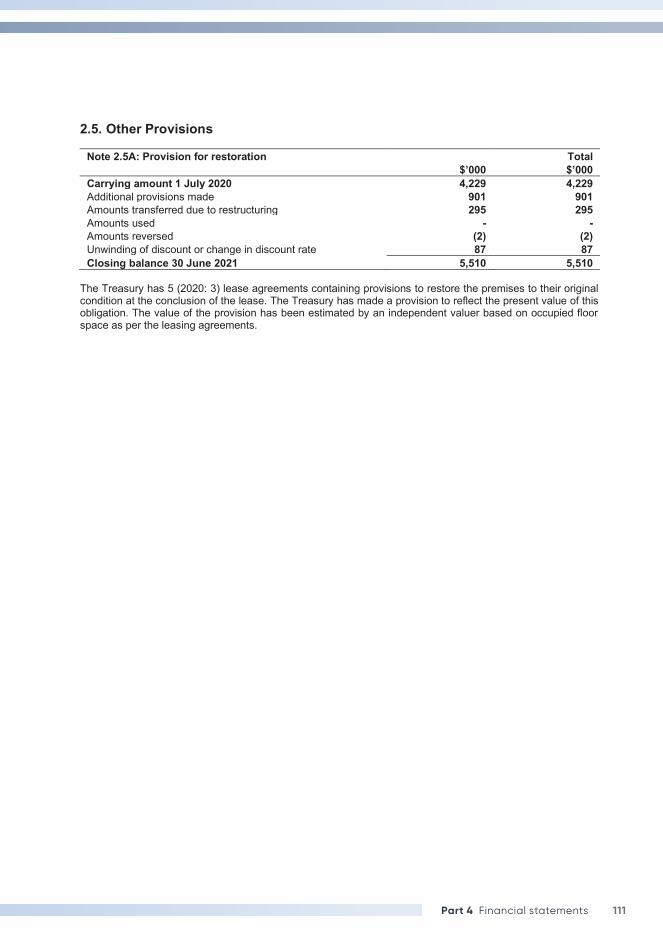
2.5. Other Provisions
Note 2.5A: Provision for restoration Total $’000 $’000 Carrying amount 1 July 2020 4,229 4,229 Additional provisions made 901 901 Amounts transferred due to restructuring 295 295 Amounts used - - Amounts reversed (2) (2) Unwinding of discount or change in discount rate 87 87 Closing balance 30 June 2021 5,510 5,510
The Treasury has 5 (2020: 3) lease agreements containing provisions to restore the premises to their original condition at the conclusion of the lease. The Treasury has made a provision to reflect the present value of this obligation. The value of the provision has been estimated by an independent valuer based on occupied floor space as per the leasing agreements.
112 The Treasury Annual Report 2020–21
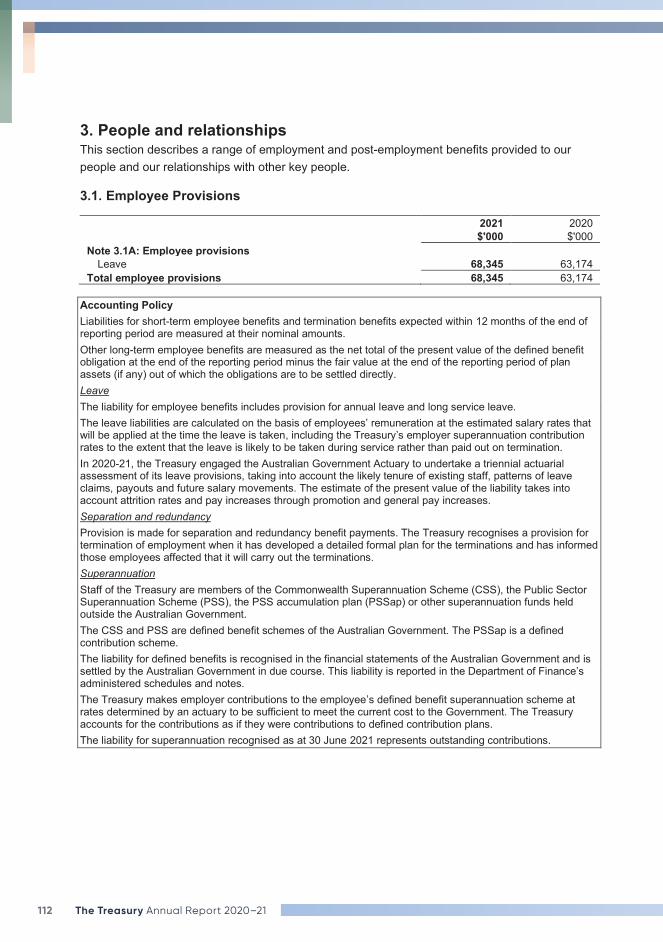
3. People and relationships This section describes a range of employment and post-employment benefits provided to our people and our relationships with other key people. 3.1. Employee Provisions
2021 2020 $'000 $'000 Note 3.1A: Employee provisions
Leave 68,345 63,174 Total employee provisions 68,345 63,174
Accounting Policy Liabilities for short-term employee benefits and termination benefits expected within 12 months of the end of reporting period are measured at their nominal amounts. Other long-term employee benefits are measured as the net total of the present value of the defined benefit obligation at the end of the reporting period minus the fair value at the end of the reporting period of plan assets (if any) out of which the obligations are to be settled directly. Leave The liability for employee benefits includes provision for annual leave and long service leave. The leave liabilities are calculated on the basis of employees’ remuneration at the estimated salary rates that will be applied at the time the leave is taken, including the Treasury’s employer superannuation contribution rates to the extent that the leave is likely to be taken during service rather than paid out on termination. In 2020-21, the Treasury engaged the Australian Government Actuary to undertake a triennial actuarial assessment of its leave provisions, taking into account the likely tenure of existing staff, patterns of leave claims, payouts and future salary movements. The estimate of the present value of the liability takes into account attrition rates and pay increases through promotion and general pay increases. Separation and redundancy Provision is made for separation and redundancy benefit payments. The Treasury recognises a provision for termination of employment when it has developed a detailed formal plan for the terminations and has informed those employees affected that it will carry out the terminations. Superannuation Staff of the Treasury are members of the Commonwealth Superannuation Scheme (CSS), the Public Sector Superannuation Scheme (PSS), the PSS accumulation plan (PSSap) or other superannuation funds held outside the Australian Government. The CSS and PSS are defined benefit schemes of the Australian Government. The PSSap is a defined contribution scheme. The liability for defined benefits is recognised in the financial statements of the Australian Government and is settled by the Australian Government in due course. This liability is reported in the Department of Finance’s administered schedules and notes. The Treasury makes employer contributions to the employee’s defined benefit superannuation scheme at rates determined by an actuary to be sufficient to meet the current cost to the Government. The Treasury accounts for the contributions as if they were contributions to defined contribution plans. The liability for superannuation recognised as at 30 June 2021 represents outstanding contributions.
113Part 4 Financial statements
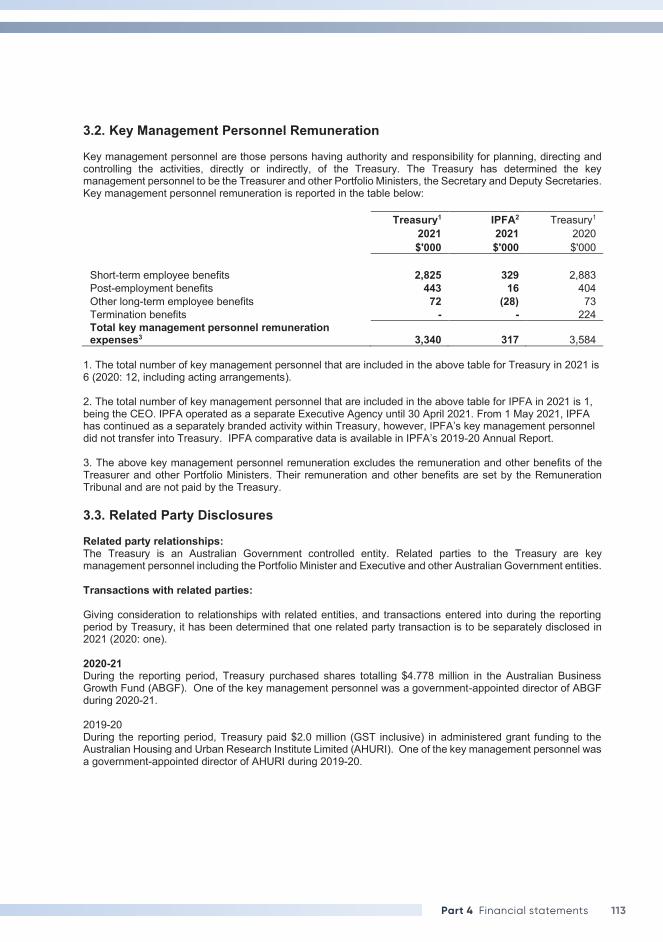
3.2. Key Management Personnel Remuneration Key management personnel are those persons having authority and responsibility for planning, directing and controlling the activities, directly or indirectly, of the Treasury. The Treasury has determined the key management personnel to be the Treasurer and other Portfolio Ministers, the Secretary and Deputy Secretaries. Key management personnel remuneration is reported in the table below:
Treasury1 IPFA2 Treasury1 2021 2021 2020 $'000 $'000 $'000 Short-term employee benefits 2,825 329 2,883 Post-employment benefits 443 16 404 Other long-term employee benefits 72 (28) 73 Termination benefits - - 224 Total key management personnel remuneration expenses3 3,340 317 3,584
1. The total number of key management personnel that are included in the above table for Treasury in 2021 is 6 (2020: 12, including acting arrangements). 2. The total number of key management personnel that are included in the above table for IPFA in 2021 is 1, being the CEO. IPFA operated as a separate Executive Agency until 30 April 2021. From 1 May 2021, IPFA has continued as a separately branded activity within Treasury, however, IPFA’s key management personnel did not transfer into Treasury. IPFA comparative data is available in IPFA’s 2019-20 Annual Report. 3. The above key management personnel remuneration excludes the remuneration and other benefits of the Treasurer and other Portfolio Ministers. Their remuneration and other benefits are set by the Remuneration Tribunal and are not paid by the Treasury. 3.3. Related Party Disclosures Related party relationships: The Treasury is an Australian Government controlled entity. Related parties to the Treasury are key management personnel including the Portfolio Minister and Executive and other Australian Government entities. Transactions with related parties: Giving consideration to relationships with related entities, and transactions entered into during the reporting period by Treasury, it has been determined that one related party transaction is to be separately disclosed in 2021 (2020: one). 2020-21 During the reporting period, Treasury purchased shares totalling $4.778 million in the Australian Business Growth Fund (ABGF). One of the key management personnel was a government-appointed director of ABGF during 2020-21. 2019-20 During the reporting period, Treasury paid $2.0 million (GST inclusive) in administered grant funding to the Australian Housing and Urban Research Institute Limited (AHURI). One of the key management personnel was a government-appointed director of AHURI during 2019-20.
114 The Treasury Annual Report 2020–21
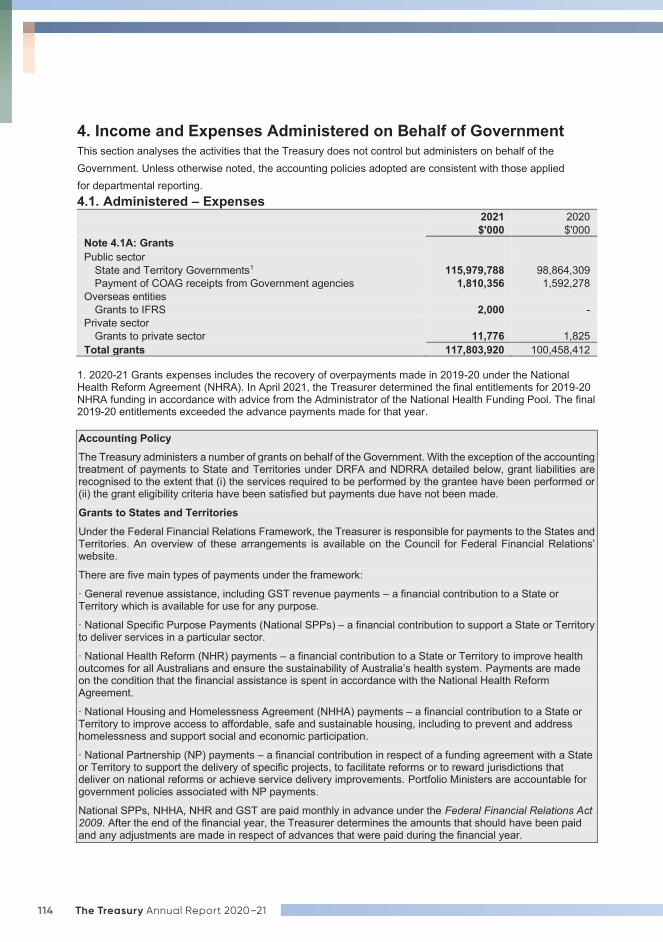
4. Income and Expenses Administered on Behalf of Government This section analyses the activities that the Treasury does not control but administers on behalf of the Government. Unless otherwise noted, the accounting policies adopted are consistent with those applied for departmental reporting. 4.1. Administered – Expenses
2021 2020 $'000 $'000 Note 4.1A: Grants Public sector
State and Territory Governments1 115,979,788 98,864,309 Payment of COAG receipts from Government agencies 1,810,356 1,592,278
Overseas entities Grants to IFRS 2,000 -
Private sector Grants to private sector 11,776 1,825
Total grants 117,803,920 100,458,412 1. 2020-21 Grants expenses includes the recovery of overpayments made in 2019-20 under the National Health Reform Agreement (NHRA). In April 2021, the Treasurer determined the final entitlements for 2019-20 NHRA funding in accordance with advice from the Administrator of the National Health Funding Pool. The final 2019-20 entitlements exceeded the advance payments made for that year.
Accounting Policy The Treasury administers a number of grants on behalf of the Government. With the exception of the accounting treatment of payments to State and Territories under DRFA and NDRRA detailed below, grant liabilities are recognised to the extent that (i) the services required to be performed by the grantee have been performed or (ii) the grant eligibility criteria have been satisfied but payments due have not been made.
Grants to States and Territories Under the Federal Financial Relations Framework, the Treasurer is responsible for payments to the States and Territories. An overview of these arrangements is available on the Council for Federal Financial Relations’ website.
There are five main types of payments under the framework:
∙ General revenue assistance, including GST revenue payments – a financial contribution to a State or Territory which is available for use for any purpose.
∙ National Specific Purpose Payments (National SPPs) – a financial contribution to support a State or Territory to deliver services in a particular sector.
∙ National Health Reform (NHR) payments – a financial contribution to a State or Territory to improve health outcomes for all Australians and ensure the sustainability of Australia’s health system. Payments are made on the condition that the financial assistance is spent in accordance with the National Health Reform Agreement.
∙ National Housing and Homelessness Agreement (NHHA) payments – a financial contribution to a State or Territory to improve access to affordable, safe and sustainable housing, including to prevent and address homelessness and support social and economic participation.
∙ National Partnership (NP) payments – a financial contribution in respect of a funding agreement with a State or Territory to support the delivery of specific projects, to facilitate reforms or to reward jurisdictions that deliver on national reforms or achieve service delivery improvements. Portfolio Ministers are accountable for government policies associated with NP payments.
National SPPs, NHHA, NHR and GST are paid monthly in advance under the Federal Financial Relations Act 2009. After the end of the financial year, the Treasurer determines the amounts that should have been paid and any adjustments are made in respect of advances that were paid during the financial year.
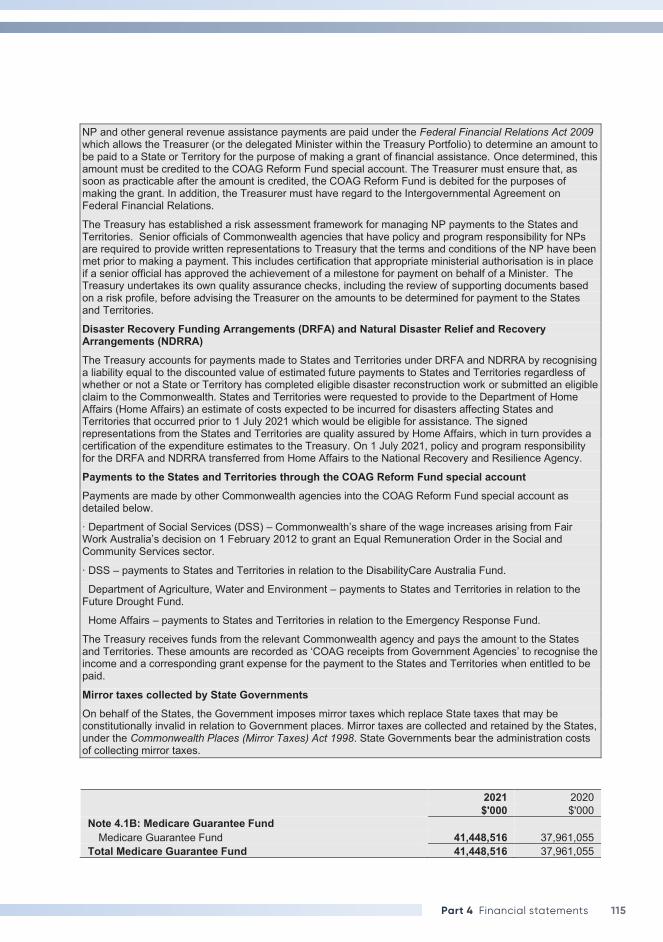
115Part 4 Financial statements
NP and other general revenue assistance payments are paid under the Federal Financial Relations Act 2009 which allows the Treasurer (or the delegated Minister within the Treasury Portfolio) to determine an amount to be paid to a State or Territory for the purpose of making a grant of financial assistance. Once determined, this amount must be credited to the COAG Reform Fund special account. The Treasurer must ensure that, as soon as practicable after the amount is credited, the COAG Reform Fund is debited for the purposes of making the grant. In addition, the Treasurer must have regard to the Intergovernmental Agreement on Federal Financial Relations.
The Treasury has established a risk assessment framework for managing NP payments to the States and Territories. Senior officials of Commonwealth agencies that have policy and program responsibility for NPs are required to provide written representations to Treasury that the terms and conditions of the NP have been met prior to making a payment. This includes certification that appropriate ministerial authorisation is in place if a senior official has approved the achievement of a milestone for payment on behalf of a Minister. The Treasury undertakes its own quality assurance checks, including the review of supporting documents based on a risk profile, before advising the Treasurer on the amounts to be determined for payment to the States and Territories.
Disaster Recovery Funding Arrangements (DRFA) and Natural Disaster Relief and Recovery Arrangements (NDRRA) The Treasury accounts for payments made to States and Territories under DRFA and NDRRA by recognising a liability equal to the discounted value of estimated future payments to States and Territories regardless of whether or not a State or Territory has completed eligible disaster reconstruction work or submitted an eligible claim to the Commonwealth. States and Territories were requested to provide to the Department of Home Affairs (Home Affairs) an estimate of costs expected to be incurred for disasters affecting States and Territories that occurred prior to 1 July 2021 which would be eligible for assistance. The signed representations from the States and Territories are quality assured by Home Affairs, which in turn provides a certification of the expenditure estimates to the Treasury. On 1 July 2021, policy and program responsibility for the DRFA and NDRRA transferred from Home Affairs to the National Recovery and Resilience Agency.
Payments to the States and Territories through the COAG Reform Fund special account Payments are made by other Commonwealth agencies into the COAG Reform Fund special account as detailed below.
∙ Department of Social Services (DSS) – Commonwealth’s share of the wage increases arising from Fair Work Australia’s decision on 1 February 2012 to grant an Equal Remuneration Order in the Social and Community Services sector.
∙ DSS – payments to States and Territories in relation to the DisabilityCare Australia Fund.
Department of Agriculture, Water and Environment – payments to States and Territories in relation to the Future Drought Fund.
Home Affairs – payments to States and Territories in relation to the Emergency Response Fund.
The Treasury receives funds from the relevant Commonwealth agency and pays the amount to the States and Territories. These amounts are recorded as ‘COAG receipts from Government Agencies’ to recognise the income and a corresponding grant expense for the payment to the States and Territories when entitled to be paid.
Mirror taxes collected by State Governments On behalf of the States, the Government imposes mirror taxes which replace State taxes that may be constitutionally invalid in relation to Government places. Mirror taxes are collected and retained by the States, under the Commonwealth Places (Mirror Taxes) Act 1998. State Governments bear the administration costs of collecting mirror taxes.
2021 2020 $'000 $'000 Note 4.1B: Medicare Guarantee Fund
Medicare Guarantee Fund 41,448,516 37,961,055 Total Medicare Guarantee Fund 41,448,516 37,961,055
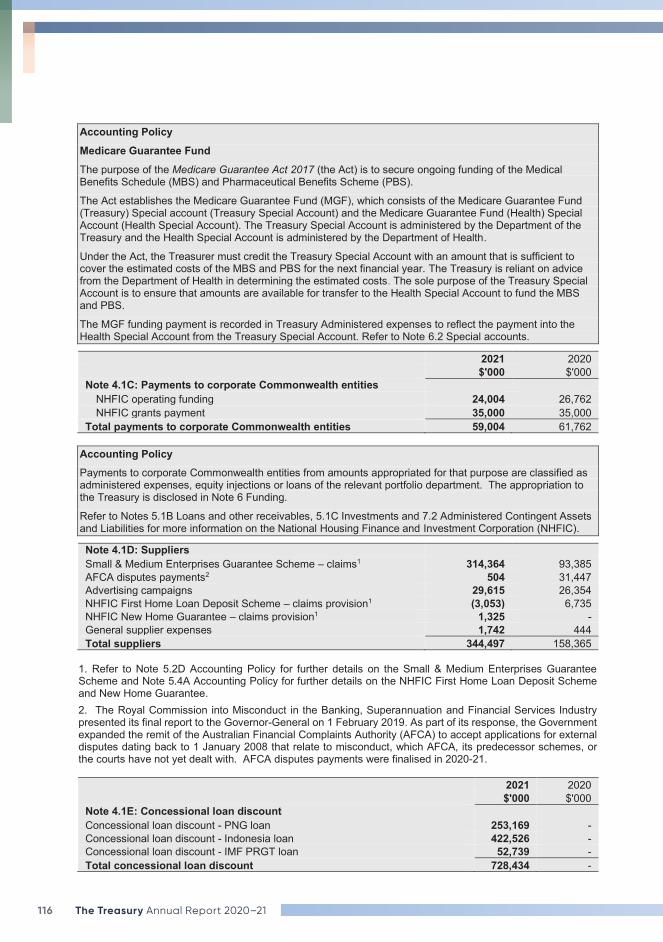
116 The Treasury Annual Report 2020–21
Accounting Policy Medicare Guarantee Fund The purpose of the Medicare Guarantee Act 2017 (the Act) is to secure ongoing funding of the Medical Benefits Schedule (MBS) and Pharmaceutical Benefits Scheme (PBS).
The Act establishes the Medicare Guarantee Fund (MGF), which consists of the Medicare Guarantee Fund (Treasury) Special account (Treasury Special Account) and the Medicare Guarantee Fund (Health) Special Account (Health Special Account). The Treasury Special Account is administered by the Department of the Treasury and the Health Special Account is administered by the Department of Health.
Under the Act, the Treasurer must credit the Treasury Special Account with an amount that is sufficient to cover the estimated costs of the MBS and PBS for the next financial year. The Treasury is reliant on advice from the Department of Health in determining the estimated costs. The sole purpose of the Treasury Special Account is to ensure that amounts are available for transfer to the Health Special Account to fund the MBS and PBS.
The MGF funding payment is recorded in Treasury Administered expenses to reflect the payment into the Health Special Account from the Treasury Special Account. Refer to Note 6.2 Special accounts.
2021 2020 $'000 $'000 Note 4.1C: Payments to corporate Commonwealth entities
NHFIC operating funding 24,004 26,762 NHFIC grants payment 35,000 35,000
Total payments to corporate Commonwealth entities 59,004 61,762
Accounting Policy Payments to corporate Commonwealth entities from amounts appropriated for that purpose are classified as administered expenses, equity injections or loans of the relevant portfolio department. The appropriation to the Treasury is disclosed in Note 6 Funding.
Refer to Notes 5.1B Loans and other receivables, 5.1C Investments and 7.2 Administered Contingent Assets and Liabilities for more information on the National Housing Finance and Investment Corporation (NHFIC).
Note 4.1D: Suppliers Small & Medium Enterprises Guarantee Scheme – claims1 314,364 93,385 AFCA disputes payments2 504 31,447 Advertising campaigns 29,615 26,354 NHFIC First Home Loan Deposit Scheme – claims provision1 (3,053) 6,735 NHFIC New Home Guarantee – claims provision1 1,325 - General supplier expenses 1,742 444 Total suppliers 344,497 158,365
1. Refer to Note 5.2D Accounting Policy for further details on the Small & Medium Enterprises Guarantee Scheme and Note 5.4A Accounting Policy for further details on the NHFIC First Home Loan Deposit Scheme and New Home Guarantee.
2. The Royal Commission into Misconduct in the Banking, Superannuation and Financial Services Industry presented its final report to the Governor-General on 1 February 2019. As part of its response, the Government expanded the remit of the Australian Financial Complaints Authority (AFCA) to accept applications for external disputes dating back to 1 January 2008 that relate to misconduct, which AFCA, its predecessor schemes, or the courts have not yet dealt with. AFCA disputes payments were finalised in 2020-21.
2021 2020 $'000 $'000 Note 4.1E: Concessional loan discount Concessional loan discount - PNG loan 253,169 - Concessional loan discount - Indonesia loan 422,526 - Concessional loan discount - IMF PRGT loan 52,739 - Total concessional loan discount 728,434 -
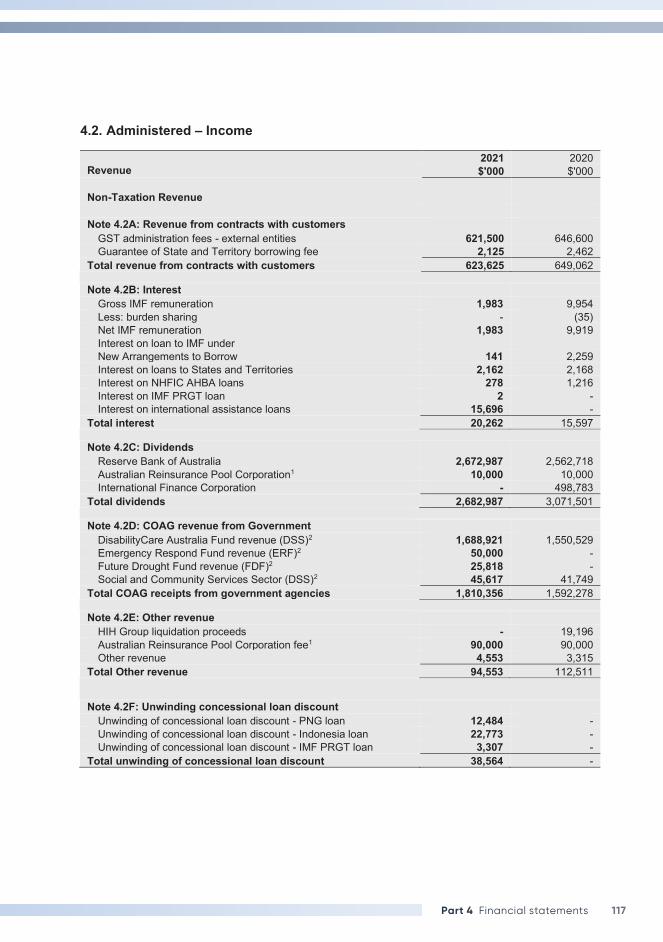
117Part 4 Financial statements
4.2. Administered – Income
2021 2020 Revenue $'000 $'000 Non-Taxation Revenue Note 4.2A: Revenue from contracts with customers
GST administration fees - external entities 621,500 646,600 Guarantee of State and Territory borrowing fee 2,125 2,462
Total revenue from contracts with customers 623,625 649,062 Note 4.2B: Interest
Gross IMF remuneration 1,983 9,954 Less: burden sharing - (35) Net IMF remuneration 1,983 9,919 Interest on loan to IMF under New Arrangements to Borrow 141 2,259 Interest on loans to States and Territories 2,162 2,168 Interest on NHFIC AHBA loans 278 1,216 Interest on IMF PRGT loan 2 - Interest on international assistance loans 15,696 -
Total interest 20,262 15,597 Note 4.2C: Dividends
Reserve Bank of Australia 2,672,987 2,562,718 Australian Reinsurance Pool Corporation1 10,000 10,000 International Finance Corporation - 498,783
Total dividends 2,682,987 3,071,501 Note 4.2D: COAG revenue from Government
DisabilityCare Australia Fund revenue (DSS)2 1,688,921 1,550,529 Emergency Respond Fund revenue (ERF)2 50,000 - Future Drought Fund revenue (FDF)2 25,818 - Social and Community Services Sector (DSS)2 45,617 41,749
Total COAG receipts from government agencies 1,810,356 1,592,278 Note 4.2E: Other revenue
HIH Group liquidation proceeds - 19,196 Australian Reinsurance Pool Corporation fee1 90,000 90,000 Other revenue 4,553 3,315
Total Other revenue 94,553 112,511 Note 4.2F: Unwinding concessional loan discount
Unwinding of concessional loan discount - PNG loan 12,484 - Unwinding of concessional loan discount - Indonesia loan 22,773 - Unwinding of concessional loan discount - IMF PRGT loan 3,307 -
Total unwinding of concessional loan discount 38,564 -
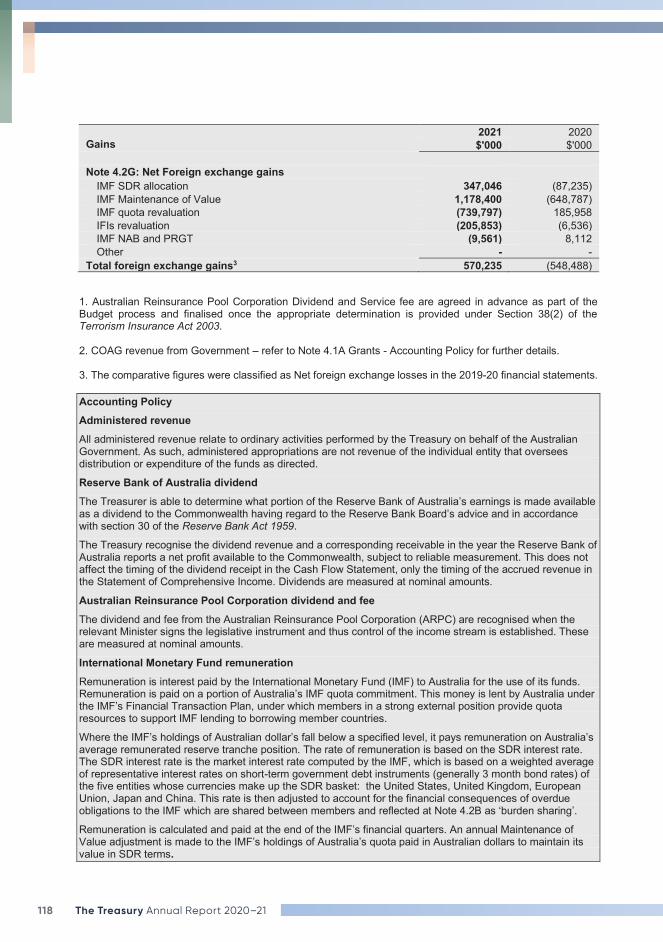
118 The Treasury Annual Report 2020–21
2021 2020 Gains $'000 $'000 Note 4.2G: Net Foreign exchange gains
IMF SDR allocation 347,046 (87,235) IMF Maintenance of Value 1,178,400 (648,787) IMF quota revaluation (739,797) 185,958 IFIs revaluation (205,853) (6,536) IMF NAB and PRGT (9,561) 8,112 Other - -
Total foreign exchange gains3 570,235 (548,488) 1. Australian Reinsurance Pool Corporation Dividend and Service fee are agreed in advance as part of the Budget process and finalised once the appropriate determination is provided under Section 38(2) of the Terrorism Insurance Act 2003.
2. COAG revenue from Government – refer to Note 4.1A Grants - Accounting Policy for further details. 3. The comparative figures were classified as Net foreign exchange losses in the 2019-20 financial statements.
Accounting Policy Administered revenue All administered revenue relate to ordinary activities performed by the Treasury on behalf of the Australian Government. As such, administered appropriations are not revenue of the individual entity that oversees distribution or expenditure of the funds as directed.
Reserve Bank of Australia dividend The Treasurer is able to determine what portion of the Reserve Bank of Australia’s earnings is made available as a dividend to the Commonwealth having regard to the Reserve Bank Board’s advice and in accordance with section 30 of the Reserve Bank Act 1959.
The Treasury recognise the dividend revenue and a corresponding receivable in the year the Reserve Bank of Australia reports a net profit available to the Commonwealth, subject to reliable measurement. This does not affect the timing of the dividend receipt in the Cash Flow Statement, only the timing of the accrued revenue in the Statement of Comprehensive Income. Dividends are measured at nominal amounts.
Australian Reinsurance Pool Corporation dividend and fee The dividend and fee from the Australian Reinsurance Pool Corporation (ARPC) are recognised when the relevant Minister signs the legislative instrument and thus control of the income stream is established. These are measured at nominal amounts.
International Monetary Fund remuneration Remuneration is interest paid by the International Monetary Fund (IMF) to Australia for the use of its funds. Remuneration is paid on a portion of Australia’s IMF quota commitment. This money is lent by Australia under the IMF’s Financial Transaction Plan, under which members in a strong external position provide quota resources to support IMF lending to borrowing member countries.
Where the IMF’s holdings of Australian dollar’s fall below a specified level, it pays remuneration on Australia’s average remunerated reserve tranche position. The rate of remuneration is based on the SDR interest rate. The SDR interest rate is the market interest rate computed by the IMF, which is based on a weighted average of representative interest rates on short-term government debt instruments (generally 3 month bond rates) of the five entities whose currencies make up the SDR basket: the United States, United Kingdom, European Union, Japan and China. This rate is then adjusted to account for the financial consequences of overdue obligations to the IMF which are shared between members and reflected at Note 4.2B as ‘burden sharing’.
Remuneration is calculated and paid at the end of the IMF’s financial quarters. An annual Maintenance of Value adjustment is made to the IMF’s holdings of Australia’s quota paid in Australian dollars to maintain its value in SDR terms.
119Part 4 Financial statements
International Monetary Fund New Arrangements to Borrow (NAB) Australia also receives interest on amounts lent to the IMF under the New Arrangements to Borrow (NAB). Amounts lent to the IMF under the NAB accrue interest daily at the SDR interest rate (or such other rate as agreed by 85 per cent of NAB participants). The IMF pays interest on NAB amounts quarterly.
The IMF must repay amounts lent through the NAB five years after each call is made. Amounts can be repaid earlier at the IMF’s discretion.
IMF Poverty Reduction and Growth Trust Australia also receives interest on amounts lent to the IMF under the Poverty Reduction and Growth Trust (PRGT). Amounts lent to the IMF under the PRGT accrue interest daily at the SDR interest rate (or such other rate as agreed by 85 per cent of PRGT lenders). The IMF pays interest on PRGT amounts quarterly.
The IMF must repay amounts lent through the PRGT in line with the pass-through loan arrangement, this is usually ten years. Amounts can be repaid earlier if the pass-through loan is repaid early.
International Finance Corporation On 16 April 2020, the Board of Governors of the International Finance Corporation passed Resolution 270 - Conversion of Retained Earnings and General Capital Increase. Following the passage of the Resolution, retained earnings converted to 16,999,998 additional shares with a par value of $1,000 USD each. Australia was allocated 313,535 shares valued at $498.783 million. This is treated as a non-cash dividend.
The Guarantee of State and Territory Borrowing Under the Guarantee of State and Territory Borrowing, a fee is paid to provide the guarantee over new and nominated existing State and Territory securities. Fees are reported as a fee for service in accordance with AASB 118 Revenue. The guarantee closed to new issuances of guaranteed liabilities on 31 December 2010.
Financial guarantee contracts Financial guarantee contracts are accounted for in accordance with AASB 139 Financial Instruments: Recognition and Measurement. They are not treated as contingent liabilities, as they are regarded as financial instruments outside the scope of AASB 137 Provisions, Contingent Liabilities and Contingent Assets. The Treasury’s administered financial guarantee contracts relate to components of the Guarantee of State and Territory Borrowing.
120 The Treasury Annual Report 2020–21
5. Assets and Liabilities Administered on Behalf of Government This section analyses assets used to conduct operations and the operating liabilities incurred as a result, which the Treasury does not control but administers on behalf of the Government. Unless otherwise noted, the accounting policies adopted are consistent with those applied for departmental reporting. 5.1. Administered – Financial Assets
2021 2020 $'000 $'000 Note 5.1A: Cash and cash equivalents Cash held in the OPA - NHFIC Special Account 747,269 449,817 Cash held in the OPA - COAG Special Account 50,000 - Total cash and cash equivalents 797,269 449,817
Accounting Policy
The Treasury’s administered cash and cash equivalents relate to special account balances held in the OPA. Refer to Note 6.2 Special accounts for more information.
2021 2020 $'000 $'000 Note 5.1B: Loans and other receivables Loans Loans to States and Territories 47,855 47,855 International assistance loans 1,367,085 - Loans to NHFIC 87,731 115,183 IMF New Arrangements to Borrow loan 120,471 213,060 IMF PRGT loan 378,812 - Total loans 2,001,954 376,098 Other receivables Guarantee Scheme for Large Deposits and Wholesale Funding contractual fee receivable - - IMF Maintenance of Value receivable 1,178,400 - Borrowing contractual fee receivable1 1,406 3,658 Guarantee of State and Territory Borrowing fee receivable 112 188 Net GST receivable from the ATO 358 1,397 IMF related moneys owing 248 320 Dividends receivable 2,669,000 2,563,000 Accrued interest - loans to NHFIC 50 53 Accrued interest - international loans 5,150 - Accrued interest - IMF PRGT loan 1 - GST revenue allocation and COAG receivable 3,597 5,174,947 Other receivables - 2 Total other receivables 3,858,322 7,743,565 Total loans and other receivables (gross) 5,860,276 8,119,663 Receivables are expected to be recovered in No more than 12 months 3,957,682 7,742,101 More than 12 months 1,902,594 377,562 Total receivables (gross) 5,860,276 8,119,663 Receivables (gross) are aged as follows Not overdue 5,860,276 8,119,663 Total receivables (gross) 5,860,276 8,119,663
1. Refer to Note 5.2C Unearned income for corresponding liability.
121Part 4 Financial statements
Note 5.1B: Concessional loans carrying amounts
Loan to
PNG Loan to
Indonesia IMF PRGT
loan Total $’000 $’000 $’000 $’000 As at 1 July 2020 - - - - Gross funded loans and advances 557,523 1,500,000 396,112 2,453,635 Less: concessional loan disount on drawn loans (253,169) (422,526) (20,823) (696,518) Less: repayment of principal and interest - (50,000) - (50,000) Add: unwinding of concessional loan discount (income) 12,484 22,773 - 35,257 Add: foreign exchange movement - - 3,523 3,523 Less: impairment allowance - - - - Total as at 30 June 2021 316,838 1,050,247 378,812 1,745,897
Accounting Policy Except for financial guarantee contracts, all loans and receivables are classified as amortised cost under AASB 9. Refer to Note 7.4 Administered financial instruments for further details on accounting treatment.
Loans to NHFIC Loans to NHFIC relate to the Affordable Housing Bond Aggregator (AHBA), which was established by NHFIC to provide loans to registered Community Housing Providers (CHPs). In accordance with the National Housing Finance and Investment Corporation Investment Mandate Direction 2018, each loan allocated to the AHBA must relate to a particular loan to a CHP unless approved by the Treasurer and Minister for Finance. Interest is to be charged on each loan at a rate that covers the Commonwealth’s cost of borrowing over the life of the loan. The interest has been accrued as earned and disclosed in Notes 4.2B and 5.1B.
IMF New Arrangements to Borrow Australia lent to the IMF under the New Arrangements to Borrow (NAB). NAB is a set of credit arrangements between the IMF and 38 member countries and Institutions, including a number of emerging market countries. The NAB is used in circumstances in which the IMF needs to supplement its quota resources for lending purposes. The NAB is covered by general activation periods of up to six months, with each activation periods subject to a specified maximum level of commitments. The IMF must repay amounts lent through the NAB five years after each call is made. Amounts can be repaid earlier at the IMF’s discretion. IMF Poverty Reduction and Growth Trust Australia lent to the IMF under the Poverty Reduction and Growth Trust (PRGT). The IMF is the Trustee of the PRGT, which is used to provide concessional lending to low-income countries. When the IMF makes a loan through the PRGT, it draws on it’s credit arrangements. The IMF must repay amounts lent through the PRGT in line with the pass-through loan arrangement, this is usually ten years. Amounts can be repaid earlier if the pass-through loan is repaid early. International Assistance Loans to PNG On 22 November 2020, the Commonwealth of Australia agreed to lend A$558 million to the Independent State of Papua New Guinea (PNG). This agreement was made to provide budget support to PNG and to support its reform actions under the International Monetary fund (IMF) Staff-Monitored Program (SMP). The funds will be used to provide budgetary support to help address the deteriorating fiscal position that PNG has been facing in recent years. The deterioration in fiscal position has been further exacerbated by the COVID-19 pandemic. Additionally, the funds were used to refinance a US$300 million loan that PNG had with Export Finance Australia. The interest rate on the loan is fixed to match the yield on 10-year Australian Government Securities as at the date of drawdown by PNG, with an additional 0.5 per cent margin to cover administrative costs associated with the loan. Instalments on the loan principal and interest are repayable over fifteen years every six months in Australian dollars.
122 The Treasury Annual Report 2020–21
International Assistance Loans to Indonesia On 12 November 2020, the Commonwealth of Australia agreed to lend A$1.5 billion to the Republic of Indonesia. This agreement is part of a multilateral action to support Indonesia led by the Asian Development Bank and including the Asian Infrastructure Investment Bank, the Japan International Cooperation Agency
and the German state-owned development bank.The funds were used to support Indonesia’s COVID-19 response, including social protection initiatives and health system development.
The interest rate on the loan is fixed to match the yield on 10-year Australian Government Securities as at the date of drawdown by the Indonesian Government, with an additional 0.5 per cent margin to cover administrative costs associated with the loan. Instalments on the loan principal and interest are repayable over fifteen years every six months in Australian dollars.
GST Revenue allocation and COAG receivable
Under the COAG arrangements, the Treasury separately discloses grants payable (grants not paid prior to year-end) and receivable (primarily GST revenue allocations and other COAG grants receivable) based on information provided by Commonwealth Agencies for each COAG grant. The current year’s COAG receivable relates to the future drought funding due from the Department of Agriculture, Water and Environment for payments to the States and Territories.
GST is paid to the State and Territories based on estimated figures provided in the Budget and revisited in the Mid-Year Economic and Fiscal Outcome (MYEFO) round. The key driver of the calculation of the distribution of GST is population and actual collections. At the end of each financial year, the Australian Bureau of Statistics provides population data and the ATO provides the actual GST collection figures. The difference between the estimated State and Territory payments is recorded as GST revenue allocation. Current year GST revenue allocation is $nil (2020: $5,174.9 million). Refer to Note 5.2A Grants for further details.
2021 2020 $'000 $'000 Note 5.1C: Investments International financial institutions
Asian Development Bank 582,976 617,551 Asian Infrastructure & Investment Bank 981,910 1,075,623 European Bank for Reconstruction
and Development 99,051 102,438 International Bank for Reconstruction
and Development 368,269 340,014 International Finance Corporation 534,469 525,811 Multilateral Investment Guarantee Agency 8,248 9,035
Total international financial institutions 2,574,923 2,670,472 Australian Government entities
Reserve Bank of Australia 22,466,000 29,601,000 Australian Reinsurance Pool Corporation 595,429 520,526 NHFIC 411,047 305,225
Total Australian Government entities 23,472,476 30,426,751 Commonwealth companies
Financial Adviser Standards and Ethics Authority Ltd - 1,436 Total Commonwealth companies - 1,436 Other investments
Australian Business Growth Fund 4,778 - IMF quota 12,473,714 13,213,510
Total other investments 12,478,492 13,213,510 Total investments 38,525,891 46,312,169 Investments are expected to be recovered in more than 12 months.
Accounting Policy Administered investments Investments are classified as fair value through other comprehensive income. Refer to Note 7.4 Administered Financial Instruments for further details on the Treasury’s accounting policy.
Development banks Australia holds shares in the World Bank Group (WBG), the Asian Development Bank (ADB), the European Bank for Reconstruction and Development (EBRD) and the Asian Infrastructure Investment Bank (AIIB).
Principal activities:
The World Bank was established in 1944 and comprises the International Bank for Reconstruction and Development (IBRD) and the International Development Association (IDA). The World Bank, alongside the International Finance Corporation (IFC), the Multilateral Investment Guarantee Agency (MIGA) and the International Centre for Settlement of Investment Disputes (ICSID), form the WBG.
The IBRD provides financing and technical assistance to middle income countries and creditworthy poor countries. The IDA provides grants, concessional finance and technical assistance to low income countries. The IFC supports the development of the private sector by providing direct finance to private sector operations. MIGA provides guarantee services for projects, which reduce the risks for other co-financing partners including the private sector. ICSID provides international facilities for conciliation and arbitration of investment disputes.
International Assistance Loans to Indonesia On 12 November 2020, the Commonwealth of Australia agreed to lend A$1.5 billion to the Republic of Indonesia. This agreement is part of a multilateral action to support Indonesia led by the Asian Development Bank and including the Asian Infrastructure Investment Bank, the Japan International Cooperation Agency
and the German state-owned development bank.The funds were used to support Indonesia’s COVID-19 response, including social protection initiatives and health system development.
The interest rate on the loan is fixed to match the yield on 10-year Australian Government Securities as at the date of drawdown by the Indonesian Government, with an additional 0.5 per cent margin to cover administrative costs associated with the loan. Instalments on the loan principal and interest are repayable over fifteen years every six months in Australian dollars.
GST Revenue allocation and COAG receivable
Under the COAG arrangements, the Treasury separately discloses grants payable (grants not paid prior to year-end) and receivable (primarily GST revenue allocations and other COAG grants receivable) based on information provided by Commonwealth Agencies for each COAG grant. The current year’s COAG receivable relates to the future drought funding due from the Department of Agriculture, Water and Environment for payments to the States and Territories.
GST is paid to the State and Territories based on estimated figures provided in the Budget and revisited in the Mid-Year Economic and Fiscal Outcome (MYEFO) round. The key driver of the calculation of the distribution of GST is population and actual collections. At the end of each financial year, the Australian Bureau of Statistics provides population data and the ATO provides the actual GST collection figures. The difference between the estimated State and Territory payments is recorded as GST revenue allocation. Current year GST revenue allocation is $nil (2020: $5,174.9 million). Refer to Note 5.2A Grants for further details.
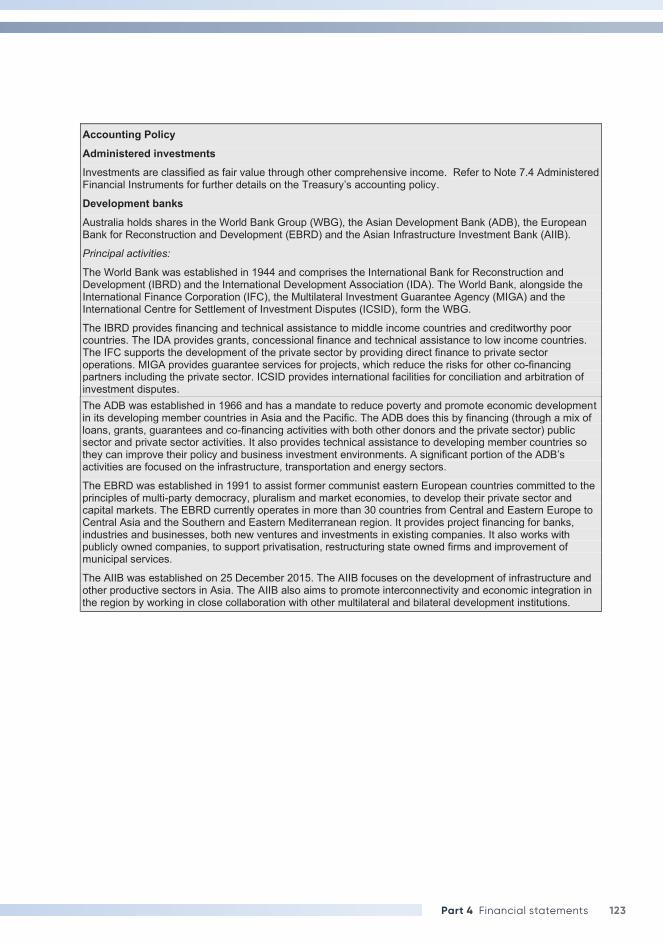
123Part 4 Financial statements
2021 2020 $'000 $'000 Note 5.1C: Investments International financial institutions
Asian Development Bank 582,976 617,551 Asian Infrastructure & Investment Bank 981,910 1,075,623 European Bank for Reconstruction
and Development 99,051 102,438 International Bank for Reconstruction
and Development 368,269 340,014 International Finance Corporation 534,469 525,811 Multilateral Investment Guarantee Agency 8,248 9,035
Total international financial institutions 2,574,923 2,670,472 Australian Government entities
Reserve Bank of Australia 22,466,000 29,601,000 Australian Reinsurance Pool Corporation 595,429 520,526 NHFIC 411,047 305,225
Total Australian Government entities 23,472,476 30,426,751 Commonwealth companies
Financial Adviser Standards and Ethics Authority Ltd - 1,436 Total Commonwealth companies - 1,436 Other investments
Australian Business Growth Fund 4,778 - IMF quota 12,473,714 13,213,510
Total other investments 12,478,492 13,213,510 Total investments 38,525,891 46,312,169 Investments are expected to be recovered in more than 12 months.
Accounting Policy Administered investments Investments are classified as fair value through other comprehensive income. Refer to Note 7.4 Administered Financial Instruments for further details on the Treasury’s accounting policy.
Development banks Australia holds shares in the World Bank Group (WBG), the Asian Development Bank (ADB), the European Bank for Reconstruction and Development (EBRD) and the Asian Infrastructure Investment Bank (AIIB).
Principal activities:
The World Bank was established in 1944 and comprises the International Bank for Reconstruction and Development (IBRD) and the International Development Association (IDA). The World Bank, alongside the International Finance Corporation (IFC), the Multilateral Investment Guarantee Agency (MIGA) and the International Centre for Settlement of Investment Disputes (ICSID), form the WBG.
The IBRD provides financing and technical assistance to middle income countries and creditworthy poor countries. The IDA provides grants, concessional finance and technical assistance to low income countries. The IFC supports the development of the private sector by providing direct finance to private sector operations. MIGA provides guarantee services for projects, which reduce the risks for other co-financing partners including the private sector. ICSID provides international facilities for conciliation and arbitration of investment disputes.
The ADB was established in 1966 and has a mandate to reduce poverty and promote economic development in its developing member countries in Asia and the Pacific. The ADB does this by financing (through a mix of loans, grants, guarantees and co-financing activities with both other donors and the private sector) public sector and private sector activities. It also provides technical assistance to developing member countries so they can improve their policy and business investment environments. A significant portion of the ADB’s activities are focused on the infrastructure, transportation and energy sectors.
The EBRD was established in 1991 to assist former communist eastern European countries committed to the principles of multi-party democracy, pluralism and market economies, to develop their private sector and capital markets. The EBRD currently operates in more than 30 countries from Central and Eastern Europe to Central Asia and the Southern and Eastern Mediterranean region. It provides project financing for banks, industries and businesses, both new ventures and investments in existing companies. It also works with publicly owned companies, to support privatisation, restructuring state owned firms and improvement of municipal services.
The AIIB was established on 25 December 2015. The AIIB focuses on the development of infrastructure and other productive sectors in Asia. The AIIB also aims to promote interconnectivity and economic integration in the region by working in close collaboration with other multilateral and bilateral development institutions.
International Monetary Fund The IMF is an organisation with 189 member countries, working to ensure the stability of the international monetary system - the system of exchange rates and international payments that enables countries (and their citizens) to transact with each other. The IMF does this through: surveillance, including annual economic assessments of member countries; technical assistance to member countries; and by making resources available (with adequate safeguards) to members experiencing balance of payments difficulties.
Quota subscriptions which are denominated in SDRs represent a member’s shareholding in the IMF and generate most of the IMF’s financial resources.
Australian Government entities Administered investments in controlled corporate entities are not consolidated because their consolidation is relevant only at the whole of government level.
The Reserve Bank of Australia is Australia's central bank. Its duty is to contribute to the maintenance of price stability, full employment and the economic prosperity and welfare of the Australian people. It does this by setting the cash rate to meet a medium-term inflation target, working to maintain a strong financial system and efficient payments system and issuing the nation's banknotes. The Bank provides selected banking services to the Australian Government and its agencies and to a number of overseas central banks and official institutions. Additionally, it manages Australia's gold and foreign exchange reserves.
The Australian Reinsurance Pool Corporation (ARPC) is a Commonwealth public financial corporation established by the Terrorism Insurance Act 2003 to administer the terrorism reinsurance scheme, providing primary insurers with reinsurance for commercial property and associated business interruption losses arising from a declared terrorist incident.
The National Housing Finance and Investment Corporation (NHFIC) was established under the National Housing Finance and Investment Corporation Act 2018 in June 2018. NHFIC’s purpose is to improve housing outcomes for Australians by providing funding to eligible housing projects through two key financing mechanisms: the National Housing Infrastructure Facility (NHIF), which provides loans, investments and grants for enabling infrastructure to support new housing; and the Affordable Housing Bond Aggregator (AHBA), which provides low-cost, long-term finance to community housing providers.
Financial Adviser Standards and Ethics Authority Ltd (FASEA) is a Commonwealth entity that was established in April 2017 to set standards for the ethical conduct, educational qualifications and ongoing training of licensed financial advisers in Australia.
The Commonwealth, as represented by the Assistant Minister for Superannuation, Financial Services and Financial Technology, is the sole shareholder. FASEA is funded by contributions from participating financial institutions under FASEA’s Funding agreement. All revenue and any subsequent profits are to be used to fund the operations of FASEA and cannot be distributed to the Commonwealth. Upon winding up, any surplus is returned to the contributing financial institutions and the shareholder is required to contribute $10.00.
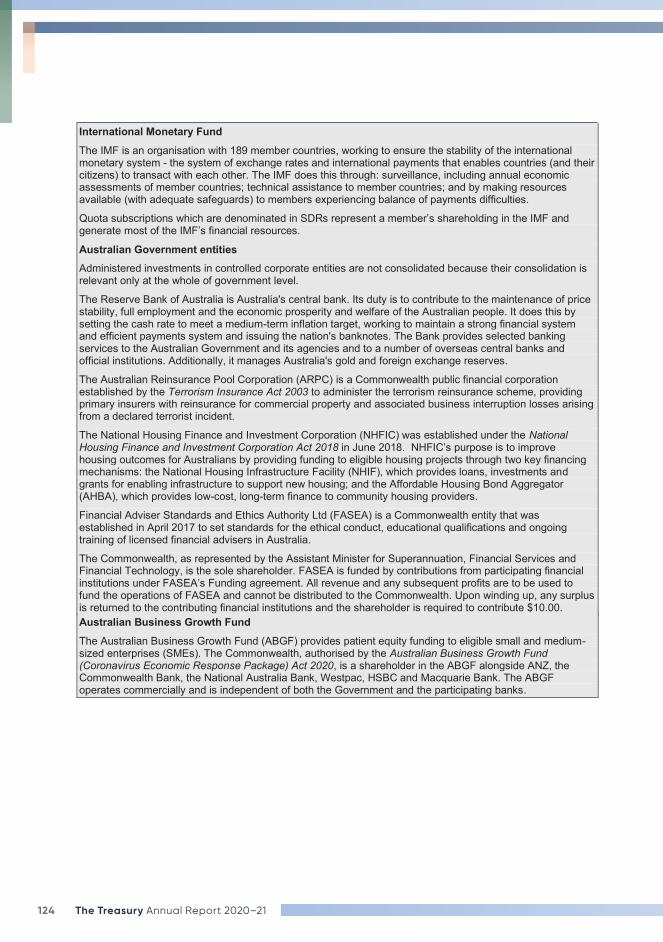
124 The Treasury Annual Report 2020–21
The ADB was established in 1966 and has a mandate to reduce poverty and promote economic development in its developing member countries in Asia and the Pacific. The ADB does this by financing (through a mix of loans, grants, guarantees and co-financing activities with both other donors and the private sector) public sector and private sector activities. It also provides technical assistance to developing member countries so they can improve their policy and business investment environments. A significant portion of the ADB’s activities are focused on the infrastructure, transportation and energy sectors.
The EBRD was established in 1991 to assist former communist eastern European countries committed to the principles of multi-party democracy, pluralism and market economies, to develop their private sector and capital markets. The EBRD currently operates in more than 30 countries from Central and Eastern Europe to Central Asia and the Southern and Eastern Mediterranean region. It provides project financing for banks, industries and businesses, both new ventures and investments in existing companies. It also works with publicly owned companies, to support privatisation, restructuring state owned firms and improvement of municipal services.
The AIIB was established on 25 December 2015. The AIIB focuses on the development of infrastructure and other productive sectors in Asia. The AIIB also aims to promote interconnectivity and economic integration in the region by working in close collaboration with other multilateral and bilateral development institutions.
International Monetary Fund The IMF is an organisation with 189 member countries, working to ensure the stability of the international monetary system - the system of exchange rates and international payments that enables countries (and their citizens) to transact with each other. The IMF does this through: surveillance, including annual economic assessments of member countries; technical assistance to member countries; and by making resources available (with adequate safeguards) to members experiencing balance of payments difficulties.
Quota subscriptions which are denominated in SDRs represent a member’s shareholding in the IMF and generate most of the IMF’s financial resources.
Australian Government entities Administered investments in controlled corporate entities are not consolidated because their consolidation is relevant only at the whole of government level.
The Reserve Bank of Australia is Australia's central bank. Its duty is to contribute to the maintenance of price stability, full employment and the economic prosperity and welfare of the Australian people. It does this by setting the cash rate to meet a medium-term inflation target, working to maintain a strong financial system and efficient payments system and issuing the nation's banknotes. The Bank provides selected banking services to the Australian Government and its agencies and to a number of overseas central banks and official institutions. Additionally, it manages Australia's gold and foreign exchange reserves.
The Australian Reinsurance Pool Corporation (ARPC) is a Commonwealth public financial corporation established by the Terrorism Insurance Act 2003 to administer the terrorism reinsurance scheme, providing primary insurers with reinsurance for commercial property and associated business interruption losses arising from a declared terrorist incident.
The National Housing Finance and Investment Corporation (NHFIC) was established under the National Housing Finance and Investment Corporation Act 2018 in June 2018. NHFIC’s purpose is to improve housing outcomes for Australians by providing funding to eligible housing projects through two key financing mechanisms: the National Housing Infrastructure Facility (NHIF), which provides loans, investments and grants for enabling infrastructure to support new housing; and the Affordable Housing Bond Aggregator (AHBA), which provides low-cost, long-term finance to community housing providers.
Financial Adviser Standards and Ethics Authority Ltd (FASEA) is a Commonwealth entity that was established in April 2017 to set standards for the ethical conduct, educational qualifications and ongoing training of licensed financial advisers in Australia.
The Commonwealth, as represented by the Assistant Minister for Superannuation, Financial Services and Financial Technology, is the sole shareholder. FASEA is funded by contributions from participating financial institutions under FASEA’s Funding agreement. All revenue and any subsequent profits are to be used to fund the operations of FASEA and cannot be distributed to the Commonwealth. Upon winding up, any surplus is returned to the contributing financial institutions and the shareholder is required to contribute $10.00.
Australian Business Growth Fund The Australian Business Growth Fund (ABGF) provides patient equity funding to eligible small and medium-sized enterprises (SMEs). The Commonwealth, authorised by the Australian Business Growth Fund (Coronavirus Economic Response Package) Act 2020, is a shareholder in the ABGF alongside ANZ, the Commonwealth Bank, the National Australia Bank, Westpac, HSBC and Macquarie Bank. The ABGF operates commercially and is independent of both the Government and the participating banks.
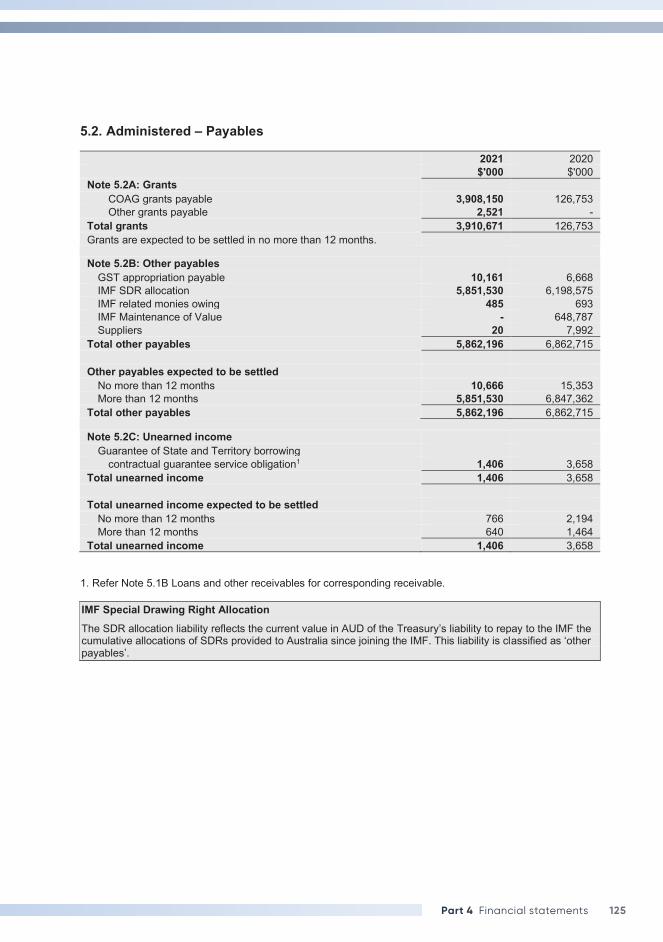
125Part 4 Financial statements
5.2. Administered – Payables
2021 2020 $'000 $'000 Note 5.2A: Grants
COAG grants payable 3,908,150 126,753 Other grants payable 2,521 -
Total grants 3,910,671 126,753 Grants are expected to be settled in no more than 12 months.
Note 5.2B: Other payables
GST appropriation payable 10,161 6,668 IMF SDR allocation 5,851,530 6,198,575 IMF related monies owing 485 693 IMF Maintenance of Value - 648,787 Suppliers 20 7,992
Total other payables 5,862,196 6,862,715 Other payables expected to be settled
No more than 12 months 10,666 15,353 More than 12 months 5,851,530 6,847,362
Total other payables 5,862,196 6,862,715 Note 5.2C: Unearned income
Guarantee of State and Territory borrowing contractual guarantee service obligation1 1,406 3,658
Total unearned income 1,406 3,658
Total unearned income expected to be settled No more than 12 months 766 2,194 More than 12 months 640 1,464
Total unearned income 1,406 3,658 1. Refer Note 5.1B Loans and other receivables for corresponding receivable. IMF Special Drawing Right Allocation The SDR allocation liability reflects the current value in AUD of the Treasury’s liability to repay to the IMF the cumulative allocations of SDRs provided to Australia since joining the IMF. This liability is classified as ‘other payables’.
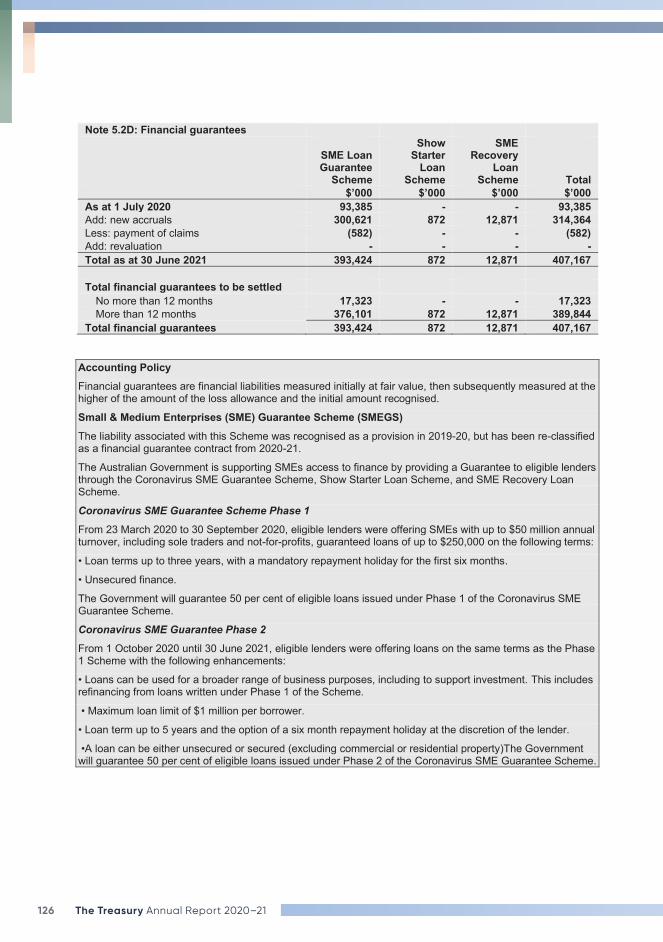
126 The Treasury Annual Report 2020–21
Note 5.2D: Financial guarantees
SME Loan Guarantee
Scheme
Show Starter
Loan Scheme
SME Recovery
Loan Scheme Total
$’000 $’000 $’000 $’000 As at 1 July 2020 93,385 - - 93,385 Add: new accruals 300,621 872 12,871 314,364 Less: payment of claims (582) - - (582) Add: revaluation - - - - Total as at 30 June 2021 393,424 872 12,871 407,167 Total financial guarantees to be settled
No more than 12 months 17,323 - - 17,323 More than 12 months 376,101 872 12,871 389,844
Total financial guarantees 393,424 872 12,871 407,167 Accounting Policy Financial guarantees are financial liabilities measured initially at fair value, then subsequently measured at the higher of the amount of the loss allowance and the initial amount recognised.
Small & Medium Enterprises (SME) Guarantee Scheme (SMEGS) The liability associated with this Scheme was recognised as a provision in 2019-20, but has been re-classified as a financial guarantee contract from 2020-21.
The Australian Government is supporting SMEs access to finance by providing a Guarantee to eligible lenders through the Coronavirus SME Guarantee Scheme, Show Starter Loan Scheme, and SME Recovery Loan Scheme.
Coronavirus SME Guarantee Scheme Phase 1
From 23 March 2020 to 30 September 2020, eligible lenders were offering SMEs with up to $50 million annual turnover, including sole traders and not-for-profits, guaranteed loans of up to $250,000 on the following terms:
• Loan terms up to three years, with a mandatory repayment holiday for the first six months.
• Unsecured finance.
The Government will guarantee 50 per cent of eligible loans issued under Phase 1 of the Coronavirus SME Guarantee Scheme.
Coronavirus SME Guarantee Phase 2
From 1 October 2020 until 30 June 2021, eligible lenders were offering loans on the same terms as the Phase 1 Scheme with the following enhancements:
• Loans can be used for a broader range of business purposes, including to support investment. This includes refinancing from loans written under Phase 1 of the Scheme.
• Maximum loan limit of $1 million per borrower.
• Loan term up to 5 years and the option of a six month repayment holiday at the discretion of the lender.
•A loan can be either unsecured or secured (excluding commercial or residential property)The Government will guarantee 50 per cent of eligible loans issued under Phase 2 of the Coronavirus SME Guarantee Scheme.
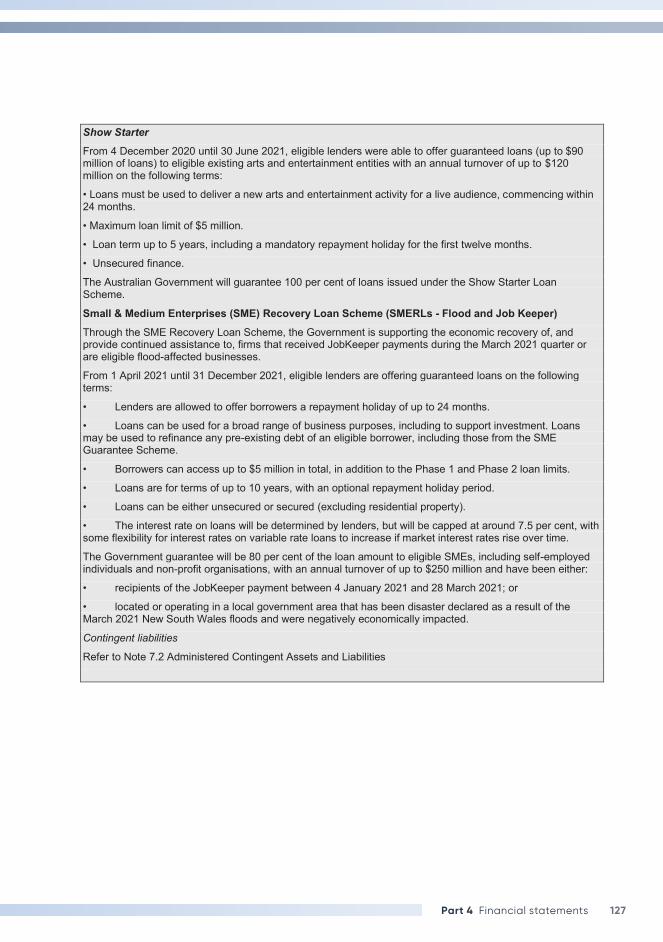
127Part 4 Financial statements
Show Starter
From 4 December 2020 until 30 June 2021, eligible lenders were able to offer guaranteed loans (up to $90 million of loans) to eligible existing arts and entertainment entities with an annual turnover of up to $120 million on the following terms:
• Loans must be used to deliver a new arts and entertainment activity for a live audience, commencing within 24 months.
• Maximum loan limit of $5 million.
• Loan term up to 5 years, including a mandatory repayment holiday for the first twelve months.
• Unsecured finance.
The Australian Government will guarantee 100 per cent of loans issued under the Show Starter Loan Scheme.
Small & Medium Enterprises (SME) Recovery Loan Scheme (SMERLs - Flood and Job Keeper) Through the SME Recovery Loan Scheme, the Government is supporting the economic recovery of, and provide continued assistance to, firms that received JobKeeper payments during the March 2021 quarter or are eligible flood-affected businesses.
From 1 April 2021 until 31 December 2021, eligible lenders are offering guaranteed loans on the following terms:
• Lenders are allowed to offer borrowers a repayment holiday of up to 24 months.
• Loans can be used for a broad range of business purposes, including to support investment. Loans may be used to refinance any pre-existing debt of an eligible borrower, including those from the SME Guarantee Scheme.
• Borrowers can access up to $5 million in total, in addition to the Phase 1 and Phase 2 loan limits.
• Loans are for terms of up to 10 years, with an optional repayment holiday period.
• Loans can be either unsecured or secured (excluding residential property).
• The interest rate on loans will be determined by lenders, but will be capped at around 7.5 per cent, with some flexibility for interest rates on variable rate loans to increase if market interest rates rise over time.
The Government guarantee will be 80 per cent of the loan amount to eligible SMEs, including self-employed individuals and non-profit organisations, with an annual turnover of up to $250 million and have been either:
• recipients of the JobKeeper payment between 4 January 2021 and 28 March 2021; or
• located or operating in a local government area that has been disaster declared as a result of the March 2021 New South Wales floods and were negatively economically impacted.
Contingent liabilities
Refer to Note 7.2 Administered Contingent Assets and Liabilities
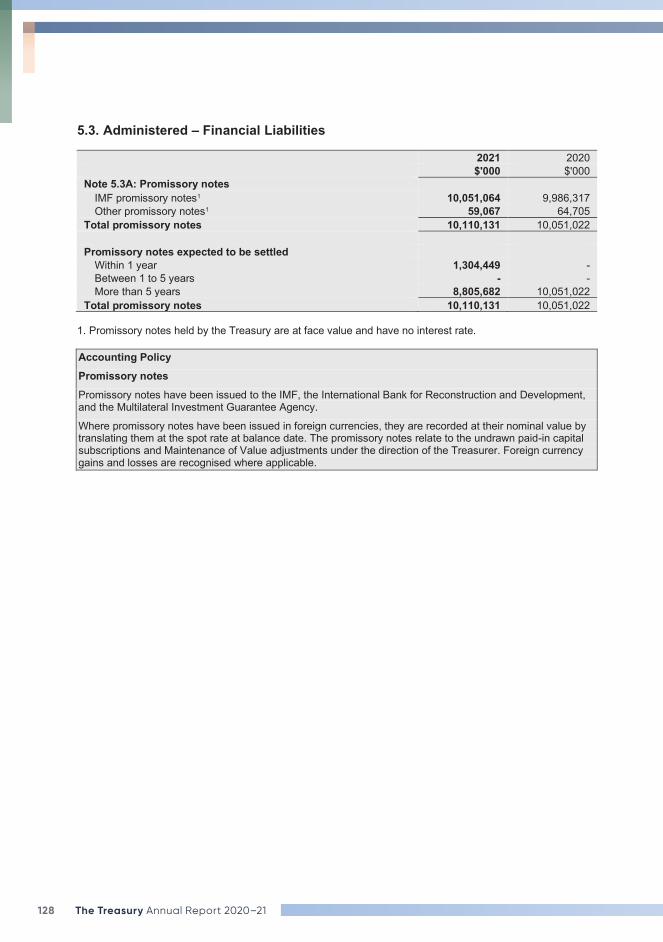
128 The Treasury Annual Report 2020–21
5.3. Administered – Financial Liabilities
2021 2020 $'000 $'000 Note 5.3A: Promissory notes
IMF promissory notes1 10,051,064 9,986,317 Other promissory notes1 59,067 64,705
Total promissory notes 10,110,131 10,051,022 Promissory notes expected to be settled
Within 1 year 1,304,449 - Between 1 to 5 years - - More than 5 years 8,805,682 10,051,022
Total promissory notes 10,110,131 10,051,022 1. Promissory notes held by the Treasury are at face value and have no interest rate. Accounting Policy Promissory notes Promissory notes have been issued to the IMF, the International Bank for Reconstruction and Development, and the Multilateral Investment Guarantee Agency.
Where promissory notes have been issued in foreign currencies, they are recorded at their nominal value by translating them at the spot rate at balance date. The promissory notes relate to the undrawn paid-in capital subscriptions and Maintenance of Value adjustments under the direction of the Treasurer. Foreign currency gains and losses are recognised where applicable.
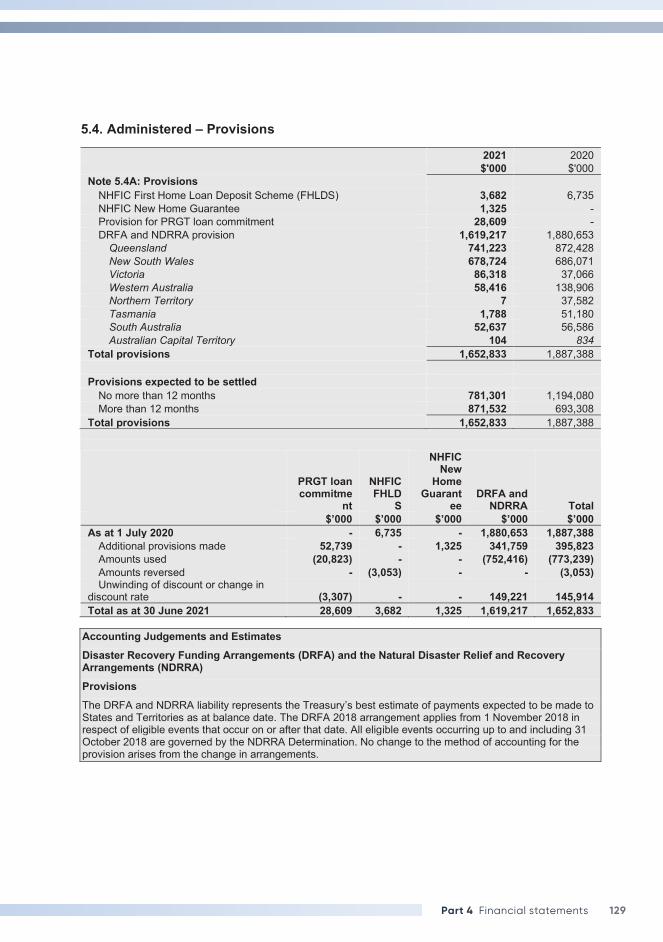
129Part 4 Financial statements
5.4. Administered – Provisions
2021 2020 $'000 $'000 Note 5.4A: Provisions
NHFIC First Home Loan Deposit Scheme (FHLDS) 3,682 6,735 NHFIC New Home Guarantee 1,325 - Provision for PRGT loan commitment 28,609 - DRFA and NDRRA provision 1,619,217 1,880,653
Queensland 741,223 872,428 New South Wales 678,724 686,071 Victoria 86,318 37,066 Western Australia 58,416 138,906 Northern Territory 7 37,582 Tasmania 1,788 51,180 South Australia 52,637 56,586 Australian Capital Territory 104 834
Total provisions 1,652,833 1,887,388 Provisions expected to be settled
No more than 12 months 781,301 1,194,080 More than 12 months 871,532 693,308
Total provisions 1,652,833 1,887,388
PRGT loan commitme
nt
NHFIC FHLD
S
NHFIC New
Home Guarant
ee DRFA and
NDRRA Total $’000 $’000 $’000 $’000 $’000 As at 1 July 2020 - 6,735 - 1,880,653 1,887,388
Additional provisions made 52,739 - 1,325 341,759 395,823 Amounts used (20,823) - - (752,416) (773,239) Amounts reversed - (3,053) - - (3,053) Unwinding of discount or change in
discount rate (3,307) - - 149,221 145,914 Total as at 30 June 2021 28,609 3,682 1,325 1,619,217 1,652,833
Accounting Judgements and Estimates Disaster Recovery Funding Arrangements (DRFA) and the Natural Disaster Relief and Recovery Arrangements (NDRRA) Provisions The DRFA and NDRRA liability represents the Treasury’s best estimate of payments expected to be made to States and Territories as at balance date. The DRFA 2018 arrangement applies from 1 November 2018 in respect of eligible events that occur on or after that date. All eligible events occurring up to and including 31 October 2018 are governed by the NDRRA Determination. No change to the method of accounting for the provision arises from the change in arrangements.
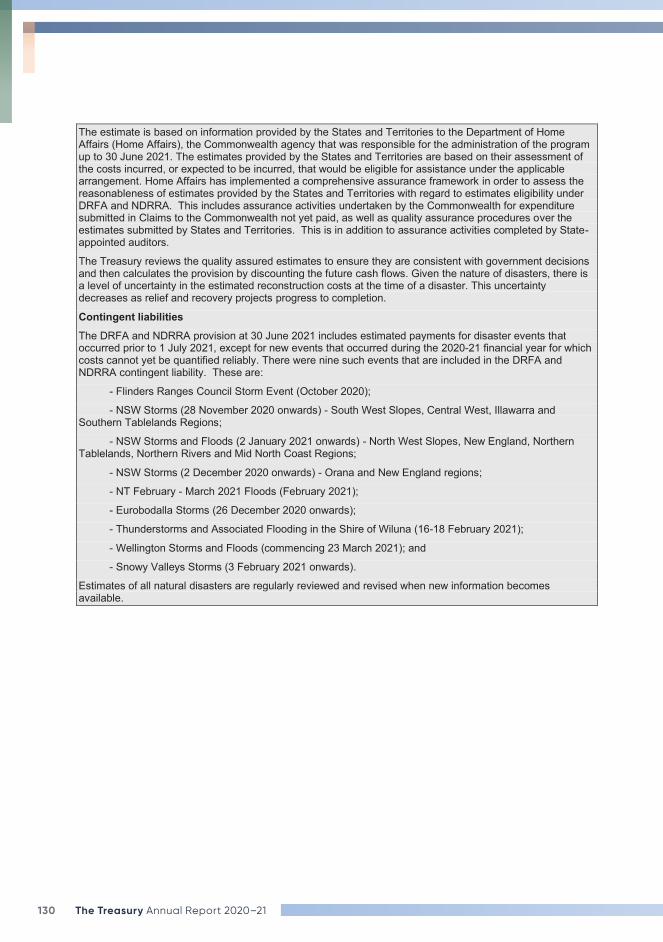
130 The Treasury Annual Report 2020–21
The estimate is based on information provided by the States and Territories to the Department of Home Affairs (Home Affairs), the Commonwealth agency that was responsible for the administration of the program up to 30 June 2021. The estimates provided by the States and Territories are based on their assessment of the costs incurred, or expected to be incurred, that would be eligible for assistance under the applicable arrangement. Home Affairs has implemented a comprehensive assurance framework in order to assess the reasonableness of estimates provided by the States and Territories with regard to estimates eligibility under DRFA and NDRRA. This includes assurance activities undertaken by the Commonwealth for expenditure submitted in Claims to the Commonwealth not yet paid, as well as quality assurance procedures over the estimates submitted by States and Territories. This is in addition to assurance activities completed by State-appointed auditors.
The Treasury reviews the quality assured estimates to ensure they are consistent with government decisions and then calculates the provision by discounting the future cash flows. Given the nature of disasters, there is a level of uncertainty in the estimated reconstruction costs at the time of a disaster. This uncertainty decreases as relief and recovery projects progress to completion.
Contingent liabilities The DRFA and NDRRA provision at 30 June 2021 includes estimated payments for disaster events that occurred prior to 1 July 2021, except for new events that occurred during the 2020-21 financial year for which costs cannot yet be quantified reliably. There were nine such events that are included in the DRFA and NDRRA contingent liability. These are:
- Flinders Ranges Council Storm Event (October 2020);
- NSW Storms (28 November 2020 onwards) - South West Slopes, Central West, Illawarra and Southern Tablelands Regions;
- NSW Storms and Floods (2 January 2021 onwards) - North West Slopes, New England, Northern Tablelands, Northern Rivers and Mid North Coast Regions;
- NSW Storms (2 December 2020 onwards) - Orana and New England regions;
- NT February - March 2021 Floods (February 2021);
- Eurobodalla Storms (26 December 2020 onwards);
- Thunderstorms and Associated Flooding in the Shire of Wiluna (16-18 February 2021);
- Wellington Storms and Floods (commencing 23 March 2021); and
- Snowy Valleys Storms (3 February 2021 onwards).
Estimates of all natural disasters are regularly reviewed and revised when new information becomes available.
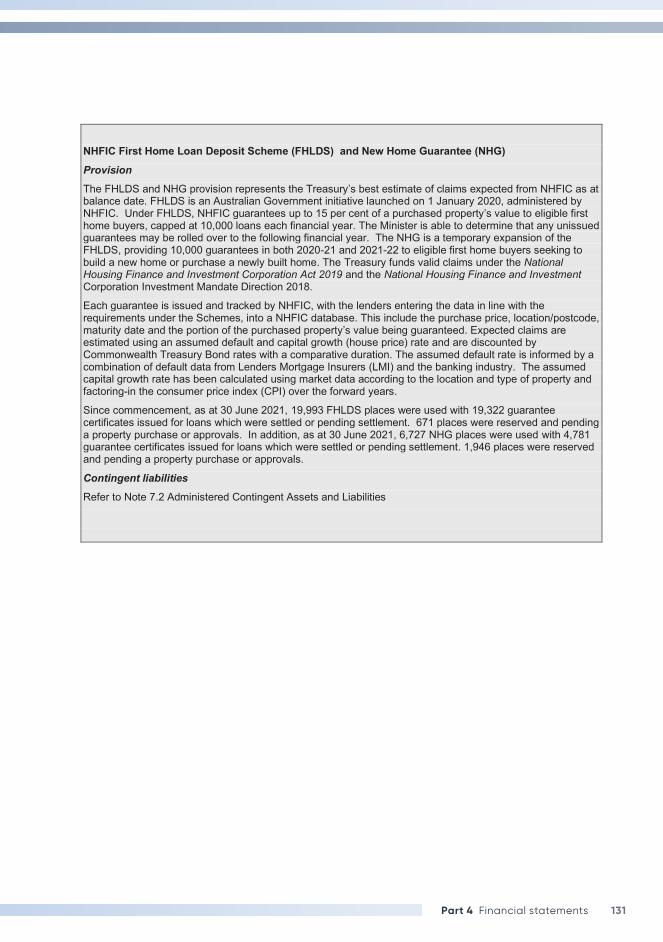
131Part 4 Financial statements
NHFIC First Home Loan Deposit Scheme (FHLDS) and New Home Guarantee (NHG) Provision
The FHLDS and NHG provision represents the Treasury’s best estimate of claims expected from NHFIC as at balance date. FHLDS is an Australian Government initiative launched on 1 January 2020, administered by NHFIC. Under FHLDS, NHFIC guarantees up to 15 per cent of a purchased property’s value to eligible first home buyers, capped at 10,000 loans each financial year. The Minister is able to determine that any unissued guarantees may be rolled over to the following financial year. The NHG is a temporary expansion of the FHLDS, providing 10,000 guarantees in both 2020-21 and 2021-22 to eligible first home buyers seeking to build a new home or purchase a newly built home. The Treasury funds valid claims under the National Housing Finance and Investment Corporation Act 2019 and the National Housing Finance and Investment Corporation Investment Mandate Direction 2018.
Each guarantee is issued and tracked by NHFIC, with the lenders entering the data in line with the requirements under the Schemes, into a NHFIC database. This include the purchase price, location/postcode, maturity date and the portion of the purchased property’s value being guaranteed. Expected claims are estimated using an assumed default and capital growth (house price) rate and are discounted by Commonwealth Treasury Bond rates with a comparative duration. The assumed default rate is informed by a combination of default data from Lenders Mortgage Insurers (LMI) and the banking industry. The assumed capital growth rate has been calculated using market data according to the location and type of property and factoring-in the consumer price index (CPI) over the forward years.
Since commencement, as at 30 June 2021, 19,993 FHLDS places were used with 19,322 guarantee certificates issued for loans which were settled or pending settlement. 671 places were reserved and pending a property purchase or approvals. In addition, as at 30 June 2021, 6,727 NHG places were used with 4,781 guarantee certificates issued for loans which were settled or pending settlement. 1,946 places were reserved and pending a property purchase or approvals.
Contingent liabilities
Refer to Note 7.2 Administered Contingent Assets and Liabilities
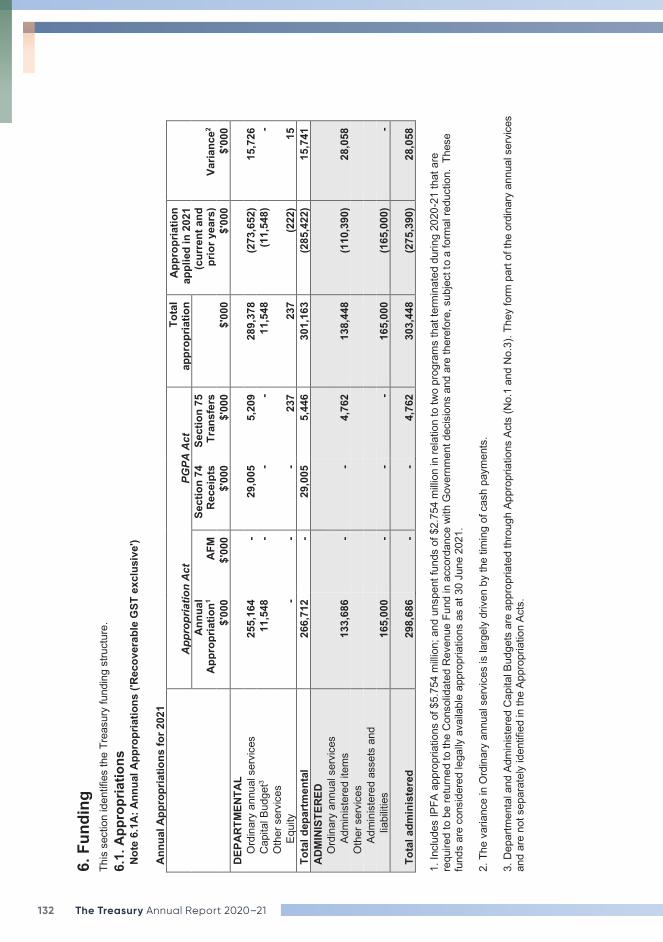
132 The Treasury Annual Report 2020–21
6. F
undi
ng
This
sec
tion
iden
tifie
s th
e Tr
easu
ry fu
ndin
g st
ruct
ure.
6.1.
App
ropr
iatio
ns
Note
6.1
A: A
nnua
l App
ropr
iatio
ns ('
Reco
vera
ble
GST
exc
lusi
ve')
An
nual
App
ropr
iatio
ns fo
r 202
1
A
ppro
pria
tion
Act
PG
PA A
ct
Tota
l ap
prop
riatio
n Ap
prop
riatio
n ap
plie
d in
202
1 (c
urre
nt a
nd
prio
r yea
rs)
An
nual
Ap
prop
riatio
n1 AF
M
Sect
ion
74
Rece
ipts
Se
ctio
n 75
Tr
ansf
ers
Va
rianc
e2
$'00
0 $'
000
$'00
0 $'
000
$'00
0 $'
000
$'00
0 DE
PART
MEN
TAL
O
rdin
ary
annu
al s
ervi
ces
255,
164
-
29,0
05
5,20
9
289,
378
(2
73,6
52)
15,7
26
Cap
ital B
udge
t3 11
,548
-
- -
11,5
48
(11,
548)
-
Oth
er s
ervi
ces
Eq
uity
-
- -
237
23
7
(222
) 15
To
tal d
epar
tmen
tal
266,
712
-
29,0
05
5,44
6
301,
163
(2
85,4
22)
15,7
41
ADM
INIS
TERE
D
Ord
inar
y an
nual
ser
vice
s
Adm
inis
tere
d ite
ms
133,
686
-
- 4,
762
13
8,44
8
(110
,390
) 28
,058
O
ther
ser
vice
s
Adm
inis
tere
d as
sets
and
liabi
litie
s 16
5,00
0
- -
- 16
5,00
0
(165
,000
) -
Tota
l adm
inis
tere
d
298,
686
-
-
4,76
2
303
,448
(2
75,3
90)
28,
058
1.
Incl
udes
IPFA
app
ropr
iatio
ns o
f $5.
754
milli
on; a
nd u
nspe
nt fu
nds
of $
2.75
4 m
illion
in re
latio
n to
two
prog
ram
s th
at te
rmin
ated
dur
ing
2020
-21
that
are
re
quire
d to
be
retu
rned
to th
e C
onso
lidat
ed R
even
ue F
und
in a
ccor
danc
e w
ith G
over
nmen
t dec
isio
ns a
nd a
re th
eref
ore,
sub
ject
to a
form
al re
duct
ion.
The
se
fund
s ar
e co
nsid
ered
lega
lly a
vaila
ble
appr
opria
tions
as
at 3
0 Ju
ne 2
021.
2.
The
var
ianc
e in
Ord
inar
y an
nual
ser
vice
s is
larg
ely
driv
en b
y th
e tim
ing
of c
ash
paym
ents
. 3.
Dep
artm
enta
l and
Adm
inis
tere
d C
apita
l Bud
gets
are
app
ropr
iate
d th
roug
h Ap
prop
riatio
ns A
cts
(No.
1 an
d N
o.3)
. The
y fo
rm p
art o
f the
ord
inar
y an
nual
ser
vice
s an
d ar
e no
t sep
arat
ely
iden
tifie
d in
the
Appr
opria
tion
Acts
.
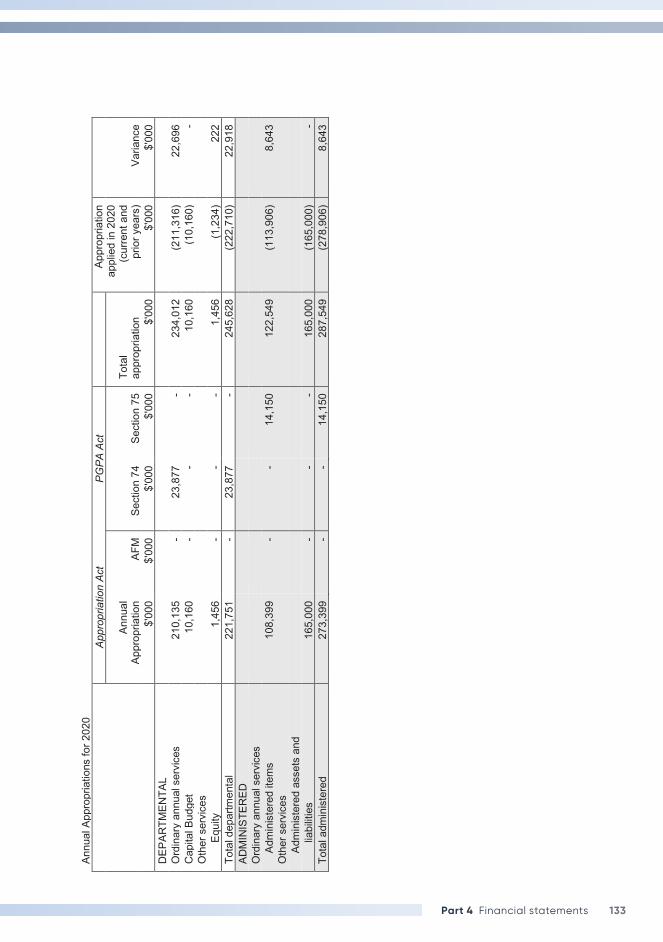
133Part 4 Financial statements
Annu
al A
ppro
pria
tions
for 2
020
App
ropr
iatio
n Ac
t P
GPA
Act
Appr
opria
tion
appl
ied
in 2
020
(cur
rent
and
pr
ior y
ears
)
An
nual
Ap
prop
riatio
n AF
M
Sect
ion
74
Sect
ion
75
Tota
l ap
prop
riatio
n Va
rianc
e
$'00
0 $'
000
$'00
0 $'
000
$'00
0 $'
000
$'00
0 D
EPAR
TMEN
TAL
O
rdin
ary
annu
al s
ervi
ces
210,
135
-
23,8
77
- 23
4,01
2
(211
,316
) 22
,696
C
apita
l Bud
get
10,1
60
- -
- 10
,160
(1
0,16
0)
- O
ther
ser
vice
s
Equi
ty
1,45
6
- -
- 1,
456
(1
,234
) 22
2
Tota
l dep
artm
enta
l 22
1,75
1
- 23
,877
-
245,
628
(2
22,7
10)
22,9
18
ADM
INIS
TER
ED
O
rdin
ary
annu
al s
ervi
ces
Ad
min
iste
red
item
s 10
8,39
9
- -
14,1
50
122,
549
(1
13,9
06)
8,64
3
Oth
er s
ervi
ces
Ad
min
iste
red
asse
ts a
nd
lia
bilit
ies
165,
000
-
- -
165,
000
(1
65,0
00)
- To
tal a
dmin
iste
red
273,
399
- -
14,1
50
287,
549
(278
,906
) 8,
643
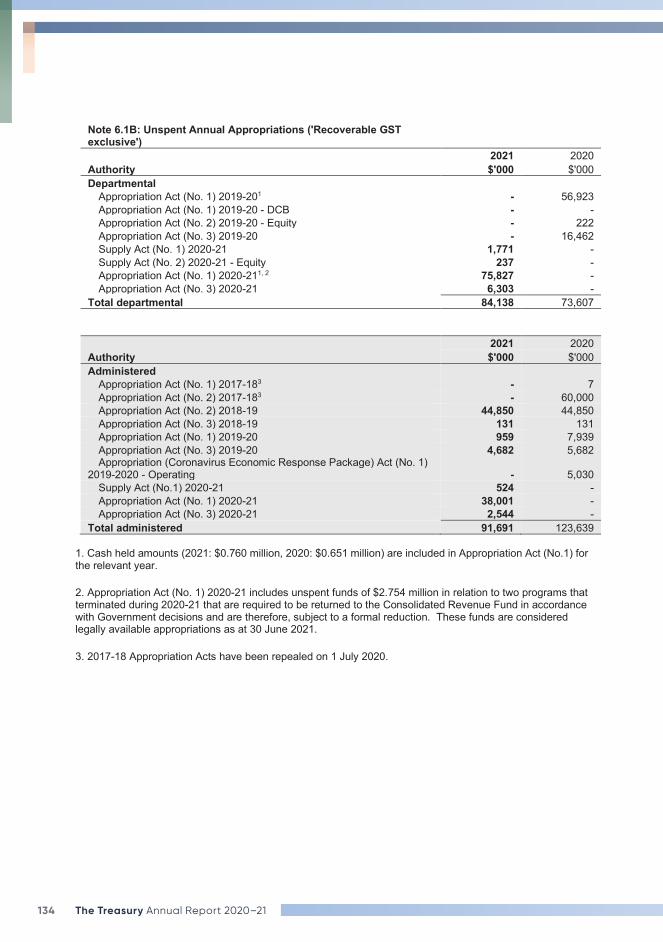
134 The Treasury Annual Report 2020–21
Note 6.1B: Unspent Annual Appropriations ('Recoverable GST exclusive')
Authority 2021 2020 $'000 $'000
Departmental Appropriation Act (No. 1) 2019-201 - 56,923 Appropriation Act (No. 1) 2019-20 - DCB - - Appropriation Act (No. 2) 2019-20 - Equity - 222 Appropriation Act (No. 3) 2019-20 - 16,462 Supply Act (No. 1) 2020-21 1,771 - Supply Act (No. 2) 2020-21 - Equity 237 - Appropriation Act (No. 1) 2020-211, 2 75,827 - Appropriation Act (No. 3) 2020-21 6,303 -
Total departmental 84,138 73,607
Authority 2021 2020 $'000 $'000
Administered Appropriation Act (No. 1) 2017-183 - 7 Appropriation Act (No. 2) 2017-183 - 60,000 Appropriation Act (No. 2) 2018-19 44,850 44,850 Appropriation Act (No. 3) 2018-19 131 131 Appropriation Act (No. 1) 2019-20 959 7,939 Appropriation Act (No. 3) 2019-20 4,682 5,682 Appropriation (Coronavirus Economic Response Package) Act (No. 1)
2019-2020 - Operating - 5,030 Supply Act (No.1) 2020-21 524 - Appropriation Act (No. 1) 2020-21 38,001 - Appropriation Act (No. 3) 2020-21 2,544 -
Total administered 91,691 123,639 1. Cash held amounts (2021: $0.760 million, 2020: $0.651 million) are included in Appropriation Act (No.1) for the relevant year. 2. Appropriation Act (No. 1) 2020-21 includes unspent funds of $2.754 million in relation to two programs that terminated during 2020-21 that are required to be returned to the Consolidated Revenue Fund in accordance with Government decisions and are therefore, subject to a formal reduction. These funds are considered legally available appropriations as at 30 June 2021. 3. 2017-18 Appropriation Acts have been repealed on 1 July 2020.
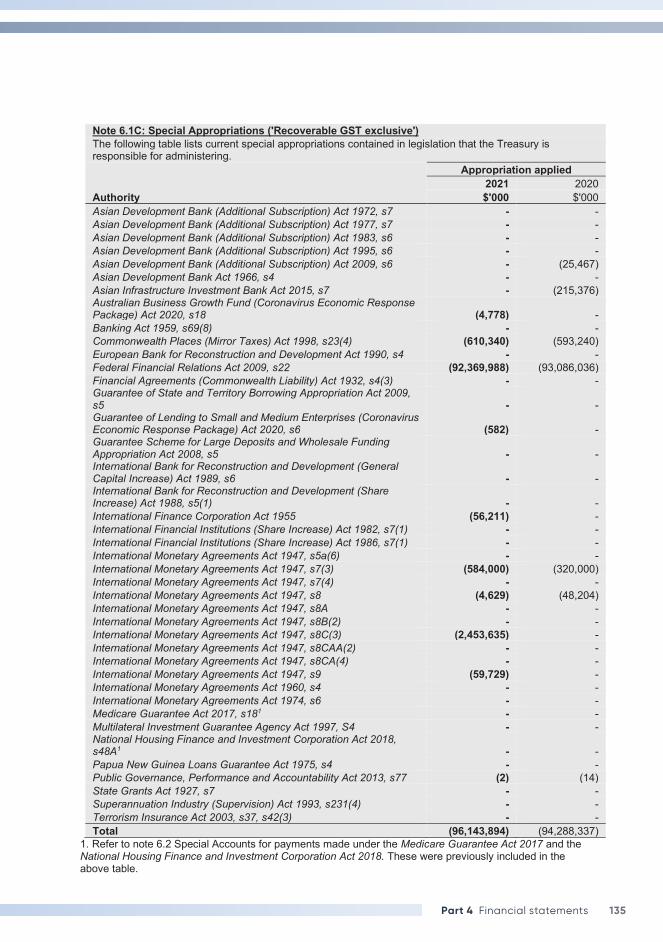
135Part 4 Financial statements
Note 6.1C: Special Appropriations ('Recoverable GST exclusive') The following table lists current special appropriations contained in legislation that the Treasury is responsible for administering.
Authority
Appropriation applied 2021 2020 $'000 $'000
Asian Development Bank (Additional Subscription) Act 1972, s7 - - Asian Development Bank (Additional Subscription) Act 1977, s7 - - Asian Development Bank (Additional Subscription) Act 1983, s6 - - Asian Development Bank (Additional Subscription) Act 1995, s6 - - Asian Development Bank (Additional Subscription) Act 2009, s6 - (25,467) Asian Development Bank Act 1966, s4 - - Asian Infrastructure Investment Bank Act 2015, s7 - (215,376) Australian Business Growth Fund (Coronavirus Economic Response Package) Act 2020, s18 (4,778) - Banking Act 1959, s69(8) - - Commonwealth Places (Mirror Taxes) Act 1998, s23(4) (610,340) (593,240) European Bank for Reconstruction and Development Act 1990, s4 - - Federal Financial Relations Act 2009, s22 (92,369,988) (93,086,036) Financial Agreements (Commonwealth Liability) Act 1932, s4(3) - - Guarantee of State and Territory Borrowing Appropriation Act 2009, s5 - - Guarantee of Lending to Small and Medium Enterprises (Coronavirus Economic Response Package) Act 2020, s6 (582) - Guarantee Scheme for Large Deposits and Wholesale Funding Appropriation Act 2008, s5 - - International Bank for Reconstruction and Development (General Capital Increase) Act 1989, s6 - - International Bank for Reconstruction and Development (Share Increase) Act 1988, s5(1) - - International Finance Corporation Act 1955 (56,211) - International Financial Institutions (Share Increase) Act 1982, s7(1) - - International Financial Institutions (Share Increase) Act 1986, s7(1) - - International Monetary Agreements Act 1947, s5a(6) - - International Monetary Agreements Act 1947, s7(3) (584,000) (320,000) International Monetary Agreements Act 1947, s7(4) - - International Monetary Agreements Act 1947, s8 (4,629) (48,204) International Monetary Agreements Act 1947, s8A - - International Monetary Agreements Act 1947, s8B(2) - - International Monetary Agreements Act 1947, s8C(3) (2,453,635) - International Monetary Agreements Act 1947, s8CAA(2) - - International Monetary Agreements Act 1947, s8CA(4) - - International Monetary Agreements Act 1947, s9 (59,729) - International Monetary Agreements Act 1960, s4 - - International Monetary Agreements Act 1974, s6 - - Medicare Guarantee Act 2017, s181 - - Multilateral Investment Guarantee Agency Act 1997, S4 - - National Housing Finance and Investment Corporation Act 2018, s48A1 - - Papua New Guinea Loans Guarantee Act 1975, s4 - - Public Governance, Performance and Accountability Act 2013, s77 (2) (14) State Grants Act 1927, s7 - - Superannuation Industry (Supervision) Act 1993, s231(4) - - Terrorism Insurance Act 2003, s37, s42(3) - - Total (96,143,894) (94,288,337)
1. Refer to note 6.2 Special Accounts for payments made under the Medicare Guarantee Act 2017 and the National Housing Finance and Investment Corporation Act 2018. These were previously included in the above table.
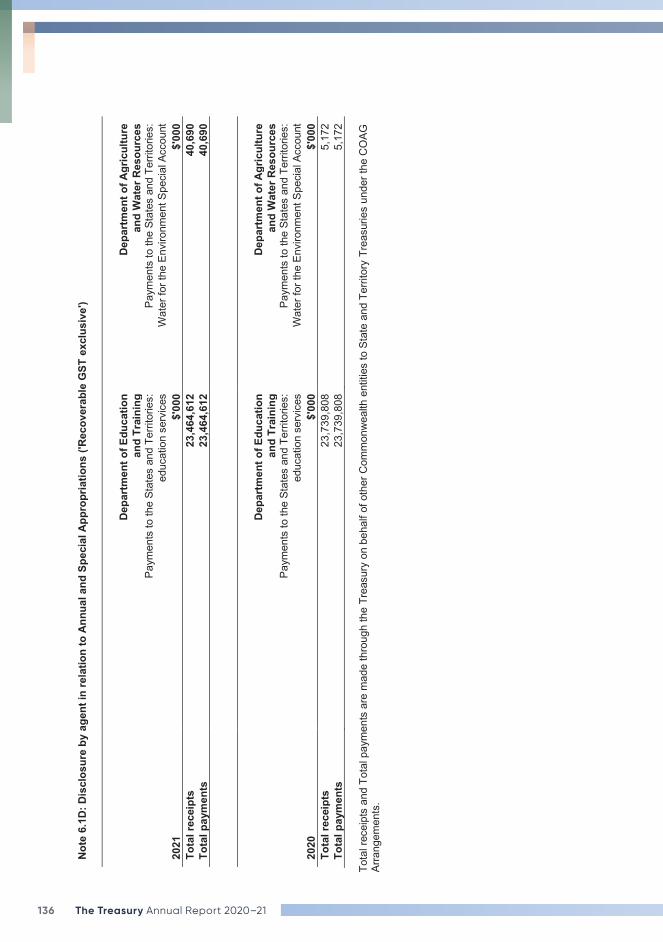
136 The Treasury Annual Report 2020–21
Note
6.1
D: D
iscl
osur
e by
age
nt in
rela
tion
to A
nnua
l and
Spe
cial
App
ropr
iatio
ns ('
Reco
vera
ble
GST
exc
lusi
ve')
De
partm
ent o
f Edu
catio
n D
epar
tmen
t of A
gric
ultu
re
an
d Tr
aini
ng
and
Wat
er R
esou
rces
Paym
ents
to th
e St
ates
and
Ter
ritor
ies:
Pa
ymen
ts to
the
Stat
es a
nd T
errit
orie
s:
ed
ucat
ion
serv
ices
W
ater
for t
he E
nviro
nmen
t Spe
cial
Acc
ount
20
21
$'00
0 $'
000
Tota
l rec
eipt
s 23
,464
,612
40
,690
To
tal p
aym
ents
23
,464
,612
40
,690
De
partm
ent o
f Edu
catio
n D
epar
tmen
t of A
gric
ultu
re
an
d Tr
aini
ng
and
Wat
er R
esou
rces
Paym
ents
to th
e St
ates
and
Ter
ritor
ies:
Pa
ymen
ts to
the
Stat
es a
nd T
errit
orie
s:
ed
ucat
ion
serv
ices
W
ater
for t
he E
nviro
nmen
t Spe
cial
Acc
ount
20
20
$'00
0 $'
000
Tota
l rec
eipt
s 23
,739
,808
5,
172
To
tal p
aym
ents
23
,739
,808
5,
172
To
tal r
ecei
pts
and
Tota
l pay
men
ts a
re m
ade
thro
ugh
the
Trea
sury
on
beha
lf of
oth
er C
omm
onw
ealth
ent
ities
to S
tate
and
Ter
ritor
y Tr
easu
ries
unde
r the
CO
AG
Arra
ngem
ents
.
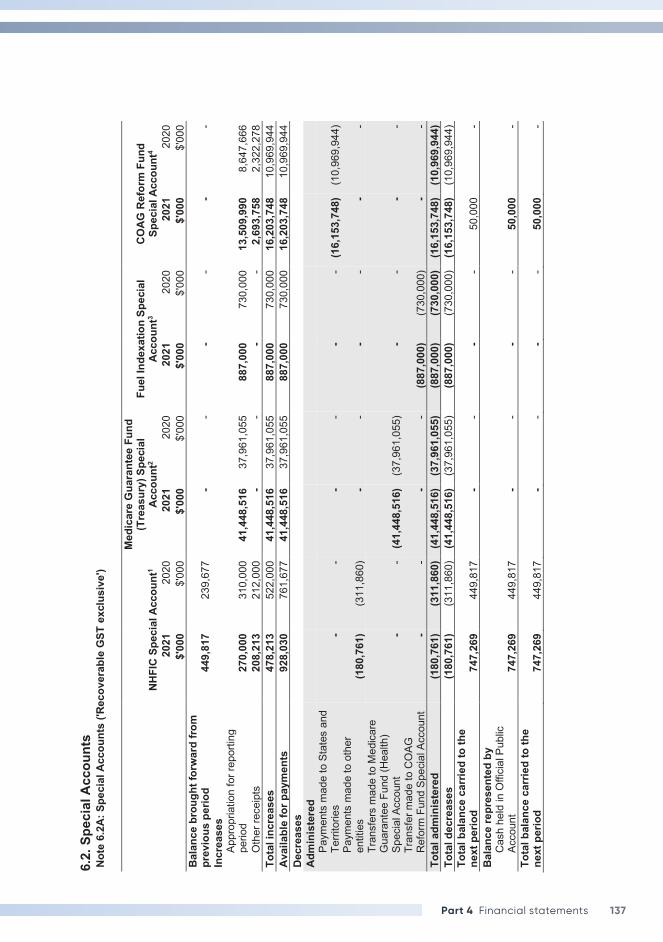
137Part 4 Financial statements
6.2.
Spe
cial
Acc
ount
s No
te 6
.2A:
Spe
cial
Acc
ount
s ('R
ecov
erab
le G
ST e
xclu
sive
')
NH
FIC
Spec
ial A
ccou
nt1
Med
icar
e G
uara
ntee
Fun
d (T
reas
ury)
Spe
cial
Ac
coun
t2 Fu
el In
dexa
tion
Spec
ial
Acco
unt3
CO
AG R
efor
m F
und
Spec
ial A
ccou
nt4
20
21
2020
20
21
2020
20
21
2020
20
21
2020
$'
000
$'00
0 $'
000
$'00
0 $'
000
$'00
0 $'
000
$'00
0 Ba
lanc
e br
ough
t for
war
d fro
m
prev
ious
per
iod
449,
817
23
9,67
7
- -
- -
- -
Incr
ease
s
Ap
prop
riatio
n fo
r rep
ortin
g pe
riod
270,
000
31
0,00
0
41,4
48,5
16
37,9
61,0
55
887,
000
73
0,00
0
13,5
09,9
90
8,64
7,66
6
Oth
er re
ceip
ts
208,
213
21
2,00
0
- -
- -
2,69
3,75
8
2,32
2,27
8
Tota
l inc
reas
es
478,
213
52
2,00
0
41,4
48,5
16
37,9
61,0
55
887,
000
73
0,00
0
16,2
03,7
48
10,9
69,9
44
Avai
labl
e fo
r pay
men
ts
928,
030
76
1,67
7
41,4
48,5
16
37,9
61,0
55
887,
000
73
0,00
0
16,2
03,7
48
10,9
69,9
44
Decr
ease
s
Ad
min
iste
red
Paym
ents
mad
e to
Sta
tes
and
Terri
torie
s -
- -
- -
- (1
6,15
3,74
8)
(10,
969,
944)
Pa
ymen
ts m
ade
to o
ther
en
titie
s (1
80,7
61)
(311
,860
) -
- -
- -
- Tr
ansf
ers
mad
e to
Med
icar
e G
uara
ntee
Fun
d (H
ealth
) Sp
ecia
l Acc
ount
-
- (4
1,44
8,51
6)
(37,
961,
055)
-
- -
- Tr
ansf
er m
ade
to C
OAG
R
efor
m F
und
Spec
ial A
ccou
nt
- -
- -
(887
,000
) (7
30,0
00)
- -
Tota
l adm
inis
tere
d (1
80,7
61)
(311
,860
) (4
1,44
8,51
6)
(37,
961,
055)
(8
87,0
00)
(730
,000
) (1
6,15
3,74
8)
(10,
969,
944)
To
tal d
ecre
ases
(1
80,7
61)
(311
,860
) (4
1,44
8,51
6)
(37,
961,
055)
(8
87,0
00)
(730
,000
) (1
6,15
3,74
8)
(10,
969,
944)
To
tal b
alan
ce c
arrie
d to
the
next
per
iod
747,
269
44
9,81
7
- -
- -
50,0
00
- Ba
lanc
e re
pres
ente
d by
C
ash
held
in O
ffici
al P
ublic
Ac
coun
t 74
7,26
9
449,
817
-
- -
- 50
,000
-
Tota
l bal
ance
car
ried
to th
e ne
xt p
erio
d 74
7,26
9
449,
817
-
- -
- 50
,000
-
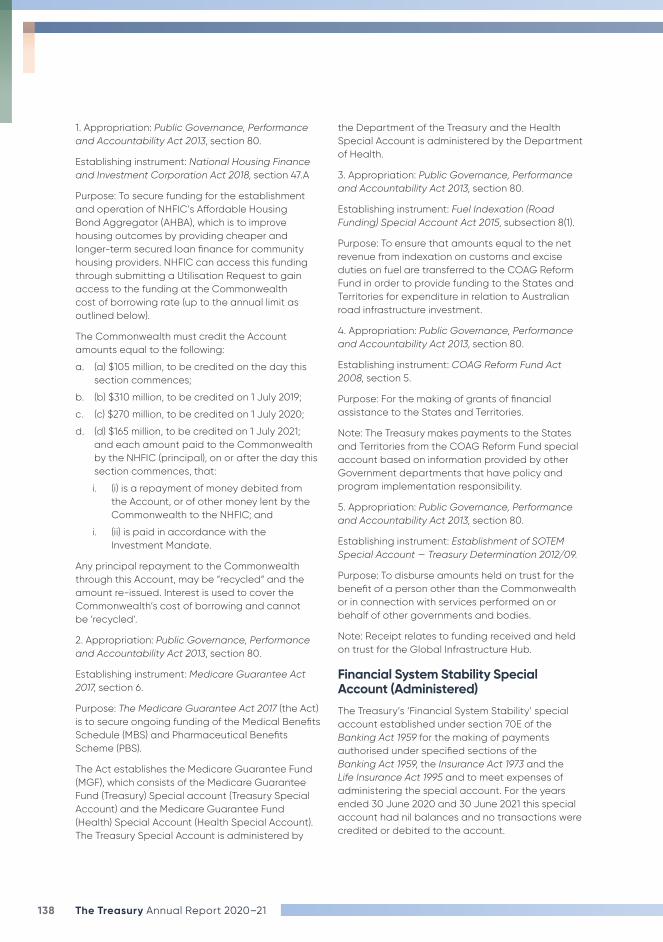
138 The Treasury Annual Report 2020–21
1. Appropriation: Public Governance, Performance and Accountability Act 2013, section 80.
Establishing instrument: National Housing Finance and Investment Corporation Act 2018, section 47.A
Purpose: To secure funding for the establishment and operation of NHFIC’s Affordable Housing Bond Aggregator (AHBA), which is to improve housing outcomes by providing cheaper and longer-term secured loan finance for community housing providers. NHFIC can access this funding through submitting a Utilisation Request to gain access to the funding at the Commonwealth cost of borrowing rate (up to the annual limit as outlined below).
The Commonwealth must credit the Account amounts equal to the following:
a. (a) $105 million, to be credited on the day this section commences;
b. (b) $310 million, to be credited on 1 July 2019;
c. (c) $270 million, to be credited on 1 July 2020;
d. (d) $165 million, to be credited on 1 July 2021; and each amount paid to the Commonwealth by the NHFIC (principal), on or after the day this section commences, that:
i. (i) is a repayment of money debited from the Account, or of other money lent by the Commonwealth to the NHFIC; and
i. (ii) is paid in accordance with the Investment Mandate.
Any principal repayment to the Commonwealth through this Account, may be “recycled” and the amount re-issued. Interest is used to cover the Commonwealth’s cost of borrowing and cannot be ‘recycled’.
2. Appropriation: Public Governance, Performance and Accountability Act 2013, section 80.
Establishing instrument: Medicare Guarantee Act 2017, section 6.
Purpose: The Medicare Guarantee Act 2017 (the Act) is to secure ongoing funding of the Medical Benefits Schedule (MBS) and Pharmaceutical Benefits Scheme (PBS).
The Act establishes the Medicare Guarantee Fund (MGF), which consists of the Medicare Guarantee Fund (Treasury) Special account (Treasury Special Account) and the Medicare Guarantee Fund (Health) Special Account (Health Special Account). The Treasury Special Account is administered by
the Department of the Treasury and the Health Special Account is administered by the Department of Health.
3. Appropriation: Public Governance, Performance and Accountability Act 2013, section 80.
Establishing instrument: Fuel Indexation (Road Funding) Special Account Act 2015, subsection 8(1).
Purpose: To ensure that amounts equal to the net revenue from indexation on customs and excise duties on fuel are transferred to the COAG Reform Fund in order to provide funding to the States and Territories for expenditure in relation to Australian road infrastructure investment.
4. Appropriation: Public Governance, Performance and Accountability Act 2013, section 80.
Establishing instrument: COAG Reform Fund Act 2008, section 5.
Purpose: For the making of grants of financial assistance to the States and Territories.
Note: The Treasury makes payments to the States and Territories from the COAG Reform Fund special account based on information provided by other Government departments that have policy and program implementation responsibility.
5. Appropriation: Public Governance, Performance and Accountability Act 2013, section 80.
Establishing instrument: Establishment of SOTEM Special Account — Treasury Determination 2012/09.
Purpose: To disburse amounts held on trust for the benefit of a person other than the Commonwealth or in connection with services performed on or behalf of other governments and bodies.
Note: Receipt relates to funding received and held on trust for the Global Infrastructure Hub.
Financial System Stability Special Account (Administered)
The Treasury’s ‘Financial System Stability’ special account established under section 70E of the Banking Act 1959 for the making of payments authorised under specified sections of the Banking Act 1959, the Insurance Act 1973 and the Life Insurance Act 1995 and to meet expenses of administering the special account. For the years ended 30 June 2020 and 30 June 2021 this special account had nil balances and no transactions were credited or debited to the account.
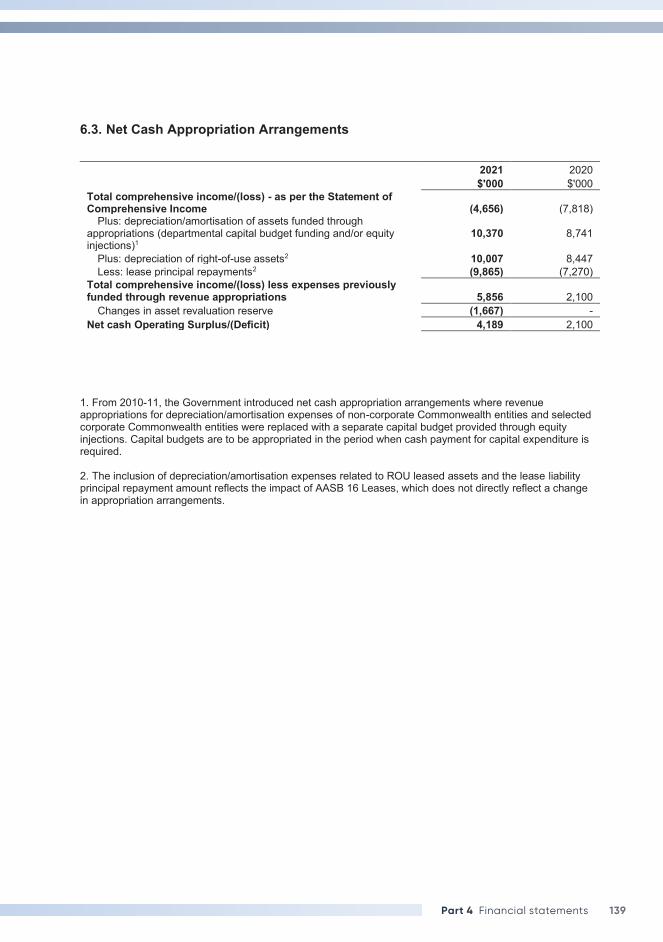
139Part 4 Financial statements
6.3. Net Cash Appropriation Arrangements
2021 2020 $'000 $'000 Total comprehensive income/(loss) - as per the Statement of Comprehensive Income (4,656) (7,818)
Plus: depreciation/amortisation of assets funded through appropriations (departmental capital budget funding and/or equity injections)1
10,370 8,741
Plus: depreciation of right-of-use assets2 10,007 8,447 Less: lease principal repayments2 (9,865) (7,270)
Total comprehensive income/(loss) less expenses previously funded through revenue appropriations 5,856 2,100
Changes in asset revaluation reserve (1,667) - Net cash Operating Surplus/(Deficit) 4,189 2,100
1. From 2010-11, the Government introduced net cash appropriation arrangements where revenue appropriations for depreciation/amortisation expenses of non-corporate Commonwealth entities and selected corporate Commonwealth entities were replaced with a separate capital budget provided through equity injections. Capital budgets are to be appropriated in the period when cash payment for capital expenditure is required. 2. The inclusion of depreciation/amortisation expenses related to ROU leased assets and the lease liability principal repayment amount reflects the impact of AASB 16 Leases, which does not directly reflect a change in appropriation arrangements.
140 The Treasury Annual Report 2020–21
7. Managing uncertainties This section analyses how the Treasury manages financial risks within its operating environment. 7.1. Departmental Contingent Assets and Liabilities Quantifiable Contingencies Contingent liabilities are nil in 2021 (2020: nil). There were no quantifiable contingent assets in 2021 (2020: nil). Contingent liabilities and contingent assets Contingent liabilities and contingent assets are not recognised in the statement of financial position but are reported in the notes. They may arise from uncertainty as to the existence of a liability or asset, or represent an asset or liability in respect of which the amount cannot be reliably measured. Contingent assets are disclosed when settlement is probable but not virtually certain and contingent liabilities are disclosed when the probability of settlement is greater than remote.
7.2. Administered Contingent Assets and Liabilities Quantifiable administered contingencies Quantifiable administered contingencies that are not remote are disclosed in the schedule of administered items as quantifiable administered contingencies. Commitments under expanded IMF New Arrangements to Borrow (NAB) Australia has made a line of credit available to the International Monetary Fund (IMF) under its New Arrangements to Borrow (NAB) since 1998. This is a contingent loan to help ensure that the IMF has the resources available to maintain stability and support recovery in the global economy. The value of Australia’s NAB credit arrangement stands at approximately 4.44 billion Special Drawing Rights (SDR, the IMF’s unit of account) (approximately A$8.43 billion at 30 June 2021) (2020: SDR2.22 billion). In January 2021, the NAB was renewed for an additional five year period until 31 December 2025. The Fund does not publish annual estimates of the amount it expects to call under the NAB facility. However, to be drawn upon, the NAB needs to be activated by the IMF Executive Board. The last NAB activation period was terminated in February 2016 and the IMF is currently relying on its quota resources to fund new lending (although the NAB can be called upon to fund IMF programs that were approved under previous activations). The IMF did not call on Australia’s NAB facility in 2020-21 and, as at the completion of these statements, has not done so in the current year. IMF Bilateral Borrowing Arrangement (BBA) In addition to the NAB credit line as part of a broad international effort to increase the resources available to the IMF, Australia has made available an SDR1.986 billion (approximately A$3.77 billion at 30 June 2021) contingent bilateral loan to the IMF (2020: SDR4.61 billion). The contingent loan is on terms consistent with separate bilateral loan and note purchase agreements between the IMF and all contributing countries. It will be drawn upon by the IMF only if needed to supplement the IMF’s quota and NAB resources and any loans would be repaid in full with interest. Australia’s three-year bilateral borrowing arrangement with the IMF was created in 2021 and will conclude on 31 December 2023, with the option to extend by one year. Poverty Reduction and Growth Trust (PRGT) To help the IMF provide concessional finance and support low-income countries to achieve, maintain, or restore a stable and sustainable macroeconomic position, Australia has made available a SDR500 million (approximately A$949 million at 30 June 2021) line of credit to the Poverty Reduction and Growth Trust (PRGT), which the IMF is the Trustee of. This contingent loan is on terms consistent with other PRGT loan agreements between the IMF and all contributing countries. It will be drawn by the IMF as they provide new loans through the PRGT and any loans will be repaid in full with interest. Australia’s 10-year loan agreement with the PRGT was created in 2020 and will conclude on 31 December 2029. International financial institutions — uncalled capital subscriptions
141Part 4 Financial statements
The Australian Government has held an uncalled capital subscription to the International Bank for Reconstruction and Development (IBRD) since 1947. Australia’s uncalled capital subscription to the IBRD totals US$3.9 billion (estimated value A$5.2 billion as at 30 June 2021). The Australian Government has also held an uncalled capital subscription to the European Bank for Reconstruction and Development (EBRD) since 1991. Australia’s uncalled capital subscription to the EBRD totals EUR237.5 million (estimated value A$375.8 million as at 30 June 2021). The Australian Government has further held an uncalled capital subscription to the Asian Development Bank (ADB) since 1966. Australia’s uncalled capital subscription to the ADB totals US$8.3 billion (estimated value A$11.1 billion as at 30 June 2021). The Australian Government has further held an uncalled capital subscription to the Multilateral Investment Guarantee Agency of US$26.5 million (estimated value A$35.2 million as at 30 June 2021). The Asian Infrastructure Investment Bank (AIIB) was established on 25 December 2015. The Australian Government has subscribed to shares in the AIIB, which includes an uncalled capital subscrtiption. Australia’s uncalled capital subscription to the AIIB totals US$3.0 billion (estimated value A$3.9 billion as at 30 June 2021). None of these international financial institutions have ever drawn on Australia’s uncalled capital subscriptions. Australian Business Growth Fund The Australian Government holds an uncalled capital subscription to the Australian Business Growth Fund. The uncalled capital subscription to the ABGF totals $95.22 million as at 30 June 2021.The Commonwealth committed $100 million in total to the Australian Business Growth Fund but drawdown is capped at 20% per year of its total commitment. Loan to New South Wales for James Hardie Asbestos Injuries Compensation Fund The Commonwealth has agreed to lend up to $160 million to the State Government of New South Wales (NSW) to support the loan facility to top up the James Hardie Asbestos Injuries Compensation Fund. Draw down on the loan is subject to the James Hardie Asbestos Injuries Compensation Fund requiring funds to meet its liabilities and is contingent on NSW meeting a number of conditions under the loan agreement with the Australian Government. The timing and amounts that may be drawn down by NSW cannot be determined accurately. No new loans were provided to the State Government of NSW in respect of the loan facility in 2020-21 (2019-20: nil). Unquantifiable administered contingencies Contingent Liabilities Housing Loans Insurance Corporation (HLIC)
The Australian Government sold HLIC on 12 December 1997 and has assumed all residual contingencies. The contingent liability relates to the HLIC’s contracts of mortgage insurance to the time of sale. Any potential economic outflow cannot be determined accurately given the complexity of any estimation calculation of the economic outflow would be reliant upon numerous unquantifiable variables. Only at the time of the event, can the amount of economic outflow be determined accurately.
Terrorism insurance — Australian Reinsurance Pool Corporation
The Terrorism Insurance Act 2003 established a scheme for terrorism insurance covering damage to commercial property, including associated business interruption and public liability. The Australian Reinsurance Pool Corporation (ARPC) uses reinsurance premiums paid by insurers to meet its administrative expenses, to maintain a pool of funds and to purchase reinsurance to help meet future claims. The Commonwealth guarantees to pay any liabilities of the ARPC, but the Treasurer must declare a reduced payout rate to insured entities if the Government’s liability would otherwise exceed $10 billion.
Guarantee by Commonwealth — NHFIC
NHFIC was established under the National Housing Finance and Investment Corporation Act 2018 to perform the functions under Section 8 of the Act. NHFIC’s operations are funded by the Commonwealth (refer to Notes 4.1.C, 5.1A and 5.1C) and by raising finance through the issuance of social housing bonds into the debt capital market. The Commonwealth Government has provided a guarantee of NHFIC’s liabilities capped
7. Managing uncertainties This section analyses how the Treasury manages financial risks within its operating environment. 7.1. Departmental Contingent Assets and Liabilities Quantifiable Contingencies Contingent liabilities are nil in 2021 (2020: nil). There were no quantifiable contingent assets in 2021 (2020: nil). Contingent liabilities and contingent assets Contingent liabilities and contingent assets are not recognised in the statement of financial position but are reported in the notes. They may arise from uncertainty as to the existence of a liability or asset, or represent an asset or liability in respect of which the amount cannot be reliably measured. Contingent assets are disclosed when settlement is probable but not virtually certain and contingent liabilities are disclosed when the probability of settlement is greater than remote.
7.2. Administered Contingent Assets and Liabilities Quantifiable administered contingencies Quantifiable administered contingencies that are not remote are disclosed in the schedule of administered items as quantifiable administered contingencies. Commitments under expanded IMF New Arrangements to Borrow (NAB) Australia has made a line of credit available to the International Monetary Fund (IMF) under its New Arrangements to Borrow (NAB) since 1998. This is a contingent loan to help ensure that the IMF has the resources available to maintain stability and support recovery in the global economy. The value of Australia’s NAB credit arrangement stands at approximately 4.44 billion Special Drawing Rights (SDR, the IMF’s unit of account) (approximately A$8.43 billion at 30 June 2021) (2020: SDR2.22 billion). In January 2021, the NAB was renewed for an additional five year period until 31 December 2025. The Fund does not publish annual estimates of the amount it expects to call under the NAB facility. However, to be drawn upon, the NAB needs to be activated by the IMF Executive Board. The last NAB activation period was terminated in February 2016 and the IMF is currently relying on its quota resources to fund new lending (although the NAB can be called upon to fund IMF programs that were approved under previous activations). The IMF did not call on Australia’s NAB facility in 2020-21 and, as at the completion of these statements, has not done so in the current year. IMF Bilateral Borrowing Arrangement (BBA) In addition to the NAB credit line as part of a broad international effort to increase the resources available to the IMF, Australia has made available an SDR1.986 billion (approximately A$3.77 billion at 30 June 2021) contingent bilateral loan to the IMF (2020: SDR4.61 billion). The contingent loan is on terms consistent with separate bilateral loan and note purchase agreements between the IMF and all contributing countries. It will be drawn upon by the IMF only if needed to supplement the IMF’s quota and NAB resources and any loans would be repaid in full with interest. Australia’s three-year bilateral borrowing arrangement with the IMF was created in 2021 and will conclude on 31 December 2023, with the option to extend by one year. Poverty Reduction and Growth Trust (PRGT) To help the IMF provide concessional finance and support low-income countries to achieve, maintain, or restore a stable and sustainable macroeconomic position, Australia has made available a SDR500 million (approximately A$949 million at 30 June 2021) line of credit to the Poverty Reduction and Growth Trust (PRGT), which the IMF is the Trustee of. This contingent loan is on terms consistent with other PRGT loan agreements between the IMF and all contributing countries. It will be drawn by the IMF as they provide new loans through the PRGT and any loans will be repaid in full with interest. Australia’s 10-year loan agreement with the PRGT was created in 2020 and will conclude on 31 December 2029. International financial institutions — uncalled capital subscriptions
142 The Treasury Annual Report 2020–21
at $3 billion to encourage the development of the market for social housing bonds. The Minister for Housing may, by legislative instrument, set a date that the guarantee is effective to, but not earlier than, 1 July 2023. Under the National Housing Finance and Investment Corporation Investment Mandate Direction 2018, the Minister for Housing and Minister for Finance may also make adjustments to the cap.
Loans to NHFIC’s Affordable Housing Bond Aggregator (AHBA)
The Commonwealth has agreed to make available amounts up to $1 billion to NHFIC’s AHBA via a loan, as outlined in Note 6.2 Special accounts. Under the AHBA Loan Agreement with the Treasury, NHFIC can access the funds by completing a Utilisation Request and providing this to Treasury. Interest is to be charged on each individual loan at the Commonwealth’s cost of borrowing.
The timing and amounts of potential drawdowns by NHFIC cannot be determined accurately. An additional complexity is the ‘recycling’ of funds repaid or prepaid by NHFIC, which can be re-borrowed by NHFIC.
The closing balance of AHBA loan drawdown is disclosed in Note 5.1B and any unused amount available at 30 June 2021 has been recorded in Note 5.1A Cash and cash equivalents and Note 6.2 Special accounts.
Disaster Recovery Funding Arrangements (DRFA) and Natural Disaster Relief and Recovery (NDRRA)
The Australian Government provides funding to States and Territories through the DRFA and NDRRA to assist with natural disaster relief and recovery costs. A State or Territory may claim NDRRA funding if a natural disaster occurs and State or Territory relief and recovery expenditure for that event meets the requirements set out in the respective DRFA and NDRRA Determinations. This combined liability represents the Treasury’s best estimate of payments expected to be made to States and Territories as at balance date. In the event where a natural disaster has occurred but the associated costs cannot be quantified reliably, the event is disclosed as a contingent liability. For a list of natural disasters that are included in the DRFA and NDRRA contingent liability, refer to Note 5.4 Administered – Provisions.
Indemnities for specialised external advisers during the COVID-19 pandemic
The Government has provided indemnities for certain external specialised advisers engaged to provide advice on emerging markets issues related to COVID-19. Indemnities were provided to mitigate personal risk and provide coverage for costs related to any legal proceedings that may arise in relation to the provision of that advice.
The indemnities apply for the period of engagement as advisers and for claims that are notified within 12 years after cessation of the advisers’ engagement. Until the indemnity agreements are varied or expire, they will remain as contingent and unquantifiable liabilities.
Small & Medium Enterprises (SME) Guarantee Scheme (SMEGS) and Small & Medium Enterprises (SME) Recovery Loan Scheme (SMERLs- Flood and Job Keeper) The Australian Government is supporting SMEs access to finance by providing a Guarantee to eligible lenders through the Coronavirus SME Guarantee Scheme, Show Starter Loan Scheme, and SME Recovery Loan Scheme. The Australian Government provides a Guarantee to eligible lenders to enhance lenders’ willingness and ability to provide credit, supporting many otherwise viable SMEs to access additional funding to continue operating through the outbreak of COVID-19. As the impact of COVID-19 evolves, so does the economic response. Refer to Note 5.2D Financial guarantees. Contingent Assets HIH Claims Support Scheme (HCSS) As an insured creditor in the liquidation of the HIH Group, the Australian Government is entitled to payments arising from the HCSS’s position in the Proof of Debt of respective HIH companies. The Treasury has received payments from the HIH Estate during 2019-20; however the timing and amount of future payments are unknown and will depend on the outcome of the estimation process and the completion of the liquidation of the HIH Group. Burden sharing in the International Monetary Fund remuneration Since 1986, the IMF has used its burden sharing mechanism to make up for the loss of income from unpaid charges on the loans of debtor members. Under burden sharing, temporary financing in equal amounts is obtained from debtor and creditor members by increasing the rate of charge and reducing the rate of
143Part 4 Financial statements
remuneration, respectively, to (1) cover shortfalls in the IMF’s regular income from unpaid charges (“deferred charges”) and (2) accumulate precautionary balances against possible credit default in a contingent account, the Special Contingent Account (SCA-1). SCA-1 accumulations were suspended effective November 1, 2006. On 29 June 2021, Australia contributed its full share of resources in the SCA-1 and deferred charges adjustments in the amount of SDR8.81 million (approximately A$16.72 million) to help finance the IMF’s debt relief to Sudan. Since Sudan was the last protracted arrears case in the IMF, the SCA-1 has been terminated. Due to the inherent uncertainty around shortfalls in IMF income, burden sharing contributions represent a contingent asset that cannot be reliably measured and as such is recorded as an unquantifiable contingent asset.
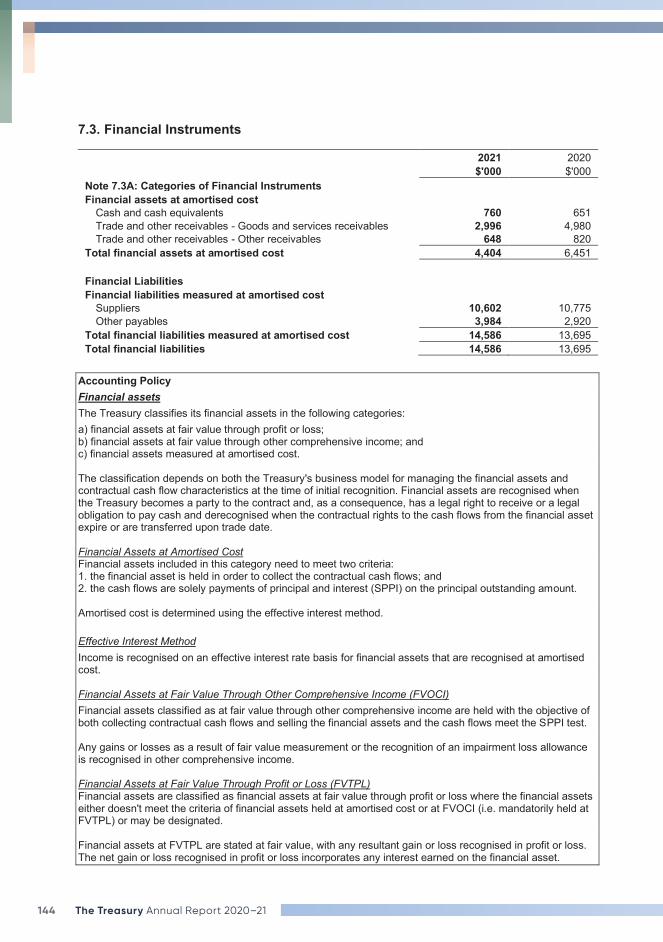
144 The Treasury Annual Report 2020–21
7.3. Financial Instruments
2021 2020 $'000 $'000 Note 7.3A: Categories of Financial Instruments Financial assets at amortised cost
Cash and cash equivalents 760 651 Trade and other receivables - Goods and services receivables 2,996 4,980 Trade and other receivables - Other receivables 648 820
Total financial assets at amortised cost 4,404 6,451 Financial Liabilities Financial liabilities measured at amortised cost
Suppliers 10,602 10,775 Other payables 3,984 2,920
Total financial liabilities measured at amortised cost 14,586 13,695 Total financial liabilities 14,586 13,695
Accounting Policy Financial assets The Treasury classifies its financial assets in the following categories: a) financial assets at fair value through profit or loss; b) financial assets at fair value through other comprehensive income; and c) financial assets measured at amortised cost. The classification depends on both the Treasury's business model for managing the financial assets and contractual cash flow characteristics at the time of initial recognition. Financial assets are recognised when the Treasury becomes a party to the contract and, as a consequence, has a legal right to receive or a legal obligation to pay cash and derecognised when the contractual rights to the cash flows from the financial asset expire or are transferred upon trade date. Financial Assets at Amortised Cost Financial assets included in this category need to meet two criteria: 1. the financial asset is held in order to collect the contractual cash flows; and 2. the cash flows are solely payments of principal and interest (SPPI) on the principal outstanding amount. Amortised cost is determined using the effective interest method. Effective Interest Method Income is recognised on an effective interest rate basis for financial assets that are recognised at amortised cost. Financial Assets at Fair Value Through Other Comprehensive Income (FVOCI) Financial assets classified as at fair value through other comprehensive income are held with the objective of both collecting contractual cash flows and selling the financial assets and the cash flows meet the SPPI test. Any gains or losses as a result of fair value measurement or the recognition of an impairment loss allowance is recognised in other comprehensive income. Financial Assets at Fair Value Through Profit or Loss (FVTPL) Financial assets are classified as financial assets at fair value through profit or loss where the financial assets either doesn't meet the criteria of financial assets held at amortised cost or at FVOCI (i.e. mandatorily held at FVTPL) or may be designated. Financial assets at FVTPL are stated at fair value, with any resultant gain or loss recognised in profit or loss. The net gain or loss recognised in profit or loss incorporates any interest earned on the financial asset.
145Part 4 Financial statements
Impairment of Financial Assets Financial assets are assessed for impairment at the end of each reporting period based on expected credit losses, using the general approach which measures the loss allowance based on an amount equal to lifetime expected credit losses where risk has significantly increased, or an amount equal to 12-month expected credit losses if risk has not increased. The simplified approach for trade, contract and lease receivables is used. This approach always measures the loss allowance as the amount equal to the lifetime expected credit losses. A write-off constitutes a derecognition event where the write-off directly reduces the gross carrying amount of the financial asset. Financial liabilities Financial liabilities are classified as either financial liabilities ‘at fair value through profit or loss’ or other financial liabilities. Financial liabilities are recognised and derecognised upon ‘trade date’. Financial Liabilities at Fair Value Through Profit or Loss Financial liabilities at fair value through profit or loss are initially measured at fair value. Subsequent fair value adjustments are recognised in profit or loss. The net gain or loss recognised in profit or loss incorporates any interest paid on the financial liability. Financial Liabilities at Amortised Cost Financial liabilities at amortised cost, including borrowings, are initially measured at fair value, net of transaction costs. These liabilities are subsequently measured at amortised cost using the effective interest method, with interest expense recognised on an effective interest basis. Supplier and other payables are recognised at amortised cost. Liabilities are recognised to the extent that the goods or services have been received (and irrespective of having been invoiced).
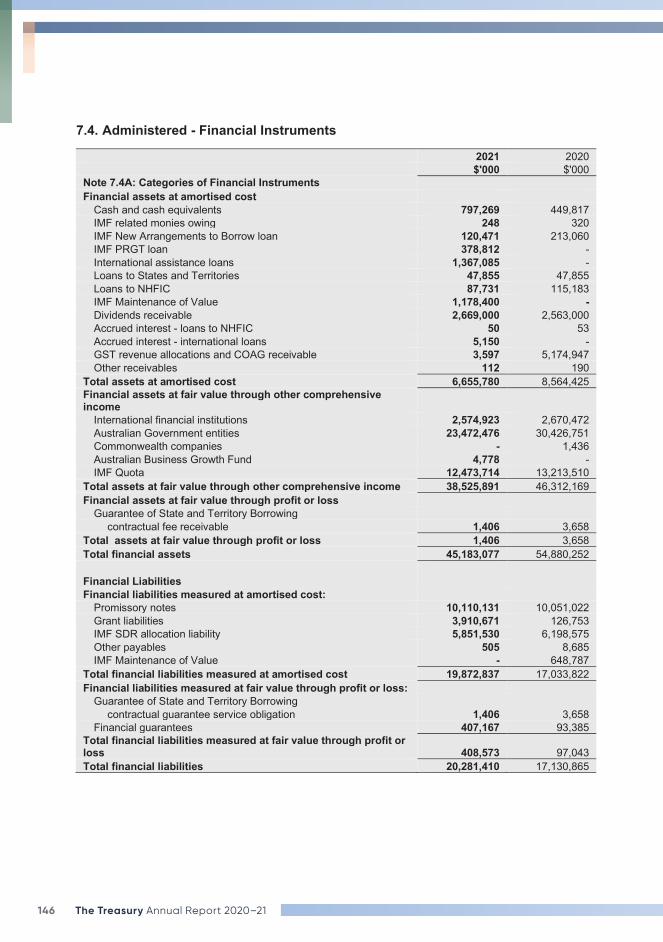
146 The Treasury Annual Report 2020–21
7.4. Administered - Financial Instruments
2021 2020 $'000 $'000 Note 7.4A: Categories of Financial Instruments Financial assets at amortised cost
Cash and cash equivalents 797,269 449,817 IMF related monies owing 248 320 IMF New Arrangements to Borrow loan 120,471 213,060 IMF PRGT loan 378,812 - International assistance loans 1,367,085 - Loans to States and Territories 47,855 47,855 Loans to NHFIC 87,731 115,183 IMF Maintenance of Value 1,178,400 - Dividends receivable 2,669,000 2,563,000 Accrued interest - loans to NHFIC 50 53 Accrued interest - international loans 5,150 - GST revenue allocations and COAG receivable 3,597 5,174,947 Other receivables 112 190
Total assets at amortised cost 6,655,780 8,564,425 Financial assets at fair value through other comprehensive income
International financial institutions 2,574,923 2,670,472 Australian Government entities 23,472,476 30,426,751 Commonwealth companies - 1,436 Australian Business Growth Fund 4,778 - IMF Quota 12,473,714 13,213,510
Total assets at fair value through other comprehensive income 38,525,891 46,312,169 Financial assets at fair value through profit or loss
Guarantee of State and Territory Borrowing contractual fee receivable 1,406 3,658
Total assets at fair value through profit or loss 1,406 3,658 Total financial assets 45,183,077 54,880,252 Financial Liabilities Financial liabilities measured at amortised cost:
Promissory notes 10,110,131 10,051,022 Grant liabilities 3,910,671 126,753 IMF SDR allocation liability 5,851,530 6,198,575 Other payables 505 8,685 IMF Maintenance of Value - 648,787
Total financial liabilities measured at amortised cost 19,872,837 17,033,822 Financial liabilities measured at fair value through profit or loss:
Guarantee of State and Territory Borrowing contractual guarantee service obligation 1,406 3,658
Financial guarantees 407,167 93,385 Total financial liabilities measured at fair value through profit or loss 408,573 97,043 Total financial liabilities 20,281,410 17,130,865
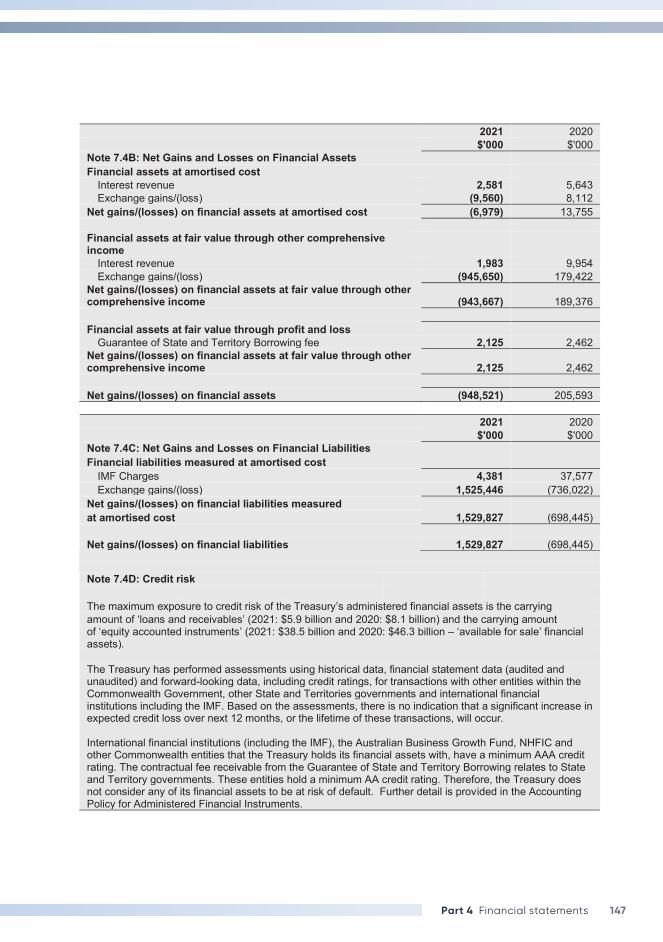
147Part 4 Financial statements
2021 2020 $'000 $'000 Note 7.4B: Net Gains and Losses on Financial Assets Financial assets at amortised cost
Interest revenue 2,581 5,643 Exchange gains/(loss) (9,560) 8,112
Net gains/(losses) on financial assets at amortised cost (6,979) 13,755 Financial assets at fair value through other comprehensive income
Interest revenue 1,983 9,954 Exchange gains/(loss) (945,650) 179,422
Net gains/(losses) on financial assets at fair value through other comprehensive income (943,667) 189,376 Financial assets at fair value through profit and loss
Guarantee of State and Territory Borrowing fee 2,125 2,462 Net gains/(losses) on financial assets at fair value through other comprehensive income 2,125 2,462 Net gains/(losses) on financial assets (948,521) 205,593
2021 2020 $'000 $'000 Note 7.4C: Net Gains and Losses on Financial Liabilities Financial liabilities measured at amortised cost
IMF Charges 4,381 37,577 Exchange gains/(loss) 1,525,446 (736,022)
Net gains/(losses) on financial liabilities measured 1,529,827 (698,445) at amortised cost
Net gains/(losses) on financial liabilities 1,529,827 (698,445)
Note 7.4D: Credit risk The maximum exposure to credit risk of the Treasury’s administered financial assets is the carrying amount of ‘loans and receivables’ (2021: $5.9 billion and 2020: $8.1 billion) and the carrying amount of ‘equity accounted instruments’ (2021: $38.5 billion and 2020: $46.3 billion – ‘available for sale’ financial assets). The Treasury has performed assessments using historical data, financial statement data (audited and unaudited) and forward-looking data, including credit ratings, for transactions with other entities within the Commonwealth Government, other State and Territories governments and international financial institutions including the IMF. Based on the assessments, there is no indication that a significant increase in expected credit loss over next 12 months, or the lifetime of these transactions, will occur. International financial institutions (including the IMF), the Australian Business Growth Fund, NHFIC and other Commonwealth entities that the Treasury holds its financial assets with, have a minimum AAA credit rating. The contractual fee receivable from the Guarantee of State and Territory Borrowing relates to State and Territory governments. These entities hold a minimum AA credit rating. Therefore, the Treasury does not consider any of its financial assets to be at risk of default. Further detail is provided in the Accounting Policy for Administered Financial Instruments.
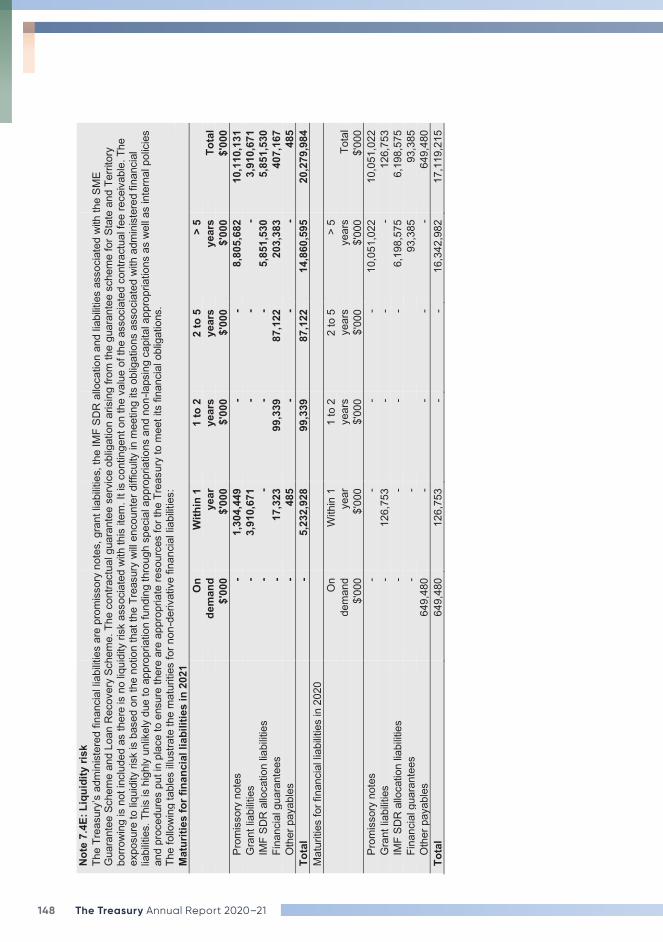
148 The Treasury Annual Report 2020–21
No
te 7
.4E:
Liq
uidi
ty ri
sk
The
Trea
sury
’s a
dmin
iste
red
finan
cial
liab
ilitie
s ar
e pr
omis
sory
not
es, g
rant
liab
ilitie
s, th
e IM
F SD
R a
lloca
tion
and
liabi
litie
s as
soci
ated
with
the
SME
Gua
rant
ee S
chem
e an
d Lo
an R
ecov
ery
Sche
me.
The
con
tract
ual g
uara
ntee
ser
vice
obl
igat
ion
aris
ing
from
the
guar
ante
e sc
hem
e fo
r Sta
te a
nd T
errit
ory
borro
win
g is
not
incl
uded
as
ther
e is
no
liqui
dity
risk
ass
ocia
ted
with
this
item
. It i
s co
ntin
gent
on
the
valu
e of
the
asso
ciat
ed c
ontra
ctua
l fee
rece
ivab
le. T
he
expo
sure
to li
quid
ity ri
sk is
bas
ed o
n th
e no
tion
that
the
Trea
sury
will
enco
unte
r diff
icul
ty in
mee
ting
its o
blig
atio
ns a
ssoc
iate
d w
ith a
dmin
iste
red
finan
cial
lia
bilit
ies.
Thi
s is
hig
hly
unlik
ely
due
to a
ppro
pria
tion
fund
ing
thro
ugh
spec
ial a
ppro
pria
tions
and
non
-laps
ing
capi
tal a
ppro
pria
tions
as
wel
l as
inte
rnal
pol
icie
s an
d pr
oced
ures
put
in p
lace
to e
nsur
e th
ere
are
appr
opria
te re
sour
ces
for t
he T
reas
ury
to m
eet i
ts fi
nanc
ial o
blig
atio
ns.
The
follo
win
g ta
bles
illu
stra
te th
e m
atur
ities
for n
on-d
eriv
ativ
e fin
anci
al li
abilit
ies:
M
atur
ities
for f
inan
cial
liab
ilitie
s in
202
1
On
With
in 1
1
to 2
2
to 5
>
5
de
man
d ye
ar
year
s ye
ars
year
s To
tal
$'
000
$'00
0 $'
000
$'00
0 $'
000
$'00
0 Pr
omis
sory
not
es
- 1,
304,
449
-
- 8,
805,
682
10
,110
,131
G
rant
liab
ilitie
s -
3,91
0,67
1
- -
- 3,
910,
671
IM
F SD
R a
lloca
tion
liabi
litie
s -
- -
- 5,
851,
530
5,
851,
530
Fi
nanc
ial g
uara
ntee
s -
17,3
23
99,3
39
87,1
22
203,
383
40
7,16
7
Oth
er p
ayab
les
- 48
5
- -
- 48
5
Tota
l -
5,23
2,92
8
99,3
39
87,1
22
14,8
60,5
95
20,2
79,9
84
Mat
uriti
es fo
r fin
anci
al li
abilit
ies
in 2
020
O
n W
ithin
1
1 to
2
2 to
5
> 5
dem
and
year
ye
ars
year
s ye
ars
Tota
l
$'00
0 $'
000
$'00
0 $'
000
$'00
0 $'
000
Prom
isso
ry n
otes
-
- -
- 10
,051
,022
10
,051
,022
G
rant
liab
ilitie
s -
126,
753
-
- -
126,
753
IM
F SD
R a
lloca
tion
liabi
litie
s -
- -
- 6,
198,
575
6,
198,
575
Fi
nanc
ial g
uara
ntee
s -
-
93
,385
93
,385
O
ther
pay
able
s 64
9,48
0
- -
- -
649,
480
To
tal
649,
480
12
6,75
3
- -
16,3
42,9
82
17,1
19,2
15
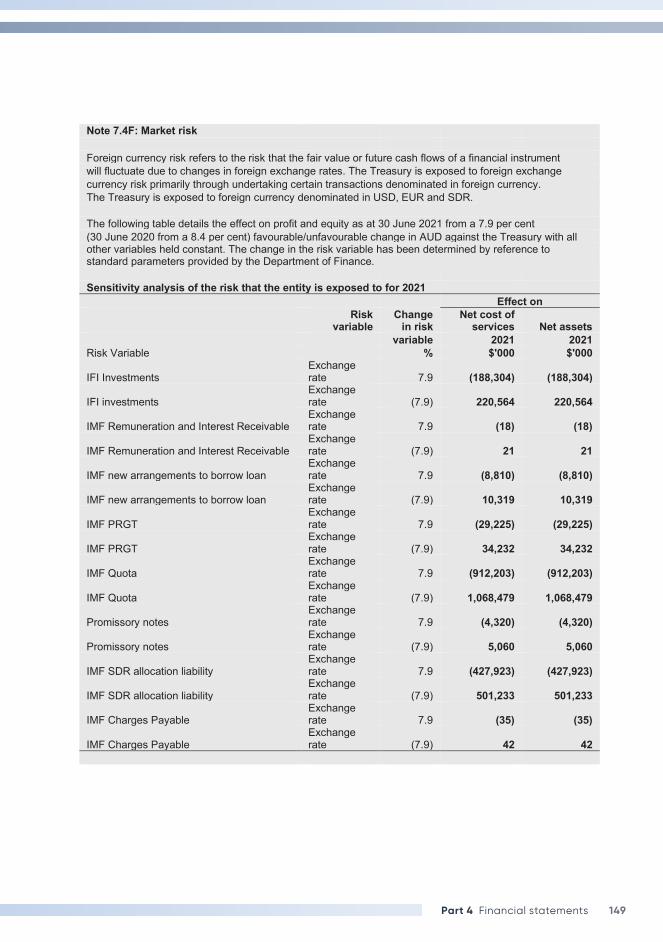
149Part 4 Financial statements
Note 7.4F: Market risk Foreign currency risk refers to the risk that the fair value or future cash flows of a financial instrument will fluctuate due to changes in foreign exchange rates. The Treasury is exposed to foreign exchange currency risk primarily through undertaking certain transactions denominated in foreign currency. The Treasury is exposed to foreign currency denominated in USD, EUR and SDR. The following table details the effect on profit and equity as at 30 June 2021 from a 7.9 per cent (30 June 2020 from a 8.4 per cent) favourable/unfavourable change in AUD against the Treasury with all other variables held constant. The change in the risk variable has been determined by reference to standard parameters provided by the Department of Finance. Sensitivity analysis of the risk that the entity is exposed to for 2021 Effect on
Risk
variable Change
in risk Net cost of
services Net assets variable 2021 2021 Risk Variable % $'000 $'000
IFI Investments Exchange rate 7.9 (188,304) (188,304)
IFI investments Exchange rate (7.9) 220,564 220,564
IMF Remuneration and Interest Receivable Exchange rate 7.9 (18) (18)
IMF Remuneration and Interest Receivable Exchange rate (7.9) 21 21
IMF new arrangements to borrow loan Exchange rate 7.9 (8,810) (8,810)
IMF new arrangements to borrow loan Exchange rate (7.9) 10,319 10,319
IMF PRGT Exchange rate 7.9 (29,225) (29,225)
IMF PRGT Exchange rate (7.9) 34,232 34,232
IMF Quota Exchange rate 7.9 (912,203) (912,203)
IMF Quota Exchange rate (7.9) 1,068,479 1,068,479
Promissory notes Exchange rate 7.9 (4,320) (4,320)
Promissory notes Exchange rate (7.9) 5,060 5,060
IMF SDR allocation liability Exchange rate 7.9 (427,923) (427,923)
IMF SDR allocation liability Exchange rate (7.9) 501,233 501,233
IMF Charges Payable Exchange rate 7.9 (35) (35)
IMF Charges Payable Exchange rate (7.9) 42 42
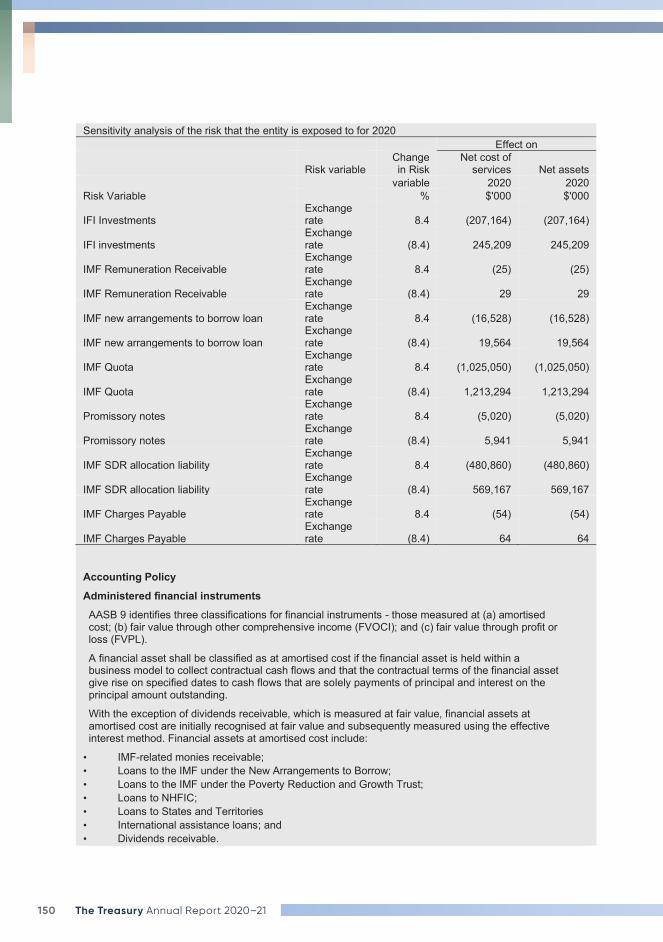
150 The Treasury Annual Report 2020–21
Sensitivity analysis of the risk that the entity is exposed to for 2020 Effect on
Risk variable Change in Risk
Net cost of services Net assets
variable 2020 2020 Risk Variable % $'000 $'000
IFI Investments Exchange rate 8.4 (207,164) (207,164)
IFI investments Exchange rate (8.4) 245,209 245,209
IMF Remuneration Receivable Exchange rate 8.4 (25) (25)
IMF Remuneration Receivable Exchange rate (8.4) 29 29
IMF new arrangements to borrow loan Exchange rate 8.4 (16,528) (16,528)
IMF new arrangements to borrow loan Exchange rate (8.4) 19,564 19,564
IMF Quota Exchange rate 8.4 (1,025,050) (1,025,050)
IMF Quota Exchange rate (8.4) 1,213,294 1,213,294
Promissory notes Exchange rate 8.4 (5,020) (5,020)
Promissory notes Exchange rate (8.4) 5,941 5,941
IMF SDR allocation liability Exchange rate 8.4 (480,860) (480,860)
IMF SDR allocation liability Exchange rate (8.4) 569,167 569,167
IMF Charges Payable Exchange rate 8.4 (54) (54)
IMF Charges Payable Exchange rate (8.4) 64 64
Accounting Policy Administered financial instruments AASB 9 identifies three classifications for financial instruments - those measured at (a) amortised cost; (b) fair value through other comprehensive income (FVOCI); and (c) fair value through profit or loss (FVPL).
A financial asset shall be classified as at amortised cost if the financial asset is held within a business model to collect contractual cash flows and that the contractual terms of the financial asset give rise on specified dates to cash flows that are solely payments of principal and interest on the principal amount outstanding.
With the exception of dividends receivable, which is measured at fair value, financial assets at amortised cost are initially recognised at fair value and subsequently measured using the effective interest method. Financial assets at amortised cost include:
• IMF-related monies receivable; • Loans to the IMF under the New Arrangements to Borrow; • Loans to the IMF under the Poverty Reduction and Growth Trust; • Loans to NHFIC; • Loans to States and Territories • International assistance loans; and • Dividends receivable.
151Part 4 Financial statements
A financial asset shall be classified as at FVOCI when the financial asset is held within a business model to collect contractual cash flows and to sell the financial asset. In addition, the Department of Finance has mandated that all equity instruments must be recorded as FVOCI.
Financial assets recorded at FVOCI are initially measured at cost and subsequently measured at fair value and include:
• Investments in development banks; • The IMF quota; • Investment in the Australian Business Growth Fund; and • Investments in Government entities.
Financial liabilities shall be classified as at amortised cost except for financial guarantee contracts.
Financial liabilities at amortised cost are initially measured at fair value and subsequently measured using the effective interest rate method. Financial liabilities at amortised cost include:
• SDR allocation; • Promissory notes; and • IMF related monies payable.
The contractual terms of promissory notes are non-interest bearing making the effective interest rate nil. Therefore, the measurement would be the initial value less any repayments plus or minus movements in exchange rates as a result of translation on the balance date.
The Treasury’s administered financial guarantee contracts relate to the Small and Medium Enterprises Guarantee Scheme (SMEGS), Show Starter Loan Scheme (SSLS), the Small and Medium Enterprises Loan Recovery Scheme (SMERLS) and components of the Guarantee of State and Territory Borrowings. They are classified as financial liabilities at fair value through profit or loss. They are not treated as contingent liabilities, as they are regarded as financial instruments outside the scope of AASB 137 Provisions, Contingent Liabilities and Contingent Assets.
The amounts recognised for the SMEGS, SSLS and SMERLS financial guarantee contracts are the expected losses on the total loan balance discounted to reporting date for these Schemes.
Recognition of the amounts for the Guarantee of State and Territory Borrowings only relate to fee revenue aspects of the financial guarantee contracts. These amounts do not reflect any expected liability under the Guarantee Scheme itself as these are considered remote and unquantifiable. Administered contingent liabilities and assets are disclosed at Note 7.2 Administered Contingent Assets and Liabilities.
152 The Treasury Annual Report 2020–21
7.5. Fair Value Measurement Note 7.5A: Fair value measurement
Fair value measurements at the end of
the reporting period 2021 2020 $'000 $'000 Non-financial assets1 Property, plant and equipment - AUC2 1,108 2,404 Property, plant and equipment2 9,884 8,077 Library2 764 939 Buildings - AUC2 2,776 920 Buildings2 19,988 18,290 Total non-financial assets 34,520 30,630
1. The Treasury’s assets are held for operational purposes and not held for the purposes of deriving a profit. The current use of all non-financial assets is considered their highest and best use. 2. No non-financial assets were measured at fair value on a non-recurring basis as at 30 June 2021.
Accounting Policy Comprehensive valuations are carried out once every three years. In the intervening years, an annual assessment is undertaken to determine whether the carrying amount of the assets is materially different from the fair value. The Treasury appointed Jones Lang LaSalle (JLL) to undertake a full revalution of all tangible property, plant and equipment assets as at 30 June 2021. Where possible, asset valuations are based upon observable inputs to the extent they are available. Where this information is not available, valuation techniques rely upon unobservable inputs. The methods utilised to determine and substantiate the unobservable inputs are derived and evaluated as follows: All Asset Classes - Physical Depreciation and Obsolescence Assets that do not transact with enough frequency or transparency to develop objective opinions of value from observable market evidence have been measured utilising the Depreciated Replacement Cost approach. Under the Depreciated Replacement Cost approach the estimated cost to replace the asset is calculated and then adjusted to take into physical depreciation and obsolescence. Physical depreciation and obsolescence has been determined based on professional judgement regarding physical, economic and external obsolescence factors relevant to the asset under consideration. For all leasehold improvement assets, the consumed economic benefit / asset obsolescence deduction is determined based on the term of the associated lease. Library - Replacement cost The value of the library was determined on the basis of the average cost for items within each collection. The replacement cost has considered purchases over recent years and these have been evaluated for reasonableness against current market prices. The Treasury's policy is to recognise transfers in and out of the fair value hierarchy levels as at the end of the reporting period. There have been no transfers between level 1 and level 2 of the hierarchy during the year.
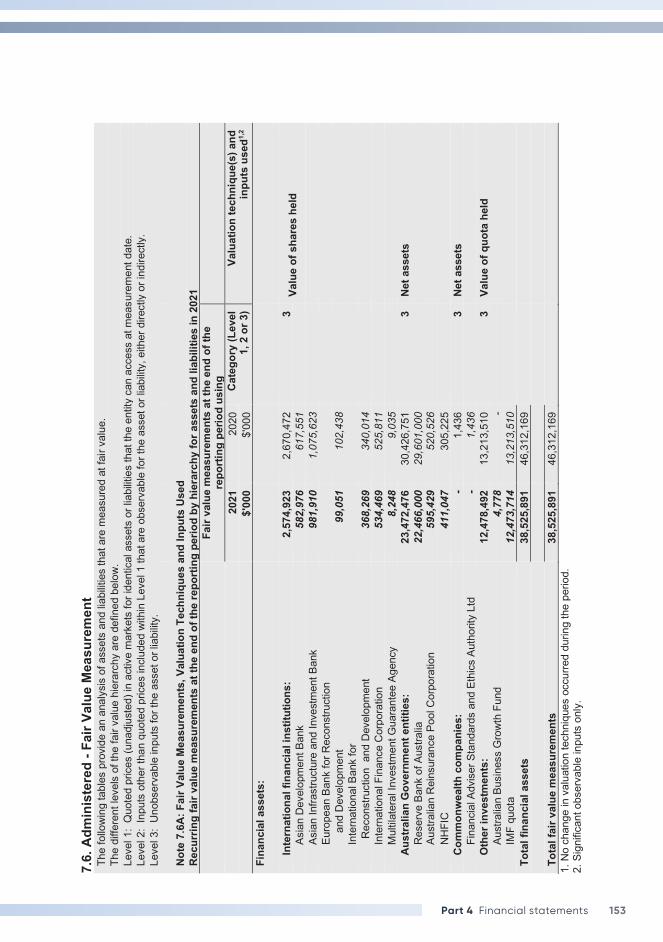
153Part 4 Financial statements
7.6.
Adm
inis
tere
d - F
air V
alue
Mea
sure
men
t Th
e fo
llow
ing
tabl
es p
rovi
de a
n an
alys
is o
f ass
ets
and
liabi
litie
s th
at a
re m
easu
red
at fa
ir va
lue.
Th
e di
ffere
nt le
vels
of t
he fa
ir va
lue
hier
arch
y ar
e de
fined
bel
ow.
Leve
l 1:
Quo
ted
pric
es (u
nadj
uste
d) in
act
ive
mar
kets
for i
dent
ical
ass
ets
or li
abilit
ies
that
the
entit
y ca
n ac
cess
at m
easu
rem
ent d
ate.
Le
vel 2
: In
puts
oth
er th
an q
uote
d pr
ices
incl
uded
with
in L
evel
1 th
at a
re o
bser
vabl
e fo
r the
ass
et o
r lia
bilit
y, e
ither
dire
ctly
or i
ndire
ctly
. Le
vel 3
: U
nobs
erva
ble
inpu
ts fo
r the
ass
et o
r lia
bilit
y.
No
te 7
.6A:
Fai
r Val
ue M
easu
rem
ents
, Val
uatio
n Te
chni
ques
and
Inpu
ts U
sed
Recu
rrin
g fa
ir va
lue
mea
sure
men
ts a
t the
end
of t
he re
port
ing
perio
d by
hie
rarc
hy fo
r ass
ets
and
liabi
litie
s in
202
1
Fa
ir va
lue
mea
sure
men
ts a
t the
end
of t
he
repo
rtin
g pe
riod
usin
g
2
021
202
0 Ca
tego
ry (L
evel
1,
2 o
r 3)
Valu
atio
n te
chni
que(
s) a
nd
inpu
ts u
sed1,
2
$'00
0 $'
000
Fina
ncia
l ass
ets:
Inte
rnat
iona
l fin
anci
al in
stitu
tions
: 2,
574,
923
2,
670,
472
3
Va
lue
of s
hare
s he
ld
Asia
n D
evel
opm
ent B
ank
582,
976
61
7,55
1
As
ian
Infra
stru
ctur
e an
d In
vest
men
t Ban
k 98
1,91
0
1,07
5,62
3
Euro
pean
Ban
k fo
r Rec
onst
ruct
ion
a
nd D
evel
opm
ent
99,0
51
102,
438
In
tern
atio
nal B
ank
for
Rec
onst
ruct
ion
and
Dev
elop
men
t 36
8,26
9
340,
014
In
tern
atio
nal F
inan
ce C
orpo
ratio
n 53
4,46
9
525,
811
M
ultil
ater
al In
vest
men
t Gua
rant
ee A
genc
y
8,24
8
9,03
5
Aust
ralia
n G
over
nmen
t ent
ities
: 23
,472
,476
30
,426
,751
3
Ne
t ass
ets
Res
erve
Ban
k of
Aus
tralia
22
,466
,000
29
,601
,000
Au
stra
lian
Rei
nsur
ance
Poo
l Cor
pora
tion
595,
429
52
0,52
6
NH
FIC
41
1,04
7
305,
225
Co
mm
onw
ealth
com
pani
es:
- 1,
436
3
Ne
t ass
ets
Fina
ncia
l Adv
iser
Sta
ndar
ds a
nd E
thic
s Au
thor
ity L
td
- 1,
436
O
ther
inve
stm
ents
: 12
,478
,492
13
,213
,510
3
Va
lue
of q
uota
hel
d Au
stra
lian
Busi
ness
Gro
wth
Fun
d 4,
778
-
IMF
quot
a 12
,473
,714
13
,213
,510
To
tal f
inan
cial
ass
ets
38,5
25,8
91
46,3
12,1
69
To
tal f
air v
alue
mea
sure
men
ts
38,5
25,8
91
46,3
12,1
69
1. N
o ch
ange
in v
alua
tion
tech
niqu
es o
ccur
red
durin
g th
e pe
riod.
2.
Sig
nific
ant o
bser
vabl
e in
puts
onl
y.
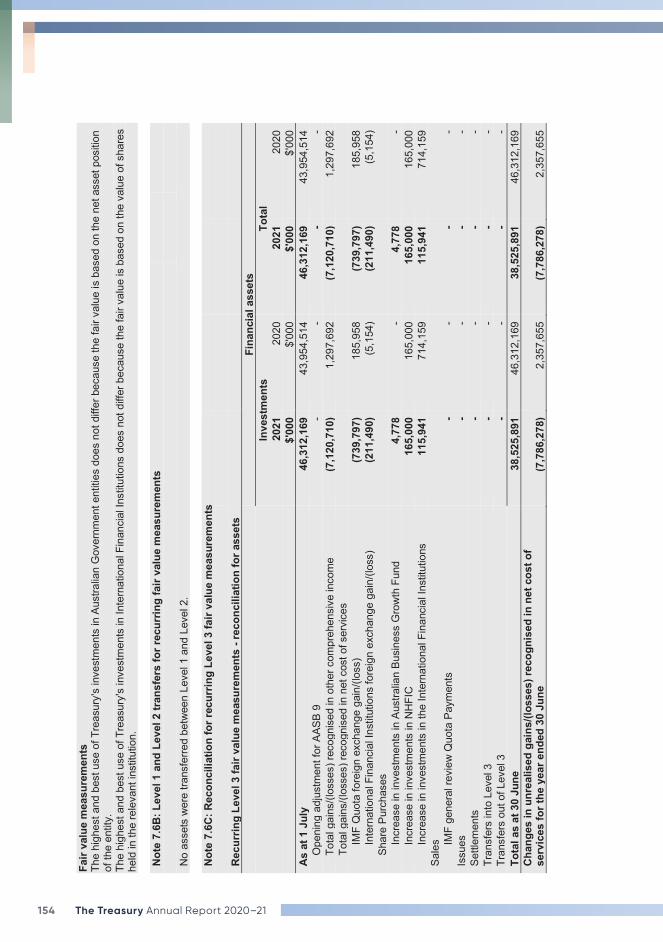
154 The Treasury Annual Report 2020–21
Fair
valu
e m
easu
rem
ents
Th
e hi
ghes
t and
bes
t use
of T
reas
ury'
s in
vest
men
ts in
Aus
tralia
n G
over
nmen
t ent
ities
doe
s no
t diff
er b
ecau
se th
e fa
ir va
lue
is b
ased
on
the
net a
sset
pos
ition
of
the
entit
y.
The
high
est a
nd b
est u
se o
f Tre
asur
y's
inve
stm
ents
in In
tern
atio
nal F
inan
cial
Inst
itutio
ns d
oes
not d
iffer
bec
ause
the
fair
valu
e is
bas
ed o
n th
e va
lue
of s
hare
s he
ld in
the
rele
vant
inst
itutio
n.
Note
7.6
B: L
evel
1 a
nd L
evel
2 tr
ansf
ers
for r
ecur
ring
fair
valu
e m
easu
rem
ents
No
asse
ts w
ere
trans
ferre
d be
twee
n Le
vel 1
and
Lev
el 2
.
Note
7.6
C: R
econ
cilia
tion
for r
ecur
ring
Leve
l 3 fa
ir va
lue
mea
sure
men
ts
Recu
rrin
g Le
vel 3
fair
valu
e m
easu
rem
ents
- re
conc
iliat
ion
for a
sset
s
Fina
ncia
l ass
ets
In
vest
men
ts
Tota
l
2021
20
20
2021
20
20
$'
000
$'00
0 $'
000
$'00
0 As
at 1
Jul
y 46
,312
,169
43
,954
,514
46
,312
,169
43
,954
,514
O
peni
ng a
djus
tmen
t for
AAS
B 9
-
- -
- To
tal g
ains
/(los
ses)
reco
gnis
ed in
oth
er c
ompr
ehen
sive
inco
me
(7,1
20,7
10)
1,29
7,69
2
(7,1
20,7
10)
1,29
7,69
2 To
tal g
ains
/(los
ses)
reco
gnis
ed in
net
cos
t of s
ervi
ces
IMF
Quo
ta fo
reig
n ex
chan
ge g
ain/
(loss
) (7
39,7
97)
185,
958
(7
39,7
97)
185,
958
Inte
rnat
iona
l Fin
anci
al In
stitu
tions
fore
ign
exch
ange
gai
n/(lo
ss)
(211
,490
) (5
,154
) (2
11,4
90)
(5,1
54)
Shar
e Pu
rcha
ses
Incr
ease
in in
vest
men
ts in
Aus
tralia
n Bu
sine
ss G
row
th F
und
4,77
8
- 4,
778
- In
crea
se in
inve
stm
ents
in N
HFI
C
165,
000
16
5,00
0
165,
000
165,
000
Incr
ease
in in
vest
men
ts in
the
Inte
rnat
iona
l Fin
anci
al In
stitu
tions
11
5,94
1
714,
159
11
5,94
1 71
4,15
9 Sa
les
IMF
gene
ral r
evie
w Q
uota
Pay
men
ts
- -
- -
Issu
es
- -
- -
Settl
emen
ts
- -
- -
Tran
sfer
s in
to L
evel
3
- -
- -
Tran
sfer
s ou
t of L
evel
3
- -
- -
Tota
l as
at 3
0 Ju
ne
38,5
25,8
91
46,3
12,1
69
38,5
25,8
91
46,3
12,1
69
Chan
ges
in u
nrea
lised
gai
ns/(l
osse
s) re
cogn
ised
in n
et c
ost o
f se
rvic
es fo
r the
yea
r end
ed 3
0 Ju
ne
(7,7
86,2
78)
2,35
7,65
5 (7
,786
,278
) 2,
357,
655
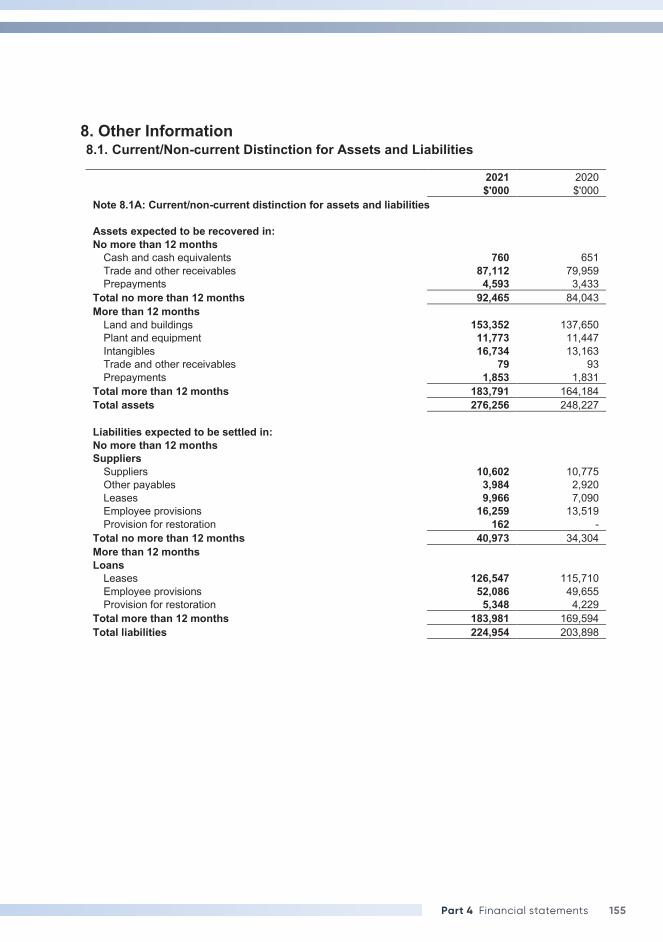
155Part 4 Financial statements
8. Other Information 8.1. Current/Non-current Distinction for Assets and Liabilities
2021 2020 $'000 $'000 Note 8.1A: Current/non-current distinction for assets and liabilities Assets expected to be recovered in: No more than 12 months
Cash and cash equivalents 760 651 Trade and other receivables 87,112 79,959 Prepayments 4,593 3,433
Total no more than 12 months 92,465 84,043 More than 12 months
Land and buildings 153,352 137,650 Plant and equipment 11,773 11,447 Intangibles 16,734 13,163 Trade and other receivables 79 93 Prepayments 1,853 1,831
Total more than 12 months 183,791 164,184 Total assets 276,256 248,227 Liabilities expected to be settled in: No more than 12 months Suppliers
Suppliers 10,602 10,775 Other payables 3,984 2,920 Leases 9,966 7,090 Employee provisions 16,259 13,519 Provision for restoration 162 -
Total no more than 12 months 40,973 34,304 More than 12 months Loans
Leases 126,547 115,710 Employee provisions 52,086 49,655 Provision for restoration 5,348 4,229
Total more than 12 months 183,981 169,594 Total liabilities 224,954 203,898
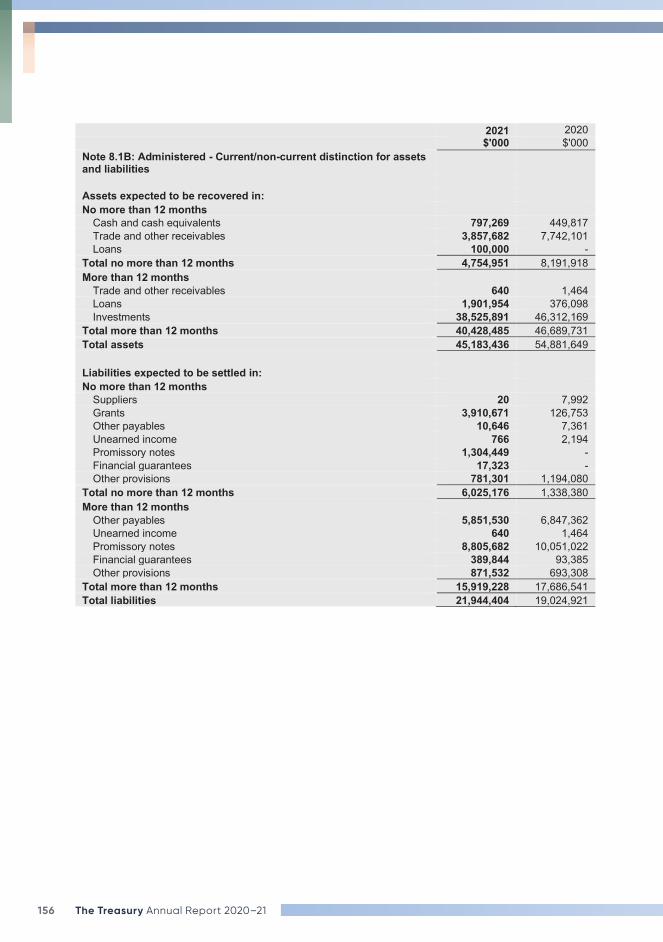
156 The Treasury Annual Report 2020–21
2021 2020 $'000 $'000 Note 8.1B: Administered - Current/non-current distinction for assets and liabilities Assets expected to be recovered in: No more than 12 months
Cash and cash equivalents 797,269 449,817 Trade and other receivables 3,857,682 7,742,101 Loans 100,000 -
Total no more than 12 months 4,754,951 8,191,918 More than 12 months
Trade and other receivables 640 1,464 Loans 1,901,954 376,098 Investments 38,525,891 46,312,169
Total more than 12 months 40,428,485 46,689,731 Total assets 45,183,436 54,881,649 Liabilities expected to be settled in: No more than 12 months
Suppliers 20 7,992 Grants 3,910,671 126,753 Other payables 10,646 7,361 Unearned income 766 2,194 Promissory notes 1,304,449 - Financial guarantees 17,323 - Other provisions 781,301 1,194,080
Total no more than 12 months 6,025,176 1,338,380 More than 12 months
Other payables 5,851,530 6,847,362 Unearned income 640 1,464 Promissory notes 8,805,682 10,051,022 Financial guarantees 389,844 93,385 Other provisions 871,532 693,308
Total more than 12 months 15,919,228 17,686,541 Total liabilities 21,944,404 19,024,921
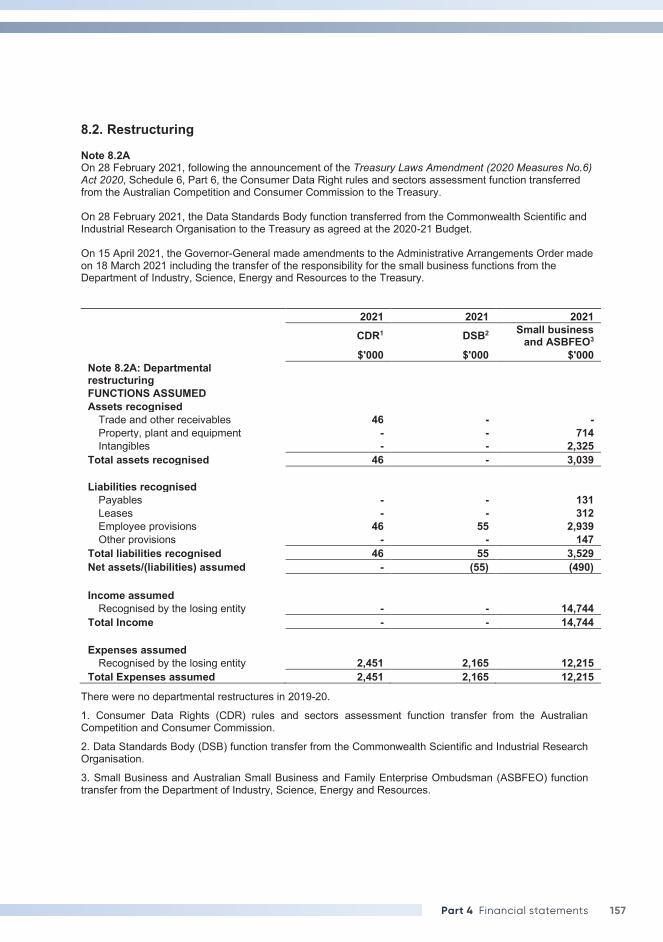
157Part 4 Financial statements
8.2. Restructuring
Note 8.2A On 28 February 2021, following the announcement of the Treasury Laws Amendment (2020 Measures No.6) Act 2020, Schedule 6, Part 6, the Consumer Data Right rules and sectors assessment function transferred from the Australian Competition and Consumer Commission to the Treasury. On 28 February 2021, the Data Standards Body function transferred from the Commonwealth Scientific and Industrial Research Organisation to the Treasury as agreed at the 2020-21 Budget. On 15 April 2021, the Governor-General made amendments to the Administrative Arrangements Order made on 18 March 2021 including the transfer of the responsibility for the small business functions from the Department of Industry, Science, Energy and Resources to the Treasury.
2021 2021 2021
CDR1 DSB2 Small business and ASBFEO3
$'000 $'000 $'000 Note 8.2A: Departmental restructuring FUNCTIONS ASSUMED Assets recognised
Trade and other receivables 46 - - Property, plant and equipment - - 714 Intangibles - - 2,325
Total assets recognised 46 - 3,039 Liabilities recognised
Payables - - 131 Leases - - 312 Employee provisions 46 55 2,939 Other provisions - - 147
Total liabilities recognised 46 55 3,529 Net assets/(liabilities) assumed - (55) (490) Income assumed
Recognised by the losing entity - - 14,744 Total Income - - 14,744 Expenses assumed
Recognised by the losing entity 2,451 2,165 12,215 Total Expenses assumed 2,451 2,165 12,215
There were no departmental restructures in 2019-20.
1. Consumer Data Rights (CDR) rules and sectors assessment function transfer from the Australian Competition and Consumer Commission.
2. Data Standards Body (DSB) function transfer from the Commonwealth Scientific and Industrial Research Organisation.
3. Small Business and Australian Small Business and Family Enterprise Ombudsman (ASBFEO) function transfer from the Department of Industry, Science, Energy and Resources.
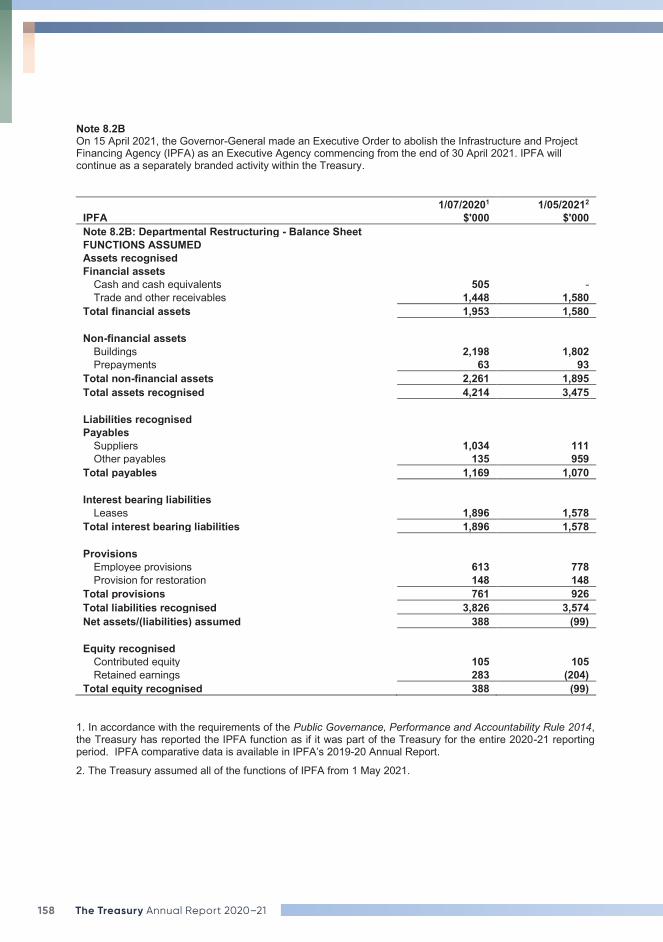
158 The Treasury Annual Report 2020–21
Note 8.2B On 15 April 2021, the Governor-General made an Executive Order to abolish the Infrastructure and Project Financing Agency (IPFA) as an Executive Agency commencing from the end of 30 April 2021. IPFA will continue as a separately branded activity within the Treasury.
1/07/20201 1/05/20212 IPFA $'000 $'000 Note 8.2B: Departmental Restructuring - Balance Sheet FUNCTIONS ASSUMED Assets recognised Financial assets
Cash and cash equivalents 505 - Trade and other receivables 1,448 1,580
Total financial assets 1,953 1,580 Non-financial assets
Buildings 2,198 1,802 Prepayments 63 93
Total non-financial assets 2,261 1,895 Total assets recognised 4,214 3,475 Liabilities recognised Payables
Suppliers 1,034 111 Other payables 135 959
Total payables 1,169 1,070 Interest bearing liabilities
Leases 1,896 1,578 Total interest bearing liabilities 1,896 1,578 Provisions
Employee provisions 613 778 Provision for restoration 148 148
Total provisions 761 926 Total liabilities recognised 3,826 3,574 Net assets/(liabilities) assumed 388 (99) Equity recognised
Contributed equity 105 105 Retained earnings 283 (204)
Total equity recognised 388 (99)
1. In accordance with the requirements of the Public Governance, Performance and Accountability Rule 2014, the Treasury has reported the IPFA function as if it was part of the Treasury for the entire 2020-21 reporting period. IPFA comparative data is available in IPFA’s 2019-20 Annual Report.
2. The Treasury assumed all of the functions of IPFA from 1 May 2021.
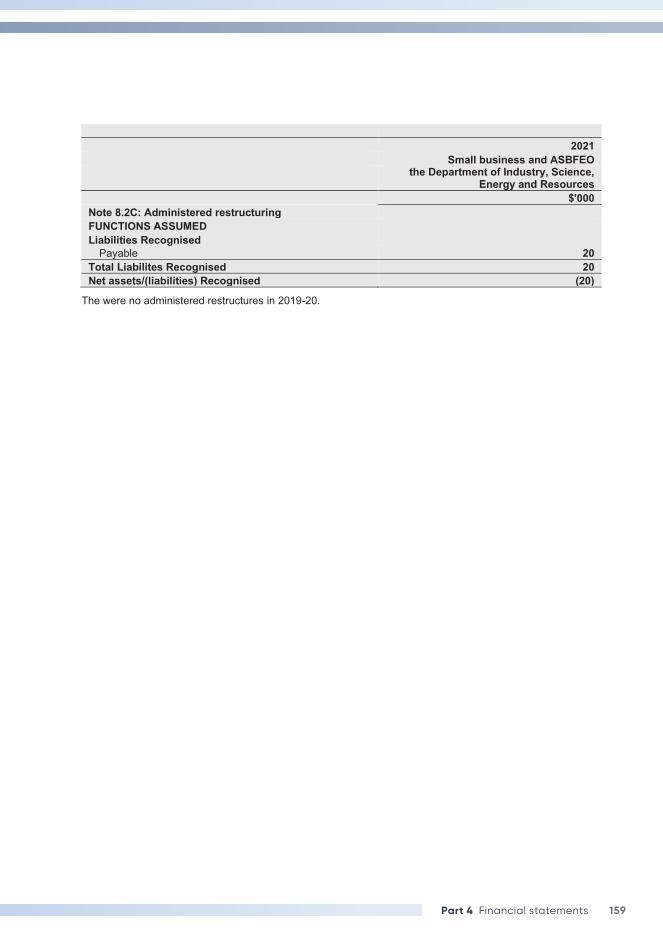
159Part 4 Financial statements
2021 Small business and ASBFEO
the Department of Industry, Science,
Energy and Resources $'000
Note 8.2C: Administered restructuring FUNCTIONS ASSUMED Liabilities Recognised
Payable 20 Total Liabilites Recognised 20 Net assets/(liabilities) Recognised (20)
The were no administered restructures in 2019-20.
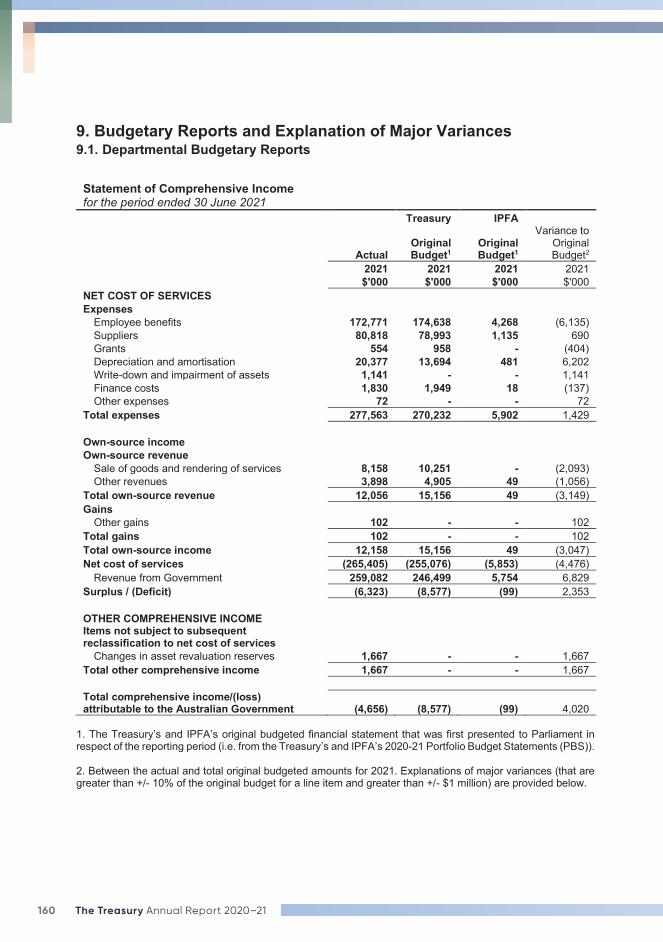
160 The Treasury Annual Report 2020–21
9. Budgetary Reports and Explanation of Major Variances 9.1. Departmental Budgetary Reports
Statement of Comprehensive Income for the period ended 30 June 2021 Treasury IPFA
Actual Original Budget1
Original Budget1
Variance to Original Budget2
2021 2021 2021 2021 $'000 $'000 $'000 $'000 NET COST OF SERVICES Expenses
Employee benefits 172,771 174,638 4,268 (6,135) Suppliers 80,818 78,993 1,135 690 Grants 554 958 - (404) Depreciation and amortisation 20,377 13,694 481 6,202 Write-down and impairment of assets 1,141 - - 1,141 Finance costs 1,830 1,949 18 (137) Other expenses 72 - - 72
Total expenses 277,563 270,232 5,902 1,429 Own-source income Own-source revenue
Sale of goods and rendering of services 8,158 10,251 - (2,093) Other revenues 3,898 4,905 49 (1,056)
Total own-source revenue 12,056 15,156 49 (3,149) Gains
Other gains 102 - - 102 Total gains 102 - - 102 Total own-source income 12,158 15,156 49 (3,047) Net cost of services (265,405) (255,076) (5,853) (4,476)
Revenue from Government 259,082 246,499 5,754 6,829 Surplus / (Deficit) (6,323) (8,577) (99) 2,353 OTHER COMPREHENSIVE INCOME Items not subject to subsequent reclassification to net cost of services
Changes in asset revaluation reserves 1,667 - - 1,667 Total other comprehensive income 1,667 - - 1,667 Total comprehensive income/(loss) attributable to the Australian Government (4,656) (8,577) (99) 4,020
1. The Treasury’s and IPFA’s original budgeted financial statement that was first presented to Parliament in respect of the reporting period (i.e. from the Treasury’s and IPFA’s 2020-21 Portfolio Budget Statements (PBS)). 2. Between the actual and total original budgeted amounts for 2021. Explanations of major variances (that are greater than +/- 10% of the original budget for a line item and greater than +/- $1 million) are provided below.
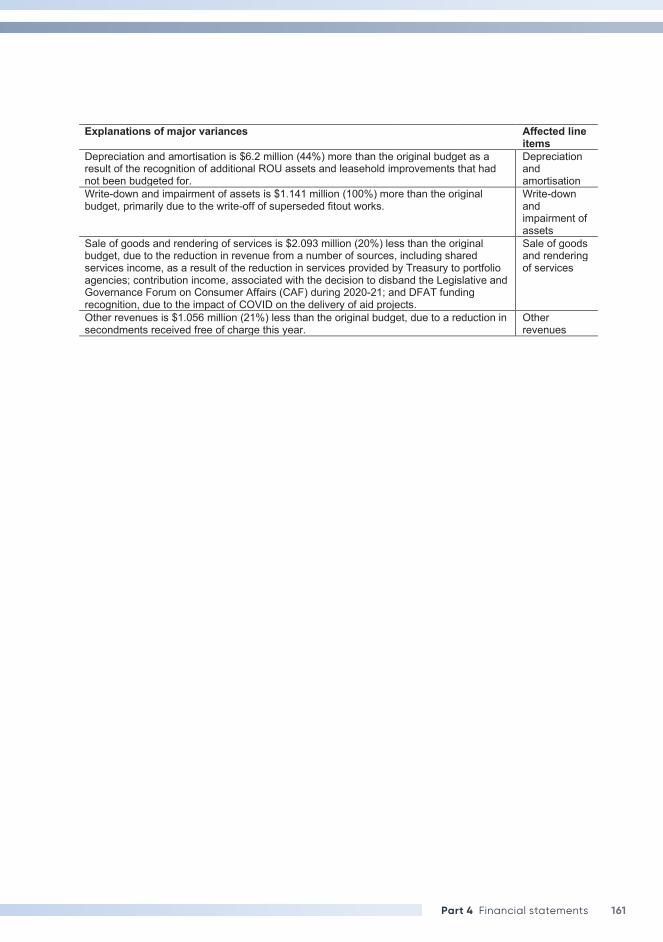
161Part 4 Financial statements
Explanations of major variances Affected line items
Depreciation and amortisation is $6.2 million (44%) more than the original budget as a result of the recognition of additional ROU assets and leasehold improvements that had not been budgeted for.
Depreciation and amortisation
Write-down and impairment of assets is $1.141 million (100%) more than the original budget, primarily due to the write-off of superseded fitout works.
Write-down and impairment of assets
Sale of goods and rendering of services is $2.093 million (20%) less than the original budget, due to the reduction in revenue from a number of sources, including shared services income, as a result of the reduction in services provided by Treasury to portfolio agencies; contribution income, associated with the decision to disband the Legislative and Governance Forum on Consumer Affairs (CAF) during 2020-21; and DFAT funding recognition, due to the impact of COVID on the delivery of aid projects.
Sale of goods and rendering of services
Other revenues is $1.056 million (21%) less than the original budget, due to a reduction in secondments received free of charge this year.
Other revenues
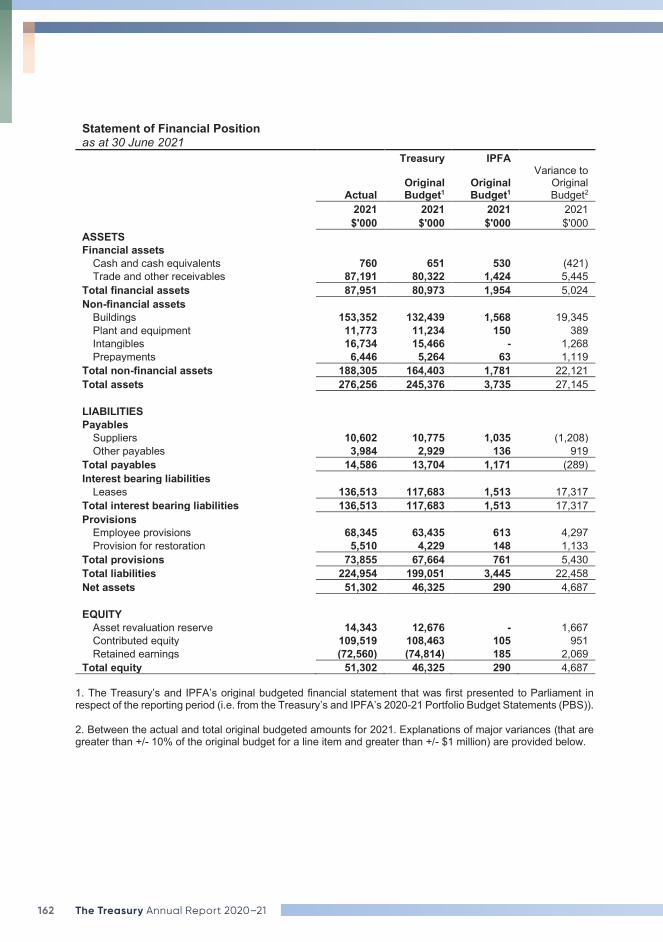
162 The Treasury Annual Report 2020–21
Statement of Financial Position as at 30 June 2021 Treasury IPFA
Actual Original Budget1
Original Budget1
Variance to Original Budget2
2021 2021 2021 2021 $'000 $'000 $'000 $'000 ASSETS Financial assets
Cash and cash equivalents 760 651 530 (421) Trade and other receivables 87,191 80,322 1,424 5,445
Total financial assets 87,951 80,973 1,954 5,024 Non-financial assets
Buildings 153,352 132,439 1,568 19,345 Plant and equipment 11,773 11,234 150 389 Intangibles 16,734 15,466 - 1,268 Prepayments 6,446 5,264 63 1,119
Total non-financial assets 188,305 164,403 1,781 22,121 Total assets 276,256 245,376 3,735 27,145 LIABILITIES Payables
Suppliers 10,602 10,775 1,035 (1,208) Other payables 3,984 2,929 136 919
Total payables 14,586 13,704 1,171 (289) Interest bearing liabilities
Leases 136,513 117,683 1,513 17,317 Total interest bearing liabilities 136,513 117,683 1,513 17,317 Provisions
Employee provisions 68,345 63,435 613 4,297 Provision for restoration 5,510 4,229 148 1,133
Total provisions 73,855 67,664 761 5,430 Total liabilities 224,954 199,051 3,445 22,458 Net assets 51,302 46,325 290 4,687 EQUITY
Asset revaluation reserve 14,343 12,676 - 1,667 Contributed equity 109,519 108,463 105 951 Retained earnings (72,560) (74,814) 185 2,069
Total equity 51,302 46,325 290 4,687 1. The Treasury’s and IPFA’s original budgeted financial statement that was first presented to Parliament in respect of the reporting period (i.e. from the Treasury’s and IPFA’s 2020-21 Portfolio Budget Statements (PBS)). 2. Between the actual and total original budgeted amounts for 2021. Explanations of major variances (that are greater than +/- 10% of the original budget for a line item and greater than +/- $1 million) are provided below.
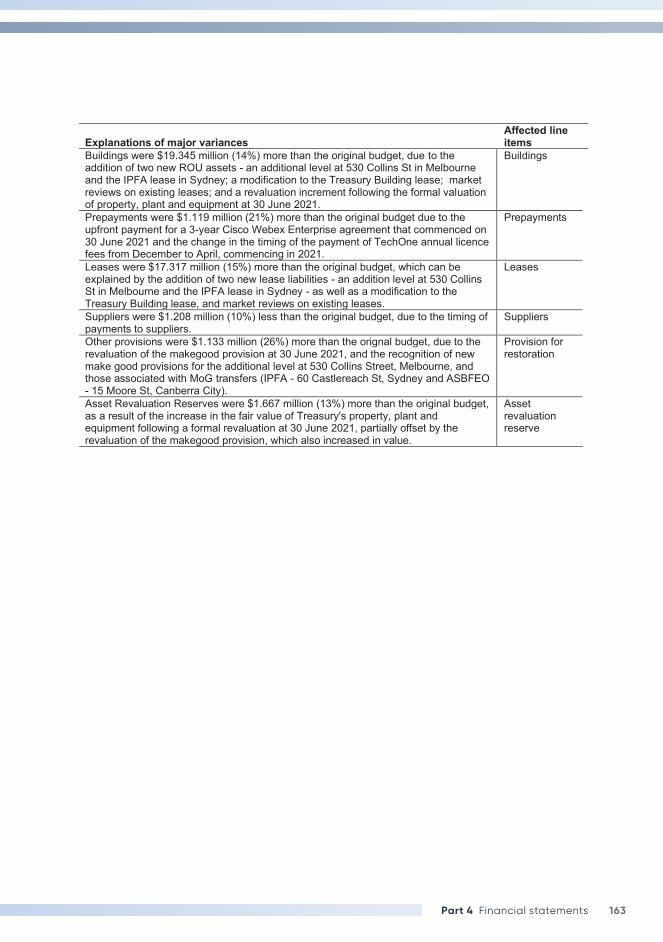
163Part 4 Financial statements
Explanations of major variances Affected line items
Buildings were $19.345 million (14%) more than the original budget, due to the addition of two new ROU assets - an additional level at 530 Collins St in Melbourne and the IPFA lease in Sydney; a modification to the Treasury Building lease; market reviews on existing leases; and a revaluation increment following the formal valuation of property, plant and equipment at 30 June 2021.
Buildings
Prepayments were $1.119 million (21%) more than the original budget due to the upfront payment for a 3-year Cisco Webex Enterprise agreement that commenced on 30 June 2021 and the change in the timing of the payment of TechOne annual licence fees from December to April, commencing in 2021.
Prepayments
Leases were $17.317 million (15%) more than the original budget, which can be explained by the addition of two new lease liabilities - an addition level at 530 Collins St in Melbourne and the IPFA lease in Sydney - as well as a modification to the Treasury Building lease, and market reviews on existing leases.
Leases
Suppliers were $1.208 million (10%) less than the original budget, due to the timing of payments to suppliers.
Suppliers
Other provisions were $1.133 million (26%) more than the orignal budget, due to the revaluation of the makegood provision at 30 June 2021, and the recognition of new make good provisions for the additional level at 530 Collins Street, Melbourne, and those associated with MoG transfers (IPFA - 60 Castlereach St, Sydney and ASBFEO - 15 Moore St, Canberra City).
Provision for restoration
Asset Revaluation Reserves were $1.667 million (13%) more than the original budget, as a result of the increase in the fair value of Treasury's property, plant and equipment following a formal revaluation at 30 June 2021, partially offset by the revaluation of the makegood provision, which also increased in value.
Asset revaluation reserve
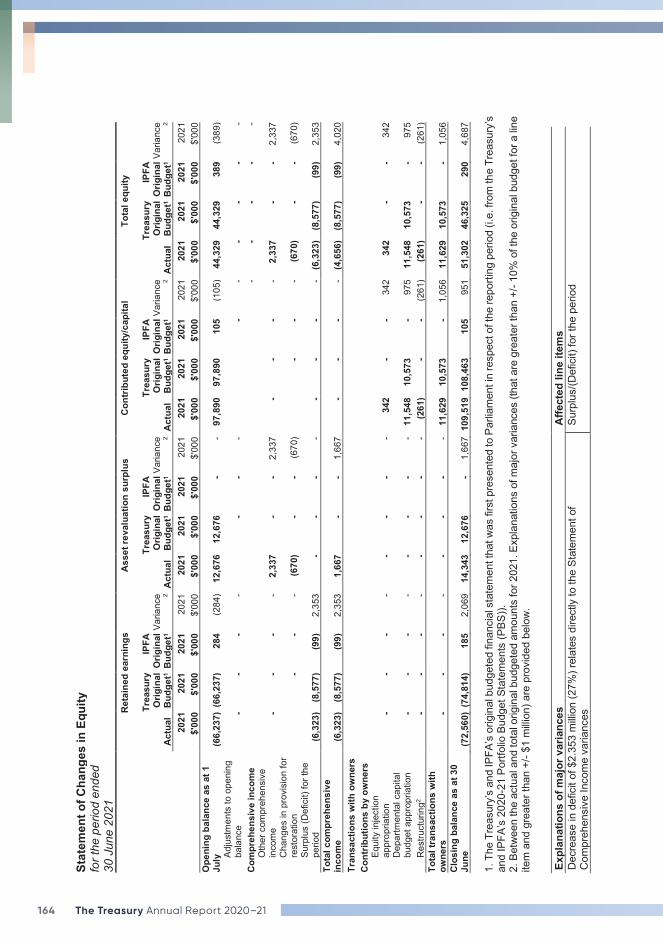
164 The Treasury Annual Report 2020–21
Stat
emen
t of C
hang
es in
Equ
ity
for t
he p
erio
d en
ded
30 J
une
2021
Ret
aine
d ea
rnin
gs
Ass
et re
valu
atio
n su
rplu
s C
ontr
ibut
ed e
quity
/cap
ital
Tota
l equ
ity
Tr
easu
ry
IPFA
Tr
easu
ry
IPFA
Tr
easu
ry
IPFA
Tr
easu
ry
IPFA
A
ctua
l O
rigin
al
Bud
get1
Orig
inal
B
udge
t1 Va
rianc
e 2 A
ctua
l O
rigin
al
Bud
get1
Orig
inal
B
udge
t1 Va
rianc
e 2 A
ctua
l O
rigin
al
Bud
get1
Orig
inal
B
udge
t1 Va
rianc
e 2 A
ctua
l O
rigin
al
Bud
get1
Orig
inal
B
udge
t1 Va
rianc
e 2
2021
20
21
2021
20
21
2021
20
21
2021
20
21
2021
20
21
2021
20
21
2021
20
21
2021
20
21
$'
000
$'00
0 $'
000
$'00
0 $'
000
$'00
0 $'
000
$'00
0 $'
000
$'00
0 $'
000
$'00
0 $'
000
$'00
0 $'
000
$'00
0 O
peni
ng b
alan
ce a
s at
1
July
(6
6,23
7) (
66,2
37)
284
(2
84)
12,6
76
12,6
76
- -
97,8
90
97,8
90
105
(1
05)
44,3
29
44,3
29
389
(3
89)
Adju
stm
ents
to o
peni
ng
bala
nce
- -
- -
-
- -
- -
- -
- -
Com
preh
ensi
ve in
com
e
-
- -
- -
Oth
er c
ompr
ehen
sive
in
com
e -
- -
- 2,
337
-
- 2,
337
-
- -
- 2,
337
-
- 2,
337
C
hang
es in
pro
visi
on fo
r re
stor
atio
n
- -
- (6
70)
- -
(670
)
- -
- (6
70)
- -
(670
) Su
rplu
s (D
efic
it) fo
r the
pe
riod
(6,3
23)
(8,5
77)
(99)
2,
353
-
- -
- -
- -
- (6
,323
) (8
,577
) (9
9)
2,35
3
Tota
l com
preh
ensi
ve
inco
me
(6,3
23)
(8,5
77)
(99)
2,
353
1,
667
-
- 1,
667
-
- -
- (4
,656
) (8
,577
) (9
9)
4,02
0
Tran
sact
ions
with
ow
ners
C
ontr
ibut
ions
by
owne
rs
Equi
ty in
ject
ion
appr
opria
tion
- -
- -
- -
- -
342
-
- 34
2
342
-
- 34
2
Dep
artm
enta
l cap
ital
budg
et a
ppro
pria
tion
- -
- -
- -
- -
11,5
48
10,5
73
- 97
5
11,5
48
10,5
73
- 97
5
Res
truct
urin
g2 -
- -
- -
- -
- (2
61)
- -
(261
) (2
61)
- -
(261
) To
tal t
rans
actio
ns w
ith
owne
rs
- -
- -
- -
- -
11,6
29
10,5
73
- 1,
056
11
,629
10
,573
-
1,05
6
Clo
sing
bal
ance
as
at 3
0 Ju
ne
(72,
560)
(74
,814
) 18
5
2,06
9
14,3
43
12,6
76
- 1,
667
109
,519
108
,463
10
5
951
51
,302
46
,325
29
0
4,68
7
1. T
he T
reas
ury’
s an
d IP
FA’s
orig
inal
bud
gete
d fin
anci
al s
tate
men
t tha
t was
firs
t pre
sent
ed to
Par
liam
ent i
n re
spec
t of t
he re
porti
ng p
erio
d (i.
e. fr
om th
e Tr
easu
ry’s
an
d IP
FA’s
202
0-21
Por
tfolio
Bud
get S
tate
men
ts (P
BS)).
2.
Bet
wee
n th
e ac
tual
and
tota
l orig
inal
bud
gete
d am
ount
s fo
r 202
1. E
xpla
natio
ns o
f maj
or v
aria
nces
(tha
t are
gre
ater
than
+/-
10%
of t
he o
rigin
al b
udge
t for
a li
ne
item
and
gre
ater
than
+/-
$1 m
illion
) are
pro
vide
d be
low
.
Expl
anat
ions
of m
ajor
var
ianc
es
Affe
cted
line
item
s D
ecre
ase
in d
efic
it of
$2.
353
milli
on (2
7%) r
elat
es d
irect
ly to
the
Stat
emen
t of
Com
preh
ensi
ve In
com
e va
rianc
es
Surp
lus/
(Def
icit)
for t
he p
erio
d
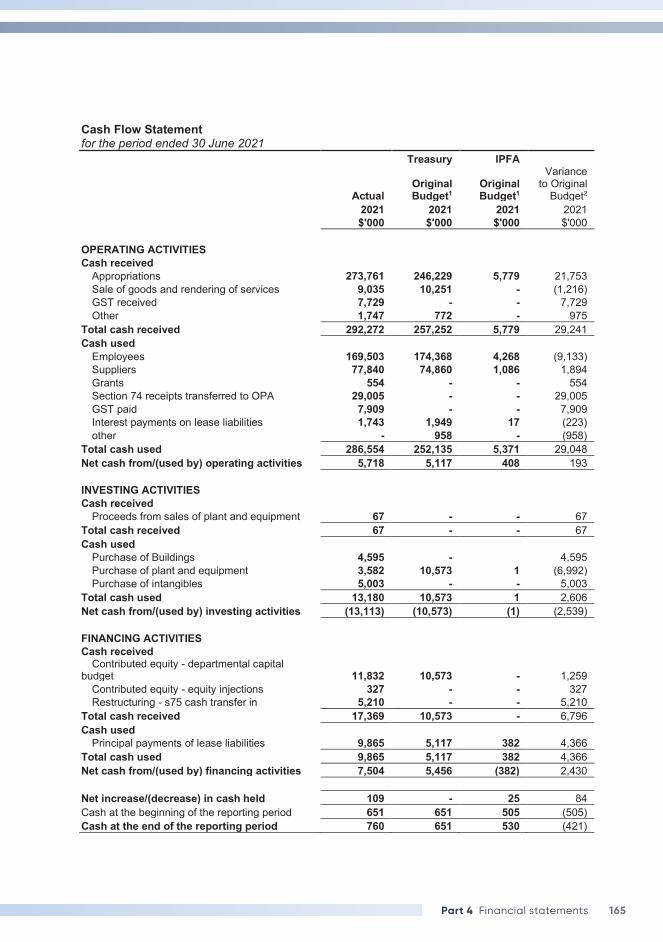
165Part 4 Financial statements
Cash Flow Statement for the period ended 30 June 2021 Treasury IPFA
Actual Original Budget1
Original Budget1
Variance to Original
Budget2 2021 2021 2021 2021 $'000 $'000 $'000 $'000 OPERATING ACTIVITIES Cash received
Appropriations 273,761 246,229 5,779 21,753 Sale of goods and rendering of services 9,035 10,251 - (1,216) GST received 7,729 - - 7,729 Other 1,747 772 - 975
Total cash received 292,272 257,252 5,779 29,241 Cash used
Employees 169,503 174,368 4,268 (9,133) Suppliers 77,840 74,860 1,086 1,894 Grants 554 - - 554 Section 74 receipts transferred to OPA 29,005 - - 29,005 GST paid 7,909 - - 7,909 Interest payments on lease liabilities 1,743 1,949 17 (223) other - 958 - (958)
Total cash used 286,554 252,135 5,371 29,048 Net cash from/(used by) operating activities 5,718 5,117 408 193 INVESTING ACTIVITIES Cash received
Proceeds from sales of plant and equipment 67 - - 67 Total cash received 67 - - 67 Cash used
Purchase of Buildings 4,595 - 4,595 Purchase of plant and equipment 3,582 10,573 1 (6,992) Purchase of intangibles 5,003 - - 5,003
Total cash used 13,180 10,573 1 2,606 Net cash from/(used by) investing activities (13,113) (10,573) (1) (2,539) FINANCING ACTIVITIES Cash received
Contributed equity - departmental capital budget 11,832 10,573 - 1,259
Contributed equity - equity injections 327 - - 327 Restructuring - s75 cash transfer in 5,210 - - 5,210
Total cash received 17,369 10,573 - 6,796 Cash used
Principal payments of lease liabilities 9,865 5,117 382 4,366 Total cash used 9,865 5,117 382 4,366 Net cash from/(used by) financing activities 7,504 5,456 (382) 2,430 Net increase/(decrease) in cash held 109 - 25 84 Cash at the beginning of the reporting period 651 651 505 (505) Cash at the end of the reporting period 760 651 530 (421)
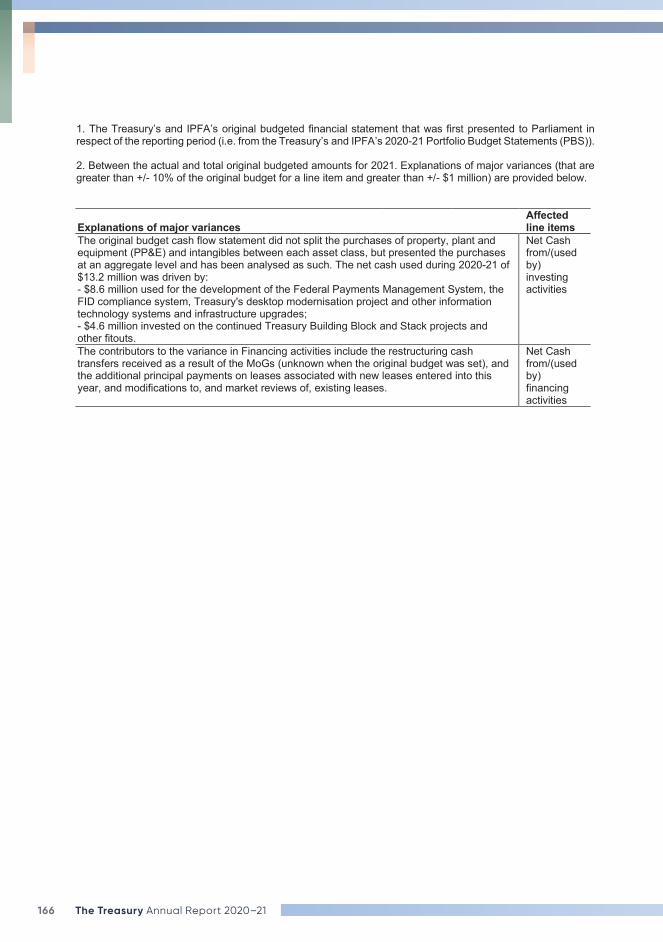
166 The Treasury Annual Report 2020–21
1. The Treasury’s and IPFA’s original budgeted financial statement that was first presented to Parliament in respect of the reporting period (i.e. from the Treasury’s and IPFA’s 2020-21 Portfolio Budget Statements (PBS)). 2. Between the actual and total original budgeted amounts for 2021. Explanations of major variances (that are greater than +/- 10% of the original budget for a line item and greater than +/- $1 million) are provided below.
Explanations of major variances Affected line items
The original budget cash flow statement did not split the purchases of property, plant and equipment (PP&E) and intangibles between each asset class, but presented the purchases at an aggregate level and has been analysed as such. The net cash used during 2020-21 of $13.2 million was driven by: - $8.6 million used for the development of the Federal Payments Management System, the FID compliance system, Treasury's desktop modernisation project and other information technology systems and infrastructure upgrades; - $4.6 million invested on the continued Treasury Building Block and Stack projects and other fitouts.
Net Cash from/(used by) investing activities
The contributors to the variance in Financing activities include the restructuring cash transfers received as a result of the MoGs (unknown when the original budget was set), and the additional principal payments on leases associated with new leases entered into this year, and modifications to, and market reviews of, existing leases.
Net Cash from/(used by) financing activities
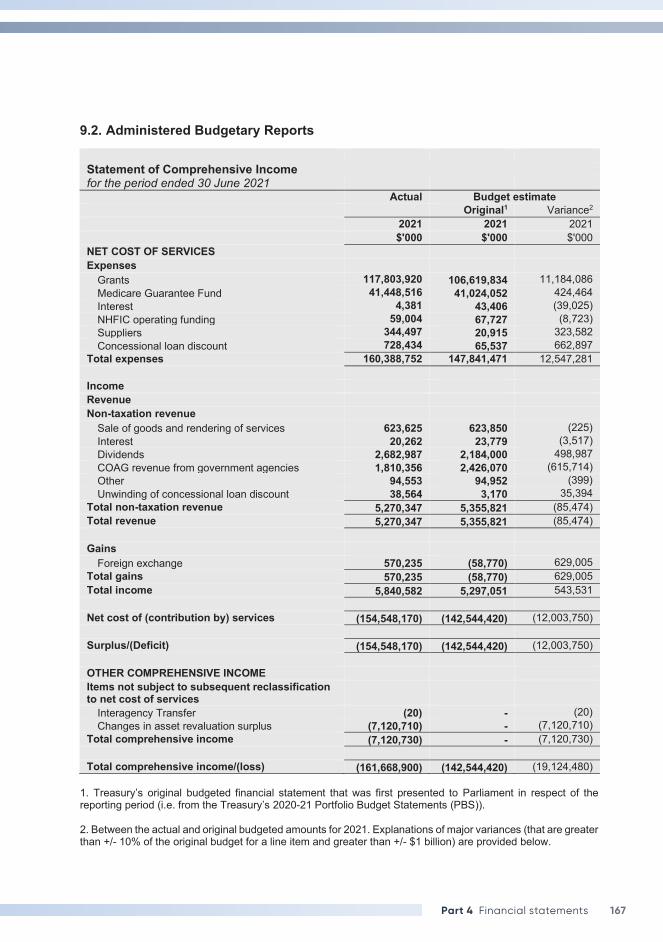
167Part 4 Financial statements
9.2. Administered Budgetary Reports
Statement of Comprehensive Income for the period ended 30 June 2021 Actual Budget estimate Original1 Variance2 2021 2021 2021 $'000 $'000 $'000 NET COST OF SERVICES Expenses
Grants 117,803,920 106,619,834 11,184,086 Medicare Guarantee Fund 41,448,516 41,024,052 424,464 Interest 4,381 43,406 (39,025) NHFIC operating funding 59,004 67,727 (8,723) Suppliers 344,497 20,915 323,582 Concessional loan discount 728,434 65,537 662,897
Total expenses 160,388,752 147,841,471 12,547,281 Income Revenue Non-taxation revenue
Sale of goods and rendering of services 623,625 623,850 (225) Interest 20,262 23,779 (3,517) Dividends 2,682,987 2,184,000 498,987 COAG revenue from government agencies 1,810,356 2,426,070 (615,714) Other 94,553 94,952 (399) Unwinding of concessional loan discount 38,564 3,170 35,394
Total non-taxation revenue 5,270,347 5,355,821 (85,474) Total revenue 5,270,347 5,355,821 (85,474) Gains
Foreign exchange 570,235 (58,770) 629,005 Total gains 570,235 (58,770) 629,005 Total income 5,840,582 5,297,051 543,531 Net cost of (contribution by) services (154,548,170) (142,544,420) (12,003,750) Surplus/(Deficit) (154,548,170) (142,544,420) (12,003,750) OTHER COMPREHENSIVE INCOME Items not subject to subsequent reclassification to net cost of services
Interagency Transfer (20) - (20) Changes in asset revaluation surplus (7,120,710) - (7,120,710)
Total comprehensive income (7,120,730) - (7,120,730) Total comprehensive income/(loss) (161,668,900) (142,544,420) (19,124,480)
1. Treasury’s original budgeted financial statement that was first presented to Parliament in respect of the reporting period (i.e. from the Treasury’s 2020-21 Portfolio Budget Statements (PBS)). 2. Between the actual and original budgeted amounts for 2021. Explanations of major variances (that are greater than +/- 10% of the original budget for a line item and greater than +/- $1 billion) are provided below.
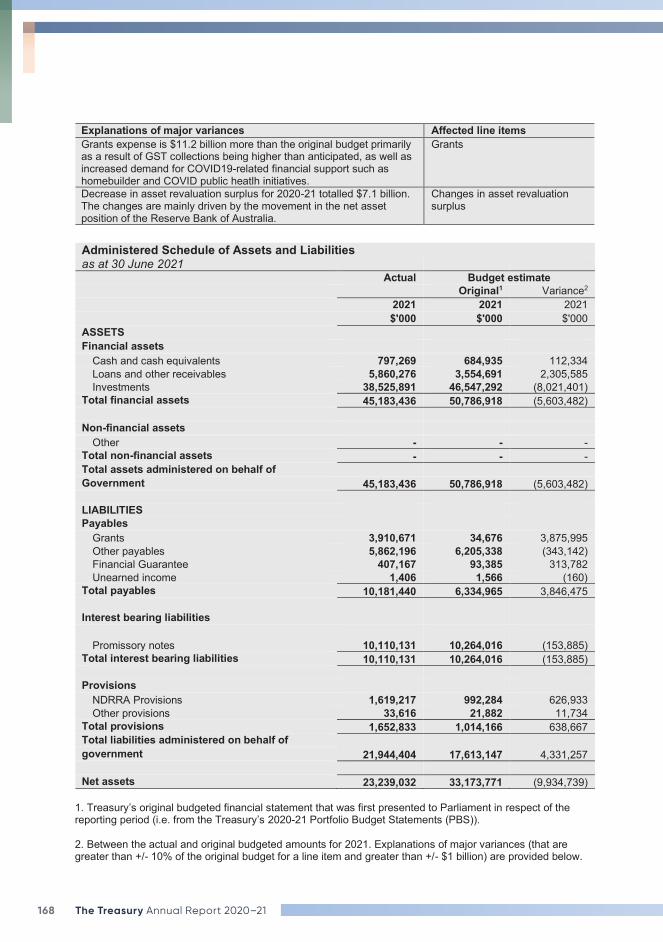
168 The Treasury Annual Report 2020–21
Explanations of major variances Affected line items Grants expense is $11.2 billion more than the original budget primarily as a result of GST collections being higher than anticipated, as well as increased demand for COVID19-related financial support such as homebuilder and COVID public heatlh initiatives.
Grants
Decrease in asset revaluation surplus for 2020-21 totalled $7.1 billion. The changes are mainly driven by the movement in the net asset position of the Reserve Bank of Australia.
Changes in asset revaluation surplus
Administered Schedule of Assets and Liabilities as at 30 June 2021 Actual Budget estimate Original1 Variance2 2021 2021 2021 $'000 $'000 $'000 ASSETS Financial assets
Cash and cash equivalents 797,269 684,935 112,334 Loans and other receivables 5,860,276 3,554,691 2,305,585 Investments 38,525,891 46,547,292 (8,021,401)
Total financial assets 45,183,436 50,786,918 (5,603,482) Non-financial assets
Other - - - Total non-financial assets - - - Total assets administered on behalf of Government 45,183,436 50,786,918 (5,603,482) LIABILITIES Payables
Grants 3,910,671 34,676 3,875,995 Other payables 5,862,196 6,205,338 (343,142) Financial Guarantee 407,167 93,385 313,782 Unearned income 1,406 1,566 (160)
Total payables 10,181,440 6,334,965 3,846,475 Interest bearing liabilities
Promissory notes 10,110,131 10,264,016 (153,885) Total interest bearing liabilities 10,110,131 10,264,016 (153,885) Provisions
NDRRA Provisions 1,619,217 992,284 626,933 Other provisions 33,616 21,882 11,734
Total provisions 1,652,833 1,014,166 638,667 Total liabilities administered on behalf of
21,944,404 17,613,147 4,331,257 government Net assets 23,239,032 33,173,771 (9,934,739)
1. Treasury’s original budgeted financial statement that was first presented to Parliament in respect of the reporting period (i.e. from the Treasury’s 2020-21 Portfolio Budget Statements (PBS)). 2. Between the actual and original budgeted amounts for 2021. Explanations of major variances (that are greater than +/- 10% of the original budget for a line item and greater than +/- $1 billion) are provided below.
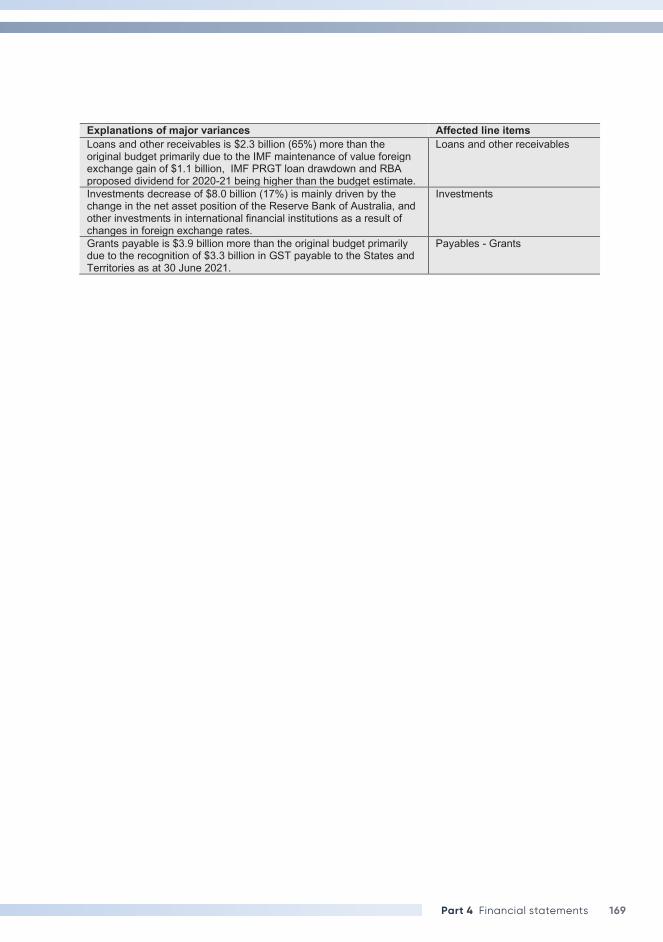
169Part 4 Financial statements
Explanations of major variances Affected line items Loans and other receivables is $2.3 billion (65%) more than the original budget primarily due to the IMF maintenance of value foreign exchange gain of $1.1 billion, IMF PRGT loan drawdown and RBA proposed dividend for 2020-21 being higher than the budget estimate.
Loans and other receivables
Investments decrease of $8.0 billion (17%) is mainly driven by the change in the net asset position of the Reserve Bank of Australia, and other investments in international financial institutions as a result of changes in foreign exchange rates.
Investments
Grants payable is $3.9 billion more than the original budget primarily due to the recognition of $3.3 billion in GST payable to the States and Territories as at 30 June 2021.
Payables - Grants

170 The Treasury Annual Report 2020–21