Embed Size (px)
Citation preview

Part 4: Data Management and Analysis, Reporting and Disseminating Results
Overview
In this Part This Part covers the following topics
Topic See Page
Section 1: Creating the Final Dataset 4-1-1
Section 2: Data Analysis 4-2-1
Section 3: Reporting and Disseminating Results 4-3-1
Section 4: Data Policies and Archiving 4-4-1

Part 4: Data Management and Analysis, Reporting and Disseminating Results 4-1-1
Section 1: Creating the Final Dataset WHO STEPS Surveillance
Last Updated: 7 April 2017
Section 1: Creating the Final Dataset
Overview
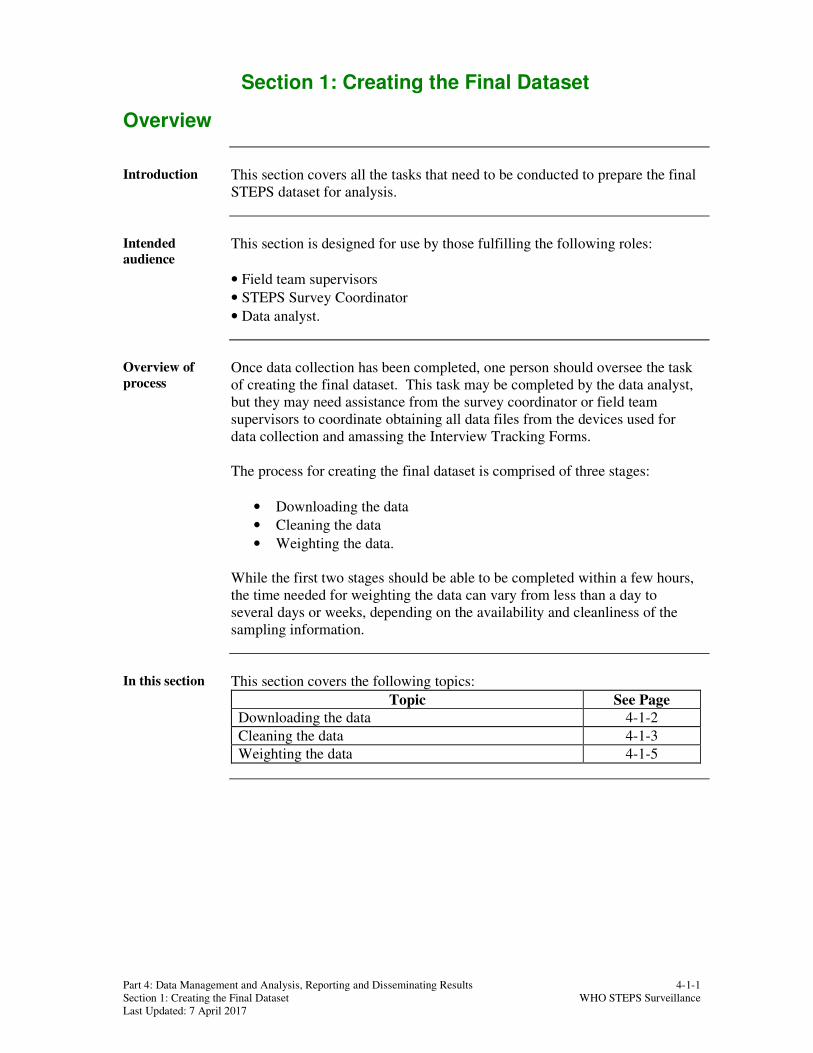
Introduction This section covers all the tasks that need to be conducted to prepare the final
STEPS dataset for analysis.
Intended
audience This section is designed for use by those fulfilling the following roles:
• Field team supervisors
• STEPS Survey Coordinator
• Data analyst.
Overview of
process Once data collection has been completed, one person should oversee the task
of creating the final dataset. This task may be completed by the data analyst,
but they may need assistance from the survey coordinator or field team
supervisors to coordinate obtaining all data files from the devices used for
data collection and amassing the Interview Tracking Forms.
The process for creating the final dataset is comprised of three stages:
• Downloading the data
• Cleaning the data
• Weighting the data.
While the first two stages should be able to be completed within a few hours,
the time needed for weighting the data can vary from less than a day to
several days or weeks, depending on the availability and cleanliness of the
sampling information.
In this section This section covers the following topics:
Topic See Page
Downloading the data 4-1-2
Cleaning the data 4-1-3
Weighting the data 4-1-5

Part 4: Data Management and Analysis, Reporting and Disseminating Results 4-1-2
Section 1: Creating the Final Dataset WHO STEPS Surveillance
Last Updated: 7 April 2017
Downloading the Data
Introduction Prior to downloading the data from the online eSTEPS platform, all Android
devices should be checked to ensure that all completed questionnaires have
been uploaded to the server.
On each device, tap on “Submit Records” from the STEPS home screen
Menu to check if there are any records still to be submitted. Only once this
check has been done on all devices should the data be downloaded.
Procedure Follow the instructions in the table below to download your STEPS data from
the online eSTEPS platform.
Step Description
1 Log into the online eSTEPS platform using your user name and
login.
2
Click on the link to your survey. This will take you to a list of all
instruments associated with your survey.
Note: If there are two instruments for your survey (e.g. one for Step
1 and 2 data and one for Step 3 data) you will need to complete
Steps 2-6 twice, once for each instrument. At the end of this
process, you will have two separate datasets which will need to be
merged together by matching records by Participant ID.
3 Click on the link to your instrument.
4 In the “Export data” box on the screen, choose the format in which
you wish to download your data. Excel is the recommended format.
5 Click on “Show advanced export options” and make sure “Remove
prefixed group names” is not selected.
6 Click on the “Prepare Excel” button just underneath the file type
selection.
7
Wait for the file to be prepared. Once it is ready, you will see a
“Download XLSX” button at the bottom of the Export data box on
the screen. Click on this button to download your data. The file
will automatically be named as follows: [your instrument file
name]_[date]_[time].xlsx. Thus, the date and time of the data
download are automatically included in the name of the file.
Household data While the downloaded data from the online eSTEPS platform already
includes the household size information from the household listings (needed
to weight the data), it is still important to download and review the household
data for your survey as it contains important information pertaining to
participant selection.
Log into the household database of the eSTEPS online platform using the
Survey ID and password for your survey then click on “Download XLS” to
download the household data to a csv file (can be read in Excel).

Part 4: Data Management and Analysis, Reporting and Disseminating Results 4-1-3
Section 1: Creating the Final Dataset WHO STEPS Surveillance
Last Updated: 7 April 2017
Cleaning the Data
Introduction While the STEPS Android app assures a very high level of data quality (i.e.
skips have been properly followed and responses are internally consistent),
there are still errors that can happen during data collection. Described here
are a variety of checks that should be performed on your STEPS dataset.
Participant ID Participant ID (PID) is automatically generated by the STEPS app when the
participant is selected at the household level. If Step 3 data collection occurs
during a follow-up visit to the household or at a nearby location, this PID will
need to be entered by the Step 3 data collector. It is at this point that data
entry errors may occur.
PID should be unique across all records and will serve to align the Step 1 and
2 with Step 3 datasets when Step 3 data is collected separately.
Note: It is possible to incorporate into the local STEPS Instrument a barcode
or QR code as an additional means to label and match records. Contact the
WHO Geneva STEPS team for more information.
Location
variables At the beginning of the STEPS Instrument, there are a few variables that
identify the location of the survey. At minimum there is usually Cluster ID
and Cluster Name, though the names of these variables may be modified in
your local STEPS Instrument and additional variables may be added.
The location variables are critical for weighting the data. An error in Cluster
ID (or the equivalent in your local STEPS Instrument) would mean the wrong
sampling weight is assigned to a given record. Thus, location variables must
be carefully reviewed to assure they are correct. It is also important that the
IDs used to identify sampling units (e.g. villages) in your dataset match the
IDs in the sampling documentation. You will need to review the sampling
information to ensure such alignment.
Open-ended
questions Throughout the STEPS Instrument, there are open-ended questions, such as
the number of manufactured cigarettes smoked per day. While the electronic
STEPS Instrument should have included limits on these fields, these limits are
typically quite generous. Therefore, the responses to these questions should
be reviewed to identify any possible errors. Keep in mind that some
responses may not seem questionable in isolation, but may seem very
questionable when reviewed alongside the participant’s responses to related
questions. For example, a person who smokes 30 manufactured cigarettes a
day may not seem unusual. But if the same person claims to also smoke 30
hand-rolled cigarettes per day and 30 cigars a day, then the response becomes
questionable.
Continued on next page

Part 4: Data Management and Analysis, Reporting and Disseminating Results 4-1-4
Section 1: Creating the Final Dataset WHO STEPS Surveillance
Last Updated: 7 April 2017
Cleaning the Data, Continued
Resolving
errors If possible, try to correct any errors found in the dataset. You can use existing
survey documentation (e.g. sampling documentation, interview tracking
forms) to double check location variables. For errors in questionnaire
responses, it is best to follow up with the field team supervisor(s) to see if the
relevant data collector can clarify. If possible, the participant can also be
contacted to clarify their response.
Do not make any corrections to the dataset until you are certain you have the
correct information. If you are unable to correct questionable data, it is
recommended the data is excluded from the dataset. It is ok to exclude only
part of an individual’s record if the rest of their response does not appear to
have any data entry errors.
Part 4: Data Management and Analysis, Reporting and Disseminating Results 4-1-5
Section 1: Creating the Final Dataset WHO STEPS Surveillance
Last Updated: 7 April 2017
Weighting the Data
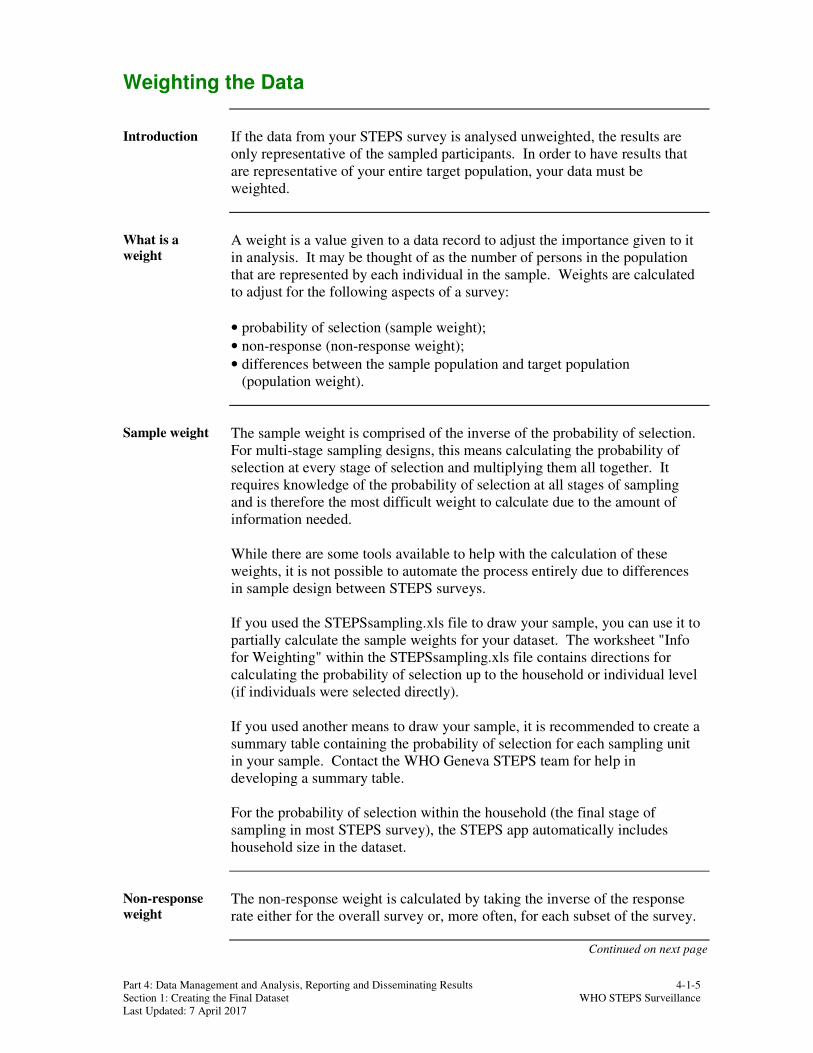
Introduction If the data from your STEPS survey is analysed unweighted, the results are
only representative of the sampled participants. In order to have results that
are representative of your entire target population, your data must be
weighted.
What is a
weight A weight is a value given to a data record to adjust the importance given to it
in analysis. It may be thought of as the number of persons in the population
that are represented by each individual in the sample. Weights are calculated
to adjust for the following aspects of a survey:
• probability of selection (sample weight);
• non-response (non-response weight);
• differences between the sample population and target population
(population weight).
Sample weight The sample weight is comprised of the inverse of the probability of selection.
For multi-stage sampling designs, this means calculating the probability of
selection at every stage of selection and multiplying them all together. It
requires knowledge of the probability of selection at all stages of sampling
and is therefore the most difficult weight to calculate due to the amount of
information needed.
While there are some tools available to help with the calculation of these
weights, it is not possible to automate the process entirely due to differences
in sample design between STEPS surveys.
If you used the STEPSsampling.xls file to draw your sample, you can use it to
partially calculate the sample weights for your dataset. The worksheet "Info
for Weighting" within the STEPSsampling.xls file contains directions for
calculating the probability of selection up to the household or individual level
(if individuals were selected directly).
If you used another means to draw your sample, it is recommended to create a
summary table containing the probability of selection for each sampling unit
in your sample. Contact the WHO Geneva STEPS team for help in
developing a summary table.
For the probability of selection within the household (the final stage of
sampling in most STEPS survey), the STEPS app automatically includes
household size in the dataset.
Non-response
weight The non-response weight is calculated by taking the inverse of the response
rate either for the overall survey or, more often, for each subset of the survey.
Continued on next page

Part 4: Data Management and Analysis, Reporting and Disseminating Results 4-1-6
Section 1: Creating the Final Dataset WHO STEPS Surveillance
Last Updated: 7 April 2017
Weighting the Data, Continued
Non-response
weight (cont.) Non-response weighting is typically done for age and sex, though it can also
be done for any other variables, such as location. Whatever variable is used,
it must fulfil the following requirements:
• the variable should be known to be somehow related to the risk factors
(for example, hair colour likely has little to do with whether or not
people eat enough fruits and vegetables);
• the variable must be known for BOTH responders and non-responders
(for example, years of education would probably not be available from
non-responders).
In surveys like STEPS, in which the age and sex is not known until the
participant is selected during a household visit, it is often difficult to have
complete age and sex information for all non-responders. Therefore a non-
response rate correcting for varying response rates by age-sex group often
cannot be done.
However, it may be of interest in many STEPS surveys to assess response rate
by location (e.g. urban vs rural areas or high vs low socioeconomic areas).
Risk factors may be expected to vary by location and the location of both
responders and non-responders should be known – thus location fulfils the
two criteria listed above. To calculate a non-response weight for location, the
response rate for each location should be calculated and the inverse of this
figure would be applied as the non-response weight for all records from the
location.
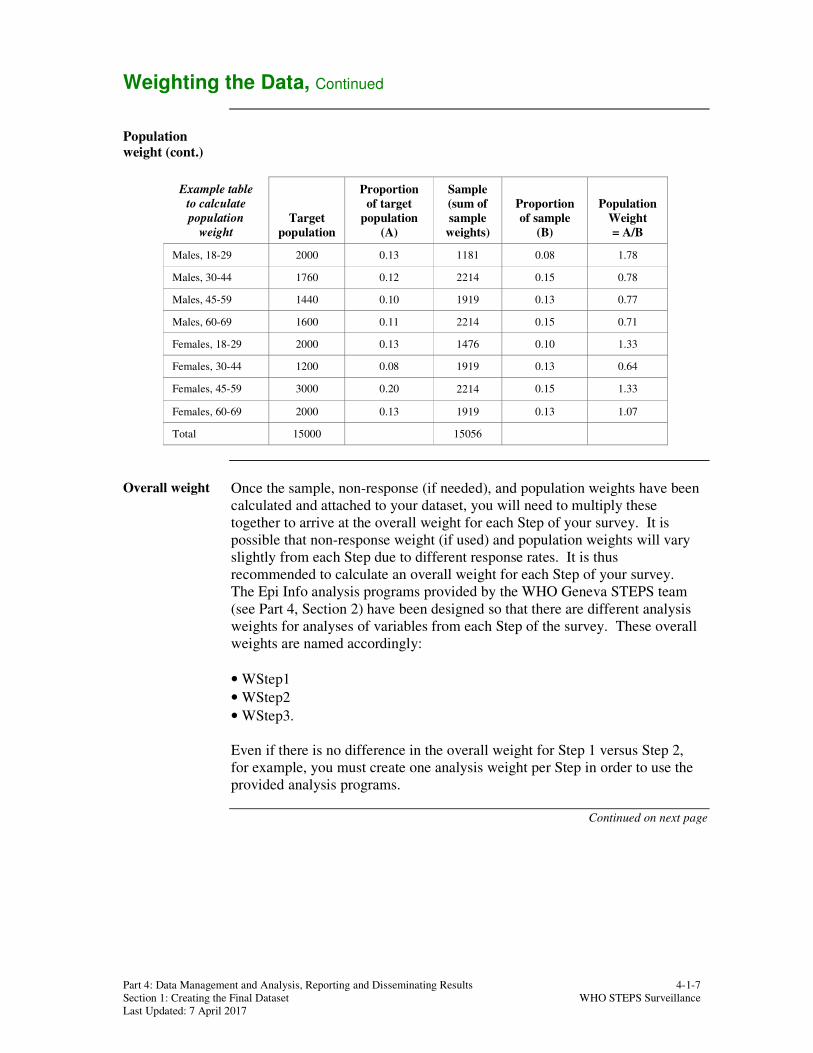
Population
weight The population weight allows for the correction of over- or under-
representation in the sample of the targeted age-sex groups.
In order to calculate the population weight, you can first count the total
number of participants in each of the age-sex groups covered by your survey.
Use the sample weights to attain weighted counts for each age-sex group.
You will then need to use recent Census data or similar to get these same
counts for your underlying target population. Use this information to create a
table like the one below, in which the population weight is shown in the last
column. The columns labelled A and B show the proportion of each age-sex
group in the target population or sample. These are calculated by taking the
number of individuals in that age-sex group and dividing it by the total
number of individuals. The population weight is derived from the ratio of
these two proportions.
Continued on next page
Part 4: Data Management and Analysis, Reporting and Disseminating Results 4-1-7
Section 1: Creating the Final Dataset WHO STEPS Surveillance
Last Updated: 7 April 2017
Weighting the Data, Continued
Population
weight (cont.)
Example table
to calculate
population
weight
Target
population
Proportion
of target
population
(A)
Sample
(sum of
sample
weights)
Proportion
of sample
(B)
Population
Weight
= A/B
Males, 18-29 2000 0.13 1181 0.08 1.78
Males, 30-44 1760 0.12 2214 0.15 0.78
Males, 45-59 1440 0.10 1919 0.13 0.77
Males, 60-69 1600 0.11 2214 0.15 0.71
Females, 18-29 2000 0.13 1476 0.10 1.33
Females, 30-44 1200 0.08 1919 0.13 0.64
Females, 45-59 3000 0.20 2214 0.15 1.33
Females, 60-69 2000 0.13 1919 0.13 1.07
Total 15000 15056
Overall weight Once the sample, non-response (if needed), and population weights have been
calculated and attached to your dataset, you will need to multiply these
together to arrive at the overall weight for each Step of your survey. It is
possible that non-response weight (if used) and population weights will vary
slightly from each Step due to different response rates. It is thus
recommended to calculate an overall weight for each Step of your survey.
The Epi Info analysis programs provided by the WHO Geneva STEPS team
(see Part 4, Section 2) have been designed so that there are different analysis
weights for analyses of variables from each Step of the survey. These overall
weights are named accordingly:
• WStep1
• WStep2
• WStep3.
Even if there is no difference in the overall weight for Step 1 versus Step 2,
for example, you must create one analysis weight per Step in order to use the
provided analysis programs.
Continued on next page

Part 4: Data Management and Analysis, Reporting and Disseminating Results 4-1-8
Section 1: Creating the Final Dataset WHO STEPS Surveillance
Last Updated: 7 April 2017
Weighting the Data, Continued
Stratum and
PSU If your sample design was anything other than a simple random sample, you
will need to create variables that contain information about your sample
design. These variables are conventionally named Stratum and PSU and
their values depend on the sample design of your survey.
PSU typically contains the identifiers of the sampling units above the
household level (e.g. villages, census blocks, or enumeration areas). PSU can
usually be generated by copying the information from your Cluster ID
variable.
Stratum allows you to identify a higher level of clustering in your sample
design, such as province, region, or urban/rural. Using Stratum is optional. If
you do not need it, simply create the Stratum variable and set it equal to 1 for
all records.

Part 4: Data Management and Analysis, Reporting and Disseminating Results 4-2-1
Section 2: Data Analysis WHO STEPS Surveillance
Last Updated: 26 January 2017
Section 2: Data Analysis
Overview
Introduction The WHO STEPS team provides a suite of data analysis tools to assist you
with the analysis of your STEPS data. While using these tools is not required,
it is strongly recommended to use them not only to expedite the data analysis
process but, more importantly, to ensure that the descriptive analysis is
performed in a standardized way. Countries looking to develop their own
data analysis tools or perform more complex analyses, are encouraged to use
the STEPS tools to perform the standard descriptive analysis first.
This section provides a detailed overview of the data analysis tools available
from the WHO STEPS team.
Intended
audience This section is designed for use by those fulfilling the following roles:
• data analyst
• statistical adviser
• STEPS Survey Coordinator.
Statistical
adviser
If the data analyst is not a survey statistician, it is important that he/she has
access to a survey statistician for advice and support. The statistician should
be a member of the STEPS Coordinating Committee and have regular contact
with the data analyst.
If there is not a statistician available or further assistance is required please
contact the WHO Geneva STEPS team at [email protected] .
Data analysis
software It is recommended to use Epi Info for data analysis (version 3.3 or higher),
supplemented by Microsoft Access. (Note that currently Epi Info 7 does not
support Microsoft Access project files containing analysis programs and
therefore cannot yet be used with the STEPS analysis tools.)
Other software packages that are available to the data analysis team may be
considered for statistical analyses. However, any alternative packages must
be able to handle complex sample designs and will not necessarily be
supported by the WHO Geneva STEPS team.
Technical
support The WHO Geneva STEPS team can provide technical assistance and training
for Epi Info and the use of the analysis tools to aid the data analyst in the
cleaning, weighting, and analysis of the data.
Continued on next page

Part 4: Data Management and Analysis, Reporting and Disseminating Results 4-2-2
Section 2: Data Analysis WHO STEPS Surveillance
Last Updated: 26 January 2017
Overview, Continued
Tasks and
timeframes Data analysis cannot begin until the data has been cleaned and weighted (see
Part 4, Section 1). Once that task it complete, the data analysis can be
completed with the standard STEPS tools within the span of a week.
Additional time would be needed if more complex analyses are going to be
done. Note this does not include time to write the survey report (see Part 4,
Section 3).
In this section This section covers the following topics:
Topic See Page
Preparing the Dataset 4-2-3
Epi Info Overview 4-2-5
Completing the Fact Sheet 4-2-8
Completing the Data Book 4-2-9
Part 4: Data Management and Analysis, Reporting and Disseminating Results 4-2-3
Section 2: Data Analysis WHO STEPS Surveillance
Last Updated: 26 January 2017
Preparing the Dataset
Introduction Once the dataset has been cleaned and weighted (see Part 4, Section 1), it
must be prepared for analysis in Epi Info in order to use the standard STEPS
analysis tools.
Epi Info
Analysis
Programs
The standardized analysis programs provided by the STEPS team are
encapsulated in an Access file containing a table of all the Epi Info analysis
programs. This Access file is available on the STEPS website.
Preparing files
and folders Once you have downloaded the Epi Info analysis programs, you must rename
the file “STEPS.mdb”. This file must be located in the following location on
your computer in order for the analysis programs to work:
C:\STEPS\EpiInfo
Additionally, you should create a folder called “Output Tables” and place it in
this folder as well. This is where Epi Info will save all of your analysis
output when you perform your analysis in Epi Info using the provided
programs.
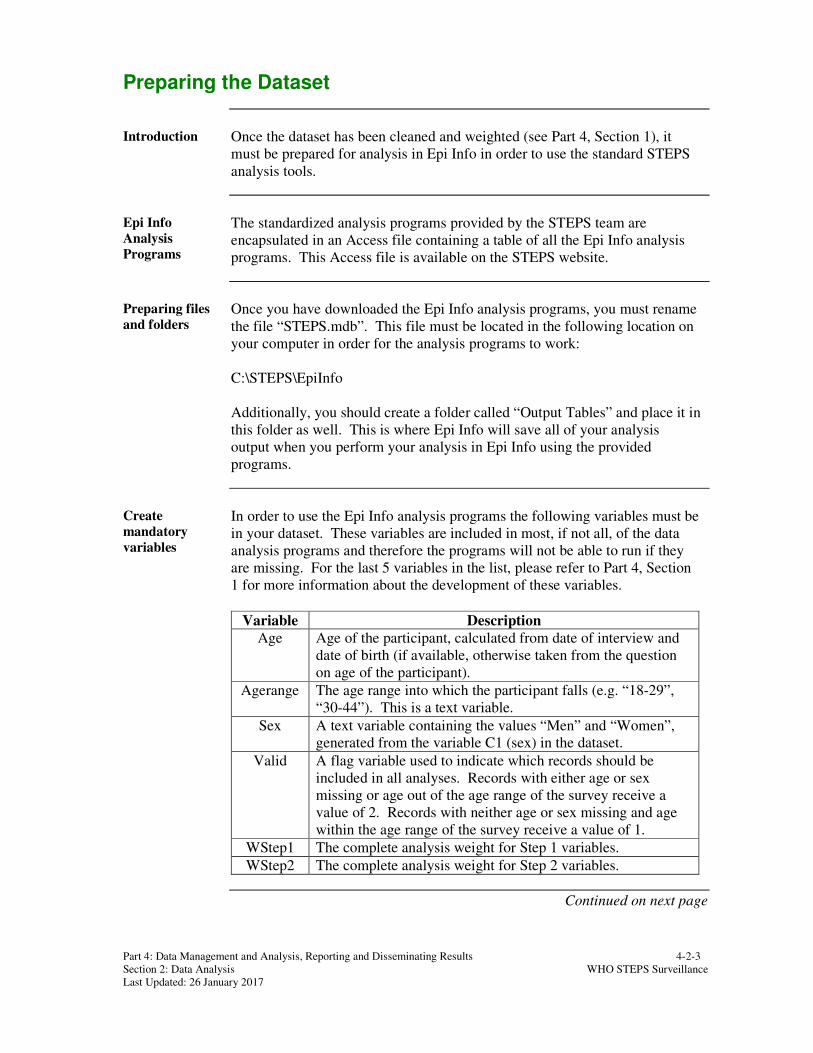
Create
mandatory
variables
In order to use the Epi Info analysis programs the following variables must be
in your dataset. These variables are included in most, if not all, of the data
analysis programs and therefore the programs will not be able to run if they
are missing. For the last 5 variables in the list, please refer to Part 4, Section
1 for more information about the development of these variables.
Variable Description
Age Age of the participant, calculated from date of interview and
date of birth (if available, otherwise taken from the question
on age of the participant).
Agerange The age range into which the participant falls (e.g. “18-29”,
“30-44”). This is a text variable.
Sex A text variable containing the values “Men” and “Women”,
generated from the variable C1 (sex) in the dataset.
Valid A flag variable used to indicate which records should be
included in all analyses. Records with either age or sex
missing or age out of the age range of the survey receive a
value of 2. Records with neither age or sex missing and age
within the age range of the survey receive a value of 1.
WStep1 The complete analysis weight for Step 1 variables.
WStep2 The complete analysis weight for Step 2 variables.
Continued on next page

Part 4: Data Management and Analysis, Reporting and Disseminating Results 4-2-4
Section 2: Data Analysis WHO STEPS Surveillance
Last Updated: 26 January 2017
Preparing the Dataset, Continued
Create
mandatory
variables
(cont.)
Variable Description
WStep3 The complete analysis weight for Step 3 variables.
PSU Unique identifiers for sampling units above the household
level (e.g. villages or enumeration areas).
Stratum Unique identifiers for sampling units above PSU (e.g.
districts, urban/rural). If not needed, simply set Stratum=1 for
all records.
Note that there are simple Epi Info programs included within the provided
analysis programs to generate the first 4 variables in the above table, if you
wish to create these within Epi Info. You will need to run AgeRange 1869
and then MissingAgeSex. The next topic in this Section provides instructions
on how to run programs in Epi Info.
Import data
Once the necessary folders have been created and the STEPS.mdb file has
been placed in the correct location on your computer, you will need to import
your data file into the STEPS.mdb file.
Prior to importing the file, count the number of variables (columns) in your
dataset to confirm the number is not greater than 255 (the maximum
allowable in Microsoft Access). If the number of variables is greater than
255, you will need to split your dataset into two data tables, each with
Participant ID. Please contact the WHO Geneva STEPS team for help with
splitting your dataset and making the necessary modifications to the analysis
programs.
To import your data from Excel to Access, follow the instructions in the table
below.
Step Action
1 Open the STEPS.mdb file and go to the External Data tab. Click on
“Excel” under this tab.
2 In the pop-up window, locate your Excel file and tick the option
“Import the source data into a new table in the current database.”
Click “OK”.
3 Click “Next” on the first screen of the Import Spreadsheet Wizard
pop-up window.
4 Tick the option “First Row Contains Column Headings” and click
“Next”.
5 Click “Next” on the next screen of the pop-up window. Then pick
the option “No primary key” and click “Next”.
6 Enter “MasterDataSet” in the Import to Table field. Click “Finish”.
Contact the WHO STEPS team if your dataset is not already in Excel and you
need assistance converting it to Excel in order to import it into Access.
Part 4: Data Management and Analysis, Reporting and Disseminating Results 4-2-5
Section 2: Data Analysis WHO STEPS Surveillance
Last Updated: 26 January 2017
Epi Info Overview
Introduction Epi Info is a free software package developed by the US Centers for Disease
Control (CDC). While Epi Info has a broad range of functions, we are only
referring to the Analysis module within this guide. Epi Info was chosen over
a decade ago as the statistical software for which the STEPS tools were
designed given that it is free, easy to use, and can appropriately adjust for
complex sample designs.
This overview refers to Epi Info 3.5, which is freely available on US CDC
website and on the STEPS website. (Note that currently Epi Info 7 does not
support Microsoft Access project files containing analysis programs and
therefore cannot yet be used with the STEPS analysis tools.)
Additional
Resources This overview will only cover the basic skills needed to run the analysis
programs and locate and interpret the results. There is a more in-depth Epi
Info Training Guide available on the STEPS website.
Analysis
settings Prior to running any analysis programs, you will need to make a slight change
to the settings of the Epi Info Analysis module in order to have confidence
intervals appear with your weighted analyses.
In the Epi Info Analysis module, click on “Set” at the bottom of the list of
commands down the left-hand side of the screen. Change the Statistics option
to “Advanced” and then click “OK” to save the change. You should only
have to make this change once on your machine.
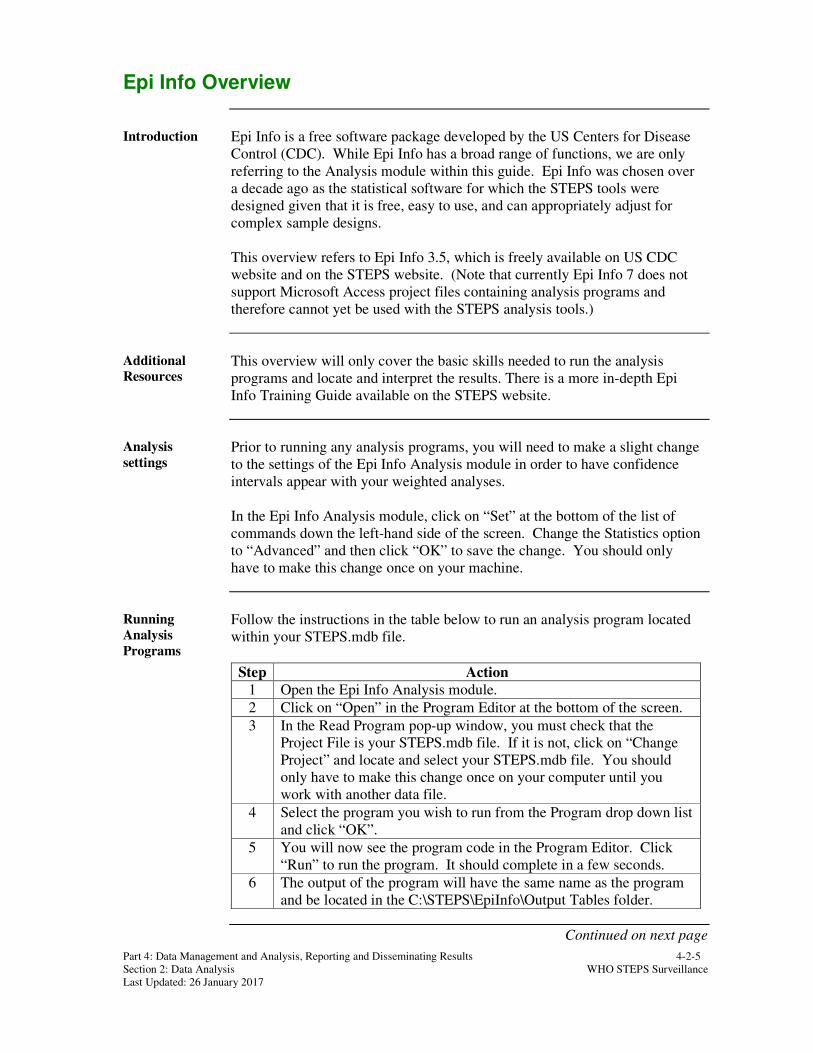
Running
Analysis
Programs
Follow the instructions in the table below to run an analysis program located
within your STEPS.mdb file.
Step Action
1 Open the Epi Info Analysis module.
2 Click on “Open” in the Program Editor at the bottom of the screen.
3 In the Read Program pop-up window, you must check that the
Project File is your STEPS.mdb file. If it is not, click on “Change
Project” and locate and select your STEPS.mdb file. You should
only have to make this change once on your computer until you
work with another data file.
4 Select the program you wish to run from the Program drop down list
and click “OK”.
5 You will now see the program code in the Program Editor. Click
“Run” to run the program. It should complete in a few seconds.
6 The output of the program will have the same name as the program
and be located in the C:\STEPS\EpiInfo\Output Tables folder.
Continued on next page
Part 4: Data Management and Analysis, Reporting and Disseminating Results 4-2-6
Section 2: Data Analysis WHO STEPS Surveillance
Last Updated: 26 January 2017
Epi Info Overview, Continued
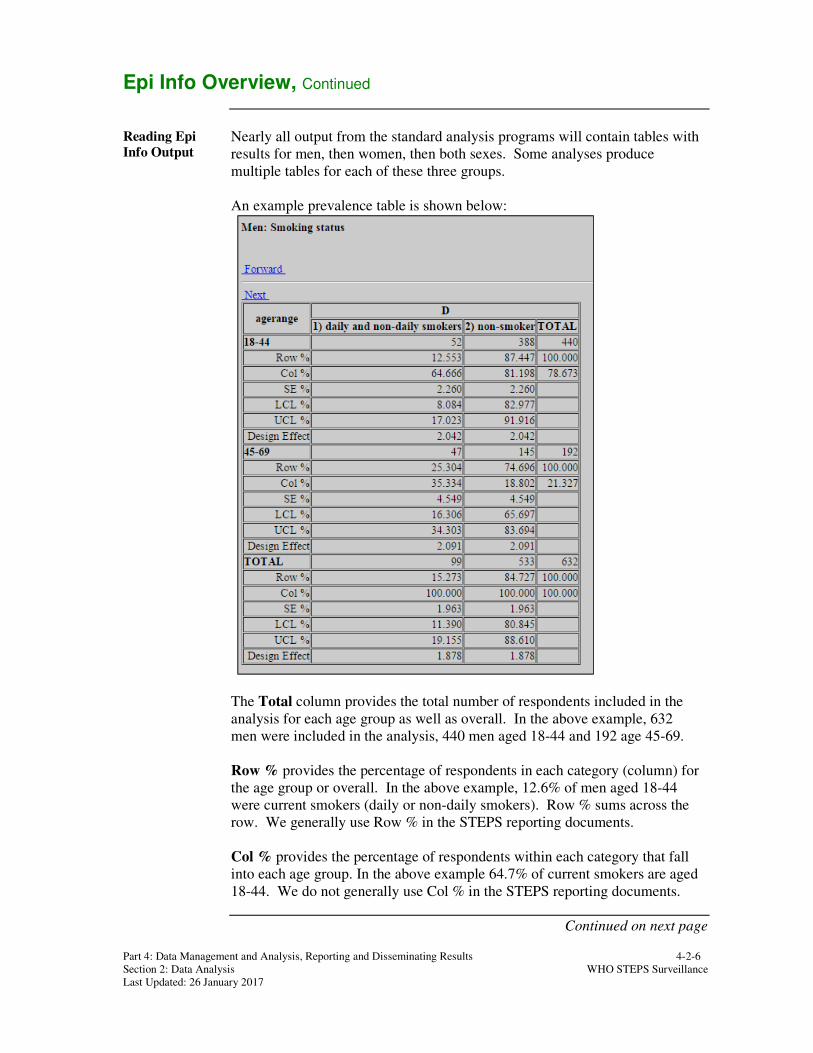
Reading Epi
Info Output Nearly all output from the standard analysis programs will contain tables with
results for men, then women, then both sexes. Some analyses produce
multiple tables for each of these three groups.
An example prevalence table is shown below:
The Total column provides the total number of respondents included in the
analysis for each age group as well as overall. In the above example, 632
men were included in the analysis, 440 men aged 18-44 and 192 age 45-69.
Row % provides the percentage of respondents in each category (column) for
the age group or overall. In the above example, 12.6% of men aged 18-44
were current smokers (daily or non-daily smokers). Row % sums across the
row. We generally use Row % in the STEPS reporting documents.
Col % provides the percentage of respondents within each category that fall
into each age group. In the above example 64.7% of current smokers are aged
18-44. We do not generally use Col % in the STEPS reporting documents.
Continued on next page

Part 4: Data Management and Analysis, Reporting and Disseminating Results 4-2-7
Section 2: Data Analysis WHO STEPS Surveillance
Last Updated: 26 January 2017
Epi Info Overview, Continued
Reading Epi
Info Output
(cont.)
95% confidence intervals are provided in the LCL% and UCL% rows of the
output tables. In the above example, the 95% confidence interval for the
12.6% of men aged 18-44 who currently smoke is 8.1-17.0.
Compacting the
dataset After you have run several analysis programs, your STEPS.mdb file will
expand in size and become very large. When you have finished running your
analysis programs (or if there is a noticeable slow down while you are in the
middle of your analysis programs), close Epi Info and open your STEPS.mdb
file in Access.
To compact your data file back to its usual size, go to the File tab and then
click on “Compact & Repair”. After a few seconds your file should be back
to its usual size.

Part 4: Data Management and Analysis, Reporting and Disseminating Results 4-2-8
Section 2: Data Analysis WHO STEPS Surveillance
Last Updated: 26 January 2017
Completing the Fact Sheet
Introduction The STEPS Fact Sheet is a short summary of key results of the STEPS
survey. It is intended to be distributed widely to draw attention to the survey
results and highlight issues that will be covered in more depth in the survey
report.
The STEPS Fact Sheet template and the STEPS Fact Sheet analysis guide are
located in Part 6, Section 3 of the Manual.
Fact Sheet
layout The STEPS Fact Sheet contains a short paragraph that briefly describes when
and where the STEPS survey has been carried out, the scope of the survey, as
well as age groups covered, overall sample size and response rates, and a
short description of the sampling method. Additionally, at the very end of the
Fact Sheet there are contact details of the country STEPS Survey
Coordinator. Be sure to complete these pieces of text as well as the data
fields.
The main body of the Fact Sheet contains a small number of indicators for
each of the behavioural and metabolic risk factors covered in the survey.
Additionally, there are a few indicators in which behavioural and metabolic
risk factors are combined. For each indicator, results are presented for the
overall sample, for all males and for all females.
Fact Sheet
Analysis Guide The Fact Sheet Analysis Guide has been developed to assist data analysts in
preparing the Fact Sheet. It looks similar to the STEPS Fact Sheet, but
instead of the results columns, it contains one column that displays the
standard question code of the question(s) required to calculate that particular
indicator, and one column that includes the names of the Epi Info program
that needs to be run to produce results for that indicator.
Procedure To complete the STEPS Fact Sheet, it is recommended to first review the Fact
Sheet Analysis Guide to determine which Epi Info programs needs to be run.
If the relevant questions have been dropped from the local STEPS Instrument,
the related line in the Fact Sheet can be removed.
Once all Epi Info analysis programs have been identified, follow the
instructions provided in the Epi Info Overview earlier in this Section to run
each program.
Point estimates (prevalences or means) should be rounded to one decimal
point and be presented with 95% confidence intervals (also rounded to one
decimal point).

Part 4: Data Management and Analysis, Reporting and Disseminating Results 4-2-9
Section 2: Data Analysis WHO STEPS Surveillance
Last Updated: 26 January 2017
Completing the Data Book
Introduction The Data Book is a full tabulation, by age range and sex, of the data from all
the questions and measurements in the STEPS Instrument. It is intended to
serve as the basis for the country report, to guide the writers on what results to
include and highlight in the report. While selected tables may be included in
the body of the country report, it can be included in its entirety as an appendix
to the report.
The template of the STEPS Data Book is located in Part 6, Section 3 of the
Manual. Additional data book pages for the optional modules are available
from the WHO STEPS team or can be downloaded from the STEPS website.
Data Book
layout After the title page and table of contents, the remaining pages of data book
contain for each table of results a title, description of the table (including the
full question text from the questionnaire) and analysis information for the
data analyst. Results are presented in the same order as the questions in the
questionnaire.
The analysis information contains the standard question codes for the
questions required for the given analysis as well as the name of the analysis
program that needs to be run to complete the table. The analysis information
can be deleted once the data book has been completed.
Each of the data tables contains results for each age group for both sexes and
for each sex separately. For each age-sex group in the table, the point
estimate is given (prevalence or mean) along with 95% confidence interval
(except for the demographic information) and the “n” (the total number of
individuals included in the analysis for that age-sex group, for example, the
total number of men aged 18-29 included in the analysis).
Procedure To complete the STEPS Data Book, it is recommended to first review
document to determine which Epi Info programs needs to be run. If the
relevant questions have been dropped from the local STEPS Instrument, the
related table(s) can be removed. Additionally, if after running an analysis
program the “n” is very small (i.e. less than 50 respondents), you can either
delete the entire table or, if there are enough respondents, only show results
for the overall age group.
Once all Epi Info analysis programs have been identified, follow the
instructions provided in the Epi Info Overview earlier in this Section to run
each program.
Both the point estimates (prevalences or means) and the 95% confidence
intervals should be rounded to one decimal point.
Continued on next page

Part 4: Data Management and Analysis, Reporting and Disseminating Results 4-2-10
Section 2: Data Analysis WHO STEPS Surveillance
Last Updated: 26 January 2017
Completing the Data Book, Continued
Formatting
macros There are formatting macros available from the WHO Geneva STEPS team to
assist you in putting together your Data Book. These macros are located in
two separate Excel files, one containing macros to format unweighted tables,
the other containing macros to format weighted tables. Be sure only one of
these is open on your computer at a time, else the macros may not work
correctly.
To format a table from the Epi Info output, follow the instructions in the table
below:
Step Action
1 Copy the entire table from Epi Info and paste it into cell A1 in the
PASTE sheet of the Excel macro file.
2 Run the macro that corresponds to your particular table. Refer to
the Instructions sheet in the Excel file to see which macro should be
run. Which macro to run depends on the type and size of the output
table. For example, to format a means output table, press ctrl + m
while on the PASTE sheet to run the macro.
3 The macro should take a few seconds to run at most. Once it is
completed, you will have a formatted table you can now copy and
paste directly into the corresponding table in the Data Book. Be
sure to highlight all the relevant squares in the Data Book table
before pasting.

Part 4: Data Management and Analysis, Reporting and Disseminating Results 4-3-1
Section 3: Reporting and Disseminating Results WHO STEPS Surveillance
Last Updated: 26 January 2017
Section 3: Reporting and Disseminating Results
Overview
Introduction This section covers the tasks that are needed to prepare reports and
disseminate the results of your STEPS survey.
Requirement The reports need to be produced in a timely manner after the completion of
your survey. The results should be presented in a clear, concise and usable
way to help:
• raise awareness about preventing NCDs and their risk factors
• guide public health policy and interventions to address NCDs
• assist and inform future health research.
Intended
audience This section is primarily designed to be used by those fulfilling the following
roles:
• STEPS Survey Coordinator
• data analyst
• STEPS Coordinating Committee.
Useful
resources Some sections of the manual that may be useful in compiling and
disseminating the results include:
• Part 1, Section 1 : "Introduction";
• Part 2, Section 2 : "Preparing the Sample";
• Part 4, Section 2: “Data Analysis”
• Part 6, Section 3A-D: "Report Templates" (includes Fact Sheet, Data Book,
Country Report Template);
• Part 7, Section 1: "Glossary".
Continued on next page

Part 4: Data Management and Analysis, Reporting and Disseminating Results 4-3-2
Section 3: Reporting and Disseminating Results WHO STEPS Surveillance
Last Updated: 26 January 2017
Overview, Continued
Reporting
process The table below shows each of the key stages in the reporting process once
data have been checked, cleaned, weighted and analyzed.
Stage Description
1 Preparing and distributing the Fact Sheet to cover the essential
results.
2 Preparing the Data Book.
3 Extracting specific tables from the Data Book that are suitably
weighted and needed for the main country report.
4 Drafting the main country report, section by section, based on the
content guidelines (see Part 6, Section 3D) and Data Book.
5 Circulating drafts of the country report to members of the
coordinating committee, WHO and other interested parties for
comment, discussion and review.
6 Reviewing and finalizing the country report in light of comments
and discussions.
7 Preparing circulation lists, preparing press releases and promotion
fliers to announce results of the STEPS Survey.
8 Presenting results, through slide presentations and meetings with
organizations and groups that have an interest and impact on
population health including relevant government departments,
sponsors, tertiary institutions and health conferences in order to
widen awareness of the STEPS findings.
In this section This section covers the following topics.
Topic See Page
Summarizing and Displaying Data 4-3-3
Interpretation of Results 4-3-5
Preparing and Distributing the Country Report 4-3-6

Part 4: Data Management and Analysis, Reporting and Disseminating Results 4-3-3
Section 3: Reporting and Disseminating Results WHO STEPS Surveillance
Last Updated: 26 January 2017
Summarizing and Displaying Data
Introduction STEPS data on NCD risk factors that have been collected from individuals
need to be summarized in a meaningful way in order to give relevant
information on levels of risk factors in a population.
Summary statistics that are used for summarizing STEPS data include:
• mean
• median
• prevalence.
When using the STEPS EpiInfo Programs, your output tables will display
these summary statistics. The three summary statistics are described in more
detail below.
Mean The mean is a measure of central tendency and is computed by adding all the
individual values in the group and dividing by the number of values in the
group. It gives information on a population's average of a specified variable,
such as waist circumference or blood sugar level.
Median The median is another measure of central tendency that is often used for non-
normally distributed variables. It is the simplest division of a set of sorted
measurements into two halves - the lower and the upper half.
The median is often reported along with the 25th
and 75th
percentiles, which
are the values that separate the lowest 25% and highest 75% of values,
respectively, in the set of measurements.
Prevalence Prevalence is defined as the number of persons with a disease or an attribute
in a given population at a designated time, e.g. % daily smoker in a country in
2015.
Standard error
and Confidence
Interval (CI)
All results from your STEPS survey, as in all sample-based surveys, are
estimates of true values, since they derive from a sample and not from the
target population (for more on sampling, see Part 2, Section 2). In order to
give information on how uncertain estimated values are, confidence intervals
are computed around the estimate.
A standard error is usually calculated to show the amount of uncertainty, or
error, in an estimated value. It takes into consideration the sample size and
distribution (standard deviation) of your sample. The larger the standard error
the larger the uncertainty in your estimate and the larger your confidence
intervals.
Continued on next page
Part 4: Data Management and Analysis, Reporting and Disseminating Results 4-3-4
Section 3: Reporting and Disseminating Results WHO STEPS Surveillance
Last Updated: 26 January 2017
Summarizing and Displaying Data, Continued
Standard error
and Confidence
Interval (CI)
(cont.)
A confidence interval shows the range of estimates that would be obtained
were all possible samples used. A 95% CI suggests that if 100 samples were
drawn, the estimate obtained from each (a mean or prevalence value) would
fall within that interval 95 of 100 times.
It is strongly recommended to always include the confidence interval
alongside any estimates when presenting your data.
Standard cut-
offs for
prevalence
In order to determine the prevalence of those persons in a specified
population that are at risk to develop an NCD, cut-off points have been set for
continuous variables to distinguish between "at risk" and "not at risk".
STEPS uses cut-offs that are evidence-based, widely used and therefore
recommended by the WHO. Refer to the STEPS Fact Sheet (Part 6, Section
3A) and STEPS Data Book (Part 6, Section 3C) to see the cut-offs used in the
standard STEPS analysis.
Guidelines for
making good
tables and
graphs
The general guidelines below may help when preparing tables and graphs.
• Each table or graph should contain enough information so that it can be
interpreted without reference to the text.
• Titles of tables and graphs should specifically describe the numbers
included.
• Decide on the point you wish to present, then choose the appropriate
method.
• Specify the units being used clearly.
• Include the total number of respondents included in the analysis (i.e. the
denominator or the “n”).
• Include confidence intervals, if available.
PowerPoint
Presentation There is a useful PowerPoint presentation available on the STEPS website
that provides further information on summarizing and displaying your data. It
also includes examples of poorly-designed and well-designed graphs.

Part 4: Data Management and Analysis, Reporting and Disseminating Results 4-3-5
Section 3: Reporting and Disseminating Results WHO STEPS Surveillance
Last Updated: 26 January 2017
Interpretation of Results
Introduction In order to deliver a meaningful message, results need to be interpreted
carefully. A variety of factors such as response rates, season of data
collection or potential biases need to be thought through and taken into
account when interpreting results. Below are a few points to consider when
interpreting the results of your survey.
Represen-
tativeness of
results
Results should only be applied to the surveyed target population, and not be
generalized to a broader population. In addition to taking into consideration
the coverage of the survey (both geographically and demographically), it is
important to look at the response rate of your survey and ask if there is any
pattern in the non-response, i.e. do certain regions have very low response
rates?, is there a particular age-sex group severely under-represented in the
sample?
Uncertainty of
results Confidence intervals help to determine the uncertainty of the estimates. The
smaller the interval, the better. Large intervals are generally due to small
sample size (either overall or for particular age-sex groups) or poor sampling
design (e.g. highly clustered sample).
Influence on
results Think through carefully what could have influenced the results when
interpreting them. Potential influence factors include:
• sample sizes (Are they high enough to have produced robust results for all
subgroups?);
• response rates (Are they high or low? Are they the same for all subgroups,
or have some subgroups lower response rates than others? If so, why?);
• social pressure (May people have answered in a specific way to certain
questions because of social desirability?);
• survey methodology (Could flaws/problems in survey methods have
influenced results, e.g. problems in reaching working population during data
collection?);
• participant comprehension (Are there specific questions in the questionnaire
that seemed not to be understood by respondents?);
• season of data collection (Do certain behaviors, such as diet or physical
activity patterns, vary with the season?).
Results in a
context When interpreting results, it is useful to put results in a context. As an
example, you may want to find out about the amount of cigarettes being sold
when looking into results for prevalence of cigarette smokers in a country.
Additionally, you should seek out comparable results from other surveys of
the same population.

Part 4: Data Management and Analysis, Reporting and Disseminating Results 4-3-6
Section 3: Reporting and Disseminating Results WHO STEPS Surveillance
Last Updated: 26 January 2017
Preparing and Distributing the Country Report
Introduction The country report is the main comprehensive report for the whole STEPS
NCD risk factor survey and must be produced at the end of the STEPS
survey. The STEPS Fact Sheet and STEPS Data Book should be completed
prior to beginning work on the country report. Use these documents to guide
the development of the country report. Additionally, be sure to have the latest
copy of the implementation plan for your survey as much of the plan can re-
used in the country report.
A template that helps preparing the STEPS country report is in Part 6, Section
3D.
Purpose Use the country report to present the following information:
• the overall rationale;
• scope of the survey;
• the sampling design used;
• detailed methods of data collection;
• detailed results of the survey;
• implications for future health and planning;
• appendices including the country-specific instrument, show cards and data
book.
Intended
audience It is recommended that you distribute the country report widely. Consider
sending copies to:
• relevant government bodies and sponsoring organizations;
• agencies and organizations that are likely to use the information to promote
NCD prevention and control;
• public, governmental and institutional (university) libraries;
• press and other media (newspapers, radio and television);
• websites of any sponsoring bodies;
• WHO STEPS Regional Office and the WHO Geneva STEPS team.

Part 4: Data Management and Analysis, Reporting and Disseminating Results 4-4-1
Section 4: Archiving WHO STEPS Surveillance
Last Updated: 27 January 2017
Section 4: Data Policies and Archiving
Overview
Introduction This section covers data policies and procedures, as well as archiving your
STEPS materials.
Intended
audience This section is primarily designed to be used by those fulfilling the following
roles:
• STEPS Survey Coordinator
• STEPS Coordinating Committee.
Useful
resources Please contact the WHO Geneva STEPS team for a copy of the STEPS Data
Policy and Procedures document.
In this section This section covers the following topics:
Topic See Page
Data Policy and Procedures 4-4-2
Archiving your STEPS Materials 4-4-3

Part 4: Data Management and Analysis, Reporting and Disseminating Results 4-4-2
Section 4: Archiving WHO STEPS Surveillance
Last Updated: 27 January 2017
Data Policy and Procedures
STEPS data
policy and
procedures
document
As part of the collaboration between the implementing country, the survey
team, WHO and other stakeholders, it is recommended to have all involved
parties sign the STEPS Data Policy and Procedures document.
The document is available from the WHO Geneva STEPS team upon request,
and provides guidance on data policy and sharing, information exchange and
publication procedures.
Principles The STEPS data and publication policies and procedures are based on the
following guiding principles:
• STEPS data are owned by the official country-level agency (in most cases
the MOH) conducting or sponsoring the survey. Major decisions regarding
data release, data sharing, and data reporting are the responsibility of the
agency in which data ownership is invested.
• The privacy of participating subjects must be protected.
• Data quality must be maintained.
• Public health and scientific advancement are best served by an open and
timely exchange of data and data analyses.
Data release The STEPS Survey Coordinator will deal with practical issues regarding
ownership and release of STEPS data. If the STEPS Survey Coordinator
moves to another institution before the survey results are made public, he/she
cannot take the data with him/her.
Data sharing In the interests of advancing public health knowledge about the risk factors
measured in STEPS, WHO encourages countries to make datasets and reports
from STEPS surveys available in the public domain after a defined period of
time after completion of the survey.
Sharing data in public domain can be done through a variety of modes,
including:
• WHO Global Data Coordinating Centre
• publications
• websites.

Part 4: Data Management and Analysis, Reporting and Disseminating Results 4-4-3
Section 4: Archiving WHO STEPS Surveillance
Last Updated: 27 January 2017
Archiving your STEPS Materials
Introduction Once the survey is completed and before the team is disbanded, all records
need to be properly stored in order to prevent loss.
Policies and
systems Most governments and large organisations will have their own established
archival systems, in which case their facilities are likely to be your best long-
term storage option. Investigate storing your data at:
• Ministry of Health
• WHO country office
• WHO regional office.
Archival period Decide on the archival period. The duration may have been specified by
your ethics authority. If not, consider twelve years. This is long enough for
data to be available for further STEPS surveys, and long enough to
investigate query from the results. You may wish to have a different period
for soft (i.e. electronic) vs hard (i.e. printed) documents and files.
Checklist Use the checklist below to help ensure all necessary steps have been completed.
Step Action ����
1 Decide on the duration of storage.
2 Include in the storage:
• At least one hard copy of all data collection forms
• The completed interview tracking forms
• Soft copies of all forms
• Soft copies of the final dataset and all documentation of the
weighting and analysis.
3 Label the box(es) clearly with:
• name and date of the project;
• contents;
• names and contact details of survey coordinator and one
other member of the coordinating committee.
4 Determine who is entitled to have access to the archive.
5 Place a copy of the form to apply for access in each box.
6 Provide copies of electronic files (without personal identifiers)
to WHO Geneva STEPS team.
7 Inform all interested parties where the information is stored.
Note: Make sure that participant identification information is never stored in
the same location (electronically and in paper form) with the rest of the
dataset.