Embed Size (px)
Citation preview

PART 3: TRAINER’S GUIDE
IntroductionThe trainer’s guide is part three of four parts contained in this module. It is NOT a training course. Rather it provides guidance onhow to design a training course by giving tips and examples of tools that the trainer can adapt. The trainer’s guide should onlybe used by experienced trainers to help develop a training course which meets the needs of a specific audience. The trainer’sguide is linked to the technical information found in part two of the module.
Module 9 is about the concepts of food security and the different food security assessment approaches that have been used inemergency contexts. Participants should be made aware of the fact that food security is usually considered within the widercontext of livelihoods. There is no single standard way of doing a food security assessment in an emergency so the objective ofthe module is to raise participants’ awareness of the importance of understanding the food security and livelihoods situationdifferent approaches and their potential uses in a variety of scenarios. Participants need to have an understanding of somebasic food security concepts and the different tools that are used to gather food security information. The importance ofincorporating nutrition information within food security analysis should be highlighted.
Navigating your way round these materialsThe trainer’s guide is divided into six sections:
1. Tips for trainer provide pointers on how to prepare for and organise a training course.
2. Learning objectives sets out examples of learning objectives for this module that can be adapted for a particularparticipant group.
3. Testing knowledge contains an example of a questionnaire that can be used to test participants’ knowledge of foodsecurity either at the start or at the end of a training course.
4. Classroom exercises provide examples of practical exercises that can be carried out in a classroom context either byparticipants individually or in groups.
5. Case studies contain examples of case studies (one from Africa and one from a different continent) that can be used toget participants thinking through real-life scenarios.
6. Field-based exercises outline ideas for field visits that may be carried out during a longer training course.
1
MODULE 9
HTP, Version 2, 2011
Food security assessment and the link with nutrition
2
TRAINER’S GUIDE
MODULE 9
HTP, Version 2, 2011
Food security assessment and the link with nutrition
CONTENTS
1. Tips for trainers
2. Learning objectives
3. Testing knowledge
Exercise 1: What do you know about food security and its assessment? Questionnaire
Handout 1a: What do you know about food security and its assessment? Questionnaire
Handout 1b: What do you know about food security and its assessment? Questionnaire (Answers)
4. Classroom exercises
Exercise 2: Identifying the three pillars of food security
Handout 2a: Identifying the three pillars of food security: Darfur 2006
Handout 2b: Identifying the three pillars of food security: Darfur 2006 (Model answer)
Exercise 3: Impact of an emergency on household food and income
Handout 3a: Impact of an emergency on household food and income: Ethiopia 2001
Handout 3b: Impact of an emergency on household food and income: Ethiopia 2001 (Model answer)
Exercise 4: Collecting 24 hour food frequency data
Handout 4a: 24 hour food frequency questionnaire
Handout 4b: 24 hour food frequency data: Bosnia 1993
Handout 4c: 24 hour food frequency data: Bosnia 1993 (Model answer)
5. Case studies
Exercise 5: Case Study on linking food security and nutrition data
Handout 5a: Linking food security and nutrition data: Afghanistan 2001
Handout 5b: Linking food security and nutrition data: Afghanistan 2001 (Model answer)
Handout 5c: Linking food security and nutrition data: Zimbabwe 2002
Handout 5d: Linking food security and nutrition data: Zimbabwe 2002 (Model answer)
6. Field-based exercises

3
TRAINER’S GUIDE
MODULE 9
HTP, Version 2, 2011
Food security assessment and the link with nutrition
Tips for trainers
Step 1: Do the reading!• Read Parts 1 and 2 of this module.
• Familiarise yourself with the technical terms from the glossary.
• Read through the following key document:
° WFP Distance Learning Package for EFSA (http://fsa.wfp.org/learning)
° SC UK and FEG consulting (2008). The Household Economy Approach.
° IFRC (2006). How to Conduct a Food Security Assessment: A Step-by-Step Guide for National Societies in Africa.Second edition Geneva: IFRC.
° FAO Food Security Information for Decision Making. Distance Learning Material. (www.foodsec.org)
Step 2: Know your audience!• Find out about your participants in advance of the training:
° How many participants will there be?
° Do any of the participants already have experience of doing food security assessments?
° Could participants with food security assessment experience be involved in the sessions by preparing a case study orcontribute through describing their practical experience?
Step 3: Design the training!• Decide on the objectives of the training: do participants just need to understand basic food security concepts or will
they be involved in the assessment? Will the field workers also be involved in data analysis and interpretation?
• Decide how long the training will be and therefore what activities you can cover within the time available.In general the following guide can be used:
° A 90 minute classroom-based training can provide a basic overview of the concepts of food security andits assessment.
° A half day classroom-based training can provide an overview of some approaches to food security and livelihoodassessment and include some practical exercise.
° A 1 day classroom-based training can provide a more in depth understanding of food security assessment andinclude a number of practical exercises and/or one case study.
° A 3-8 day classroom plus field-based training can provide a full training as preparation to carry out an actualassessment suitable for a particular context. This would include case studies and field practical exercises.A further 1-2 days after the field work can support participants to analyse and interpret the results.
1. Identify appropriate learning objectives. This will depend on your participants, their level of understanding andexperience, and the aim and length of the training.
2. Decide exactly which technical points to cover based on the learning objectives that you have identified.
3. Divide the training into manageable ‘chunks’. One session should generally not last longer than an hour.
4. Ensure the training is a good mix of activities i.e. mix powerpoint presentations in plenary with more active participationthrough classroom-based exercises, mix individual work with group work.

4
TRAINER’S GUIDE
MODULE 9
HTP, Version 2, 2011
Food security assessment and the link with nutrition
Step 4: Get prepared!• Prepare PowerPoint presentations with notes (if they are going to be used) in advance and do a trial run.
Recommended PowerPoint presentations that can be adapted are:
° FAO (2007). FAO Food Security Information for Action Distance Learning Material – Food Security Information Systemsand Networks; Reporting Food Security
° Sphere (2010). The Sphere Project Handbook: Humanitarian Charter and Minimum Standards in Disaster Response.
• Prepare flipcharts and marker pens to record key points during presentations and plenary sessions.
• Prepare exercises and case studies. These can be based on the examples given in this trainers’ guide but should beadapted to be suitable for the particular training context.
• Prepare material for the participants (one copy each) to be given out at the start of the training. This should include:
° Timetable showing break times (coffee and lunch) and individual sessions
° Parts 1 and 2 from this module
• Ensure participants are provided with pens and paper, and calculator (if necessary).
REMEMBER
People remember 20% of what they are told, 40% of what they are told and read, and 80% of what they find out forthemselves.
People learn differently. They learn from what they read, what they hear, what they see, what they discuss with othersand what they explain to others. A good training is therefore one that offers a variety of learning methods which suit thevariety of individuals in any group. Such variety will also help reinforce messages and ideas so that they are more likelyto be learned.
5
TRAINER’S GUIDE
MODULE 9
HTP, Version 2, 2011
Food security assessment and the link with nutrition
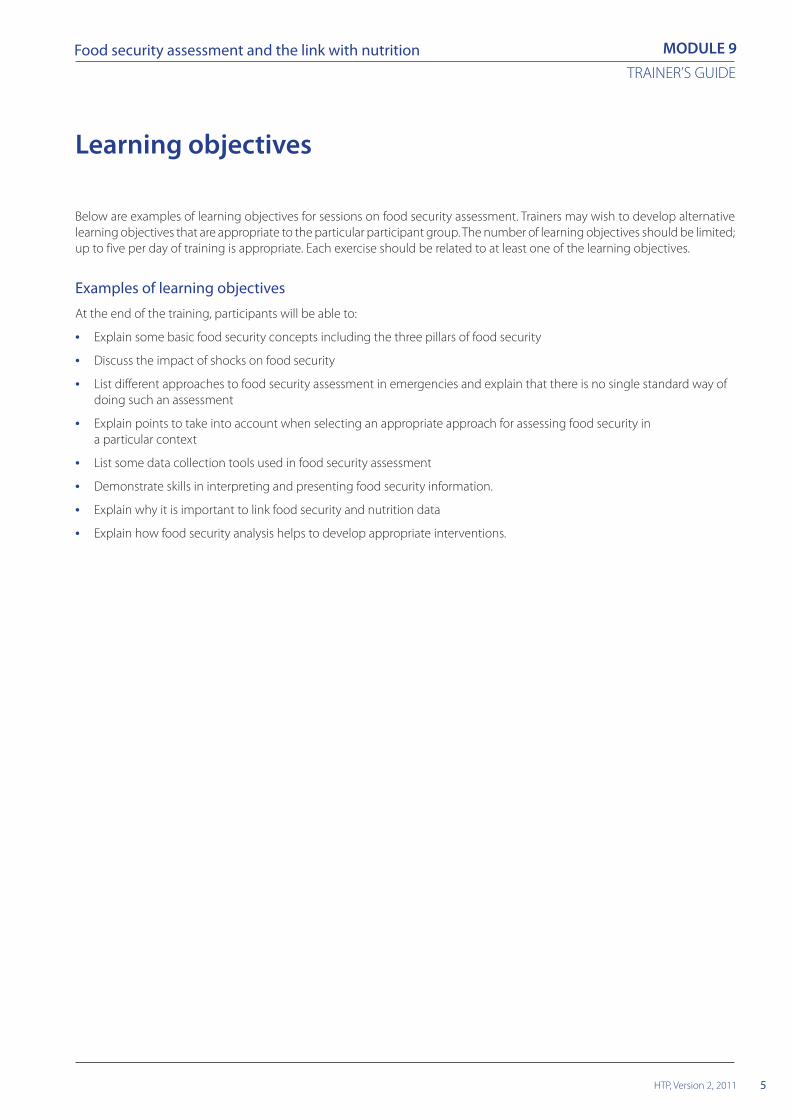
Learning objectives
Below are examples of learning objectives for sessions on food security assessment. Trainers may wish to develop alternativelearning objectives that are appropriate to the particular participant group. The number of learning objectives should be limited;up to five per day of training is appropriate. Each exercise should be related to at least one of the learning objectives.
Examples of learning objectives
At the end of the training, participants will be able to:
• Explain some basic food security concepts including the three pillars of food security
• Discuss the impact of shocks on food security
• List different approaches to food security assessment in emergencies and explain that there is no single standard way ofdoing such an assessment
• Explain points to take into account when selecting an appropriate approach for assessing food security ina particular context
• List some data collection tools used in food security assessment
• Demonstrate skills in interpreting and presenting food security information.
• Explain why it is important to link food security and nutrition data
• Explain how food security analysis helps to develop appropriate interventions.

6
TRAINER’S GUIDE
MODULE 9
HTP, Version 2, 2011
Food security assessment and the link with nutrition
Testing knowledge
This section contains one exercise which is an example of a questionnaire that can be used to test participants’ knowledge offood security either at the start or at the end of a training session. The questionnaire can be adapted by the trainer to includequestions relevant to the specific participant group.
Exercise 1: What do you know about food security and its assessment? Questionnaire
What is the learning objective?
• Participants demonstrate their knowledge of food security and its assessment.
When should this exercise be done?
• Either at the start of a training session to establish knowledge level.
• Or at the end of a training session to check how much participants’ have learned
How long should the exercise take?
• 20 minutes
What materials are needed?
• Handout 1a: What do you know about food security and its assessment? Questionnaire
• Handout 1b: What do you know about food security and its assessment? Answers to questionnaire
What does the trainer need to prepare?
• Familiarise yourself with the questionnaire questions and answers.
• Add your own questions and answers based on your knowledge of the participants and their knowledge base.
Instructions
Step 1: Give each participant a copy of handout 1a
Step 2: Give participants 15 minutes to complete the questionnaire working alone
Step 3: Give each participant a copy of handout 1b
Step 4: Give participants 5 minutes to mark their own questionnaires and clarify the answers where necessary.

7
TRAINER’S GUIDE
MODULE 9
HTP, Version 2, 2011
Food security assessment and the link with nutrition
Handout 1a: What do you know about food security and its assessment?Questionnaire
Time for completion: 20 minutes
Answer This exercise relates to all learning objectives cited above
Answer all the questions
1. What is the best definition of food security? Circle the correct answer
a) Food security exists when there is enough available food for all people at all times.
b) Food security exists when all people are well nourished.
c) Food security exists when all people, at all times, have physical and economic access to sufficient,safe and nutritious food for a healthy and active life
2. What is a coping strategy? Circle the correct answer
a) A coping strategy is a short-term response to shock. Early coping strategies are not necessarily abnormal and may notcause lasting damage to the household. Later strategies may permanently undermine future household food security.
b) A coping strategy is an abnormal response to shock which always causes long-term damage to the household.
c) A coping strategy is a normal response during times of shortage and households are always able to recover.
3. What are the three pillars of food security? Write your answer
a)
b)
c)
4. Are the following statements true or false? Write TRUE or FALSE after each sentence
a) There is no single standard way of collecting food security information in emergencies.
b) Food security assessment approaches generally collect a mixture of quantitative and qualitative information.
c) All food security assessment approaches use the same methods to collect and analyse information.
d) Agencies have an agreed set of food security indicators that are always collected in a food security assessment
e) Food security assessments should be able to forecast future insecurity
f ) There is no single indicator that can adequately measure food security
5. What is the difference between these key food security terms? Write your answer:
a) Access and availability
b) Access and utilisation
6. What is the importance of the following in relation to food security? Write your answer:
a) Seasonality
b) Markets
c) Livelihoods
7. Why is lack of standardisation in food security assessments problematic? Write TRUE or FALSE after each sentence
a) Lack of standardisation makes it difficult to compare different assessment findings within and between countries.
b) Lack of standardisation means that the findings from food security assessments are never reliable.

8
TRAINER’S GUIDE
MODULE 9
HTP, Version 2, 2011
Food security assessment and the link with nutrition
8. What are the differences between anthropometric surveys and food security assessments in the following concepts?Write your answer:
a) Unit of observation/measurement
b) Time frame that the results refer to
c) Socio-economic status
9. Give three ways to collect primary data in a food security assessment? Write your answer
a)
b)
c)

9
TRAINER’S GUIDE
MODULE 9
HTP, Version 2, 2011
Food security assessment and the link with nutrition
Handout 1b: What do you know about food security and its assessment?Questionnaire (Answers)
1. c)
2. a)
3. Food availability, accessibility and utilization
4. a) TRUE
b) TRUE
c) FALSE
d) FALSE
e) TRUE
f) TRUE
5. a) Access and availability: availability relates only to the physical presence of the food eg the harvest or in themarkets. Access relates to whether households are able to get this food to eat; for example do they have theright to consume the harvest, can they afford to purchase food at the market?
b) Access and utilisation: Access relates to whether households have the food (see part a above) whileutilisation refers to how the food is stored and processed, how it is shared within the household, comparedwith each person’s nutrient requirements. Utilisation also includes biological use, which is linkedto a person’s health.
6. a) The activities that people do to get food or to earn money, the prices they pay and the foods and incomegenerating activities that are available to them are determined by the season.
b) Prices for food and labour are critical in determining household access to food. Most major food securitycrises have involved major market disruption.
c) A livelihood comprises the capabilities, assets (stores, resources, claims and access) and activities requiredfor a means of living. Households are assumed to have different types of assets and to adopt livelihoodstrategies to achieve livelihood outcomes. Food security is one of these outcomes.
7. a) TRUE
b) FALSE
8. a) Anthropometric assessment usually measures the individual child (or mother) while food securityassessment considers the whole household
b) Anthropometric assessment measures a particular point in time. A food security assessment usually refersto a much longer time period eg the past year. (Note that a diet survey usually relates to the previousday or week).
c) Results of anthropometric surveys usually refer to the prevalence in the entire population while some(but not all) food security assessments disaggregate their results by wealth group.
9. Questionnaires, Observation, Measurement, Interviews, Seasonal calendar, Wealth ranking, Proportional piling…
10
TRAINER’S GUIDE
MODULE 9
HTP, Version 2, 2011
Food security assessment and the link with nutrition
What are the learning objectives?
• Participants can describe the three pillars of food security, with examples
When should this exercise be done?
• After the main food security concepts have been introduced
How long should the exercise take?
• 25 minutes
What materials are needed?
• Handout 2a: Identifying the three pillars of food security: Darfur 2006
• Handout 2b: Identifying the three pillars of food security: Darfur 2006 (Model answer)
What does the trainer need to prepare?
• Prepare a case study for an area that is familiar to the participants based on the template handout 2a.
Instructions
Step 1: Give each participant a copy of Handout 2a.
Step 2: Give participants 15 minutes to read the case study and complete the table
Step 3: Allow 10 minutes of discussion in plenary
Discussion points for feedback in plenary
➡ Discuss how insecurity can affect food availability as well as access to food
➡ Bring out linkages between poor health environment and food utilisation
➡ Ask participants if they can think of situations where only one of the pillars of food security is compromised
Classroom exercises
This section provides examples of practical exercises that can be carried out in a classroom context either by participantsindividually or in groups. Practical exercises are useful to break up plenary sessions where the trainer has done most of thetalking as they provide an opportunity for participants to engage actively in the session. The choice of classroom exerciseswill depend upon the learning objectives and the time available. Trainers should adapt the exercises presented in this sectionto make them appropriate to the particular participant group. Preferably, trainers should use case examples with which theyare familiar.
Exercise 2: Identifying the three pillars of food security
11
TRAINER’S GUIDE
MODULE 9
HTP, Version 2, 2011
Food security assessment and the link with nutrition
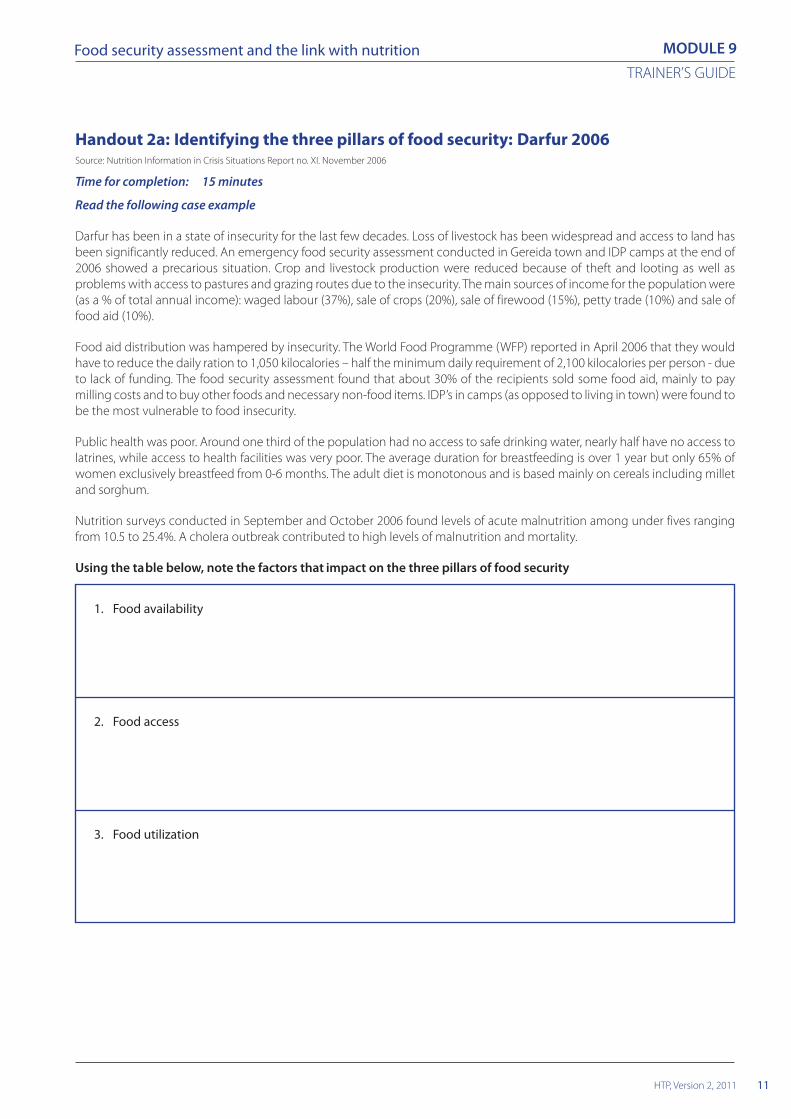
Handout 2a: Identifying the three pillars of food security: Darfur 2006Source: Nutrition Information in Crisis Situations Report no. XI. November 2006
Time for completion: 15 minutes
Read the following case example
Darfur has been in a state of insecurity for the last few decades. Loss of livestock has been widespread and access to land hasbeen significantly reduced. An emergency food security assessment conducted in Gereida town and IDP camps at the end of2006 showed a precarious situation. Crop and livestock production were reduced because of theft and looting as well asproblems with access to pastures and grazing routes due to the insecurity. The main sources of income for the population were(as a % of total annual income): waged labour (37%), sale of crops (20%), sale of firewood (15%), petty trade (10%) and sale offood aid (10%).
Food aid distribution was hampered by insecurity. The World Food Programme (WFP) reported in April 2006 that they wouldhave to reduce the daily ration to 1,050 kilocalories – half the minimum daily requirement of 2,100 kilocalories per person - dueto lack of funding. The food security assessment found that about 30% of the recipients sold some food aid, mainly to paymilling costs and to buy other foods and necessary non-food items. IDP’s in camps (as opposed to living in town) were found tobe the most vulnerable to food insecurity.
Public health was poor. Around one third of the population had no access to safe drinking water, nearly half have no access tolatrines, while access to health facilities was very poor. The average duration for breastfeeding is over 1 year but only 65% ofwomen exclusively breastfeed from 0-6 months. The adult diet is monotonous and is based mainly on cereals including milletand sorghum.
Nutrition surveys conducted in September and October 2006 found levels of acute malnutrition among under fives rangingfrom 10.5 to 25.4%. A cholera outbreak contributed to high levels of malnutrition and mortality.
Using the table below, note the factors that impact on the three pillars of food security
1. Food availability
2. Food access
3. Food utilization

12
TRAINER’S GUIDE
MODULE 9
HTP, Version 2, 2011
Food security assessment and the link with nutrition
Handout 2b: Identifying the three pillars of food security: Darfur 2006 (Model answer)
1. Food availabilityReduction in crop and livestock productionLack of access to pastures and grazing routes further reduces food productionReduced food aid ration providing fewer calories.
2. Food accessPoor access to food aid and sale of food aid to buy other itemsLow purchasing power to buy food
3. Food utilizationDiseases – cholera outbreak which increases food needsHigh prevalence of malnutrition which increases food needsPoor health environment leads to high prevalence of disease

13
TRAINER’S GUIDE
MODULE 9
HTP, Version 2, 2011
Food security assessment and the link with nutrition
What are the learning objectives?
• Participants can describe the impact of shocks on food security
When should this exercise be done?
• After the main food security concepts have been introduced
How long should the exercise take?
• 50-60 minutes
What materials are needed?
• Handout 3a: Impact of an emergency on household food sources: Ethiopia 2001
• Handout 3b: Impact of an emergency on household food sources: Ethiopia 2000 (Model answer)
What does the trainer need to prepare?
• Prepare household food and income source pie charts for a context that is familiar to the participants based onthe template handout 3a.
• Either during preparation for training, visit a local community and construct a
• household profile of food and income sources using information from key informants.
• Or construct food and income source profiles from secondary data e.g. available reports.
Instructions
Step 1: Give each participant a copy of handout 3a
Step 2: Divide the participants into groups of (Maximum) 5 people
Step 3: Give the groups 30 minutes to answer the questions and prepare a presentation of their answers
Step 4: Give each group 5 minutes for feedback in plenary
Discussion points for feedback in plenary
➡ Recognising that distinguishing coping strategies which may be damaging and those which are not is notstraightforward
➡ Understanding that quantifying impact of shocks on different food and income sources is a subjective exercisewith certain margins of error
➡ Diversity of food and income sources can help to safeguard against the impact of shock
➡ The population in the case study experienced shocks which affected more than one of their primary food andincome sources
Exercise 3: Impact of an emergency on household food sources

14
TRAINER’S GUIDE
MODULE 9
HTP, Version 2, 2011
Food security assessment and the link with nutrition
Handout 3a: Impact of an emergency on household food and income sources:Ethiopia 2001
Source: Bush, J. Baseline Report: Household Food Economy Assessment, Boloso Sorie Woreda, Wolayita, Ethiopia. February 2002
Time for completion: 30 minutes
Allow Working in groups, read the following case example, address the questions and prepare a brief presentation ofyour discussion.
Boloso Sorie, Ethiopia 2001A Household Economy Assessment (HEA) was carried out in Boloso Sorie woreda in Ethiopia in 2001. The assessmentdistinguished a number of wealth groups which included the ‘middle-poor’. These households grow maize and sweet potatoeson their own farm land and Enset (also known as ‘false banana’) which makes them comparatively better-off than the ‘very poor’even though this land is usually sharecropped. They care for the livestock of better-off farmers. While they do not earn a wagefor this, they get manure for their crops, as well as potential access to milk for their children or to sell. They can also earn extraincome for example if the cattle owner sells an animal, they get a share of the profit, or they can use the animal to earn moneyby ploughing fields for other people. The middle-poor migrate away to work seasonally on farms. In addition they do somepetty marketing of low-value goods (sweet potato, salt, staple grains) or sell grass for forage and thatch. They are relativelyùlabour-richû (at least 2 adults or older children) and so have sufficient income for some additional expenditure such as clothes,meat for festivals, or school books for one child. They are basically labourers, but at least during the time of the maize harvestthere is less pressure on them to find work for food.
The pie chart illustrates the food sources of the middle-poor as assessed through HEA. Here, 100% refers to the annual calorierequirements of the household, based on 2100 kcals per person per day. ‘Agricultural labour’ refers to ‘wages-in kind’, that is,food received as payment for labouring. The main foods purchased are maize and sweet potatoes. Milk is not shown in thegraph because it makes a minimal contribution to the overall annual household caloric requirements.
Food sources of middle-poor in Boloso Sorie Ethiopia 2001
In 2000 there were two shocks. Firstly, the sweet potato crop, an important staple, was lost due to drought and pests. This ledto a reduction of 35-40% of their calories from their own crops. Secondly, there were significant wage and price changes;staple food prices doubled and local wages-in-kind were cut by half although labourers still received the same lunch fromtheir employer when they worked.
1. How do you think these two shocks affected their sources of food?Draw a pie chart to show your conclusions.
2. What coping strategies might the population have employed in order to reduce the impact of the shocks?
3. Are any of these coping strategies likely to have a negative impact on livelihoods in the long-term?
4. What other information would you need to be able to better understand the impact of the shocks?
Agricultral labour20%
Own crops35%
Purchase33%
Lunch6%Relief
6%

15
TRAINER’S GUIDE
MODULE 9
HTP, Version 2, 2011
Food security assessment and the link with nutrition
Handout 3b: Impact of an emergency on household food sources: Ethiopia 2000(Model answer)
1. How do you think these two shocks affected sources of food?
Effect of sweet potato losses and wage and price effect (Pre-relif ) Middle-poor, 2000 (1992 EC)
2. What coping strategies might the population have employed in order to reduce the impact of the shocks?
• Greater dependence on food relief from local charities
• Borrowing money and increase in debt
• Gathering wild fruits to eat
• Harvesting earlier for home consumption or sale
• Taking a child out of school
3. Are any of these coping strategies likely to have a negative impact on livelihoods in the long-term?
Increasing debt will prevent future investment in livelihoods. Harvesting earlier for home consumption or sale may leadto a situation where households have to purchase food later in the year when it is more expensive leading to greaterdebt. Gathering wild fruits could improve food diversity during the season. Disrupting a child’s education can have animpact on the future earning capacity of the household.
4. What other information would you need to be able to better understand the impact of the shocks?
We don’t know enough about their cash income to see what could be increased. We do not know the proportion of totalexpenditure that households spent on food, or whether they could reduce ‘non-essential’ expenses to afford to buy morefood. We don’t know to what extent they can they rely on their Enset harvest to make up the food gap. We don’t knowthe impact on the richer households and whether they will they continue to loan their animals to the middle poor.
Own crops25%
Purchase14%
Relief6%
Lunch6%
Ag. Labour6%
Ag. Lab. Deficit10%
Crop Deficit15%
Purchase Deficit14%
16
TRAINER’S GUIDE
MODULE 9
HTP, Version 2, 2011
Food security assessment and the link with nutrition
Exercise 4: Collecting 24 hour food frequency data
What are the learning objectives?
• Be able to describe some tools used in assessing food security
When should this exercise be done?
• During the session on food security data collection methods
How long should the exercise take?
• 40-50 minutes
What materials are needed?
• Handout 4a: 24 hour food frequency questionnaire
• Handout 4b: 24 hour food frequency data: Bosnia December 1993
• Handout 4c: 24 hour food frequency data: Bosnia December 1993 (Model answer)
• Flip chart and marker pens
What does the trainer need to prepare?
• Complete a 24 hour food frequency questionnaire using an interviewee who comes from a context similar to theparticipants based on the template handout 4b. The trainer will then be able to identify many of the individualfood items in advance and identify some of the pitfalls which may be encountered.
• Prepare a flip chart to collate the results from pair-work, with 2 columns: food items, no. of individualswho consumed the item at least once on the previous day
Instructions
Step 1: Give each participant a copy of handout 4a
Step 2: Divide participants into pairs
Step 3: Give participants 10 minutes for one of the pair to interview the other, complete handout 4a andidentify any problems encountered
Step 4: Collate the data from each pair and discuss briefly (10 minutes)
Step 4: Give participants 10 minutes to read handout 4b and address the questions
Step 5: Allow 15 minutes for general discussion in plenary
Discussion points for feedback in plenary
➡ Food frequency questionnaires can provide some indication about dietary diversity and sources of food
➡ Can be difficult to complete as some foods may fall into more than one category (e.g. how to categorisevegetable soup?) and informants may not know ingredients of food.
➡ Diet of Sarajevans was heavily dependent on food aid and poor diversity. Particularly low in fruit and vegetablesand dependent on bread.
➡ Information may be useful to provide information on dietary diversity and dependence on food aid.
17
TRAINER’S GUIDE
MODULE 9
HTP, Version 2, 2011
Food security assessment and the link with nutrition
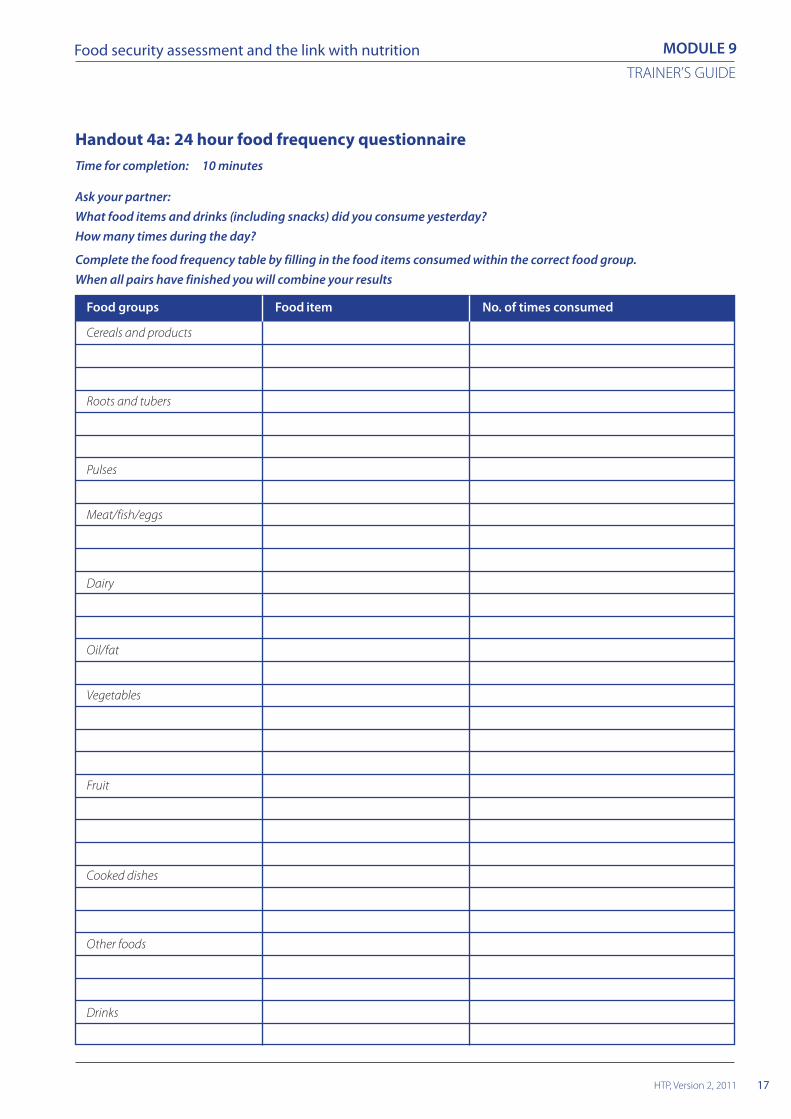
Handout 4a: 24 hour food frequency questionnaireTime for completion: 10 minutes
Ask your partner:What food items and drinks (including snacks) did you consume yesterday?How many times during the day?
Complete the food frequency table by filling in the food items consumed within the correct food group.When all pairs have finished you will combine your results
Food groups Food item No. of times consumed
Cereals and products
Roots and tubers
Pulses
Meat/fish/eggs
Dairy
Oil/fat
Vegetables
Fruit
Cooked dishes
Other foods
Drinks

18
TRAINER’S GUIDE
MODULE 9
HTP, Version 2, 2011
Food security assessment and the link with nutrition
Handout 4b: 24 hour food frequency data: Bosnia 1993Source: Watson, F. Why was there no famine in Bosnia during the war? (unpublished PhD)
Time for completion: 10 minutes
Address the following questions:1. What can you conclude about the diet of Sarajevans?2. How is this information useful?
War broke out in Bosnia in 1992. The capital city, Sarajevo, was besieged and by December 1993 the food supply was seriouslydisrupted. Some food aid was getting through, but distribution was sporadic. The ration consisted of flour, rice or pasta; vegetableoil or margarine; sugar; pulses (dried beans or lentils); tinned fish; salt and yeast. Supplementary food in the form of high-energybiscuits was also distributed to vulnerable groups. As part of a nutrition monitoring system, the World Health Organisationinterviewed 143 households living in Sarajevo every month. 24 hour food frequency information was collected for each householdmember and the results for December 1993 are shown below.
% of individuals who consumed food itemFood item at least once on previous day
Cereals and products Bread 97.1
Pasta 20.3
Rice 22.2
Roots and tubers Potato 3.1’
Pulses Beans (dried) 30.1
Lentils (dried) 6.2
Meat/fish/eggs Fish (tinned) 24.1
Meat 10.7
Eggs 0.9
Dairy Butter 0.5
Cheese 7.9
Milk 30.5
Oil/fat Vegetable oil 10.5
Margarine 19.1
Vegetables Cabbage 1.2
French beans 0.7
Peas 1.2
Spinach 0.7
Fruit Apple 3
Cooked dishes Pie 9.3
Rice pudding 0.2
Soup 9.3
Other foods Biscuits 11.2
Cake 1.7
Honey 1.2
Jam 1.0
Dried fruit 2.9
Drinks Cocoa 3.8
Coffee 3.1
Juice 1.0
Tea 43.9

19
TRAINER’S GUIDE
MODULE 9
HTP, Version 2, 2011
Food security assessment and the link with nutrition
Handout 4c: 24 hour food frequency data: Bosnia 1993 (Model answer)
1. What can you conclude about the diet of Sarajevans?
• The diet was not very diverse for a previously affluent urban population
• It was heavily dependent on starchy foods with very little fruit and vegetables and therefore potentially lowin micronutrients
• Heavily dependent on food aid items
2. How is this information useful?
• Provides some information on dietary diversity
• Provides information on whether food aid is getting to the population and is being consumed
• Highlights the type of nutritional risk that may occur but does not indicate who may be affected withinthe household
3. What other information might help you to understand the results better?
• Disaggregating by type of household shows if wealth or socio-economic status has any impact
• Disaggregating by locality shows if there is a difference for people in the central districts compared with those onthe edge of town
• Seasonality may have an impact on people’s access to fruit and vegetables

20
TRAINER’S GUIDE
MODULE 9
HTP, Version 2, 2011
Food security assessment and the link with nutrition
What is the learning objective?
• Appreciate the importance of linking food security and nutrition data
When should this exercise be done?
• As part of a longer in-depth training
How long should the exercise take?
• 60 minutes
What materials are needed?
• Handout 5a: Linking food security and nutrition data: Afghanistan 2001
• Handout 5b: Linking food security and nutrition data: Afghanistan 2001 (Model answer)
What does the trainer need to prepare?
• Prepare a case study from a context familiar to the participants based on the template handouts 5a and 5b.
Instructions
Step 1: Give each participant a copy of either handout 5a or 5b
Step 2: Divide the participants into groups of (Maximum) 5 people
Step 3: Give the groups 30 minutes to answer the questions and prepare a presentation of their answers
Step 4: Give each group 5 minutes for feedback in plenary
Discussion points for feedback in plenary
➡ The limited value of anthropometric data in isolation
➡ The critical importance of context information on food and livelihoods security and the need to project likelyoutcomes in the event of no intervention or limited nutritional interventions
➡ The importance of linking nutrition data with food and livelihood security data
➡ What data is most compelling and why?
Case studies
Two case studies are presented in this section: one from Afghanistan and one from Zimbabwe. Case studies are useful forgetting participants to think through real-life scenarios. They also provide an opportunity for participants to work in a groupand develop their analytical and decision-making skills. Trainers should develop their own case studies which are contextuallyappropriate to the particular participant group. Preferably trainers should use scenarios with which they are familiar.
Exercise 5: Case Study on linking food security and nutrition data

21
TRAINER’S GUIDE
MODULE 9
HTP, Version 2, 2011
Food security assessment and the link with nutrition
Handout 5a: Linking food security and nutrition data: Afghanistan 2001Time for completion: 30 minutes
There are three parts to this case study.Read part I and answer the questions at the end of part I before you go on to part II.Read part II and answer the questions at the end of part II before going on to part III.Read part III and address the questions at the end.Prepare a brief presentation of your discussion.
Concern, an international NGO, has been operational in two provinces of north eastern Afghanistan (non-Taliban held areas)since 1998. In 2001, Concern carried out a nutrition, health and food security assessment in one of the provinces called Badakshanwith a population of 842,910 people. This was in response to an influx of internally displaced people (IDPs) due to ongoingconflict between the Northern Alliance and Taliban, and drought which had resulted in crop failure. The assessment providedinformation on nutritional status, agriculture, household food security, coping mechanisms, and patterns of morbidity andmortality.
Part IIn the Khosh Valley of Badhakshan Province, the assessment found a prevalence of wasting (global acute malnutrition or GAM)of 11.5% (95% CI = 8.7%, 14.9%) in children under five using standard cut-off points for weight-for-height Z-scores.
Table 1 compares the Afghanistan data with two nutritional surveys in Africa which were classified as not indicating a disaster.
Table 1: Prevalence of malnutrition in children in Afghanistan, Sudan and Kenya
Location GAM% SAM% Date Source Interpretation
Afghanistan 12 3 Sep 2001 Concern(Badakshan)
South Sudan 18 1 Oct 1999 MSF-B Stable but vulnerable
Kenya 16 Dec 1999 MSF-B Stable(Dadaab Camp)
Address the following questions:1. What can you conclude from this information?2. What interventions would you recommend to Concern and donors to address the situation?
Part IIIn addition to measuring children under five years of age, maternal malnutrition was assessed using mid-upper arm circumference(MUAC). A cut-off below 21.5 cm was used to define severe malnutrition. The assessment found 21.2% of mothers were severelymalnourished. Qualitative investigation revealed preferential feeding of children, with mothers reducing their own intake beforereducing intake of their children or husbands. This information was verified by interviewing a variety of groups using differentmethods including in depth interviews with mothers and community leaders, and focus group discussions with mothers andcommunity leaders, men at mosques and guest house sites.
Address the following question:3. How do these findings alter your conclusions and recommendations?

22
TRAINER’S GUIDE
MODULE 9
HTP, Version 2, 2011
Food security assessment and the link with nutrition
Part IIIPublic healthThe assessment found that the public health situation in the Badakshan was poor. Diarrhoea and acute respiratory infection(ARI) were the most common causes of childhood mortality. Both preventive and curative services were limited in scope andinadequate. The water table had dropped considerably and some recently constructed wells had dried up resulting in a shortageof water available for irrigation and drinking. The lack of potable water was often cited as the cause of diarrhoea but faecaldisposal methods were far from ideal and combined with a lack of water for washing was probably as important a cause ofdiarrhoea as contaminated water.
Diarrhoea and fever were significantly associated with child malnutrition.
Crop productionRain-fed winter and spring wheat crops had failed for the second consecutive year and the assessment found that the smallquantity of grain harvested was poor quality. The barley harvest, the second commonest staple was equally poor. The poorgrain harvests was reflected in steadily rising cereal prices.
Potato and onion harvests appeared to have been reasonably good although farmers reported lower than average yields. Cropdiversity was low with only a small number of farmers planting vegetables such as carrots, tomatoes, aubergines, turnips andpumpkins.
All the farmers interviewed reported planting opium poppy. Yields were low, averaging 0.45 kg per farming household. Combinedwith the collapse of labour markets, the assessment concluded that this would probably lead to an inability to compensate forproduction shortfalls using purchased food.
Livestock productionMost poor farmers had already sold their livestock in order to compensate for production shortfalls. Livestock prices were lowand wheat prices high. Sale of livestock was associated with a reduction of dietary variety due to the loss of sources of meat,animal fat, eggs and milk. Households now only had small herds sufficient, on average, to provide only 230kgs of cereal if soldat the local market. This quantity of grain would only feed a family of eight for approximately 8 months. Fodder production(winter-feed) was reduced and a fodder shortage was likely during the winter months. This could seriously affect livestockleading to decreased milk yields and further depress the livestock market reducing the viability of selling livestock as a copingstrategy.
Fruit and wild foodsFruit was available at the time of the assessment and was an important source of both food and income. Some families gatheredwild cumin for sale to petty traders who sold it on at a small profit to traders in the market town. Collection and consumptionof wild grasses and vetches was also reported. Neither fruit nor wild foods are available during the winter.
LabourWage labour (agricultural labour, mining, donkey driving) was a common source of income. Demand for labour is highestduring the harvest of rain-fed wheat and barley as well as during the earlier poppy harvest. Little work was available and thesupply of casual labour exceeded demand. Wage levels were insufficient to meet household food requirements. Child labourwas a source of family support with children leased to wealthy persons as servants in return for a ration. Migrant labour wascommon with young men migrating to Pakistan and Iran to work and sending money back to their families. Regular seasonallabour migration was also reported with male household member travelling to Pakistan to work in the autumn and returningin the spring. Workers often returned with goods such as clothes and shoes, and engaged in petty trading.

23
TRAINER’S GUIDE
MODULE 9
HTP, Version 2, 2011
Food security assessment and the link with nutrition
Other coping strategiesMost people had reduced their food intake. Usual meal-times were kept but solid food was replaced by tea or milk. Reductionin dietary variety was a common consequence of the sale of livestock. Preferential feeding of children was consistently reported.Both men and women reported that mothers preferred to reduce their own intake before reducing the intake of their childrenor husbands.
Borrowing was increasingly common. The borrower bought food at between two or three times the market price agreeing torepay in cash or grain at a later date, usually after the harvest. The loan is secured against property with irrigated land beingpreferred as security. Food is, therefore, purchased at a multiple of a peak market price that can only be paid for by sale ortransfer of food immediately after harvest when food prices are likely to be low. The effective interest rate was as high as 350%over a three month period. Defaulting on a loan usually led to seizure of property with the borrower either becoming asharecropper for the lender or being displaced.
Most of the poorer households had already sold their household goods. Sale of land was reported as a last resort and wasfrequently cited as a reason for displacement with Pakistan and Iran being mentioned as the preferred destinations. Displacementin Afghanistan, is however substantially different from displacement in, for instance, Africa. It takes place before food andincome sources are exhausted and is facilitated by a strong culture of hospitality to travellers. It is possible that displacement inthe face of adverse economic circumstances is a common and long-standing coping strategy rather than a crisis strategy.
The identified coping strategies were viewed as lying along a continuum ranging from normal coping behaviours (e.g. cashcrops, casual labour) through stress coping behaviours (e.g. borrowing, kinship support) to crisis behaviours (e.g. sale of highlyportable valuables, displacement).
Food economyA basic food economy analysis converting sources of income and expenditure to cereal equivalents using a purposive sampleof 39 farmers was undertaken. The analysis found a cereal deficit of 22% compared to the year before. It was estimated that byJanuary 2002 nearly 80% of farmers would have exhausted their capacity to cope.
At the time of the assessment, a food for work (FFW) scheme was planned involving distribution of wheat. Even with this inter-vention, over 70% of those surveyed were estimated not to be able to find sufficient food for their families without sellingvital assets.
Address the following questions:4. How do these findings alter your conclusions and recommendations?5. Which non-nutritional data did you find most compelling with regard to determining the severity of the situation
and why?6. What other information about the households would help you to make your conclusions and recommendations?7. What lessons can be learnt from doing this case study?
24
TRAINER’S GUIDE
MODULE 9
HTP, Version 2, 2011
Food security assessment and the link with nutrition
Handout 5b: Linking food security and nutrition data: Afghanistan 2001 (Model answer)
Part I:What can you conclude from this information?Malnutrition levels are not at emergency levels although levels of severe wasting are quite high. Lack of baseline data makes itdifficult to determine whether drought and influx of IDPs has led to a deterioration in nutritional status or whether these arenormal levels.
What interventions would you recommend to Concern and donors to address the situation?Given the high levels of severe wasting (3%), it may be appropriate to implement therapeutic feeding (centre based or CTC).Other interventions are not advised on the basis of the nutrition survey findings alone.
Part II:How do these findings alter your conclusions and recommendations?High levels of maternal malnutrition and the underlying cause, e.g. preferential feeding of their children, indicate a severe foodsecurity crisis and the potential need for a general ration programme or some other means of supporting food security. At thevery least, supplementary feeding for children and pregnant and lactating women may be advised.
Part III:How do these findings alter your conclusions and recommendations?The findings indicate that coping strategies for many are nearing exhaustion and that without intervention to support foodand livelihood security levels of wasting could soon increase dramatically resulting in famine conditions. Furthermore, waterand sanitation conditions are critical with the need for immediate intervention to prevent disease taking hold – especially insuch a context of compromised nutritional status.
Which non-nutritional data did you find most compelling with regard to determining the severity of the situationand why?To some degree this is a question which allows subjective response. However, food economy data on cereal deficit comparedto normal (22%), extreme coping strategies like taking out loans with 350% interest rate and the percentage of population thatare predicted to have exhausted coping strategies by January 2002, are compelling information. These data are normative,indicate how desperate populations have become and how long they are likely to hold out. In contrast, data on crop productiondoes little to indicate how critical the situation is although market information on high prices of cereal and low prices oflivestock do indicate that production short-falls are having a marked impact.
What other information about the households would help you to make your conclusions and recommendations?
A seasonal calendar would show how food and income activities might change in the future (for better or for worse). It wouldalso show when is the appropriate time for planting seeds and when people are very busy
Information on typical expenditure would show whether households are able to afford other basic requirements such as clothing,education, health care costs, agricultural inputs etc.
What lessons can be learnt from doing this case study?
The main lesson is that anthropometric data must be complemented by contextual data on food and livelihood security inorder to interpret survey findings.
Another lesson is that is that some data are more compelling than other data and to understand why that is. In other wordsthink carefully about what data to present and what to leave out – especially when presenting findings to decision makers.

25
TRAINER’S GUIDE
MODULE 9
HTP, Version 2, 2011
Food security assessment and the link with nutrition
Handout 5c: Linking food security and nutrition data: Zimbabwe 2001Source: VAC / SADC. Zimbabwe Emergency Food Security Assessment Report. September 2002
Time for completion: 30 minutes
There are three parts to this case study.Read part I and answer the questions at the end of part I before you go on to part II.Read part II and answer the questions at the end.Prepare a brief presentation of your discussion.
The situation in Zimbabwe spiralled into crisis as a result of complex underlying factors. Firstly, the political environment wasunstable and the government was accused of poor governance. Secondly, the economic situation was deteriorating with highinflation, high unemployment, and closure of factories and businesses. Thirdly, the impact of HIV/ AIDS which was affectingover 30 per cent of the population. These factors had a major impact on food security. In response, an assessment was carriedout in August 2002 by the Vulnerability Assessment Committee (VAC) – a conglomeration of government and humanitarianagencies. The aims of the assessment were to determine whether households were able to meet their immediate food needs(i.e. any food deficit), and to identify vulnerable households and their coping capacities. A survey approach was adopted thatintegrated analysis of the household economy, coping strategies, dietary intake, agricultural inputs, and nutritionalanthropometry. A complementary Household Economy Analysis (HEA) was also conducted in four Food Economy Zones (FEZs).
Part IThe VAC assessment found a prevalence of wasting (global acute malnutrition or GAM) of 7.3% in children under five usingstandard cut-off points for weight-for-height Z-scores. This was similar to national surveys using random sampling methods astable 1 illustrates. The United Nations classifies a prevalence of GAM between 5-8% as a worrying nutritional situation, and aprevalence greater than 10% as a serious nutritional situation.
Table 1: Prevalence of malnutrition in children in Zimbabwe
Survey Sample size GAM% Date
Demographic Health Survey 3,566 6 1999
Ministry of Health/UNICEF 23,400 6.4 May 2002
VAC 695 7.3 Aug 2002
Address the following questions:1. What can you conclude from this information?2. What interventions would you recommend to international agencies and donors to address the situation?
Part IICrop productionThe 2001/02 crop growing season was among the worst three since 1990 and cereal crop production was seriously reduceddue to:• The dry spell experienced during the second half of the season• The resettlement programme that disrupted commercial farming• The Government agricultural input programme that delivered inputs late• Draft power shortages• The high cost of inputs which farmers could not afford.
The VAC assessment concluded that Zimbabwe was facing a severe food crisis which would become a humanitarian crisis inthe next seven months unless urgent action was taken. Cereal availability was a critical factor with an initial cereal deficit of 1.65million MT. The Grain Marketing Board had imported only 335,000 MT, and humanitarian food relief 70,600 MT. Private sectorcommercial imports were negligible.

26
TRAINER’S GUIDE
MODULE 9
HTP, Version 2, 2011
Food security assessment and the link with nutrition
The assessment found that 75% of households had less than 1/2 bag (50kg) of maize in stock. Furthermore 94% of farmers didnot have enough seed for the following agricultural year.
Cash crop productionThe major cash crops grown in Zimbabwe include tobacco, flowers, vegetables, fruits, cotton, soybeans, groundnuts, sunflower,sugarcane, coffee, tea and paprika. Most of the cash crop production had decreased in the past three years.
Market pricesThe annual inflation rate at the beginning of 2001 was 57%. By January 2002, it had doubled to 116% and further increased to124% in July. The increase in inflation rate was compounded by the shortage of basic consumer goods, agricultural inputs, fueland foreign currency.
The assessment found that 70% of households were dependent on purchasing their cereals, and yet 64% of the communitiesstated that cereal was not, or seldom, available.
Livelihoods and coping strategiesThe assessment confirmed the impact of the crisis on peoples’ lives and livelihoods. Most rural income strategies are dynamicthroughout the year. The community analysis indicated that 83% of the communities expected casual labour availability todecrease this year-severely limiting income opportunities especially for the poor. The casual labour averaged Z$200 per day.Half the households interviewed reported incomes of less than Z$5,000 per year. Even if all of the Z$5,000 were spent on cerealalone, this could only purchase enough cereal for a typical family size to meet their needs for 7 1/2 months.
Households were asked if they had engaged in any of seventeen distress coping strategies within the past two months. Theseinclude: borrowing food, purchase food on credit, get food from relatives or friends from outside the household, regularly limitsize of portions at mealtimes, regularly reduce the number of meals eaten during the day, skip whole days without eating,reduce expenditure on health care, reduce expenditure on education, reduce expenditure on beer and tobacco, sell all poultryto get food, sell all goats to get food, sell breeding and draft power cattle to get food, sell land or gave up rights to land, sellother assets to get food, take children out of school, send children away to friends or relatives, forced to migrate to find workor food.
The most commonly cited strategies involved reduction in consumption, with 86% of the households limiting portions ofmeals, and another 86% reducing the number of meals eaten in a day. A total of 18% of the households had removed one ormore children from school. A majority (68%) of households were employing multiple distress coping strategies.
Other commonly mentioned coping strategies included illegal gold panning (often involving removing children from schoolto assist, and also leads to environmental damage), prostitution, and eating wild foods that were new to the households andcan sometimes lead to health complications.
Public healthThe assessment found that the incidence of diarrhoea and acute respiratory infection (ARI) had increased dramatically. Thisincrease could be attributed to deteriorating health
conditions due to lack of water and proper sanitation and possibly complications of HIV / AIDS.
Vitamin A deficiency (VAD) was 35.8% among children aged 12-71 months and anaemia was 19.3% in the same age group. Ina crisis situation VAD is exacerbated and other vitamin deficiencies such as pellagra can surface.
Address the following question:3. How do these findings alter your conclusions and recommendations?4. Which non-nutritional data did you find most compelling with regard to determining the severity of the situation
and why?5. What other information about the households would help you to make your conclusions and recommendations?6. What lessons can be learnt from doing this case study?

27
TRAINER’S GUIDE
MODULE 9
HTP, Version 2, 2011
Food security assessment and the link with nutrition
Handout 5d: Linking food security and nutrition data: Zimbabwe 2001 (Model answer)
Part I:What can you conclude from this information?These levels of wasting alone do not indicate a deteriorating situation, although the fact that the three surveys presented areundertaken at different times of the year makes rigorous comparison difficult
What interventions would you recommend to international agencies and donors to address the situation?A follow up nutrition survey in three months would be valuable to determine whether the situation is deteriorating and alsosome sentinel site monitoring of MCH programmes and paediatric wards in order to determine whether number of cases ofchildren presenting with malnutrition is increasing. No other interventions are indicated by these data alone.
Part II:How do these findings alter your conclusions and recommendations?It is clear that the population is under considerably more stress than indicated by the anthropometric survey alone. Foodavailability (crop production) and access (through markets) is considerably compromised while diverse coping strategies arebeing employed some of which are damaging to long-term livelihoods, e.g. selling draft animals and land or land rights. It alsoappears that coping strategies are limited and are being exhausted.
A number of interventions are needed to address the situation. However, detailed analysis is needed to asses the feasibility andappropriateness of each option. A SWOT analysis is useful (Strengths, Weaknesses, Opportunities and Threats). Possible responseoptions include:• Implementation of general rations• Gearing up to selective feeding programme implementation• Market support initiatives, e.g. subsidised sale of cereals, in order to improve access to cereals• Livestock de-stocking and restocking programmes• Seed fairs• Water and sanitation programmes
Which non-nutritional data did you find most compelling with regard to determining the severity of the situationand why?Although there is a subjective element to the question the most compelling non-nutritional data must in some way relate toextreme non-reversible coping strategies as well as predictions of how long population groups can hold out using availablecoping strategies. Other compelling evidence includes data which shows a change from the normal, e.g. market prices, lesscasual labour available.
What other information about the households would help you to make your conclusions and recommendations?A seasonal calendar would show how food and income activities might change in the future (for better or for worse). It wouldalso show the appropriate time for planting seeds and when people are very busy.
Information on typical expenditure would show whether households are able to afford other basic requirements such as clothing,education, health care costs, agricultural inputs etc.
What lessons can be learnt from doing this case study?The importance of linking anthropometric data with food security and livelihoods data
The importance of data that may indicate the need for interventions which go beyond feeding and address recovery, e.g. saleof seeds and livestock

28
TRAINER’S GUIDE
MODULE 9
HTP, Version 2, 2011
Food security assessment and the link with nutrition
What is the learning objective?
• Be able to describe how to conduct interviews to collect food security information
When should this exercise be done?
• As part of an in-depth course and after a session on food security data collection methods
How long should the exercise take?
• 4 hours (excluding travel) over a 3 day period
What materials are needed?
• Handout 6a: Testing different tools used in food security assessment
What does the trainer need to prepare?
• On day 1, the trainer needs to work with the participants to develop their questions. The field visit takes place onday 2. The trainer will need to identify a suitable organisation and area for the field visit and organise all logistics(transport, fuel, meals etc.) for the visit. It is essential that the trainer visits the field site in advance of the visit inorder to set up focus groups and identify key informants, and identify potential problems. Discussion of theexercise should take place back in the classroom on day 3.
• The trainer needs to ensure that all participants are clear how they will introduce themselves, the purpose of thework and how the interview will proceed to the focus group or key informant.
Instructions
Step 1: Give each participant a copy of handout 6a
Step 2: Divide participants into groups
Step 3: On day 1, groups complete part 1 of handout 6a in the classroom
Step 4: On day 2, groups complete part 2 of handout 6a at the field site
Step 5: On day 3, groups return to the classroom for discussion
Field based exercises
This section outlines ideas for exercises that can be carried out as part of a field visit. Field visits require a lot of preparation. Anorganisation that is actively involved in programming has to be identified to ùhostû the visit. This could be a governmentagency, an international NGO or a UN agency. The agency needs to identify an area that can be easily and safely visited byparticipants. Permission has to be sought from all the relevant authorities and care taken not to disrupt or take time away fromprogramme activities. Despite these caveats, field based learning is probably the best way of getting over information that willbe remembered by participants.
Exercise 6: Testing different interview skills used in food security assessments

29
TRAINER’S GUIDE
MODULE 9
HTP, Version 2, 2011
Food security assessment and the link with nutrition
Handout 6a: Testing different interview techniques to collect food security informationTime for completion: 3 hours and 15 minutes over 3 days for each group
This exercise relates to learning objective 6.
Two groups are needed for this exercise. Each group will test a different type of interview technique. On day 1 in theclassroom, each group will carry out part I while part II will be completed during the field visit on day 2. Part III will bedone on return to the classroom on day 3 to allow each group to learn from the experiences of the other.
Group 1: Focus group discussion
Part I – 1 hourThe aim of the focus group discussion is to find out about the current sources of food and income, livelihood options andcoping strategies of the group.• Develop a set of questions/key areas that need to be covered during the discussion. Think about the type of question to
ask (open or closed).• Develop a recording sheet which allows participants to record points from the group discussion in a logical way• Decide how your group will organise the focus group discussion. For example: Will one person ask questions while the
others take notes? Will several people ask questions?
Part II – 2 hoursThe focus group discussion should last a maximum of 1 hour leaving another hour for getting the focus group together.• Lead a focus group discussion using your set of questions• Note down your observations (good and bad) of the process. Was it easy to get people to talk? Did a few individuals
dominate the discussion? Were you able to cover all the areas you needed to in the time available? Were there anysensitive areas which you were unable to cover? Would you change the way that some of the questions were asked toget the same information? Do you think that the information you obtained is reliable and why?
Part III – 15 minutes• Present your observations of the process in plenary
Group 2: Key informant interviews
Part I – 1 hourThe aim of the key informant interviews is to find out about the current sources of food and income, livelihood options andcoping strategies of the community represented by the key informants.• Develop a set of questions/key areas that need to be covered during the interview• Develop a recording sheet to record the responses• Decide how your group will organise key informant interviews. For example: Will each participant interview one key
informant or several?
Part II – 2 hoursEach key informant interview should last a maximum of 30 minutes so that a number of interviews can be completed in2 hours.• Conduct the key informant interviews using your set of questions• Note down your observations (good and bad) of the process. Was it easy to get people to talk? Were you able to cover all
the areas you needed to in the time available? Were there any sensitive areas which you were unable to cover? Wouldyou change the way that some of the questions were asked to get the same information? Do you think that theinformation you obtained is reliable and why?
Part III – 15 minutes• Present your observations of the process in plenary