Embed Size (px)
Citation preview
23
PART 3: FISCAL STRATEGY AND OUTLOOK OVERVIEW
The fiscal position is forecast to maintain an improving trajectory over the forward estimates period, consistent with the Government’s commitment to responsible budget repair and strengthening the Government’s balance sheet over time. In line with the 2017-18 Budget, the underlying cash balance is projected to return to surplus in 2020-21.
Reflecting prudent fiscal management, the underlying cash balance is expected to improve from a deficit of $23.6 billion (1.3 per cent of GDP) in 2017-18 to a surplus of $10.2 billion (0.5 per cent of GDP) in 2020-21. Over the medium term, the underlying cash balance is projected to peak at 0.5 per cent of GDP in 2026-27, before moderating to 0.4 per cent of GDP by 2027-28.
The net operating balance is also expected to improve from a deficit of $18.2 billion (1.0 per cent of GDP) in 2017-18 to projected surpluses of $6.8 billion (0.3 per cent of GDP) in 2019-20 and $20.9 billion (1.0 per cent of GDP) in 2020-21, as shown in Table 3.1.
Table 3.1: Budget aggregates
Budget$b
MYEFO$b
Budget$b
MYEFO$b
Underlying cash balance(a) -29.4 -23.6 -21.4 -20.5Per cent of GDP -1.6 -1.3 -1.1 -1.1
Net operating balance -19.8 -18.2 -10.8 -9.9Per cent of GDP -1.1 -1.0 -0.6 -0.5
Budget$b
MYEFO$b
Budget$b
MYEFO$b
Underlying cash balance(a) -2.5 -2.6 7.4 10.2Per cent of GDP -0.1 -0.1 0.4 0.5
Net operating balance 7.6 6.8 17.5 20.9Per cent of GDP 0.4 0.3 0.8 1.0
2019-20 2020-21
Estimates2017-18 2018-19
Projections
(a) Excludes expected net Future Fund earnings before 2020-21. The Government has continued to focus on controlling expenditure. Nominal payments over the four years to 2020-21 are now expected to be $6.5 billion lower than anticipated at the 2017-18 Budget. Taking account of Senate positions, all new spending has been more than offset, consistent with the Government’s fiscal strategy.

Part 3: Fiscal strategy and outlook
24
Economic parameter and other variations since the 2017-18 Budget have contributed to a $2.4 billion upward revision to total receipts over the four years to 2020-21. Stronger-than-expected company and superannuation fund taxes collections since Budget are largely offset by weaker forecasts for individuals income tax receipts.
FISCAL STRATEGY
Returning the budget to balance The Government remains committed to returning the budget to a sustainable surplus as soon as possible. Continued discipline to offset new expenditure and pass existing budget repair measures is needed to consolidate the budget and to lower government debt.
Table 3.2 provides key budget aggregates for the Australian Government general government sector.
Table 3.2: Australian Government general government sector budget aggregates
Budget MYEFO Budget MYEFO$b $b $b $b
Receipts 433.5 437.1 462.5 463.1Per cent of GDP 23.8 24.0 24.4 24.5
Payments(a) 459.7 457.6 480.4 480.1Per cent of GDP 25.2 25.2 25.4 25.4
Net Future Fund earnings(b) 3.2 3.1 3.5 3.5
Underlying cash balance(c) -29.4 -23.6 -21.4 -20.5Per cent of GDP -1.6 -1.3 -1.1 -1.1
Revenue 444.4 448.7 476.1 475.6Per cent of GDP 24.4 24.7 25.2 25.2
Expenses 464.3 466.9 486.9 485.5Per cent of GDP 25.5 25.7 25.7 25.7
Net operating balance -19.8 -18.2 -10.8 -9.9Per cent of GDP -1.1 -1.0 -0.6 -0.5
Net capital investment 0.5 0.2 4.8 4.8
Fiscal balance -20.3 -18.4 -15.5 -14.7Per cent of GDP -1.1 -1.0 -0.8 -0.8Memorandum items:Net Future Fund earnings(b) 3.2 3.1 3.5 3.5Headline cash balance -48.4 -39.6 -37.1 -36.2
Estimates2017-18 2018-19

Part 3: Fiscal strategy and outlook
25
Table 3.2: Australian Government general government sector budget aggregates (continued)
Budget MYEFO Budget MYEFO$b $b $b $b
Receipts 496.9 496.2 526.3 525.6Per cent of GDP 25.1 25.1 25.4 25.4
Payments(a) 495.6 495.0 518.9 515.4Per cent of GDP 25.0 25.1 25.0 24.9
Net Future Fund earnings(b) 3.7 3.9 na na
Underlying cash balance(c) -2.5 -2.6 7.4 10.2Per cent of GDP -0.1 -0.1 0.4 0.5
Revenue 510.8 507.8 540.4 538.2Per cent of GDP 25.8 25.7 26.0 26.0
Expenses 503.2 501.0 522.9 517.3Per cent of GDP 25.4 25.4 25.2 25.0
Net operating balance 7.6 6.8 17.5 20.9Per cent of GDP 0.4 0.3 0.8 1.0
Net capital investment 4.9 5.3 6.0 6.1
Fiscal balance 2.7 1.5 11.4 14.8Per cent of GDP 0.1 0.1 0.6 0.7Memorandum:Net Future Fund earnings(b) 3.7 3.9 4.0 4.1Headline cash balance -14.8 -13.2 11.7 17.4
2019-20 2020-21Projections
(a) Equivalent to cash payments for operating activities, purchases of non-financial assets and net
acquisition of assets under finance leases. (b) Under the Future Fund Act 2006, net Future Fund earnings will be available to meet the Government
superannuation liability in 2020-21. From this time, the underlying cash balance includes expected net Future Fund earnings.
(c) Excludes expected net Future Fund earnings before 2020-21. Expected total receipts have been revised up by around $3.6 billion in 2017-18 and $2.8 billion over the four years to 2020-21, relative to the levels at the time of the 2017-18 Budget. This is mainly driven by upwards revisions to the forecasts for company tax and superannuation fund taxes.
Estimated cash payments are lower for each year relative to the 2017-18 Budget. They have decreased by around $2.1 billion in 2017-18 and decreased in total by around $6.5 billion over the four years to 2020-21 compared with the 2017-18 Budget estimates.
In accordance with the Government’s budget repair strategy, increases in receipts and decreases in payments due to changes in the economy have flowed through to improve the budget bottom line. Excluding the effect of Senate positions, all new spending decisions have been more than offset by decisions to reduce spending elsewhere in the budget.

Part 3: Fiscal strategy and outlook
26
The 2017-18 MYEFO continues to project a return to surplus in 2020-21. The underlying cash balance is expected to improve from a deficit of $23.6 billion in 2017-18 (1.3 per cent of GDP) to a projected surplus of $10.2 billion in 2020-21 (0.5 per cent of GDP). Compared with the 2017-18 Budget, underlying cash balance estimates over the four years to 2020-21 have improved by a total of $9.3 billion.
The average pace of consolidation remains at 0.6 per cent over the forward estimates. A prudent and sustainable path to a surplus in 2020-21 has been maintained for five successive Budget updates, reflecting the Government’s demonstrated commitment to its fiscal strategy and budget repair.
The payments-to-GDP ratio — a key element of the Government’s medium-term fiscal strategy — is expected to be 25.2 per cent in 2017-18, falling to 24.9 per cent of GDP by 2020-21, slightly above the 30-year historical average of 24.8 per cent of GDP. Compared with the 2017-18 Budget, nominal payments have decreased by a total of $6.5 billion across the forward estimates. Further, average real growth in payments over the forward estimates is expected to be 1.9 per cent per annum, consistent with the 2017-18 Budget.
Net debt is expected to stabilise over the forward estimates, peaking at 19.2 per cent of GDP in 2018-19, an amount $11.9 billion lower than the peak estimated at Budget, and reducing to 17.2 per cent of GDP in 2020-21. Across the forward estimates, the value of net debt has improved since the 2017-18 Budget, reflecting lower levels of Commonwealth Government Securities (CGS) on issue due to a change in the financing requirement and an increase in investments, loans and placements, partly offset by a decrease in advances paid, predominantly relating to student loans.
On an accrual basis, the net operating balance is projected to return to surplus a year earlier than the underlying cash balance, reaching $6.8 billion (0.3 per cent of GDP) in 2019-20, with a further surplus of $20.9 billion (1.0 per cent of GDP) in 2020-21. After taking into account the net operating balance, infrastructure grants and non–cash accounting provisions, the Government is now not expected to need to borrow for recurrent spending from 2017-18, which is a year earlier than was expected at the time of the 2017-18 Budget.
Continued discipline will be required to maintain the current trajectory and to sustain underlying cash surpluses beyond 2020-21. The underlying cash balance is projected to record modest surpluses over the medium term, peaking at 0.5 per cent of GDP in 2026-27, before moderating to 0.4 per cent of GDP by 2027-28. These projections incorporate tax receipts reaching the tax-to-GDP ‘cap’ of 23.9 per cent in 2022-23, as was projected at the 2017-18 Budget. Beyond 2022-23, tax receipts are assumed to remain constant as a share of GDP.

Part 3: Fiscal strategy and outlook
27
Chart 3.1: Underlying cash balance projected to 2027-28
-3
-2
-1
0
1
2
-3
-2
-1
0
1
220
16-1
7
2017
-18
2018
-19
2019
-20
2020
-21
2021
-22
2022
-23
2023
-24
2024
-25
2025
-26
2026
-27
2027
-28
Per cent of GDP Per cent of GDP
2017-18 MYEFO
2017-18 Budget
2017-18 MYEFO -unconstrained
Note: A tax-to-GDP ‘cap’ of 23.9 per cent is applied to the 2017-18 MYEFO projections from 2022-23, as was projected at the 2017-18 Budget. Net Future Fund earnings are included in projections of the underlying cash balance from 2020-21 when drawdowns from the Future Fund are available. Source: Treasury projections. Chart 3.1 shows the projections of the underlying cash balance to 2027-28 compared with the projections at the 2017-18 Budget. The projections of the underlying cash balance over the medium term have slightly improved, driven by lower projected payments which more than offset lower tax receipts. The chart also illustrates the underlying cash balance projected to 2027-28 without the tax-to-GDP ‘cap’ assumption. In the absence of this assumption, the underlying cash balance is projected to reach a surplus of 1.6 per cent of GDP in 2027-28. This would be unrealistic, as unconstrained revenue projections imply constantly increasing average tax rates on personal income.
Strengthening the Government’s balance sheet A strong balance sheet provides the Government the flexibility to respond to unanticipated events during times of financial crises or economic shocks. Some key aggregates that relate to the balance sheet are set out in Table 3.3.

Part 3: Fiscal strategy and outlook
28
Table 3.3: Australian Government general government sector net worth, net financial worth, net debt and net interest payments
Budget MYEFO Budget MYEFO$b $b $b $b
Financial assets 393.5 397.3 422.6 419.1Non-financial assets 139.7 140.7 143.9 144.7Total assets 533.2 538.0 566.5 563.8Total liabilities 851.3 848.6 898.4 887.1Net worth -318.1 -310.7 -331.9 -323.3Net financial worth(a) -457.8 -451.3 -475.8 -468.0Per cent of GDP -25.1 -24.8 -25.1 -24.8
Net debt(b) 354.9 343.8 375.1 363.2Per cent of GDP 19.5 18.9 19.8 19.2
Net interest payments 13.4 13.4 13.7 13.2Per cent of GDP 0.7 0.7 0.7 0.7
Budget MYEFO Budget MYEFO$b $b $b $b
Financial assets 453.9 448.7 465.4 454.4Non-financial assets 148.3 149.2 153.8 154.6Total assets 602.2 597.9 619.2 608.9Total liabilities 929.0 917.2 930.6 910.1Net worth -326.8 -319.3 -311.4 -301.1Net financial worth(a) -475.0 -468.5 -465.3 -455.7Per cent of GDP -24.0 -23.7 -22.4 -22.1
Net debt(b) 374.7 365.2 366.2 355.3Per cent of GDP 18.9 18.5 17.6 17.2
Net interest payments 13.7 12.9 15.5 14.5Per cent of GDP 0.7 0.7 0.7 0.7
Estimates2017-18 2018-19
Projections2019-20 2020-21
(a) Net financial worth equals total financial assets minus total liabilities. (b) Net debt equals the sum of deposits held, government securities, loans and other borrowing, minus the
sum of cash and deposits, advances paid and investments, loans and placements. Net financial worth is an indicator of fiscal sustainability in the medium-term fiscal strategy. It measures the Government’s financial assets and liabilities, including both the assets of the Future Fund and the public superannuation liability that the Future Fund seeks to finance.
Compared with the 2017-18 Budget, net financial worth has improved over the forward estimates. Net financial worth is estimated to be -$451.3 billion in 2017-18, $6.5 billion better than estimated at the 2017-18 Budget. This reflects lower CGS issuance and an increase in the value of certain investments held by the Government, offset by a decrease in advances paid.
Net financial worth also improves as a share of GDP over the medium term, rising to -$299 billion (-10.1 per cent of GDP) by 2027-28.

Part 3: Fiscal strategy and outlook
29
Net worth is equal to total assets less total liabilities. It reflects the contribution of the Australian Government to the wealth of Australia. Compared with the 2017-18 Budget, net worth has improved over the forward estimates. Net worth is estimated to be -$310.7 billion in 2017-18, $7.4 billion higher than estimated at the 2017-18 Budget.
Net debt is the sum of selected financial liabilities less the sum of selected financial assets and is a common measure of the strength of a government’s financial position. High levels of net debt impose a call on future revenue flows to service that debt.
Net debt is estimated to peak as a proportion of GDP at 19.2 per cent in 2018-19, lower than the peak of 19.8 per cent expected at the 2017-18 Budget.
In the 2017-18 Budget, net debt was projected to be $366.2 billion in 2020-21. It is now projected to be $355.3 billion (or $10.9 billion lower) in 2020-21, declining as a share of GDP to 17.2 per cent.
In the 2017-18 Budget, net debt was projected to be $256 billion in 2027-28. Net debt is now projected to reach $228 billion by 2027-28 ($28 billion lower), falling to 7.7 per cent of GDP (Chart 3.2).
Chart 3.2: Net debt projected to 2027-28
0
5
10
15
20
0
5
10
15
20
2016
-17
2017
-18
2018
-19
2019
-20
2020
-21
2021
-22
2022
-23
2023
-24
2024
-25
2025
-26
2026
-27
2027
-28
Per cent of GDPPer cent of GDP
2017-18 MYEFO
2017-18 Budget
Note: A tax-to-GDP ‘cap’ of 23.9 per cent is applied to the 2017-18 MYEFO projections from 2022-23, as was projected at 2017-18 Budget. Source: Treasury projections.

Part 3: Fiscal strategy and outlook
30
Gross debt, as measured by the face value of CGS on issue, is estimated to rise from $534 billion in 2017-18 to $591 billion in 2019-20 before falling to $583 billion by the end of the forward estimates period ($23 billion lower than projected at Budget).
At the 2017-18 Budget, gross debt was projected to be $725 billion in 2027-28. Gross debt is now projected to reach around $684 billion by 2027-28 — a fall of around $40 billion (Chart 3.3).
The projected increase in the level of gross debt over the medium term reflects the Government’s decision not to drawdown on the Future Fund’s earnings over the medium term to meet unfunded superannuation liabilities, as well as financing the Government’s infrastructure and Defence Force recapitalisation programs.
Chart 3.3: Gross debt projected to 2027-28
0
100
200
300
400
500
600
700
800
0
100
200
300
400
500
600
700
800
2016
-17
2017
-18
2018
-19
2019
-20
2020
-21
2021
-22
2022
-23
2023
-24
2024
-25
2025
-26
2026
-27
2027
-28
$billion$billion
2017-18 Budget
2017-18 MYEFO
Note: A tax-to-GDP ‘cap’ of 23.9 per cent is applied to the 2017-18 MYEFO projections from 2022-23, as was projected at 2017-18 Budget. Source: Australian Office of Financial Management and Treasury projections. The Government’s fiscal strategy is outlined in Box A.

Part 3: Fiscal strategy and outlook
31
Box A: The Government’s fiscal strategy
Medium-term fiscal strategy
The Government’s medium-term fiscal strategy is to achieve budget surpluses, on average, over the course of the economic cycle. The fiscal strategy underlines the commitment to budget discipline and outlines how the Government will set medium-term fiscal policy while allowing for flexibility in response to changing economic conditions.
The strategy is underpinned by the following four policy elements:
• investing in a stronger economy by redirecting Government spending to quality investment to boost productivity and workforce participation;
• maintaining strong fiscal discipline by controlling expenditure to reduce the Government’s share of the economy over time in order to free up resources for private investment to drive jobs and economic growth, with:
− the payments-to-GDP ratio falling;
− stabilising and then reducing net debt over time;
• supporting revenue growth by supporting policies that drive earnings and economic growth; and
• strengthening the Government’s balance sheet by improving net financial worth over time.
Budget repair strategy
The budget repair strategy is designed to deliver sustainable budget surpluses building to at least 1 per cent of GDP as soon as possible, consistent with the medium-term fiscal strategy.
The strategy sets out that:
• new spending measures will be more than offset by reductions in spending elsewhere within the budget;
• the overall impact of shifts in receipts and payments due to changes in the economy will be banked as an improvement to the budget bottom line, if this impact is positive; and
• a clear path back to surplus is underpinned by decisions that build over time.
The budget repair strategy will stay in place until a strong and sustainable surplus is achieved and so long as economic growth prospects are sound and unemployment remains low.

Part 3: Fiscal strategy and outlook
32
FISCAL OUTLOOK
Budget aggregates An underlying cash deficit of $23.6 billion (1.3 per cent of GDP) is expected in 2017-18, improving to a projected surplus of $10.2 billion (0.5 per cent of GDP) in 2020-21.
In accrual terms, a net operating deficit of $18.2 billion (1.0 per cent of GDP) is expected in 2017-18, improving to a projected surplus of $6.8 billion (0.3 per cent of GDP) in 2019-20 and a larger projected surplus of $20.9 billion (1.0 per cent of GDP) in 2020-21.
A headline cash deficit of $39.6 billion (2.2 per cent of GDP) is expected in 2017-18, improving to a projected surplus of $17.4 billion (0.8 per cent of GDP) in 2020-21.
Table 3.4: Summary of Australian Government general government sector cash flows
Budget MYEFO Budget MYEFO$b $b $b $b
Cash receiptsOperating cash receipts 432.1 435.7 461.8 462.4Capital cash receipts(a) 1.4 1.4 0.7 0.7
Total cash receipts 433.5 437.1 462.5 463.1
Cash paymentsOperating cash payments 446.2 444.4 466.6 466.1Capital cash payments(b) 13.5 13.2 13.8 14.0
Total cash payments 459.7 457.6 480.4 480.1
GFS cash surplus(+)/deficit(-)(c) -26.2 -20.5 -17.9 -17.0Per cent of GDP -1.4 -1.1 -0.9 -0.9
less Finance leases and similar arrangements(c)(d) 0.0 0.0 0.0 0.0less Net Future Fund earnings(e) 3.2 3.1 3.5 3.5
Underlying cash balance(f) -29.4 -23.6 -21.4 -20.5Per cent of GDP -1.6 -1.3 -1.1 -1.1Memorandum:Net cash flows from investments in financial
assets for policy purposes -22.2 -19.0 -19.2 -19.2plus Net Future Fund earnings(e) 3.2 3.1 3.5 3.5Headline cash balance -48.4 -39.6 -37.1 -36.2Net Future Fund earnings(e) 3.2 3.1 3.5 3.5
Estimates2017-18 2018-19

Part 3: Fiscal strategy and outlook
33
Table 3.4: Summary of Australian Government general government sector cash flows (continued)
Budget MYEFO Budget MYEFO$b $b $b $b
Cash receiptsOperating cash receipts 496.1 495.4 526.3 525.5Capital cash receipts(a) 0.8 0.9 0.1 0.1
Total cash receipts 496.9 496.2 526.3 525.6
Cash paymentsOperating cash payments 480.9 480.2 503.1 499.6Capital cash payments(b) 14.7 14.8 15.8 15.9
Total cash payments 495.6 495.0 518.9 515.4
GFS cash surplus(+)/deficit(-)(c) 1.3 1.2 7.4 10.2Per cent of GDP 0.1 0.1 0.4 0.5
less Finance leases and similar arrangements(c)(d) 0.0 0.0 0.0 0.0less Net Future Fund earnings(e) 3.7 3.9 na na
Underlying cash balance(f) -2.5 -2.6 7.4 10.2Per cent of GDP -0.1 -0.1 0.4 0.5Memorandum:Net cash flows from investments in financial
assets for policy purposes -16.1 -14.4 4.3 7.2plus Net Future Fund earnings(e) 3.7 3.9 na naHeadline cash balance -14.8 -13.2 11.7 17.4Net Future Fund earnings(e) 3.7 3.9 4.0 4.1
Projections2019-20 2020-21
(a) Equivalent to cash receipts from the sale of non-financial assets in the cash flow statement. (b) Equivalent to cash payments for purchases of non-financial assets in the cash flow statement. (c) Due to the implementation of the 2015 ABS GFS Manual, from the 2017-18 Budget, finance leases are
no longer deducted in the derivation of the GFS cash surplus/deficit. (d) The acquisition of assets under finance leases worsens the underlying cash balance. The disposal of
assets previously held under finance leases improves the underlying cash balance. (e) Under the Future Fund Act 2006, net Future Fund earnings will be available to meet the Government
superannuation liability in 2020-21. From this time, the underlying cash balance includes expected net Future Fund earnings.
(f) Excludes expected net Future Fund earnings before 2020-21.
Underlying cash balance estimates The estimated underlying cash deficit in 2017-18 has improved by $5.8 billion compared with the 2017-18 Budget. Table 3.5 provides a reconciliation of the variations in the underlying cash balance since the 2017-18 Budget.
Since the 2017-18 Budget, policy decisions, after taking account of Senate positions, have resulted in a $573 million improvement in the underlying cash balance over the forward estimates.
Since the 2017-18 Budget, the effect of parameter and other variations has resulted in a $2.4 billion increase in forecast receipts and a $8.8 billion decrease in payments over the forward estimates.

Part 3: Fiscal strategy and outlook
34
From 2020-21 onwards, net Future Fund earnings are included in the calculation of the underlying cash balance because the Future Fund becomes available to meet the Government’s superannuation liabilities from that year. The earnings do not include unrealised gains from the Future Fund that are the basis of the investment mandate provided to the Future Fund by the Government. Net Future Fund earnings are excluded from the calculation of the underlying cash balance between 2005-06 and 2019-20 as, under the Future Fund Act 2006, earnings are required to be reinvested to meet the future public sector superannuation liabilities in these years.
Table 3.5: Reconciliation of general government sector underlying cash balance estimates
2017-18 2018-19 2019-20 2020-21 Total$m $m $m $m $m
2017-18 Budget underlying cash balance(a) -29,396 -21,422 -2,470 7,417 -45,870Per cent of GDP -1.6 -1.1 -0.1 0.4
Changes from 2017-18 Budget to 2017-18 MYEFOEffect of policy decisions(b)(c)
Receipts 280 -258 271 72 365Payments 1,351 273 535 151 2,309
Total policy decisions impact onunderlying cash balance -1,071 -531 -264 -79 -1,944
Effect of parameter and other variations(c)Receipts 3,301 849 -932 -784 2,433Payments -3,430 -602 -1,144 -3,609 -8,785less Net Future Fund earnings(d) -128 -9 116 na -22
Total parameter and other variations impact onunderlying cash balance 6,859 1,460 96 2,825 11,240
2017-18 MYEFO underlying cash balance(a) -23,608 -20,493 -2,638 10,163 -36,575Per cent of GDP -1.3 -1.1 -0.1 0.5Memorandum:Net Future Fund earnings(d) 3,076 3,503 3,861 4,115 14,556
Estimates Projections
(a) Excludes expected net Future Fund earnings before 2020-21. (b) Excludes secondary impacts on public debt interest of policy decisions and offsets from the Contingency
Reserve for decisions taken. (c) A positive number for receipts improves the underlying cash balance, while a positive number for
payments worsens the underlying cash balance. (d) Under the Future Fund Act 2006, net Future Fund earnings will be available to meet the Government
superannuation liability in 2020-21. From this time, the underlying cash balance includes expected net Future Fund earnings.
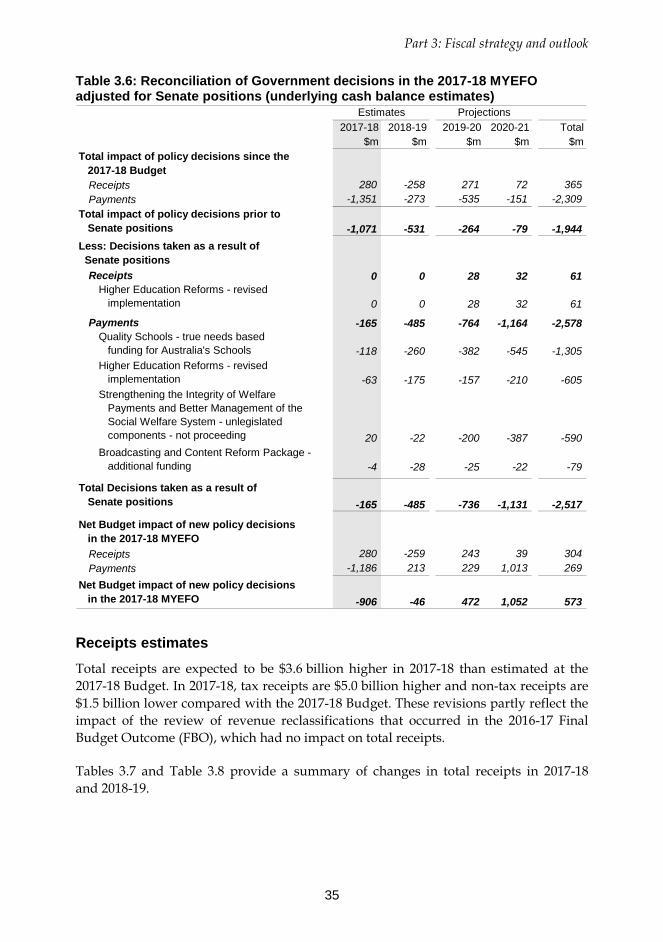
Decisions taken since the 2017-18 Budget as a result of Senate positions had a net negative impact on the underlying cash balance of $2.5 billion over the forward estimates. Adjusting for these decisions, including those that helped secure parliamentary support for the Government’s School Reform Package and the impact of a revised Higher Education Reform Package, the net impact of policy decisions taken since the 2017-18 Budget is a $573 million improvement in the underlying cash balance over the forward estimates, as illustrated in Table 3.6 below.
Part 3: Fiscal strategy and outlook
35
Table 3.6: Reconciliation of Government decisions in the 2017-18 MYEFO adjusted for Senate positions (underlying cash balance estimates)
2017-18 2018-19 2019-20 2020-21 Total$m $m $m $m $m
Total impact of policy decisions since the 2017-18 Budget
Receipts 280 -258 271 72 365Payments -1,351 -273 -535 -151 -2,309
Total impact of policy decisions prior to Senate positions -1,071 -531 -264 -79 -1,944Less: Decisions taken as a result of Senate positions
Receipts 0 0 28 32 61Higher Education Reforms - revised implementation 0 0 28 32 61
Payments -165 -485 -764 -1,164 -2,578Quality Schools - true needs based funding for Australia's Schools -118 -260 -382 -545 -1,305Higher Education Reforms - revised implementation -63 -175 -157 -210 -605Strengthening the Integrity of Welfare Payments and Better Management of the Social Welfare System - unlegislated components - not proceeding 20 -22 -200 -387 -590Broadcasting and Content Reform Package - additional funding -4 -28 -25 -22 -79
Total Decisions taken as a result of Senate positions -165 -485 -736 -1,131 -2,517
Net Budget impact of new policy decisions in the 2017-18 MYEFO
Receipts 280 -259 243 39 304Payments -1,186 213 229 1,013 269
Net Budget impact of new policy decisions in the 2017-18 MYEFO -906 -46 472 1,052 573
Estimates Projections
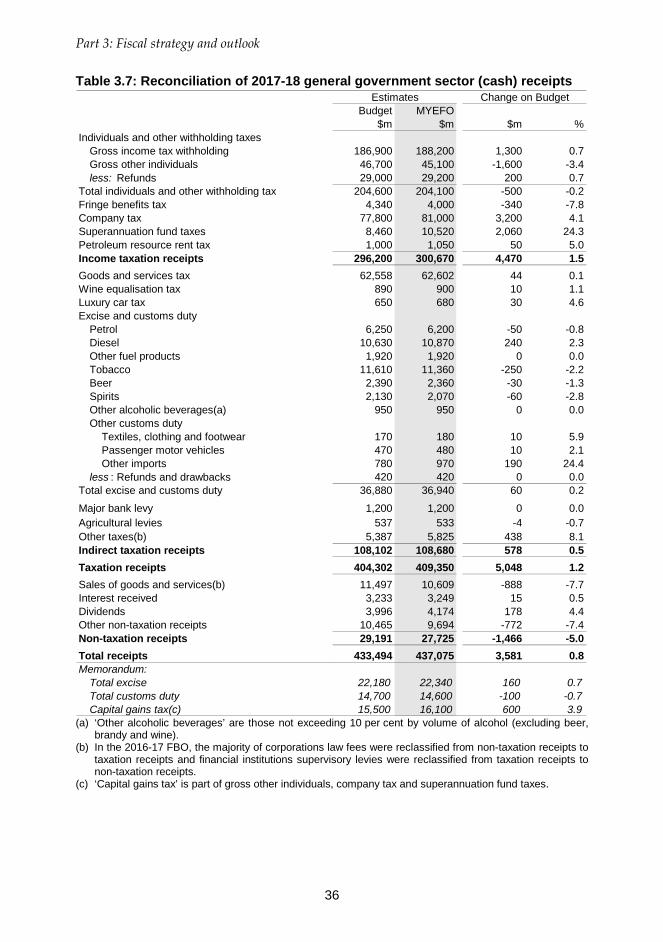
Receipts estimates Total receipts are expected to be $3.6 billion higher in 2017-18 than estimated at the 2017-18 Budget. In 2017-18, tax receipts are $5.0 billion higher and non-tax receipts are $1.5 billion lower compared with the 2017-18 Budget. These revisions partly reflect the impact of the review of revenue reclassifications that occurred in the 2016-17 Final Budget Outcome (FBO), which had no impact on total receipts.
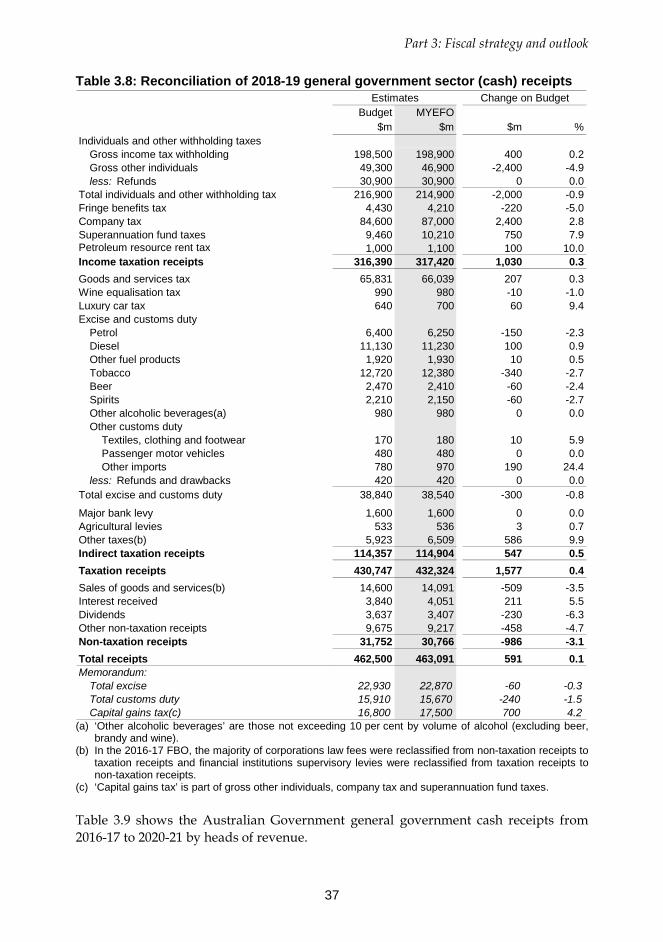
Tables 3.7 and Table 3.8 provide a summary of changes in total receipts in 2017-18 and 2018-19.
Part 3: Fiscal strategy and outlook
36
Table 3.7: Reconciliation of 2017-18 general government sector (cash) receipts Estimates Change on Budget
Budget MYEFO$m $m $m %
Individuals and other withholding taxesGross income tax withholding 186,900 188,200 1,300 0.7Gross other individuals 46,700 45,100 -1,600 -3.4less: Refunds 29,000 29,200 200 0.7
Total individuals and other withholding tax 204,600 204,100 -500 -0.2Fringe benefits tax 4,340 4,000 -340 -7.8Company tax 77,800 81,000 3,200 4.1Superannuation fund taxes 8,460 10,520 2,060 24.3Petroleum resource rent tax 1,000 1,050 50 5.0Income taxation receipts 296,200 300,670 4,470 1.5Goods and services tax 62,558 62,602 44 0.1Wine equalisation tax 890 900 10 1.1Luxury car tax 650 680 30 4.6Excise and customs duty
Petrol 6,250 6,200 -50 -0.8Diesel 10,630 10,870 240 2.3Other fuel products 1,920 1,920 0 0.0Tobacco 11,610 11,360 -250 -2.2Beer 2,390 2,360 -30 -1.3Spirits 2,130 2,070 -60 -2.8Other alcoholic beverages(a) 950 950 0 0.0Other customs duty Textiles, clothing and footwear 170 180 10 5.9 Passenger motor vehicles 470 480 10 2.1 Other imports 780 970 190 24.4less : Refunds and drawbacks 420 420 0 0.0
Total excise and customs duty 36,880 36,940 60 0.2
Major bank levy 1,200 1,200 0 0.0Agricultural levies 537 533 -4 -0.7Other taxes(b) 5,387 5,825 438 8.1Indirect taxation receipts 108,102 108,680 578 0.5Taxation receipts 404,302 409,350 5,048 1.2Sales of goods and services(b) 11,497 10,609 -888 -7.7Interest received 3,233 3,249 15 0.5Dividends 3,996 4,174 178 4.4Other non-taxation receipts 10,465 9,694 -772 -7.4Non-taxation receipts 29,191 27,725 -1,466 -5.0Total receipts 433,494 437,075 3,581 0.8Memorandum:
Total excise 22,180 22,340 160 0.7Total customs duty 14,700 14,600 -100 -0.7Capital gains tax(c) 15,500 16,100 600 3.9
(a) ‘Other alcoholic beverages’ are those not exceeding 10 per cent by volume of alcohol (excluding beer, brandy and wine).
(b) In the 2016-17 FBO, the majority of corporations law fees were reclassified from non-taxation receipts to taxation receipts and financial institutions supervisory levies were reclassified from taxation receipts to non-taxation receipts.
(c) ‘Capital gains tax’ is part of gross other individuals, company tax and superannuation fund taxes.
Part 3: Fiscal strategy and outlook
37
Table 3.8: Reconciliation of 2018-19 general government sector (cash) receipts Estimates Change on Budget
Budget MYEFO$m $m $m %
Individuals and other withholding taxesGross income tax withholding 198,500 198,900 400 0.2Gross other individuals 49,300 46,900 -2,400 -4.9less: Refunds 30,900 30,900 0 0.0
Total individuals and other withholding tax 216,900 214,900 -2,000 -0.9Fringe benefits tax 4,430 4,210 -220 -5.0Company tax 84,600 87,000 2,400 2.8Superannuation fund taxes 9,460 10,210 750 7.9Petroleum resource rent tax 1,000 1,100 100 10.0Income taxation receipts 316,390 317,420 1,030 0.3Goods and services tax 65,831 66,039 207 0.3Wine equalisation tax 990 980 -10 -1.0Luxury car tax 640 700 60 9.4Excise and customs duty
Petrol 6,400 6,250 -150 -2.3Diesel 11,130 11,230 100 0.9Other fuel products 1,920 1,930 10 0.5Tobacco 12,720 12,380 -340 -2.7Beer 2,470 2,410 -60 -2.4Spirits 2,210 2,150 -60 -2.7Other alcoholic beverages(a) 980 980 0 0.0Other customs duty Textiles, clothing and footwear 170 180 10 5.9 Passenger motor vehicles 480 480 0 0.0 Other imports 780 970 190 24.4less: Refunds and drawbacks 420 420 0 0.0
Total excise and customs duty 38,840 38,540 -300 -0.8
Major bank levy 1,600 1,600 0 0.0Agricultural levies 533 536 3 0.7Other taxes(b) 5,923 6,509 586 9.9Indirect taxation receipts 114,357 114,904 547 0.5Taxation receipts 430,747 432,324 1,577 0.4Sales of goods and services(b) 14,600 14,091 -509 -3.5Interest received 3,840 4,051 211 5.5Dividends 3,637 3,407 -230 -6.3Other non-taxation receipts 9,675 9,217 -458 -4.7Non-taxation receipts 31,752 30,766 -986 -3.1Total receipts 462,500 463,091 591 0.1Memorandum:
Total excise 22,930 22,870 -60 -0.3Total customs duty 15,910 15,670 -240 -1.5Capital gains tax(c) 16,800 17,500 700 4.2
(a) ‘Other alcoholic beverages’ are those not exceeding 10 per cent by volume of alcohol (excluding beer, brandy and wine).
(b) In the 2016-17 FBO, the majority of corporations law fees were reclassified from non-taxation receipts to taxation receipts and financial institutions supervisory levies were reclassified from taxation receipts to non-taxation receipts.
(c) ‘Capital gains tax’ is part of gross other individuals, company tax and superannuation fund taxes. Table 3.9 shows the Australian Government general government cash receipts from 2016-17 to 2020-21 by heads of revenue.

Part 3: Fiscal strategy and outlook
38
Table 3.9: Australian Government general government sector (cash) receipts Actual Projections2016-17 2017-18 2018-19 2019-20 2020-21
$m $m $m $m $mIndividuals and other withholding taxes
Gross income tax withholding 179,355 188,200 198,900 214,300 228,800Gross other individuals 42,871 45,100 46,900 50,900 55,100less: Refunds 28,364 29,200 30,900 32,500 33,500
Total individuals and otherwithholding tax 193,863 204,100 214,900 232,700 250,400
Fringe benefits tax 4,046 4,000 4,210 4,500 4,750Company tax 68,390 81,000 87,000 92,400 96,000Superannuation fund taxes 8,218 10,520 10,210 11,160 12,260Petroleum resource rent tax(a) 981 1,050 1,100 1,100 1,100Income taxation receipts 275,498 300,670 317,420 341,860 364,510Goods and services tax 60,023 62,602 66,039 68,515 72,185Wine equalisation tax 842 900 980 1,050 1,090Luxury car tax 664 680 700 750 790Excise and customs duty
Petrol 6,174 6,200 6,250 6,650 6,850Diesel 10,341 10,870 11,230 11,980 12,430Other fuel products 1,948 1,920 1,930 2,030 2,060Tobacco 10,453 11,360 12,380 13,700 14,820Beer 2,375 2,360 2,410 2,500 2,560Spirits 2,057 2,070 2,150 2,220 2,310Other alcoholic beverages(b) 919 950 980 1,030 1,040Other customs duty
Textiles, clothing and footwear 279 180 180 180 190
Passenger motor vehicles 540 480 480 490 550 Other imports 1,148 970 970 1,000 1,070less: Refunds and drawbacks 397 420 420 420 420
Total excise and customs duty 35,837 36,940 38,540 41,360 43,460Major bank levy - 1,200 1,600 1,700 1,800Agricultural levies 547 533 536 547 557Other taxes(c) 5,860 5,825 6,509 6,887 7,113Indirect taxation receipts 103,773 108,680 114,904 120,809 126,995Taxation receipts 379,271 409,350 432,324 462,669 491,505Sales of goods and services(c) 8,050 10,609 14,091 14,930 15,230Interest received 2,925 3,249 4,051 4,893 5,342Dividends 6,874 4,174 3,407 4,105 4,542Other non-taxation receipts 12,748 9,694 9,217 9,648 8,991Non-taxation receipts 30,597 27,725 30,766 33,577 34,105Total receipts 409,868 437,075 463,091 496,246 525,609Memorandum:
Total excise 21,800 22,340 22,870 24,270 25,010Total customs duty 14,037 14,600 15,670 17,090 18,450Capital gains tax(d) 12,700 16,100 17,500 18,900 20,400
Estimates
(a) This item includes a small amount of MRRT receipts relating to a pre-2013-14 income year which cannot
be separately disclosed owing to taxpayer confidentiality. (b) ‘Other alcoholic beverages’ are those not exceeding 10 per cent by volume of alcohol (excluding beer,
brandy and wine). (c) In the 2016-17 FBO, the majority of corporations law fees were reclassified from non-taxation receipts to
taxation receipts and financial institutions supervisory levies were reclassified from taxation receipts to non-taxation receipts.
(d) ‘Capital gains tax’ is part of gross other individuals, company tax and superannuation fund taxes. The 2016-17 reported figure is an estimate.

Part 3: Fiscal strategy and outlook
39
Policy decisions
Policy decisions since the 2017-18 Budget have increased total receipts by $280 million in 2017-18 and by $365 million over the forward estimates period.
Parameter and other variations
Parameter and other variations have increased total receipts since the 2017-18 Budget by $3.3 billion in 2017-18 and $2.4 billion over the forward estimates period.
Parameter and other variations have decreased non-taxation receipts since the 2017-18 Budget by $1.8 billion in 2017-18 and $2.6 billion over the forward estimates period, largely reflecting the impact of revenue reclassifications that occurred in the 2016-17 FBO, which had no impact on total receipts.
Parameter and other variations, including the impact of the revenue reclassifications, have increased tax receipts since the 2017-18 Budget by $5.1 billion in 2017-18 and $5.0 billion over the forward estimates period. Excluding GST, parameter and other variations have increased tax receipts by $5.0 billion in 2017-18 and by $3.6 billion over the forward estimates. This revision reflects stronger-than-expected collections from company tax and superannuation fund taxes. Weaker forecasts for wages and unincorporated business income are expected to weigh on individuals’ income tax.
The key economic parameters that influence tax receipts and tax revenue are shown in Table 3.10. The table shows effects on the Australian Government’s main tax bases of the changed circumstances and outlook since the 2017-18 Budget.
Table 3.10: Key economic parameters(a) Outcome Estimates Projections
2016-17 2017-18 2018-19 2019-20 2020-21Revenue parameters at 2017-18 MYEFO
Nominal gross domestic product 5.8 3 1/2 4 4 1/2 4 3/4Change since 2017-18 Budget -0.1 - 1/2 0 0 0
Compensation of employees(b) 2.2 3 3/4 3 3/4 4 3/4 5 1/4Change since 2017-18 Budget 0.0 1/4 - 1/2 - 1/4 0
Corporate gross operating surplus(c) 14.0 5 1/2 3 3/4 3 1/2 3 1/4Change since 2017-18 Budget -0.2 - 1/4 1 1/4 0
Unincorporated business income 3.2 3 5 1/4 5 1/4 5 1/4Change since 2017-18 Budget -1.5 -2 3/4 3/4 1/2 - 1/2
Property income(d) 2.5 4 6 4 3/4 5Change since 2017-18 Budget -0.7 -1 3/4 1/4 - 1/2 - 1/4
Consumption subject to GST 2.9 3 1/4 5 5 1/2 5 1/4Change since 2017-18 Budget -0.5 -1 1/2 - 1/2 - 1/4 - 1/2
(a) Current prices, per cent change on previous year. Changes since the 2017-18 Budget are percentage points and may not reconcile due to rounding.
(b) Compensation of employees measures total remuneration earned by employees. (c) Corporate gross operating surplus is an Australian System of National Accounts measure of company
profits, gross of depreciation. (d) Property income measures income derived from interest, rent and dividends.
Part 3: Fiscal strategy and outlook
40
Excluding policy decisions, individuals taxes have been revised down by $500 million (0.2 per cent) in 2017-18 and $8.0 billion over the forward estimates. This reflects weaker forecasts for average wages growth and unincorporated business income.
Excluding policy decisions, company tax receipts have been revised up by $3.2 billion (4.1 per cent) in 2017-18 and $7.4 billion over the forward estimates. This is driven by stronger-than-expected collections in the year to date (partly reflecting higher mining profits in 2016-17), successful ATO enforcement activity and higher forecast growth for corporate profits from 2018-19.
Excluding policy decisions, superannuation fund taxes have been revised up by $2.1 billion in 2017-18 and $3.4 billion over the forward estimates. This is driven by stronger-than-expected collections from APRA funds. Higher capital gains tax receipts are expected in the near term as some superannuation funds have used up the stock of capital losses they accumulated in previous years.
Excluding policy decisions, goods and services tax receipts have been revised up by $100 million in 2017-18 and $1.4 billion over the forward estimates. This reflects stronger-than-expected collections since the Budget, including the 2016-17 outcome, partly offset by a weaker forecast for growth in consumption subject to GST.
Excluding policy decisions, excise and customs duties have been revised up by $60 million in 2017-18 and down by $1.2 billion over the forward estimates, with lower forecasts for tobacco, alcohol and petrol partly offset by higher forecasts for diesel and other customs duty.
The estimate for the major bank levy is the same as at the 2017-18 Budget. Recent data from the major banks was in line with expectations. The first instalments are due in March 2018.
Analysis of the sensitivity of the receipts estimates to changes in the economic outlook is provided in Attachment A to this part.
The 2017-18 MYEFO continues to include provisions for a number of Free Trade Agreements (FTAs) which have not been finalised:
• Environmental Goods Agreement;
• FTA with the Gulf Cooperation Council;
• India FTA — Comprehensive Economic Cooperation Agreement;
• Regional Comprehensive Economic Partnership;
• Australia’s accession to the World Trade Organisation Government Procurement Agreement;
Part 3: Fiscal strategy and outlook
41
• Indonesia-Australia Comprehensive Economic Partnership Agreement; and
• Australia-Hong Kong Free Trade Agreement.
The 2017-18 MYEFO also includes new provisions for the Pacific Alliance Free Trade Agreement, Peru-Australia Free Trade Agreement and the Australia-European Union Free Trade Agreement.
Payments estimates Since the 2017-18 Budget, total cash payments for 2017-18 have decreased by $2.1 billion and have decreased by $6.5 billion over the four years to 2020-21. The overall net impact of payment related decisions (excluding the impact of Senate positions) has decreased total cash payments by $269 million over the four years to 2020-21.
Policy decisions
Major increases in payments as a result of policy decisions since the 2017-18 Budget include:
• introducing new and amended listings on the Pharmaceutical Benefits Scheme and the Repatriation Pharmaceutical Benefits Scheme, which is expected to increase payments by $2.1 billion over the four years to 2020-21;
• implementing the Quality Schools reform package to build on the 2017-18 Budget measure titled Quality Schools - true needs-based funding for Australia's schools, which delivers a consistent Commonwealth approach for all schools in all States and Territories. This is expected to increase payments by $1.3 billion over the four years to 2020-21;
• proceeding with Higher Education Reform to improve transparency, accountability, affordability and responsiveness to the aspirations of students and future workforce needs. This is expected to increase payments by $605 million over the four years to 2020-21; and
• providing additional funding in response to recommendations from the 2017 Independent Intelligence Review, including establishing the Office of National Intelligence, which is expected to increase payments by $118 million over the four years to 2020-21.
Major decreases in payments as a result of policy decisions since the 2017-18 Budget include:
• extending and expanding the requirements for newly arrived migrants to wait before they can access certain welfare payments, which is expected to decrease payments by $1.2 billion over the four years to 2020-21;

Part 3: Fiscal strategy and outlook
42
• improving the integrity of payments to family day care services through increased compliance efforts to ensure a strong transition to the new Child Care package, which is expected to decrease payments by $1.0 billion over the four years to 2020-21;
• requiring Family Tax Benefit lump-sum, reconciliation or instalment arrears payments to be used to repay outstanding social security, student assistance or Paid Parental Leave debts. This is expected to decrease payments by $405 million over the four years to 2020-21; and
• maintaining the higher income thresholds and supplement amounts for family payments at their current levels until 30 June 2021, which is expected to decrease payments by $186 million over the four years to 2020-21.
Parameter and other variations
Parameter and other variations have decreased total cash payments since the 2017-18 Budget by $3.4 billion in 2017-18 and $8.8 billion over the four years to 2020-21.
Major decreases in cash payments as a result of parameter and other variations since the 2017-18 Budget include:
• payments related to the Income Support for People with Disability program, which are expected to decrease by $439 million in 2017-18 ($1.5 billion over the four years to 2020-21), largely reflecting lower-than-expected recipient numbers;
• payments related to the Student Payments program, which are expected to decrease by $252 million in 2017-18 ($1.2 billion over the four years to 2020-21), largely reflecting lower-than-expected recipient numbers and higher recipient earnings reducing average payment rates, resulting from more students moving into work;
• payments related to the Parents Income Support program, which are expected to decrease by $175 million in 2017-18 ($1.1 billion over the four years to 2020-21), largely reflecting lower-than-expected recipient numbers and lower than forecast average payment rates, resulting in part from Government policies aimed at ensuring fewer Australians move onto welfare and more move from welfare to work;
• payments related to the Income Support for Seniors program, which are expected to decrease by $361 million in 2017-18 ($755 million over the four years to 2020-21), largely reflecting slower-than-expected growth in the number of Age Pension recipients. This has been partially offset by higher-than-expected average Age Pension payment rates; and

Part 3: Fiscal strategy and outlook
43
• payments related to the Research and Development Tax Incentive program, which are expected to decrease by $128 million in 2017-18 ($696 million over the four years to 2020-21), primarily reflecting reduced eligible incentive amounts and lower than forecast claims.
Major increases in cash payments as a result of parameter and other variations since the 2017-18 Budget include:
• payments relating to the Fuel Tax Credits Scheme, which are expected to increase by $290 million in 2017-18 ($1.1 billion over the four years to 2020-21), largely reflecting higher-than-expected usage of fuels that are eligible for Fuel Tax Credits;
• payments to the States and Territories under the Natural Disaster Relief and Recovery Arrangement program, which are expected to increase by $88 million in 2017-18 ($812 million over the three years to 2019-20), largely reflecting the impacts of Tropical Cyclone Debbie which were not available for inclusion at the time of the 2017-18 Budget;
• payments relating to the Medical Benefits program, which are expected to increase by $78 million in 2017-18 ($405 million over the four years to 2020-21), reflecting ongoing growth in the access to, and use of, medical services;
• payments related to the Military Rehabilitation Compensation Acts – Income Support and Compensation program, which are expected to increase by $140 million in 2017-18 ($251 million over the four years to 2020-21), largely reflecting an increase in claims processing capabilities; and
• payments related to the Australian Screen Production Incentive program, which are expected to increase by $115 million in 2017-18 ($167 million over four years to 2020-21), largely reflecting tax offsets for qualifying film expenditure in the 2016-17 financial year to be paid in 2017-18.
Consistent with previous budgets, the underlying cash balance has been improved by the regular draw down of the conservative bias allowance. Details of this draw down are provided at Attachment C to this part.
Analysis of the sensitivity of the payments estimates to changes in the economic outlook is provided in Attachment A to this part.
Net operating balance estimates Table 3.11 provides a reconciliation of net operating balance estimates, including the impact of policy decisions and parameter and other variations on revenue and expenses since the 2017-18 Budget.

Part 3: Fiscal strategy and outlook
44
Table 3.11: Reconciliation of general government sector net operating balance estimates
Estimates2017-18 2018-19 2019-20 2020-21 Total
$m $m $m $m $m2017-18 Budget net operating balance -19,848 -10,765 7,622 17,471 -5,520Per cent of GDP -1.1 -0.6 0.4 0.8
Changes from 2017-18 Budget to 2017-18 MYEFOEffect of policy decisions(a)(b)
Revenue -197 -367 -131 -408 -1,102Expenses 877 40 384 98 1,398
Total policy decisions impact onnet operating balance -1,073 -406 -515 -505 -2,500
Effect of parameter and other variations(b)Revenue 4,484 -144 -2,878 -1,750 -287Expenses 1,798 -1,391 -2,556 -5,687 -7,836
Total parameter and other variations impact on net operating balance 2,686 1,247 -322 3,937 7,548
2017-18 MYEFO net operating balance -18,235 -9,924 6,785 20,902 -472Per cent of GDP -1.0 -0.5 0.3 1.0Net capital investmentEffect of net capital investment(c) 193 4,823 5,261 6,094 16,3712017-18 MYEFO fiscal balance -18,428 -14,747 1,524 14,808 -16,843Per cent of GDP -1.0 -0.8 0.1 0.7
Projections
(a) Excludes secondary impacts on public debt interest of policy decisions and offsets from the Contingency
Reserve for decisions taken. (b) A positive number for revenue improves the net operating balance, while a positive number for expenses
worsens the net operating balance. (c) A positive number for net capital investment worsens the fiscal balance. Compared with the 2017-18 Budget, the net operating balance is expected to improve by $1.6 billion in 2017-18 and $5.0 billion over the forward estimates.
Revenue estimates Total revenue has been revised up by $4.3 billion in 2017-18 since the 2017-18 Budget.
While changes in tax revenue (measured when the obligation to pay tax is incurred) are generally driven by the same factors as tax receipts (measured when the tax is collected), there are differences as not all revenue raised in a given year is actually paid in that year. These differences exist for most revenue heads and vary across years.
Detailed Australian Government general government sector revenue estimates for 2017-18 and 2018-19, compared with estimates from the 2017-18 Budget, are provided in Tables 3.12 and 3.13 respectively. Table 3.14 shows the Australian Government general government revenue from 2016-17 to 2020-21 by heads of revenue.

Part 3: Fiscal strategy and outlook
45
Table 3.12: Reconciliation of 2017-18 general government sector (accrual) revenue
Estimates Change on BudgetBudget MYEFO
$m $m $m %Individuals and other withholding taxes
Gross income tax withholding 188,750 190,600 1,850 1.0Gross other individuals 49,860 47,800 -2,060 -4.1less: Refunds 29,000 29,200 200 0.7
Total individuals and other withholding tax 209,610 209,200 -410 -0.2Fringe benefits tax 4,430 4,080 -350 -7.9Company tax 79,400 83,800 4,400 5.5Superannuation fund taxes 8,540 10,570 2,030 23.8Petroleum resource rent tax 990 1,030 40 4.0Income taxation revenue 302,970 308,680 5,710 1.9Goods and services tax 65,710 65,560 -150 -0.2Wine equalisation tax 900 920 20 2.2Luxury car tax 650 680 30 4.6Excise and customs duty
Petrol 6,250 6,200 -50 -0.8Diesel 10,640 10,880 240 2.3Other fuel products 1,920 1,920 0 0.0Tobacco 11,610 11,530 -80 -0.7Beer 2,390 2,360 -30 -1.3Spirits 2,130 2,070 -60 -2.8Other alcoholic beverages(a) 950 950 0 0.0Other customs duty
Textiles, clothing and footwear 170 180 10 5.9Passenger motor vehicles 490 500 10 2.0Other imports 790 980 190 24.1
less: Refunds and drawbacks 420 420 0 0.0Total excise and customs duty 36,920 37,150 230 0.6
Major bank levy 1,600 1,600 0 0.0Agricultural levies 537 533 -4 -0.7Other taxes(b) 6,141 6,385 244 4.0Indirect taxation revenue 112,458 112,828 371 0.3Taxation revenue 415,428 421,508 6,080 1.5Sales of goods and services(b) 11,496 10,491 -1,005 -8.7Interest 4,397 3,580 -816 -18.6Dividends 3,517 3,112 -405 -11.5Other non-taxation revenue 9,578 10,012 434 4.5Non-taxation revenue 28,987 27,194 -1,793 -6.2Total revenue 444,414 448,702 4,288 1.0Memorandum:
Total excise 22,190 22,350 160 0.7Total customs duty 14,730 14,800 70 0.5Capital gains tax(c) 15,500 16,100 600 3.9
(a) ‘Other alcoholic beverages’ are those not exceeding 10 per cent by volume of alcohol (excluding beer,
brandy and wine). (b) In the 2016-17 FBO, the majority of corporations law fees were reclassified from non-taxation revenue to
taxation revenue and financial institutions supervisory levies were reclassified from taxation revenue to non-taxation revenue.
(c) ‘Capital gains tax’ is part of gross other individuals, company tax and superannuation fund taxes.

Part 3: Fiscal strategy and outlook
46
Table 3.13: Reconciliation of 2018-19 general government sector (accrual) revenue
Estimates Change on BudgetBudget MYEFO
$m $m $m %Individuals and other withholding taxes
Gross income tax withholding 200,400 200,900 500 0.2Gross other individuals 52,720 49,700 -3,020 -5.7less: Refunds 30,900 30,900 0 0.0
Total individuals and other withholding tax 222,220 219,700 -2,520 -1.1Fringe benefits tax 4,520 4,290 -230 -5.1Company tax 86,400 88,800 2,400 2.8Superannuation fund taxes 9,510 10,260 750 7.9Petroleum resource rent tax 990 1,110 120 12.1Income taxation revenue 323,640 324,160 520 0.2Goods and services tax 68,460 68,550 90 0.1Wine equalisation tax 1,000 1,000 0 0.0Luxury car tax 640 700 60 9.4Excise and customs duty
Petrol 6,410 6,260 -150 -2.3Diesel 11,140 11,240 100 0.9Other fuel products 1,920 1,930 10 0.5Tobacco 12,720 12,570 -150 -1.2Beer 2,470 2,410 -60 -2.4Spirits 2,210 2,150 -60 -2.7Other alcoholic beverages(a) 980 980 0 0.0Other customs duty
Textiles, clothing and footwear 170 180 10 5.9Passenger motor vehicles 500 500 0 0.0Other imports 790 980 190 24.1
less: Refunds and drawbacks 420 420 0 0.0Total excise and customs duty 38,890 38,780 -110 -0.3
Major bank levy 1,700 1,700 0 0.0Agricultural levies 533 536 3 0.7Other taxes(b) 6,910 7,711 801 11.6Indirect taxation revenue 118,132 118,977 845 0.7Taxation revenue 441,772 443,137 1,365 0.3Sales of goods and services(b) 14,654 13,980 -674 -4.6Interest 5,470 4,463 -1,007 -18.4Dividends 4,125 3,935 -190 -4.6Other non-taxation revenue 10,077 10,073 -4 0.0Non-taxation revenue 34,326 32,451 -1,875 -5.5Total revenue 476,099 475,588 -510 -0.1Memorandum:
Total excise 22,950 22,890 -60 -0.3Total customs duty 15,940 15,890 -50 -0.3Capital gains tax(c) 16,800 17,500 700 4.2
(a) ‘Other alcoholic beverages’ are those not exceeding 10 per cent by volume of alcohol (excluding beer,
brandy and wine). (b) In the 2016-17 FBO, the majority of corporations law fees were reclassified from non-taxation revenue to
taxation revenue and financial institutions supervisory levies were reclassified from taxation revenue to non-taxation revenue.
(c) ‘Capital gains tax’ is part of gross other individuals, company tax and superannuation fund taxes.

Part 3: Fiscal strategy and outlook
47
Table 3.14: Australian Government general government sector (accrual) revenue Actual Projections2016-17 2017-18 2018-19 2019-20 2020-21
$m $m $m $m $mIndividuals and other withholding taxes
Gross income tax withholding 180,618 190,600 200,900 216,400 231,000Gross other individuals 45,133 47,800 49,700 53,800 58,000less: Refunds 28,364 29,200 30,900 32,500 33,500
Total individuals and other withholding tax 197,388 209,200 219,700 237,700 255,500Fringe benefits tax 3,905 4,080 4,290 4,580 4,830Company tax 71,170 83,800 88,800 94,100 96,900Superannuation fund taxes 8,228 10,570 10,260 11,220 12,320Petroleum resource rent tax(a) 976 1,030 1,110 1,110 1,110Income taxation revenue 281,667 308,680 324,160 348,710 370,660Goods and services tax 62,727 65,560 68,550 71,360 75,300Wine equalisation tax 850 920 1,000 1,070 1,110Luxury car tax 674 680 700 750 790Excise and customs duty
Petrol 6,201 6,200 6,260 6,540 6,850Diesel 10,387 10,880 11,240 11,790 12,440Other fuel products 1,955 1,920 1,930 2,000 2,060Tobacco 10,612 11,530 12,570 13,700 14,940Beer 2,384 2,360 2,410 2,440 2,560Spirits 2,059 2,070 2,150 2,220 2,310Other alcoholic beverages(b) 923 950 980 1,030 1,040Other customs duty
Textiles, clothing and footwear 279 180 180 180 190Passenger motor vehicles 540 500 500 500 550Other imports 1,149 980 980 1,010 1,070
less: Refunds and drawbacks 397 420 420 420 420Total excise and customs duty 36,091 37,150 38,780 40,990 43,590Major bank levy - 1,600 1,700 1,800 1,900Agricultural levies 554 533 536 547 557Other taxes(c) 6,078 6,385 7,711 8,202 8,488Indirect taxation revenue 106,974 112,828 118,977 124,719 131,735Taxation revenue 388,641 421,508 443,137 473,429 502,395Sales of goods and services(c) 8,230 10,491 13,980 14,838 15,124Interest 2,992 3,580 4,463 5,432 6,004Dividends 4,998 3,112 3,935 4,325 4,745Other non-taxation revenue 10,863 10,012 10,073 9,787 9,951Non-taxation revenue 27,082 27,194 32,451 34,382 35,825Total revenue 415,723 448,702 475,588 507,811 538,220Memorandum:
Total excise 21,895 22,350 22,890 23,880 25,020Total customs duty 14,196 14,800 15,890 17,110 18,570Capital gains tax(d) 12,700 16,100 17,500 18,900 20,400
Estimates
(a) This item includes a small amount of MRRT revenue relating to a pre-2013-14 income year which cannot
be separately disclosed owing to taxpayer confidentiality. (b) ‘Other alcoholic beverages’ are those not exceeding 10 per cent by volume of alcohol (excluding beer,
brandy and wine). (c) In the 2016-17 FBO, the majority of corporations law fees were reclassified from non-taxation revenue to
taxation revenue and financial institutions supervisory levies were reclassified from taxation revenue to non-taxation revenue.
(d) ‘Capital gains tax’ is part of gross other individuals, company tax and superannuation fund taxes. The 2016-17 reported figure is an estimate.

Part 3: Fiscal strategy and outlook
48
Expense estimates Movements in accrual expenses over the forward estimates are broadly similar to the movements in cash payments. The key exceptions include:
• superannuation benefits, where there is a timing difference with the expense accruing during employment and cash payments occurring during retirement; and
• purchases of non-financial assets, which are included in cash payments but not in accrual expenses. The expense estimates include depreciation of non-financial assets rather than recognising the impact at the time of purchase.
Estimates of Australian Government general government sector expenses by function can be found in Attachment C to this part.
Table 3.15 provides a reconciliation of expense estimates.
Table 3.15 Reconciliation of general government sector expense estimates
2017-18 2018-19 2019-20 2020-21 Total$m $m $m $m $m
2017-18 Budget expenses 464,262 486,863 503,198 522,907 1,977,230Changes from 2017-18 Budget to 2017-18 MYEFOEffect of policy decisions(a) 877 40 384 98 1,398Effect of economic parameter variations
Unemployment benefits -168 -140 -242 -150 -700Prices and wages -197 -406 -463 -474 -1,540Interest and exchange rates -26 -27 -44 -41 -138GST payments to the States 120 500 490 320 1,430
Public debt interest -195 -289 -430 -591 -1,505Program specific parameter variations 1,030 -1,794 -985 -2,017 -3,765Other variations 1,234 765 -882 -2,735 -1,618Total variations 2,675 -1,351 -2,172 -5,589 -6,4372017-18 MYEFO expenses 466,937 485,512 501,026 517,318 1,970,792
Estimates Projections
(a) Excludes secondary impacts on public debt interest of policy decisions and offsets from the Contingency
Reserve for decisions taken.
Part 3: Fiscal strategy and outlook
49
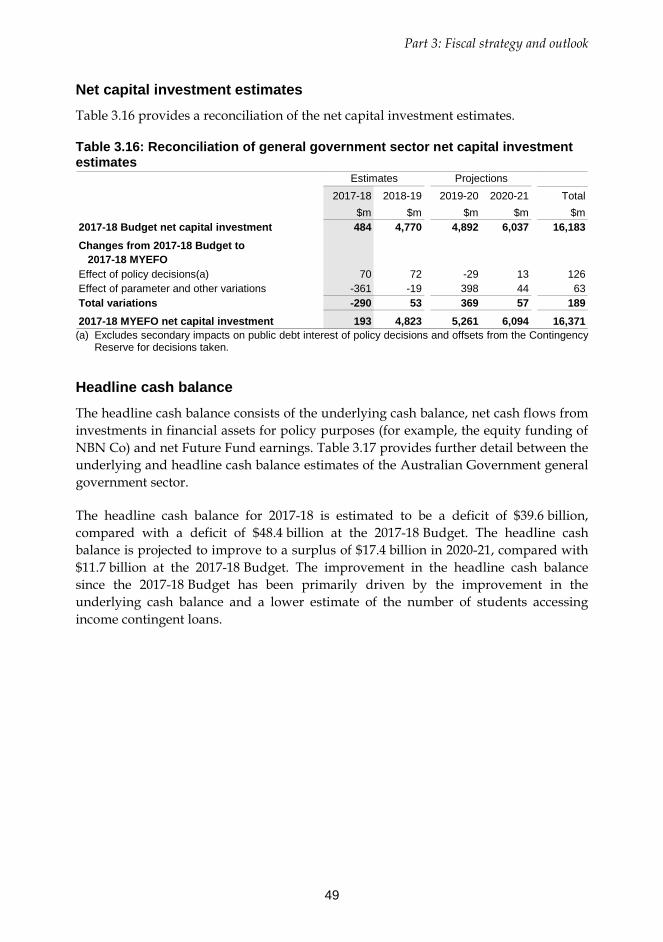
Net capital investment estimates Table 3.16 provides a reconciliation of the net capital investment estimates.
Table 3.16: Reconciliation of general government sector net capital investment estimates
2017-18 2018-19 2019-20 2020-21 Total$m $m $m $m $m
2017-18 Budget net capital investment 484 4,770 4,892 6,037 16,183Changes from 2017-18 Budget to 2017-18 MYEFOEffect of policy decisions(a) 70 72 -29 13 126Effect of parameter and other variations -361 -19 398 44 63Total variations -290 53 369 57 1892017-18 MYEFO net capital investment 193 4,823 5,261 6,094 16,371
Estimates Projections
(a) Excludes secondary impacts on public debt interest of policy decisions and offsets from the Contingency
Reserve for decisions taken.
Headline cash balance The headline cash balance consists of the underlying cash balance, net cash flows from investments in financial assets for policy purposes (for example, the equity funding of NBN Co) and net Future Fund earnings. Table 3.17 provides further detail between the underlying and headline cash balance estimates of the Australian Government general government sector.
The headline cash balance for 2017-18 is estimated to be a deficit of $39.6 billion, compared with a deficit of $48.4 billion at the 2017-18 Budget. The headline cash balance is projected to improve to a surplus of $17.4 billion in 2020-21, compared with $11.7 billion at the 2017-18 Budget. The improvement in the headline cash balance since the 2017-18 Budget has been primarily driven by the improvement in the underlying cash balance and a lower estimate of the number of students accessing income contingent loans.

Part 3: Fiscal strategy and outlook
50
Table 3.17: Reconciliation of general government sector underlying and headline cash balance estimates
2017-18 2018-19 2019-20 2020-21 Total$m $m $m $m $m
2017-18 MYEFO underlying cash balance(a) -23,608 -20,493 -2,638 10,163 -36,575plus Net cash flows from investments in
financial assets for policy purposesStudent loans -6,056 -6,318 -6,185 -6,219 -24,778NBN investment -2,035 0 0 0 -2,035NBN Loan -8,843 -7,769 -2,688 19,300 0Residential mortgage backed securities 1,919 0 0 0 1,919WestConnex -722 -576 -85 0 -1,383Trade support loans -163 -167 -173 -162 -665CEFC loans and investments -1,374 -611 -717 -767 -3,468Northern Australia Infrastructure Facility -337 -1,242 -1,299 -819 -3,696Drought and rural assistance loans -192 -202 -143 -144 -680National water infrastructure loan facility -100 -200 -500 -500 -1,300Net other(b) -1,140 -2,160 -2,640 -3,442 -9,382
Total net cash flows from investments in financial assets for policy purposes -19,042 -19,245 -14,430 7,248 -45,468
plus Net Future Fund earnings(c) 3,076 3,503 3,861 na 10,4412017-18 MYEFO headline cash balance -39,573 -36,235 -13,206 17,412 -71,602Memorandum:Net Future Fund earnings(c) 3,076 3,503 3,861 4,115 14,556
Estimates Projections
(a) Excludes expected net Future Fund earnings before 2020-21. (b) Net other includes proposed equity payments for infrastructure projects. The amounts have not been
itemised for commercial-in-confidence reasons. (c) Under the Future Fund Act 2006, net Future Fund earnings will be available to meet the Government
superannuation liability in 2020-21. From this time, the underlying cash balance includes expected net Future Fund earnings.
Part 3: Fiscal strategy and outlook
51
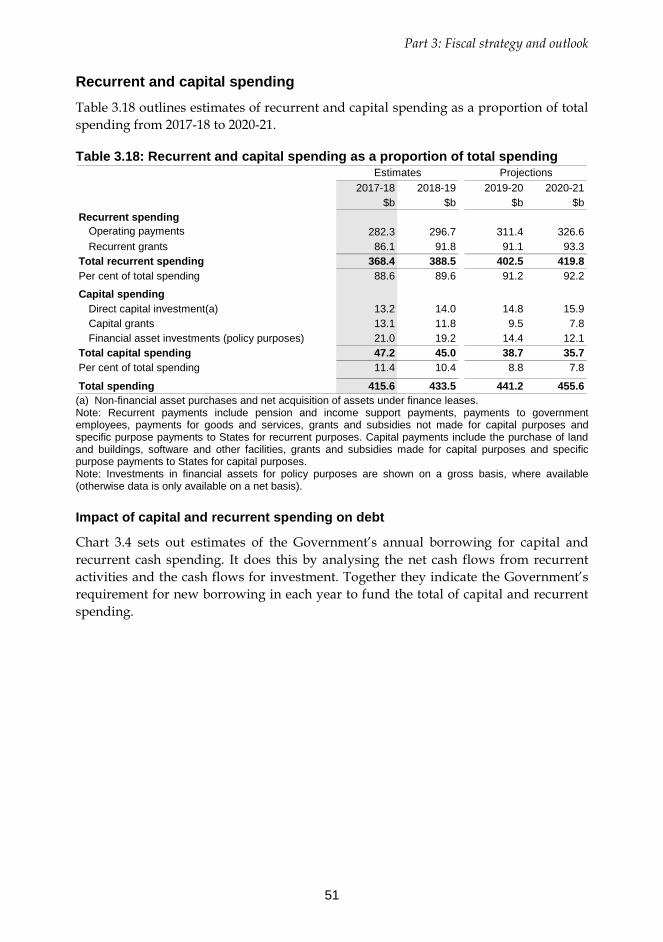
Recurrent and capital spending Table 3.18 outlines estimates of recurrent and capital spending as a proportion of total spending from 2017-18 to 2020-21.
Table 3.18: Recurrent and capital spending as a proportion of total spending
2017-18 2018-19 2019-20 2020-21$b $b $b $b
Recurrent spendingOperating payments 282.3 296.7 311.4 326.6Recurrent grants 86.1 91.8 91.1 93.3
Total recurrent spending 368.4 388.5 402.5 419.8Per cent of total spending 88.6 89.6 91.2 92.2
Capital spendingDirect capital investment(a) 13.2 14.0 14.8 15.9Capital grants 13.1 11.8 9.5 7.8Financial asset investments (policy purposes) 21.0 19.2 14.4 12.1
Total capital spending 47.2 45.0 38.7 35.7Per cent of total spending 11.4 10.4 8.8 7.8
Total spending 415.6 433.5 441.2 455.6
Estimates Projections
(a) Non-financial asset purchases and net acquisition of assets under finance leases. Note: Recurrent payments include pension and income support payments, payments to government employees, payments for goods and services, grants and subsidies not made for capital purposes and specific purpose payments to States for recurrent purposes. Capital payments include the purchase of land and buildings, software and other facilities, grants and subsidies made for capital purposes and specific purpose payments to States for capital purposes. Note: Investments in financial assets for policy purposes are shown on a gross basis, where available (otherwise data is only available on a net basis). Impact of capital and recurrent spending on debt
Chart 3.4 sets out estimates of the Government’s annual borrowing for capital and recurrent cash spending. It does this by analysing the net cash flows from recurrent activities and the cash flows for investment. Together they indicate the Government’s requirement for new borrowing in each year to fund the total of capital and recurrent spending.

Part 3: Fiscal strategy and outlook
52
Chart 3.4: Contributions of recurrent and capital spending to government borrowing needs
-50
-40
-30
-20
-10
0
10
20
30
40
50
-50
-40
-30
-20
-10
0
10
20
30
40
50
2017-18 2018-19 2019-20 2020-21
$billion$billion
Net cash flow from recurrent activities Net cash flow from investments Borrowing requirement Note: Net cash flow from investments includes spending to acquire physical assets, spending to acquire financial assets and capital grants to the States and other entities. Note: The borrowing requirement reflects the amounts to be financed to cover net cash flows from recurrent activities and net cash flows from investments but does not include the funding required for liquidity purposes or refinancing. This analysis effectively illustrates that from 2017-18 and over the remainder of the forward estimates, the Government is not expected to need to borrow for recurrent spending. This is a year earlier than was expected at the time of the 2017-18 Budget. In 2017-18, net cash flows from recurrent activities are broadly in balance and from 2018-19 they effectively make a contribution to funding capital spending. This reflects the Government’s policy to stabilise net debt while still maintaining a strong capital investment program.
Structural budget balance Restoring the structural integrity of the budget is crucial for achieving surpluses on average over the economic cycle and paying down government debt, consistent with the medium-term fiscal strategy.
The structural budget balance estimates seek to remove factors that have a temporary impact on revenues and expenditures, such as fluctuations in commodity prices and the extent to which economic output deviates from its potential level. Considered in conjunction with other measures, estimates of the structural budget balance can provide insight into the sustainability of current fiscal settings.

Part 3: Fiscal strategy and outlook
53
Consistent with the 2017-18 Budget, the overall level of the structural budget balance improves from a deficit of around 2.1 per cent of GDP in 2017-18, to a series of small surpluses from 2020-21 onwards. On average, over the whole period, estimates of the structural budget balance are stable.
Cyclical factors are projected to dissipate by the end of 2023-24. From then the structural budget balance converges to the underlying cash balance (see Chart 3.5).
Chart 3.5: Structural budget balance estimates
-6
-4
-2
0
2
4
6
-6
-4
-2
0
2
4
6
2006-07 2009-10 2012-13 2015-16 2018-19 2021-22 2024-25 2027-28
Per cent of GDPPer cent of GDP
Structural Budget Balance Band Underlying cash balance Structural budget balance
Forw ard estimates / projections period
Medium-term projections period
Note: The methodology for producing structural budget balance estimates was detailed in Treasury Working Paper 2013-01 and incorporates the medium-term projection methodology detailed in Treasury Working Paper 2014-02.