Embed Size (px)
Citation preview

Bioinformatics and
Biomarker Discovery
Part 3: Examples
Limsoon Wong
3 September 2014

2
MCI5004, AY2013/14, 3/9/2014 Copyright 2014 © Limsoon Wong
Outline
• ALL
– Gene expression profile classification
– Beyond diagnosis and prognosis
• WEKA
– Breast cancer
– Dermatology
– Pima Indians
– Echocardiogram
– Mammography

Gene Expression Profile Classification
Diagnosis of Childhood Acute
Lymphoblastic Leukemia and Optimization
of Risk-Benefit Ratio of Therapy

4
MCI5004, AY2013/14, 3/9/2014 Copyright 2014 © Limsoon Wong
• The subtypes look similar
• Conventional diagnosis
– Immunophenotyping
– Cytogenetics
– Molecular diagnostics
• Unavailable in most
ASEAN countries
Childhood ALL
• Major subtypes: T-ALL,
E2A-PBX, TEL-AML, BCR-
ABL, MLL genome
rearrangements,
Hyperdiploid>50
• Diff subtypes respond
differently to same Tx
• Over-intensive Tx
– Development of
secondary cancers
– Reduction of IQ
• Under-intensiveTx
– Relapse

5
MCI5004, AY2013/14, 3/9/2014 Copyright 2014 © Limsoon Wong
Subtype Diagnosis by Machine Learning
• Gene expression data collection
• Gene selection by e.g. 2
• Classifier training by e.g. emerging pattern
• Classifier tuning (optional for some machine
learning methods)
• Apply classifier for diagnosis of future cases by
e.g. PCL

6
MCI5004, AY2013/14, 3/9/2014 Copyright 2014 © Limsoon Wong
Childhood ALL Subtype
Diagnosis Workflow
A tree-structured
diagnostic
workflow was
recommended by
our doctor
collaborator

7
MCI5004, AY2013/14, 3/9/2014 Copyright 2014 © Limsoon Wong
Training and Testing Sets

8
MCI5004, AY2013/14, 3/9/2014 Copyright 2014 © Limsoon Wong
Signal Selection by 2

9
MCI5004, AY2013/14, 3/9/2014 Copyright 2014 © Limsoon Wong
Accuracy of Various Classifiers
The classifiers are all applied to the 20 genes selected
by 2 at each level of the tree

Normalization

11
MCI5004, AY2013/14, 3/9/2014 Copyright 2014 © Limsoon Wong
Sometimes, a gene expression study
may involve batches of data collected
over a long period of time…
0
10
20
30
40
50
60
70
Ja
n-0
4
Ap
r-0
4
Ju
l-04
Oct-
04
Ja
n-0
5
Ap
r-0
5
Ju
l-05
Oct-
05
Ja
n-0
6
Ap
r-0
6
Ju
l-06
Oct-
06
Ja
n-0
7
Ap
r-0
7
Ju
l-07
Oct-
07
Ja
n-0
8
Ap
r-0
8
Ju
l-08
Oct-
08
Ja
n-0
9
Ap
r-0
9
Ju
l-09
Oct-
09
Ja
n-1
0
Time Span of Gene Expression Profiles
Image credit: Dong Difeng

12
MCI5004, AY2013/14, 3/9/2014 Copyright 2014 © Limsoon Wong
In such a case, batch effect may be
severe… to the extent that you can
predict the batch that each sample
comes!
Need normalization to correct for batch effect
Image credit: Dong Difeng
13
MCI5004, AY2013/14, 3/9/2014 Copyright 2014 © Limsoon Wong
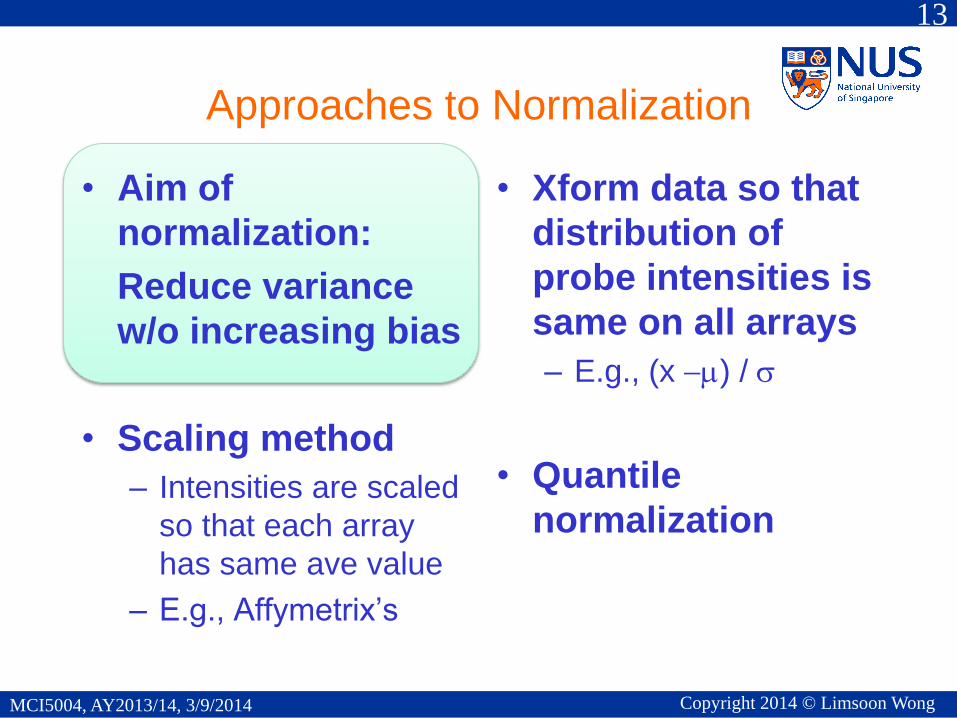
Approaches to Normalization
• Aim of
normalization:
Reduce variance
w/o increasing bias
• Scaling method
– Intensities are scaled
so that each array
has same ave value
– E.g., Affymetrix’s
• Xform data so that
distribution of
probe intensities is
same on all arrays
– E.g., (x ) /
• Quantile
normalization
14
MCI5004, AY2013/14, 3/9/2014 Copyright 2014 © Limsoon Wong
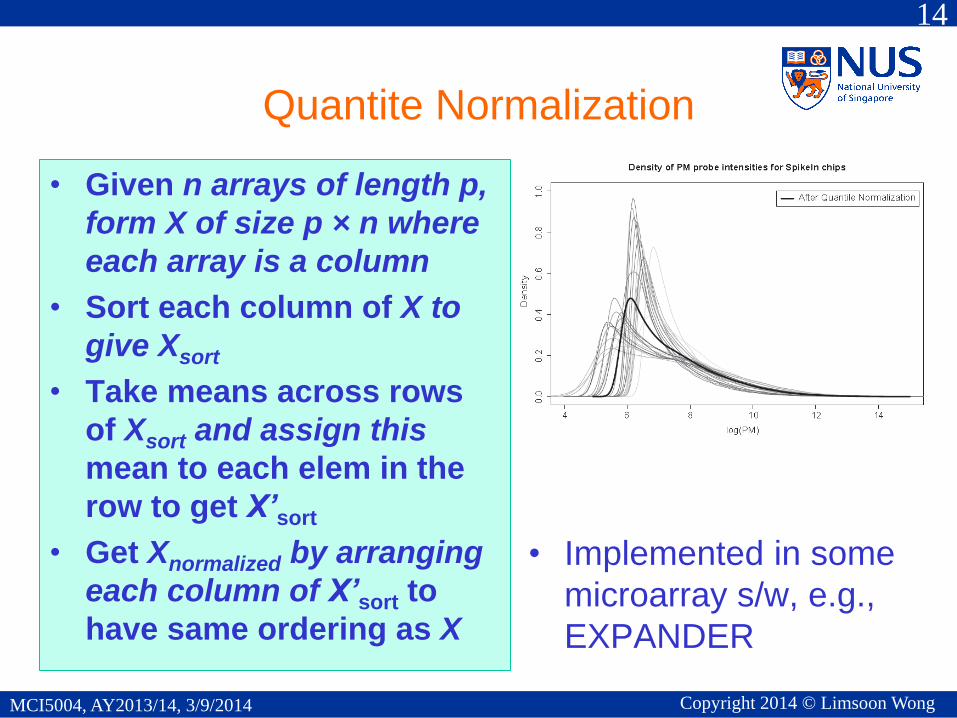
Quantite Normalization
• Given n arrays of length p,
form X of size p × n where
each array is a column
• Sort each column of X to
give Xsort
• Take means across rows
of Xsort and assign this
mean to each elem in the
row to get X’sort
• Get Xnormalized by arranging
each column of X’sort to
have same ordering as X
• Implemented in some
microarray s/w, e.g.,
EXPANDER

15
MCI5004, AY2013/14, 3/9/2014 Copyright 2014 © Limsoon Wong
After quantile
normalization

Beyond Disease Diagnosis & Prognosis

17
MCI5004, AY2013/14, 3/9/2014 Copyright 2014 © Limsoon Wong
Percentage of Overlapping Genes
• Low % of overlapping
genes from diff expt in
general
– Prostate cancer
• Lapointe et al, 2004
• Singh et al, 2002
– Lung cancer
• Garber et al, 2001
• Bhattacharjee et al,
2001
– DMD
• Haslett et al, 2002
• Pescatori et al, 2007
Datasets DEG POG
Prostate
Cancer
Top 10 0.30
Top 50 0.14
Top100 0.15
Lung
Cancer
Top 10 0.00
Top 50 0.20
Top100 0.31
DMD Top 10 0.20
Top 50 0.42
Top100 0.54
Zhang et al, Bioinformatics, 2009

18
MCI5004, AY2013/14, 3/9/2014 Copyright 2014 © Limsoon Wong
Individual Genes
• Suppose
– Each gene has 50%
chance to be high
– You have 3 disease and
3 normal samples
• How many genes on a
microarray are expected to
perfectly correlate to these
samples?
• Prob(a gene is correlated)
= 1/26
• # of genes on array =
30,000
E(# of correlated genes) =
468
Many false positives
• These cannot be
eliminated based on pure
statistics!

19
MCI5004, AY2013/14, 3/9/2014 Copyright 2014 © Limsoon Wong
Group of Genes
• Suppose
– Each gene has 50%
chance to be high
– You have 3 disease and
3 normal samples
• What is the chance of a
group of 5 genes being
perfectly correlated to
these samples?
• Prob(group of genes
correlated) = (1/26)5
– Good, << 1/26
• # of groups = 30000C5
E(# of groups of genes
correlated) = 30000C5* (1/26)5
= 2*1011
Even more false positives?
• Perhaps no need to
consider every group

20
MCI5004, AY2013/14, 3/9/2014 Copyright 2014 © Limsoon Wong
Gene Regulatory Circuits
• Each disease phenotype
has some underlying
cause
• There is some unifying
biological theme for genes
that are truly associated
with a disease subtype
• Uncertainty in selected
genes can be reduced by
considering biological
processes of the genes
• The unifying biological
theme is basis for inferring
the underlying cause of
disease subtype

21
MCI5004, AY2013/14, 3/9/2014 Copyright 2014 © Limsoon Wong
Taming false positives by
considering pathways instead of
all possible groups
# of pathways =
1000
E(# of pathways
correlated) =
1000 * (1/26)5 =
9.3*10-7

22
MCI5004, AY2013/14, 3/9/2014 Copyright 2014 © Limsoon Wong
Towards More Meaningful Genes
• ORA
– Khatri et al
– Genomics, 2002
• FCS
– Pavlidis & Noble
– PSB 2002
• GSEA
– Subramanian et al
– PNAS, 2005
• SNet
– Soh et al
– BMC Genomics, 2011
Overlap Analysis
Direct-Group Analysis
Network-Based Analysis

23
MCI5004, AY2013/14, 3/9/2014 Copyright 2014 © Limsoon Wong
Intersection Analysis (ORA)
• Intersect the list of differentially expressed genes with a list
of genes on a pathway
• If intersection is significant, the pathway is postulated as
basis of disease subtype or treatment response
Exercise: What is a good test
statistics to determine if the
intersection is significant?

24
MCI5004, AY2013/14, 3/9/2014 Copyright 2014 © Limsoon Wong
Disappointing Performance
DMD gene expression data
• Pescatori et al., 2007
• Haslett et al., 2002
Pathway data
• PathwayAPI, Soh et al., 2010

25
MCI5004, AY2013/14, 3/9/2014 Copyright 2014 © Limsoon Wong
Issue #1 with ORA
• Its null hypothesis
basically says “Genes in
the given pathway
behaves no differently
from randomly chosen
gene sets of the same
size”
• This null hypothesis is
obviously false
Lots of false positives
• A biological pathway is a series of actions
among molecules in a cell that leads to a certain
product or a change in a cell. Thus necessarily
the behavour of genes in a pathway is more
coordinated than random ones

26
MCI5004, AY2013/14, 3/9/2014 Copyright 2014 © Limsoon Wong
Issue #2 with ORA
• It relies on a pre-
determined list of DE
genes
• This list is sensitive to the
test statistic used and to
the significance threshold
used
• This list is unstable
regardless of the threshold
used when sample size is
small

27
MCI5004, AY2013/14, 3/9/2014 Copyright 2014 © Limsoon Wong
Issue #3 with ORA
• It tests whether the entire
pathway is significantly
differentially expressed
• If only a branch of the
pathway is relevant to the
phenotypes, the noise
from the large irrelevant
part of the pathways can
dilute the signal from that
branch

28
MCI5004, AY2013/14, 3/9/2014 Copyright 2014 © Limsoon Wong
ORA-Paired: Paired Test and New
Null Hypothesis
• Let gi be genes in a
given pathway P
• Let pj be patients
• Let qk be normals
• Let i,j,k = Expr(gi,pj) –
Expr(gi,qk)
• Test whether i,j,k is a
distribution with mean 0
• Issue #1 is solved
– The null hypothesis is now “If a
pathway P is irrelevant to the
difference between patients and
normals, then the genes in P are
expected to behave similarly in
patients and normals”
• Issue #2 is solved
– No longer need a pre-determined
list of DE genes
• Issue #3 is unsolved
• Is sample size now larger?
– |patients| * |normals| * |genes in P|

29
MCI5004, AY2013/14, 3/9/2014 Copyright 2014 © Limsoon Wong
NEA-Paired: Paired Test on Subnetworks
• Given a pathway P
• Let each node and its
immediate neighbourhood
in P be a subnetwork
• Apply ORA-Paired on each
subnetwork individually
• Issues #1 & #2 are solved
as per ORA-Paired
• Issue #3 is partly solved
– Testing subnetworks instead of
whole pathways
– But subnetworks derived in
fragmented way

30
MCI5004, AY2013/14, 3/9/2014 Copyright 2014 © Limsoon Wong
ESSNet: Larger Subnetworks
• Compute the average rank
of a gene based on its
expression level in
patients
• Use the top % to extract
large connected
components in pathways
• Test each component
using ORA-Paired
• Gene rank is very stable
• Issues #1 - #3 solved
31
MCI5004, AY2013/14, 3/9/2014 Copyright 2014 © Limsoon Wong
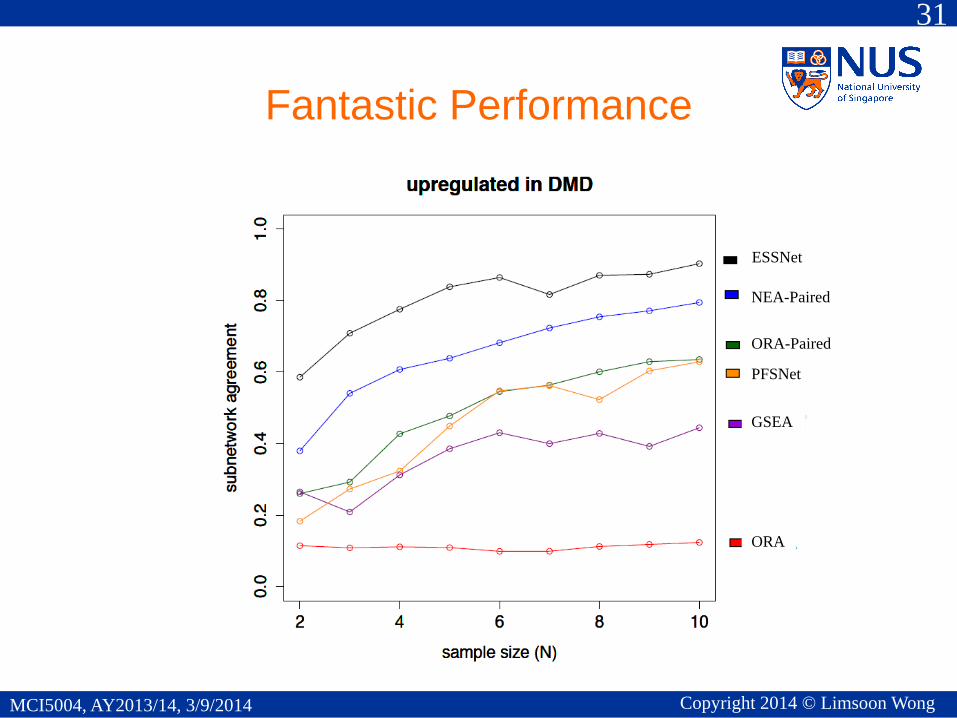
Fantastic Performance
ORA-Paired
PFSNet
GSEA
ORA
NEA-Paired
ESSNet

32
MCI5004, AY2013/14, 3/9/2014 Copyright 2014 © Limsoon Wong
Concluding Remarks
• Consistent successful gene expression profile
analysis needs deep integration of background
knowledge
• Most gene expression profile analysis methods
fail to give reproducible results when sample size
is small (and some even fail when sample size is
quite large)
• Logical analysis to identify key issues and simple
logical solution to the issues can give fantastic
results

33
MCI5004, AY2013/14, 3/9/2014 Copyright 2014 © Limsoon Wong
References
• E.-J. Yeoh et al., “Classification, subtype discovery, and
prediction of outcome in pediatric acute lymphoblastic leukemia
by gene expression profiling”, Cancer Cell, 1:133-143, 2002
• L.D. Miller et al., “Optimal gene expression analysis by
microarrays”, Cancer Cell 2:353-361, 2002
• J. Li, L. Wong, “Techniques for Analysis of Gene Expression”,
The Practical Bioinformatician, Chapter 14, pages 319-346,
WSPC, 2004
• D. Soh, D. Dong, Y. Guo, L. Wong. “Finding Consistent Disease
Subnetworks Across Microarray Datasets”. BMC Bioinformatics,
12(Suppl 13):S15, 2011
• K. Lim, L. Wong. “Finding consistent disease subnetworks using
PFSNet”. Bioinformatics, 30(2):189--196, January 2014

A Popular Software Package: WEKA

35
MCI5004, AY2013/14, 3/9/2014 Copyright 2014 © Limsoon Wong
• http://www.cs.waikato.ac.nz/ml/weka
• Weka is a collection of machine learning
algorithms for data mining tasks. The algorithms
can either be applied directly to a dataset or
called from your own Java code. Weka contains
tools for data pre-processing, classification,
regression, clustering, association rules, and
visualization.
Exercise: Download a copy of WEKA. What are the names
of classifiers in WEKA that correspond to C4.5 and SVM?

36
MCI5004, AY2013/14, 3/9/2014 Copyright 2014 © Limsoon Wong
Let’s try WEKA on …
• Breast cancer
• Dermatology
• Pima Indians
• Echocardiogram
• Mammography


![A Comparison of Data Mining Tools using the … Weka Tool Weka [11] is an open source tool for the implementation of various data mining algorithms. It is based on java application](https://img.pdfslide.us/doc/110x75/5acf2b167f8b9ad24f8c1c52/a-comparison-of-data-mining-tools-using-the-weka-tool-weka-11-is-an-open-source.jpg)