Embed Size (px)
Citation preview
Part 2:Research Methods
Why is psychological research important?
• Psychologists do more than just wonder about human behavior
• Psychological research has an enormous impact on all facets of our lives– how parents choose to discipline their children – how companies package and advertise their products– how governments choose to punish or rehabilitate
criminals• Understanding how psychologists do research is vital to
understanding psychology itself.
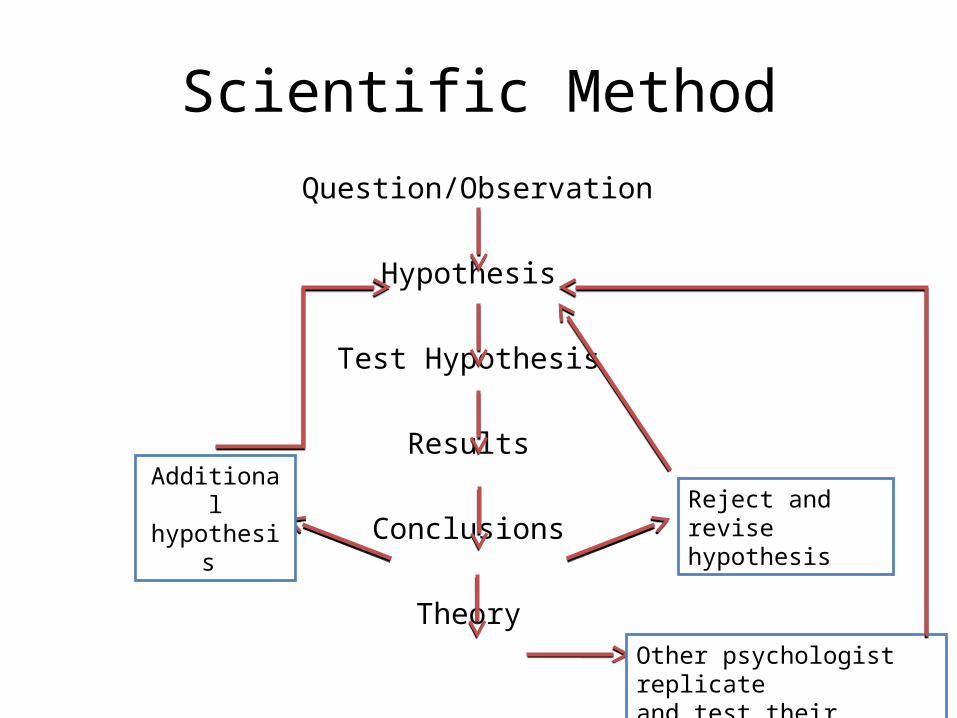
Scientific MethodQuestion/Observation
Hypothesis
Test Hypothesis
Results
Conclusions
Theory
Additional hypothesis Reject and revise
hypothesis
Other psychologist replicateand test their theories
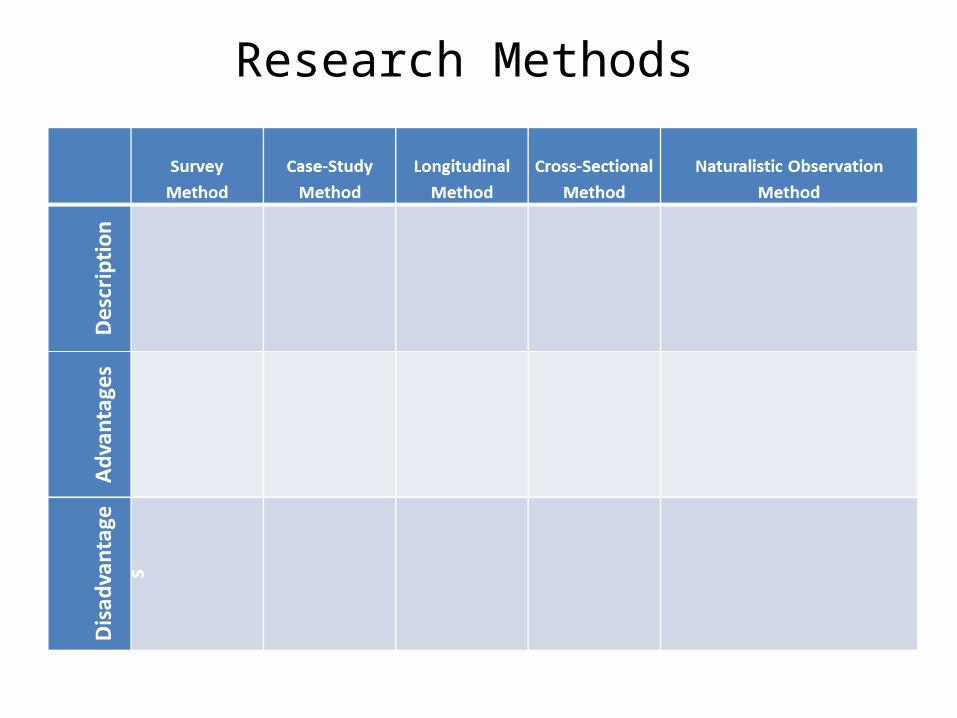
Research Methods
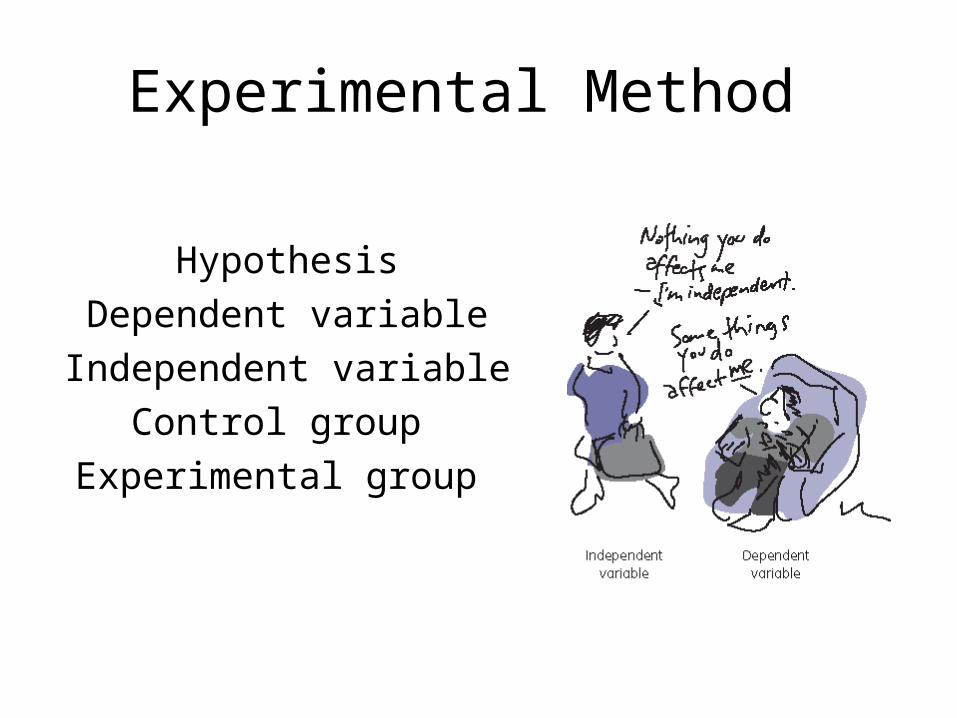
Experimental Method
HypothesisDependent variable
Independent variableControl group
Experimental group
Extraneous Variables in Experiments
• Variables other than the independent variable that could affect the dependent variable are called extraneous variables. – Example: An educational psychologist has developed a new learning
strategy and is interested in examining the effectiveness of this strategy. The experimenter randomly assigns students to two groups. All of the students study text materials on a biology topic for thirty minutes. One group uses the new strategy and the other uses a strategy of their choice. Then all students complete a test over the materials.
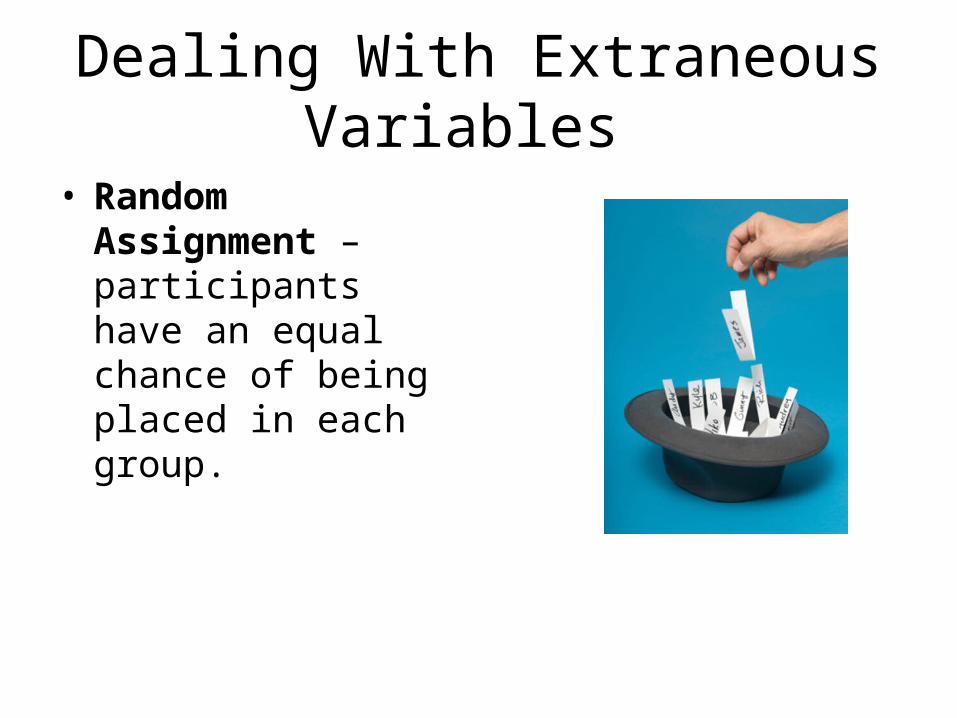
Dealing With Extraneous Variables
• Random Assignment – participants have an equal chance of being placed in each group.
Advantages of Experimental Method
• Can show cause-and-effect relationships between variables
Disadvantage of Experimental Method
• Can not be generalized to the real world because an artificial situation.
• Cant be used to study everything– Cant control variables – Unethical
Bias in Research
• Bias is the distortion of results by a variable. – Sampling bias occurs when the sample studied in an experiment
does not correctly represent the population the researcher wants to draw conclusions about.
– Subject bias - Research subjects’ expectations can affect and change the subjects’ behavior, resulting in subject bias. Such a bias can manifest itself in two ways:
• Placebo effect • Social desirability bias
– Experimenter bias occurs when researchers’ preference or expectations influence the outcome of their research. Researchers see what they want to see.
• Double-blind experiment
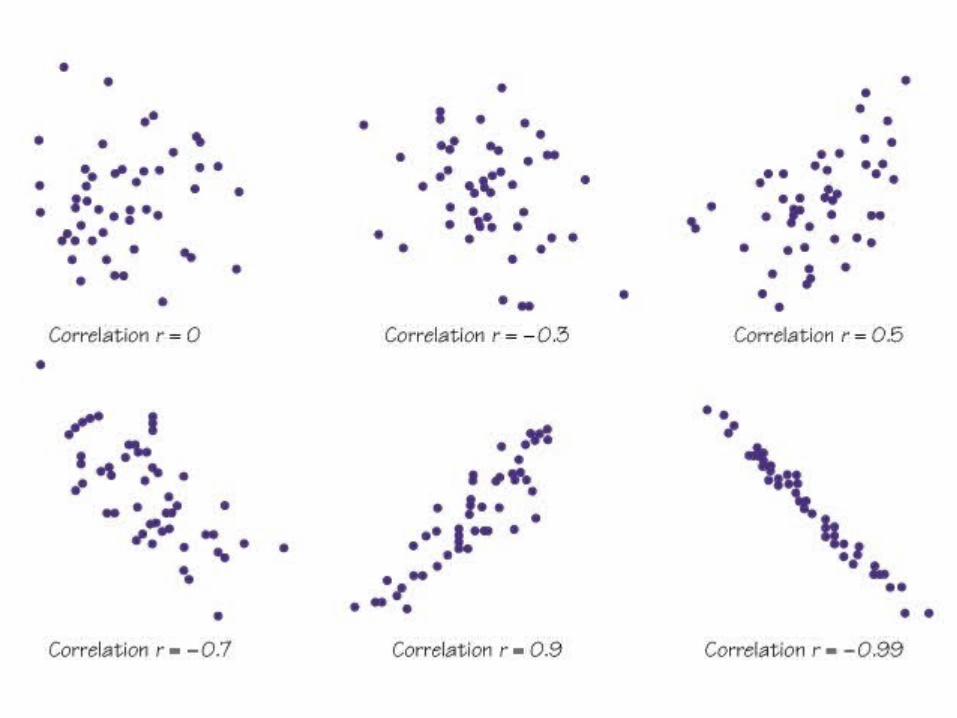
Correlations • Used to describe how two sets of data relate to each
other – Ex: students grades and number of hours slept
• Correlation coefficient measures the strength of the relationship between two variables. – Always a number between –1 and +1. – The sign (+ or –) of a correlation coefficient indicates the
nature of the relationship between the variables.
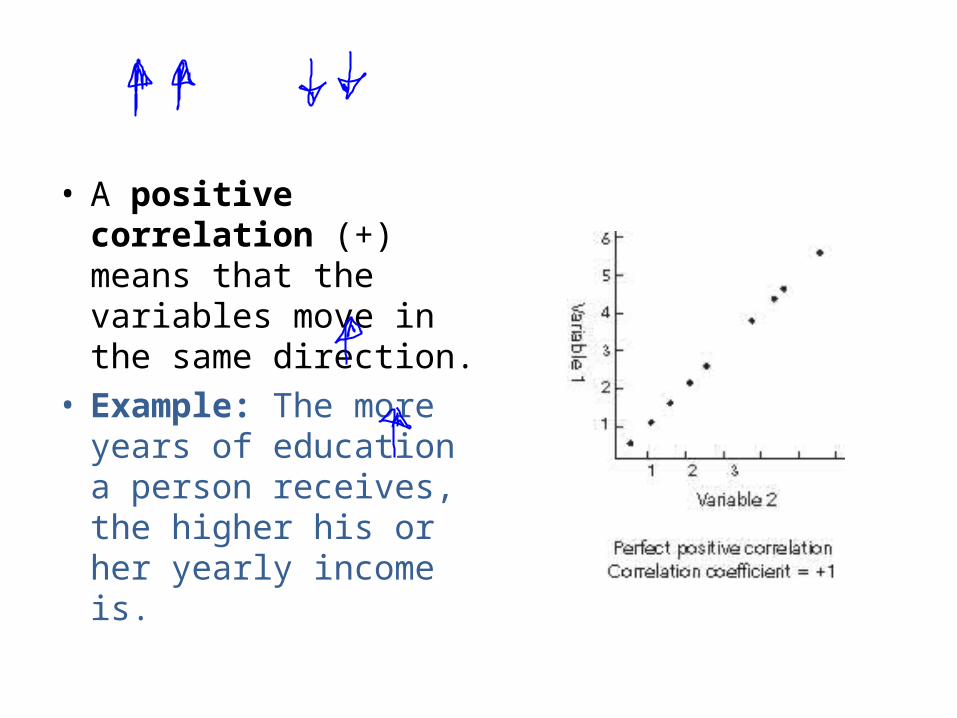
• A positive correlation (+) means that the variables move in the same direction.
• Example: The more years of education a person receives, the higher his or her yearly income is.
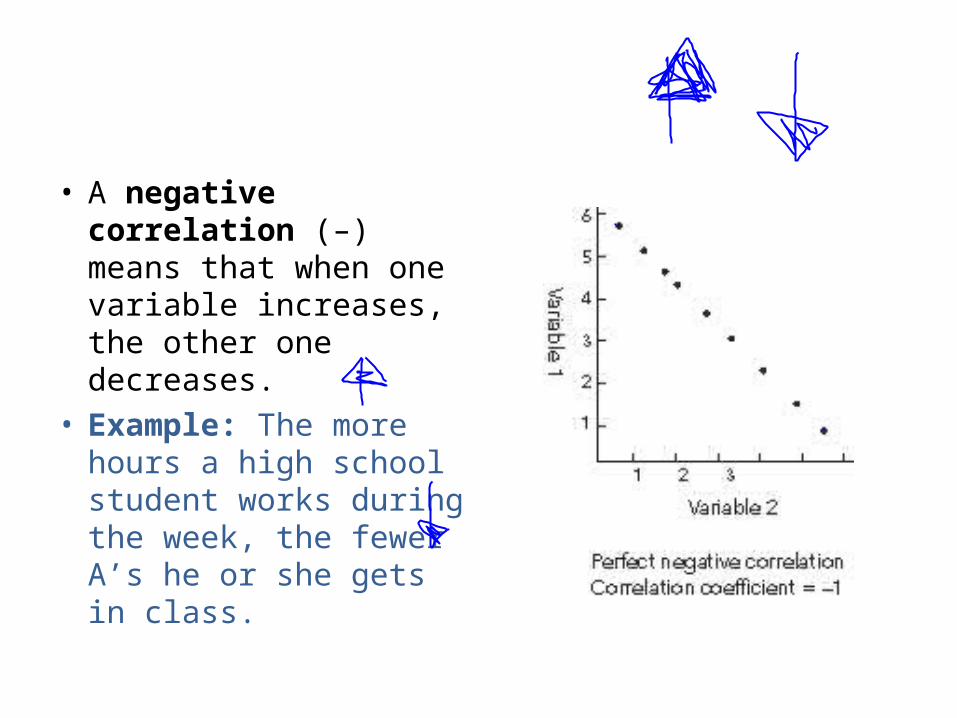
• A negative correlation (–) means that when one variable increases, the other one decreases.
• Example: The more hours a high school student works during the week, the fewer A’s he or she gets in class.
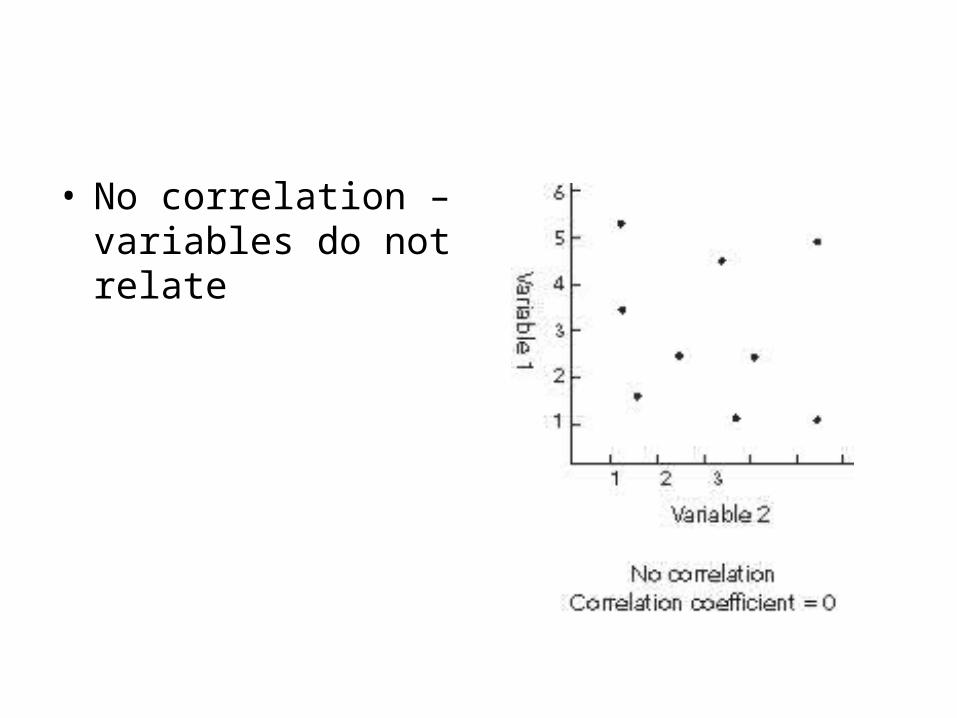
• No correlation – variables do not relate
• The higher the correlation coefficient, the stronger the correlation. – A +0.9 or a –0.9 indicates a very strong correlation – A +0.1 or a –0.1 indicates a very weak correlation. – A correlation of 0 means that no relationship exists
between two variables.
• correlation is not the same as causation. Two factors may be related without one causing the other to occur. Often, a third factor explains the correlation.– A psychologist uses the survey method to study the
relationship between balding and length of marriage. He finds that length of marriage correlates with baldness. However, he can’t infer from this that being bald causes people to stay married longer. Instead, a third factor explains the correlation: both balding and long marriages are associated with old age.
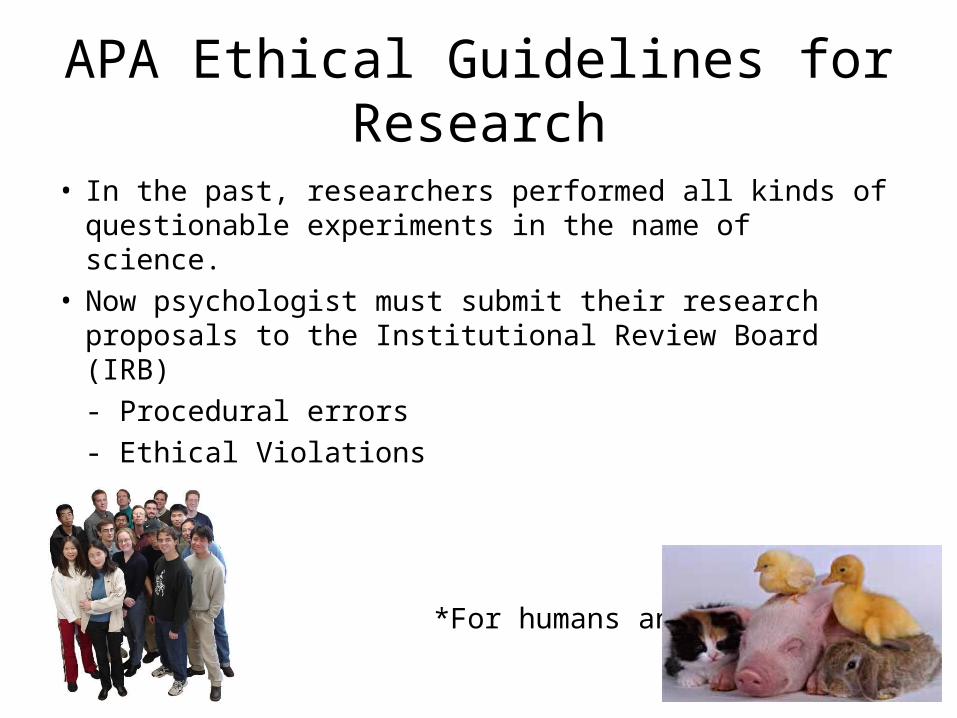
APA Ethical Guidelines for Research
• In the past, researchers performed all kinds of questionable experiments in the name of science.
• Now psychologist must submit their research proposals to the Institutional Review Board (IRB)- Procedural errors - Ethical Violations
*For humans and animals*
Human Research
1. Informed Consent – participants must know that they are involved in research and give their consent or permission
2. Deception – if the participants are deceived in any way about the nature of the study, the deception must not be so extreme as to invalidate the informed consent. Also, researchers must be very careful about the trauma deception may cause.
3. Coercion – participants cannot be coerced in any way to give consent to be in the study.
4. Anonymity – the identities and actions of participants must not be revealed in any way by the researcher.
5. Risk – participants cannot be placed at significant mental or physical risk. This clause requires interpretation by the review board.
6. Debriefing procedures –participants must be told of the purpose of the study and provided with ways to contact the researchers about the results.
Milgram Experiment
Milgram Experiment Original Video http://www.youtube.com/watch?v=W147ybOdgpE
Milgram Experiment Video 2 http://www.youtube.com/watch?v=HwqNP9HRy7Y
The Holocaust
• https://www.facinghistory.org/for-educators/educator-resources/readings/reserve-police-battalion-101
• https://www.youtube.com/watch?v=JJ6umV7CVY8
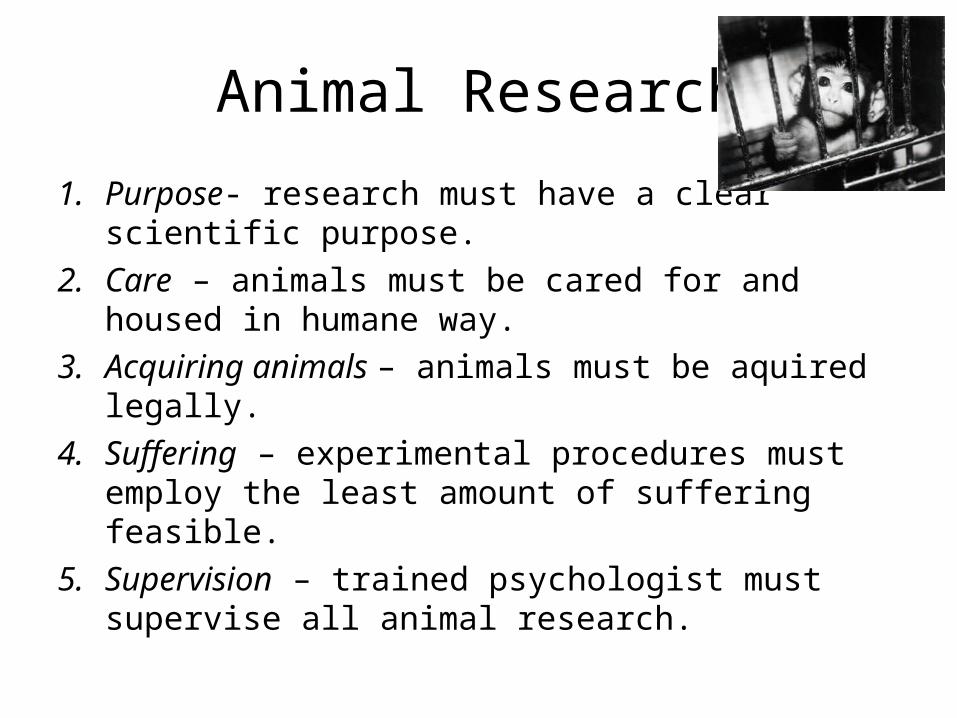
Animal Research
1. Purpose- research must have a clear scientific purpose.
2. Care – animals must be cared for and housed in humane way.
3. Acquiring animals – animals must be aquired legally.
4. Suffering – experimental procedures must employ the least amount of suffering feasible.
5. Supervision – trained psychologist must supervise all animal research.

#1 David Reimer1965 – 2004

#2 The Well of Despair 1960
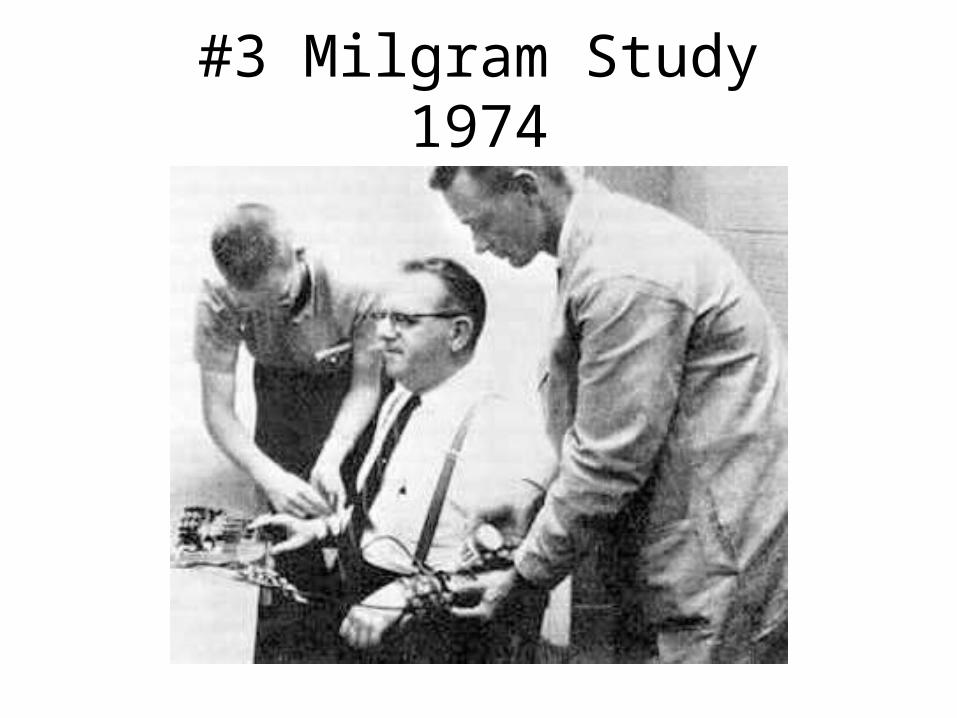
#3 Milgram Study1974
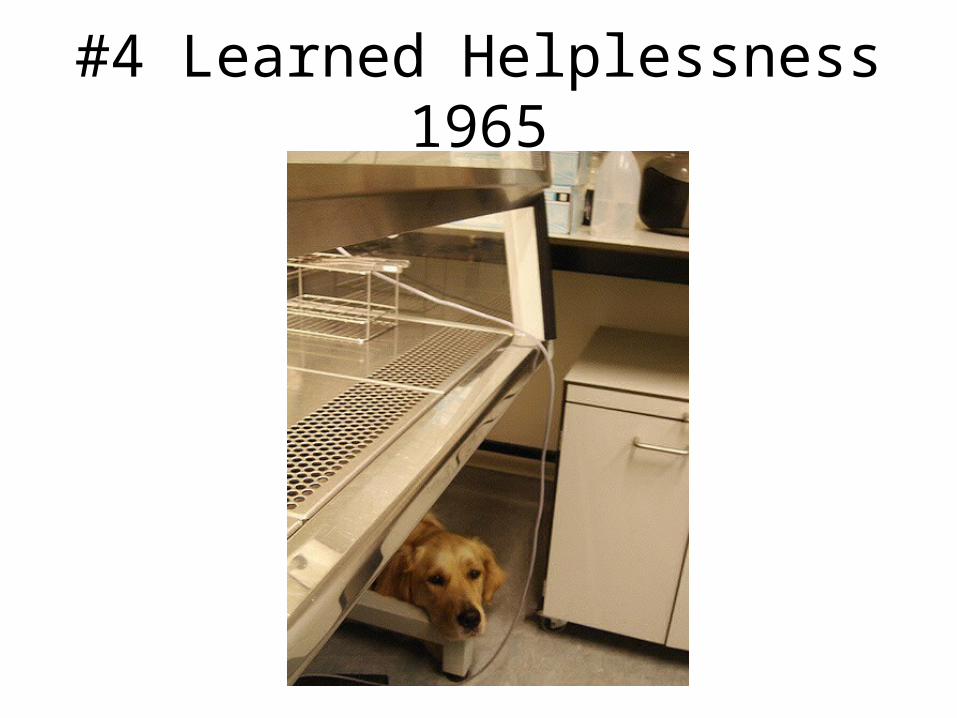
#4 Learned Helplessness1965

#5 Little Albert1920
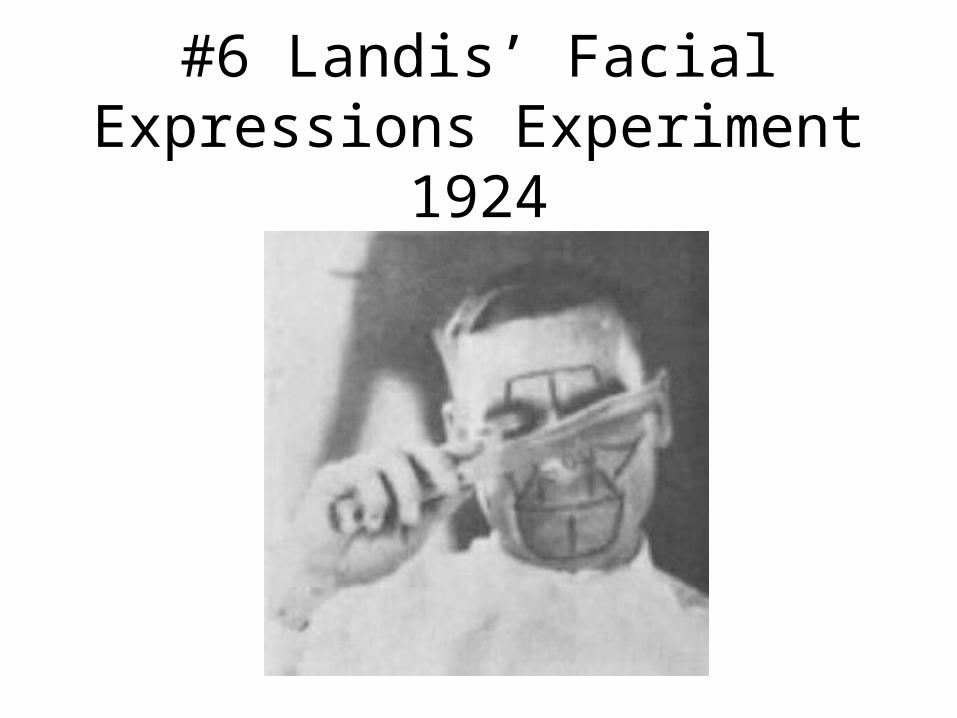
#6 Landis’ Facial Expressions Experiment
1924
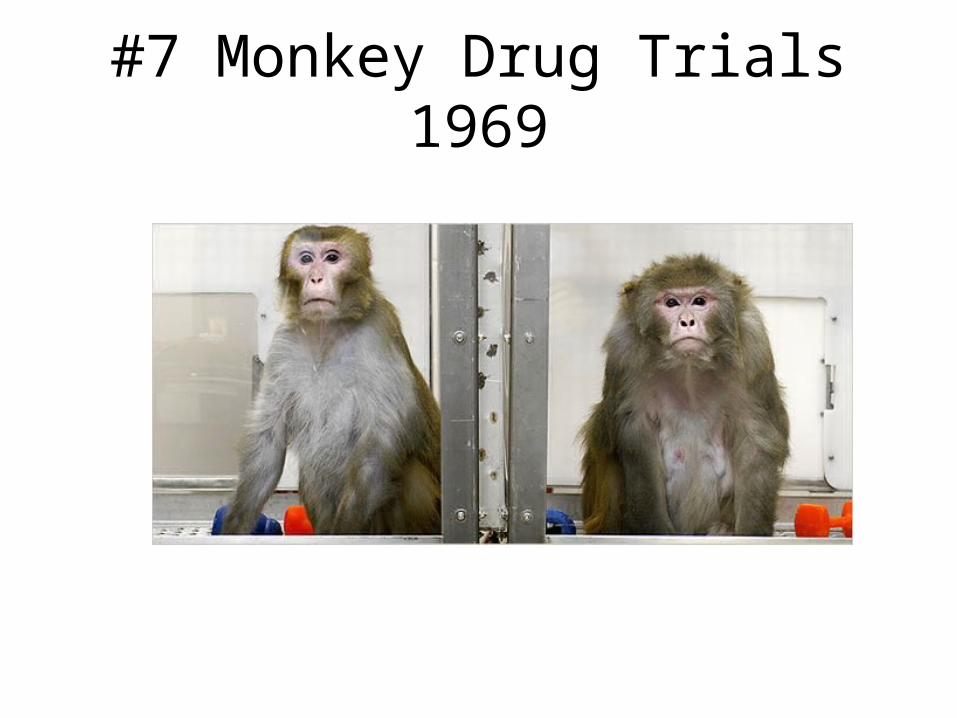
#7 Monkey Drug Trials1969
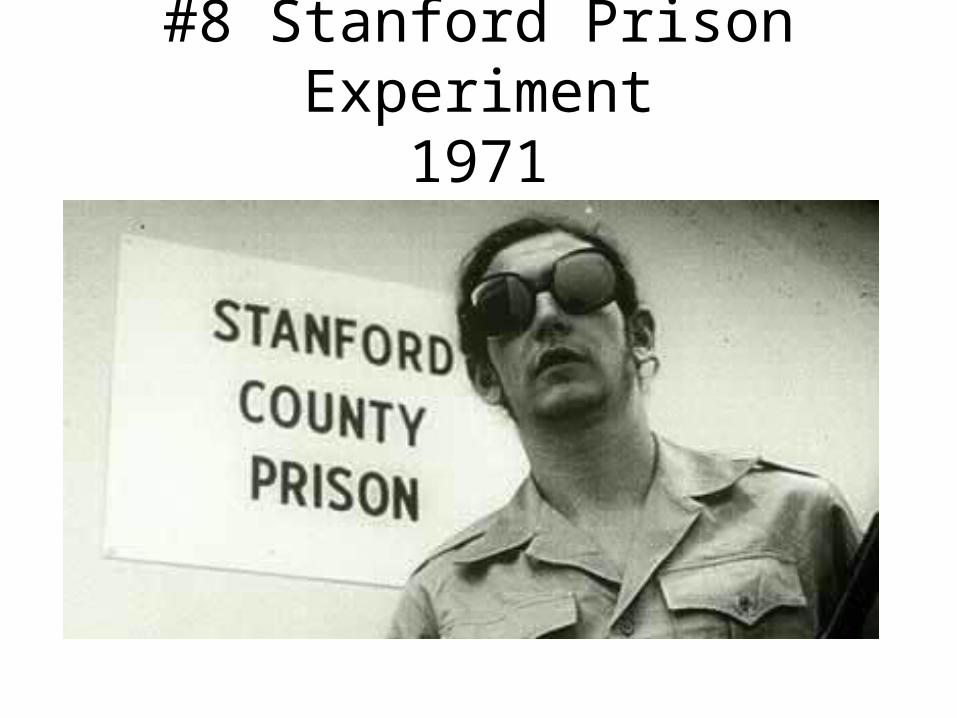
#8 Stanford Prison Experiment1971
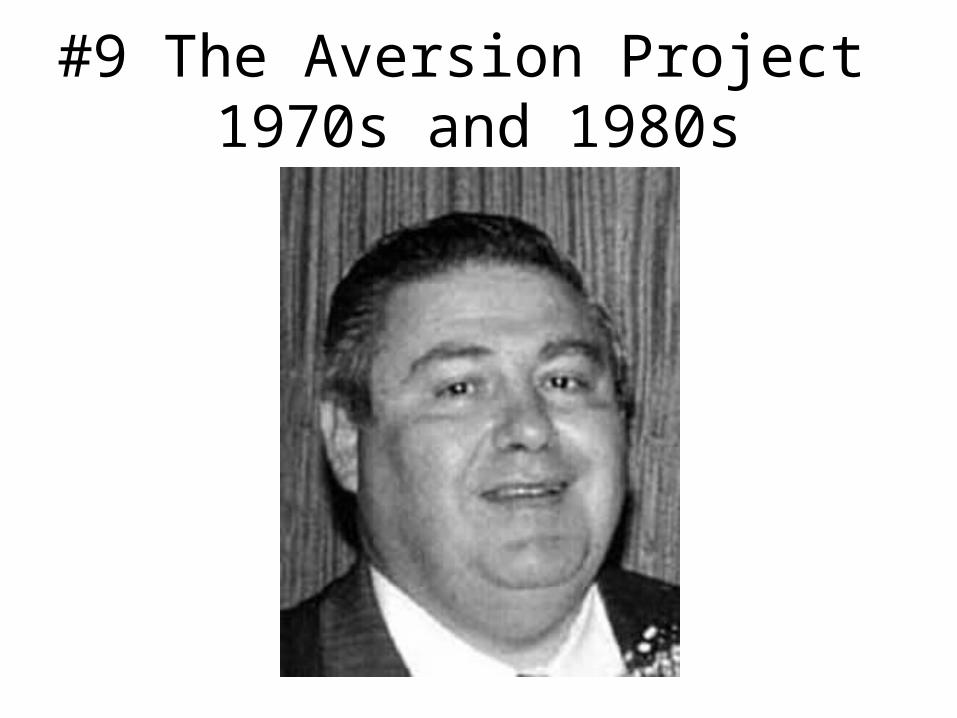
#9 The Aversion Project 1970s and 1980s

#10 The Monster Study1939
Qualitative Data
• Deals with descriptions • Data can be observed
but not measures
Quantitative Data
• Deals with numbers • Data can be measured
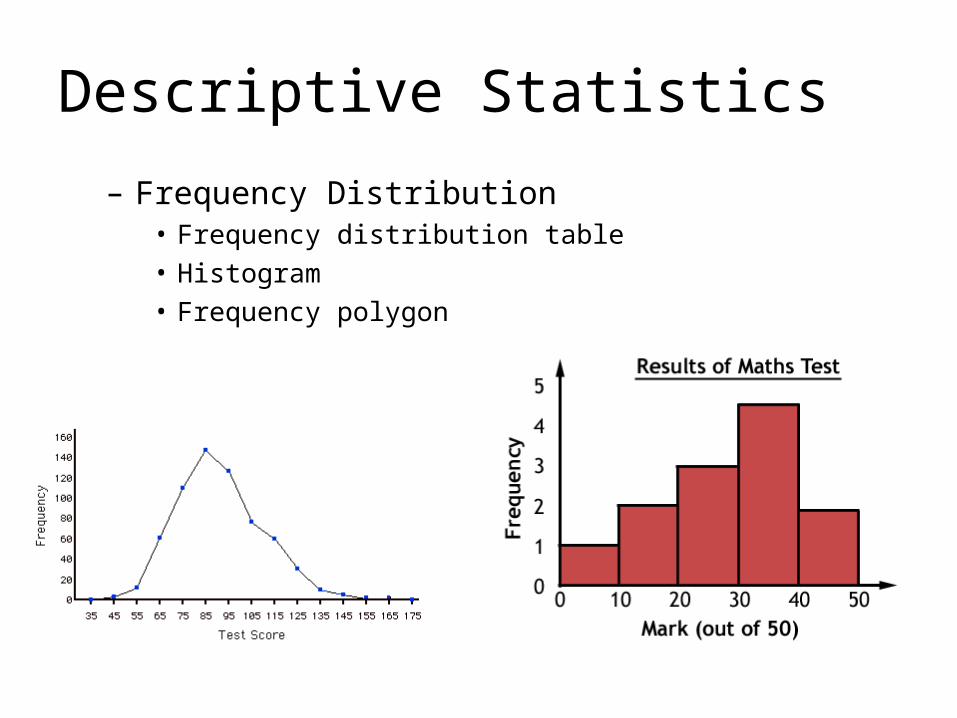
– Frequency Distribution • Frequency distribution table • Histogram• Frequency polygon
Descriptive Statistics
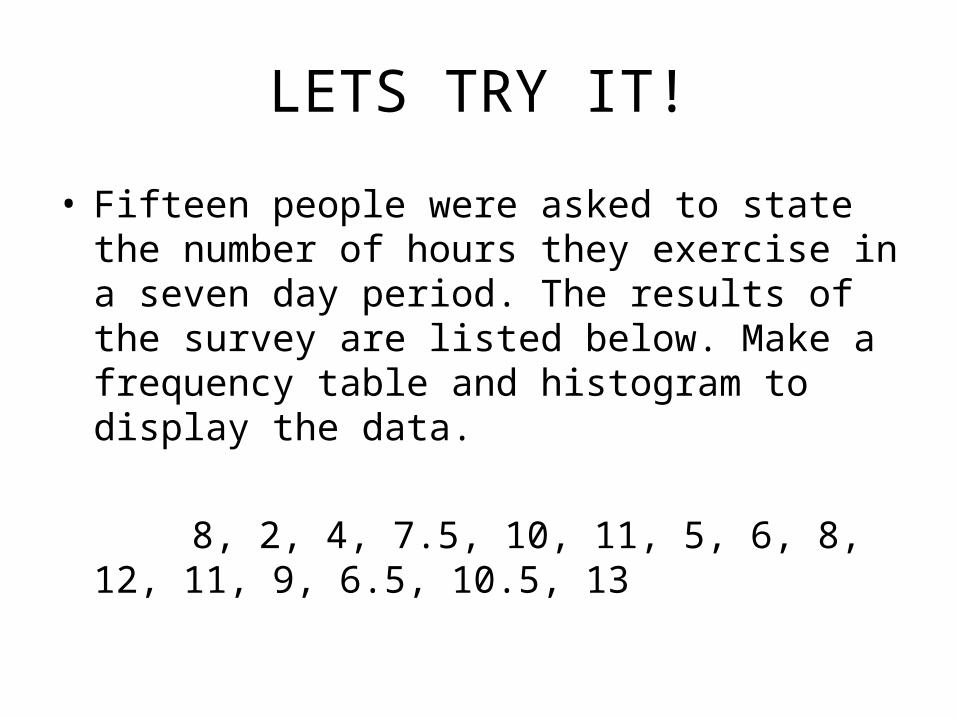
LETS TRY IT!
• Fifteen people were asked to state the number of hours they exercise in a seven day period. The results of the survey are listed below. Make a frequency table and histogram to display the data.
8, 2, 4, 7.5, 10, 11, 5, 6, 8, 12, 11, 9, 6.5, 10.5, 13
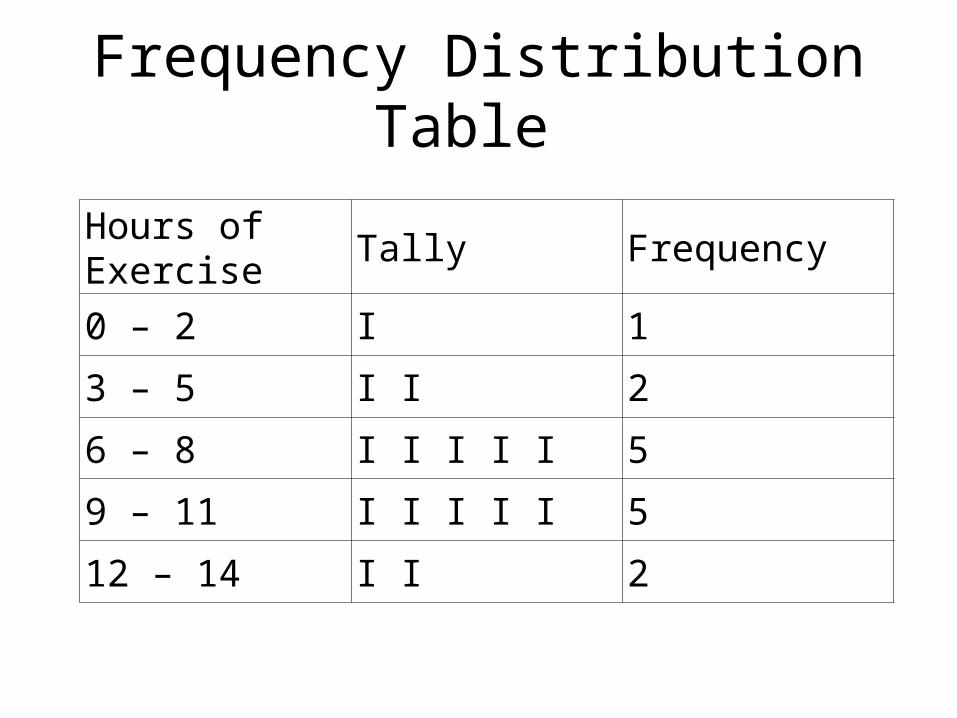
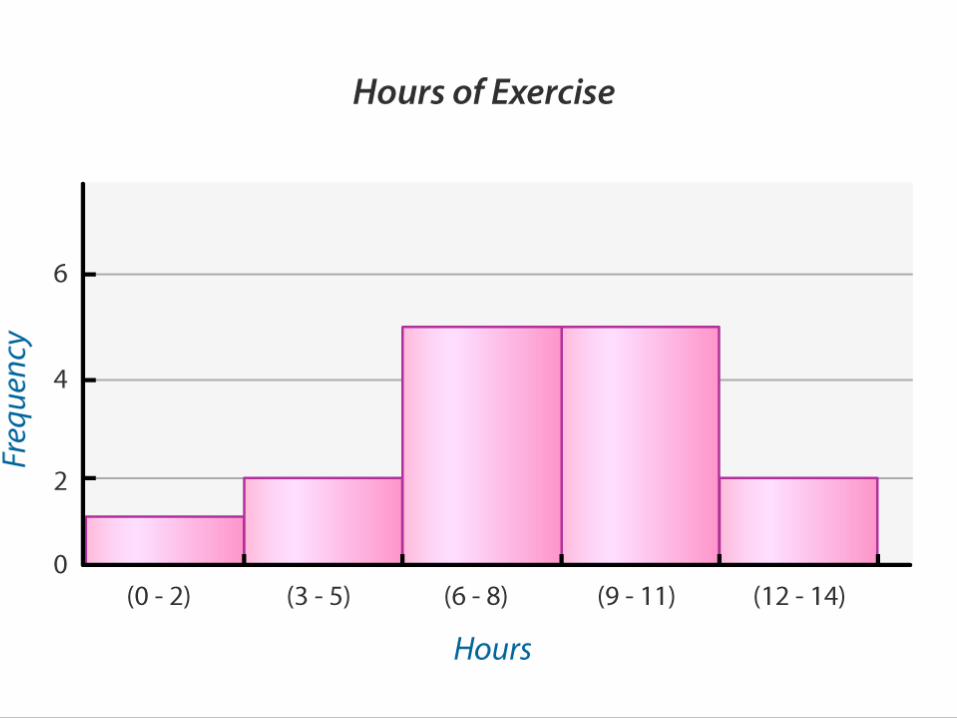
Frequency Distribution Table
Hours of Exercise Tally Frequency
0 – 2 I 1
3 – 5 I I 2
6 – 8 I I I I I 5
9 – 11 I I I I I 5
12 – 14 I I 2
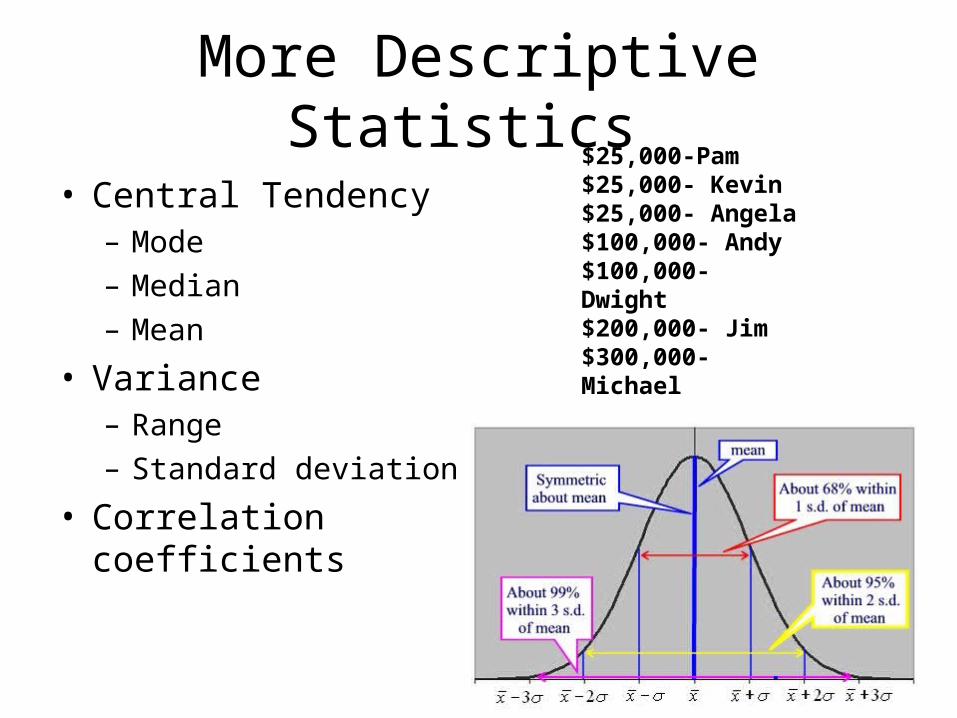
More Descriptive Statistics
• Central Tendency– Mode – Median – Mean
• Variance– Range – Standard deviation
• Correlation coefficients
$25,000-Pam $25,000- Kevin$25,000- Angela$100,000- Andy$100,000- Dwight$200,000- Jim$300,000- Michael
Closer Look at Standard Deviation
• Standard Deviation: The Standard Deviation is a measure of how spread out the numbers are.
• The higher the variance or SD, the more spread out the distribution is.
• Do scientists want a big or small SD?
Example: There was a, now discredited, theory proposed that claimed in IQ tests Men and Women had the same average IQs but men had a larger standard deviation than women. That is that there were more male geniuses and mentally challenged people than women. While woman's IQs tended to sit more around the average.
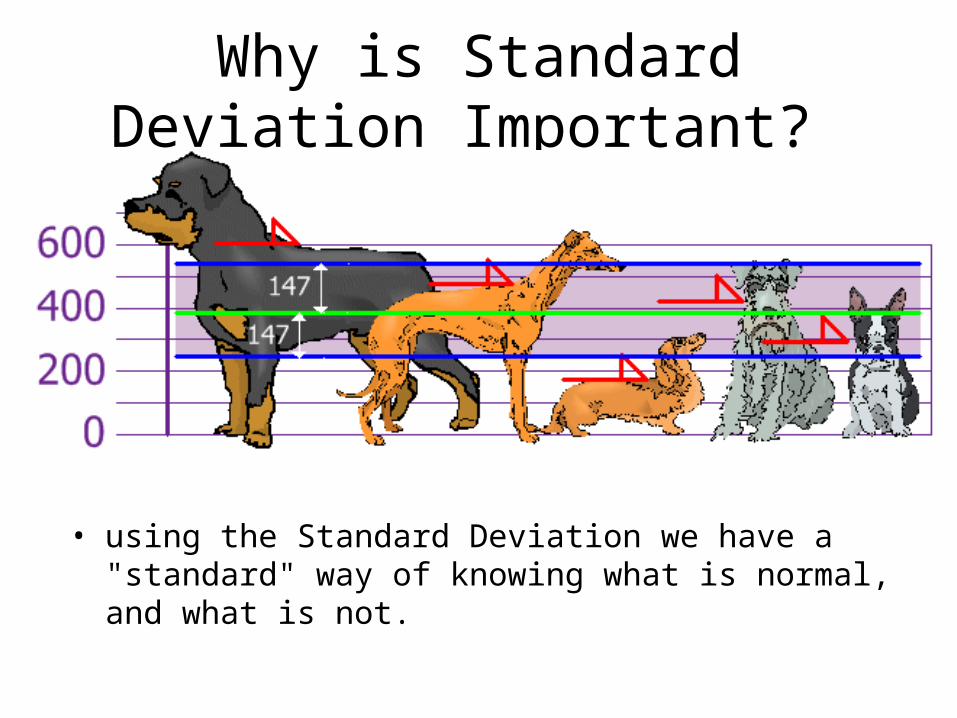
Why is Standard Deviation Important?
• using the Standard Deviation we have a "standard" way of knowing what is normal, and what is not.
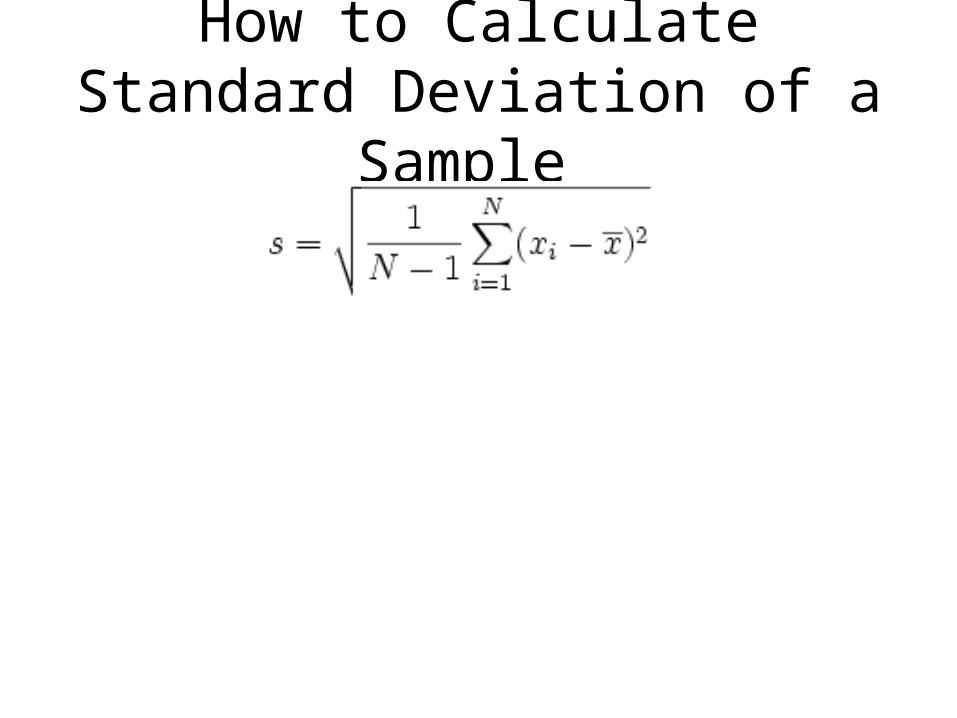
How to Calculate Standard Deviation of a Sample
Inferential Statistics
- Measures of Statistical Significance - Probability results are due to chance less than 5%
to be statistically significant
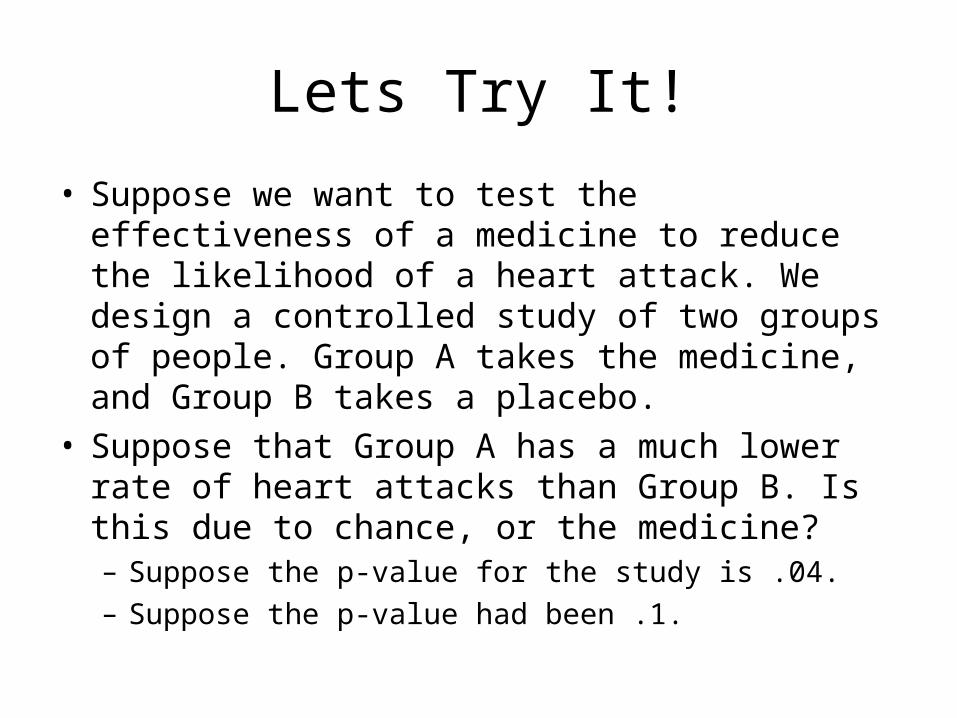
Lets Try It!
• Suppose we want to test the effectiveness of a medicine to reduce the likelihood of a heart attack. We design a controlled study of two groups of people. Group A takes the medicine, and Group B takes a placebo.
• Suppose that Group A has a much lower rate of heart attacks than Group B. Is this due to chance, or the medicine?– Suppose the p-value for the study is .04. – Suppose the p-value had been .1.