Embed Size (px)
Citation preview


Introduction - http://www.irdpq.qc.ca/communication/publications/PDF/Preliminaries.pdf Part 1 – Gait : http://www.irdpq.qc.ca/communication/publications/PDF/Part_1_Gait.pdf Part 2 – Muscle Strength and Physical Fitness : http://www.irdpq.qc.ca/communication/publications/PDF/Part_2_Muscle.pdf Part 3 – Range of Motion : http://www.irdpq.qc.ca/communication/publications/PDF/Part_3_Range.pdf Part 4 – Specific Tests : http://www.irdpq.qc.ca/communication/publications/PDF/Part_4_Specific.pdf Part 5 – The Foot : http://www.irdpq.qc.ca/communication/publications/PDF/Part_5_Foot.pdf
Hip Flexion Contracture ............................................................................................................ 181 Summary ............................................................................................................................... 181
1. Hip Flexion Contracture in the Premature Child ................................................................ 182 2. Hip Flexion Contracture in the Newborn ............................................................................ 186 3. Hip Flexion Contracture in Infants ..................................................................................... 190 4. Hip Flexion Contracture in Children .................................................................................. 194
Knee Flexion Contracture .......................................................................................................... 198 Summary .............................................................................................................................. 198 5. Knee Flexion Contracture in the Newborn ......................................................................... 199 6. Knee Flexion Contracture in Newborns and Infants .......................................................... 203 7. Knee Flexion Contracture in Children ................................................................................ 206
Hamstring Tightness Assessment ........................................................................................... 209
Summary .............................................................................................................................. 209 8. The Popliteal Angle ........................................................................................................... 210 9. The Popliteal Complimentary Angle .................................................................................. 217
10. Straight Leg Raise Test .................................................................................................... 222 Rotational Profile in the Lower Extremities .............................................................................. 227 Summary ................................................................................................................................ 227
11. Foot Progression Angle ..................................................................................................... 228 12. Lateral Hip Rotation and Medial Hip Rotation .................................................................... 231 13. Thigh-Foot Angle and the Transmalleolar Axis-Thigh Angle ............................................... 234 14. Forefoot Alignment: Metatarsus adductus .......................................................................... 241
Tibial Torsion ............................................................................................................................. 244 Summary ................................................................................................................................. 244 15. Measurement of the Transmallleolar Axis, Knee in Flexion ................................................ 244 16. Measurement of the Transmalleolar Axis, Knee in Extension ............................................. 250
Genu Valgum and Genu Varum ................................................................................................. 254
Summary ................................................................................................................................. 254 17. Intercondylar and Intermalleolar Distances in Supine ........................................................ 256 18. Tibiofemoral Angle, Intercondylar and Intermalleolar Distances in Supine and Standing ... 260 19. Tibiofemoral Angle, Intercondylar and Intermalleolar Distances in Standing ...................... 265
Joint Hypermobility .................................................................................................................... 271
Summary ................................................................................................................................. 271 20. Beighton Score Index ........................................................................................................ 273 21. Lower Limb Assessment Score ......................................................................................... 278
References ................................................................................................................................. 282 Annex : Up to Date References ................................................................................................ 287
Part 4 Specific Tests
181 Part 4: Specific Tests
Hip Flexion Contracture Summary
Measurement of hip joint range of motion is used clinically to assess joint disability or various medical conditions (orthopedic, neurological or musculoskeletal disorders). Research findings indicate that the ROM of joints is different in neonates, children, and adults without significant differences between sexes. 9, 14, 19, 20 To assess if there is joint motion limitation, the comparison between sides is usually appropriate. 49 Limitation of hip extension is physiologically normal in infants and children 9, 14, 20, 31, 44 and the term that is often used to describe this condition is hip flexion contracture (HFC). However, the term “contracture” usually refers to a pathological condition, which is not the case in the pediatric population when limitation of hip extension is within the normal ranges. Since the term “contracture” is often used in the literature to describe hip extension limitation, the same term will be used throughout this chapter for purposes of consistency. A common test used to detect HFC is the Thomas maneuver.
VALIDITY AND RELIABILITY OF THE THOMAS MANEUVER
� Inter-rater reliability had high scores in premature infants. 20
� Compared to other measurements taken in children (unimpaired and mild spastic diplegia), the Thomas test was reported as presenting the most reliable inter-sessional measures (along with knee extension measurements) and mostly when limitation was present in small degrees. 24
� For additional information on hip measurements, refer to the ‘’up to date’’ pages, at the end of the references pages.
Four studies were selected to document HFC with the Thomas maneuver in:
� The premature child - Harris et al.-1990; 20
� Newborns - Forero et al. -1989; 14
� Infants - Coon et al.-1975; 9
� Children - Boone et al. -1979. 5
182 Part 4: Specific Tests
1. Hip Flexion Contracture in the Premature Child 20
Age range: Newborns (~37 weeks gestational age), 4, 8 and 12 months (chronological age). 1.1 Clinical Use
� To measure neonatal passive ROM of hip extension limitation and to document age-related changes in the premature child.
� To screen infants who are at risk for neurological or musculoskeletal disorders.
1.2 Measurements
� Hip flexion contracture (Fig. 4.1).
1.3 Testing Procedures
REQUIRED EQUIPMENT
� Standard two-arm goniometer. The arms were shortened to accommodate the limb segments of infants.
� Examination table. � Hypoallergenic skin cosmetic crayon to mark anatomical landmarks.
PRE-TEST
� Mark the following anatomical landmarks:
� Lateral aspect of the hip joint;
� Lateral aspect of the femur.
TEST
� Testing position, goniometer alignment and measurements are presented in Table 4.1. � Method: International SFTRa Method of Measuring and Recording Joint Motion. This method refers to
the neutral zero procedure.16, 51 Thomas maneuver is used to detect hip flexion contracture.
� Results are compared to the normative reference values in Table 4.2
a International SFTR Method of Measuring and Recording Joint Motion 14, 32 refers to the assessment of joint motion by using a standardized approach based on the international neutral zero method and different basic planes designation. SFTR: S = Sagittal; F = Frontal; T = Transverse; R = Rotation.
183 Part 4: Specific Tests
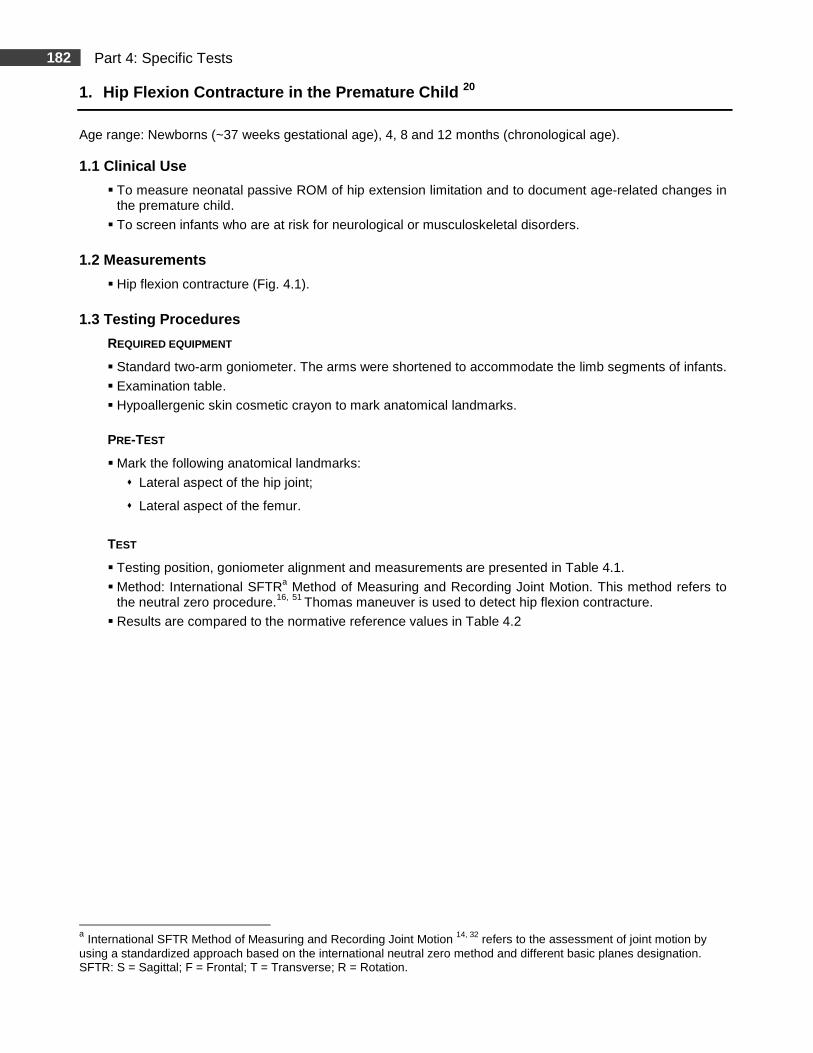
TABLE 4.1. HIP FLEXION CONTRACTURE
Testing Condition
Figure 4.1. Method of positioning and clinical determination of hip flexion contracture (© IRDPQ – 2011).
� The infant must be in an alert, non crying state. The head is gently held in midline to control effects of tonic neck reflexes on muscle tone.
Testing Position
� Standard Thomas test. � The contralateral hip and knee are flexed to the
chest. The test leg is allowed to drop into extension.
� Goniometer Alignment and Measurements � The axis of the goniometer is centered over the lateral aspect of the hip joint. � The stationary arm rests on the table top. � The movable arm is parallel to the lateral aspect of the femur. � The angle formed by the leg aligned with the surface on which the infant is lying is recorded
(Fig. 4.1).
1.4 Normative Reference Values
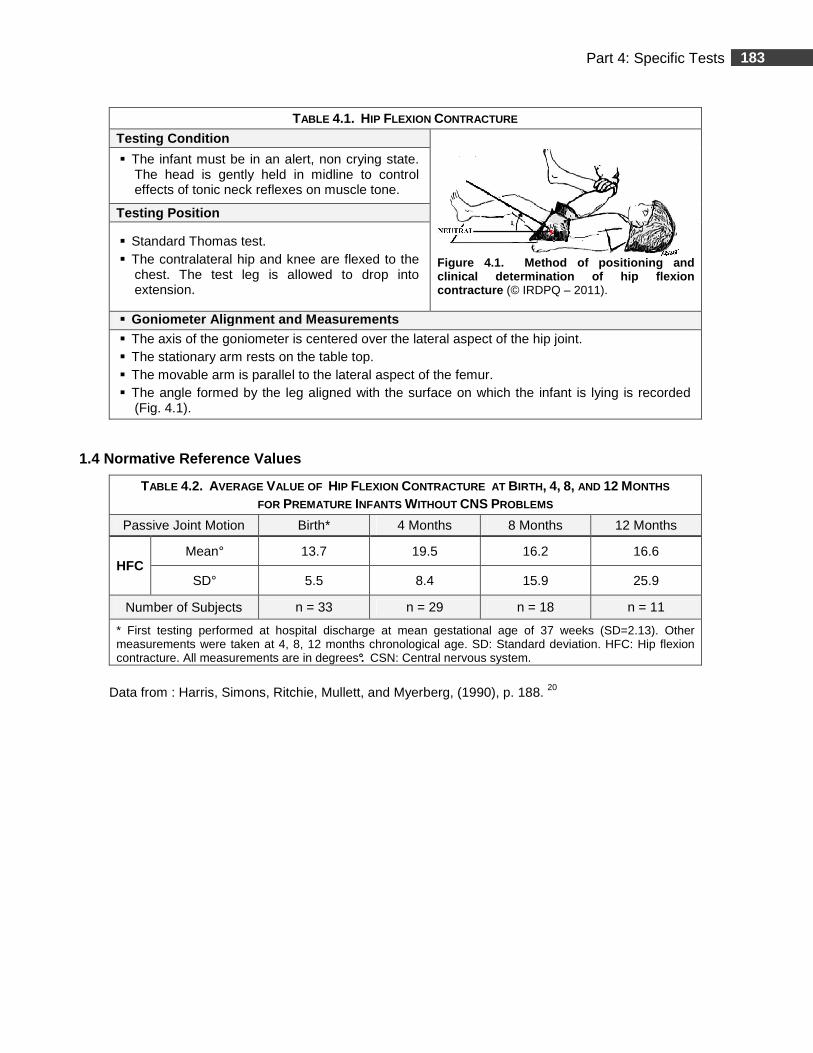
TABLE 4.2. AVERAGE VALUE OF HIP FLEXION CONTRACTURE AT BIRTH, 4, 8, AND 12 MONTHS FOR PREMATURE INFANTS WITHOUT CNS PROBLEMS
Passive Joint Motion Birth* 4 Months 8 Months 12 Months
HFC Mean° 13.7 19.5 16.2 16.6
SD° 5.5 8.4 15.9 25.9
Number of Subjects n = 33 n = 29 n = 18 n = 11
* First testing performed at hospital discharge at mean gestational age of 37 weeks (SD=2.13). Other measurements were taken at 4, 8, 12 months chronological age. SD: Standard deviation. HFC: Hip flexion contracture. All measurements are in degrees°. CSN: Central nervous system.
Data from : Harris, Simons, Ritchie, Mullett, and Myerberg, (1990), p. 188. 20
184 Part 4: Specific Tests
1.5 Study Summary
Title: Joint Range of Motion Development in Premat ure Infants 20
Authors Harris, M. B., Simons, C. J. R., Ritchie, S. K., Mullett, M. D., & Myerberg, D. Z.
Publication Pediatric Physical Therapy, 1990, 2, 185-191.
Purpose of the Study To document joint range of motion values for premature infants during the first year of life.
Type of Population Normal
Other: Premature infants with and without central nervous system sequelae.
Clinical Relevance Quantification of range of motion in hip flexion contracture, hip abduction, ankle dorsiflexion and elbow extension in premature infants.
Methods
Subjects � The study sample consisted of 65 premature infants: (38 ♀; 27 ♂). USA. � Age range: ~37 weeks (gestational age) to 12 months (chronological age). � Infants were classified into two groups depending on common complications directly related to
prematurity. � Range of motion (ROM) was assessed at time of hospital discharge, at approaching term gestational
age (~37 weeks, SD=2.13) and at 4, 8, 12 months chronological age. � If the child was not present at the clinic appointment, the subject was not represented in the data for
that particular age. The number of children without central nervous system complications (CNS) was at initial examination: 33; at four months, 29; at eight months,18 and at twelve months, 11.
Testing Procedures and Instrumentation � Hip abduction, hip extension (hip flexion contracture), elbow extension, wrist extension, ankle
dorsiflexion, the scarf sign and the popliteal angle (PA) were measured on both sides. � Testing positions were standardized and based on the bAmiel-Tison Neurological Evaluation and the
c International SFTR Method of Measuring and Recording Joint Motion. Testing was abandoned if infants were crying vigorously or were in a deep sleep.
� Instrumentation: Standard plastic goniometer (arms were shortened to accommodate limb segments). The larger angle was recorded to ensure reading in a standard fashion with the exception of hip abduction measurements.
Data Analysis � Inter-rater reliability was established by having two examiners test the subjects independently in rapid
succession. Reliability was obtained on six subjects, representing each age and each motion. Agreement between the examiners was calculated in two ways:
1. One-way analysis of variance procedure producing an intra-class correlation coefficient (ICC); 2. A ratio of agreement to total observations multiplied by 100 to obtain a percentage.
� Mean, range and standard deviation for each joint motion was calculated.
b) Amiel Tison neurological evaluation intends to establish the risk for later neurologic impairment. A recent study 9 tested
the reliability of the revised Amiel Tison neurological evaluation at term. Kappa Coefficient Ranges for the scarf sign test was 0.82 and for the popliteal angle 0.78 which is excellent by authors ratings.
c) International SFTR Method of Measuring and Recording Joint Motion 14, 32 refers to the assessment of joint motion by using a standardized approach based on the international neutral zero method and different basic planes designation. SFTR: S = Sagittal; F = Frontal; T = Transverse; R = Rotation.
185 Part 4: Specific Tests
1.5 Study Summary (Continued)
Results
� Psychometric Properties
� Inter-rater reliability: ICC for ankle dorsiflexion: 0.87.
� Hip extension (hip flexion contracture): 0.72.
� Hip abduction: 0.85.
� Popliteal angle: 0.83.
� The scarf sign: 0.84.
� Wrist extension: 0.59.
� Perfect agreement was reported in elbow extension, hip extension and hip abduction (100%). Percentage of agreement for wrist extension was 92%; for ankle dorsiflexion, 75 %; for PA, 67%; and for the scarf sign, 75%.
� There was no difference in ROM between the two sides of the body. ROM of hip extension remained relatively constant over the 12 months. PA values decreased by 5° between the first and second test and then remained fairly constant. Over the first year, only ankle dorsiflexion showed a clear decrease of almost 10°.
� Premature infants who had CNS involvement had no change in ROM for hip abduction and had much lower ankle dorsiflexion values at 8 months than infants who had no CNS involvement.
� Premature infants who had no CNS involvement had an increase in abduction ROM. At 12 months of age, abduction ROM was much greater than in premature infants who had CNS involvement.
� Findings support results from other authors that premature infants never acquired the extreme postural flexion exhibited by term infants at birth.
Authors’ Conclusion
� Pre-term infants have less flexion at term conceptional age than their full-term counterparts. This may support the concept that gross motor development in premature infants is qualitatively different from motor development in full-term children.
Comments
� Internal validity seems good. However, sample size is small in some age-categories (n =18 in the 8-months-group; n = 11 in the 12-months-group) and the use of results must be interpreted with caution. External validity in the other age groups (including sample size) seems good and the data can be used as a trend for clinical guidelines.
� Only the measurements presenting acceptable reliability with the goniometry technique were taking into account for this document. The scarf sign (no goniometer measurement) and wrist extension ROM (poor inter-rater reliability) were excluded.
� The PA measurements were excluded based on the testing position (hip maximally flexed on the abdomen) which is reported as being less accurate than when the hip is flexed at 90°, the latter being unaffected by abdominal bulk. 19, 22
186 Part 4: Specific Tests
2. Hip Flexion Contracture in the Newborn 14
Age range: One to three days. 2.1 Clinical Use
� To measure neonatal passive ROM of hip extension limitation.
� To screen infants who are at risk for neurological or musculoskeletal disorders.
2.2 Measurements
� Hip flexion contracture (Fig. 4.2).
2.3 Testing Procedures
REQUIRED EQUIPMENT
� Standard two-arm 360° goniometer.
� Hypoallergenic skin cosmetic crayon to mark anatomical landmarks.
PRE-TEST
� Mark the following anatomical landmarks:
� Anterior superior iliac spine (ASIS);
� Posterior superior iliac spine (PSIS);
� Femoral greater trochanter;
� Femoral lateral epicondyle;
� On the tested limb, a line is drawn between the anterior and posterior superior iliac spines and a line perpendicular to it from the greater trochanter.
TEST
� Testing position, goniometer alignment and measurements are presented in Table 4.3. � Results are compared to the normative reference values in Table 4.4
187 Part 4: Specific Tests
TABLE 4.3. HIP FLEXION CONTRACTURE
Testing Condition
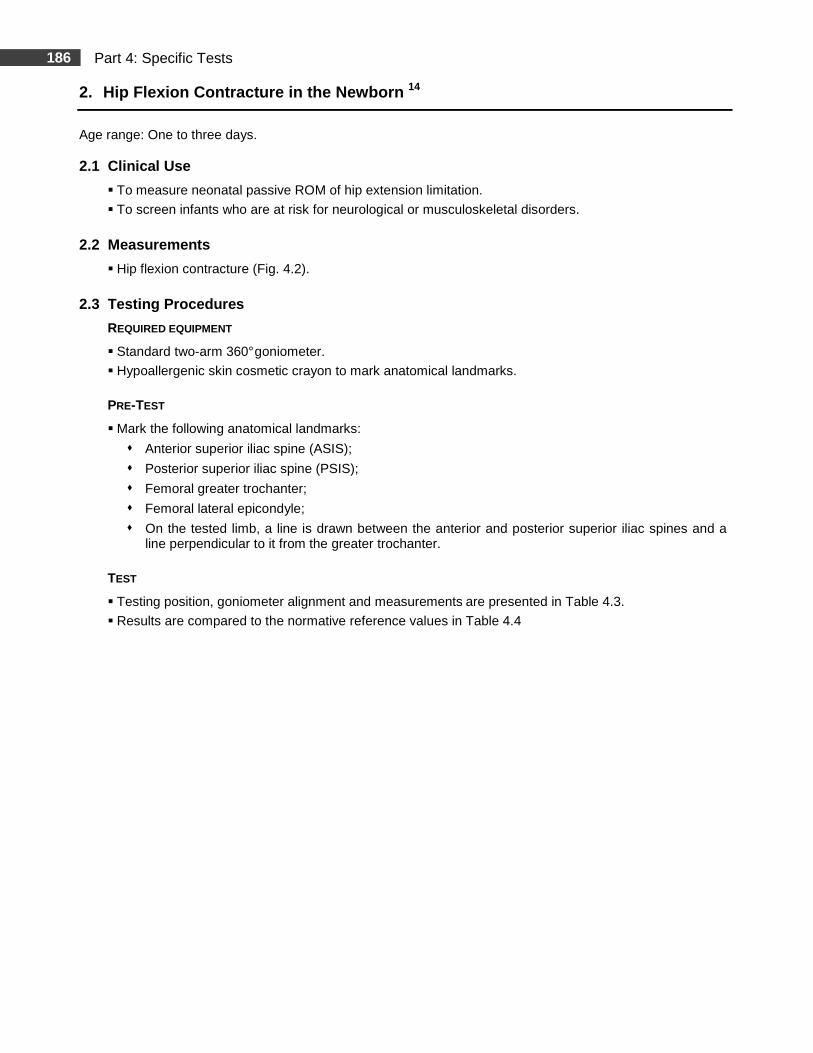
Figure 4.2. Method of positioning and clinical determination of hip flexion contracture. (© IRDPQ – 2011).
� The infant must be in an alert-quiet, alert-active or drowsy-awake Brazelton states. Measurements were taken with the diaper off, the infant lying on a warmer bed in the nursery.
� The infant’s head is gently held in midline to reduce effects of neonatal neck reflexes.
Testing Position
� Standard Thomas test. � The contralateral leg is placed in maximum hip and
knee flexion to stabilize the pelvis. � The tested hip is kept in neutral position and brought
in extension. � The end range of beginning flexion is determined
when the pelvis begins to rock anteriorly.
Goniometer Alignment and Measurements
� The axis of the goniometer is placed over the greater trochanter. � The stationary arm is aligned with the perpendicular line described previously in the pre-test
section. � The movable arm is aligned with a line of the femoral lateral epicondyle along the midline of the
femur. � The angle formed by the leg aligned with the surface on which the infant is lying is recorded
(Fig. 4.2).
2.4 Normative Reference Values
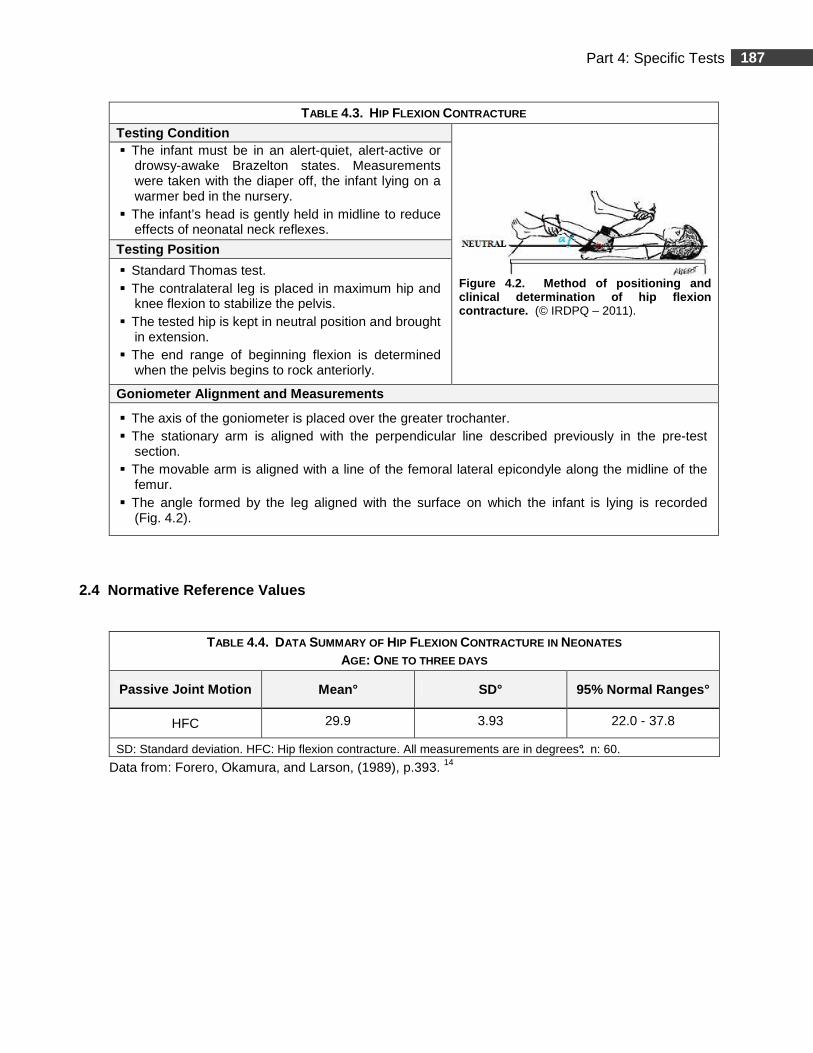
TABLE 4.4. DATA SUMMARY OF HIP FLEXION CONTRACTURE IN NEONATES AGE: ONE TO THREE DAYS
Passive Joint Motion Mean° SD° 95% Normal Ranges°
HFC 29.9 3.93 22.0 - 37.8
SD: Standard deviation. HFC: Hip flexion contracture. All measurements are in degrees°. n: 60.
Data from: Forero, Okamura, and Larson, (1989), p.393. 14
188 Part 4: Specific Tests
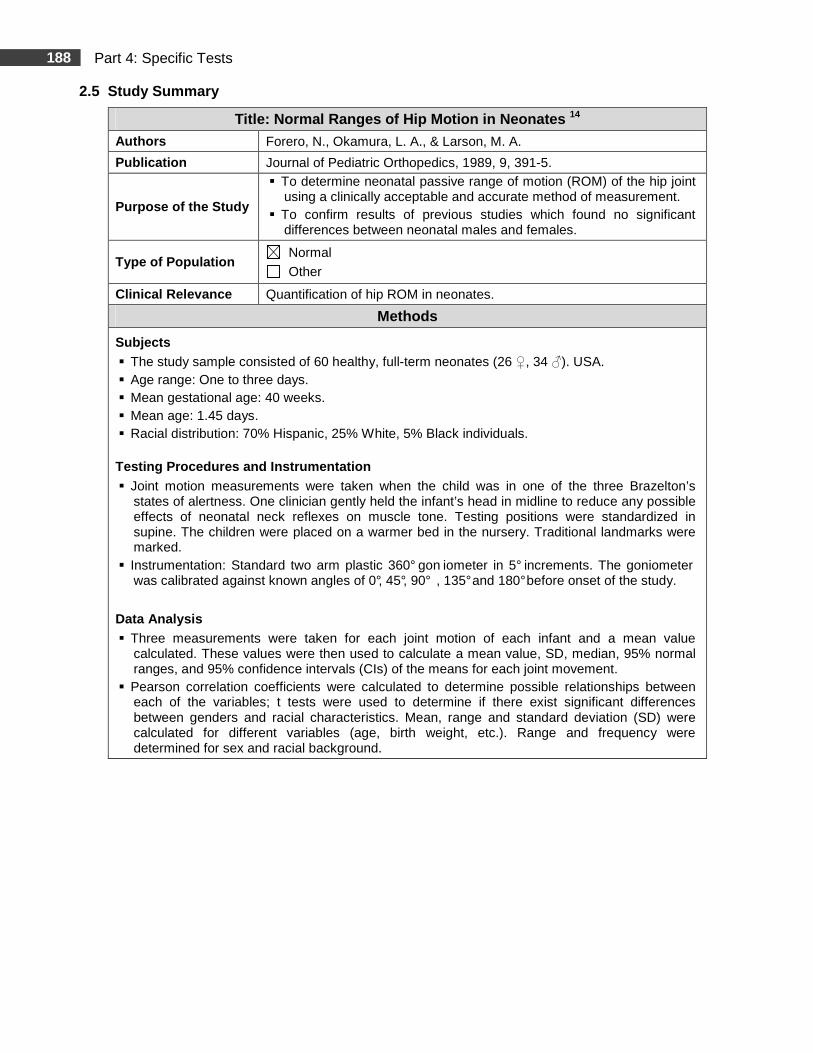
2.5 Study Summary
Title: Normal Ranges of Hip Motion in Neonates 14 Authors Forero, N., Okamura, L. A., & Larson, M. A.
Publication Journal of Pediatric Orthopedics, 1989, 9, 391-5.
Purpose of the Study
� To determine neonatal passive range of motion (ROM) of the hip joint using a clinically acceptable and accurate method of measurement.
� To confirm results of previous studies which found no significant differences between neonatal males and females.
Type of Population Normal
Other
Clinical Relevance Quantification of hip ROM in neonates.
Methods
Subjects � The study sample consisted of 60 healthy, full-term neonates (26 ♀, 34 ♂). USA. � Age range: One to three days. � Mean gestational age: 40 weeks. � Mean age: 1.45 days. � Racial distribution: 70% Hispanic, 25% White, 5% Black individuals. Testing Procedures and Instrumentation � Joint motion measurements were taken when the child was in one of the three Brazelton’s
states of alertness. One clinician gently held the infant’s head in midline to reduce any possible effects of neonatal neck reflexes on muscle tone. Testing positions were standardized in supine. The children were placed on a warmer bed in the nursery. Traditional landmarks were marked.
� Instrumentation: Standard two arm plastic 360° gon iometer in 5° increments. The goniometer was calibrated against known angles of 0°, 45°, 90° , 135° and 180° before onset of the study.
Data Analysis
� Three measurements were taken for each joint motion of each infant and a mean value calculated. These values were then used to calculate a mean value, SD, median, 95% normal ranges, and 95% confidence intervals (CIs) of the means for each joint movement.
� Pearson correlation coefficients were calculated to determine possible relationships between each of the variables; t tests were used to determine if there exist significant differences between genders and racial characteristics. Mean, range and standard deviation (SD) were calculated for different variables (age, birth weight, etc.). Range and frequency were determined for sex and racial background.
189 Part 4: Specific Tests
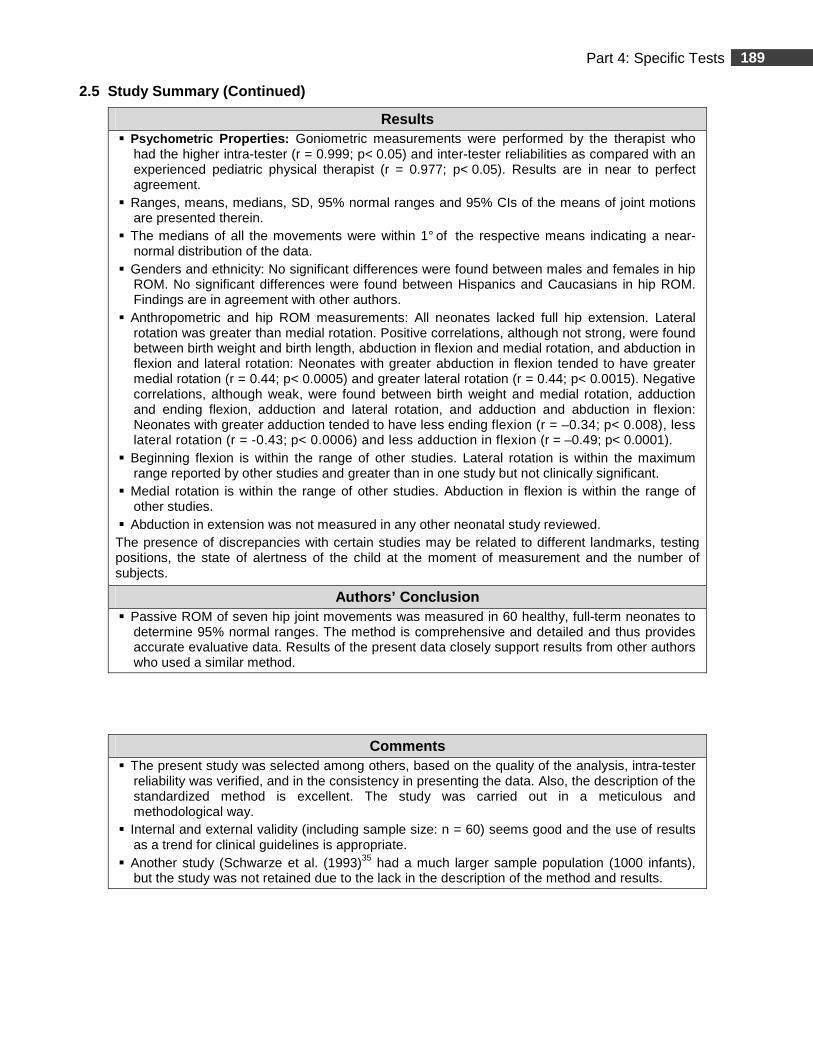
2.5 Study Summary (Continued)
Results � Psychometric Properties : Goniometric measurements were performed by the therapist who
had the higher intra-tester (r = 0.999; p< 0.05) and inter-tester reliabilities as compared with an experienced pediatric physical therapist (r = 0.977; p< 0.05). Results are in near to perfect agreement.
� Ranges, means, medians, SD, 95% normal ranges and 95% CIs of the means of joint motions are presented therein.
� The medians of all the movements were within 1° of the respective means indicating a near-normal distribution of the data.
� Genders and ethnicity: No significant differences were found between males and females in hip ROM. No significant differences were found between Hispanics and Caucasians in hip ROM. Findings are in agreement with other authors.
� Anthropometric and hip ROM measurements: All neonates lacked full hip extension. Lateral rotation was greater than medial rotation. Positive correlations, although not strong, were found between birth weight and birth length, abduction in flexion and medial rotation, and abduction in flexion and lateral rotation: Neonates with greater abduction in flexion tended to have greater medial rotation (r = 0.44; p< 0.0005) and greater lateral rotation (r = 0.44; p< 0.0015). Negative correlations, although weak, were found between birth weight and medial rotation, adduction and ending flexion, adduction and lateral rotation, and adduction and abduction in flexion: Neonates with greater adduction tended to have less ending flexion (r = –0.34; p< 0.008), less lateral rotation (r = -0.43; p< 0.0006) and less adduction in flexion (r = –0.49; p< 0.0001).
� Beginning flexion is within the range of other studies. Lateral rotation is within the maximum range reported by other studies and greater than in one study but not clinically significant.
� Medial rotation is within the range of other studies. Abduction in flexion is within the range of other studies.
� Abduction in extension was not measured in any other neonatal study reviewed. The presence of discrepancies with certain studies may be related to different landmarks, testing positions, the state of alertness of the child at the moment of measurement and the number of subjects.
Authors’ Conclusion
� Passive ROM of seven hip joint movements was measured in 60 healthy, full-term neonates to determine 95% normal ranges. The method is comprehensive and detailed and thus provides accurate evaluative data. Results of the present data closely support results from other authors who used a similar method.
Comments
� The present study was selected among others, based on the quality of the analysis, intra-tester reliability was verified, and in the consistency in presenting the data. Also, the description of the standardized method is excellent. The study was carried out in a meticulous and methodological way.
� Internal and external validity (including sample size: n = 60) seems good and the use of results as a trend for clinical guidelines is appropriate.
� Another study (Schwarze et al. (1993)35 had a much larger sample population (1000 infants), but the study was not retained due to the lack in the description of the method and results.
190 Part 4: Specific Tests
3. Hip Flexion Contracture in Infants 9
Age range: 6 weeks, 3 months and 6 months.
3.1 Clinical Use
� To measure neonatal passive ROM of hip extension limitation and to document age-related changes in the premature child.
� To screen infants who are at risk for neurological or musculoskeletal disorders.
3.2 Measurements
� Hip flexion contracture (Fig. 4.3).
3.3 Testing Procedures
REQUIRED EQUIPMENT
� Standard goniometer.
� Examination table.
� Hypoallergenic skin cosmetic crayon to mark anatomical landmarks.
PRE-TEST
� Mark the following anatomical landmarks with the leg in extension:
� The femoral greater trochanter;
� The lateral condyle of the femur.
TEST
� Testing position, goniometer alignment and measurements are presented in Table 4.5. � Results are compared to the normative reference values in Table 4.6, for flexion contracture.
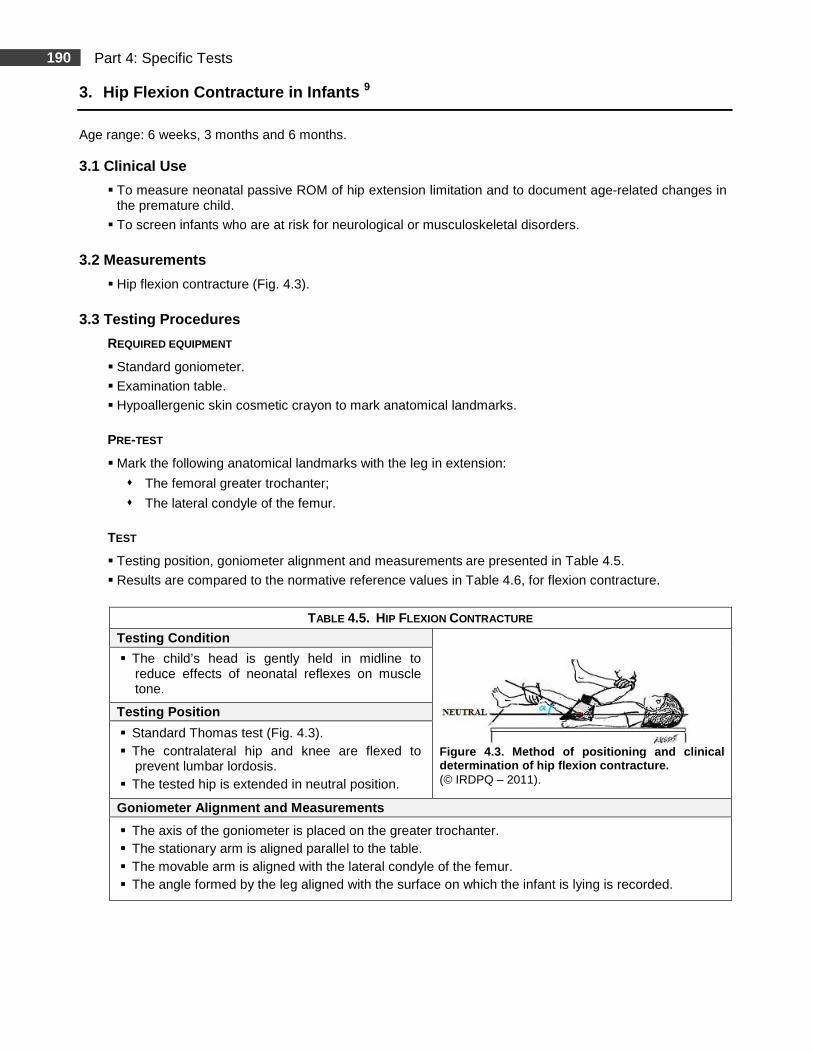
TABLE 4.5. HIP FLEXION CONTRACTURE
Testing Condition
Figure 4.3. Method of positioning and clinical determination of hip flexion contracture. (© IRDPQ – 2011).
� The child’s head is gently held in midline to reduce effects of neonatal reflexes on muscle tone.
Testing Position
� Standard Thomas test (Fig. 4.3). � The contralateral hip and knee are flexed to
prevent lumbar lordosis. � The tested hip is extended in neutral position.
Goniometer Alignment and Measurements
� The axis of the goniometer is placed on the greater trochanter. � The stationary arm is aligned parallel to the table. � The movable arm is aligned with the lateral condyle of the femur. � The angle formed by the leg aligned with the surface on which the infant is lying is recorded.
191 Part 4: Specific Tests
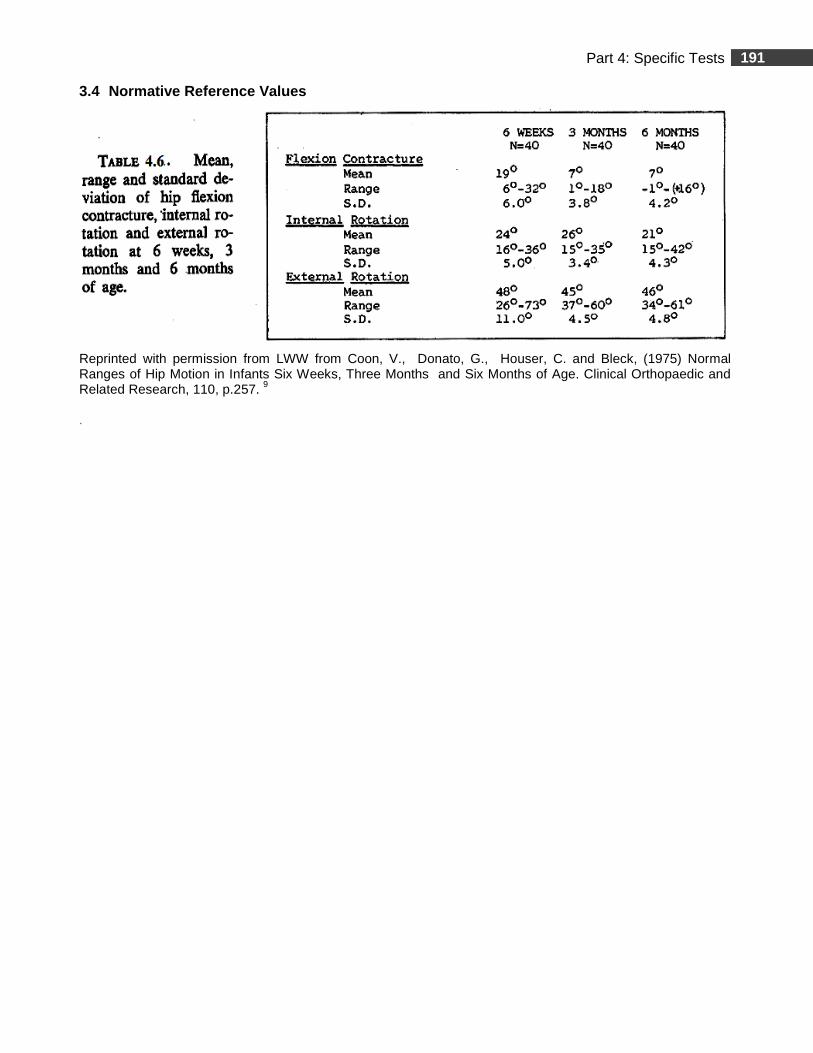
3.4 Normative Reference Values
Reprinted with permission from LWW from Coon, V., Donato, G., Houser, C. and Bleck, (1975) Normal Ranges of Hip Motion in Infants Six Weeks, Three Months and Six Months of Age. Clinical Orthopaedic and Related Research, 110, p.257. 9
.
192 Part 4: Specific Tests
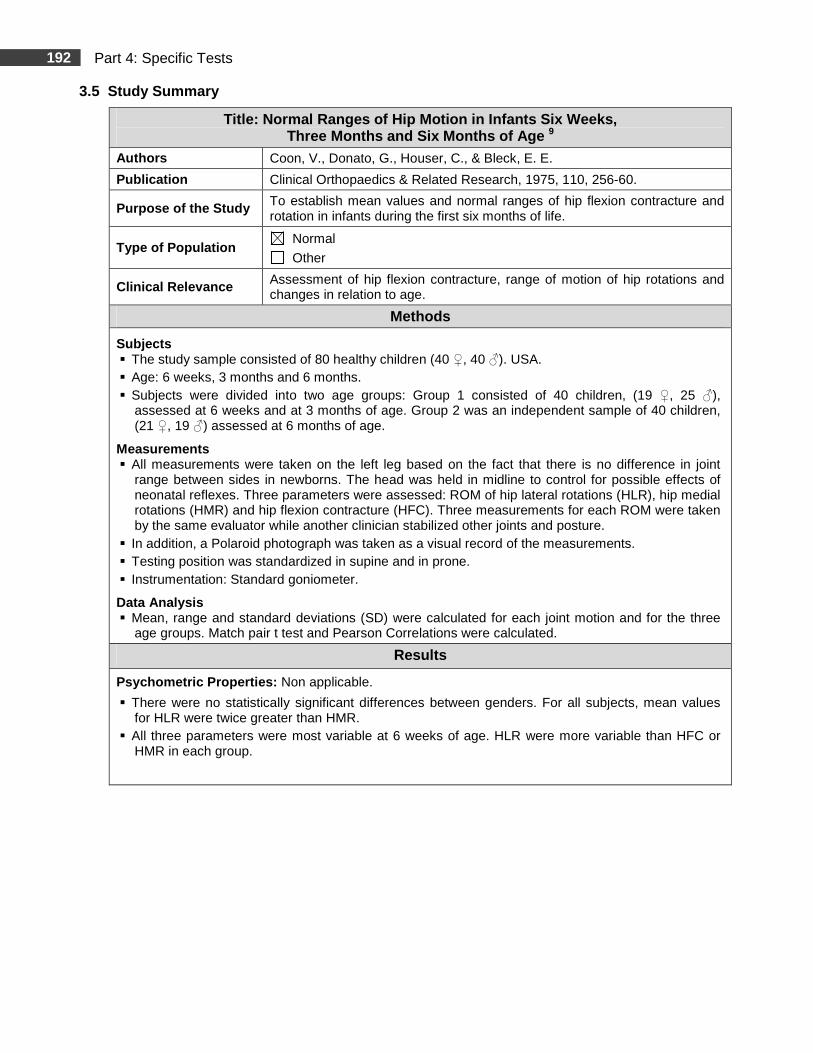
3.5 Study Summary
Title: Normal Ranges of Hip Motion in Infants Six W eeks, Three Months and Six Months of Age 9
Authors Coon, V., Donato, G., Houser, C., & Bleck, E. E.
Publication Clinical Orthopaedics & Related Research, 1975, 110, 256-60.
Purpose of the Study To establish mean values and normal ranges of hip flexion contracture and rotation in infants during the first six months of life.
Type of Population Normal
Other
Clinical Relevance Assessment of hip flexion contracture, range of motion of hip rotations and changes in relation to age.
Methods
Subjects � The study sample consisted of 80 healthy children (40 ♀, 40 ♂). USA. � Age: 6 weeks, 3 months and 6 months. � Subjects were divided into two age groups: Group 1 consisted of 40 children, (19 ♀, 25 ♂),
assessed at 6 weeks and at 3 months of age. Group 2 was an independent sample of 40 children, (21 ♀, 19 ♂) assessed at 6 months of age.
Measurements � All measurements were taken on the left leg based on the fact that there is no difference in joint
range between sides in newborns. The head was held in midline to control for possible effects of neonatal reflexes. Three parameters were assessed: ROM of hip lateral rotations (HLR), hip medial rotations (HMR) and hip flexion contracture (HFC). Three measurements for each ROM were taken by the same evaluator while another clinician stabilized other joints and posture.
� In addition, a Polaroid photograph was taken as a visual record of the measurements. � Testing position was standardized in supine and in prone. � Instrumentation: Standard goniometer.
Data Analysis � Mean, range and standard deviations (SD) were calculated for each joint motion and for the three
age groups. Match pair t test and Pearson Correlations were calculated.
Results
Psychometric Properties: Non applicable.
� There were no statistically significant differences between genders. For all subjects, mean values for HLR were twice greater than HMR.
� All three parameters were most variable at 6 weeks of age. HLR were more variable than HFC or HMR in each group.
193 Part 4: Specific Tests
3.5 Study Summary (Continued)
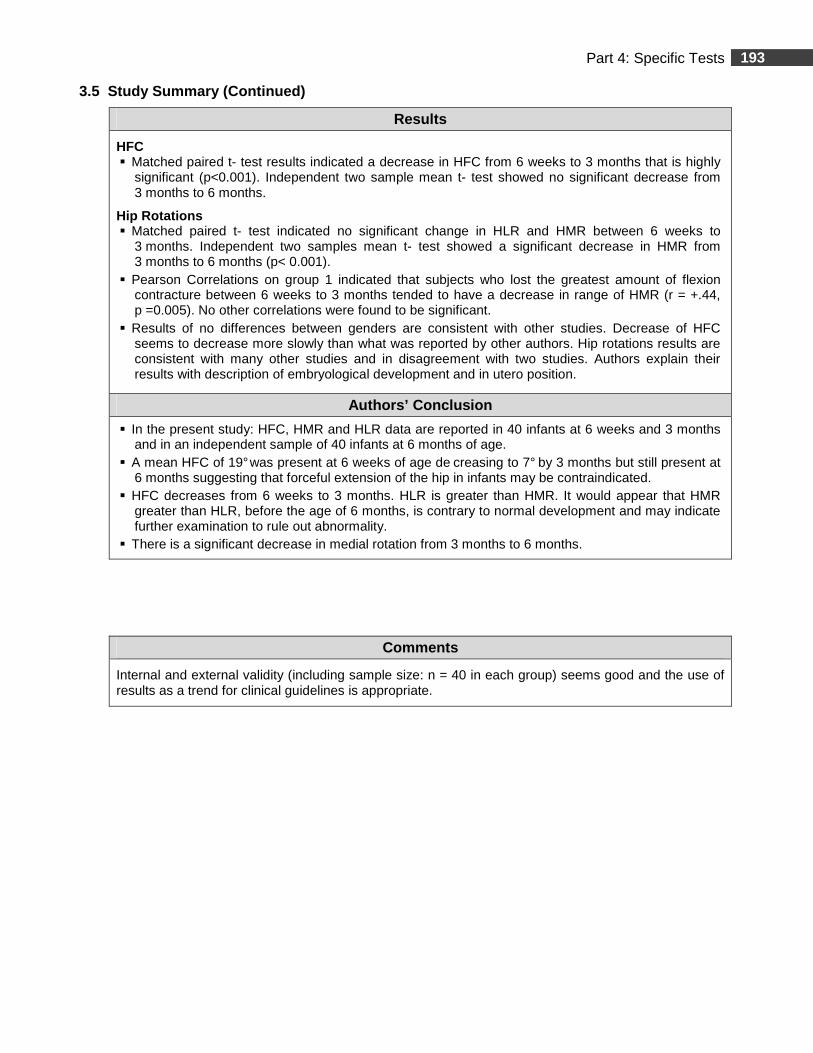
Results
HFC � Matched paired t- test results indicated a decrease in HFC from 6 weeks to 3 months that is highly
significant (p<0.001). Independent two sample mean t- test showed no significant decrease from 3 months to 6 months.
Hip Rotations � Matched paired t- test indicated no significant change in HLR and HMR between 6 weeks to
3 months. Independent two samples mean t- test showed a significant decrease in HMR from 3 months to 6 months (p< 0.001).
� Pearson Correlations on group 1 indicated that subjects who lost the greatest amount of flexion contracture between 6 weeks to 3 months tended to have a decrease in range of HMR (r = +.44, p =0.005). No other correlations were found to be significant.
� Results of no differences between genders are consistent with other studies. Decrease of HFC seems to decrease more slowly than what was reported by other authors. Hip rotations results are consistent with many other studies and in disagreement with two studies. Authors explain their results with description of embryological development and in utero position.
Authors’ Conclusion
� In the present study: HFC, HMR and HLR data are reported in 40 infants at 6 weeks and 3 months and in an independent sample of 40 infants at 6 months of age.
� A mean HFC of 19° was present at 6 weeks of age de creasing to 7° by 3 months but still present at 6 months suggesting that forceful extension of the hip in infants may be contraindicated.
� HFC decreases from 6 weeks to 3 months. HLR is greater than HMR. It would appear that HMR greater than HLR, before the age of 6 months, is contrary to normal development and may indicate further examination to rule out abnormality.
� There is a significant decrease in medial rotation from 3 months to 6 months.
Comments
Internal and external validity (including sample size: n = 40 in each group) seems good and the use of results as a trend for clinical guidelines is appropriate.

194 Part 4: Specific Tests
4. Hip Flexion Contracture in Children 5
Age range: 18 months to 19 years (male subjects). 4.1 Clinical Use
� To measure neonatal passive ROM of hip extension limitation and to document age-related changes.
� To screen infants who are at risk for neurological or musculoskeletal disorders.
4.2 Measurements
� Hip flexion contracture.
4.3 Testing Procedures
REQUIRED EQUIPMENT
� Standard goniometer.
� Examination table.
� Hypoallergenic skin cosmetic crayon to mark anatomical landmarks.
PRE-TEST
� Mark the traditional anatomical landmarks:
� The femoral greater trochanter;
� The lateral epicondyle of the femur.
TEST
� Method: American Academy of Orthopaedic Surgeons method which refers to the neutral zero procedure. 51
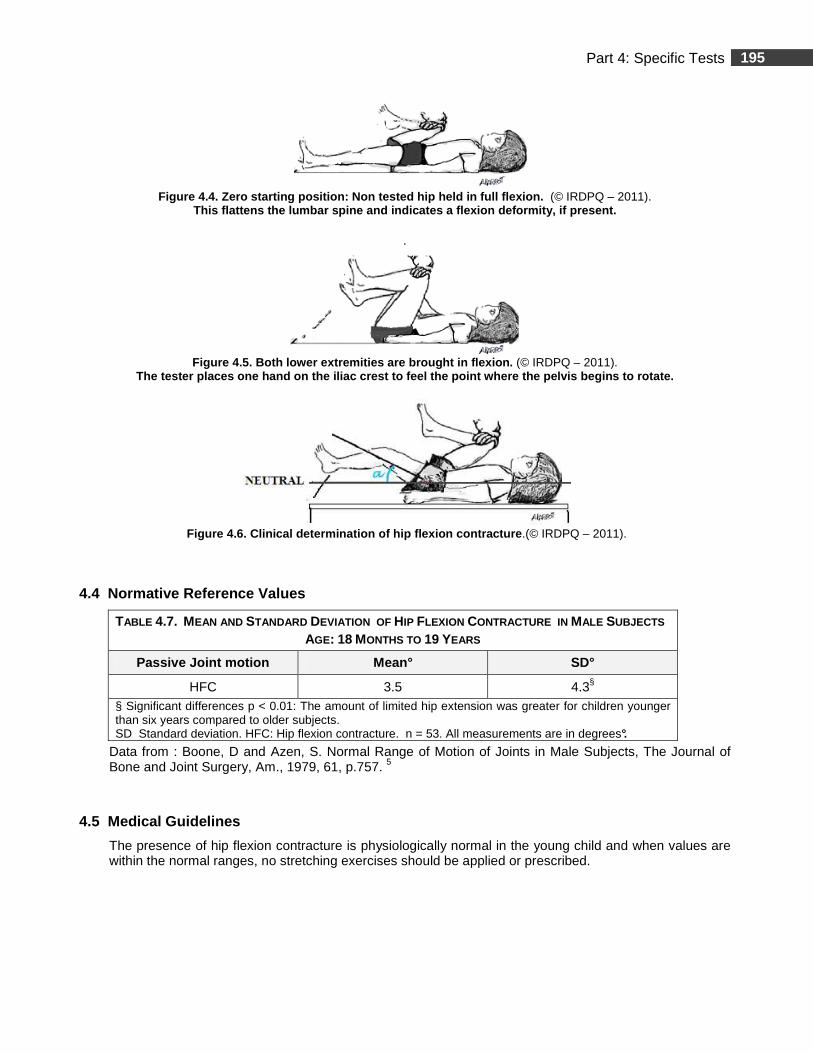
� Zero starting position in supine (Fig. 4.4).
� Both lower extremities are brought in flexion (Fig. 4.5).
� The tested hip is allowed to drop in extension. The angle formed by the leg aligned with the surface on which the infant is lying is recorded (Fig. 4.6).
� Results are compared to the normative reference values in Table 4.7.
195 Part 4: Specific Tests
Figure 4.4. Zero starting position: Non tested hip held in full flexion. (© IRDPQ – 2011).
This flattens the lumbar spine and indicates a flex ion deformity, if present. .
Figure 4.5. Both lower extremities are brought in f lexion. (© IRDPQ – 2011).
The tester places one hand on the iliac crest to fe el the point where the pelvis begins to rotate.
Figure 4.6. Clinical determination of hip flexion c ontracture .(© IRDPQ – 2011).
4.4 Normative Reference Values
TABLE 4.7. MEAN AND STANDARD DEVIATION OF HIP FLEXION CONTRACTURE IN MALE SUBJECTS AGE: 18 MONTHS TO 19 YEARS
Passive Joint motion Mean° SD°
HFC 3.5 4.3§ § Significant differences p < 0.01: The amount of limited hip extension was greater for children younger than six years compared to older subjects. SD Standard deviation. HFC: Hip flexion contracture. n = 53. All measurements are in degrees°.
Data from : Boone, D and Azen, S. Normal Range of Motion of Joints in Male Subjects, The Journal of Bone and Joint Surgery, Am., 1979, 61, p.757. 5
4.5 Medical Guidelines
The presence of hip flexion contracture is physiologically normal in the young child and when values are within the normal ranges, no stretching exercises should be applied or prescribed.
196 Part 4: Specific Tests
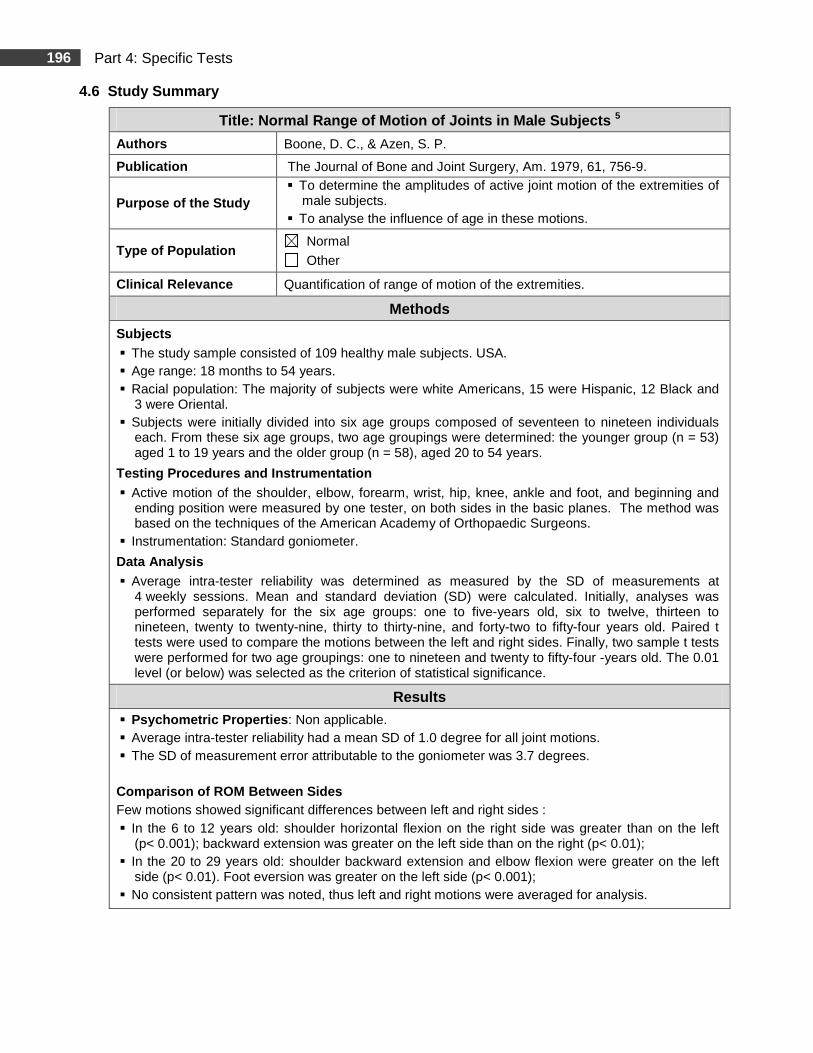
4.6 Study Summary
Title: Normal Range of Motion of Joints in Male Sub jects 5
Authors Boone, D. C., & Azen, S. P.
Publication The Journal of Bone and Joint Surgery, Am. 1979, 61, 756-9.
Purpose of the Study � To determine the amplitudes of active joint motion of the extremities of
male subjects. � To analyse the influence of age in these motions.
Type of Population Normal
Other
Clinical Relevance Quantification of range of motion of the extremities.
Methods
Subjects � The study sample consisted of 109 healthy male subjects. USA. � Age range: 18 months to 54 years. � Racial population: The majority of subjects were white Americans, 15 were Hispanic, 12 Black and
3 were Oriental. � Subjects were initially divided into six age groups composed of seventeen to nineteen individuals
each. From these six age groups, two age groupings were determined: the younger group (n = 53) aged 1 to 19 years and the older group (n = 58), aged 20 to 54 years.
Testing Procedures and Instrumentation � Active motion of the shoulder, elbow, forearm, wrist, hip, knee, ankle and foot, and beginning and
ending position were measured by one tester, on both sides in the basic planes. The method was based on the techniques of the American Academy of Orthopaedic Surgeons.
� Instrumentation: Standard goniometer.
Data Analysis
� Average intra-tester reliability was determined as measured by the SD of measurements at 4 weekly sessions. Mean and standard deviation (SD) were calculated. Initially, analyses was performed separately for the six age groups: one to five-years old, six to twelve, thirteen to nineteen, twenty to twenty-nine, thirty to thirty-nine, and forty-two to fifty-four years old. Paired t tests were used to compare the motions between the left and right sides. Finally, two sample t tests were performed for two age groupings: one to nineteen and twenty to fifty-four -years old. The 0.01 level (or below) was selected as the criterion of statistical significance.
Results
� Psychometric Properties : Non applicable. � Average intra-tester reliability had a mean SD of 1.0 degree for all joint motions. � The SD of measurement error attributable to the goniometer was 3.7 degrees. Comparison of ROM Between Sides Few motions showed significant differences between left and right sides : � In the 6 to 12 years old: shoulder horizontal flexion on the right side was greater than on the left
(p< 0.001); backward extension was greater on the left side than on the right (p< 0.01); � In the 20 to 29 years old: shoulder backward extension and elbow flexion were greater on the left
side (p< 0.01). Foot eversion was greater on the left side (p< 0.001); � No consistent pattern was noted, thus left and right motions were averaged for analysis.
197 Part 4: Specific Tests
4.6 Study Summary (Continued)
Results
Differences Between ROM and Age
Since the study is based on cross-sectional data from groups of subjects of various ages, the authors report that they can only infer that differences in motions between children and adults are related to age. Analyses of variance revealed significant differences between the two age groups for most motions (p< 0.01): � Shoulder joint motion: the greatest difference was backward extension and outward rotation; � Elbow joint motion: hyperextension was possible for younger subjects and gradually decreased with
age. ROM in elbow flexion and supination was less in the older age group; � The inability to assume a zero starting position of knee flexion (complete extension) was present in
the younger subjects; � The inability to assume a zero starting position of hip flexion (complete extension) was present in
the younger subjects and evident in some of the adults; � The amplitudes of most hip motions are markedly different between the younger and the older
groups; � The findings are consistent with other studies.
Authors’ Conclusion
� The amplitudes of motion of the left and right joints were consistently similar, therefore the healthy limb can be routinely used for means of comparison.
� Normal limits for ROM of the extremities were calculated in two age groups for male subjects and will be helpful when a bilateral deficit is present or suspected.
Comments
� Internal and external validity seems good and the use of results as a trend for clinical guidelines is appropriate. However, the number of subjects per age-groups is small (n = 17 to 19 ) and data should be interpreted with caution.
� Generalization of the results for female subjects may be challenged. � There is a paucity of research concerning the normal ROM in the pediatric population. To the best
of our knowledge, the present study is the only one that reports normative values for mostly all active motions in all joints for the pediatric population. However, the age range for the pediatric population is wide (1 to 19 years) making the data maybe less discriminant for the very young individuals.
198 Part 4: Specific Tests
Knee Flexion Contracture
Summary
Measurement of the knee joint motion is used clinically to assess joint disability or various medical conditions (neuromuscular diseases, postural abnormalities…) 24, 44 and, to assess if there is joint motion limitation, the comparison between sides is usually appropriate. 49 Limitation of knee extension is physiologically normal in infants and children. 44 32 This limitation is greater in newborns with increased gestational age, the greatest limitation being noted in the full-term neonates. 32 In children without disabilities, it is observed that the range of motion gradually increases during the first six months. 24 As mentioned previously, the term “contracture” usually refers to a pathological condition, which is not the case in children 9 when limitation of knee extension is within the normal limits. Since the term “contracture” is often used in the literature to describe knee flexion contracture (KFC), the same term will be used throughout this chapter for purposes of consistency. KFC angle is usually measured by calculating the amount of knee extension limitation, with the hip extended. Compared to other measurements in children (unimpaired and mild spastic diplegia), knee extension measurement was reported as presenting the most reliable inter-sessional measures (along with the Thomas test) in both populations and mostly when limitation was present in small degrees. 24 Three studies were selected to document KFC in:
� Newborns - Waugh et al.-1983; 44
� Newborns and Infants - Reade et al.-1984; 32
� Children - Boone et al. -1979. 5
The first two studies 44, 32 use the same testing position but differ slightly in the alignment of the goniometer. The population sample is larger in the former study (n = 40) 44 compared to the latter (n = 10) 32 in each age group. Testing procedures and sample size may explain the difference in the data when comparing the normative reference values.
199 Part 4: Specific Tests
5. Knee Flexion Contracture in the Newborn 44
Age range: 6 to 65 hours. 5.1 Clinical Use
� To measure neonatal passive ROM of knee extension limitation.
� To screen infants who are at risk for neurological or musculoskeletal disorders.
5.2 Measurements
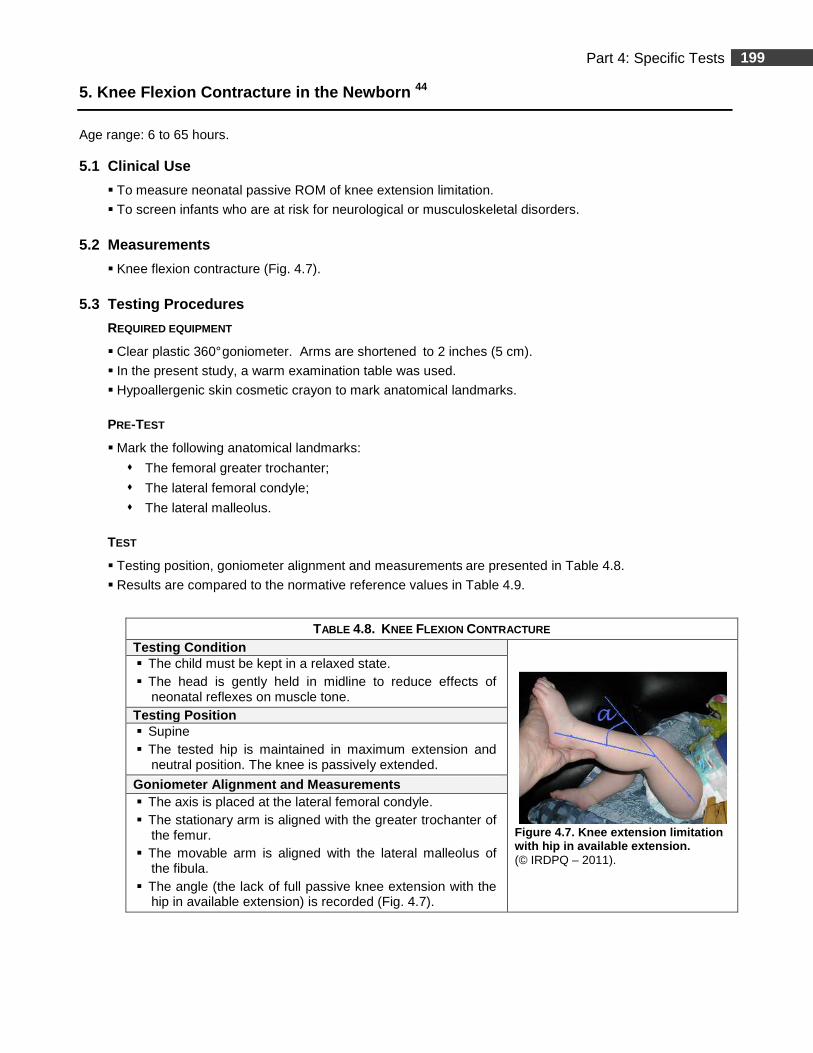
� Knee flexion contracture (Fig. 4.7).
5.3 Testing Procedures
REQUIRED EQUIPMENT
� Clear plastic 360° goniometer. Arms are shortened to 2 inches (5 cm).
� In the present study, a warm examination table was used.
� Hypoallergenic skin cosmetic crayon to mark anatomical landmarks.
PRE-TEST
� Mark the following anatomical landmarks:
� The femoral greater trochanter;
� The lateral femoral condyle;
� The lateral malleolus.
TEST
� Testing position, goniometer alignment and measurements are presented in Table 4.8.
� Results are compared to the normative reference values in Table 4.9.
TABLE 4.8. KNEE FLEXION CONTRACTURE Testing Condition
Figure 4.7. Knee extension limitation with hip in available extension. (© IRDPQ – 2011).
� The child must be kept in a relaxed state. � The head is gently held in midline to reduce effects of
neonatal reflexes on muscle tone. Testing Position � Supine � The tested hip is maintained in maximum extension and
neutral position. The knee is passively extended.
Goniometer Alignment and Measurements � The axis is placed at the lateral femoral condyle. � The stationary arm is aligned with the greater trochanter of
the femur. � The movable arm is aligned with the lateral malleolus of
the fibula. � The angle (the lack of full passive knee extension with the
hip in available extension) is recorded (Fig. 4.7).
200 Part 4: Specific Tests
5.4 Normative Reference Values
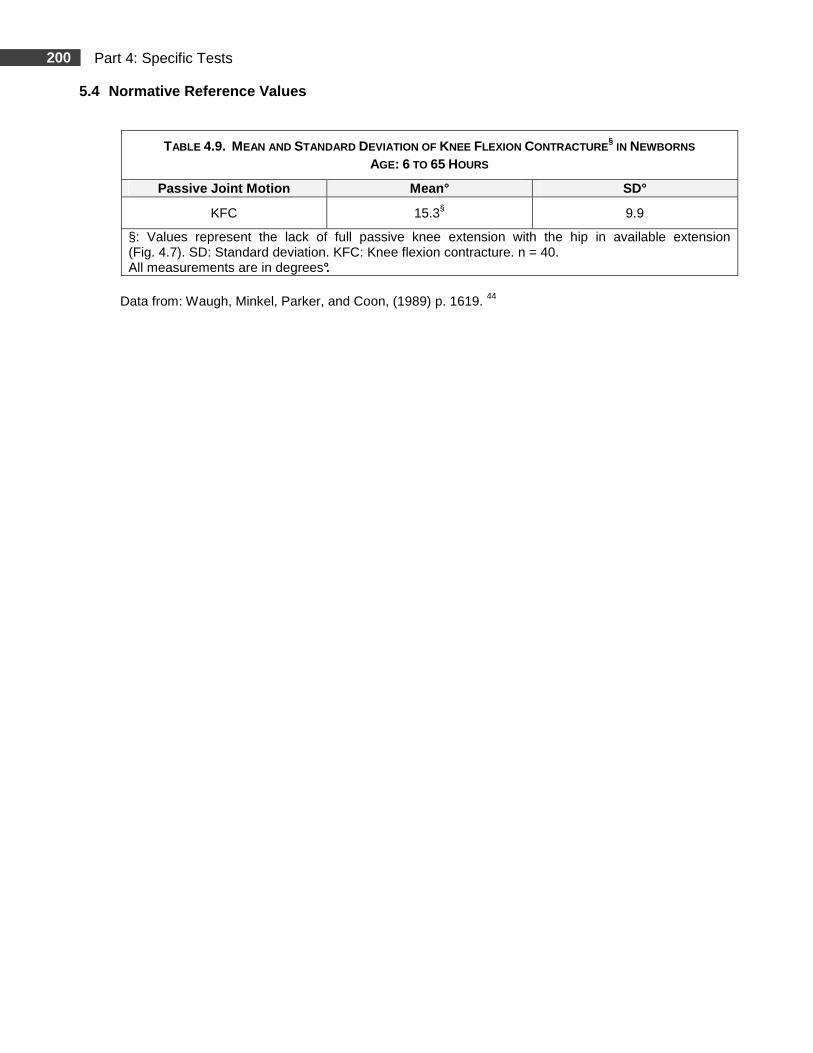
Data from: Waugh, Minkel, Parker, and Coon, (1989) p. 1619. 44
TABLE 4.9. MEAN AND STANDARD DEVIATION OF KNEE FLEXION CONTRACTURE§ IN NEWBORNS
AGE: 6 TO 65 HOURS
Passive Joint Motion Mean° SD°
KFC 15.3§ 9.9
§: Values represent the lack of full passive knee extension with the hip in available extension (Fig. 4.7). SD: Standard deviation. KFC: Knee flexion contracture. n = 40. All measurements are in degrees°.
201 Part 4: Specific Tests
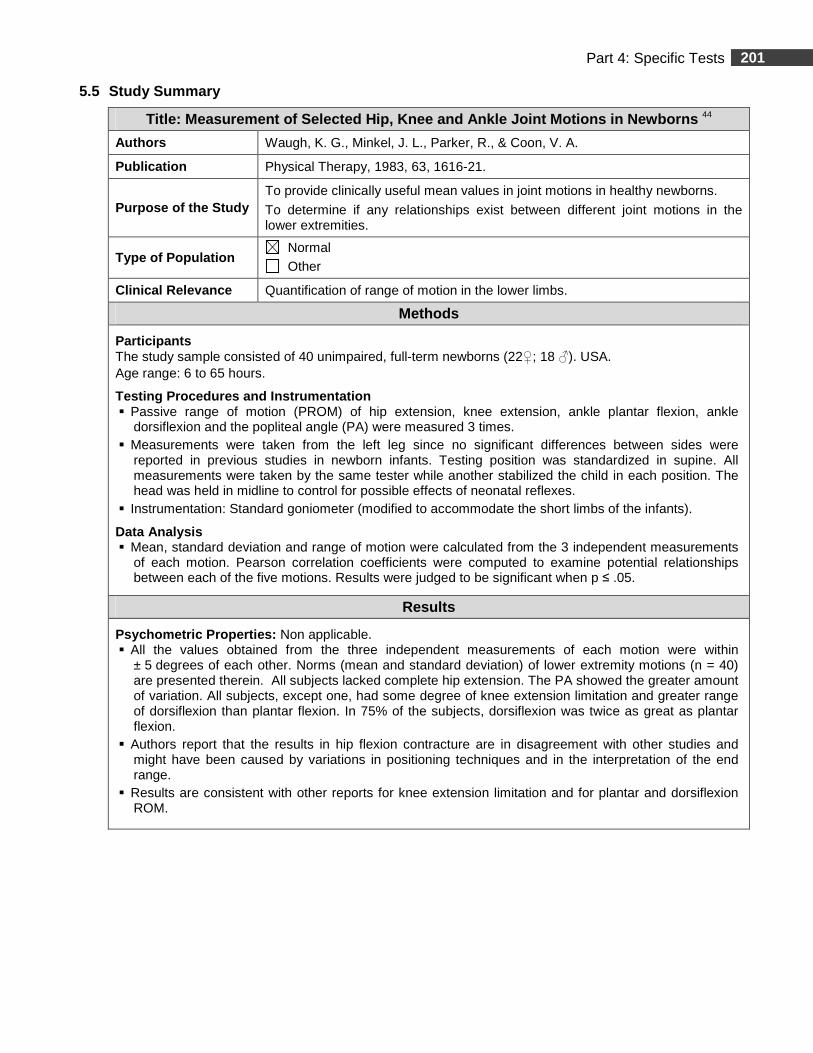
5.5 Study Summary
Title: Measurement of Selected Hip, Knee and Ankle Joint Motions in Newborns 44
Authors Waugh, K. G., Minkel, J. L., Parker, R., & Coon, V. A.
Publication Physical Therapy, 1983, 63, 1616-21.
Purpose of the Study To provide clinically useful mean values in joint motions in healthy newborns.
To determine if any relationships exist between different joint motions in the lower extremities.
Type of Population Normal Other
Clinical Relevance Quantification of range of motion in the lower limbs.
Methods
Participants The study sample consisted of 40 unimpaired, full-term newborns (22♀; 18 ♂). USA. Age range: 6 to 65 hours.
Testing Procedures and Instrumentation � Passive range of motion (PROM) of hip extension, knee extension, ankle plantar flexion, ankle
dorsiflexion and the popliteal angle (PA) were measured 3 times. � Measurements were taken from the left leg since no significant differences between sides were
reported in previous studies in newborn infants. Testing position was standardized in supine. All measurements were taken by the same tester while another stabilized the child in each position. The head was held in midline to control for possible effects of neonatal reflexes.
� Instrumentation: Standard goniometer (modified to accommodate the short limbs of the infants).
Data Analysis � Mean, standard deviation and range of motion were calculated from the 3 independent measurements
of each motion. Pearson correlation coefficients were computed to examine potential relationships between each of the five motions. Results were judged to be significant when p ≤ .05.
Results
Psychometric Properties: Non applicable. � All the values obtained from the three independent measurements of each motion were within
± 5 degrees of each other. Norms (mean and standard deviation) of lower extremity motions (n = 40) are presented therein. All subjects lacked complete hip extension. The PA showed the greater amount of variation. All subjects, except one, had some degree of knee extension limitation and greater range of dorsiflexion than plantar flexion. In 75% of the subjects, dorsiflexion was twice as great as plantar flexion.
� Authors report that the results in hip flexion contracture are in disagreement with other studies and might have been caused by variations in positioning techniques and in the interpretation of the end range.
� Results are consistent with other reports for knee extension limitation and for plantar and dorsiflexion ROM.
202 Part 4: Specific Tests
5.5 Study Summary (Continued)
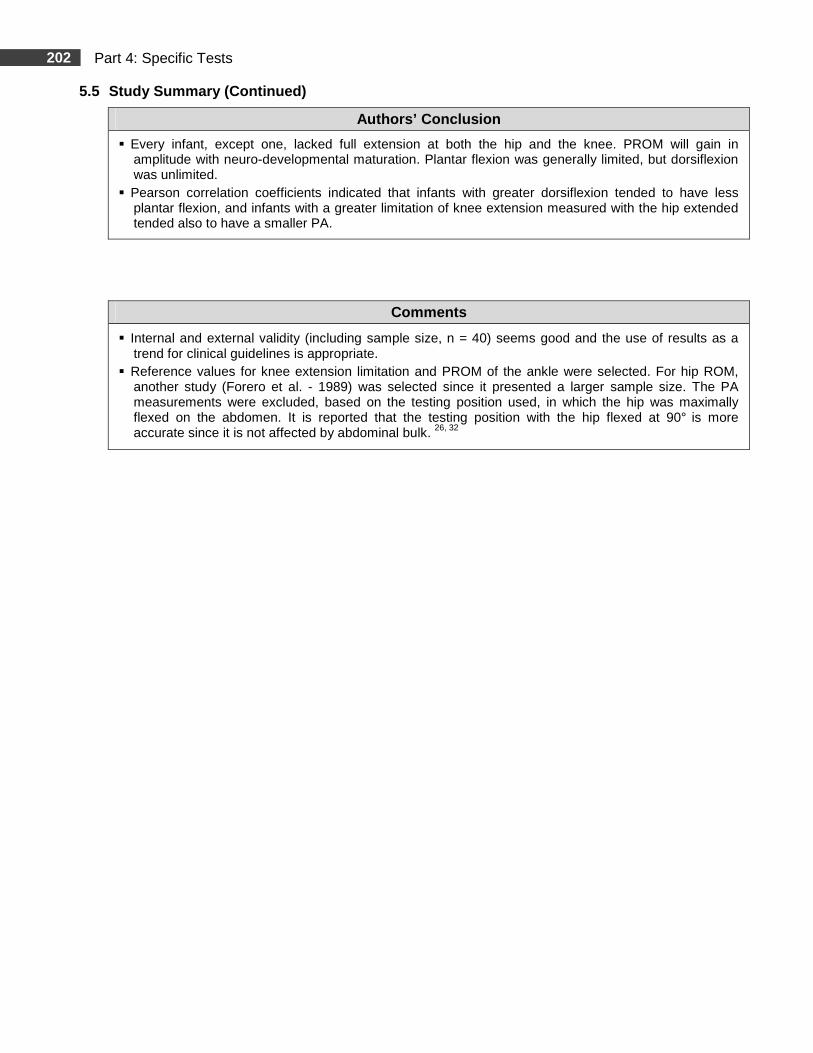
Authors’ Conclusion
� Every infant, except one, lacked full extension at both the hip and the knee. PROM will gain in amplitude with neuro-developmental maturation. Plantar flexion was generally limited, but dorsiflexion was unlimited.
� Pearson correlation coefficients indicated that infants with greater dorsiflexion tended to have less plantar flexion, and infants with a greater limitation of knee extension measured with the hip extended tended also to have a smaller PA.
Comments
� Internal and external validity (including sample size, n = 40) seems good and the use of results as a trend for clinical guidelines is appropriate.
� Reference values for knee extension limitation and PROM of the ankle were selected. For hip ROM, another study (Forero et al. - 1989) was selected since it presented a larger sample size. The PA measurements were excluded, based on the testing position used, in which the hip was maximally flexed on the abdomen. It is reported that the testing position with the hip flexed at 90° is more accurate since it is not affected by abdominal bulk. 26, 32
203 Part 4: Specific Tests
6. Knee Flexion Contracture in Newborns and Infants 32
Age range: Newborns (1-2 or 3 days after birth) and from 1 to 12 months. 6.1 Clinical Use
� To measure infants’ passive ROM of knee extension limitation annd document age-related changes.
� To screen infants who are at risk for neurological or musculoskeletal disorders.
6.2 Measurements
In the present study, the amount of knee extension limitation with the hip extended is defined as the ‘’Heke ( Hip extension, knee extension) angle’’ and indicates capsular joint restrictions. 32
6.3 Testing Procedures
REQUIRED EQUIPMENT
� Standard 360° goniometer.
� Hypoallergenic skin cosmetic crayon to mark anatomical landmarks.
PRE-TEST
� Mark the following anatomical landmarks:
� The femoral greater trochanter;
� The lateral side of the knee joint;
� The lateral malleolus of the fibula.
TEST
� Testing position, goniometer alignment and measurements are presented in Table 4.10.
� Results are compared to the mean values in Table 4.11 for the HEKE angle.
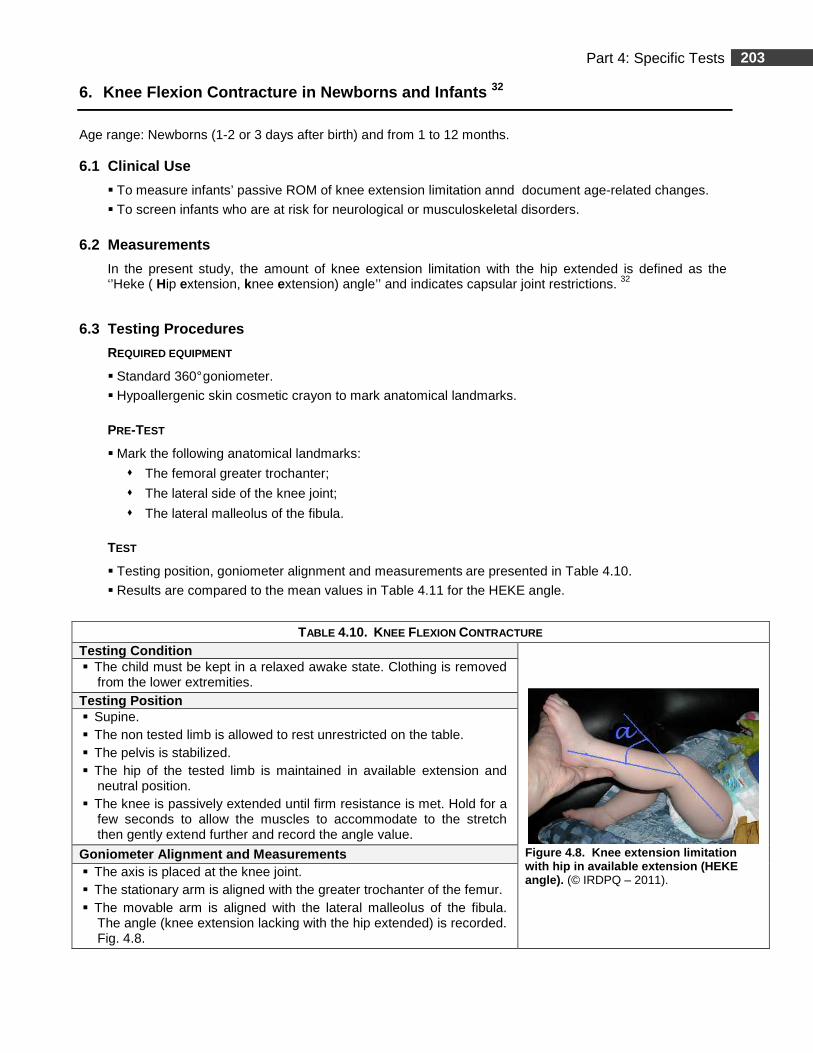
TABLE 4.10. KNEE FLEXION CONTRACTURE Testing Condition
Figure 4.8. Knee extension limitation with hip in available extension (HEKE angle). (© IRDPQ – 2011).
� The child must be kept in a relaxed awake state. Clothing is removed from the lower extremities.
Testing Position � Supine. � The non tested limb is allowed to rest unrestricted on the table. � The pelvis is stabilized. � The hip of the tested limb is maintained in available extension and
neutral position. � The knee is passively extended until firm resistance is met. Hold for a
few seconds to allow the muscles to accommodate to the stretch then gently extend further and record the angle value.
Goniometer Alignment and Measurements � The axis is placed at the knee joint. � The stationary arm is aligned with the greater trochanter of the femur. � The movable arm is aligned with the lateral malleolus of the fibula.
The angle (knee extension lacking with the hip extended) is recorded. Fig. 4.8.
204 Part 4: Specific Tests
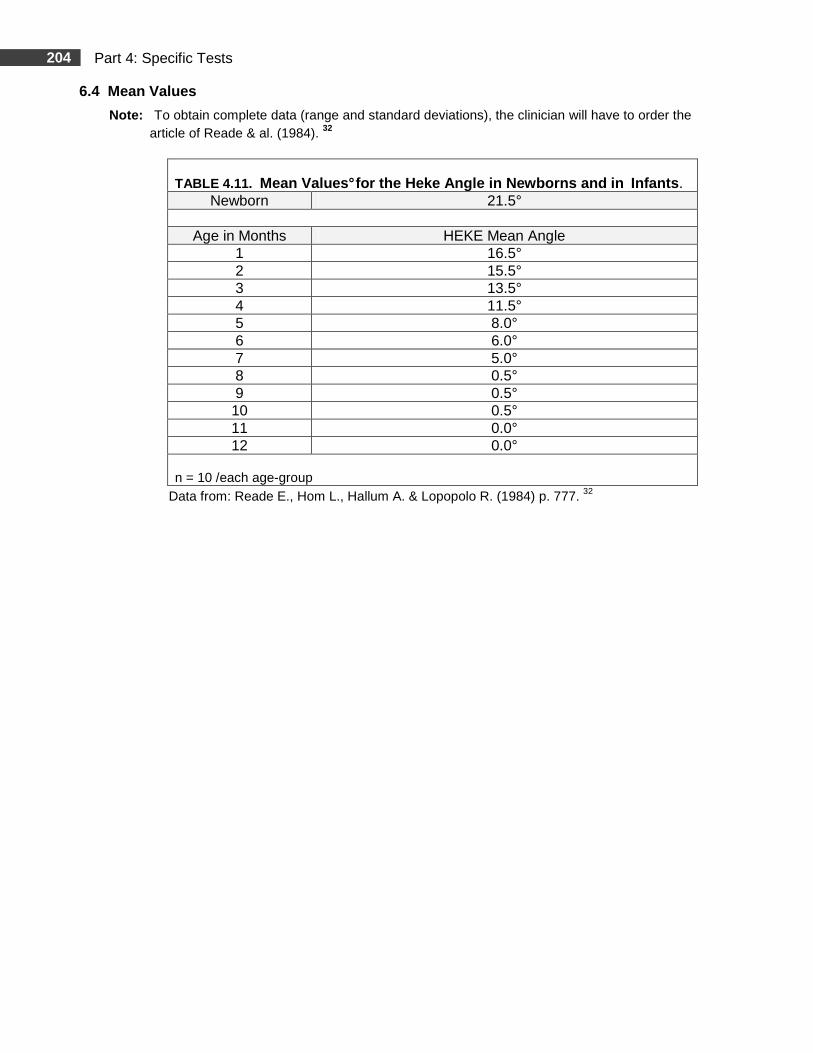
6.4 Mean Values
Note: To obtain complete data (range and standard deviations), the clinician will have to order the article of Reade & al. (1984). 32
TABLE 4.11. Mean Values° for the Heke Angle in Newborns and in Infants .
Newborn 21.5°
Age in Months HEKE Mean Angle 1 16.5° 2 15.5° 3 13.5° 4 11.5° 5 8.0° 6 6.0° 7 5.0° 8 0.5° 9 0.5° 10 0.5° 11 0.0° 12 0.0°
n = 10 /each age-group
Data from: Reade E., Hom L., Hallum A. & Lopopolo R. (1984) p. 777. 32
205 Part 4: Specific Tests
6.5 Study Summary
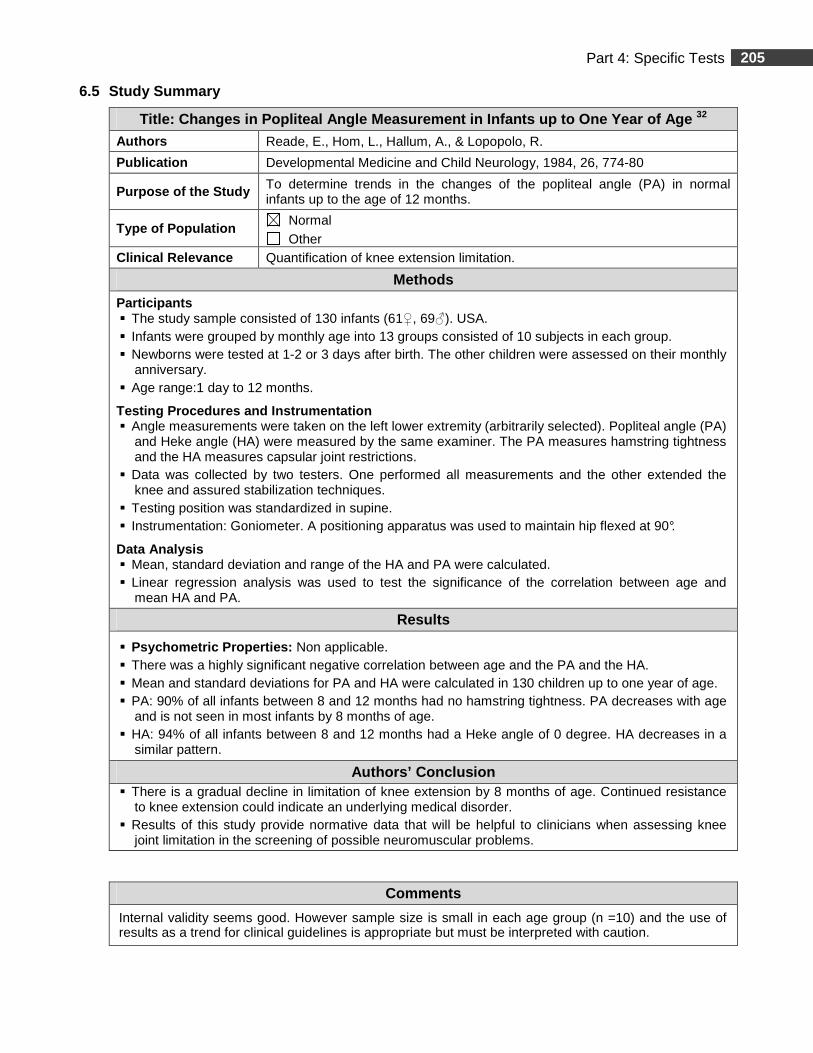
Title: Changes in Popliteal Angle Measurement in In fants up to One Year of Age 32
Authors Reade, E., Hom, L., Hallum, A., & Lopopolo, R.
Publication Developmental Medicine and Child Neurology, 1984, 26, 774-80
Purpose of the Study To determine trends in the changes of the popliteal angle (PA) in normal infants up to the age of 12 months.
Type of Population Normal Other
Clinical Relevance Quantification of knee extension limitation.
Methods
Participants � The study sample consisted of 130 infants (61♀, 69♂). USA. � Infants were grouped by monthly age into 13 groups consisted of 10 subjects in each group. � Newborns were tested at 1-2 or 3 days after birth. The other children were assessed on their monthly
anniversary. � Age range:1 day to 12 months.
Testing Procedures and Instrumentation � Angle measurements were taken on the left lower extremity (arbitrarily selected). Popliteal angle (PA)
and Heke angle (HA) were measured by the same examiner. The PA measures hamstring tightness and the HA measures capsular joint restrictions.
� Data was collected by two testers. One performed all measurements and the other extended the knee and assured stabilization techniques.
� Testing position was standardized in supine. � Instrumentation: Goniometer. A positioning apparatus was used to maintain hip flexed at 90°.
Data Analysis � Mean, standard deviation and range of the HA and PA were calculated. � Linear regression analysis was used to test the significance of the correlation between age and
mean HA and PA.
Results
� Psychometric Properties: Non applicable. � There was a highly significant negative correlation between age and the PA and the HA. � Mean and standard deviations for PA and HA were calculated in 130 children up to one year of age. � PA: 90% of all infants between 8 and 12 months had no hamstring tightness. PA decreases with age
and is not seen in most infants by 8 months of age. � HA: 94% of all infants between 8 and 12 months had a Heke angle of 0 degree. HA decreases in a
similar pattern.
Authors’ Conclusion � There is a gradual decline in limitation of knee extension by 8 months of age. Continued resistance
to knee extension could indicate an underlying medical disorder. � Results of this study provide normative data that will be helpful to clinicians when assessing knee
joint limitation in the screening of possible neuromuscular problems.
Comments
Internal validity seems good. However sample size is small in each age group (n =10) and the use of results as a trend for clinical guidelines is appropriate but must be interpreted with caution.
206 Part 4: Specific Tests
7. Knee Flexion Contracture in Children 5
Age range: 18 months to 19 years (male subjects). 7.1 Clinical Use
� To measure infants’ passive ROM of knee extension limitation.
� To screen infants who are at risk for neurological or musculoskeletal disorders.
7.2 Measurements
� Knee flexion contracture.
7.3 Testing Procedures
REQUIRED EQUIPMENT
� Standard goniometer.
� Examination table.
� Hypoallergenic skin cosmetic crayon to mark anatomical landmarks.
PRE-TEST
� Mark the following traditional anatomical landmarks:
� The femoral greater trochanter;
� The knee joint;
� The lateral malleolus of the fibula.
TEST
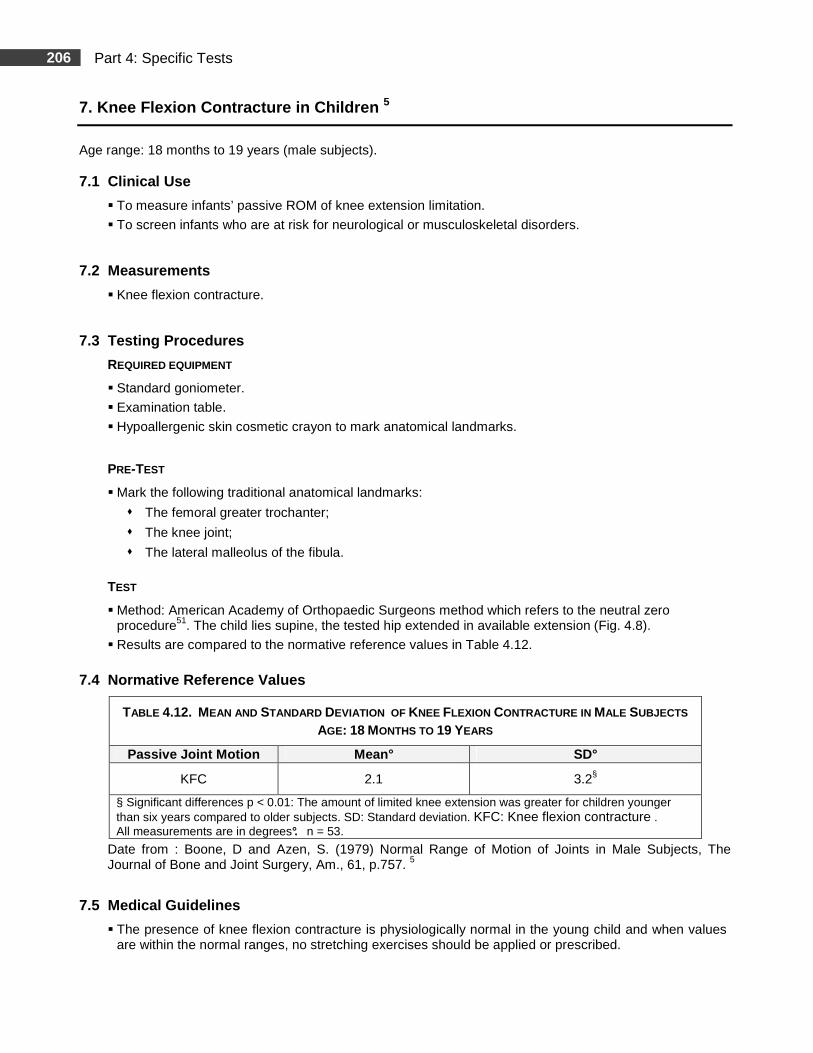
� Method: American Academy of Orthopaedic Surgeons method which refers to the neutral zero procedure51. The child lies supine, the tested hip extended in available extension (Fig. 4.8).
� Results are compared to the normative reference values in Table 4.12.
7.4 Normative Reference Values
TABLE 4.12. MEAN AND STANDARD DEVIATION OF KNEE FLEXION CONTRACTURE IN MALE SUBJECTS AGE: 18 MONTHS TO 19 YEARS
Passive Joint Motion Mean° SD°
KFC 2.1 3.2§
§ Significant differences p < 0.01: The amount of limited knee extension was greater for children younger than six years compared to older subjects. SD: Standard deviation. KFC: Knee flexion contracture . All measurements are in degrees°. n = 53.
Date from : Boone, D and Azen, S. (1979) Normal Range of Motion of Joints in Male Subjects, The Journal of Bone and Joint Surgery, Am., 61, p.757. 5
7.5 Medical Guidelines
� The presence of knee flexion contracture is physiologically normal in the young child and when values are within the normal ranges, no stretching exercises should be applied or prescribed.
207 Part 4: Specific Tests
7.6 Study Summary
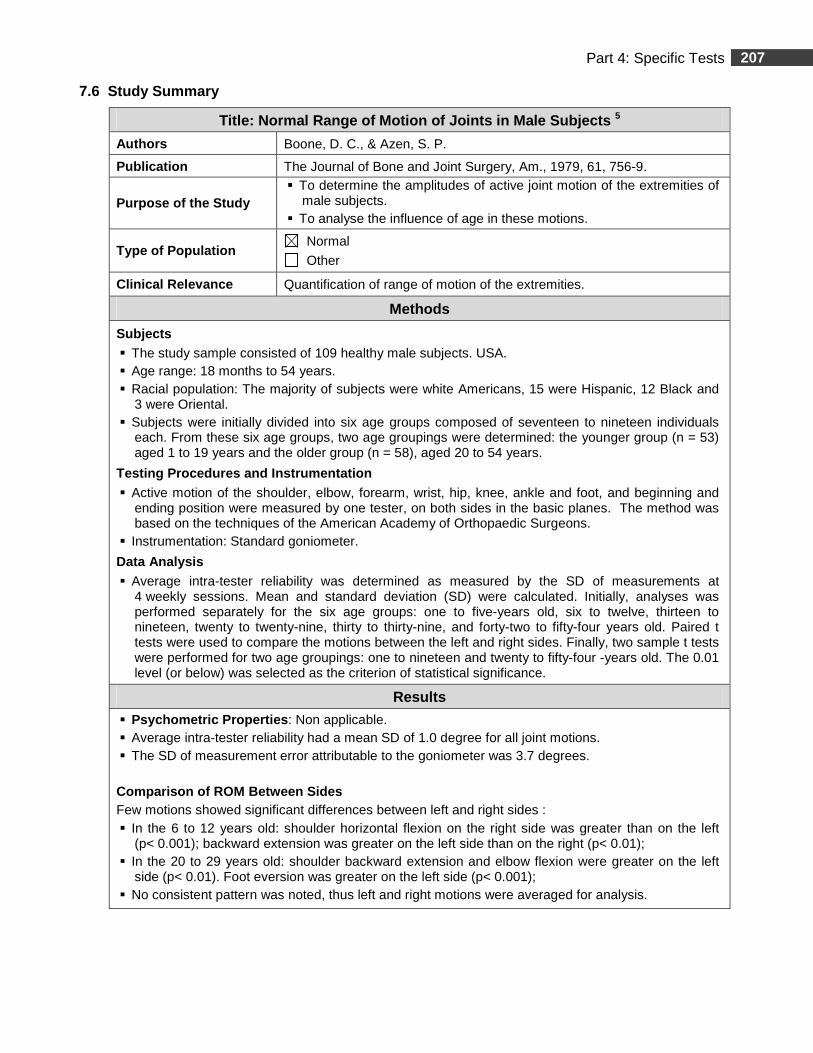
Title: Normal Range of Motion of Joints in Male Sub jects 5
Authors Boone, D. C., & Azen, S. P.
Publication The Journal of Bone and Joint Surgery, Am., 1979, 61, 756-9.
Purpose of the Study � To determine the amplitudes of active joint motion of the extremities of
male subjects. � To analyse the influence of age in these motions.
Type of Population Normal
Other
Clinical Relevance Quantification of range of motion of the extremities.
Methods
Subjects � The study sample consisted of 109 healthy male subjects. USA. � Age range: 18 months to 54 years. � Racial population: The majority of subjects were white Americans, 15 were Hispanic, 12 Black and
3 were Oriental. � Subjects were initially divided into six age groups composed of seventeen to nineteen individuals
each. From these six age groups, two age groupings were determined: the younger group (n = 53) aged 1 to 19 years and the older group (n = 58), aged 20 to 54 years.
Testing Procedures and Instrumentation � Active motion of the shoulder, elbow, forearm, wrist, hip, knee, ankle and foot, and beginning and
ending position were measured by one tester, on both sides in the basic planes. The method was based on the techniques of the American Academy of Orthopaedic Surgeons.
� Instrumentation: Standard goniometer.
Data Analysis
� Average intra-tester reliability was determined as measured by the SD of measurements at 4 weekly sessions. Mean and standard deviation (SD) were calculated. Initially, analyses was performed separately for the six age groups: one to five-years old, six to twelve, thirteen to nineteen, twenty to twenty-nine, thirty to thirty-nine, and forty-two to fifty-four years old. Paired t tests were used to compare the motions between the left and right sides. Finally, two sample t tests were performed for two age groupings: one to nineteen and twenty to fifty-four -years old. The 0.01 level (or below) was selected as the criterion of statistical significance.
Results
� Psychometric Properties : Non applicable. � Average intra-tester reliability had a mean SD of 1.0 degree for all joint motions. � The SD of measurement error attributable to the goniometer was 3.7 degrees. Comparison of ROM Between Sides Few motions showed significant differences between left and right sides : � In the 6 to 12 years old: shoulder horizontal flexion on the right side was greater than on the left
(p< 0.001); backward extension was greater on the left side than on the right (p< 0.01); � In the 20 to 29 years old: shoulder backward extension and elbow flexion were greater on the left
side (p< 0.01). Foot eversion was greater on the left side (p< 0.001); � No consistent pattern was noted, thus left and right motions were averaged for analysis.
208 Part 4: Specific Tests
7.6 Study Summary (Continued)
Results (Continued)
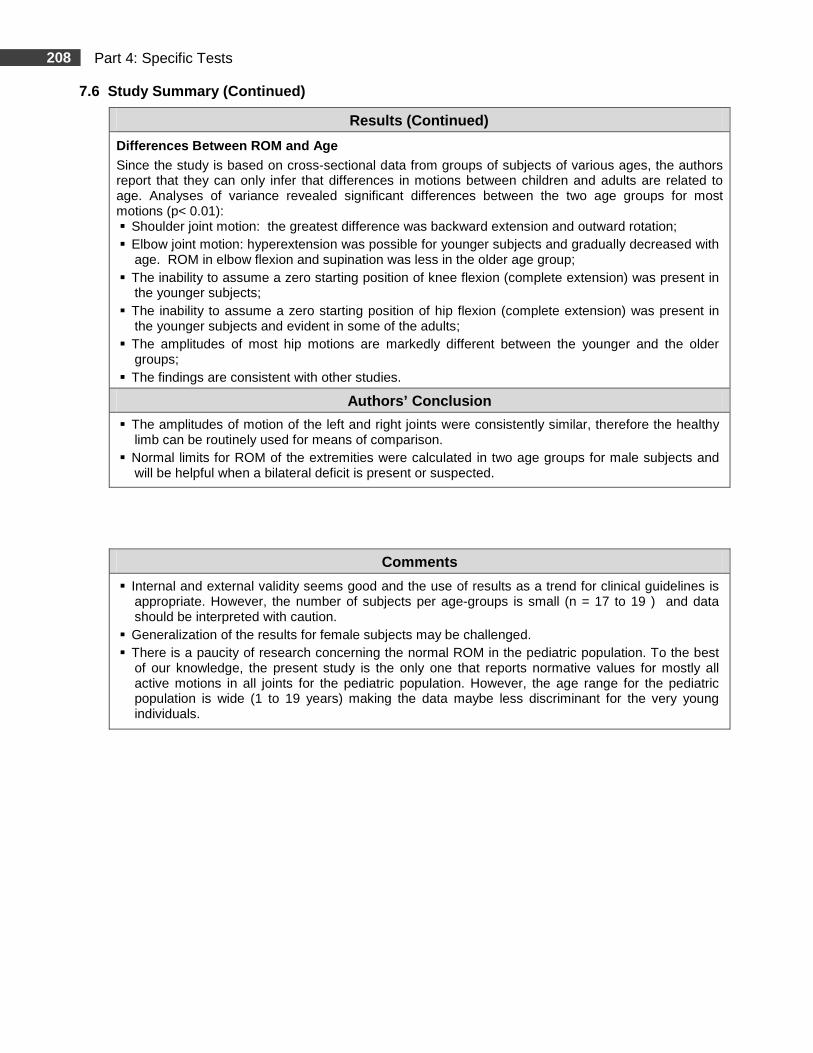
Differences Between ROM and Age
Since the study is based on cross-sectional data from groups of subjects of various ages, the authors report that they can only infer that differences in motions between children and adults are related to age. Analyses of variance revealed significant differences between the two age groups for most motions (p< 0.01): � Shoulder joint motion: the greatest difference was backward extension and outward rotation; � Elbow joint motion: hyperextension was possible for younger subjects and gradually decreased with
age. ROM in elbow flexion and supination was less in the older age group; � The inability to assume a zero starting position of knee flexion (complete extension) was present in
the younger subjects; � The inability to assume a zero starting position of hip flexion (complete extension) was present in
the younger subjects and evident in some of the adults; � The amplitudes of most hip motions are markedly different between the younger and the older
groups; � The findings are consistent with other studies.
Authors’ Conclusion
� The amplitudes of motion of the left and right joints were consistently similar, therefore the healthy limb can be routinely used for means of comparison.
� Normal limits for ROM of the extremities were calculated in two age groups for male subjects and will be helpful when a bilateral deficit is present or suspected.
Comments
� Internal and external validity seems good and the use of results as a trend for clinical guidelines is appropriate. However, the number of subjects per age-groups is small (n = 17 to 19 ) and data should be interpreted with caution.
� Generalization of the results for female subjects may be challenged. � There is a paucity of research concerning the normal ROM in the pediatric population. To the best
of our knowledge, the present study is the only one that reports normative values for mostly all active motions in all joints for the pediatric population. However, the age range for the pediatric population is wide (1 to 19 years) making the data maybe less discriminant for the very young individuals.
209 Part 4: Specific Tests
Hamstring Tightness Assessment
Summary
Different tests are clinically used to assess hamstring tightness in children: The popliteal angle (PA), the popliteal complementary angle (PCA) and the straight leg raise (SLR) test. THE POPLITEAL ANGLE AND THE POPLITEAL COMPLEMENTARY ANGLE Both measurements are clinical indicators of gestational maturity in the neonatal period 23, 26 and are considered to be a red flag for neuromuscular implications in the presence of excessive tightness. 26,32
Clinically, the PA is among one of the most popular methods for assessing hamstring tightness in children. 23, 26, 32
RELIABILITY
Reliability scores differ between studies. A summary of selected studies is presented in the ‘’up to date’’ section at the end of the references’ pages. Difficulties can arise when consulting data in the literature since the definition of the PA differs between studies. The meaning of the terms used in this chapter is presented in Table 4.13. Knowledge of these differences is important when the results are compared to the normative values.
TABLE 4.13. DEFINITION OF THE POPLITEAL ANGLE AND THE POPLITEAL COMPLEMENTARY ANGLE
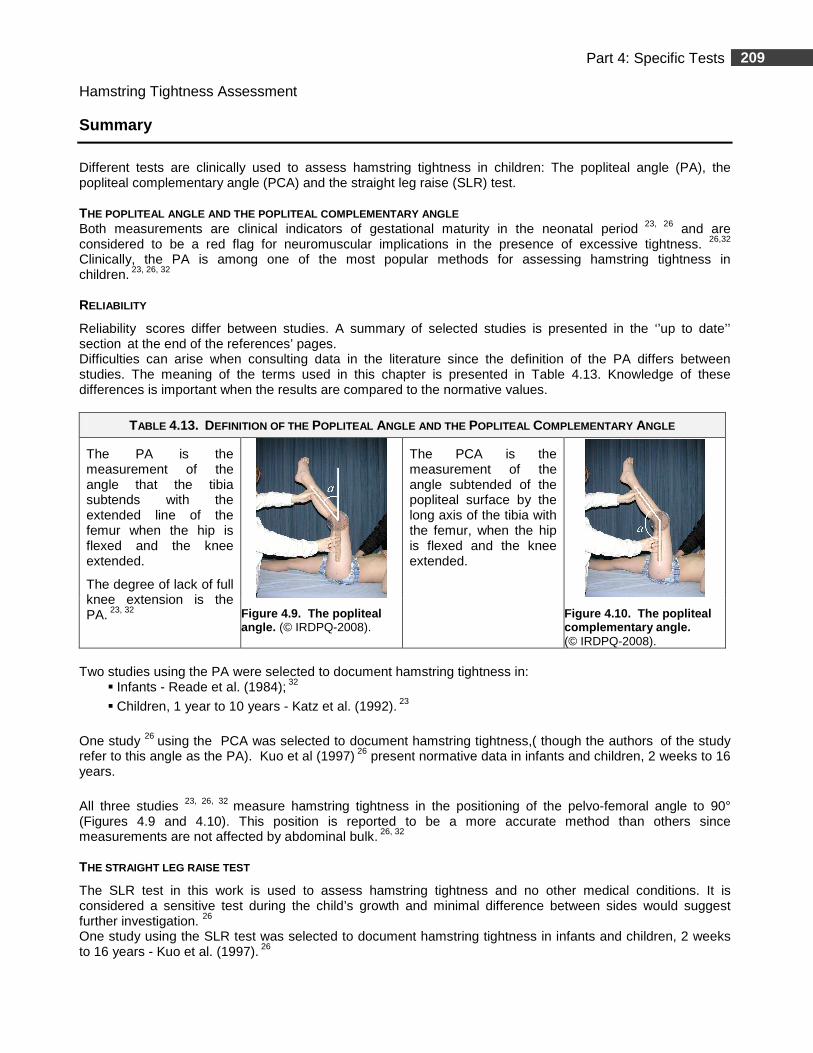
The PA is the measurement of the angle that the tibia subtends with the extended line of the femur when the hip is flexed and the knee extended.
The degree of lack of full knee extension is the PA. 23, 32
The PCA is the measurement of the angle subtended of the popliteal surface by the long axis of the tibia with the femur, when the hip is flexed and the knee extended.
Figure 4.9. The popliteal angle. (© IRDPQ-2008).
Figure 4.10. The popliteal complementary angle. (© IRDPQ-2008).
Two studies using the PA were selected to document hamstring tightness in:
� Infants - Reade et al. (1984); 32
� Children, 1 year to 10 years - Katz et al. (1992). 23
One study 26 using the PCA was selected to document hamstring tightness,( though the authors of the study
refer to this angle as the PA). Kuo et al (1997) 26 present normative data in infants and children, 2 weeks to 16 years.
All three studies 23, 26, 32 measure hamstring tightness in the positioning of the pelvo-femoral angle to 90° (Figures 4.9 and 4.10). This position is reported to be a more accurate method than others since measurements are not affected by abdominal bulk. 26, 32
THE STRAIGHT LEG RAISE TEST
The SLR test in this work is used to assess hamstring tightness and no other medical conditions. It is considered a sensitive test during the child’s growth and minimal difference between sides would suggest further investigation. 26 One study using the SLR test was selected to document hamstring tightness in infants and children, 2 weeks to 16 years - Kuo et al. (1997). 26

210 Part 4: Specific Tests
8. The Popliteal Angle
Age range: � Newborns to 12 months; 32
� 1 year to 10 years. 23
8.1 Clinical Use
� In infants, the popliteal angle (PA) is an indicator of gestational age. 23, 26, 32
� In children with cerebral palsy the PA is used to assess high muscle tone in the hamstring muscle and contracture. 23, 32
� Hamstring tightness in a “healthy” child might be an indication to observe the child for other signs of neuromuscular pathology. 32
8.2 Measurements
� The degree of lack of full knee extension is measured in the positioning of the pelvo-femoral angle to 90° (Fig. 4.11).
8.3 Testing Procedures
REQUIRED EQUIPMENT
� Standard 360° goniometer.
� Examination table.
� Hypoallergenic skin cosmetic crayon to mark anatomical landmarks.
PRE-TEST
� Mark the following anatomical landmarks:
� Axis of the knee joint;
� Greater trochanter;
� Lateral malleolus.
TEST
� Testing position, goniometer alignment and measurements are presented in Table 4.14.
� Results are compared to: A. The mean values in in Table 4.15 for newborns and infants; 32 B. The normative reference values in Figure 4.14 for children 1 year to 10 years. 23
211 Part 4: Specific Tests
TABLE 4.14. POPLITEAL ANGLE
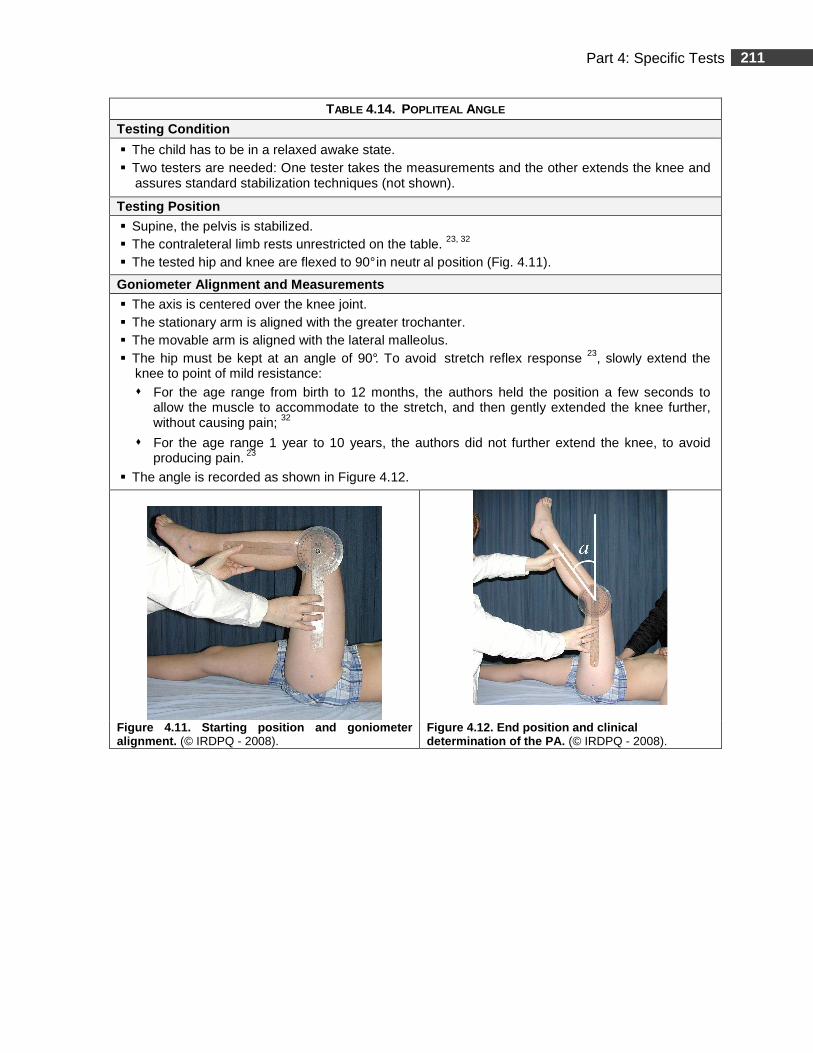
Testing Condition
� The child has to be in a relaxed awake state. � Two testers are needed: One tester takes the measurements and the other extends the knee and
assures standard stabilization techniques (not shown).
Testing Position
� Supine, the pelvis is stabilized. � The contraleteral limb rests unrestricted on the table. 23, 32 � The tested hip and knee are flexed to 90° in neutr al position (Fig. 4.11).
Goniometer Alignment and Measurements
� The axis is centered over the knee joint. � The stationary arm is aligned with the greater trochanter. � The movable arm is aligned with the lateral malleolus. � The hip must be kept at an angle of 90°. To avoid stretch reflex response 23, slowly extend the
knee to point of mild resistance: � For the age range from birth to 12 months, the authors held the position a few seconds to
allow the muscle to accommodate to the stretch, and then gently extended the knee further, without causing pain; 32
� For the age range 1 year to 10 years, the authors did not further extend the knee, to avoid producing pain. 23
� The angle is recorded as shown in Figure 4.12.
Figure 4.11. Starting position and goniometer alignment. (© IRDPQ - 2008).
Figure 4.12. End position and c linical determination of the PA. (© IRDPQ - 2008).
212 Part 4: Specific Tests
8.4 - A . Mean Values (newborn to 12 months)
Note : To obtain complete data (range and standard deviations), the clinician will have to order the article of Reade et al.-1984. 32
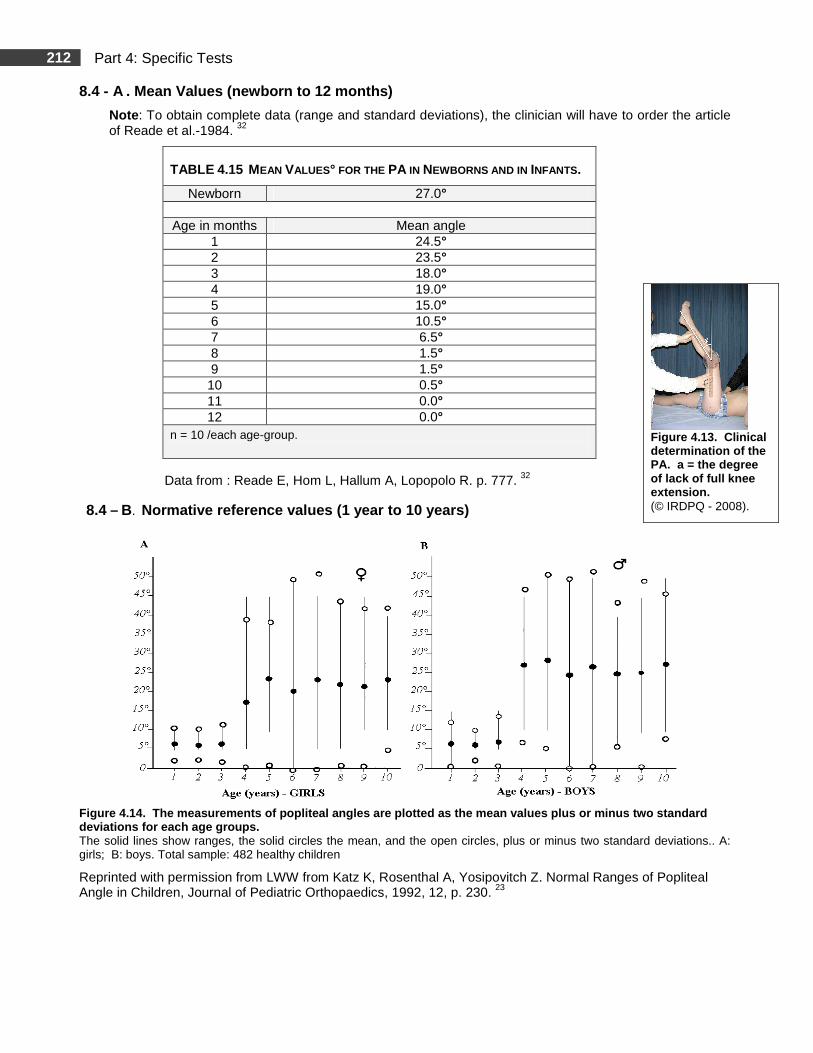
TABLE 4.15 MEAN VALUES° FOR THE PA IN NEWBORNS AND IN INFANTS.
Newborn 27.0°
Age in months Mean angle 1 24.5° 2 23.5° 3 18.0° 4 19.0° 5 15.0° 6 10.5° 7 6.5° 8 1.5° 9 1.5° 10 0.5° 11 0.0° 12 0.0°
n = 10 /each age-group.
Data from : Reade E, Hom L, Hallum A, Lopopolo R. p. 777. 32
8.4 – B. Normative reference values (1 year to 10 years)
Figure 4.14. The measurements of popliteal angles are plotted as the mean values plus or minus two st andard deviations for each age groups. The solid lines show ranges, the solid circles the mean, and the open circles, plus or minus two standard deviations.. A: girls; B: boys. Total sample: 482 healthy children
Reprinted with permission from LWW from Katz K, Rosenthal A, Yosipovitch Z. Normal Ranges of Popliteal Angle in Children, Journal of Pediatric Orthopaedics, 1992, 12, p. 230. 23
Figure 4.13. Clinical determination of the PA. a = the degree of lack of full knee extension. (© IRDPQ - 2008).
213 Part 4: Specific Tests
8.5 Clinical Practice Guidelines
� In children aged 12 months or less: 32
� There is a highly significant relationship between age and degree of limitation of knee extension in “normal” children.
� In children aged between 1 year and 10 years: 23
� A popliteal angle < 50° does not interfere with nor mal gait and should be regarded as a normal angle in children;
� A popliteal angle ≥ 50° indicates a significant hamstring shortening.
214 Part 4: Specific Tests
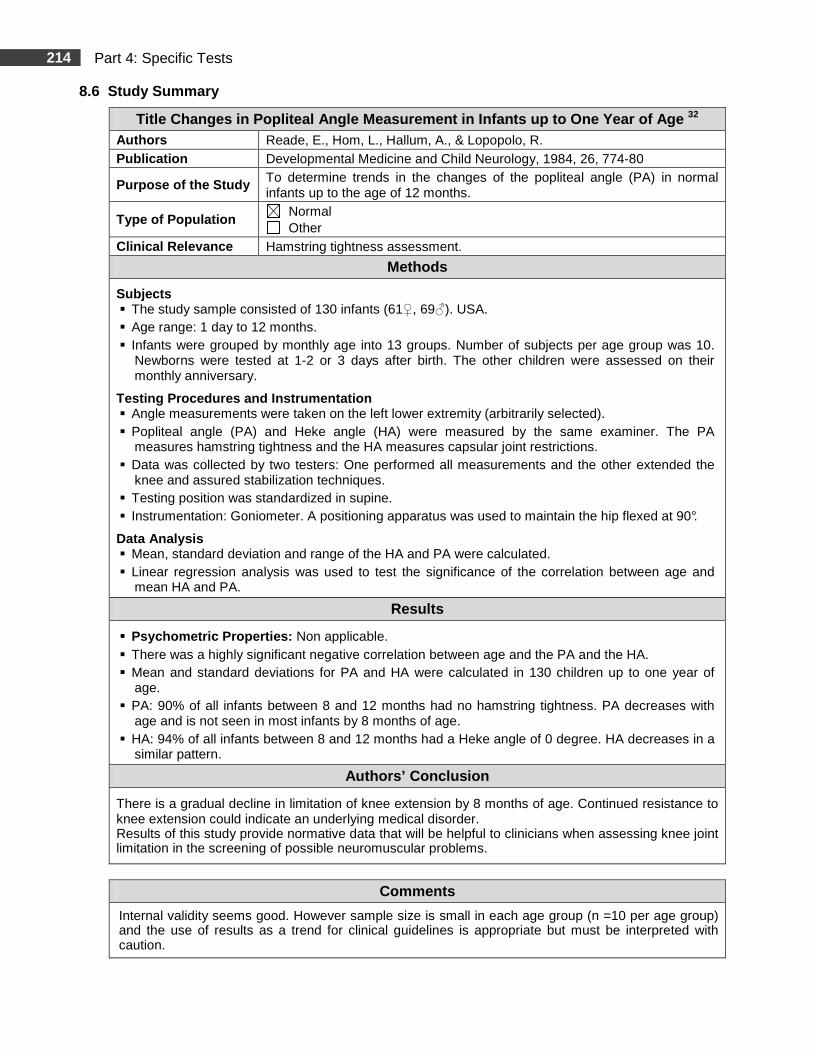
8.6 Study Summary
Title Changes in Popliteal Angle Measurement in Inf ants up to One Year of Age 32
Authors Reade, E., Hom, L., Hallum, A., & Lopopolo, R. Publication Developmental Medicine and Child Neurology, 1984, 26, 774-80
Purpose of the Study To determine trends in the changes of the popliteal angle (PA) in normal infants up to the age of 12 months.
Type of Population Normal Other
Clinical Relevance Hamstring tightness assessment.
Methods
Subjects � The study sample consisted of 130 infants (61♀, 69♂). USA. � Age range: 1 day to 12 months. � Infants were grouped by monthly age into 13 groups. Number of subjects per age group was 10.
Newborns were tested at 1-2 or 3 days after birth. The other children were assessed on their monthly anniversary.
Testing Procedures and Instrumentation � Angle measurements were taken on the left lower extremity (arbitrarily selected). � Popliteal angle (PA) and Heke angle (HA) were measured by the same examiner. The PA
measures hamstring tightness and the HA measures capsular joint restrictions. � Data was collected by two testers: One performed all measurements and the other extended the
knee and assured stabilization techniques. � Testing position was standardized in supine. � Instrumentation: Goniometer. A positioning apparatus was used to maintain the hip flexed at 90°.
Data Analysis � Mean, standard deviation and range of the HA and PA were calculated. � Linear regression analysis was used to test the significance of the correlation between age and
mean HA and PA.
Results
� Psychometric Properties: Non applicable. � There was a highly significant negative correlation between age and the PA and the HA. � Mean and standard deviations for PA and HA were calculated in 130 children up to one year of
age. � PA: 90% of all infants between 8 and 12 months had no hamstring tightness. PA decreases with
age and is not seen in most infants by 8 months of age. � HA: 94% of all infants between 8 and 12 months had a Heke angle of 0 degree. HA decreases in a
similar pattern.
Authors’ Conclusion
There is a gradual decline in limitation of knee extension by 8 months of age. Continued resistance to knee extension could indicate an underlying medical disorder. Results of this study provide normative data that will be helpful to clinicians when assessing knee joint limitation in the screening of possible neuromuscular problems.
Comments
Internal validity seems good. However sample size is small in each age group (n =10 per age group) and the use of results as a trend for clinical guidelines is appropriate but must be interpreted with caution.
215 Part 4: Specific Tests
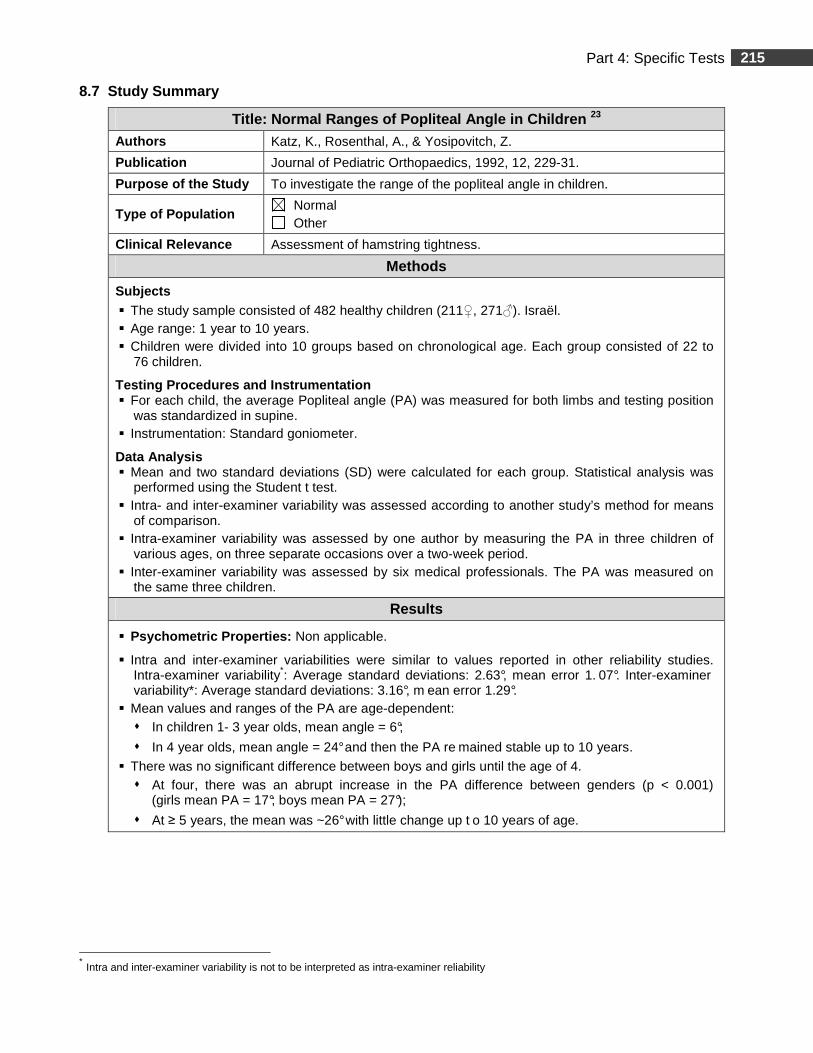
8.7 Study Summary
Title: Normal Ranges of Popliteal Angle in Children 23 Authors Katz, K., Rosenthal, A., & Yosipovitch, Z.
Publication Journal of Pediatric Orthopaedics, 1992, 12, 229-31.
Purpose of the Study To investigate the range of the popliteal angle in children.
Type of Population Normal Other
Clinical Relevance Assessment of hamstring tightness.
Methods
Subjects � The study sample consisted of 482 healthy children (211♀, 271♂). Israël. � Age range: 1 year to 10 years. � Children were divided into 10 groups based on chronological age. Each group consisted of 22 to
76 children.
Testing Procedures and Instrumentation � For each child, the average Popliteal angle (PA) was measured for both limbs and testing position
was standardized in supine. � Instrumentation: Standard goniometer.
Data Analysis � Mean and two standard deviations (SD) were calculated for each group. Statistical analysis was
performed using the Student t test. � Intra- and inter-examiner variability was assessed according to another study’s method for means
of comparison. � Intra-examiner variability was assessed by one author by measuring the PA in three children of
various ages, on three separate occasions over a two-week period. � Inter-examiner variability was assessed by six medical professionals. The PA was measured on
the same three children.
Results
� Psychometric Properties: Non applicable.
� Intra and inter-examiner variabilities were similar to values reported in other reliability studies. Intra-examiner variability*: Average standard deviations: 2.63°, mean error 1. 07°. Inter-examiner variability*: Average standard deviations: 3.16°, m ean error 1.29°.
� Mean values and ranges of the PA are age-dependent: � In children 1- 3 year olds, mean angle = 6°;
� In 4 year olds, mean angle = 24° and then the PA re mained stable up to 10 years.
� There was no significant difference between boys and girls until the age of 4. � At four, there was an abrupt increase in the PA difference between genders (p < 0.001)
(girls mean PA = 17°; boys mean PA = 27°);
� At ≥ 5 years, the mean was ~26° with little change up t o 10 years of age.
* Intra and inter-examiner variability is not to be interpreted as intra-examiner reliability
216 Part 4: Specific Tests
8.7 Study Summary (Continued)
Authors’ Conclusion
� Tightness of hamstring muscles < 50° as expressed by a PA does not interfere with normal gait and an angle < 50° should be considered normal.
� Findings of the study support the recommendation that a PA > 40°- 45° is an indication for hamstring lengthening in children with cerebral palsy who have sitting or gait disturbance.
Comments
� Internal and external validity, including sample size, seems good and the use of results as a trend for clinical guidelines is appropriate.

217 Part 4: Specific Tests
9. The Popliteal Complimentary Angle 26
Age range: 2 weeks to 16 years. 9.1 Clinical Use
� To assess hamstring tightness.
� Hamstring tightness in a “healthy” child might be an indication to observe the child for other signs of neuromuscular pathology. 32
9.2 Measurements
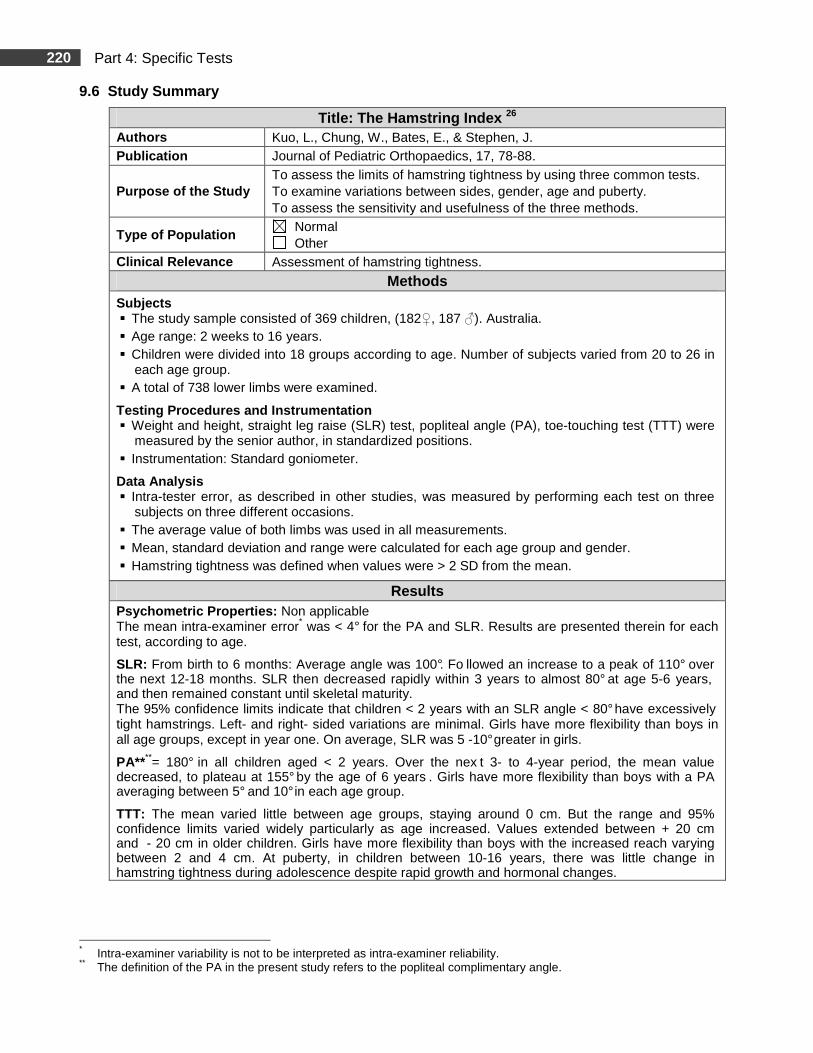
� The angle subtended of the popliteal surface by the long axis of the tibia with the femur represents the PCA (Fig. 4.17).
� Note : in the present study, the authors used the term popliteal angle but, as defined in this document, measured the PCA. The reported angle value will thus be higher.
9.3 Testing Procedures
REQUIRED EQUIPMENT
� Standard 360° goniometer.
� Examination table.
� Hypoallergenic skin cosmetic crayon to mark anatomical landmarks.
PRE-TEST
� Mark the following anatomical landmarks:
� Axis of the knee joint;
� Greater trochanter;
� Lateral malleolus.
TEST
� Testing position, goniometer alignment and measurements are presented in Table 4.16.
� Results are compared to the normative reference values in Figure 4.18.
218 Part 4: Specific Tests
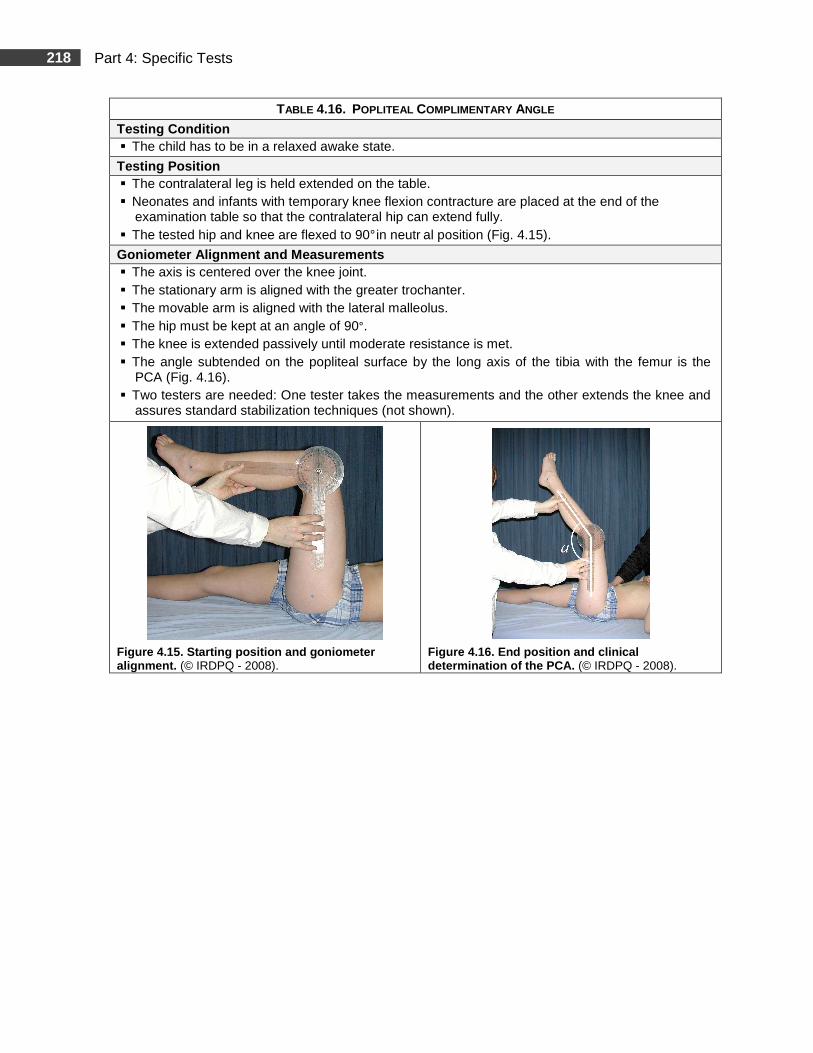
TABLE 4.16. POPLITEAL COMPLIMENTARY ANGLE
Testing Condition � The child has to be in a relaxed awake state.
Testing Position � The contralateral leg is held extended on the table. � Neonates and infants with temporary knee flexion contracture are placed at the end of the
examination table so that the contralateral hip can extend fully. � The tested hip and knee are flexed to 90° in neutr al position (Fig. 4.15).
Goniometer Alignment and Measurements � The axis is centered over the knee joint. � The stationary arm is aligned with the greater trochanter. � The movable arm is aligned with the lateral malleolus. � The hip must be kept at an angle of 90°. � The knee is extended passively until moderate resistance is met. � The angle subtended on the popliteal surface by the long axis of the tibia with the femur is the
PCA (Fig. 4.16). � Two testers are needed: One tester takes the measurements and the other extends the knee and
assures standard stabilization techniques (not shown).
Figure 4.15. Starting position and goniometer alignment. (© IRDPQ - 2008).
Figure 4.16. End position and clinical determination of the PCA. (© IRDPQ - 2008).
219 Part 4: Specific Tests
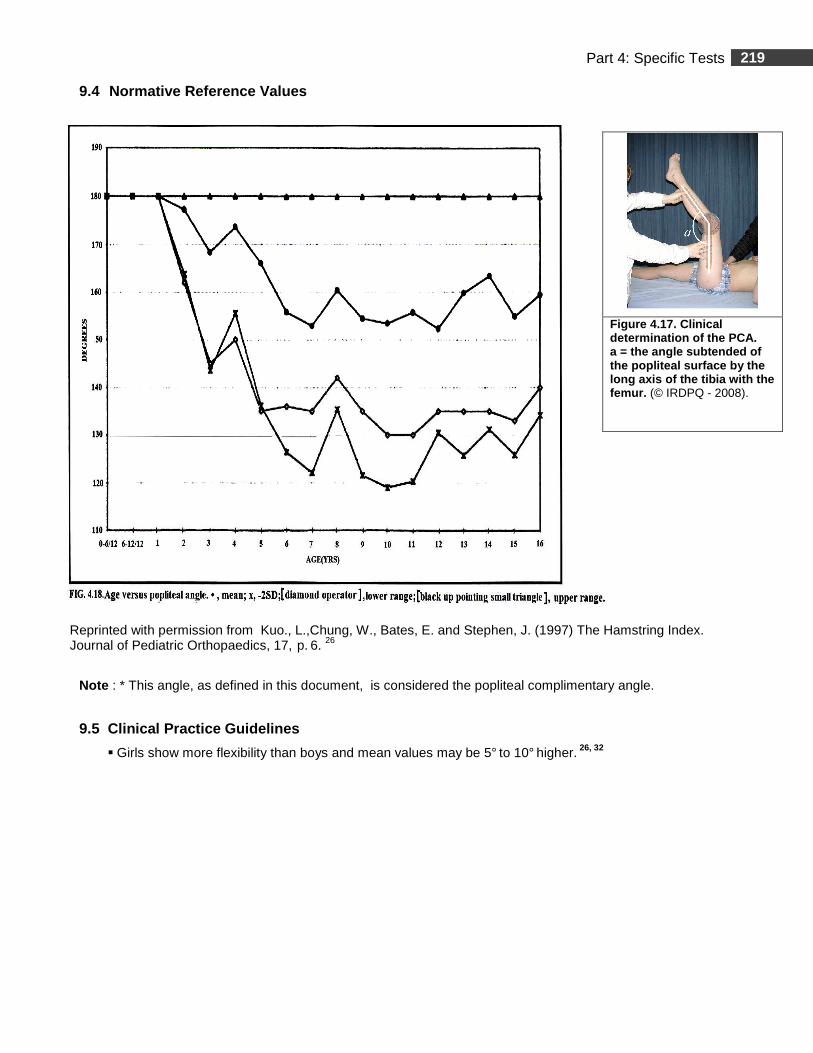
9.4 Normative Reference Values
Reprinted with permission from Kuo., L.,Chung, W., Bates, E. and Stephen, J. (1997) The Hamstring Index. Journal of Pediatric Orthopaedics, 17, p. 6. 26
Note : * This angle, as defined in this document, is considered the popliteal complimentary angle.
9.5 Clinical Practice Guidelines
� Girls show more flexibility than boys and mean values may be 5° to 10° higher. 26, 32
Figure 4.17. Clinical determination of the PCA . a = the angle subtended of the popliteal surface by the long axis of the tibia with the femur. (© IRDPQ - 2008).
220 Part 4: Specific Tests
9.6 Study Summary
Title: The Hamstring Index 26 Authors Kuo, L., Chung, W., Bates, E., & Stephen, J. Publication Journal of Pediatric Orthopaedics, 17, 78-88.
Purpose of the Study To assess the limits of hamstring tightness by using three common tests. To examine variations between sides, gender, age and puberty. To assess the sensitivity and usefulness of the three methods.
Type of Population Normal Other
Clinical Relevance Assessment of hamstring tightness.
Methods Subjects � The study sample consisted of 369 children, (182♀, 187 ♂). Australia. � Age range: 2 weeks to 16 years. � Children were divided into 18 groups according to age. Number of subjects varied from 20 to 26 in
each age group. � A total of 738 lower limbs were examined.
Testing Procedures and Instrumentation � Weight and height, straight leg raise (SLR) test, popliteal angle (PA), toe-touching test (TTT) were
measured by the senior author, in standardized positions. � Instrumentation: Standard goniometer.
Data Analysis � Intra-tester error, as described in other studies, was measured by performing each test on three
subjects on three different occasions. � The average value of both limbs was used in all measurements. � Mean, standard deviation and range were calculated for each age group and gender. � Hamstring tightness was defined when values were > 2 SD from the mean.
Results Psychometric Properties: Non applicable The mean intra-examiner error* was < 4° for the PA and SLR. Results are presented therein for each test, according to age.
SLR: From birth to 6 months: Average angle was 100°. Fo llowed an increase to a peak of 110° over the next 12-18 months. SLR then decreased rapidly within 3 years to almost 80° at age 5-6 years, and then remained constant until skeletal maturity. The 95% confidence limits indicate that children < 2 years with an SLR angle < 80° have excessively tight hamstrings. Left- and right- sided variations are minimal. Girls have more flexibility than boys in all age groups, except in year one. On average, SLR was 5 -10° greater in girls.
PA****= 180° in all children aged < 2 years. Over the nex t 3- to 4-year period, the mean value decreased, to plateau at 155° by the age of 6 years . Girls have more flexibility than boys with a PA averaging between 5° and 10° in each age group.
TTT: The mean varied little between age groups, staying around 0 cm. But the range and 95% confidence limits varied widely particularly as age increased. Values extended between + 20 cm and - 20 cm in older children. Girls have more flexibility than boys with the increased reach varying between 2 and 4 cm. At puberty, in children between 10-16 years, there was little change in hamstring tightness during adolescence despite rapid growth and hormonal changes.
* Intra-examiner variability is not to be interpreted as intra-examiner reliability. ** The definition of the PA in the present study refers to the popliteal complimentary angle.
221 Part 4: Specific Tests
9.6 Study Summary (Continued)
Authors’ Conclusion � SLR and PA are passive tests that are more sensitive of hamstring tightness allowing better
examiner control. � TTT is an active test subject to great variability and is not a pure test of hamstring tightness. It is
not reliable in children < 3 years and results show wide SD making the test less discriminative. � Girls have less hamstring tightness than boys.
Comments � Internal and external validity, including sample size, (n =20 to 26 in each age group) seems good
and the use of results as a trend for clinical guidelines is appropriate.
222 Part 4: Specific Tests
10. Straight Leg Raise Test 26
Age range: 2 weeks to 16 years. 10.1 Clinical Use
� The straight leg raise (SLR) test is used to assess hamstring tightness and, in neuromuscular disorders, to determine contracture and high muscle tone.
� The presence of tight hamstring muscles in an infant without musculoskeletal dysfunction may be a sign indicating neuromuscular pathology or other medical conditions. 32
10.2 Measurements
� SLR is the angle subtended between the raised leg and the horizontal plane (Fig. 4.20).
10.3 Testing Procedures
REQUIRED EQUIPMENT
� Standard 360° goniometer.
� Examination table.
� Hypoallergenic skin cosmetic crayon to mark anatomical landmarks
PRE-TEST
� Mark the following anatomical landmarks:
� The femoral greater trochanter;
� The lateral femoral condyle.
TEST
� Testing position, goniometer alignment and measurements are presented in:
� Table 4.17 for infants with a temporary knee flexion contracture (KFC);
� Table 4.18 for children with no KFC.
� Results are compared to the normative reference values in Figure 4.21.
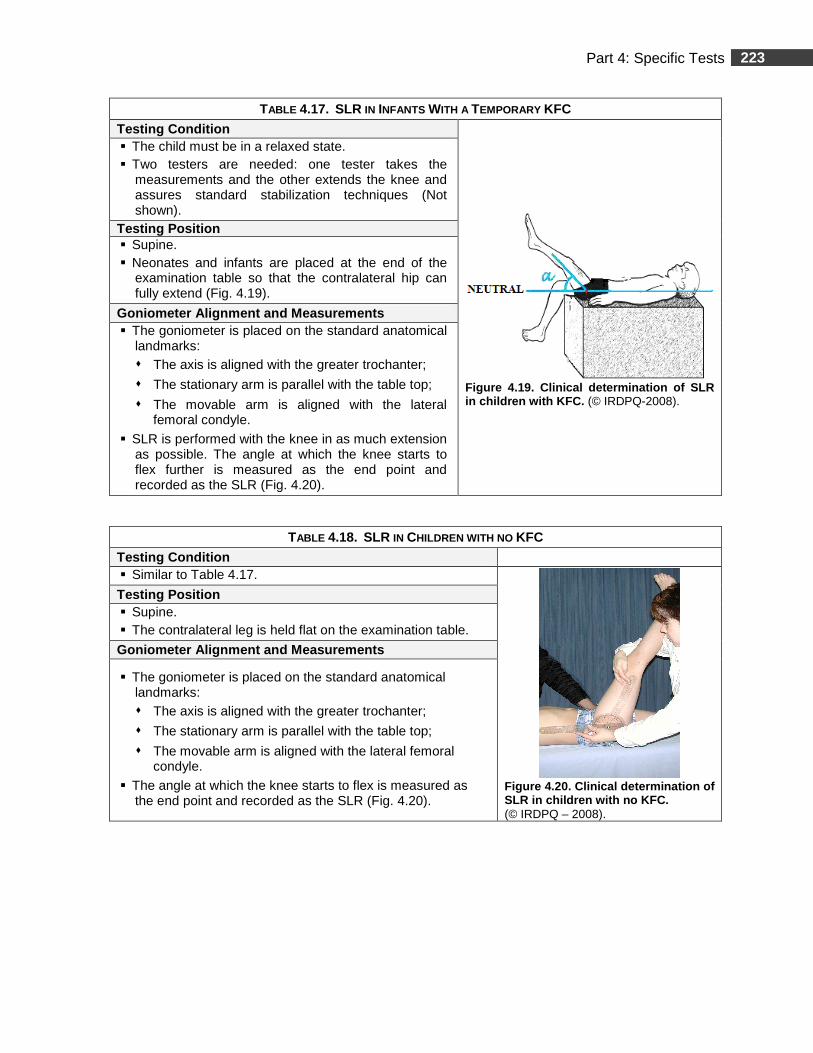
223 Part 4: Specific Tests
TABLE 4.17. SLR IN INFANTS WITH A TEMPORARY KFC
Testing Condition
Figure 4.19. Clinical determination of SLR in children with KFC. (© IRDPQ-2008).
� The child must be in a relaxed state. � Two testers are needed: one tester takes the
measurements and the other extends the knee and assures standard stabilization techniques (Not shown).
Testing Po sition � Supine. � Neonates and infants are placed at the end of the
examination table so that the contralateral hip can fully extend (Fig. 4.19).
Goniometer Alignment and Measurements � The goniometer is placed on the standard anatomical
landmarks: � The axis is aligned with the greater trochanter;
� The stationary arm is parallel with the table top;
� The movable arm is aligned with the lateral femoral condyle.
� SLR is performed with the knee in as much extension as possible. The angle at which the knee starts to flex further is measured as the end point and recorded as the SLR (Fig. 4.20).
TABLE 4.18. SLR IN CHILDREN WITH NO KFC
Testing Condition � Similar to Table 4.17.
Figure 4.20. Clinical determination of SLR in children with no KFC. (© IRDPQ – 2008).
Testing Position � Supine. � The contralateral leg is held flat on the examination table.
Goniometer Alignment and Measurements
� The goniometer is placed on the standard anatomical landmarks: � The axis is aligned with the greater trochanter;
� The stationary arm is parallel with the table top;
� The movable arm is aligned with the lateral femoral condyle.
� The angle at which the knee starts to flex is measured as the end point and recorded as the SLR (Fig. 4.20).
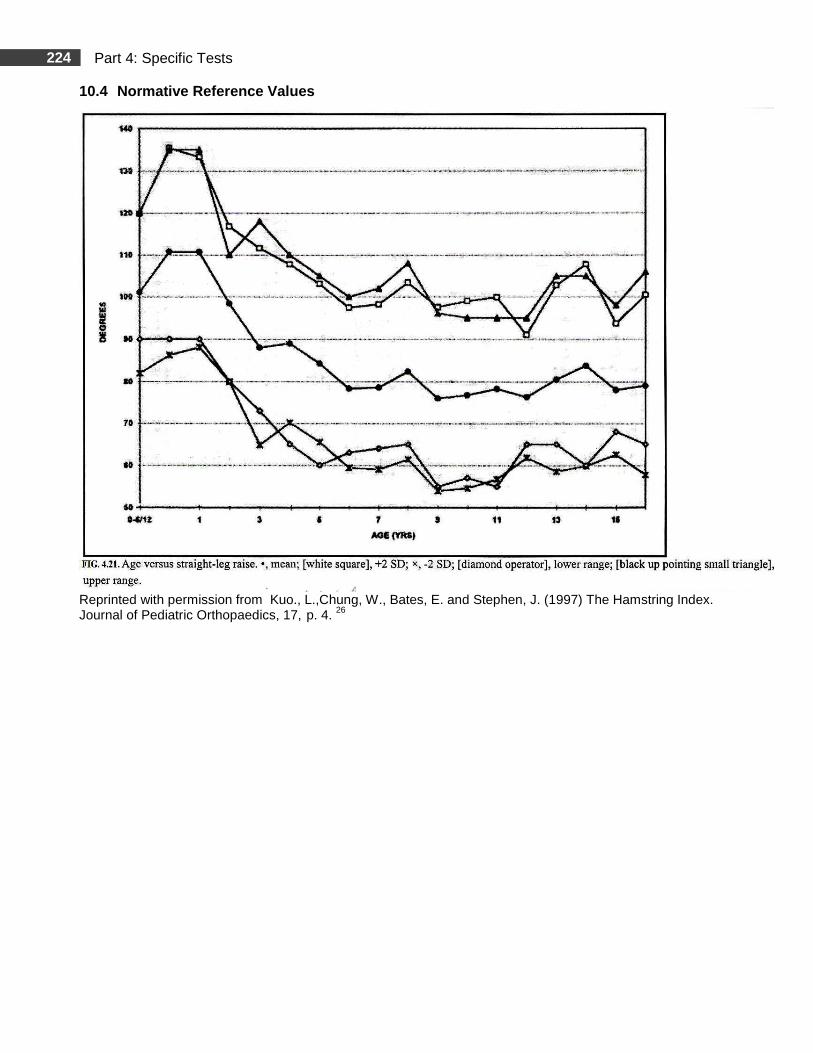
224 Part 4: Specific Tests
10.4 Normative Reference Values
Reprinted with permission from Kuo., L.,Chung, W., Bates, E. and Stephen, J. (1997) The Hamstring Index. Journal of Pediatric Orthopaedics, 17, p. 4. 26
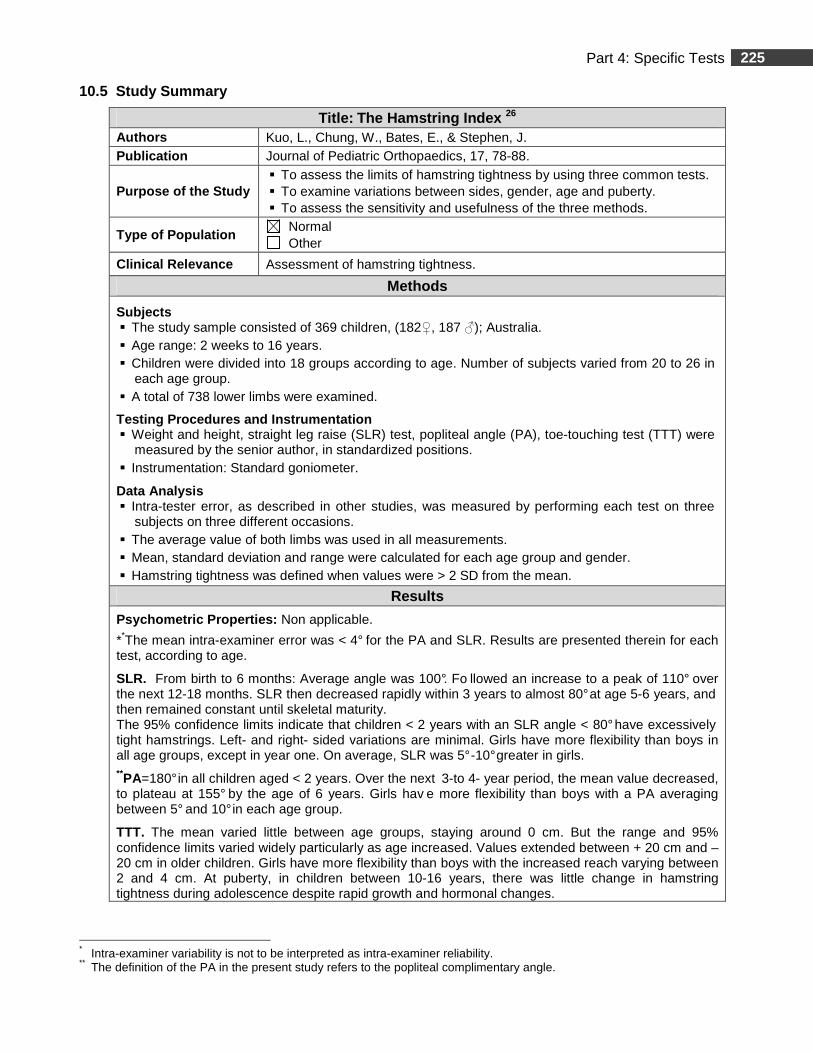
225 Part 4: Specific Tests
10.5 Study Summary
Title: The Hamstring Index 26 Authors Kuo, L., Chung, W., Bates, E., & Stephen, J. Publication Journal of Pediatric Orthopaedics, 17, 78-88.
Purpose of the Study � To assess the limits of hamstring tightness by using three common tests. � To examine variations between sides, gender, age and puberty. � To assess the sensitivity and usefulness of the three methods.
Type of Population Normal Other
Clinical Relevance Assessment of hamstring tightness.
Methods
Subjects � The study sample consisted of 369 children, (182♀, 187 ♂); Australia. � Age range: 2 weeks to 16 years. � Children were divided into 18 groups according to age. Number of subjects varied from 20 to 26 in
each age group. � A total of 738 lower limbs were examined.
Testing Procedures and Instrumentation � Weight and height, straight leg raise (SLR) test, popliteal angle (PA), toe-touching test (TTT) were
measured by the senior author, in standardized positions. � Instrumentation: Standard goniometer.
Data Analysis � Intra-tester error, as described in other studies, was measured by performing each test on three
subjects on three different occasions. � The average value of both limbs was used in all measurements. � Mean, standard deviation and range were calculated for each age group and gender. � Hamstring tightness was defined when values were > 2 SD from the mean.
Results
Psychometric Properties: Non applicable.
**The mean intra-examiner error was < 4° for the PA and SLR. Results are presented therein for each test, according to age.
SLR. From birth to 6 months: Average angle was 100°. Fo llowed an increase to a peak of 110° over the next 12-18 months. SLR then decreased rapidly within 3 years to almost 80° at age 5-6 years, and then remained constant until skeletal maturity. The 95% confidence limits indicate that children < 2 years with an SLR angle < 80° have excessively tight hamstrings. Left- and right- sided variations are minimal. Girls have more flexibility than boys in all age groups, except in year one. On average, SLR was 5° -10° greater in girls. **PA=180° in all children aged < 2 years. Over the next 3-to 4- year period, the mean value decreased, to plateau at 155° by the age of 6 years. Girls hav e more flexibility than boys with a PA averaging between 5° and 10° in each age group.
TTT. The mean varied little between age groups, staying around 0 cm. But the range and 95% confidence limits varied widely particularly as age increased. Values extended between + 20 cm and – 20 cm in older children. Girls have more flexibility than boys with the increased reach varying between 2 and 4 cm. At puberty, in children between 10-16 years, there was little change in hamstring tightness during adolescence despite rapid growth and hormonal changes.
* Intra-examiner variability is not to be interpreted as intra-examiner reliability. ** The definition of the PA in the present study refers to the popliteal complimentary angle.
226 Part 4: Specific Tests
10.5 Study Summary (Continued)
Authors’ Conclusion
� SLR and PA are passive tests that are more sensitive of hamstring tightness allowing better examiner control.
� TTT is an active test subject to great variability and is not a pure test of hamstring tightness. It is not reliable in children < 3 years and results show wide SD making the test less discriminative.
� Girls have less hamstring tightness than boys.
Comments
� Internal and external validity, including sample size, (n =20 to 26 in each age group) seems good and the use of results as a trend for clinical guidelines is appropriate.
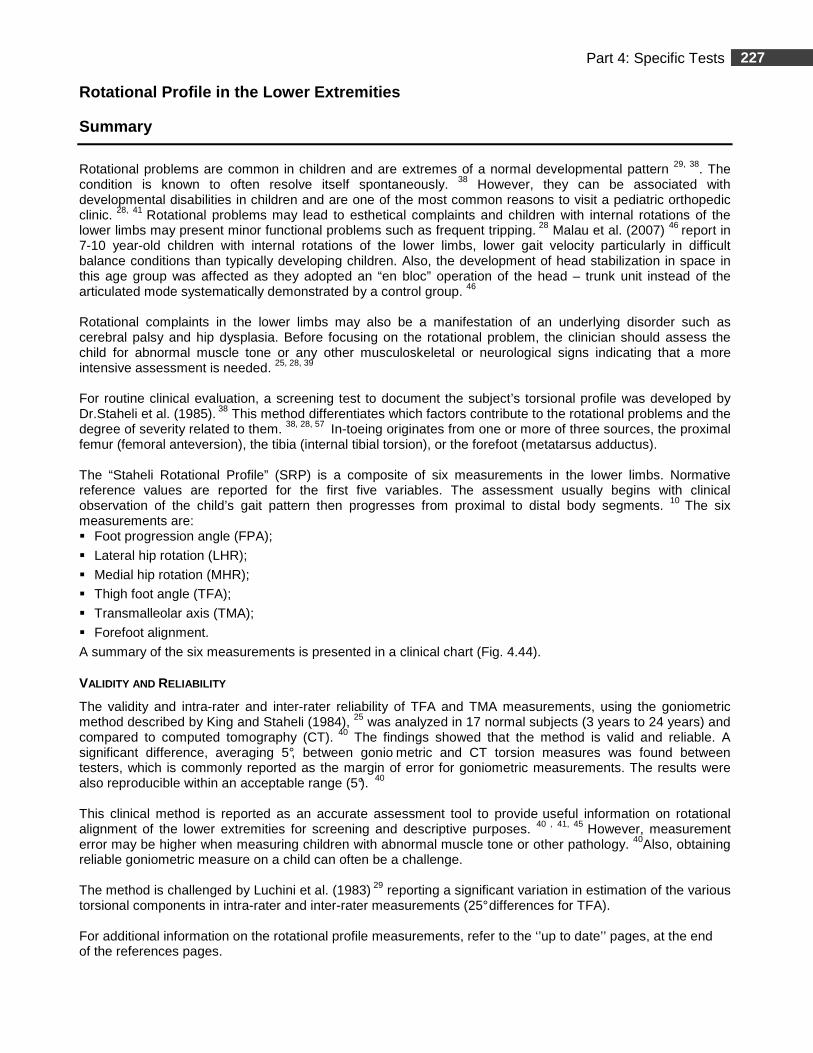
227 Part 4: Specific Tests
Rotational Profile in the Lower Extremities
Summary
Rotational problems are common in children and are extremes of a normal developmental pattern 29, 38. The condition is known to often resolve itself spontaneously. 38 However, they can be associated with developmental disabilities in children and are one of the most common reasons to visit a pediatric orthopedic clinic. 28, 41 Rotational problems may lead to esthetical complaints and children with internal rotations of the lower limbs may present minor functional problems such as frequent tripping. 28 Malau et al. (2007) 46 report in 7-10 year-old children with internal rotations of the lower limbs, lower gait velocity particularly in difficult balance conditions than typically developing children. Also, the development of head stabilization in space in this age group was affected as they adopted an “en bloc” operation of the head – trunk unit instead of the articulated mode systematically demonstrated by a control group. 46
Rotational complaints in the lower limbs may also be a manifestation of an underlying disorder such as cerebral palsy and hip dysplasia. Before focusing on the rotational problem, the clinician should assess the child for abnormal muscle tone or any other musculoskeletal or neurological signs indicating that a more intensive assessment is needed. 25, 28, 39 For routine clinical evaluation, a screening test to document the subject’s torsional profile was developed by Dr.Staheli et al. (1985). 38 This method differentiates which factors contribute to the rotational problems and the degree of severity related to them. 38, 28, 57 In-toeing originates from one or more of three sources, the proximal femur (femoral anteversion), the tibia (internal tibial torsion), or the forefoot (metatarsus adductus). The “Staheli Rotational Profile” (SRP) is a composite of six measurements in the lower limbs. Normative reference values are reported for the first five variables. The assessment usually begins with clinical observation of the child’s gait pattern then progresses from proximal to distal body segments. 10 The six measurements are: � Foot progression angle (FPA);
� Lateral hip rotation (LHR);
� Medial hip rotation (MHR);
� Thigh foot angle (TFA);
� Transmalleolar axis (TMA);
� Forefoot alignment.
A summary of the six measurements is presented in a clinical chart (Fig. 4.44). VALIDITY AND RELIABILITY
The validity and intra-rater and inter-rater reliability of TFA and TMA measurements, using the goniometric method described by King and Staheli (1984), 25 was analyzed in 17 normal subjects (3 years to 24 years) and compared to computed tomography (CT). 40 The findings showed that the method is valid and reliable. A significant difference, averaging 5°, between gonio metric and CT torsion measures was found between testers, which is commonly reported as the margin of error for goniometric measurements. The results were also reproducible within an acceptable range (5°). 40 This clinical method is reported as an accurate assessment tool to provide useful information on rotational alignment of the lower extremities for screening and descriptive purposes. 40 , 41, 45 However, measurement error may be higher when measuring children with abnormal muscle tone or other pathology. 40Also, obtaining reliable goniometric measure on a child can often be a challenge.
The method is challenged by Luchini et al. (1983) 29 reporting a significant variation in estimation of the various torsional components in intra-rater and inter-rater measurements (25° differences for TFA). For additional information on the rotational profile measurements, refer to the ‘’up to date’’ pages, at the end of the references pages.
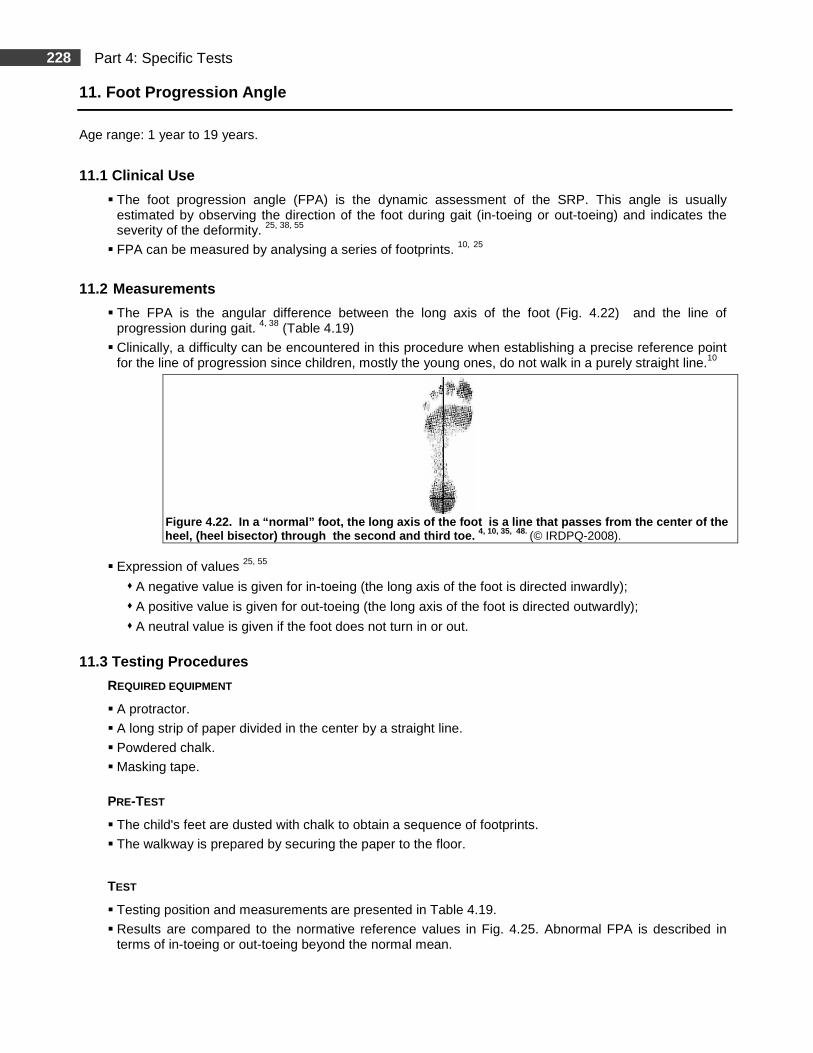
228 Part 4: Specific Tests
11. Foot Progression Angle
Age range: 1 year to 19 years.
11.1 Clinical Use
� The foot progression angle (FPA) is the dynamic assessment of the SRP. This angle is usually estimated by observing the direction of the foot during gait (in-toeing or out-toeing) and indicates the severity of the deformity. 25, 38, 55
� FPA can be measured by analysing a series of footprints. 10, 25
11.2 Measurements
� The FPA is the angular difference between the long axis of the foot (Fig. 4.22) and the line of progression during gait. 4, 38 (Table 4.19)
� Clinically, a difficulty can be encountered in this procedure when establishing a precise reference point for the line of progression since children, mostly the young ones, do not walk in a purely straight line.10
Figure 4.22. In a “normal” foot, the long axis of the foot is a line that passes from the center of the
heel, (heel bisector) through the second and third toe. 4, 10, 35, 48. (© IRDPQ-2008).
� Expression of values 25, 55
� A negative value is given for in-toeing (the long axis of the foot is directed inwardly);
� A positive value is given for out-toeing (the long axis of the foot is directed outwardly);
� A neutral value is given if the foot does not turn in or out.
11.3 Testing Procedures
REQUIRED EQUIPMENT
� A protractor.
� A long strip of paper divided in the center by a straight line.
� Powdered chalk.
� Masking tape.
PRE-TEST
� The child's feet are dusted with chalk to obtain a sequence of footprints.
� The walkway is prepared by securing the paper to the floor.
TEST
� Testing position and measurements are presented in Table 4.19.
� Results are compared to the normative reference values in Fig. 4.25. Abnormal FPA is described in terms of in-toeing or out-toeing beyond the normal mean.
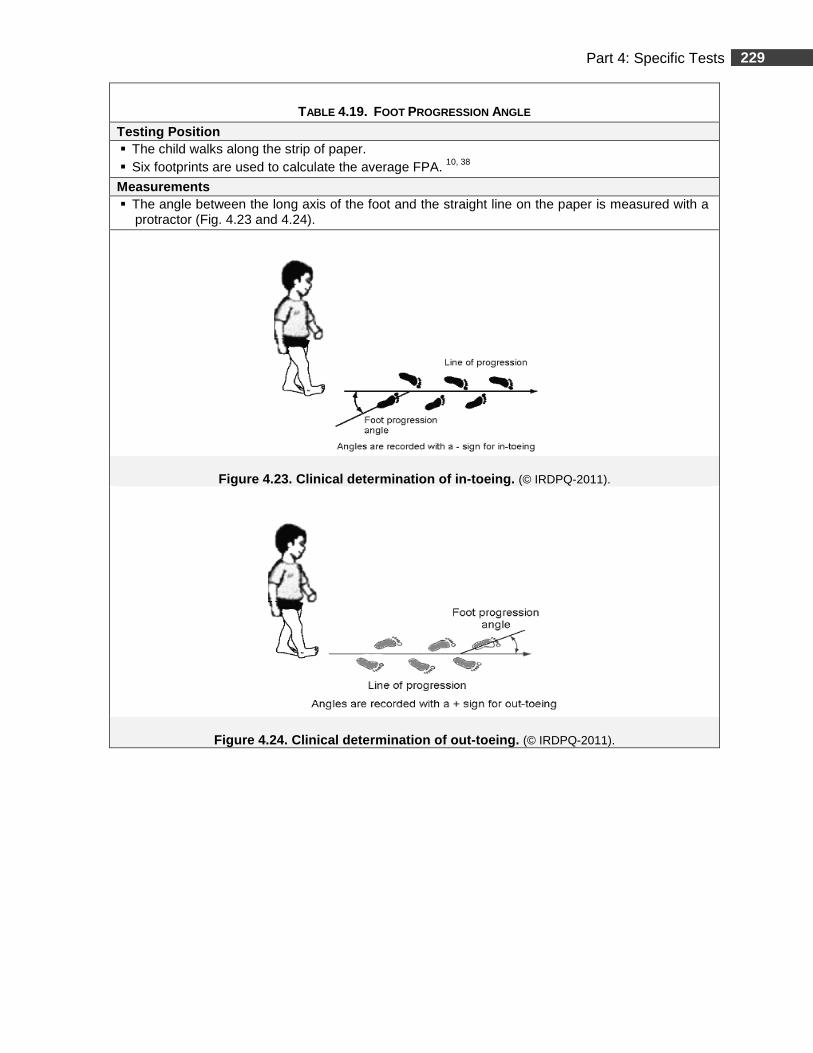
229 Part 4: Specific Tests
TABLE 4.19. FOOT PROGRESSION ANGLE
Testing Position � The child walks along the strip of paper. � Six footprints are used to calculate the average FPA. 10, 38
Measurements � The angle between the long axis of the foot and the straight line on the paper is measured with a
protractor (Fig. 4.23 and 4.24).
Figure 4.23. Clinical determination of in-toeing. (© IRDPQ-2011).
Figure 4.24. Clinical determination of out-toeing. (© IRDPQ-2011).
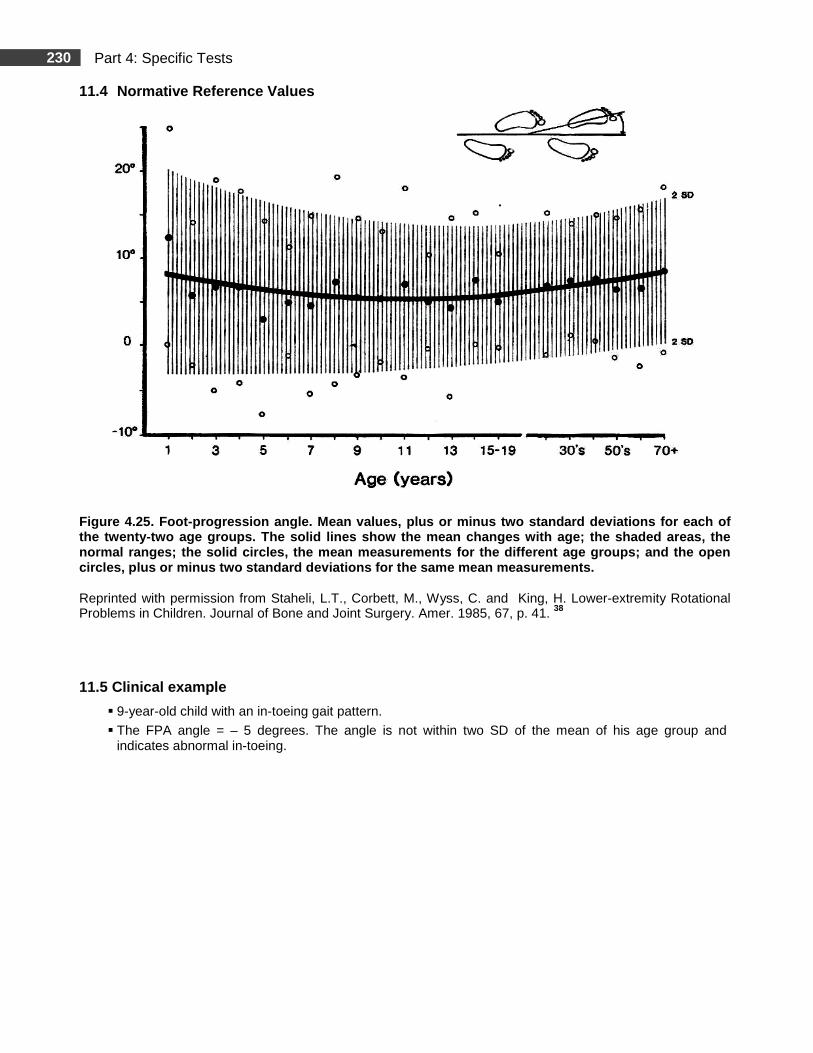
230 Part 4: Specific Tests
11.4 Normative Reference Values
Figure 4.25. Foot-progression angle. Mean values, p lus or minus two standard deviations for each of the twenty-two age groups. The solid lines show the mean changes with age; the shaded areas, the normal ranges; the solid circles, the mean measurem ents for the different age groups; and the open circles, plus or minus two standard deviations for the same mean measurements.
Reprinted with permission from Staheli, L.T., Corbett, M., Wyss, C. and King, H. Lower-extremity Rotational Problems in Children. Journal of Bone and Joint Surgery. Amer. 1985, 67, p. 41. 38
11.5 Clinical example
� 9-year-old child with an in-toeing gait pattern.
� The FPA angle = – 5 degrees. The angle is not within two SD of the mean of his age group and indicates abnormal in-toeing.
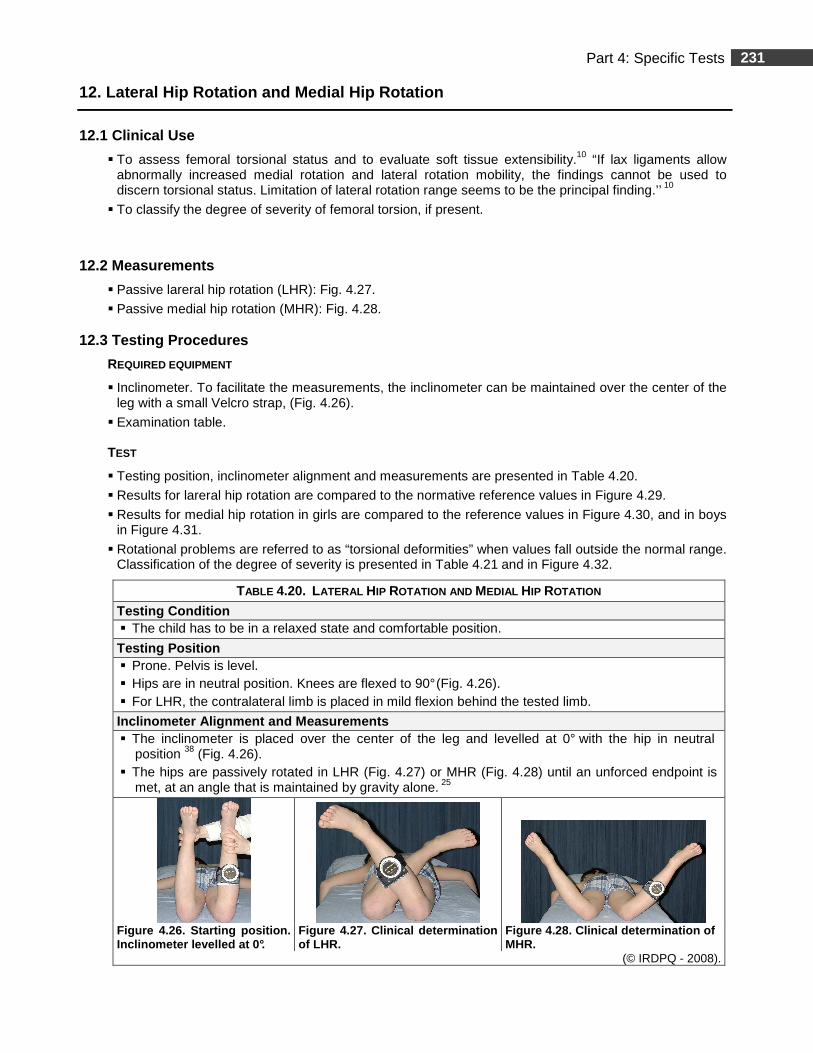
231 Part 4: Specific Tests
12. Lateral Hip Rotation and Medial Hip Rotation
12.1 Clinical Use
� To assess femoral torsional status and to evaluate soft tissue extensibility.10 “If lax ligaments allow abnormally increased medial rotation and lateral rotation mobility, the findings cannot be used to discern torsional status. Limitation of lateral rotation range seems to be the principal finding.’’ 10
� To classify the degree of severity of femoral torsion, if present.
12.2 Measurements
� Passive lareral hip rotation (LHR): Fig. 4.27.
� Passive medial hip rotation (MHR): Fig. 4.28.
12.3 Testing Procedures
REQUIRED EQUIPMENT
� Inclinometer. To facilitate the measurements, the inclinometer can be maintained over the center of the leg with a small Velcro strap, (Fig. 4.26).
� Examination table. TEST
� Testing position, inclinometer alignment and measurements are presented in Table 4.20.
� Results for lareral hip rotation are compared to the normative reference values in Figure 4.29.
� Results for medial hip rotation in girls are compared to the reference values in Figure 4.30, and in boys in Figure 4.31.
� Rotational problems are referred to as “torsional deformities” when values fall outside the normal range. Classification of the degree of severity is presented in Table 4.21 and in Figure 4.32.
TABLE 4.20. LATERAL HIP ROTATION AND MEDIAL HIP ROTATION
Testing Condition � The child has to be in a relaxed state and comfortable position.
Testing Position � Prone. Pelvis is level. � Hips are in neutral position. Knees are flexed to 90° (Fig. 4.26). � For LHR, the contralateral limb is placed in mild flexion behind the tested limb.
Inclinometer Alignment and Measurements � The inclinometer is placed over the center of the leg and levelled at 0° with the hip in neutral
position 38 (Fig. 4.26). � The hips are passively rotated in LHR (Fig. 4.27) or MHR (Fig. 4.28) until an unforced endpoint is
met, at an angle that is maintained by gravity alone. 25
Figure 4.26 . Starting position . Inclinometer levelled at 0°.
Figure 4.27 . Clinical determinatio n of LHR.
Figure 4.28 . Clinical determination of MHR.
(© IRDPQ - 2008).
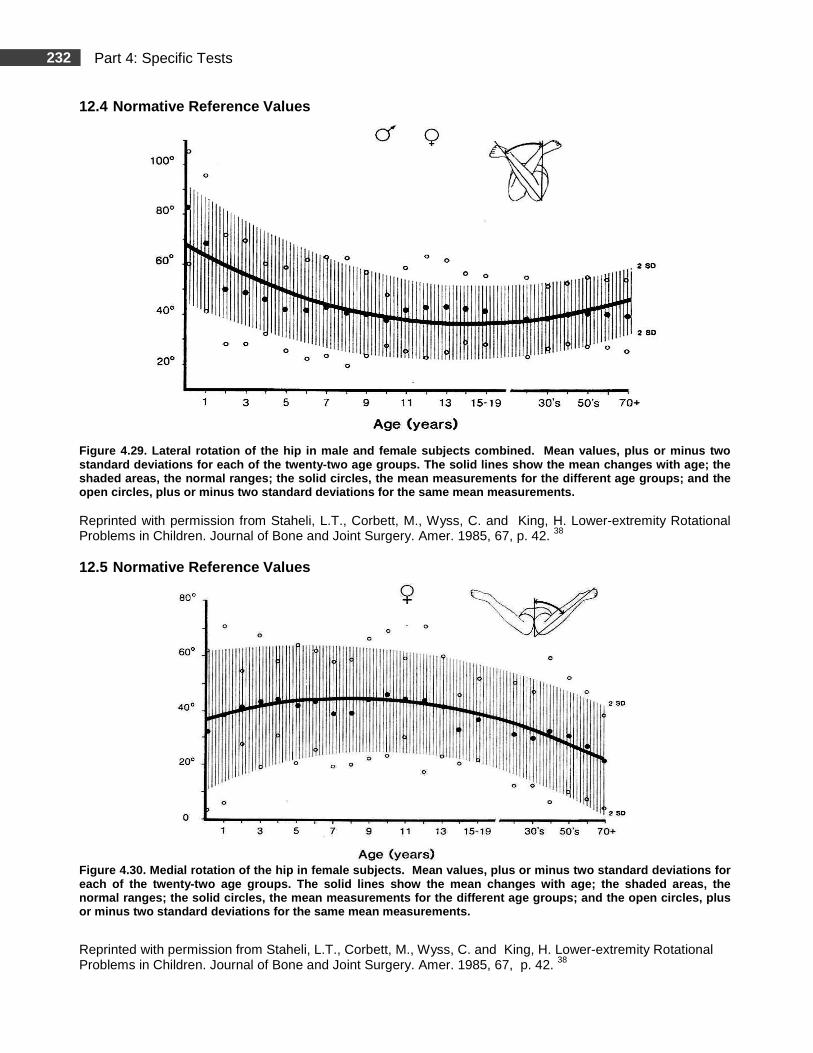
232 Part 4: Specific Tests
12.4 Normative Reference Values
Figure 4.29. Lateral rotation of the hip in male an d female subjects combined. Mean values, plus or m inus two standard deviations for each of the twenty-two age groups. The solid lines show the mean changes with age; the shaded areas, the normal ranges; the solid circles, the mean measurements for the different age groups ; and the open circles, plus or minus two standard deviations for the same mean measurements.
Reprinted with permission from Staheli, L.T., Corbett, M., Wyss, C. and King, H. Lower-extremity Rotational Problems in Children. Journal of Bone and Joint Surgery. Amer. 1985, 67, p. 42. 38
12.5 Normative Reference Values
Figure 4.30. Medial rotation of the hip in female s ubjects. Mean values, plus or minus two standard d eviations for each of the twenty-two age groups. The solid lines show the mean changes with age; the shaded areas, t he normal ranges; the solid circles, the mean measurem ents for the different age groups; and the open cir cles, plus or minus two standard deviations for the same mean measurements.
Reprinted with permission from Staheli, L.T., Corbett, M., Wyss, C. and King, H. Lower-extremity Rotational Problems in Children. Journal of Bone and Joint Surgery. Amer. 1985, 67, p. 42. 38
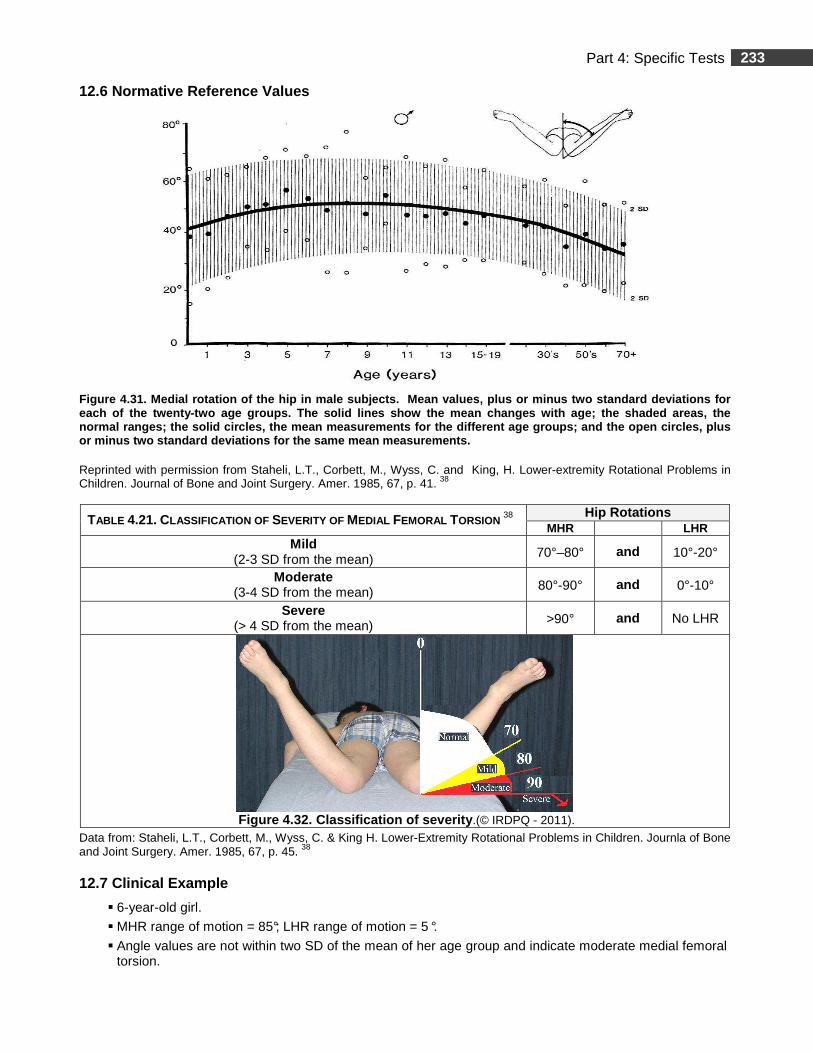
233 Part 4: Specific Tests
12.6 Normative Reference Values
Figure 4.31. Medial rotation of the hip in male sub jects. Mean values, plus or minus two standard dev iations for each of the twenty-two age groups. The solid lines show the mean changes with age; the shaded areas, t he normal ranges; the solid circles, the mean measurem ents for the different age groups; and the open cir cles, plus or minus two standard deviations for the same mean measurements.
Reprinted with permission from Staheli, L.T., Corbett, M., Wyss, C. and King, H. Lower-extremity Rotational Problems in Children. Journal of Bone and Joint Surgery. Amer. 1985, 67, p. 41. 38
TABLE 4.21. CLASSIFICATION OF SEVERITY OF MEDIAL FEMORAL TORSION 38 Hip Rotations
MHR LHR Mild
(2-3 SD from the mean) 70°–80° and 10°-20°
Moderate (3-4 SD from the mean) 80°-90° and 0°-10°
Severe (> 4 SD from the mean) >90° and No LHR
Figure 4.32. Classification of severity .(© IRDPQ - 2011).
Data from: Staheli, L.T., Corbett, M., Wyss, C. & King H. Lower-Extremity Rotational Problems in Children. Journla of Bone and Joint Surgery. Amer. 1985, 67, p. 45. 38
12.7 Clinical Example
� 6-year-old girl.
� MHR range of motion = 85°; LHR range of motion = 5 °.
� Angle values are not within two SD of the mean of her age group and indicate moderate medial femoral torsion.
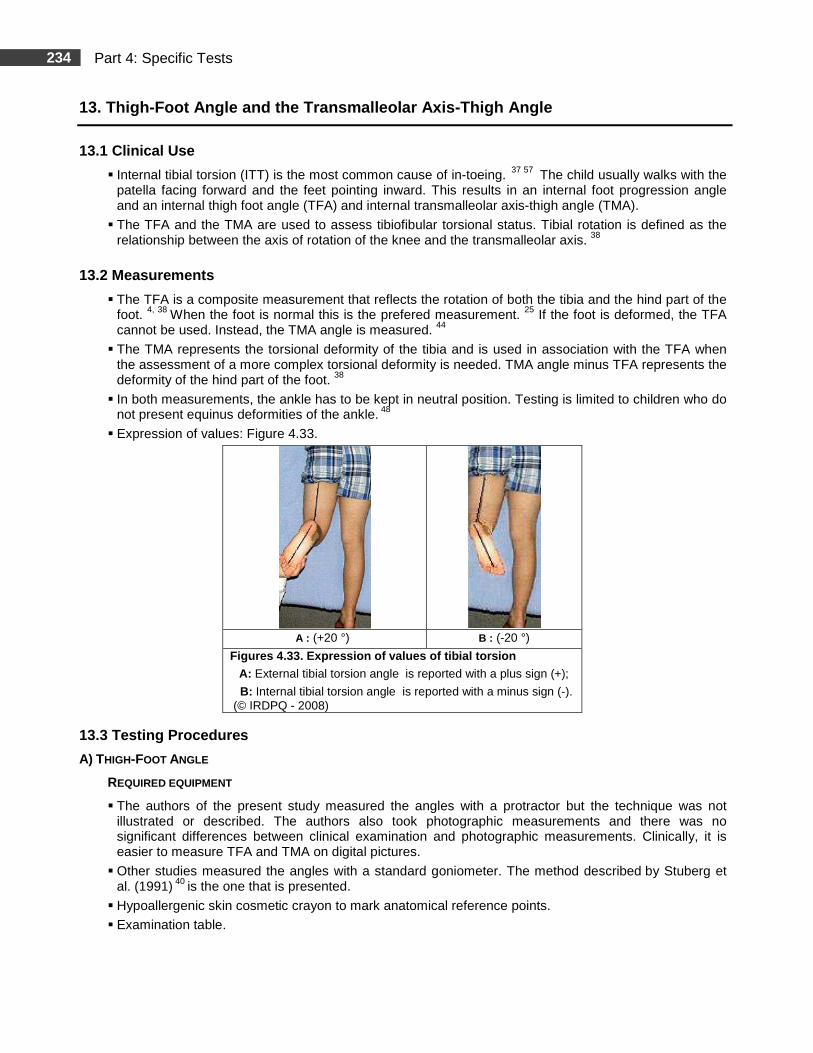
234 Part 4: Specific Tests
13. Thigh-Foot Angle and the Transmalleolar Axis-Th igh Angle
13.1 Clinical Use
� Internal tibial torsion (ITT) is the most common cause of in-toeing. 37 57 The child usually walks with the patella facing forward and the feet pointing inward. This results in an internal foot progression angle and an internal thigh foot angle (TFA) and internal transmalleolar axis-thigh angle (TMA).
� The TFA and the TMA are used to assess tibiofibular torsional status. Tibial rotation is defined as the relationship between the axis of rotation of the knee and the transmalleolar axis. 38
13.2 Measurements
� The TFA is a composite measurement that reflects the rotation of both the tibia and the hind part of the foot. 4, 38 When the foot is normal this is the prefered measurement. 25 If the foot is deformed, the TFA cannot be used. Instead, the TMA angle is measured. 44
� The TMA represents the torsional deformity of the tibia and is used in association with the TFA when the assessment of a more complex torsional deformity is needed. TMA angle minus TFA represents the deformity of the hind part of the foot. 38
� In both measurements, the ankle has to be kept in neutral position. Testing is limited to children who do not present equinus deformities of the ankle. 48
� Expression of values: Figure 4.33.
A : (+20 °) B : (-20 °)
Figures 4.33. Expression of values of tibial torsion A: External tibial torsion angle is reported with a plus sign (+);
B: Internal tibial torsion angle is reported with a minus sign (-). (© IRDPQ - 2008)
13.3 Testing Procedures
A) THIGH-FOOT ANGLE
REQUIRED EQUIPMENT
� The authors of the present study measured the angles with a protractor but the technique was not illustrated or described. The authors also took photographic measurements and there was no significant differences between clinical examination and photographic measurements. Clinically, it is easier to measure TFA and TMA on digital pictures.
� Other studies measured the angles with a standard goniometer. The method described by Stuberg et al. (1991) 40 is the one that is presented.
� Hypoallergenic skin cosmetic crayon to mark anatomical reference points.
� Examination table.
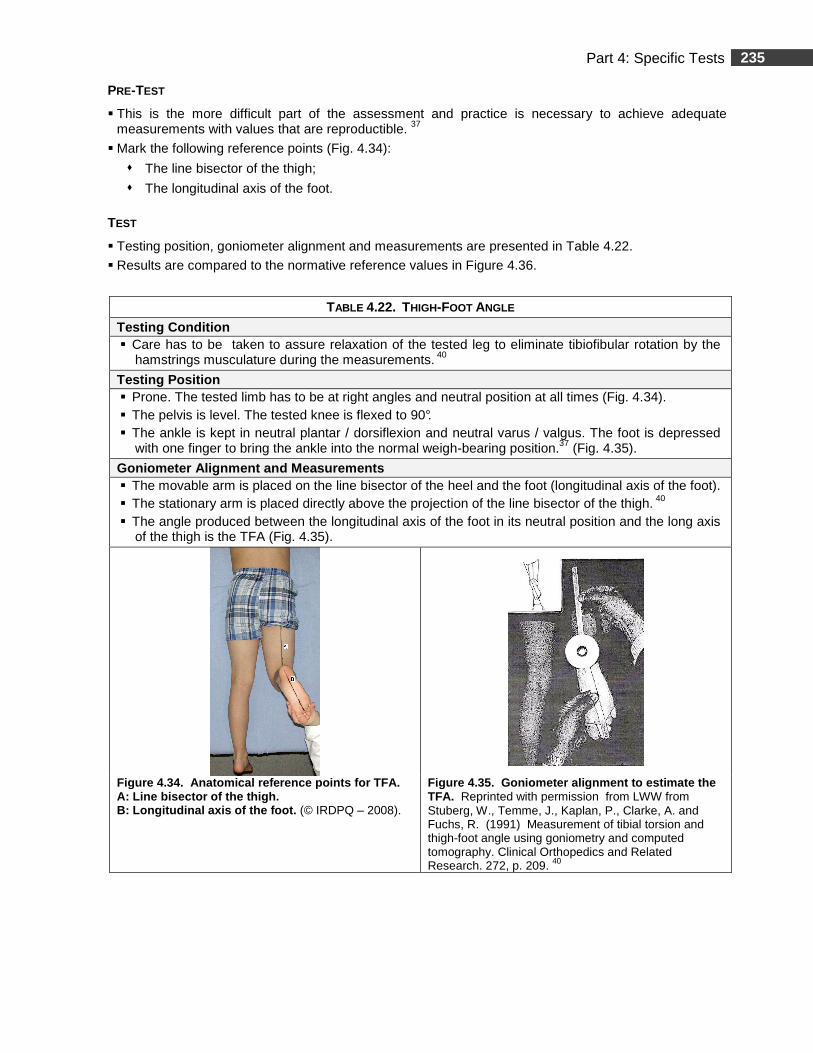
235 Part 4: Specific Tests
PRE-TEST
� This is the more difficult part of the assessment and practice is necessary to achieve adequate measurements with values that are reproductible. 37
� Mark the following reference points (Fig. 4.34):
� The line bisector of the thigh;
� The longitudinal axis of the foot.
TEST
� Testing position, goniometer alignment and measurements are presented in Table 4.22.
� Results are compared to the normative reference values in Figure 4.36.
TABLE 4.22. THIGH-FOOT ANGLE
Testing Condition � Care has to be taken to assure relaxation of the tested leg to eliminate tibiofibular rotation by the
hamstrings musculature during the measurements. 40
Testing Position � Prone. The tested limb has to be at right angles and neutral position at all times (Fig. 4.34). � The pelvis is level. The tested knee is flexed to 90°. � The ankle is kept in neutral plantar / dorsiflexion and neutral varus / valgus. The foot is depressed
with one finger to bring the ankle into the normal weigh-bearing position.37 (Fig. 4.35).
Goniometer Alignment and Measurements � The movable arm is placed on the line bisector of the heel and the foot (longitudinal axis of the foot). � The stationary arm is placed directly above the projection of the line bisector of the thigh. 40 � The angle produced between the longitudinal axis of the foot in its neutral position and the long axis
of the thigh is the TFA (Fig. 4.35).
Figure 4.34. Anatomical reference points for TFA. A: Line bisector of the thigh. B: Longitudinal axis of the foot. (© IRDPQ – 2008).
Figure 4.35. Goniometer alignment to estimate the TFA. Reprinted with permission from LWW from Stuberg, W., Temme, J., Kaplan, P., Clarke, A. and Fuchs, R. (1991) Measurement of tibial torsion and thigh-foot angle using goniometry and computed tomography. Clinical Orthopedics and Related Research. 272, p. 209. 40
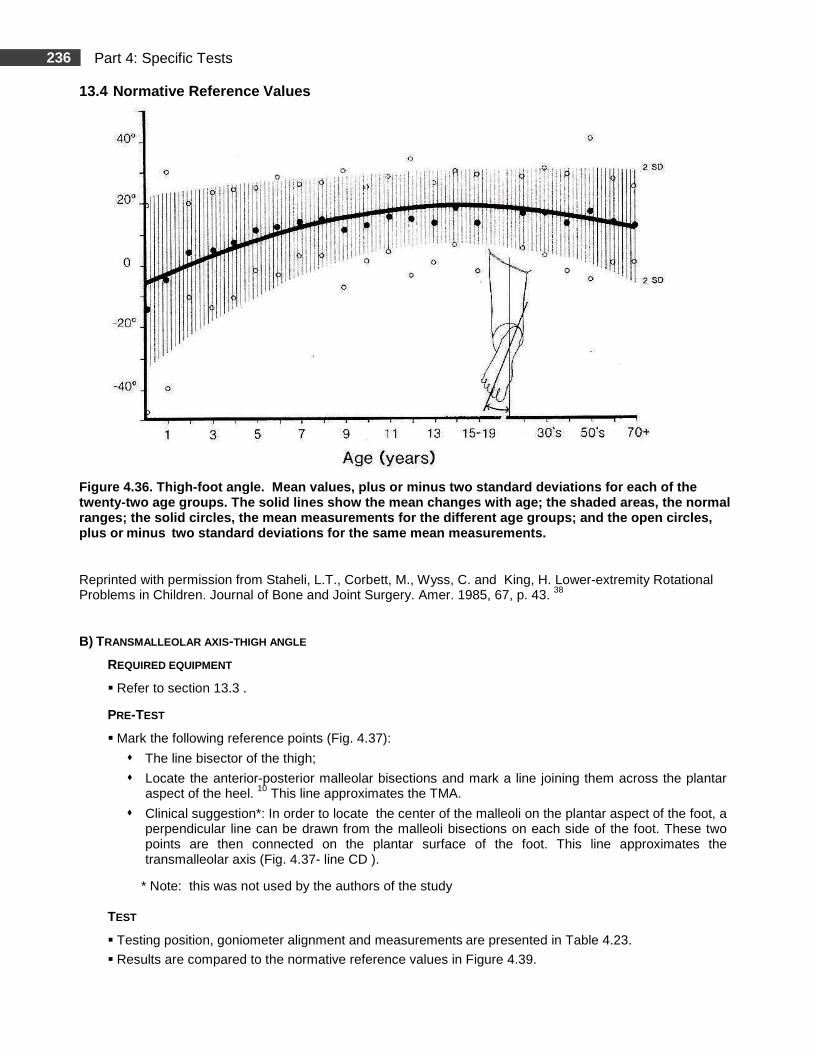
236 Part 4: Specific Tests
13.4 Normative Reference Values
Figure 4.36. Thigh-foot angle. Mean values, plus o r minus two standard deviations for each of the twenty-two age groups. The solid lines show the mea n changes with age; the shaded areas, the normal ranges; the solid circles, the mean measurements fo r the different age groups; and the open circles, plus or minus two standard deviations for the same mean measureme nts.
Reprinted with permission from Staheli, L.T., Corbett, M., Wyss, C. and King, H. Lower-extremity Rotational Problems in Children. Journal of Bone and Joint Surgery. Amer. 1985, 67, p. 43. 38
B) TRANSMALLEOLAR AXIS -THIGH ANGLE
REQUIRED EQUIPMENT
� Refer to section 13.3 .
PRE-TEST
� Mark the following reference points (Fig. 4.37):
� The line bisector of the thigh;
� Locate the anterior-posterior malleolar bisections and mark a line joining them across the plantar aspect of the heel. 10 This line approximates the TMA.
� Clinical suggestion*: In order to locate the center of the malleoli on the plantar aspect of the foot, a perpendicular line can be drawn from the malleoli bisections on each side of the foot. These two points are then connected on the plantar surface of the foot. This line approximates the transmalleolar axis (Fig. 4.37- line CD ).
* Note: this was not used by the authors of the study TEST
� Testing position, goniometer alignment and measurements are presented in Table 4.23.
� Results are compared to the normative reference values in Figure 4.39.
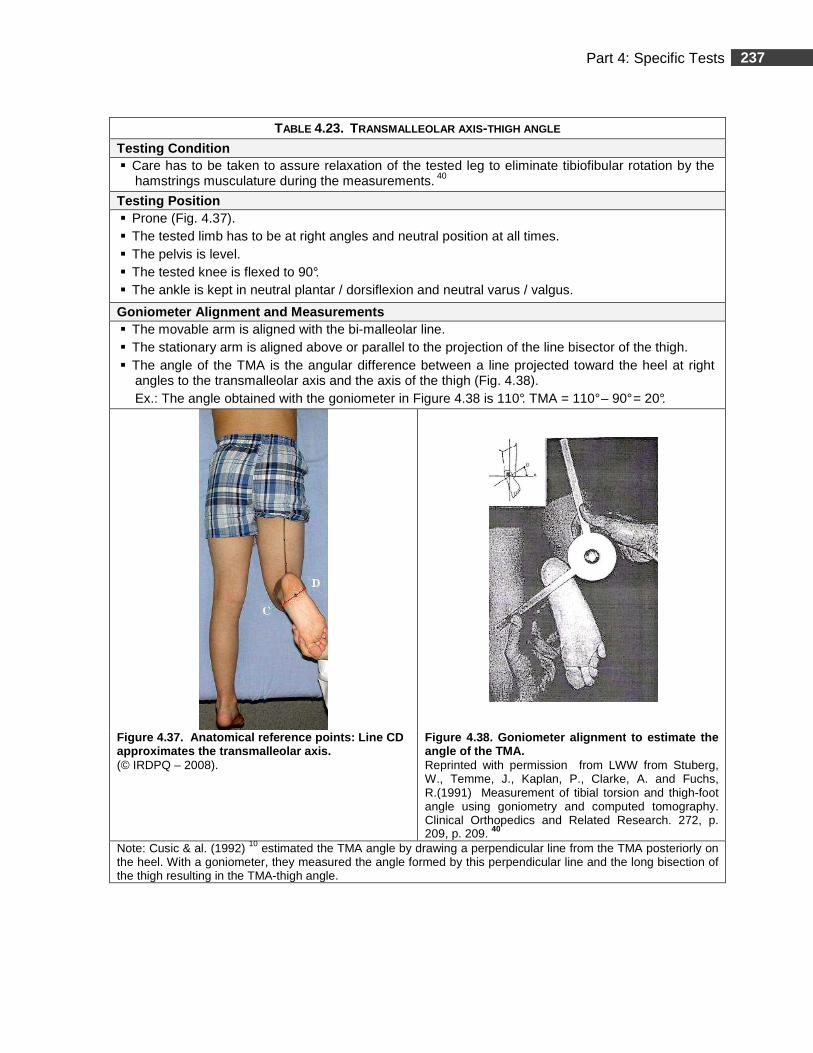
237 Part 4: Specific Tests
TABLE 4.23. TRANSMALLEOLAR AXIS -THIGH ANGLE
Testing Condition � Care has to be taken to assure relaxation of the tested leg to eliminate tibiofibular rotation by the
hamstrings musculature during the measurements. 40
Testing Position � Prone (Fig. 4.37). � The tested limb has to be at right angles and neutral position at all times. � The pelvis is level. � The tested knee is flexed to 90°. � The ankle is kept in neutral plantar / dorsiflexion and neutral varus / valgus.
Goniometer Alignment and Measurements � The movable arm is aligned with the bi-malleolar line. � The stationary arm is aligned above or parallel to the projection of the line bisector of the thigh. � The angle of the TMA is the angular difference between a line projected toward the heel at right
angles to the transmalleolar axis and the axis of the thigh (Fig. 4.38). Ex.: The angle obtained with the goniometer in Figure 4.38 is 110°. TMA = 110° – 90° = 20°.
Figure 4.37 . Anatomical reference points : Line CD approximates the transmalleolar axis. (© IRDPQ – 2008).
Figure 4.38. Goniometer alignment to estimate the angle of the TMA. Reprinted with permission from LWW from Stuberg, W., Temme, J., Kaplan, P., Clarke, A. and Fuchs, R.(1991) Measurement of tibial torsion and thigh-foot angle using goniometry and computed tomography. Clinical Orthopedics and Related Research. 272, p. 209, p. 209. 40
Note: Cusic & al. (1992) 10 estimated the TMA angle by drawing a perpendicular line from the TMA posteriorly on the heel. With a goniometer, they measured the angle formed by this perpendicular line and the long bisection of the thigh resulting in the TMA-thigh angle.
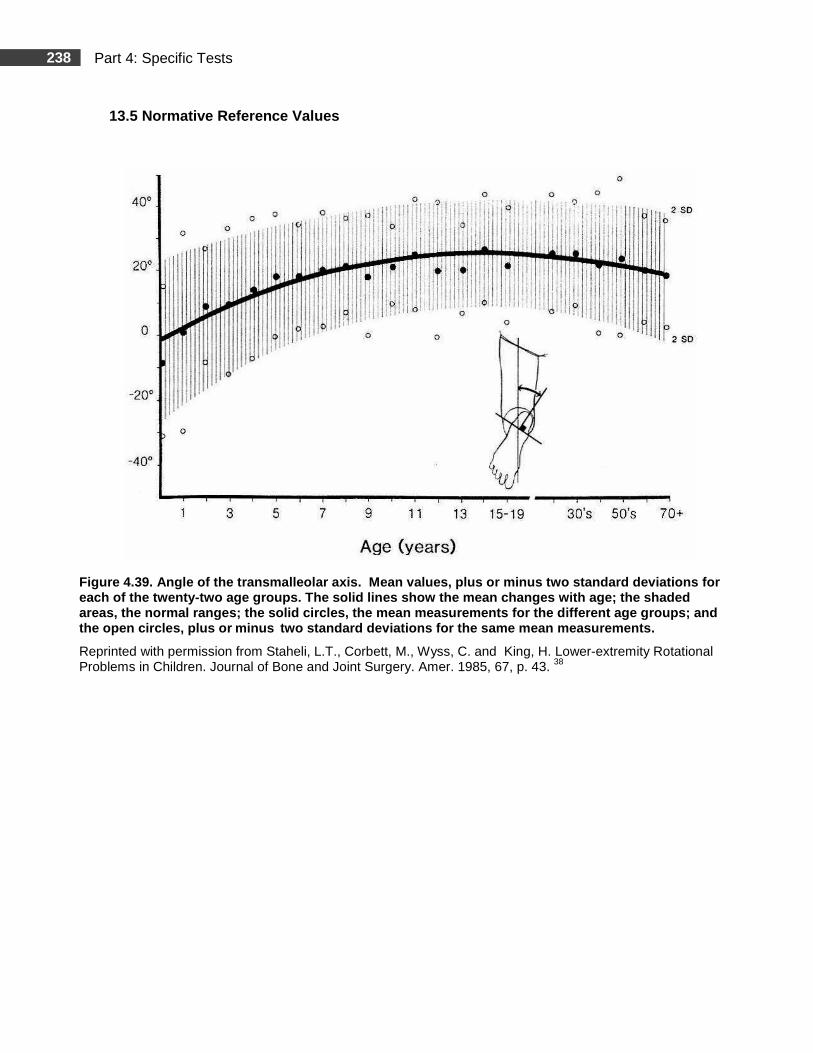
238 Part 4: Specific Tests
13.5 Normative Reference Values
Figure 4.39. Angle of the transmalleolar axis. Mea n values, plus or minus two standard deviations for each of the twenty-two age groups. The solid lines show the mean changes with age; the shaded areas, the normal ranges; the solid circles, the me an measurements for the different age groups; and the open circles, plus or minus two standard deviations for the same mean measureme nts.
Reprinted with permission from Staheli, L.T., Corbett, M., Wyss, C. and King, H. Lower-extremity Rotational Problems in Children. Journal of Bone and Joint Surgery. Amer. 1985, 67, p. 43. 38
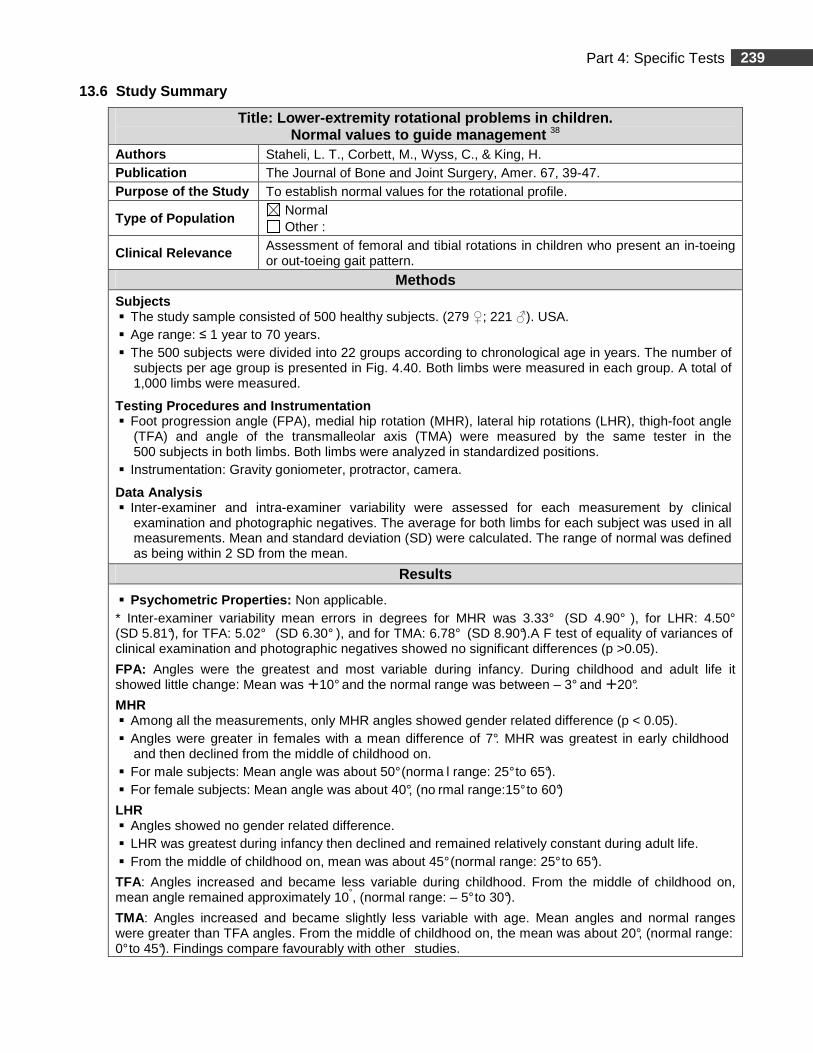
239 Part 4: Specific Tests
13.6 Study Summary
Title: Lower-extremity rotational problems in child ren. Normal values to guide management 38
Authors Staheli, L. T., Corbett, M., Wyss, C., & King, H. Publication The Journal of Bone and Joint Surgery, Amer. 67, 39-47. Purpose of the Study To establish normal values for the rotational profile.
Type of Population Normal Other :
Clinical Relevance Assessment of femoral and tibial rotations in children who present an in-toeing or out-toeing gait pattern.
Methods Subjects � The study sample consisted of 500 healthy subjects. (279 ♀; 221 ♂). USA. � Age range: ≤ 1 year to 70 years. � The 500 subjects were divided into 22 groups according to chronological age in years. The number of
subjects per age group is presented in Fig. 4.40. Both limbs were measured in each group. A total of 1,000 limbs were measured.
Testing Procedures and Instrumentation � Foot progression angle (FPA), medial hip rotation (MHR), lateral hip rotations (LHR), thigh-foot angle
(TFA) and angle of the transmalleolar axis (TMA) were measured by the same tester in the 500 subjects in both limbs. Both limbs were analyzed in standardized positions.
� Instrumentation: Gravity goniometer, protractor, camera.
Data Analysis � Inter-examiner and intra-examiner variability were assessed for each measurement by clinical
examination and photographic negatives. The average for both limbs for each subject was used in all measurements. Mean and standard deviation (SD) were calculated. The range of normal was defined as being within 2 SD from the mean.
Results
� Psychometric Properties: Non applicable. * Inter-examiner variability mean errors in degrees for MHR was 3.33° (SD 4.90° ), for LHR: 4.50°
(SD 5.81°), for TFA: 5.02° (SD 6.30° ), and for TMA: 6.78° (SD 8.90°).A F test of equality of variances of clinical examination and photographic negatives showed no significant differences (p >0.05).
FPA: Angles were the greatest and most variable during infancy. During childhood and adult life it showed little change: Mean was �10° and the normal range was between – 3° and �20°.
MHR � Among all the measurements, only MHR angles showed gender related difference (p < 0.05). � Angles were greater in females with a mean difference of 7°. MHR was greatest in early childhood
and then declined from the middle of childhood on. � For male subjects: Mean angle was about 50° (norma l range: 25° to 65°). � For female subjects: Mean angle was about 40°, (no rmal range:15° to 60°)
LHR � Angles showed no gender related difference. � LHR was greatest during infancy then declined and remained relatively constant during adult life. � From the middle of childhood on, mean was about 45° (normal range: 25° to 65°).
TFA: Angles increased and became less variable during childhood. From the middle of childhood on, mean angle remained approximately 10°, (normal range: – 5° to 30°).
TMA: Angles increased and became slightly less variable with age. Mean angles and normal ranges were greater than TFA angles. From the middle of childhood on, the mean was about 20°, (normal range: 0° to 45°). Findings compare favourably with other studies.
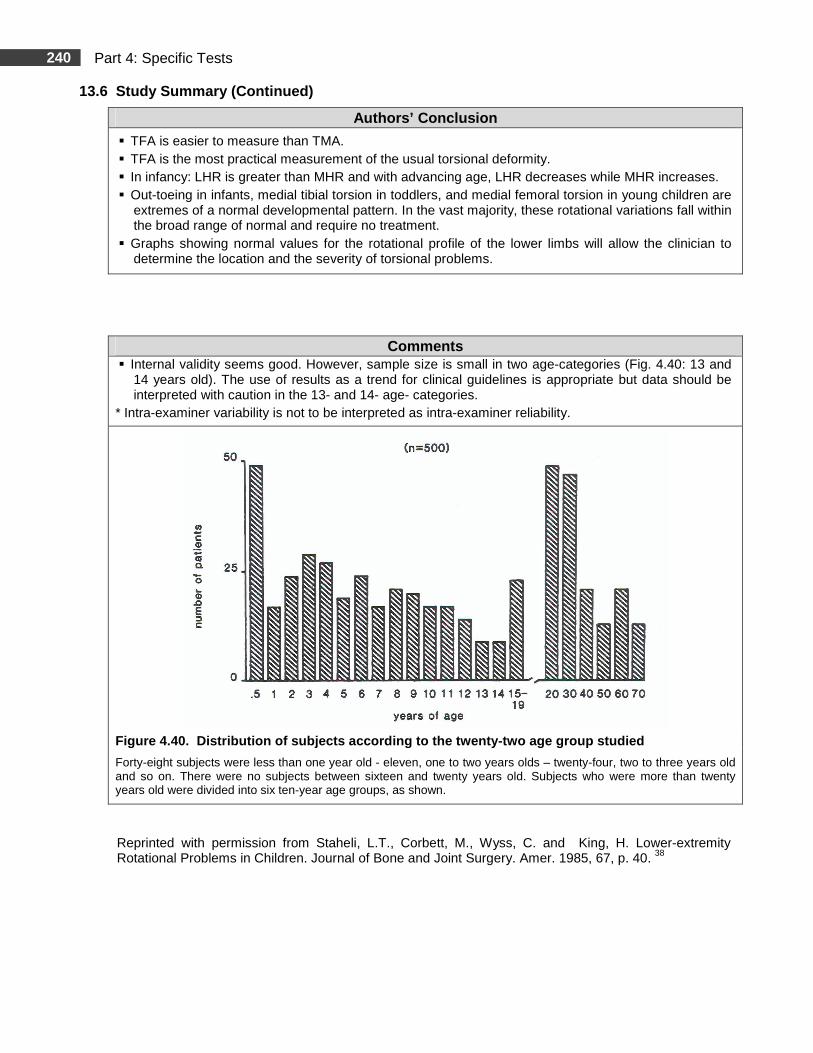
240 Part 4: Specific Tests
13.6 Study Summary (Continued)
Authors’ Conclusion
� TFA is easier to measure than TMA. � TFA is the most practical measurement of the usual torsional deformity. � In infancy: LHR is greater than MHR and with advancing age, LHR decreases while MHR increases. � Out-toeing in infants, medial tibial torsion in toddlers, and medial femoral torsion in young children are
extremes of a normal developmental pattern. In the vast majority, these rotational variations fall within the broad range of normal and require no treatment.
� Graphs showing normal values for the rotational profile of the lower limbs will allow the clinician to determine the location and the severity of torsional problems.
Comments � Internal validity seems good. However, sample size is small in two age-categories (Fig. 4.40: 13 and
14 years old). The use of results as a trend for clinical guidelines is appropriate but data should be interpreted with caution in the 13- and 14- age- categories.
* Intra-examiner variability is not to be interpreted as intra-examiner reliability.
Figure 4.40 . Distribution of subjects according to the twenty -two age group studied
Forty-eight subjects were less than one year old - eleven, one to two years olds – twenty-four, two to three years old and so on. There were no subjects between sixteen and twenty years old. Subjects who were more than twenty years old were divided into six ten-year age groups, as shown.
Reprinted with permission from Staheli, L.T., Corbett, M., Wyss, C. and King, H. Lower-extremity Rotational Problems in Children. Journal of Bone and Joint Surgery. Amer. 1985, 67, p. 40. 38
241 Part 4: Specific Tests
14. Forefoot Alignment: Metatarsus Adductus
14.1 Clinical Use
� The final step in the assessment of the child’s rotational profile is the foot evaluation verifying for metatarsus adductus.
� Metatarsus adductus is a source of in-toeing 10, 28 and is a factor to consider when proximal factors are normal. 10 Metatarsus adductus is characterized by adduction of the forefoot in relation to the hindfoot at the tarso-metatarsal joints. Some varus of the forefoot associated with the adduction may be observed, but the hindfoot or the heel is usually in the neutral position.
14.2 Measurement
� The assessment of metatarsus adductus (MA) is of a more subjective nature than the other rotational measurements and takes into account the long axis of the foot and the alignment of the forefoot.
� MA can be estimated by extrapolating a line bisecting the heel toward the toes (Fig. 4.41-B) or by analyzing footprints (Fig. 4.43).
14.3 Testing Procedures
REQUIRED EQUIPMENT
� Podograph (footprint mat) and paper.
� Hypoallergenic skin cosmetic crayon.
� Non-slip material.
PRE-TEST
� The non-slip material is placed under the podograph for safety reasons.
TEST
� Testing position and clinical evaluation are presented in Table 4.24.
� Classification of the degree of severity of MA is presented in Table 4.25.
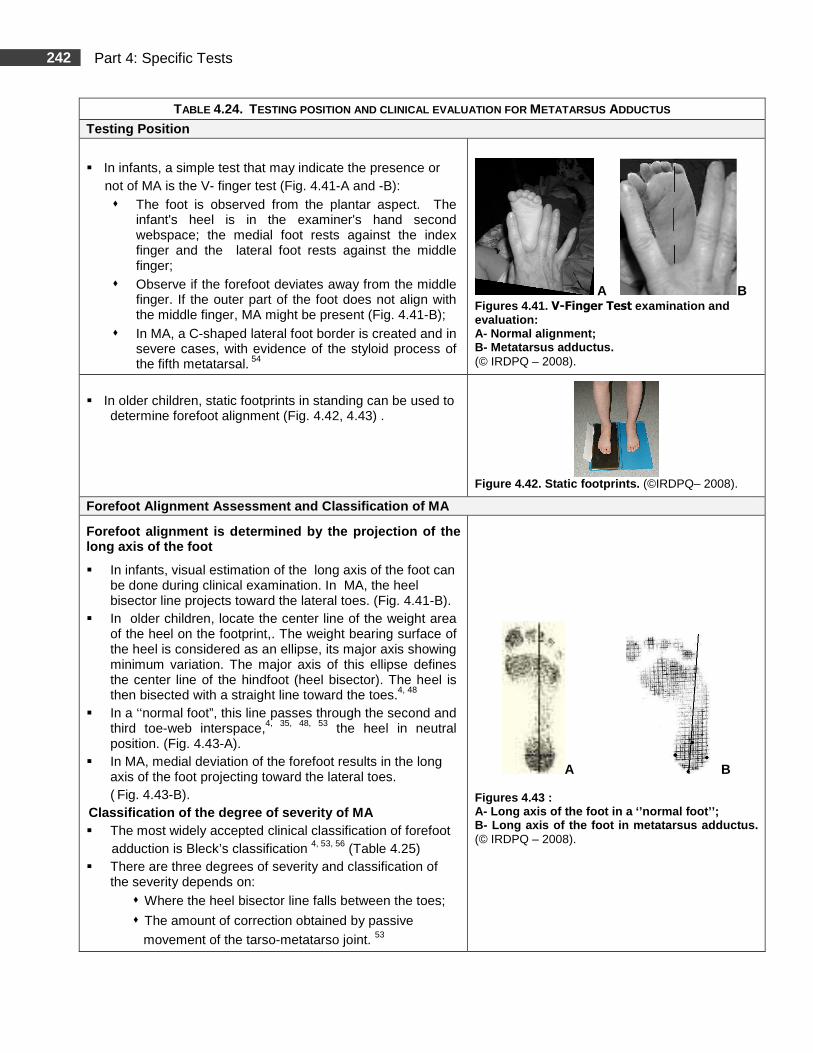
242 Part 4: Specific Tests
TABLE 4.24. TESTING POSITION AND CLINICAL EVALUATION FOR METATARSUS ADDUCTUS
Testing Position
� In infants, a simple test that may indicate the presence or not of MA is the V- finger test (Fig. 4.41-A and -B):
� The foot is observed from the plantar aspect. The infant's heel is in the examiner's hand second webspace; the medial foot rests against the index finger and the lateral foot rests against the middle finger;
� Observe if the forefoot deviates away from the middle finger. If the outer part of the foot does not align with the middle finger, MA might be present (Fig. 4.41-B);
� In MA, a C-shaped lateral foot border is created and in severe cases, with evidence of the styloid process of the fifth metatarsal. 54
A B Figures 4.41. V-Finger Test examination and evaluation: A- Normal alignment; B- Metatarsus adductus. (© IRDPQ – 2008).
� In older children, static footprints in standing can be used to
determine forefoot alignment (Fig. 4.42, 4.43) .
Figure 4.42. Static footprints. (©IRDPQ– 2008).
Forefoot Alignment Assessment and Classification of MA
Forefoot alignment is determined by the projection of the long axis of the foot
� In infants, visual estimation of the long axis of the foot can be done during clinical examination. In MA, the heel bisector line projects toward the lateral toes. (Fig. 4.41-B).
� In older children, locate the center line of the weight area of the heel on the footprint,. The weight bearing surface of the heel is considered as an ellipse, its major axis showing minimum variation. The major axis of this ellipse defines the center line of the hindfoot (heel bisector). The heel is then bisected with a straight line toward the toes.4, 48
� In a ‘‘normal foot”, this line passes through the second and third toe-web interspace,4, 35, 48, 53 the heel in neutral position. (Fig. 4.43-A).
� In MA, medial deviation of the forefoot results in the long axis of the foot projecting toward the lateral toes. ( Fig. 4.43-B).
Classification of the degree of severity of MA � The most widely accepted clinical classification of forefoot adduction is Bleck’s classification 4, 53, 56 (Table 4.25) � There are three degrees of severity and classification of
the severity depends on: � Where the heel bisector line falls between the toes;
� The amount of correction obtained by passive
movement of the tarso-metatarso joint. 53
A B Figures 4.43 : A- Long axis of the foot in a ‘’normal foot’’; B- Long axis of the foot in metatarsus adductus. (© IRDPQ – 2008).
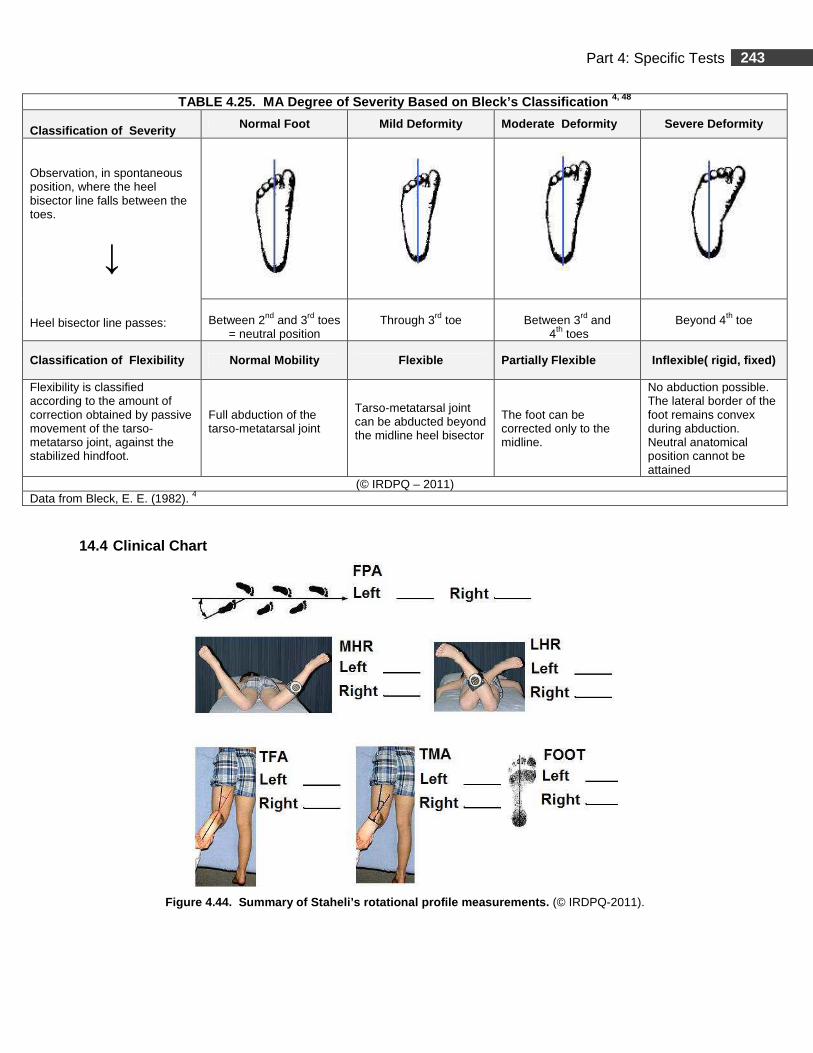
243 Part 4: Specific Tests
14.4 Clinical Chart
Figure 4.44. Summary of Staheli’s rotational profi le measurements. (© IRDPQ-2011).
TABLE 4.25. MA Degree of Severity Based on Bleck’s Classification 4, 48
Classification of Severity Normal Foot Mild Deformity Moderate Deformity Severe Deformity
Observation, in spontaneous position, where the heel bisector line falls between the toes.
↓ Heel bisector line passes:
Between 2nd and 3rd toes
= neutral position
Through 3rd toe
Between 3rd and
4th toes
Beyond 4th toe
Classification of Flexibility Normal Mobility Flexible Partially Flexible Inflexible( rigid, fixed)
Flexibility is classified according to the amount of correction obtained by passive movement of the tarso-metatarso joint, against the stabilized hindfoot.
Full abduction of the tarso-metatarsal joint
Tarso-metatarsal joint can be abducted beyond the midline heel bisector
The foot can be corrected only to the midline.
No abduction possible. The lateral border of the foot remains convex during abduction. Neutral anatomical position cannot be attained
(© IRDPQ – 2011) Data from Bleck, E. E. (1982). 4
244 Part 4: Specific Tests
Tibial Torsion
Summary
During the child’s normal development, the tibia will rotate externally to bring the foot into its normal position of 15°, abducted from the sagittal plane. A normal deg ree of tibial torsion is essential for normal foot function. A lack of tibial rotation or internal tibial torsion will cause in-toeing while an excessive tibial rotation, or external tibial torsion, will cause out-toeing. 42 Computed tomography (CT) is the gold standard for measurement of tibial torsion. 9 Clinically, tibial torsion can be estimated by measuring the transmallleolar axis (TMA). 39 , 42
Depending on which points of reference are used to measure tibial torsion, the recorded values will vary and are not directly comparable. 12 Two studies were selected to assess tibial torsion and both use a different technique:
� Staheli and Engel -1972 39 measured the TMA, with the knee in flexion, in children aged between 3 months and 13 years;
� Valmassy and Stanton -1989 42 measured the TMA, with the knee in extension, in children aged between 1 ½ years to 6 years.
15. Measurement of the Transmalleolar Axis Angle, K nee in Flexion 39
Age range: < 3months to 13 years. 15.1 Clinical Use
� The transmallleolar axis (TMA) or malleolar position is a measurement that indirectly assesses tibial torsion. 39, 42
� Provides a standard method to estimate the TMA and can be used if forefoot adduction is present.
� Clinically, it is mostly used in children presenting an out-toeing or in-toeing gait.
15.2 Measurements
� Testing position: sitting (Fig. 4.45). ( Note : Testing position for infants was not described by the authors).
� Anthropometric measurements:
� The difference between the malleoli in the sagittal plane in cm (Fig. 4.47);
� The width of the ankle in cm (inter-malleolar distance) (Fig. 4.48).
� A conversion grid is used to estimate the degrees of the TMA (Fig. 4.51).
� Expression of values:
� External tibial torsion is reported with a plus sign (+);
� Internal tibial torsion is reported with a minus sign (-).
15.3 Testing procedures
REQUIRED EQUIPMENT
� Calliper.
� Thin metallic ruler in cm increments.
� An elevated platform with a flat back wall (Fig. 4.45).
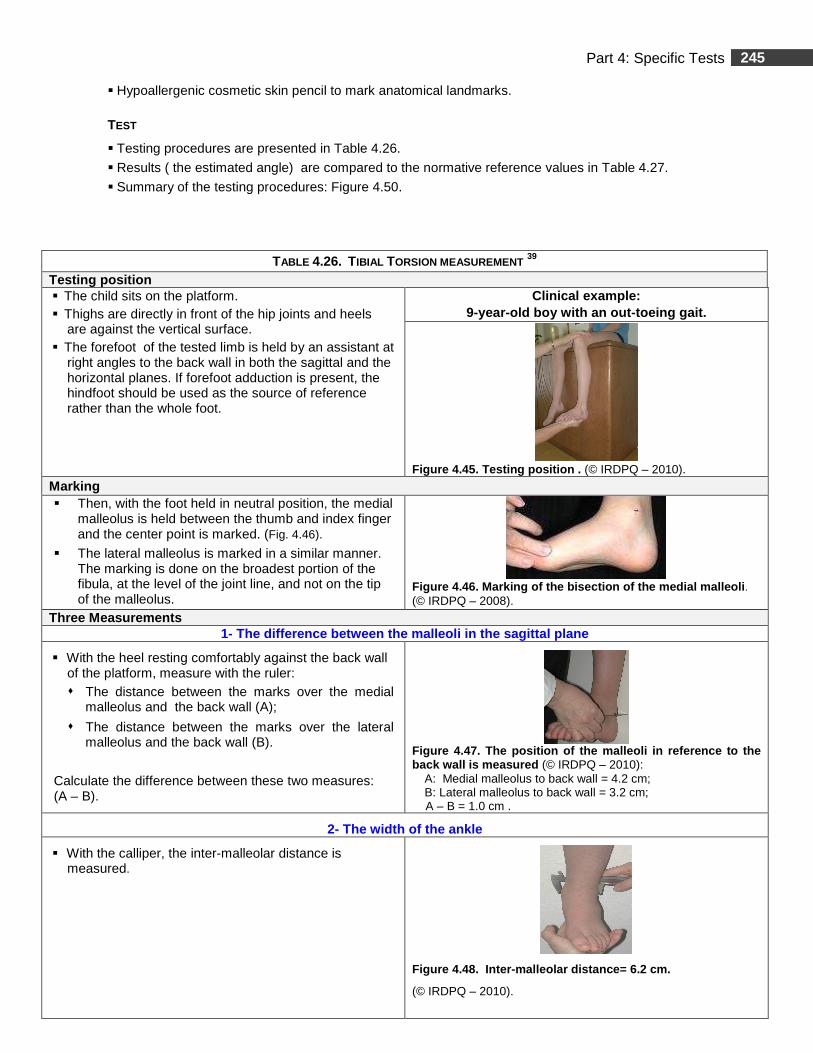
245 Part 4: Specific Tests
� Hypoallergenic cosmetic skin pencil to mark anatomical landmarks.
TEST
� Testing procedures are presented in Table 4.26.
� Results ( the estimated angle) are compared to the normative reference values in Table 4.27.
� Summary of the testing procedures: Figure 4.50.
TABLE 4.26. TIBIAL TORSION MEASUREMENT 39
Testing position � The child sits on the platform. � Thighs are directly in front of the hip joints and heels
are against the vertical surface. � The forefoot of the tested limb is held by an assistant at
right angles to the back wall in both the sagittal and the horizontal planes. If forefoot adduction is present, the hindfoot should be used as the source of reference rather than the whole foot.
Clinical example : 9-year-old boy with an out-toeing gait.
Figure 4.45. Testing position . (© IRDPQ – 2010).
Marking � Then, with the foot held in neutral position, the medial
malleolus is held between the thumb and index finger and the center point is marked. (Fig. 4.46).
� The lateral malleolus is marked in a similar manner. The marking is done on the broadest portion of the fibula, at the level of the joint line, and not on the tip of the malleolus.
Figure 4.46. Marking of the bisection of the medial malleoli . (© IRDPQ – 2008).
Three Measurements 1- The di fference between the malleoli in the sagittal plane
� With the heel resting comfortably against the back wall of the platform, measure with the ruler: � The distance between the marks over the medial
malleolus and the back wall (A);
� The distance between the marks over the lateral malleolus and the back wall (B).
Calculate the difference between these two measures: (A – B).
Figure 4.47. The position of the malleoli in refere nce to the back wall is measured (© IRDPQ – 2010):
A: Medial malleolus to back wall = 4.2 cm; B: Lateral malleolus to back wall = 3.2 cm;
A – B = 1.0 cm .
2- The width of the ankle
� With the calliper, the inter-malleolar distance is measured.
Figure 4.48. Inter-malleolar distance= 6.2 cm.
(© IRDPQ – 2010).
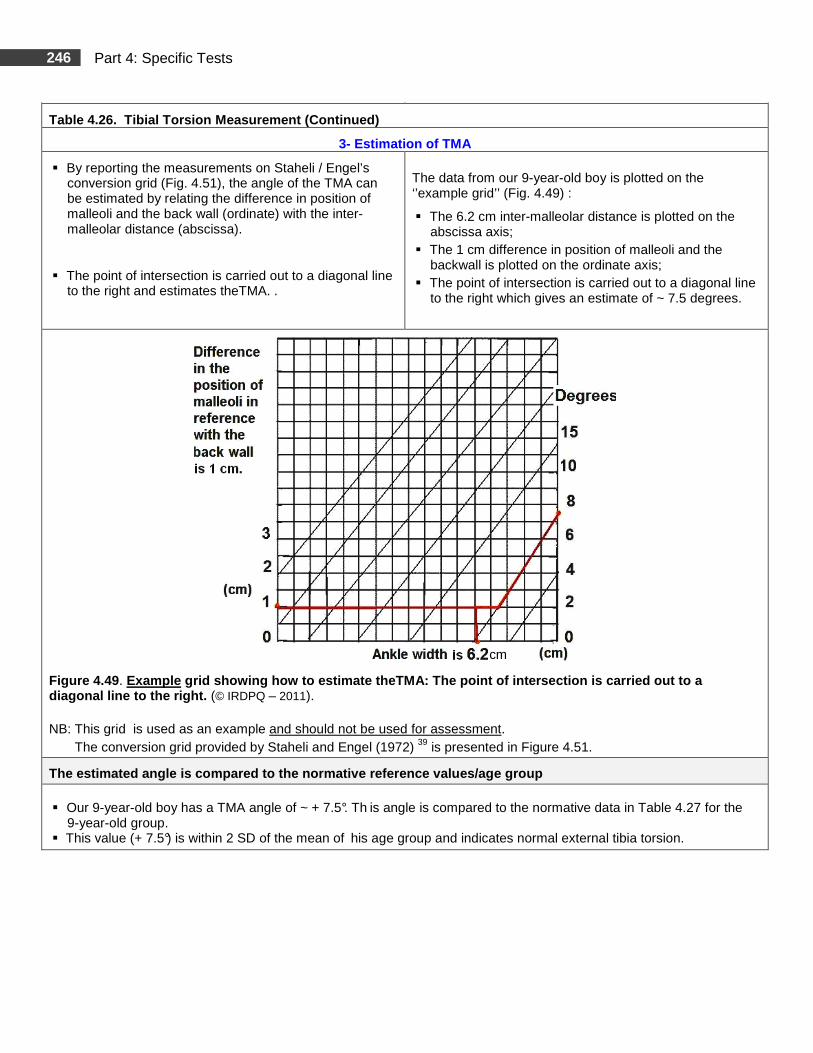
246 Part 4: Specific Tests
Table 4.26. Tibial Torsion Measurement (Continued)
3- Estimation of TMA
� By reporting the measurements on Staheli / Engel’s conversion grid (Fig. 4.51), the angle of the TMA can be estimated by relating the difference in position of malleoli and the back wall (ordinate) with the inter- malleolar distance (abscissa).
� The point of intersection is carried out to a diagonal line to the right and estimates theTMA. .
The data from our 9-year-old boy is plotted on the ‘’example grid’’ (Fig. 4.49) :
� The 6.2 cm inter-malleolar distance is plotted on the abscissa axis;
� The 1 cm difference in position of malleoli and the backwall is plotted on the ordinate axis;
� The point of intersection is carried out to a diagonal line to the right which gives an estimate of ~ 7.5 degrees.
Figure 4.49 . Example grid showing how to estimate theTMA: The po int of intersection is carried out to a diagonal line to the right. (© IRDPQ – 2011). NB: This grid is used as an example and should not be used for assessment. The conversion grid provided by Staheli and Engel (1972) 39 is presented in Figure 4.51.
The estimated angle is compared to the normative re ference values/age group � Our 9-year-old boy has a TMA angle of ~ + 7.5°. Th is angle is compared to the normative data in Table 4.27 for the
9-year-old group. � This value (+ 7.5°) is within 2 SD of the mean of his age group and indicates normal external tibia torsion.
cm
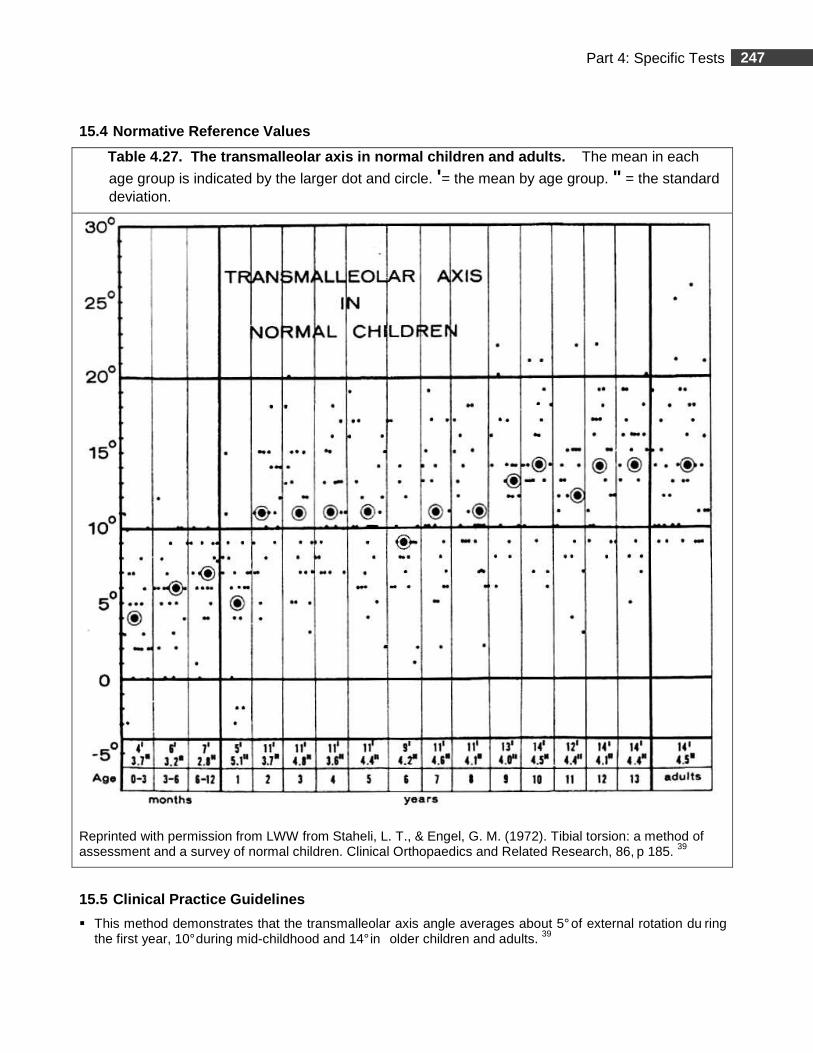
247 Part 4: Specific Tests
15.4 Normative Reference Values
Table 4.27. The transmalleolar a xis in normal children and adults. The mean in each
age group is indicated by the larger dot and circle. '= the mean by age group. " = the standard deviation.
Reprinted with permission from LWW from Staheli, L. T., & Engel, G. M. (1972). Tibial torsion: a method of assessment and a survey of normal children. Clinical Orthopaedics and Related Research, 86, p 185. 39
15.5 Clinical Practice Guidelines
� This method demonstrates that the transmalleolar axis angle averages about 5° of external rotation du ring the first year, 10° during mid-childhood and 14° in older children and adults. 39
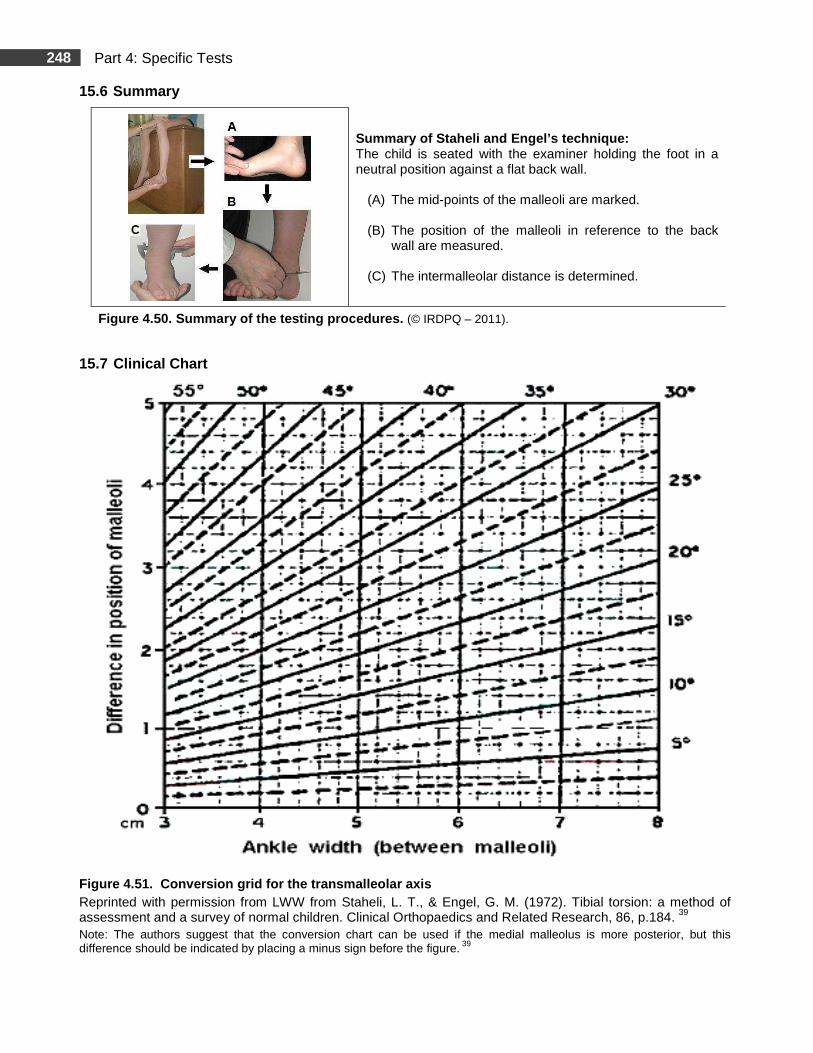
248 Part 4: Specific Tests
15.6 Summary
Summary of Staheli and Engel’s technique: The child is seated with the examiner holding the foot in a neutral position against a flat back wall.
(A) The mid-points of the malleoli are marked. (B) The position of the malleoli in reference to the back
wall are measured. (C) The intermalleolar distance is determined.
Figure 4.50. Summary of the testing procedures. (© IRDPQ – 2011).
15.7 Clinical Chart
Figure 4.51. Conversion grid for the transmalleola r axis
Reprinted with permission from LWW from Staheli, L. T., & Engel, G. M. (1972). Tibial torsion: a method of assessment and a survey of normal children. Clinical Orthopaedics and Related Research, 86, p.184. 39 Note: The authors suggest that the conversion chart can be used if the medial malleolus is more posterior, but this difference should be indicated by placing a minus sign before the figure. 39
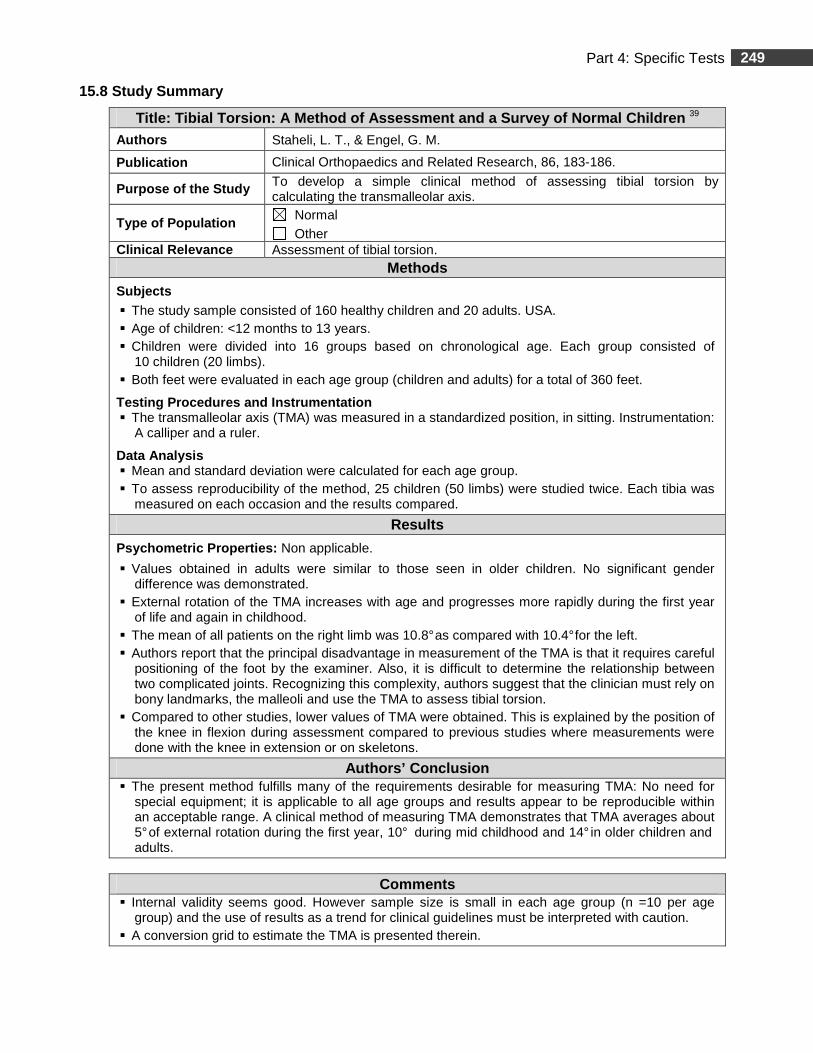
249 Part 4: Specific Tests
15.8 Study Summary
Title: Tibial Torsion: A Method of Assessment and a Survey of Normal Children 39 Authors Staheli, L. T., & Engel, G. M.
Publication Clinical Orthopaedics and Related Research, 86, 183-186.
Purpose of the Study To develop a simple clinical method of assessing tibial torsion by calculating the transmalleolar axis.
Type of Population Normal Other
Clinical R elevance Assessment of tibial torsion. Methods
Subjects � The study sample consisted of 160 healthy children and 20 adults. USA. � Age of children: <12 months to 13 years. � Children were divided into 16 groups based on chronological age. Each group consisted of
10 children (20 limbs). � Both feet were evaluated in each age group (children and adults) for a total of 360 feet.
Testing Procedures and Instrumentation � The transmalleolar axis (TMA) was measured in a standardized position, in sitting. Instrumentation:
A calliper and a ruler.
Data Analysis � Mean and standard deviation were calculated for each age group. � To assess reproducibility of the method, 25 children (50 limbs) were studied twice. Each tibia was
measured on each occasion and the results compared.
Results
Psychometric Properties: Non applicable.
� Values obtained in adults were similar to those seen in older children. No significant gender difference was demonstrated.
� External rotation of the TMA increases with age and progresses more rapidly during the first year of life and again in childhood.
� The mean of all patients on the right limb was 10.8° as compared with 10.4° for the left. � Authors report that the principal disadvantage in measurement of the TMA is that it requires careful
positioning of the foot by the examiner. Also, it is difficult to determine the relationship between two complicated joints. Recognizing this complexity, authors suggest that the clinician must rely on bony landmarks, the malleoli and use the TMA to assess tibial torsion.
� Compared to other studies, lower values of TMA were obtained. This is explained by the position of the knee in flexion during assessment compared to previous studies where measurements were done with the knee in extension or on skeletons.
Authors’ Conclusion � The present method fulfills many of the requirements desirable for measuring TMA: No need for
special equipment; it is applicable to all age groups and results appear to be reproducible within an acceptable range. A clinical method of measuring TMA demonstrates that TMA averages about 5° of external rotation during the first year, 10° during mid childhood and 14° in older children and adults.
Comments
� Internal validity seems good. However sample size is small in each age group (n =10 per age group) and the use of results as a trend for clinical guidelines must be interpreted with caution.
� A conversion grid to estimate the TMA is presented therein.
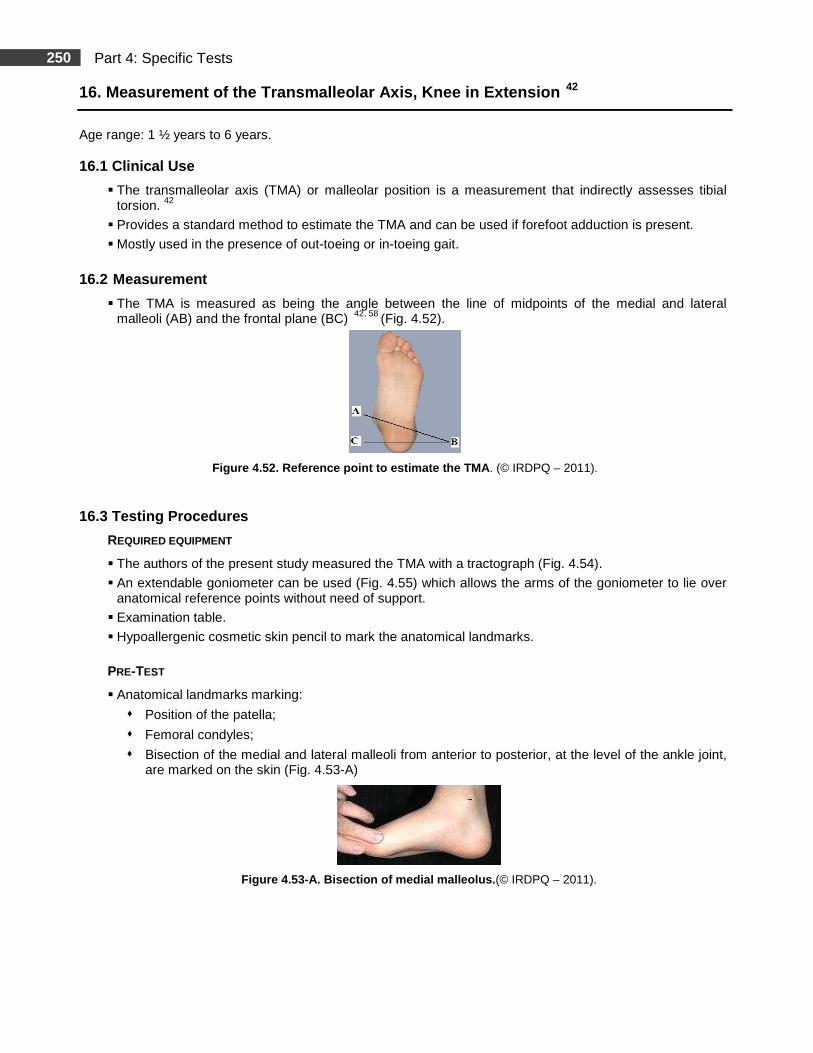
250 Part 4: Specific Tests
16. Measurement of the Transmalleolar Axis, Knee in Extension 42
Age range: 1 ½ years to 6 years. 16.1 Clinical Use
� The transmalleolar axis (TMA) or malleolar position is a measurement that indirectly assesses tibial torsion. 42
� Provides a standard method to estimate the TMA and can be used if forefoot adduction is present.
� Mostly used in the presence of out-toeing or in-toeing gait.
16.2 Measurement
� The TMA is measured as being the angle between the line of midpoints of the medial and lateral malleoli (AB) and the frontal plane (BC) 42, 58 (Fig. 4.52).
Figure 4.52. Reference point to estimate the TMA . (© IRDPQ – 2011).
16.3 Testing Procedures
REQUIRED EQUIPMENT
� The authors of the present study measured the TMA with a tractograph (Fig. 4.54).
� An extendable goniometer can be used (Fig. 4.55) which allows the arms of the goniometer to lie over anatomical reference points without need of support.
� Examination table. � Hypoallergenic cosmetic skin pencil to mark the anatomical landmarks.
PRE-TEST
� Anatomical landmarks marking:
� Position of the patella;
� Femoral condyles;
� Bisection of the medial and lateral malleoli from anterior to posterior, at the level of the ankle joint, are marked on the skin (Fig. 4.53-A)
Figure 4.53-A. Bisection of medial malleolus. (© IRDPQ – 2011).
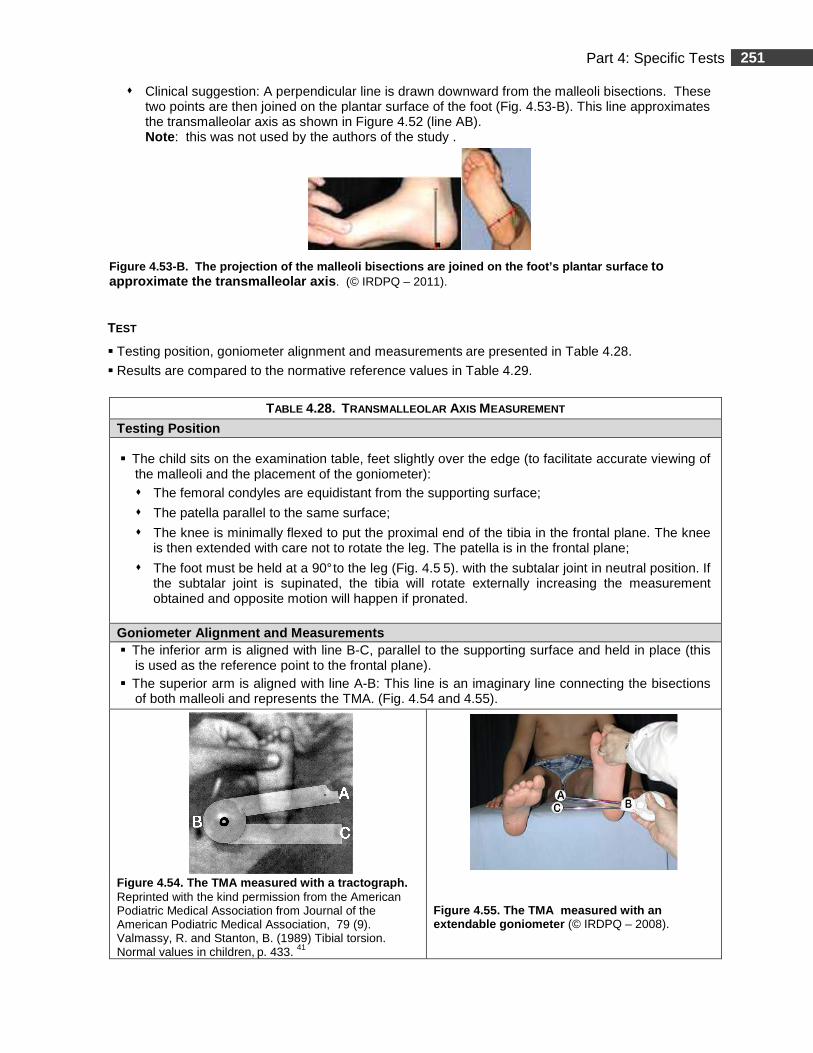
251 Part 4: Specific Tests
� Clinical suggestion: A perpendicular line is drawn downward from the malleoli bisections. These two points are then joined on the plantar surface of the foot (Fig. 4.53-B). This line approximates the transmalleolar axis as shown in Figure 4.52 (line AB). Note : this was not used by the authors of the study .
Figure 4.53-B. The projection of the malleoli bise ctions are joined on the foot’s plantar surface to approximate the transmalleolar axis . (© IRDPQ – 2011).
TEST
� Testing position, goniometer alignment and measurements are presented in Table 4.28.
� Results are compared to the normative reference values in Table 4.29.
TABLE 4.28. TRANSMALLEOLAR AXIS MEASUREMENT
Testing Position
� The child sits on the examination table, feet slightly over the edge (to facilitate accurate viewing of the malleoli and the placement of the goniometer): � The femoral condyles are equidistant from the supporting surface;
� The patella parallel to the same surface;
� The knee is minimally flexed to put the proximal end of the tibia in the frontal plane. The knee is then extended with care not to rotate the leg. The patella is in the frontal plane;
� The foot must be held at a 90° to the leg (Fig. 4.5 5). with the subtalar joint in neutral position. If the subtalar joint is supinated, the tibia will rotate externally increasing the measurement obtained and opposite motion will happen if pronated.
Goniometer Alignment and Measurements � The inferior arm is aligned with line B-C, parallel to the supporting surface and held in place (this
is used as the reference point to the frontal plane). � The superior arm is aligned with line A-B: This line is an imaginary line connecting the bisections
of both malleoli and represents the TMA. (Fig. 4.54 and 4.55).
Figure 4.54. The TMA measured with a tractograph. Reprinted with the kind permission from the American Podiatric Medical Association from Journal of the American Podiatric Medical Association, 79 (9). Valmassy, R. and Stanton, B. (1989) Tibial torsion. Normal values in children, p. 433. 41
Figure 4.55. The TMA measured with an extendable goniometer (© IRDPQ – 2008).
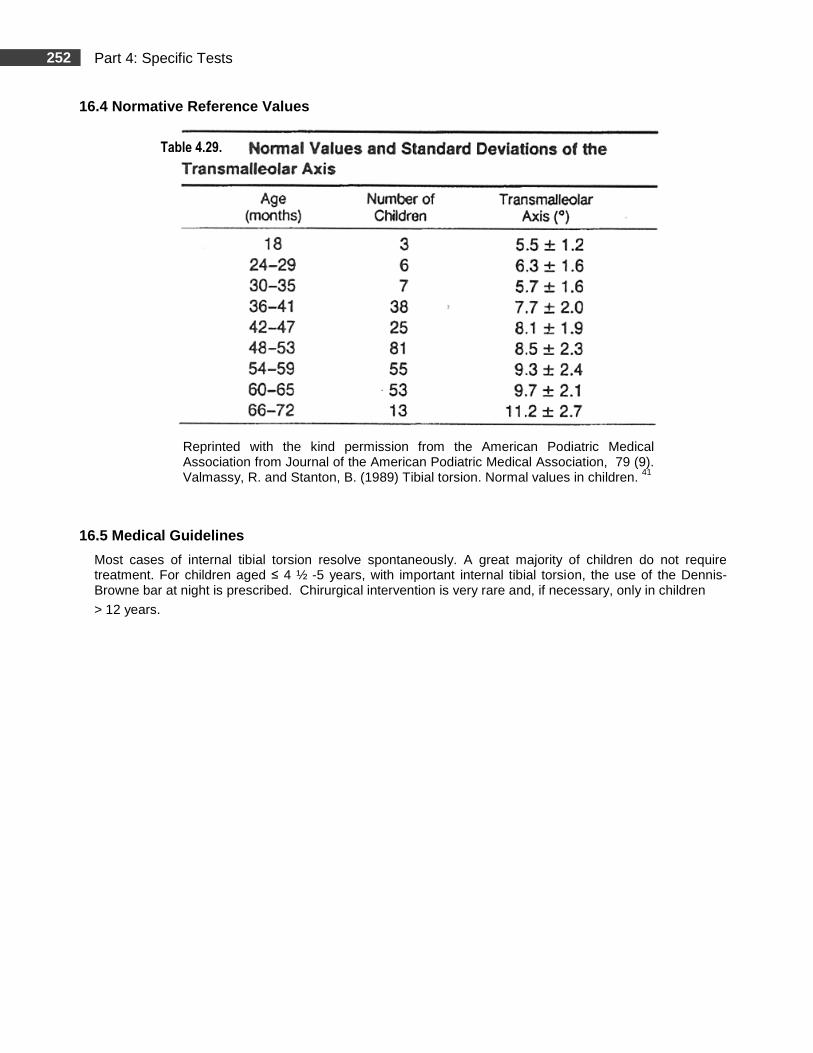
252 Part 4: Specific Tests
16.4 Normative Reference Values
Reprinted with the kind permission from the American Podiatric Medical Association from Journal of the American Podiatric Medical Association, 79 (9). Valmassy, R. and Stanton, B. (1989) Tibial torsion. Normal values in children. 41
16.5 Medical Guidelines
Most cases of internal tibial torsion resolve spontaneously. A great majority of children do not require treatment. For children aged ≤ 4 ½ -5 years, with important internal tibial torsion, the use of the Dennis-Browne bar at night is prescribed. Chirurgical intervention is very rare and, if necessary, only in children
> 12 years.
Table 4.29.
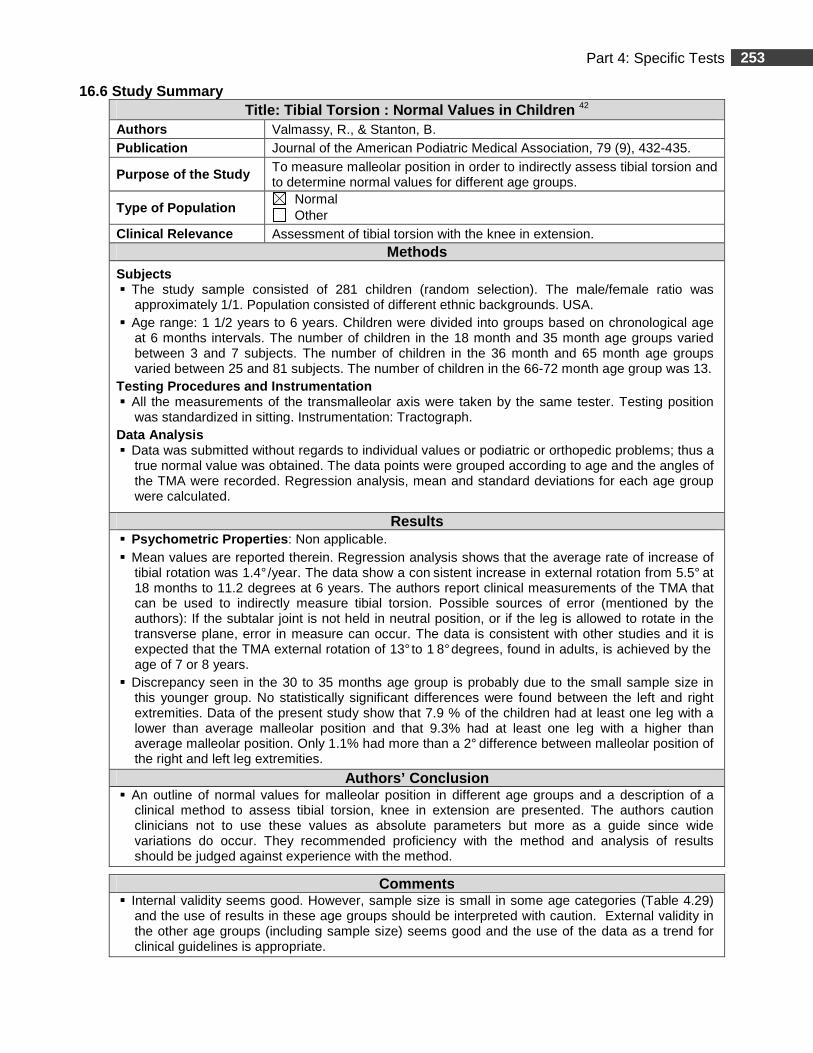
253 Part 4: Specific Tests
16.6 Study Summary Title: Tibial Torsion : Normal Values in Children 42
Authors Valmassy, R., & Stanton, B. Publication Journal of the American Podiatric Medical Association, 79 (9), 432-435.
Purpose of the Study To measure malleolar position in order to indirectly assess tibial torsion and to determine normal values for different age groups.
Type of Population Normal Other
Clinical Relevance Assessment of tibial torsion with the knee in extension. Methods
Subjects � The study sample consisted of 281 children (random selection). The male/female ratio was
approximately 1/1. Population consisted of different ethnic backgrounds. USA. � Age range: 1 1/2 years to 6 years. Children were divided into groups based on chronological age
at 6 months intervals. The number of children in the 18 month and 35 month age groups varied between 3 and 7 subjects. The number of children in the 36 month and 65 month age groups varied between 25 and 81 subjects. The number of children in the 66-72 month age group was 13.
Testing Procedures and Instrumentation � All the measurements of the transmalleolar axis were taken by the same tester. Testing position
was standardized in sitting. Instrumentation: Tractograph. Data Analysis � Data was submitted without regards to individual values or podiatric or orthopedic problems; thus a
true normal value was obtained. The data points were grouped according to age and the angles of the TMA were recorded. Regression analysis, mean and standard deviations for each age group were calculated.
Results � Psychometric Properties : Non applicable. � Mean values are reported therein. Regression analysis shows that the average rate of increase of
tibial rotation was 1.4° /year. The data show a con sistent increase in external rotation from 5.5° at 18 months to 11.2 degrees at 6 years. The authors report clinical measurements of the TMA that can be used to indirectly measure tibial torsion. Possible sources of error (mentioned by the authors): If the subtalar joint is not held in neutral position, or if the leg is allowed to rotate in the transverse plane, error in measure can occur. The data is consistent with other studies and it is expected that the TMA external rotation of 13° to 1 8° degrees, found in adults, is achieved by the age of 7 or 8 years.
� Discrepancy seen in the 30 to 35 months age group is probably due to the small sample size in this younger group. No statistically significant differences were found between the left and right extremities. Data of the present study show that 7.9 % of the children had at least one leg with a lower than average malleolar position and that 9.3% had at least one leg with a higher than average malleolar position. Only 1.1% had more than a 2° difference between malleolar position of the right and left leg extremities.
Authors’ Conclusion � An outline of normal values for malleolar position in different age groups and a description of a
clinical method to assess tibial torsion, knee in extension are presented. The authors caution clinicians not to use these values as absolute parameters but more as a guide since wide variations do occur. They recommended proficiency with the method and analysis of results should be judged against experience with the method.
Comments � Internal validity seems good. However, sample size is small in some age categories (Table 4.29)
and the use of results in these age groups should be interpreted with caution. External validity in the other age groups (including sample size) seems good and the use of the data as a trend for clinical guidelines is appropriate.
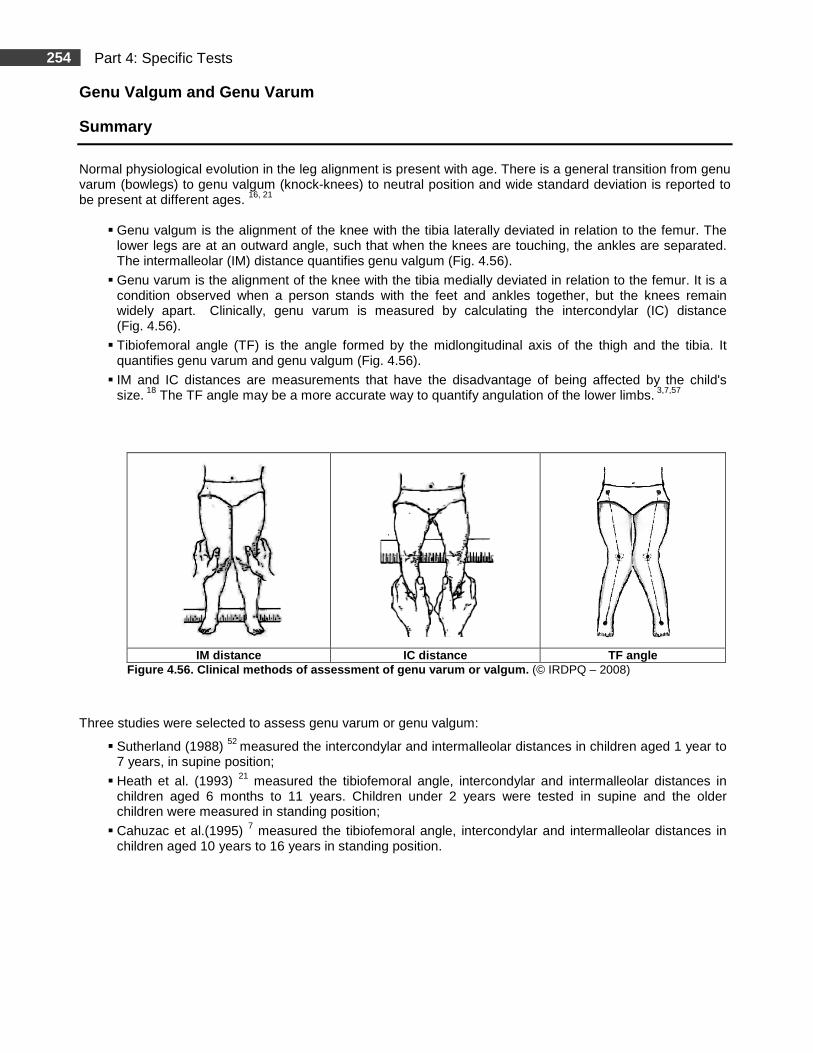
254 Part 4: Specific Tests
Genu Valgum and Genu Varum
Summary
Normal physiological evolution in the leg alignment is present with age. There is a general transition from genu varum (bowlegs) to genu valgum (knock-knees) to neutral position and wide standard deviation is reported to be present at different ages. 16, 21
� Genu valgum is the alignment of the knee with the tibia laterally deviated in relation to the femur. The lower legs are at an outward angle, such that when the knees are touching, the ankles are separated. The intermalleolar (IM) distance quantifies genu valgum (Fig. 4.56).
� Genu varum is the alignment of the knee with the tibia medially deviated in relation to the femur. It is a condition observed when a person stands with the feet and ankles together, but the knees remain widely apart. Clinically, genu varum is measured by calculating the intercondylar (IC) distance (Fig. 4.56).
� Tibiofemoral angle (TF) is the angle formed by the midlongitudinal axis of the thigh and the tibia. It quantifies genu varum and genu valgum (Fig. 4.56).
� IM and IC distances are measurements that have the disadvantage of being affected by the child's size. 18 The TF angle may be a more accurate way to quantify angulation of the lower limbs. 3,7,57
IM distance IC distance TF angle
Figure 4.56. Clinical methods of assessment of genu varum or valgum. (© IRDPQ – 2008)
Three studies were selected to assess genu varum or genu valgum:
� Sutherland (1988) 52 measured the intercondylar and intermalleolar distances in children aged 1 year to 7 years, in supine position;
� Heath et al. (1993) 21 measured the tibiofemoral angle, intercondylar and intermalleolar distances in children aged 6 months to 11 years. Children under 2 years were tested in supine and the older children were measured in standing position;
� Cahuzac et al.(1995) 7 measured the tibiofemoral angle, intercondylar and intermalleolar distances in children aged 10 years to 16 years in standing position.
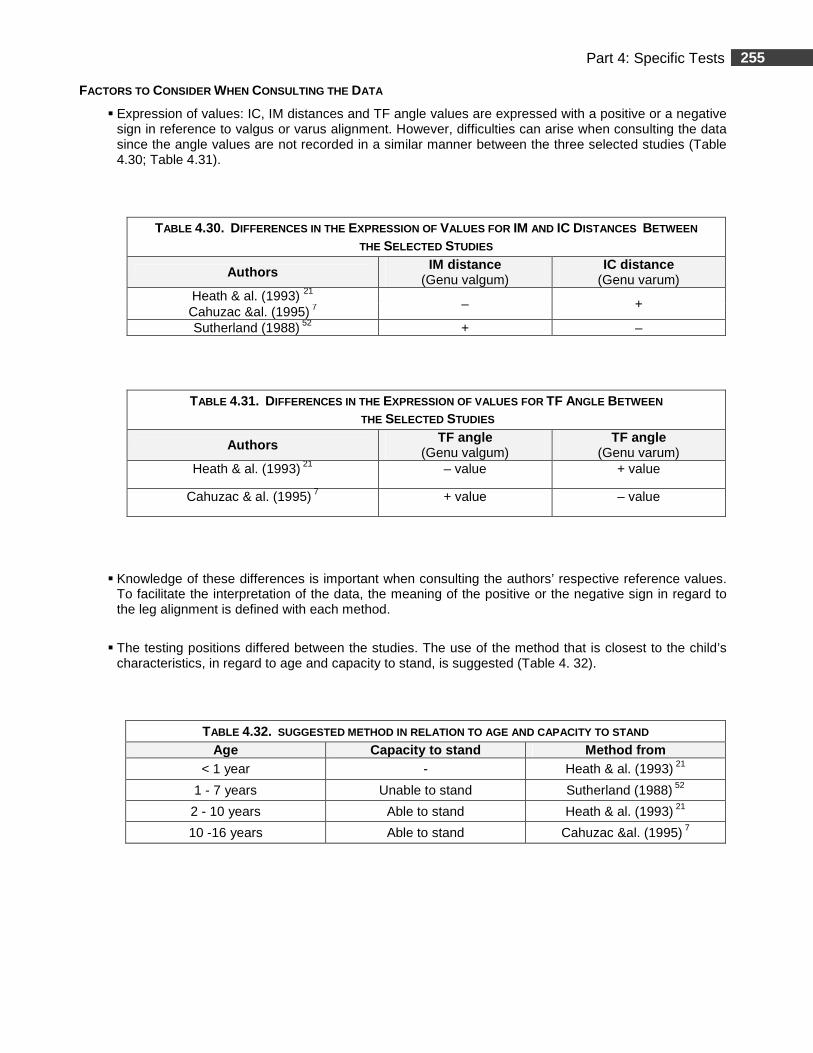
255 Part 4: Specific Tests
FACTORS TO CONSIDER WHEN CONSULTING THE DATA
� Expression of values: IC, IM distances and TF angle values are expressed with a positive or a negative sign in reference to valgus or varus alignment. However, difficulties can arise when consulting the data since the angle values are not recorded in a similar manner between the three selected studies (Table 4.30; Table 4.31).
TABLE 4.30. DIFFERENCES IN THE EXPRESSION OF VALUES FOR IM AND IC DISTANCES BETWEEN THE SELECTED STUDIES
Authors IM distance (Genu valgum)
IC dist ance (Genu varum)
Heath & al. (1993) 21 – +
Cahuzac &al. (1995) 7 Sutherland (1988) 52 + –
TABLE 4.31. DIFFERENCES IN THE EXPRESSION OF VALUES FOR TF ANGLE BETWEEN THE SELECTED STUDIES
Authors TF angle (Genu valgum)
TF angle (Genu varum)
Heath & al. (1993) 21 – value + value
Cahuzac & al. (1995) 7 + value – value
� Knowledge of these differences is important when consulting the authors’ respective reference values. To facilitate the interpretation of the data, the meaning of the positive or the negative sign in regard to the leg alignment is defined with each method.
� The testing positions differed between the studies. The use of the method that is closest to the child’s characteristics, in regard to age and capacity to stand, is suggested (Table 4. 32).
TABLE 4.32. SUGGESTED METHOD IN RELATION TO AGE AND CAPACITY TO STAND Age Capacity to stand Method from
< 1 year - Heath & al. (1993) 21
1 - 7 years Unable to stand Sutherland (1988) 52
2 - 10 years Able to stand Heath & al. (1993) 21
10 -16 years Able to stand Cahuzac &al. (1995) 7
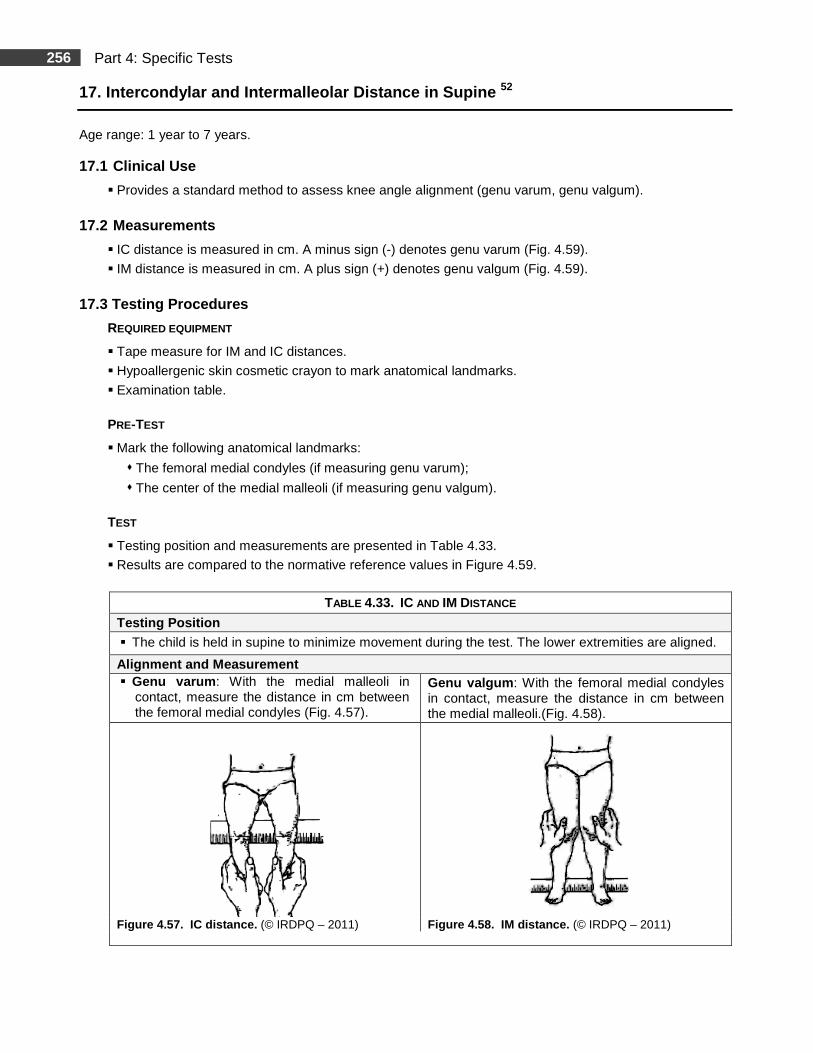
256 Part 4: Specific Tests
17. Intercondylar and Intermalleolar Distance in Su pine 52
Age range: 1 year to 7 years. 17.1 Clinical Use
� Provides a standard method to assess knee angle alignment (genu varum, genu valgum).
17.2 Measurements
� IC distance is measured in cm. A minus sign (-) denotes genu varum (Fig. 4.59).
� IM distance is measured in cm. A plus sign (+) denotes genu valgum (Fig. 4.59).
17.3 Testing Procedures
REQUIRED EQUIPMENT
� Tape measure for IM and IC distances.
� Hypoallergenic skin cosmetic crayon to mark anatomical landmarks.
� Examination table.
PRE-TEST
� Mark the following anatomical landmarks:
� The femoral medial condyles (if measuring genu varum);
� The center of the medial malleoli (if measuring genu valgum).
TEST
� Testing position and measurements are presented in Table 4.33.
� Results are compared to the normative reference values in Figure 4.59.
TABLE 4.33. IC AND IM DISTANCE
Testing Position
� The child is held in supine to minimize movement during the test. The lower extremities are aligned.
Alignment and Measurement � Genu varum : With the medial malleoli in
contact, measure the distance in cm between the femoral medial condyles (Fig. 4.57).
Genu valgum : With the femoral medial condyles in contact, measure the distance in cm between the medial malleoli.(Fig. 4.58).
Figure 4.57. IC distance . (© IRDPQ – 2011) Figure 4.58. IM distance. (© IRDPQ – 2011)
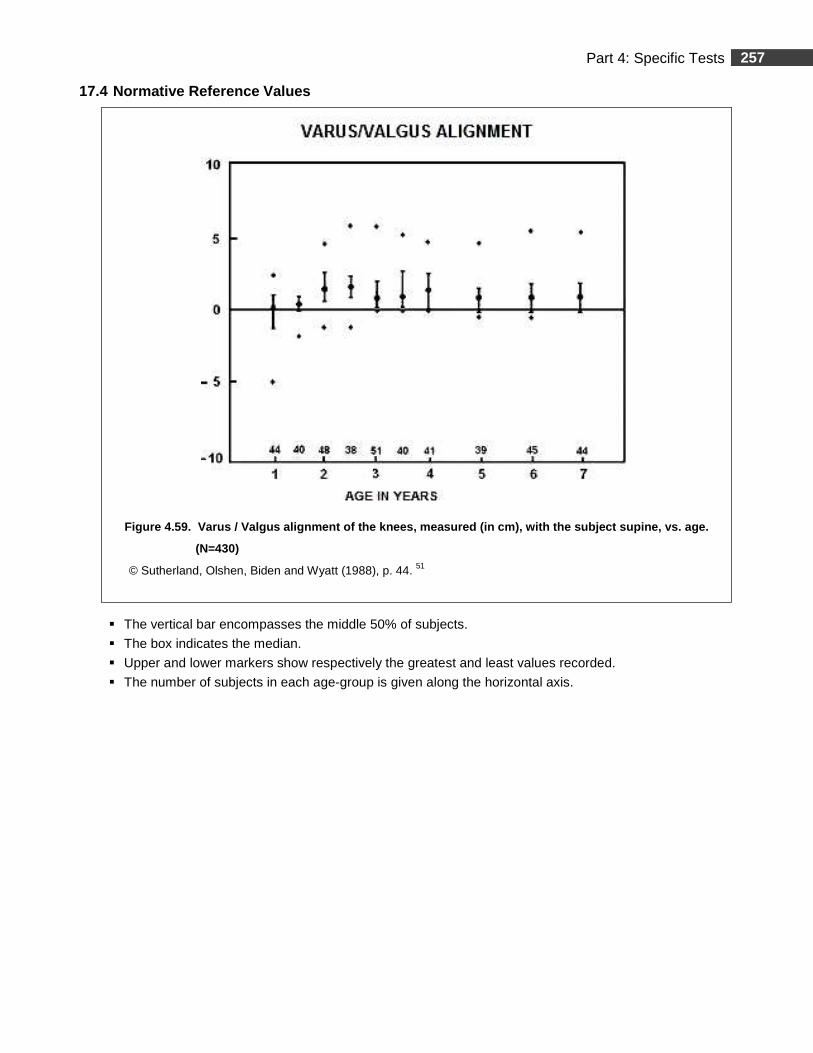
257 Part 4: Specific Tests
17.4 Normative Reference Values
Figure 4.59. Varus / Valgus alignment of the knees , measured (in cm), with the subject supine, vs . age.
(N=430)
© Sutherland, Olshen, Biden and Wyatt (1988), p. 44. 51
� The vertical bar encompasses the middle 50% of subjects.
� The box indicates the median.
� Upper and lower markers show respectively the greatest and least values recorded.
� The number of subjects in each age-group is given along the horizontal axis.
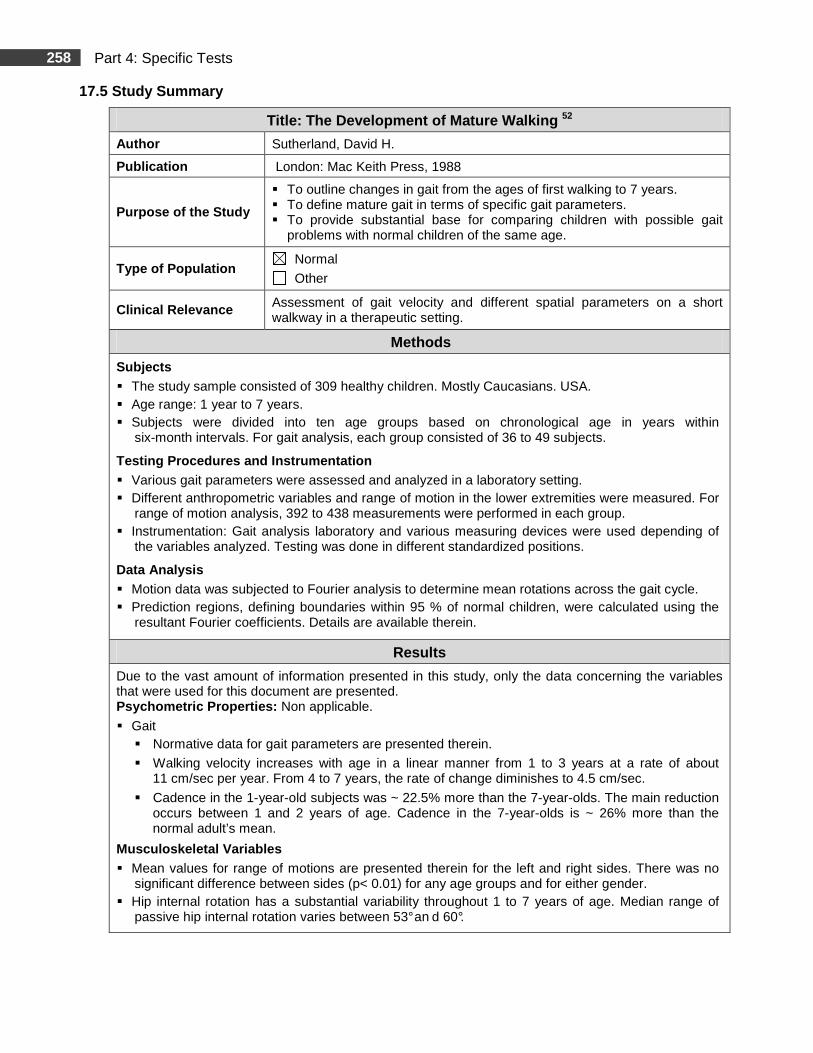
258 Part 4: Specific Tests
17.5 Study Summary
Title: The Development of Mature Walking 52
Author Sutherland, David H.
Publication London: Mac Keith Press, 1988
Purpose of the Study
� To outline changes in gait from the ages of first walking to 7 years. � To define mature gait in terms of specific gait parameters. � To provide substantial base for comparing children with possible gait
problems with normal children of the same age.
Type of Population Normal
Other
Clinical Relevance Assessment of gait velocity and different spatial parameters on a short walkway in a therapeutic setting.
Methods
Subjects � The study sample consisted of 309 healthy children. Mostly Caucasians. USA. � Age range: 1 year to 7 years. � Subjects were divided into ten age groups based on chronological age in years within
six-month intervals. For gait analysis, each group consisted of 36 to 49 subjects.
Testing Procedures and Instrumentation � Various gait parameters were assessed and analyzed in a laboratory setting. � Different anthropometric variables and range of motion in the lower extremities were measured. For
range of motion analysis, 392 to 438 measurements were performed in each group. � Instrumentation: Gait analysis laboratory and various measuring devices were used depending of
the variables analyzed. Testing was done in different standardized positions.
Data Analysis
� Motion data was subjected to Fourier analysis to determine mean rotations across the gait cycle. � Prediction regions, defining boundaries within 95 % of normal children, were calculated using the
resultant Fourier coefficients. Details are available therein.
Results
Due to the vast amount of information presented in this study, only the data concerning the variables that were used for this document are presented. Psychometric Properties: Non applicable.
� Gait � Normative data for gait parameters are presented therein.
� Walking velocity increases with age in a linear manner from 1 to 3 years at a rate of about 11 cm/sec per year. From 4 to 7 years, the rate of change diminishes to 4.5 cm/sec.
� Cadence in the 1-year-old subjects was ~ 22.5% more than the 7-year-olds. The main reduction occurs between 1 and 2 years of age. Cadence in the 7-year-olds is ~ 26% more than the normal adult’s mean.
Musculoskeletal Variables
� Mean values for range of motions are presented therein for the left and right sides. There was no significant difference between sides (p< 0.01) for any age groups and for either gender.
� Hip internal rotation has a substantial variability throughout 1 to 7 years of age. Median range of passive hip internal rotation varies between 53° an d 60°.
259 Part 4: Specific Tests
17.5 Study Summary (Continued)
Results (Continued)
� Median range of hip adduction throughout 1 year to 7 years was 20°. � Hip abduction at 1 year shows a median range of passive hip abduction of 55°. At 7 years, the
median range of passive hip abduction has gradually diminished to 45°. � At 7 years, the straight leg raise test exceeded range of motion of most adults. � Ankle dorsiflexion, straight leg raise test, hip abduction and external rotation gradually decreased
with age. Dorsiflexion, from 1 year to 7 years, shows a significant decline with increasing age, from 25° at 1 year to 15° at 7 years. At 1 year, hip ext ernal rotation is greater than hip internal rotation. At 2 ½ years, hip internal rotation is greater than hip external rotation.
� Complete extension of the hip to 10° across all ag e-groups is in disagreement with other authors. � The greatest spread of data in normal children for femoro-tibial alignment was in the direction of
valgus. Results show similar trends as other studies but with greater variability and may be due to different measurement methods such as X rays versus clinical measurements.
� Finfings are consistent with other studies but some discrepancy exists with others which may be explained by the much larger sample size of the present study, the use of a permanent laboratory setting and in the assessment of free-speed gait.
Authors’ Conclusion
Normative data for gait parameters, anthropometric and musculoskeletal measurements are available for normal children aged from 1 to 7 years. The ranges of motion are to be used as guidelines. The authors report that it would be unwise to label a child abnormal if he shows minor deviations from the presented values.
Comments
Internal and external validity (including sample size, n = 36 to 49 per age group) seems good and the use of results as a trend for clinical guidelines is appropriate.
260 Part 4: Specific Tests
18. Tibiofemoral Angle, Intercondylar and Intermall eolar Distances in Supine and Standing 21
Age range: 6 months to 11 years. 18.1 Clinical Use
� Provides a standard method to assess knee angle alignment (genu varum, genu valgum).
18.2 Measurements
� TF angle is measured in degrees (Fig. 4.63).
� A minus sign (-) denotes a valgus angle.
� A plus sign (+) denotes a varus angle.
� IC distance is measured in cm. A plus sign (+) denotes genu varum (Fig. 4.63).
� IM distance is measured in cm. A minus sign (-) denotes genu valgum (Fig. 4.63).
18.3 Testing Procedures
REQUIRED EQUIPMENT
� Tape measure for IM and IC distances.
� Standard goniometer for TF angle.
� Hypoallergenic skin cosmetic crayon to mark anatomical landmarks.
� Examination table.
PRE-TEST
� Mark the following anatomical landmarks:
� The femoral medial condyles (if measuring genu varum);
� The center of the medial malleoli (if measuring genu valgum).
� To measure the TF angle (Fig. 4.60), small dots (~5mm) are marked over the:
� Anterior superior iliac spine (ASIS);
� Centers of patellae;
� Mid point of the ankles.
TEST
� TF angle
� Testing positions, goniometer alignment and measurements are presented in Table 4.34.
� Results are compared to the normative reference values in Figure 4.63.
� Note: In the present study, the children were photographed and the TF angle was calculated on projected images. In clinical practice, a goniometer is commonly used. 3, 7
� IC and IM distances
� Testing positions and measurements are presented in Table 4.35.
� Results are compared to the normative reference values in Figure 4.63.
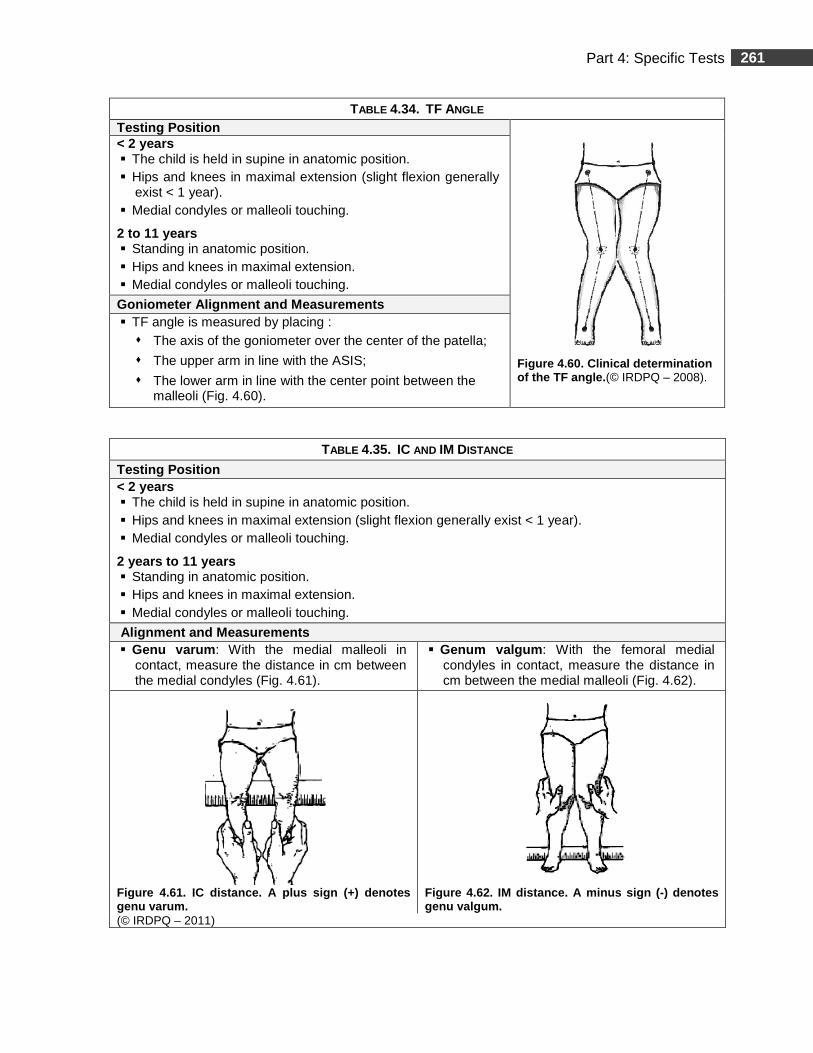
261 Part 4: Specific Tests
TABLE 4.34. TF ANGLE
Testing Position
Figure 4.60. Clinical determination of the TF angle. (© IRDPQ – 2008).
< 2 years � The child is held in supine in anatomic position. � Hips and knees in maximal extension (slight flexion generally
exist < 1 year). � Medial condyles or malleoli touching.
2 to 11 years � Standing in anatomic position. � Hips and knees in maximal extension. � Medial condyles or malleoli touching.
Goniometer Alignment and Measurements � TF angle is measured by placing :
� The axis of the goniometer over the center of the patella;
� The upper arm in line with the ASIS;
� The lower arm in line with the center point between the malleoli (Fig. 4.60).
TABLE 4.35. IC AND IM DISTANCE
Testing Position < 2 years � The child is held in supine in anatomic position. � Hips and knees in maximal extension (slight flexion generally exist < 1 year). � Medial condyles or malleoli touching.
2 years to 11 years � Standing in anatomic position. � Hips and knees in maximal extension. � Medial condyles or malleoli touching.
Alignment and Measurements � Genu varum : With the medial malleoli in
contact, measure the distance in cm between the medial condyles (Fig. 4.61).
� Genum valgum : With the femoral medial condyles in contact, measure the distance in cm between the medial malleoli (Fig. 4.62).
Figure 4.61. IC distance. A plus sign (+) denotes genu varum.
Figure 4.62. IM distance. A minus sign ( -) denotes genu valgum.
(© IRDPQ – 2011)
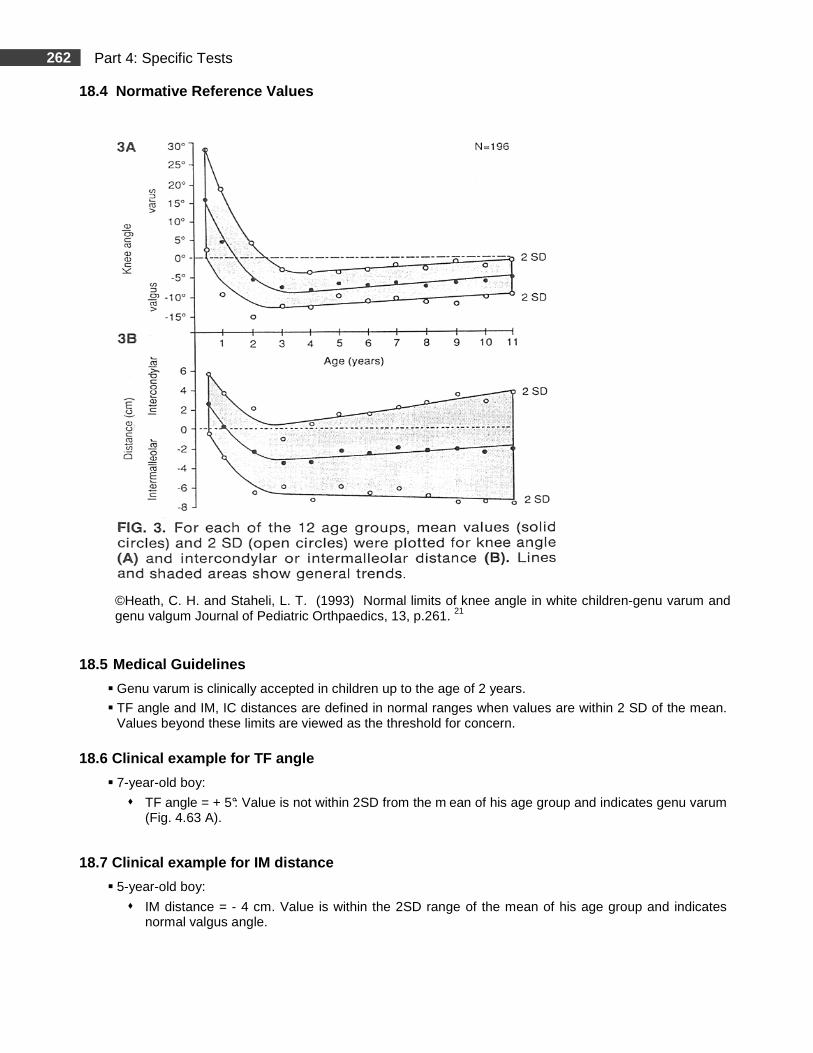
262 Part 4: Specific Tests
18.4 Normative Reference Values
©Heath, C. H. and Staheli, L. T. (1993) Normal limits of knee angle in white children-genu varum and genu valgum Journal of Pediatric Orthpaedics, 13, p.261. 21
18.5 Medical Guidelines
� Genu varum is clinically accepted in children up to the age of 2 years.
� TF angle and IM, IC distances are defined in normal ranges when values are within 2 SD of the mean. Values beyond these limits are viewed as the threshold for concern.
18.6 Clinical example for TF angle
� 7-year-old boy:
� TF angle = + 5°: Value is not within 2SD from the m ean of his age group and indicates genu varum (Fig. 4.63 A).
18.7 Clinical example for IM distance
� 5-year-old boy:
� IM distance = - 4 cm. Value is within the 2SD range of the mean of his age group and indicates normal valgus angle.
263 Part 4: Specific Tests
18.8 Study Summary
Title: Normal Limits of Knee Angle in White Child ren-Genu Varum and Genu Valgum 21
Authors Heath C. H, & Staheli L. T. Publication Journal of Pediatric Orthopaedics, 13, 259-262.
Purpose of the Study
To establish mean values and normal ranges for knee angle (KA), intercondylar distance (IC) or intermalleolar (IM) distance in white children. To describe differences that may exist between different ethnic groups.
Type of Population Normal Other
Clinical Relevance Assessment of alignment of the lower extremities.
Methods Subjects � The study sample consisted of 196 healthy children (106 ♂ and 90 ♀). Caucasian; USA. � 392 lower limbs were tested. � Age range: 6 months to 11 years. � Children were divided into 12 age groups based on their chronological age. The lowest number
of subjects was in the 11-year-old group (n = ~13) and the highest number of subjects was in the 3-year-old group (n = ~ 25).
Testing Procedures and Instrumentation � Measurements of KA, IM and IC distances were made by the same tester. Testing position was
standardized. Instrumentation: Tape measure, goniometer and a camera for KA.
Data Analysis � Mean, standard deviation and range were calculated for all measurements. � Norms for KA in degrees and IM and IC distances are reported therein. Number of subjects per
age category is small, but data is clinically interesting. � KA, IM and IC distance measurements were compared between male and female subjects in
each of the 12 age groups by the Mann-Whitney rank-sum test.
Results � Psychometric Properties : Non applicable. � Results are consistent with other studies. Authors report discrepancy with a study from China in
KA measurements that can be explained by racial differences and the use of different measurement techniques.
� Normal limits established in this study for white children are of additional clinical significances in that they may be used to provide practical and accurate screening, influencing decisions regarding the necessity for further clinical and radiological assessment.
� KA: There is a trend from extreme bowlegs at age < 18 months to maximum knock knees at 4 years, followed by a gradual progression toward a neutral knee angle (0°). The greatest mean varus of 15.9° (SD 6.7°) at 6 months was followed b y a transitional phase to valgus at 1 and 2 years of age. Maximum valgus of 8.7° (SD 2.4°) was observed at 4 years with significant differences (p< 0.05) between sexes with girls being more knock-kneed. At age ≤11 years, all children continued to demonstrate mean valgus of 5.8° (SD 2.3°).
� IC and IM Distances: Measurements showed a similar trend to KA, from extreme varus at 6 months to maximum valgus between 3 and 4 years of age. The mean IC distance of 2.6 cm (SD 1.5 cm) at 6 months, ranging from 0 to 4.5 cm, was replaced by IC distance of ~ 0 cm at 1 year. The greatest IM distances of 3.5 cm (SD 1.3 cm) and 3.5 cm (SD 2.0 cm) were noted at 3 and 4 years, respectively. IM distance persisted in children after age 4 years with a minimum of 2.1 cm (SD 2.2 cm) at 7 years of age.
264 Part 4: Specific Tests
18.8 Study Summary (Continued)
Authors’ Conclusion
� White children are maximally bowlegged at 6 months and progress toward approximately neutral knee angles (0°) by age 18 months. Between 2 and 11 years, they exhibit ≤12° physiologic valgus. The presence of varus during this period is considered abnormal according to the limits set forth in the present study.
Comments
� Internal validity seems good. However, sample size is small in most of the age groups (except the 3-, 4- and 7- years old), and the data should be considered with caution in the small sample age-groups. Internal and external validity in the other age groups, including sample size, seems good and the use of results as a trend for clinical guidelines is appropriate.
265 Part 4: Specific Tests
19. Tibiofemoral Angle, Intercondylar and Intermall eolar Distances in Standing 7
Age range: 10 years to 16 years. 19.1 Clinical Use
� Provides a standard method to assess knee angle alignment (genu varum, genu valgum).
19.2 Measurements
� TF angle is measured in degrees (Fig. 4.67).
� A plus sign (+) denotes a valgus angle
� A minus sign (-) denotes a varus angle.
� IM distance is measured in mm. A minus sign (-) denotes genu valgum (Fig. 4.68).
� IC distance is measured in mm. A plus sign (+) denotes genu varum (Fig. 4.68). 19.3 Testing Procedures
REQUIRED EQUIPMENT
� Tape measure for IM and IC distances.
� Standard goniometer for TF angle.
� Hypoallergenic skin cosmetic crayon to mark anatomical landmarks.
� Examination table.
PRE-TEST
� To measure the TF angle (Fig. 4.64), small dots (~5mm) are marked over the:
� Anterior superior iliac spine (ASIS);
� Centers of patellae;
� Mid-point of the ankles.
� To measure IM or IC distances, mark the following anatomical landmarks:
� Femoral medial condyles;
� Center of the medial malleoli.
TEST
� TF Angle
� Testing position, goniometer alignment and measurements are presented in Table 4.36.
� Results are compared to the normative reference values in Figure 4.67.
� IC and IM distances
� Testing positions and measurements are presented in Table 4.37.
� Results are compared to the normative reference values in Figure 4.68.
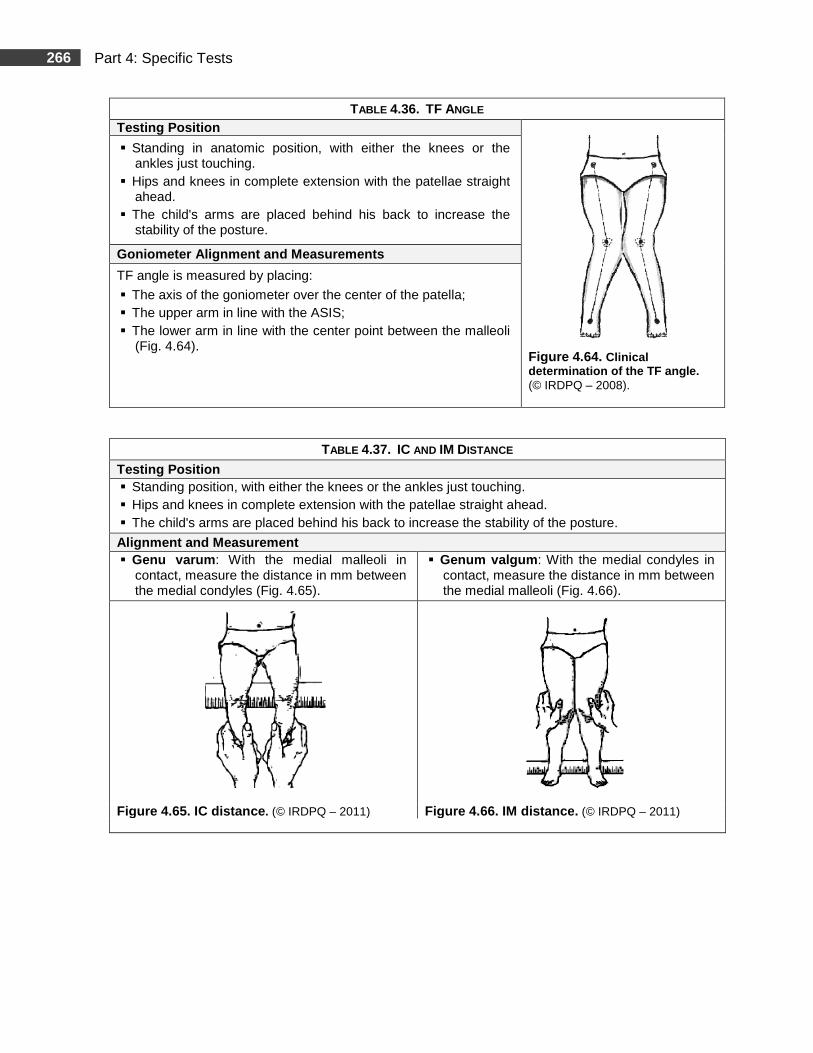
266 Part 4: Specific Tests
TABLE 4.36. TF ANGLE
Testing Position
Figure 4.64. Clinical determination of the TF angle. (© IRDPQ – 2008).
� Standing in anatomic position, with either the knees or the ankles just touching.
� Hips and knees in complete extension with the patellae straight ahead.
� The child's arms are placed behind his back to increase the stability of the posture.
Goniometer Alignment and Measurements
TF angle is measured by placing:
� The axis of the goniometer over the center of the patella; � The upper arm in line with the ASIS; � The lower arm in line with the center point between the malleoli
(Fig. 4.64).
TABLE 4.37. IC AND IM DISTANCE
Testing Position � Standing position, with either the knees or the ankles just touching. � Hips and knees in complete extension with the patellae straight ahead. � The child's arms are placed behind his back to increase the stability of the posture.
Alignment and Measurement � Genu varum : With the medial malleoli in
contact, measure the distance in mm between the medial condyles (Fig. 4.65).
� Genum valgum : With the medial condyles in contact, measure the distance in mm between the medial malleoli (Fig. 4.66).
Figure 4.65. IC distance . (© IRDPQ – 2011) Figure 4.66. IM distance . (© IRDPQ – 2011)
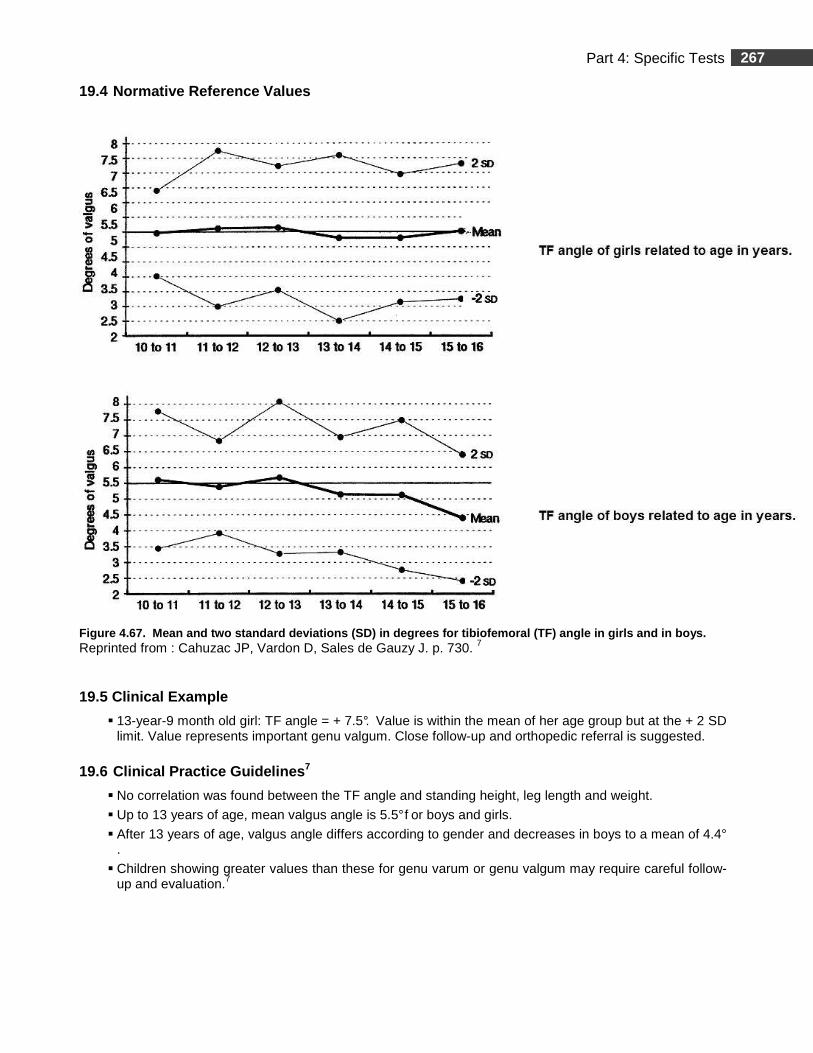
267 Part 4: Specific Tests
19.4 Normative Reference Values
Figure 4.67. Mean and two standard deviations (SD) in degrees for tibiofemoral (TF) angle in girls an d in boys. Reprinted from : Cahuzac JP, Vardon D, Sales de Gauzy J. p. 730. 7
19.5 Clinical Example
� 13-year-9 month old girl: TF angle = + 7.5°. Value is within the mean of her age group but at the + 2 SD limit. Value represents important genu valgum. Close follow-up and orthopedic referral is suggested.
19.6 Clinical Practice Guidelines 7
� No correlation was found between the TF angle and standing height, leg length and weight.
� Up to 13 years of age, mean valgus angle is 5.5° f or boys and girls.
� After 13 years of age, valgus angle differs according to gender and decreases in boys to a mean of 4.4°
.
� Children showing greater values than these for genu varum or genu valgum may require careful follow-up and evaluation.7
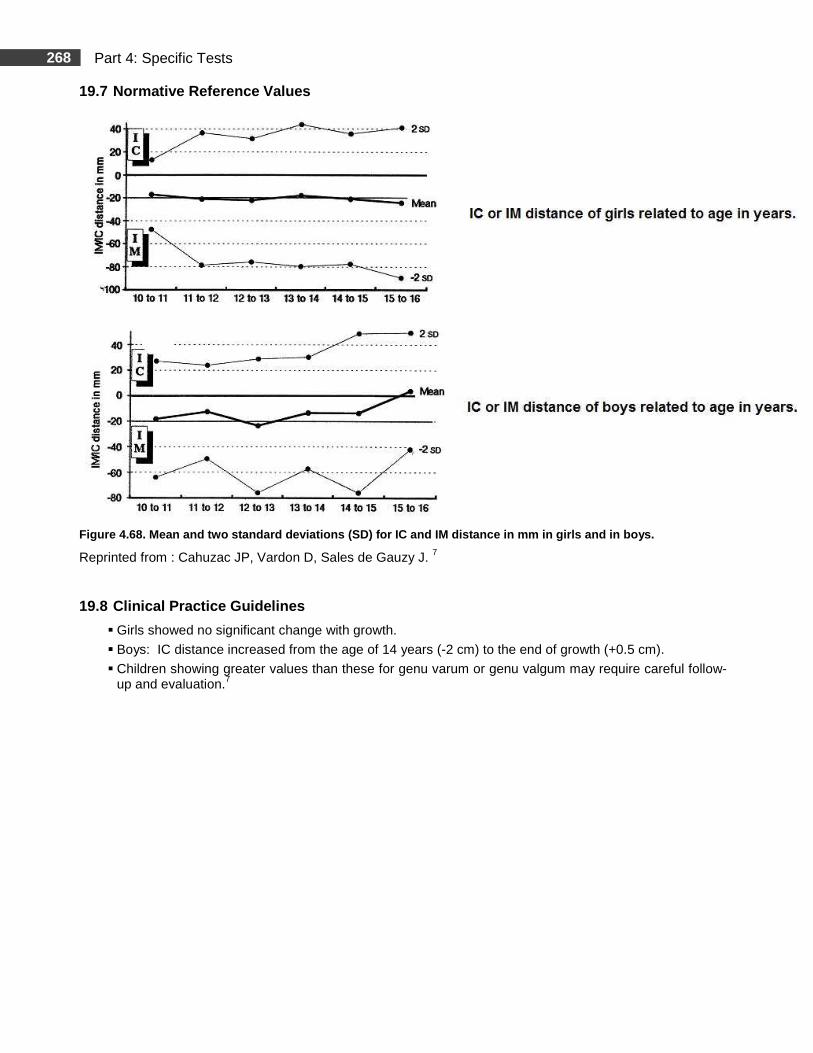
268 Part 4: Specific Tests
19.7 Normative Reference Values
Figure 4.68. Mean and two standard deviations (SD) for IC and IM distance in mm in girls and in boys.
Reprinted from : Cahuzac JP, Vardon D, Sales de Gauzy J. 7
19.8 Clinical Practice Guidelines
� Girls showed no significant change with growth.
� Boys: IC distance increased from the age of 14 years (-2 cm) to the end of growth (+0.5 cm).
� Children showing greater values than these for genu varum or genu valgum may require careful follow-up and evaluation.7
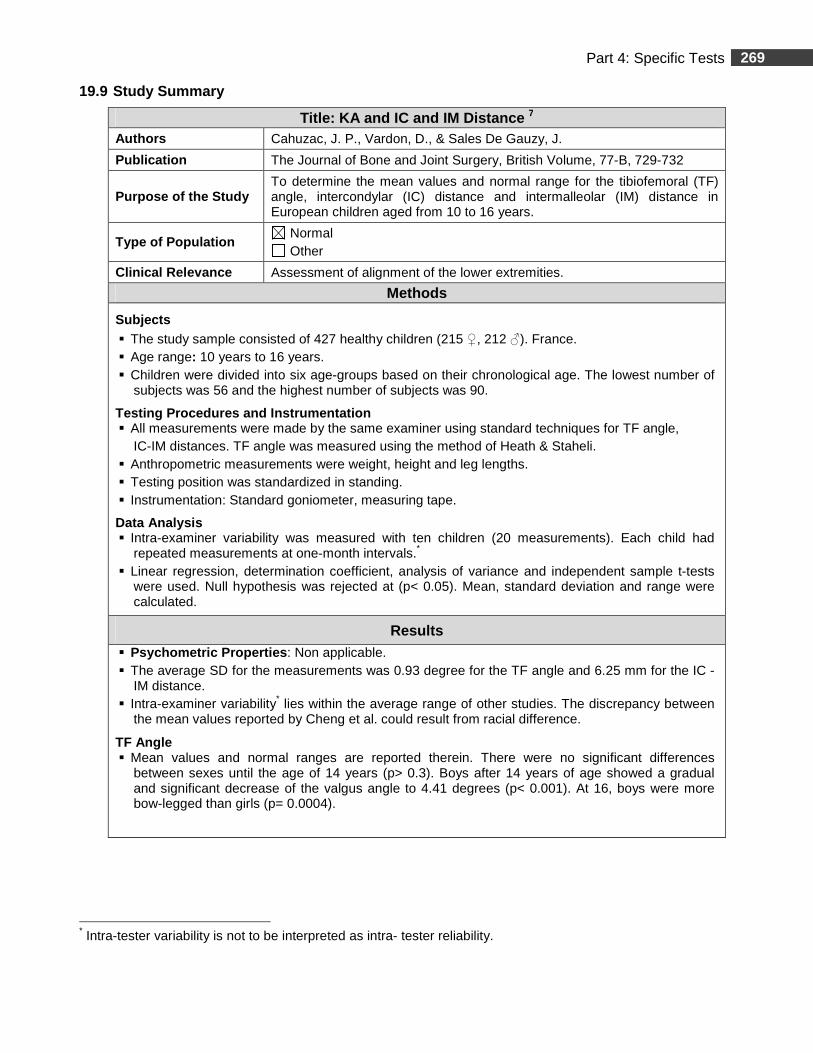
269 Part 4: Specific Tests
19.9 Study Summary
Title: KA and IC and IM Distance 7 Authors Cahuzac, J. P., Vardon, D., & Sales De Gauzy, J.
Publication The Journal of Bone and Joint Surgery, British Volume, 77-B, 729-732
Purpose of the Study To determine the mean values and normal range for the tibiofemoral (TF) angle, intercondylar (IC) distance and intermalleolar (IM) distance in European children aged from 10 to 16 years.
Type of Population Normal Other
Clinical Relevance Assessment of alignment of the lower extremities.
Methods
Subjects � The study sample consisted of 427 healthy children (215 ♀, 212 ♂). France. � Age range: 10 years to 16 years. � Children were divided into six age-groups based on their chronological age. The lowest number of
subjects was 56 and the highest number of subjects was 90.
Testing Procedures and Instrumentation � All measurements were made by the same examiner using standard techniques for TF angle,
IC-IM distances. TF angle was measured using the method of Heath & Staheli. � Anthropometric measurements were weight, height and leg lengths. � Testing position was standardized in standing. � Instrumentation: Standard goniometer, measuring tape.
Data Analysis � Intra-examiner variability was measured with ten children (20 measurements). Each child had
repeated measurements at one-month intervals.* � Linear regression, determination coefficient, analysis of variance and independent sample t-tests
were used. Null hypothesis was rejected at (p< 0.05). Mean, standard deviation and range were calculated.
Results
� Psychometric Properties : Non applicable. � The average SD for the measurements was 0.93 degree for the TF angle and 6.25 mm for the IC -
IM distance. � Intra-examiner variability* lies within the average range of other studies. The discrepancy between
the mean values reported by Cheng et al. could result from racial difference.
TF Angle � Mean values and normal ranges are reported therein. There were no significant differences
between sexes until the age of 14 years (p> 0.3). Boys after 14 years of age showed a gradual and significant decrease of the valgus angle to 4.41 degrees (p< 0.001). At 16, boys were more bow-legged than girls (p= 0.0004).
* Intra-tester variability is not to be interpreted as intra- tester reliability.
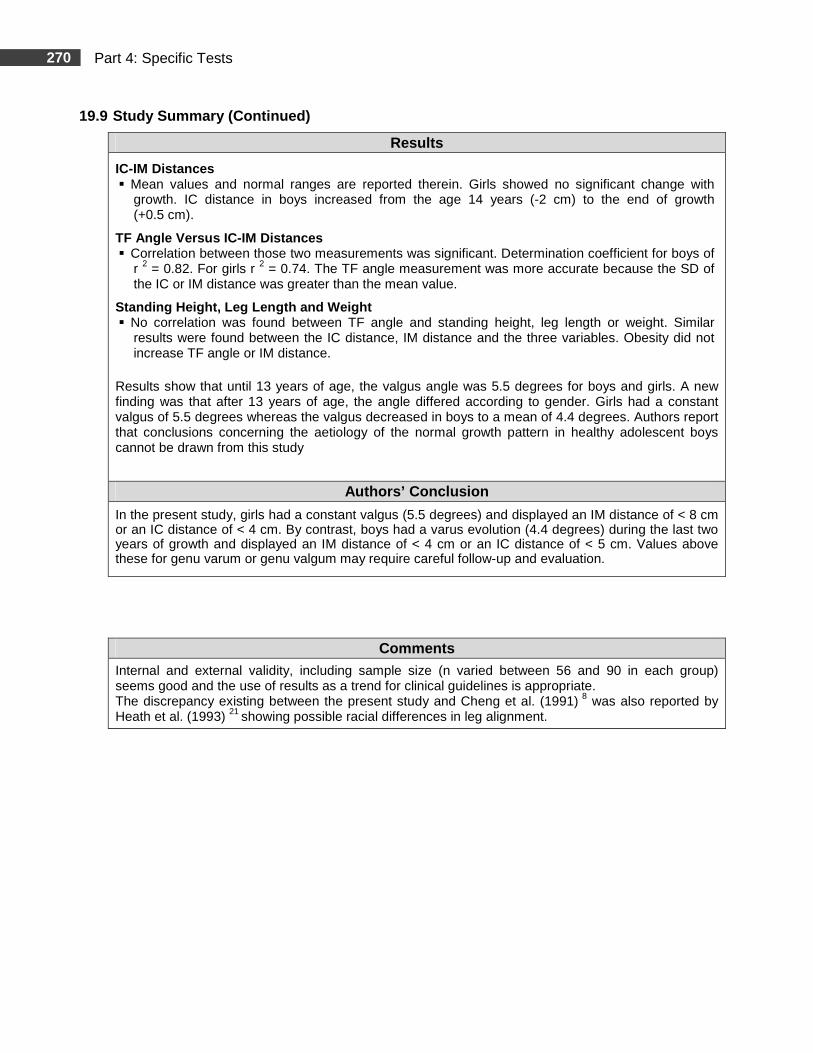
270 Part 4: Specific Tests
19.9 Study Summary (Continued)
Results
IC-IM Distances � Mean values and normal ranges are reported therein. Girls showed no significant change with
growth. IC distance in boys increased from the age 14 years (-2 cm) to the end of growth (+0.5 cm).
TF Angle Versus IC-IM Distances � Correlation between those two measurements was significant. Determination coefficient for boys of
r 2 = 0.82. For girls r 2 = 0.74. The TF angle measurement was more accurate because the SD of the IC or IM distance was greater than the mean value.
Standing Height, Leg Length and Weight � No correlation was found between TF angle and standing height, leg length or weight. Similar
results were found between the IC distance, IM distance and the three variables. Obesity did not increase TF angle or IM distance.
Results show that until 13 years of age, the valgus angle was 5.5 degrees for boys and girls. A new finding was that after 13 years of age, the angle differed according to gender. Girls had a constant valgus of 5.5 degrees whereas the valgus decreased in boys to a mean of 4.4 degrees. Authors report that conclusions concerning the aetiology of the normal growth pattern in healthy adolescent boys cannot be drawn from this study
Authors’ Conclusion
In the present study, girls had a constant valgus (5.5 degrees) and displayed an IM distance of < 8 cm or an IC distance of < 4 cm. By contrast, boys had a varus evolution (4.4 degrees) during the last two years of growth and displayed an IM distance of < 4 cm or an IC distance of < 5 cm. Values above these for genu varum or genu valgum may require careful follow-up and evaluation.
Comments Internal and external validity, including sample size (n varied between 56 and 90 in each group) seems good and the use of results as a trend for clinical guidelines is appropriate. The discrepancy existing between the present study and Cheng et al. (1991) 8 was also reported by Heath et al. (1993) 21 showing possible racial differences in leg alignment.
271 Part 4: Specific Tests
Joint Hypermobility
Summary
Joint hypermobility (JH) or ligamentous laxity is a common benign phenomenon in healthy children and usually diminishes throughout childhood 1, 11, 15, 27 as mobility decreases as age increases. 27 Children are reported to be more flexible than adults and hypermobility is considered present when joint range of motion is excessive. 6, 13, 22, 30 Joint hypermobility usually does not influence the physical functioning and the physical and psychosocial welfare of healthy children. 34 Not all hypermobile children will be symptomatic or will develop musculoskeletal problems later in life. 30 However, in a small proportion of children, joint hypermobility may progress with other musculoskeletal complaints derived from the joint hypermobility condition without a demonstrable systemic rheumatological disease. This condition is recognized as the Joint Hypermobility Syndrome (hypermobility + symptoms = Joint Hypermobilty Syndrome). 1, 17 Joint hypermobilty syndrome (JHS) is also called benign joint hypermobility syndrome (BJHS). The term “benign” is used to differentiate the condition from more important musculoskeletal syndromes. 33 CLINICAL SYMPTOMS
There appears to be a trend towards a greater frequency of articular complaints in hypermobile children compared to age and sex matched controls.2 There is an association between joint hypermobility and arthralgia. 1, 6, 11, 15, 17, 30 It was observed that up to 40% of JH children had developed symptoms of arthralgia in one year and are the ones that are usually seen in pediatric rheumatology. 2, 11, 15 Joint complaints in the lower limbs are symptoms often reported. 13, 30 Some children with JHS may present delayed motor development, poor balance skills and clumsiness. 1, 50
Children may present loss of function. 1 Poor coordination, limitations in physical activities or in school physical education activities and significant absences from school are reported because of symptoms. 1 AGE, GENDER AND ETHNIC CHARACTERISTICS
Hypermobile joints present a range of motion that exceeds the norm for that subject taking into consideration age, sex and ethnic characteristics. 2, 6, 13, 22, 36, 43 These three variables are factors that seem to have the most impact on the degree of joint mobility. 22, 27, 33, 47 JH would appear to be specific to a given population. The criteria should be adjusted according to age group 27. It is suggested that each country or geographic region would need to evaluate its specific criteria in order to obtain its own specific cut-off score. Since there are no “gold standards”, (no universally accepted diagnostic criteria), testing BJHS is a particular diagnosis problem. 17, 33
There exist different screening tests for JH and these tests hould be used as clinical guidelines. The clinician must take into consideration the limits of generalizing the results.
SCREENING TESTS
Two different screening tests to assess JH were selected:
� Beighton Score Index; 43
� Lower Limb Assessment Score (LLAS). 13
272 Part 4: Specific Tests
BEIGHTON SCORE INDEX 43
A most widely screening test for detecting generalized joint laxity is the Beighton Score Index (BSI). 11, 43 It is clinically easy to use 22, 43 and is reported to be suitable for epidemiological studies. 43 The BSI is designed to assess JH and is a complementary tool to the diagnosis of Joint Hypermobilty Syndrome. 50 It is not used as the sole criterion for diagnosis of JHS. 30 For more detailed information, we refer the reader to Table 4.41, for consultation on the revised diagnostic criteria for the benign joint hypermobility syndrome.
The BSI documents the joint laxity distribution, but it does not indicate the degree of hypermobility 50 and focuses more in the upper extremities than the lower extremities. The use and the set cut-off score of the Beighton score index in children is cited as being a controversial issue in the literature. 13, 22, 27
VALIDITY AND RELIABILITY
� A review of the literature by Remvig et al. (2007) 33 reports that the Beighton scoring recommendations were correlated with a global joint mobility index as well as with two other scoring systems, the Carter and Wilkinson, and the Rotes-Querol. All illustrate high concurrent validity with one another.
� For additional information on the Beighton Score Index, refer to the ‘’up to date’’ pages at the end of
the reference pages.
LOWER LIMB ASSESSMENT SCORE (LLAS)
13
LLAS is another screening test that is used to measure hypermobility, specifically in the lower limbs. Inter-tester reliability was reported to be 0.84 (Intraclass correlation coefficient).
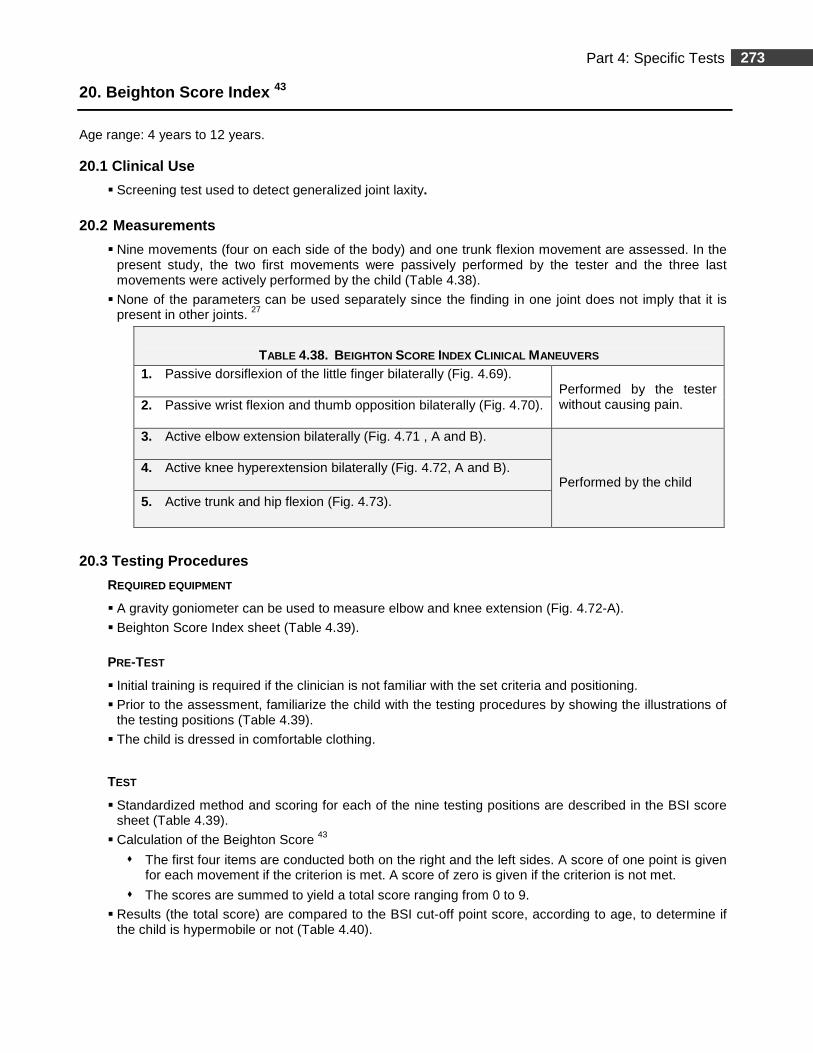
273 Part 4: Specific Tests
20. Beighton Score Index 43
Age range: 4 years to 12 years. 20.1 Clinical Use
� Screening test used to detect generalized joint laxity.
20.2 Measurements
� Nine movements (four on each side of the body) and one trunk flexion movement are assessed. In the present study, the two first movements were passively performed by the tester and the three last movements were actively performed by the child (Table 4.38).
� None of the parameters can be used separately since the finding in one joint does not imply that it is present in other joints. 27
TABLE 4.38. BEIGHTON SCORE INDEX CLINICAL MANEUVERS
1. Passive dorsiflexion of the little finger bilaterally (Fig. 4.69).
Performed by the tester without causing pain. 2. Passive wrist flexion and thumb opposition bilaterally (Fig. 4.70).
3. Active elbow extension bilaterally (Fig. 4.71 , A and B).
Performed by the child
4. Active knee hyperextension bilaterally (Fig. 4.72, A and B). 5. Active trunk and hip flexion (Fig. 4.73).
20.3 Testing Procedures
REQUIRED EQUIPMENT
� A gravity goniometer can be used to measure elbow and knee extension (Fig. 4.72-A).
� Beighton Score Index sheet (Table 4.39).
PRE-TEST
� Initial training is required if the clinician is not familiar with the set criteria and positioning.
� Prior to the assessment, familiarize the child with the testing procedures by showing the illustrations of the testing positions (Table 4.39).
� The child is dressed in comfortable clothing.
TEST
� Standardized method and scoring for each of the nine testing positions are described in the BSI score sheet (Table 4.39).
� Calculation of the Beighton Score 43
� The first four items are conducted both on the right and the left sides. A score of one point is given for each movement if the criterion is met. A score of zero is given if the criterion is not met.
� The scores are summed to yield a total score ranging from 0 to 9.
� Results (the total score) are compared to the BSI cut-off point score, according to age, to determine if the child is hypermobile or not (Table 4.40).
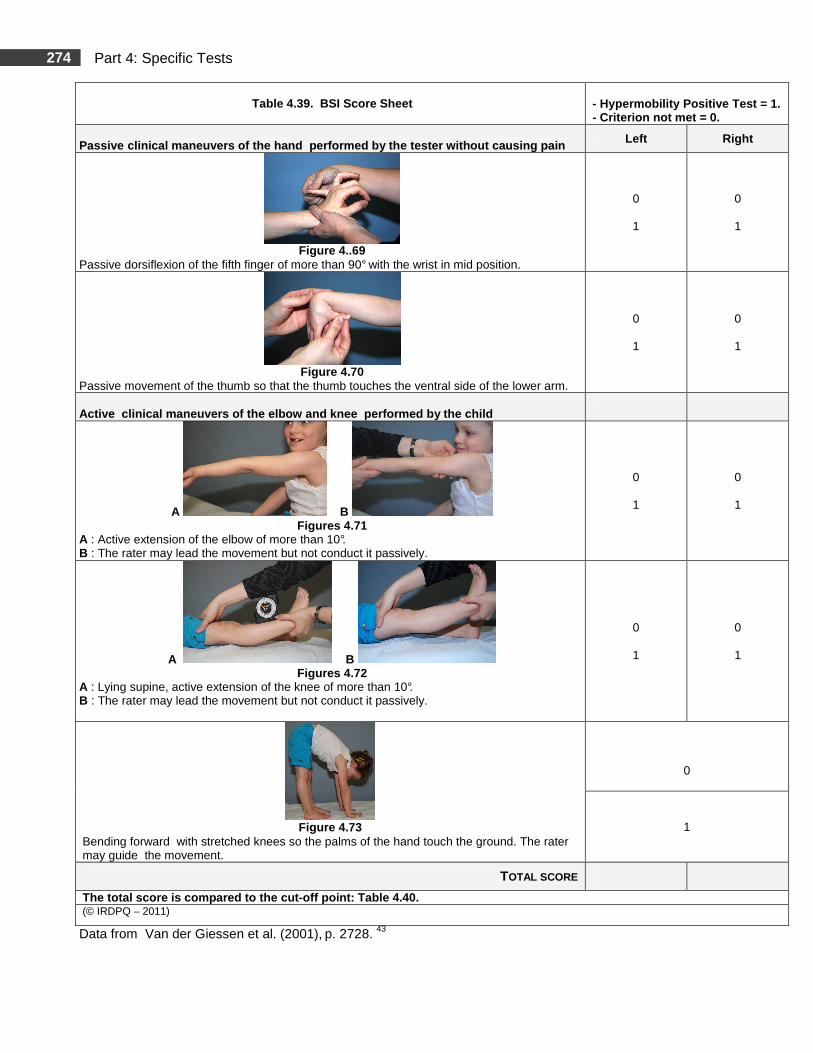
274 Part 4: Specific Tests
Data from Van der Giessen et al. (2001), p. 2728. 43
Table 4.39. BSI Score Sheet - Hypermobility Positive Test = 1. - Criterion not met = 0.
Passive clinical maneuvers of the hand performed by the te ster without causing pain Left Right
Figure 4..69
Passive dorsiflexion of the fifth finger of more than 90° with the wrist in mid position.
0
1
0
1
Figure 4.70
Passive movement of the thumb so that the thumb touches the ventral side of the lower arm.
0
1
0
1
Active clinical maneuvers of the elbow and knee p erformed by the child
A B Figures 4.71
A : Active extension of the elbow of more than 10°. B : The rater may lead the movement but not conduct it passively.
0
1
0
1
A B Figures 4.72
A : Lying supine, active extension of the knee of more than 10°. B : The rater may lead the movement but not conduct it passively.
0
1
0
1
Figure 4.73
Bending forward with stretched knees so the palms of the hand touch the ground. The rater may guide the movement.
0
1
TOTAL SCORE
The total score is compared to the cut -off point: Table 4.40. (© IRDPQ – 2011)
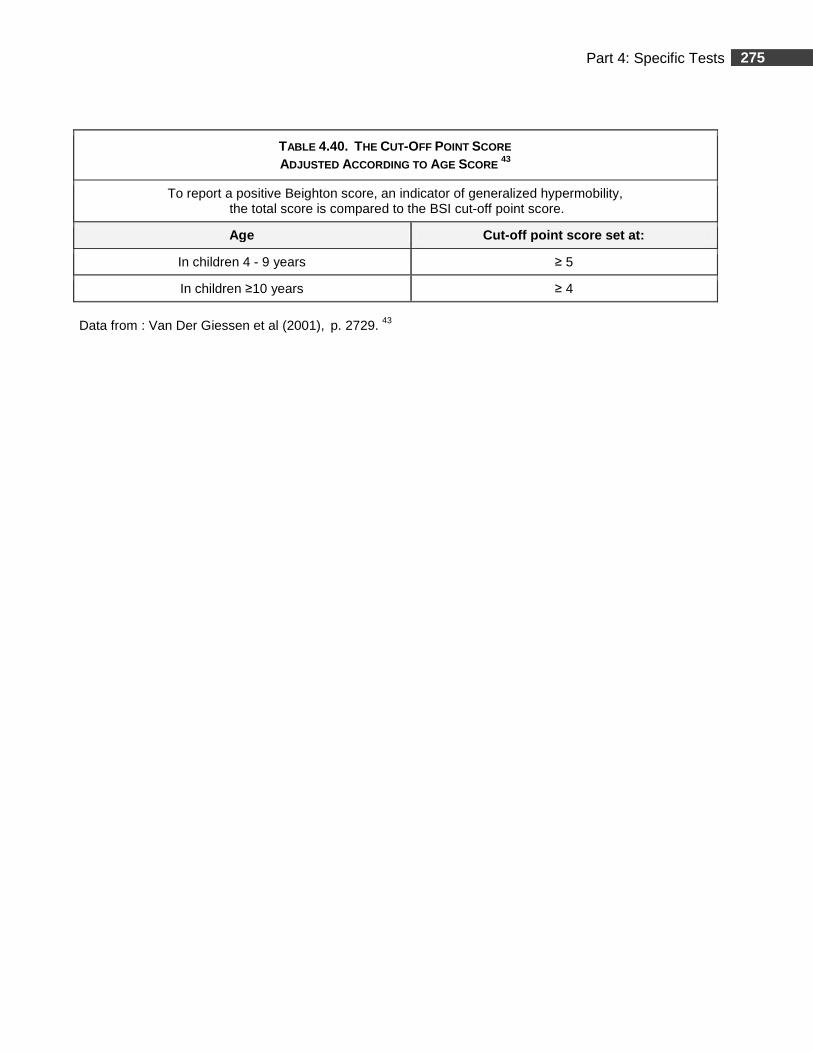
275 Part 4: Specific Tests
Data from : Van Der Giessen et al (2001), p. 2729. 43
TABLE 4.40. THE CUT-OFF POINT SCORE ADJUSTED ACCORDING TO AGE SCORE
43
To report a positive Beighton score, an indicator of generalized hypermobility, the total score is compared to the BSI cut-off point score.
Age Cut-off point score set at :
In children 4 - 9 years ≥ 5
In children ≥10 years ≥ 4
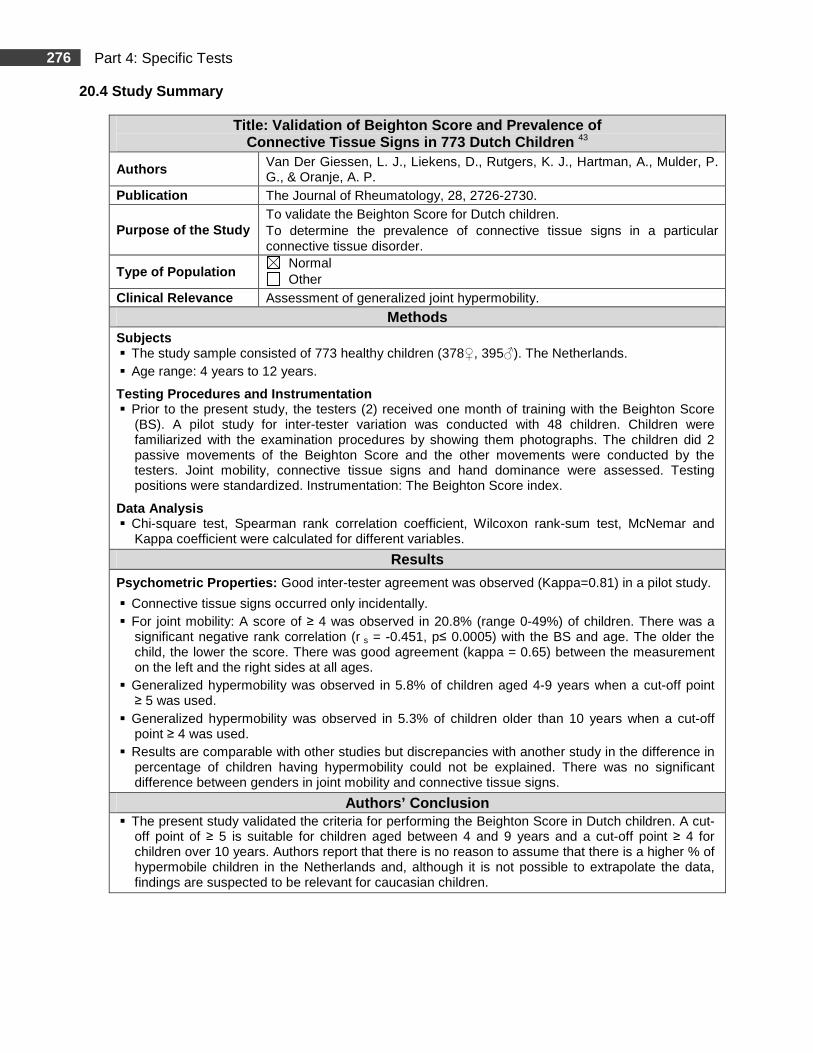
276 Part 4: Specific Tests
20.4 Study Summary
Title: Validation of Beighton Score and Prevalence of Connective Tissue Signs in 773 Dutch Children 43
Authors Van Der Giessen, L. J., Liekens, D., Rutgers, K. J., Hartman, A., Mulder, P. G., & Oranje, A. P.
Publication The Journal of Rheumatology, 28, 2726-2730.
Purpose of the Study To validate the Beighton Score for Dutch children. To determine the prevalence of connective tissue signs in a particular connective tissue disorder.
Type of Population Normal Other
Clinical Relevance Assessment of generalized joint hypermobility.
Methods Subjects � The study sample consisted of 773 healthy children (378♀, 395♂). The Netherlands. � Age range: 4 years to 12 years.
Testing Procedures and Instrumentation � Prior to the present study, the testers (2) received one month of training with the Beighton Score
(BS). A pilot study for inter-tester variation was conducted with 48 children. Children were familiarized with the examination procedures by showing them photographs. The children did 2 passive movements of the Beighton Score and the other movements were conducted by the testers. Joint mobility, connective tissue signs and hand dominance were assessed. Testing positions were standardized. Instrumentation: The Beighton Score index.
Data Analysis � Chi-square test, Spearman rank correlation coefficient, Wilcoxon rank-sum test, McNemar and
Kappa coefficient were calculated for different variables.
Results
Psychometric Properties: Good inter-tester agreement was observed (Kappa=0.81) in a pilot study.
� Connective tissue signs occurred only incidentally. � For joint mobility: A score of ≥ 4 was observed in 20.8% (range 0-49%) of children. There was a
significant negative rank correlation (r s = -0.451, p≤ 0.0005) with the BS and age. The older the child, the lower the score. There was good agreement (kappa = 0.65) between the measurement on the left and the right sides at all ages.
� Generalized hypermobility was observed in 5.8% of children aged 4-9 years when a cut-off point ≥ 5 was used.
� Generalized hypermobility was observed in 5.3% of children older than 10 years when a cut-off point ≥ 4 was used.
� Results are comparable with other studies but discrepancies with another study in the difference in percentage of children having hypermobility could not be explained. There was no significant difference between genders in joint mobility and connective tissue signs.
Authors’ Conclusion � The present study validated the criteria for performing the Beighton Score in Dutch children. A cut-
off point of ≥ 5 is suitable for children aged between 4 and 9 years and a cut-off point ≥ 4 for children over 10 years. Authors report that there is no reason to assume that there is a higher % of hypermobile children in the Netherlands and, although it is not possible to extrapolate the data, findings are suspected to be relevant for caucasian children.
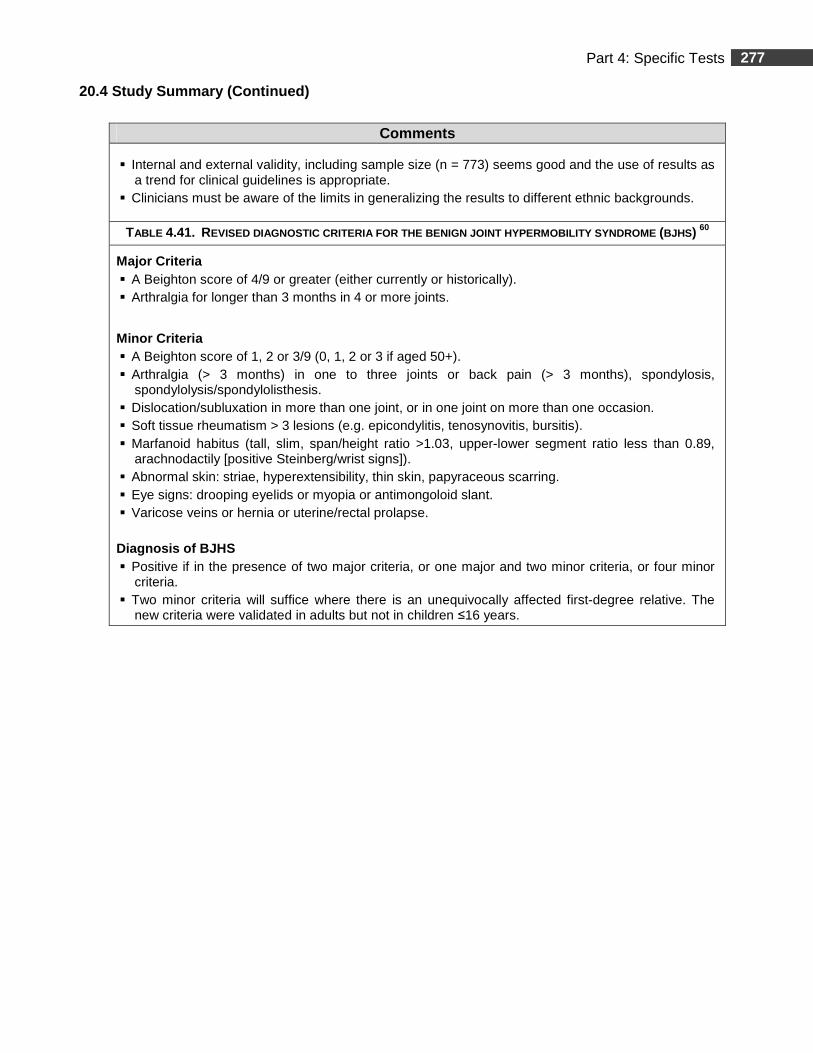
277 Part 4: Specific Tests
20.4 Study Summary (Continued)
Comments
� Internal and external validity, including sample size (n = 773) seems good and the use of results as a trend for clinical guidelines is appropriate.
� Clinicians must be aware of the limits in generalizing the results to different ethnic backgrounds.
TABLE 4.41. REVISED DIAGNOSTIC CRITERIA FOR THE BENIGN JOINT HYP ERMOBILITY SYNDROME (BJHS) 60
Major Criteria � A Beighton score of 4/9 or greater (either currently or historically). � Arthralgia for longer than 3 months in 4 or more joints.
Minor Criteria � A Beighton score of 1, 2 or 3/9 (0, 1, 2 or 3 if aged 50+). � Arthralgia (> 3 months) in one to three joints or back pain (> 3 months), spondylosis,
spondylolysis/spondylolisthesis. � Dislocation/subluxation in more than one joint, or in one joint on more than one occasion. � Soft tissue rheumatism > 3 lesions (e.g. epicondylitis, tenosynovitis, bursitis). � Marfanoid habitus (tall, slim, span/height ratio >1.03, upper-lower segment ratio less than 0.89,
arachnodactily [positive Steinberg/wrist signs]). � Abnormal skin: striae, hyperextensibility, thin skin, papyraceous scarring. � Eye signs: drooping eyelids or myopia or antimongoloid slant. � Varicose veins or hernia or uterine/rectal prolapse. Diagnosis of BJHS � Positive if in the presence of two major criteria, or one major and two minor criteria, or four minor
criteria. � Two minor criteria will suffice where there is an unequivocally affected first-degree relative. The
new criteria were validated in adults but not in children ≤16 years.
278 Part 4: Specific Tests
21. Lower Limb Assessment Score 13
Age range: 7 years (SD 1.9 years).
21.1 Clinical Use
� The Lower Limb Assessment Score (LLAS) measures hypermobility exclusively in the lower limbs in children.
21.2 Measurements
The LLAS is a composite scoring system of 12 joint movements occurring in several planes of motion, assessed in the lower limbs, on both sides (Table 4.42).
1. Hip abduction. 2. Hip flexion. 3. Knee hyperextension. 4. Knee anterior draw test. 5. Knee rotation. 6. Ankle joint dorsiflexion. 7. Ankle anterior draw test. 8. Subtalar joint inversion. 9. Midtarsal joint inversion. 10. Midtarsal joint ab/adduction and dorsi / plantar flexion. 11. Metartarso-phalangeal movement. 12. Excessive subtalar joint pronation.
21.3 Testing Procedures
REQUIRED EQUIPMENT
� Ruler with cm increments (optional).
� Standard goniometer to respect standardized testing positions.
� Hypoallergenic cosmetic skin pencil to mark anatomical bony landmarks.
� Examination table.
PRE-TEST
� Initial training is required if the clinician is not familiar with the set criteria and positioning used to isolate the joints.
� The child is barefoot.
TEST
� Testing positions:
� Standing for excessive subtalar joint pronation;
� Supine for all other measurements.
� The standardized method for each of the 12 assessed movements is described in Table 4.42.
� The calculation of the LLAS is explained in Table 4.43:
� The 12 items are conducted both on the right and the left sides. A score of one point is given for each movement if the criterion is met. A score of zero is given if the criterion is not met;
� For each side, the scores are summed to yield a total score ranging from 0 to 12.
� The total score of each side is compared to the LLAS cut-off point score, set at ≥7, to determine joint hypermobility.
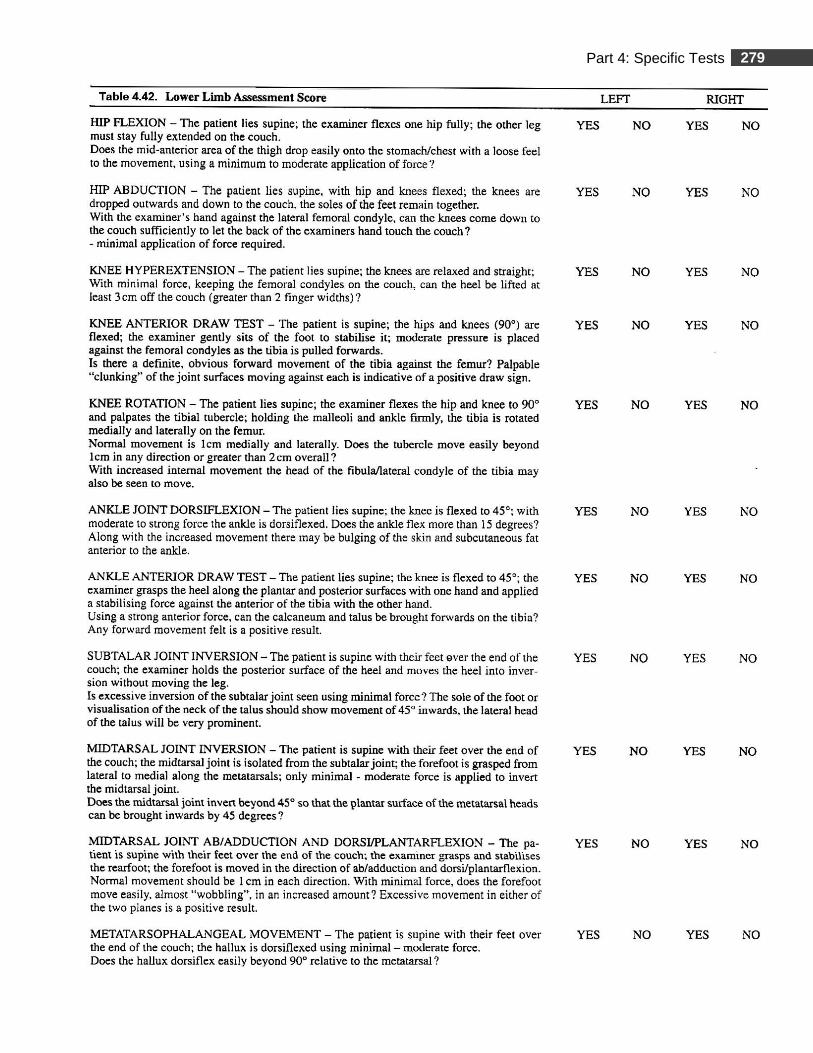
279 Part 4: Specific Tests
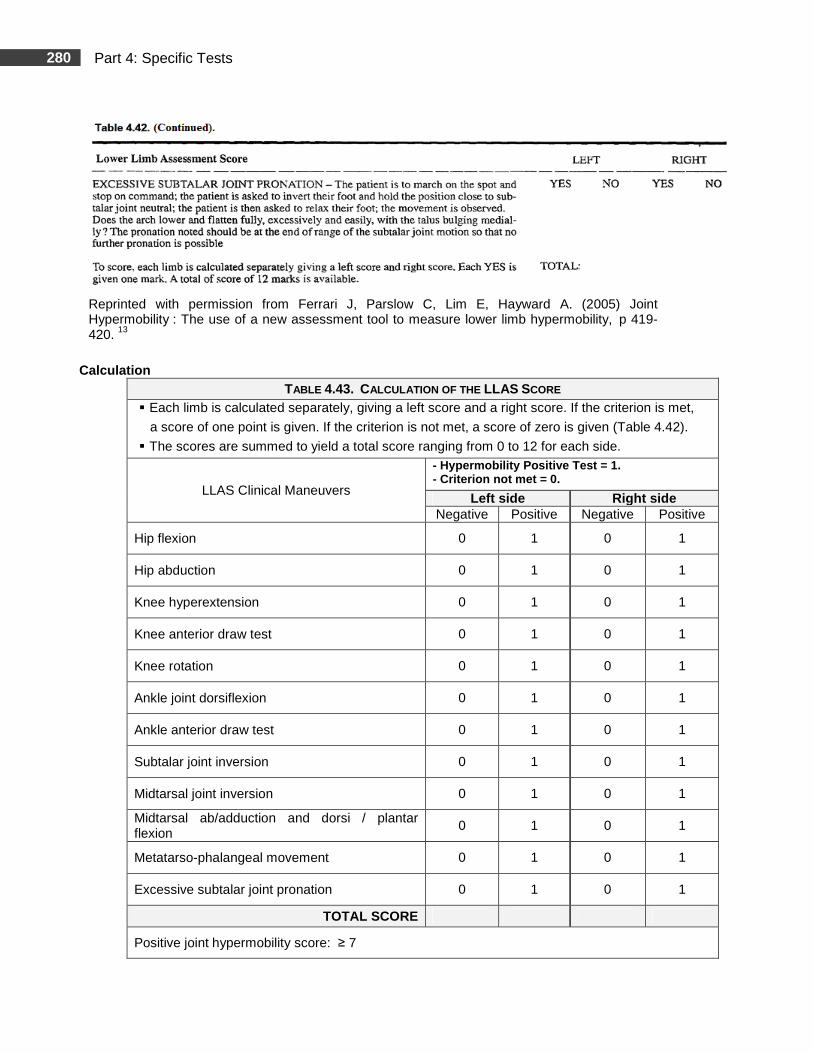
280 Part 4: Specific Tests
Reprinted with permission from Ferrari J, Parslow C, Lim E, Hayward A. (2005) Joint Hypermobility : The use of a new assessment tool to measure lower limb hypermobility, p 419-420. 13
Calculation
TABLE 4.43. CALCULATION OF THE LLAS SCORE � Each limb is calculated separately, giving a left score and a right score. If the criterion is met,
a score of one point is given. If the criterion is not met, a score of zero is given (Table 4.42).
� The scores are summed to yield a total score ranging from 0 to 12 for each side.
LLAS Clinical Maneuvers
- Hypermobility Positive Test = 1. - Criterion not met = 0.
Left side Right side Negative Positive Negative Positive
Hip flexion 0 1 0 1
Hip abduction 0 1 0 1
Knee hyperextension 0 1 0 1
Knee anterior draw test 0 1 0 1
Knee rotation 0 1 0 1
Ankle joint dorsiflexion 0 1 0 1
Ankle anterior draw test 0 1 0 1
Subtalar joint inversion 0 1 0 1
Midtarsal joint inversion 0 1 0 1
Midtarsal ab/adduction and dorsi / plantar flexion
0 1 0 1
Metatarso-phalangeal movement 0 1 0 1
Excessive subtalar joint pronation 0 1 0 1
TOTAL SCORE
Positive joint hypermobility score: ≥ 7
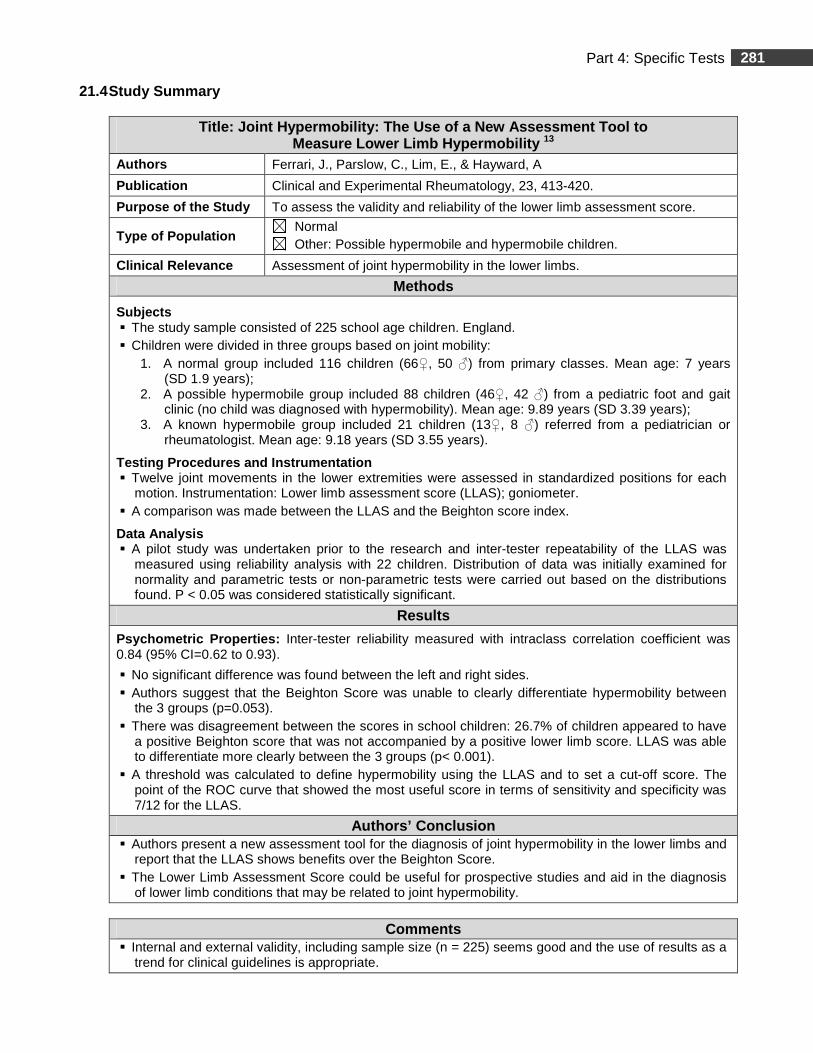
281 Part 4: Specific Tests
21.4 Study Summary
Title: Joint Hypermobility: The Use of a New Assess ment Tool to Measure Lower Limb Hypermobility 13
Authors Ferrari, J., Parslow, C., Lim, E., & Hayward, A
Publication Clinical and Experimental Rheumatology, 23, 413-420.
Purpose of the Study To assess the validity and reliability of the lower limb assessment score.
Type of Population Normal Other: Possible hypermobile and hypermobile children.
Clinical Relevance Assessment of joint hypermobility in the lower limbs.
Methods
Subjects � The study sample consisted of 225 school age children. England. � Children were divided in three groups based on joint mobility:
1. A normal group included 116 children (66♀, 50 ♂) from primary classes. Mean age: 7 years (SD 1.9 years);
2. A possible hypermobile group included 88 children (46♀, 42 ♂) from a pediatric foot and gait clinic (no child was diagnosed with hypermobility). Mean age: 9.89 years (SD 3.39 years);
3. A known hypermobile group included 21 children (13♀, 8 ♂) referred from a pediatrician or rheumatologist. Mean age: 9.18 years (SD 3.55 years).
Testing Procedures and Instrumentation � Twelve joint movements in the lower extremities were assessed in standardized positions for each
motion. Instrumentation: Lower limb assessment score (LLAS); goniometer. � A comparison was made between the LLAS and the Beighton score index.
Data Analysis � A pilot study was undertaken prior to the research and inter-tester repeatability of the LLAS was
measured using reliability analysis with 22 children. Distribution of data was initially examined for normality and parametric tests or non-parametric tests were carried out based on the distributions found. P < 0.05 was considered statistically significant.
Results
Psychometric Properties: Inter-tester reliability measured with intraclass correlation coefficient was 0.84 (95% CI=0.62 to 0.93).
� No significant difference was found between the left and right sides. � Authors suggest that the Beighton Score was unable to clearly differentiate hypermobility between
the 3 groups (p=0.053). � There was disagreement between the scores in school children: 26.7% of children appeared to have
a positive Beighton score that was not accompanied by a positive lower limb score. LLAS was able to differentiate more clearly between the 3 groups (p< 0.001).
� A threshold was calculated to define hypermobility using the LLAS and to set a cut-off score. The point of the ROC curve that showed the most useful score in terms of sensitivity and specificity was 7/12 for the LLAS.
Authors’ Conclusion � Authors present a new assessment tool for the diagnosis of joint hypermobility in the lower limbs and
report that the LLAS shows benefits over the Beighton Score. � The Lower Limb Assessment Score could be useful for prospective studies and aid in the diagnosis
of lower limb conditions that may be related to joint hypermobility.
Comments � Internal and external validity, including sample size (n = 225) seems good and the use of results as a
trend for clinical guidelines is appropriate.
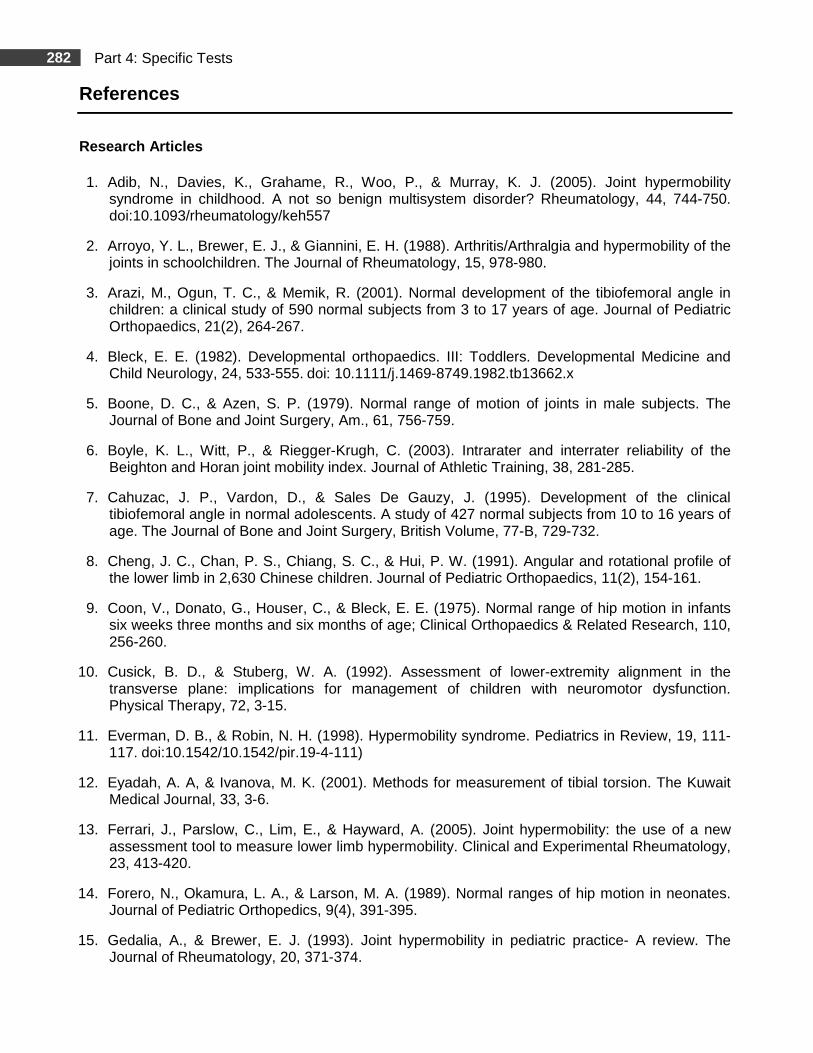
282 Part 4: Specific Tests
References
Research Articles
1. Adib, N., Davies, K., Grahame, R., Woo, P., & Murray, K. J. (2005). Joint hypermobility syndrome in childhood. A not so benign multisystem disorder? Rheumatology, 44, 744-750. doi:10.1093/rheumatology/keh557
2. Arroyo, Y. L., Brewer, E. J., & Giannini, E. H. (1988). Arthritis/Arthralgia and hypermobility of the joints in schoolchildren. The Journal of Rheumatology, 15, 978-980.
3. Arazi, M., Ogun, T. C., & Memik, R. (2001). Normal development of the tibiofemoral angle in children: a clinical study of 590 normal subjects from 3 to 17 years of age. Journal of Pediatric Orthopaedics, 21(2), 264-267.
4. Bleck, E. E. (1982). Developmental orthopaedics. III: Toddlers. Developmental Medicine and Child Neurology, 24, 533-555. doi: 10.1111/j.1469-8749.1982.tb13662.x
5. Boone, D. C., & Azen, S. P. (1979). Normal range of motion of joints in male subjects. The Journal of Bone and Joint Surgery, Am., 61, 756-759.
6. Boyle, K. L., Witt, P., & Riegger-Krugh, C. (2003). Intrarater and interrater reliability of the Beighton and Horan joint mobility index. Journal of Athletic Training, 38, 281-285.
7. Cahuzac, J. P., Vardon, D., & Sales De Gauzy, J. (1995). Development of the clinical tibiofemoral angle in normal adolescents. A study of 427 normal subjects from 10 to 16 years of age. The Journal of Bone and Joint Surgery, British Volume, 77-B, 729-732.
8. Cheng, J. C., Chan, P. S., Chiang, S. C., & Hui, P. W. (1991). Angular and rotational profile of the lower limb in 2,630 Chinese children. Journal of Pediatric Orthopaedics, 11(2), 154-161.
9. Coon, V., Donato, G., Houser, C., & Bleck, E. E. (1975). Normal range of hip motion in infants six weeks three months and six months of age; Clinical Orthopaedics & Related Research, 110, 256-260.
10. Cusick, B. D., & Stuberg, W. A. (1992). Assessment of lower-extremity alignment in the transverse plane: implications for management of children with neuromotor dysfunction. Physical Therapy, 72, 3-15.
11. Everman, D. B., & Robin, N. H. (1998). Hypermobility syndrome. Pediatrics in Review, 19, 111-117. doi:10.1542/10.1542/pir.19-4-111)
12. Eyadah, A. A, & Ivanova, M. K. (2001). Methods for measurement of tibial torsion. The Kuwait Medical Journal, 33, 3-6.
13. Ferrari, J., Parslow, C., Lim, E., & Hayward, A. (2005). Joint hypermobility: the use of a new assessment tool to measure lower limb hypermobility. Clinical and Experimental Rheumatology, 23, 413-420.
14. Forero, N., Okamura, L. A., & Larson, M. A. (1989). Normal ranges of hip motion in neonates. Journal of Pediatric Orthopedics, 9(4), 391-395.
15. Gedalia, A., & Brewer, E. J. (1993). Joint hypermobility in pediatric practice- A review. The Journal of Rheumatology, 20, 371-374.
283 Part 4: Specific Tests
16. Gerhardt, J. J. (1983). Clinical measurements of joint motion and position in the neutral-zero method and SFTR recording: basic principles. International Rehabilitation Medicine, 5, 161-164.
17. Grahame, R., Bird, H. A., Child, A., Dolan, A. L., Edwards–Fowler, A., Ferrell, W. ET AL. (2000). The revised (Brighton 1998) criteria for the diagnosis of benign joint hypermobility syndrome (BJHS). The Journal of Rheumatology, 27, 1777-1779.
18. Greene, W. B. (1996). Genu varum and genu valgum in children: differential diagnosis and guidelines for evaluation. Comprehensive Therapy, 22, 22-29.
19. Haas, S. S., Epps, C. H., Jr., & Adams, J. P. (1973). Normal ranges of hip motion in the newborn. Clinical Orthopaedics and Related Research, 91, 114-118.
20. Harris, M. B., Simons, C. J. R., Ritchie, S. K., Mullett, M. D., & Myerberg, D. Z. (1990). Joint range of motion development in premature infants. Pediatric Physical Therapy, 13, 185-191.
21. Heath, C. H. & Staheli, L. T. (1993). Normal limits of knee angle in white children-genu varum and genu valgum. Journal of Pediatric Orthopaedics, 13 (2), 259-262.
22. Janson, A., Saartok, T., Werner, S., & Renstrom, P. (2004). General joint laxity in 1845 Swedish school children of different ages: age- and gender-specific distributions. Acta Paediatrica, 93, 1202-1206. doi: 10.1080/08035250410023971
23. Katz, K., Rosenthal, A., & Yosipovitch, Z. (1992). Normal ranges of popliteal angle in children. Journal of Pediatric Orthopaedics, 12, 229-231.
24. Kilgour, G., McNair, P., & Stott, N. S. (2003). Intrarater reliability of lower limb sagittal range-of-motion measures in children with spastic diplegia. Developmental Medicine and Child Neurology, 45, 391-399. doi: 10.1111/j.1469-8749.2003.tb00418.x
25. King, H.A., & Staheli, L. T. (1984). Torsional problems in cerebral palsy. Foot & Ankle, 4, 180-184.
26. Kuo, L., Chung, W., Bates, E., & Stephen, J. (1997). The hamstring index. Journal of Pediatric Orthopaedics, 17, 78-88.
27. Lamari, N. M., Chueire, A. G., & Cordeiro, J. A. (2005). Analysis of joint mobility patterns among preschool children. São Paulo Medical Journal, 123(3) 119-123. doi: 10.1590/S1516-31802005000300006
28. Li, Y. H., & Leong, J. C. Y. (1999). Intoeing gait in children. Hong Kong Medical Journal, 5, 360-366.
29. Luchini, M., & Stevens, D. B. (1983). Validity of torsional profile examination. Journal of Pediatric Orthopaedics. 3, 41-44.
30. Murray, K. J. (2006). Hypermobility disorders in children and adolescents. Best Practice & Research Clinical Rheumatology, 20(2), 329-351. doi:10.1016/j.berh.2005.12.003
31. Phelps, E., Smith, L. J., & Hallum, A. (1985). Normal ranges of hip motion of infants between nine and 24 months of age. Developmental Medicine and Child Neurology, 27(6), 785-792. doi: 10.1111/j.1469-8749.1985.tb03803.x
32. Reade, E., Hom, L., Hallum, A., & Lopopolo, R. (1984). Changes in popliteal angle measurement in infants up to one year of age. Developmental Medicine and Child Neurology, 26, 774-780. doi: 10.1111/j.1469-8749.1984.tb08171.x
284 Part 4: Specific Tests
33. Remvig, L., Jensen, D. V., & Ward, R. C. (2007). Are diagnostic criteria for general joint hypermobility and benign joint hypermobility syndrome based on reproducible and valid tests? A review of the literature. The Journal of Rheumatology, 34, 798-803.
34. Ruperto, N., Malattia, C., Bartoli, M., Trail, L., Pistorio, A., Martini, A., & Ravelli, A. (2004). Functional ability and physical and psychosocial well-being of hypermobile schoolchildren. Clinical and Experimental Rheumatology, 22(4), 495-498.
35. Schwarze, D. J., & Denton, J. R. (1993). Normal values of neonatal lower limbs: an evaluation of 1,000 neonates. Journal of Pediatric Orthopaedics, (6), 758-760.
36. Seçkin, U., Tur, B. S., Yilmaz, O., Yagci, I., Bodur, H., & Arasil, T. (2005). The prevalence of joint hypermobility among high school students. Rheumatology International, 25, 260-263.
37. Staheli, L. T. (1977). Torsional deformity. Pediatric Clinics of North America, 24, 799-811.
38. Staheli, L. T., Corbett, M., Wyss, C., & King, H. (1985). Lower-extremity rotational problems in children. Normal values to guide management. The Journal of Bone and Joint Surgery, 67, 39-47.
39. Staheli, L. T., & Engel, G. M. (1972). Tibial torsion: a method of assessment and a survey of normal children. Clinical Orthopaedics and Related Research, 86, 183-186.
40. Stuberg, W., Temme, J., Kaplan, P., Clarke, A., & Fuchs, R. (1991). Measurement of tibial torsion and thigh-foot angle using goniometry and computed tomography. Clinical Orthopaedics and Related Research, 272, 208-212.
41. Tamari, K., Tinley, P., Briffa, K., & Breidahl, W. (2005). Validity and reliability of existing and modified clinical methods of measuring femoral and tibiofibular torsion in healthy subjects: use of different reference axes may improve reliability. Clinical Anatomy, 18, 46-55. doi: 10.1002/ca.20050
42. Valmassy, R., & Stanton, B. (1989). Tibial torsion. Normal values in children. Journal of the American Podiatric Medical Association, 79, 432-435.
43. Van Der Giessen, L. J., Liekens, D., Rutgers, K. J., Hartman, A., Mulder, P. G., & Oranje, A. P. (2001). Validation of beighton score and prevalence of connective tissue signs in 773 Dutch children. The Journal of Rheumatology, 28, 2726-2730.
44. Waugh, K. G., Minkel, J. L., Parker, R., & Coon, V. A. (1983). Measurement of selected hip, knee, and ankle joint motions in newborns. Physical Therapy, 63, 1616-1621.
285 Part 4: Specific Tests
Research Abstracts
45. Cooney, K. M., Keister, T., Poignard, E., Ruper, E., Zerbe, S., Hudson, T., Buczek, F. L. (2005). Convergent validity of goniometric and motion capture techniques used to measure tibial torsion. Proceedings of the annual meeting of the International Society of Biomechanics (ISB), Cleveland OH, Retrieved from: http://www.asbweb.org/conferences/2005/pdf/0328.pdf Accessed March 9th, 2010.
46. Mallau, S., Mesure, S., Jacquemier, M., Bollini, G., & Assiante, C. Locomotor skills and balance strategies in children with internal rotations of the lower limbs. CNRS-INPC Institut de Neurosciences Physiologiques et Cognitives, Marseille, France et Service de Chirurgie orthopédique Infantile, Hôpital de la Timone, Marseille, France Retrieved from: http://www3.interscience.wiley.com/journal/114300718/abstract?CRETRY=1&SRETRY=0. Accessed March, 17th, 2010.
47. Remvig, L., Jensen, D. V., & Ward, R. C. (2007). Epidemiology of general joint hypermobility and basis for the proposed criteria for benign joint hypermobility syndrome: review of the literature. The Journal of Rheumatology, 34, 804-809.
Reference Books
48. Bleck, E. E. (1987). Orthopaedic Management in Cerebral Palsy. Mac Keith Press. Oxford, Blackwell Scientific
49. Heck, C. V., Hendryson, I. E., & Rowe, C. R. (1965). Joint motion, method of measuring and recording (Committee for the study of joint motion). American Academy of Orthopaedic Surgeons.
50. Keer, R., & Grahame, R. (2003). Hypermobility Syndrome - Diagnosis and Management for Physiotherapists. Edinburgh: Butterworth-Heinemann.
51. Gerhar, D. T & Russe, O. A., (1975). International SFTR method for measuring and recording joint motion. Bern: Hans Huber.
52. Sutherland, D. (1988). The development of mature walking. London: MacKeith Press.
Web sites
53. Anaes. (2004) Physiotherapy and orthopaedic treatment for isolated congenital foot deformity during the first six months of life: Clinical practice guidelines, Retrieved from: http://www.has-sante.fr/portail/upload/docs/application/pdf/congenital_foot_deformity.pdf Accessed March 1, 2011.
54. Gore, A. I., & Spencer, J. P. (2004). The newborn foot. American Academy of Family Physicians. Retrieved from: http://www.aafp.org/afp/2004/0215/p865.html Accessed March 1 2011.
55. Gugel, J. & Glunz, C. (2004) In-toeing, knock knees and bow legs. Retrieved from: http://pediatrics.uchicago.edu/chiefs/documents/intoeing-Jon.pdf Accessed March 1, 2011.
56. Jackson, J. F., & Stricker, S. J. (2003) Pediatric footnotes. A review of common congenital foot deformities. International Pediatrics, 18, 133-140. Retrieved from: http://www.int-pediatrics.org/PDF/Volume_18/18-3/133_140_ip1803.pdf . Accessed March 1, 2011.

286 Part 4: Specific Tests
57. Sass, P., & Hassan, G. (2003). Lower extremity abnormalities in children. American Family Physician, 68, 461-468. Retrieved from: http://www.aafp.org/afp/20030801/461.html Accessed March 1, 2011.
58. The Hypermobility Syndrome Association. The Brighton score - The new diagnostic criteria for HMS. Retrieved from: http://www.hypermobility.org/diagnosis.php Accessed March 1, 2011.
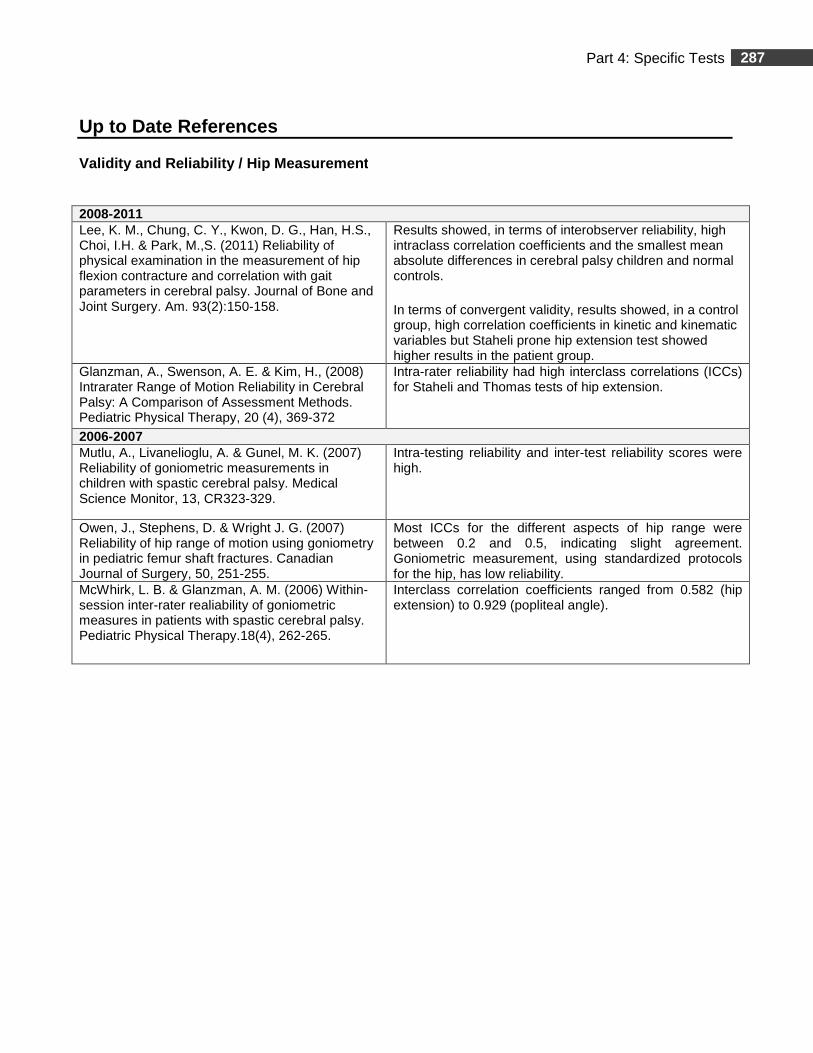
287 Part 4: Specific Tests
Up to Date References
Validity and Reliability / Hip Measurement
2008-2011 Lee, K. M., Chung, C. Y., Kwon, D. G., Han, H.S., Choi, I.H. & Park, M.,S. (2011) Reliability of physical examination in the measurement of hip flexion contracture and correlation with gait parameters in cerebral palsy. Journal of Bone and Joint Surgery. Am. 93(2):150-158.
Results showed, in terms of interobserver reliability, high intraclass correlation coefficients and the smallest mean absolute differences in cerebral palsy children and normal controls.
In terms of convergent validity, results showed, in a control group, high correlation coefficients in kinetic and kinematic variables but Staheli prone hip extension test showed higher results in the patient group.
Glanzman, A., Swenson, A. E. & Kim, H., (2008) Intrarater Range of Motion Reliability in Cerebral Palsy: A Comparison of Assessment Methods. Pediatric Physical Therapy, 20 (4), 369-372
Intra-rater reliability had high interclass correlations (ICCs) for Staheli and Thomas tests of hip extension.
2006-2007 Mutlu, A., Livanelioglu, A. & Gunel, M. K. (2007) Reliability of goniometric measurements in children with spastic cerebral palsy. Medical Science Monitor, 13, CR323-329.
Intra-testing reliability and inter-test reliability scores were high.
Owen, J., Stephens, D. & Wright J. G. (2007) Reliability of hip range of motion using goniometry in pediatric femur shaft fractures. Canadian Journal of Surgery, 50, 251-255.
Most ICCs for the different aspects of hip range were between 0.2 and 0.5, indicating slight agreement. Goniometric measurement, using standardized protocols for the hip, has low reliability.
McWhirk, L. B. & Glanzman, A. M. (2006) Within-session inter-rater realiability of goniometric measures in patients with spastic cerebral palsy. Pediatric Physical Therapy.18(4), 262-265.
Interclass correlation coefficients ranged from 0.582 (hip extension) to 0.929 (popliteal angle).
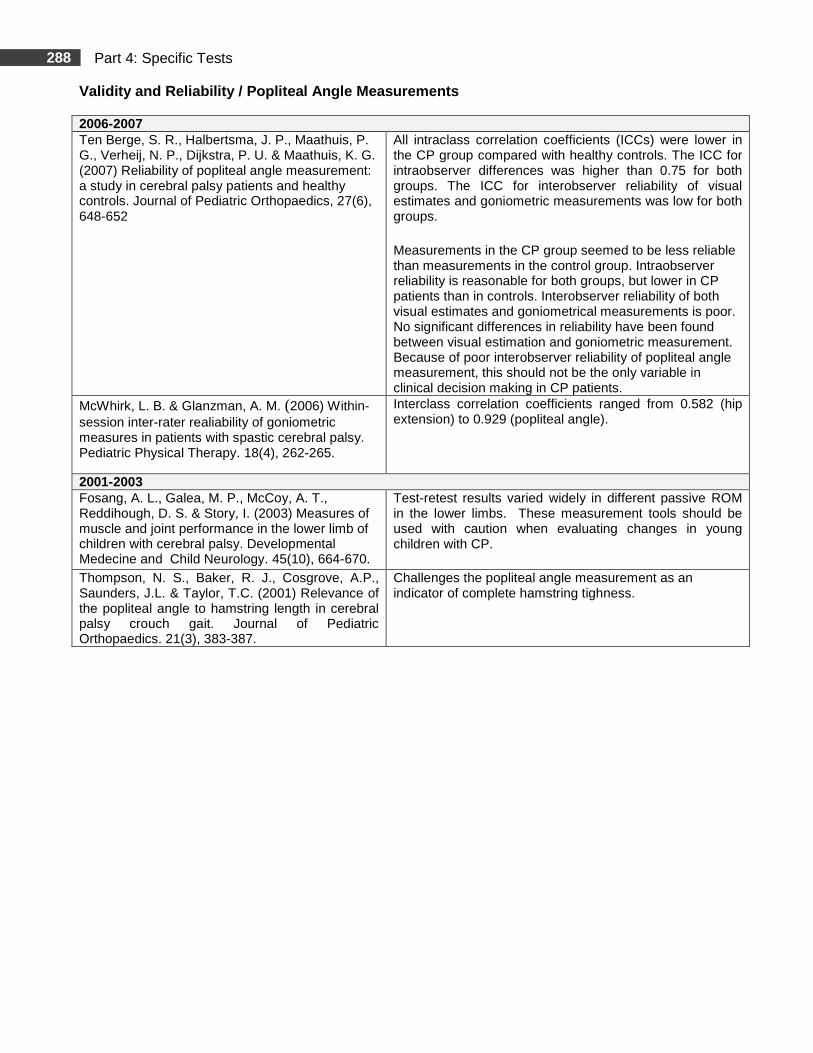
288 Part 4: Specific Tests
Validity and Reliability / Popliteal Angle Measurem ents
2006-2007 Ten Berge, S. R., Halbertsma, J. P., Maathuis, P. G., Verheij, N. P., Dijkstra, P. U. & Maathuis, K. G. (2007) Reliability of popliteal angle measurement: a study in cerebral palsy patients and healthy controls. Journal of Pediatric Orthopaedics, 27(6), 648-652
All intraclass correlation coefficients (ICCs) were lower in the CP group compared with healthy controls. The ICC for intraobserver differences was higher than 0.75 for both groups. The ICC for interobserver reliability of visual estimates and goniometric measurements was low for both groups.
Measurements in the CP group seemed to be less reliable than measurements in the control group. Intraobserver reliability is reasonable for both groups, but lower in CP patients than in controls. Interobserver reliability of both visual estimates and goniometrical measurements is poor. No significant differences in reliability have been found between visual estimation and goniometric measurement. Because of poor interobserver reliability of popliteal angle measurement, this should not be the only variable in clinical decision making in CP patients.
McWhirk, L. B. & Glanzman, A. M. (2006) Within-session inter-rater realiability of goniometric measures in patients with spastic cerebral palsy. Pediatric Physical Therapy. 18(4), 262-265.
Interclass correlation coefficients ranged from 0.582 (hip extension) to 0.929 (popliteal angle).
2001-2003 Fosang, A. L., Galea, M. P., McCoy, A. T., Reddihough, D. S. & Story, I. (2003) Measures of muscle and joint performance in the lower limb of children with cerebral palsy. Developmental Medecine and Child Neurology. 45(10), 664-670.
Test-retest results varied widely in different passive ROM in the lower limbs. These measurement tools should be used with caution when evaluating changes in young children with CP.
Thompson, N. S., Baker, R. J., Cosgrove, A.P., Saunders, J.L. & Taylor, T.C. (2001) Relevance of the popliteal angle to hamstring length in cerebral palsy crouch gait. Journal of Pediatric Orthopaedics. 21(3), 383-387.
Challenges the popliteal angle measurement as an indicator of complete hamstring tighness.
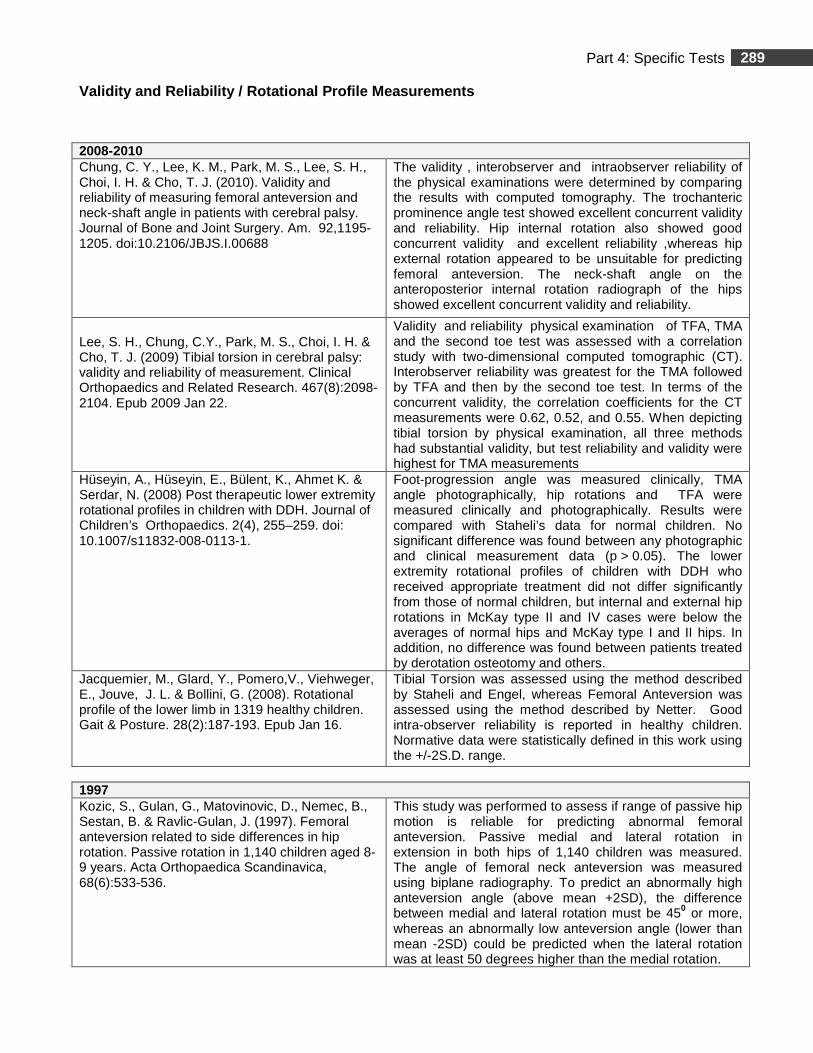
289 Part 4: Specific Tests
Validity and Reliability / Rotational Profile Measu rements
2008-2010 Chung, C. Y., Lee, K. M., Park, M. S., Lee, S. H., Choi, I. H. & Cho, T. J. (2010). Validity and reliability of measuring femoral anteversion and neck-shaft angle in patients with cerebral palsy. Journal of Bone and Joint Surgery. Am. 92,1195-1205. doi:10.2106/JBJS.I.00688
The validity , interobserver and intraobserver reliability of the physical examinations were determined by comparing the results with computed tomography. The trochanteric prominence angle test showed excellent concurrent validity and reliability. Hip internal rotation also showed good concurrent validity and excellent reliability ,whereas hip external rotation appeared to be unsuitable for predicting femoral anteversion. The neck-shaft angle on the anteroposterior internal rotation radiograph of the hips showed excellent concurrent validity and reliability.
Lee, S. H., Chung, C.Y., Park, M. S., Choi, I. H. & Cho, T. J. (2009) Tibial torsion in cerebral palsy: validity and reliability of measurement. Clinical Orthopaedics and Related Research. 467(8):2098-2104. Epub 2009 Jan 22.
Validity and reliability physical examination of TFA, TMA and the second toe test was assessed with a correlation study with two-dimensional computed tomographic (CT). Interobserver reliability was greatest for the TMA followed by TFA and then by the second toe test. In terms of the concurrent validity, the correlation coefficients for the CT measurements were 0.62, 0.52, and 0.55. When depicting tibial torsion by physical examination, all three methods had substantial validity, but test reliability and validity were highest for TMA measurements
Hüseyin, A., Hüseyin, E., Bülent, K., Ahmet K. & Serdar, N. (2008) Post therapeutic lower extremity rotational profiles in children with DDH. Journal of Children’s Orthopaedics. 2(4), 255–259. doi: 10.1007/s11832-008-0113-1.
Foot-progression angle was measured clinically, TMA angle photographically, hip rotations and TFA were measured clinically and photographically. Results were compared with Staheli’s data for normal children. No significant difference was found between any photographic and clinical measurement data (p > 0.05). The lower extremity rotational profiles of children with DDH who received appropriate treatment did not differ significantly from those of normal children, but internal and external hip rotations in McKay type II and IV cases were below the averages of normal hips and McKay type I and II hips. In addition, no difference was found between patients treated by derotation osteotomy and others.
Jacquemier, M., Glard, Y., Pomero,V., Viehweger, E., Jouve, J. L. & Bollini, G. (2008). Rotational profile of the lower limb in 1319 healthy children. Gait & Posture. 28(2):187-193. Epub Jan 16.
Tibial Torsion was assessed using the method described by Staheli and Engel, whereas Femoral Anteversion was assessed using the method described by Netter. Good intra-observer reliability is reported in healthy children. Normative data were statistically defined in this work using the +/-2S.D. range.
1997 Kozic, S., Gulan, G., Matovinovic, D., Nemec, B., Sestan, B. & Ravlic-Gulan, J. (1997). Femoral anteversion related to side differences in hip rotation. Passive rotation in 1,140 children aged 8-9 years. Acta Orthopaedica Scandinavica, 68(6):533-536.
This study was performed to assess if range of passive hip motion is reliable for predicting abnormal femoral anteversion. Passive medial and lateral rotation in extension in both hips of 1,140 children was measured. The angle of femoral neck anteversion was measured using biplane radiography. To predict an abnormally high anteversion angle (above mean +2SD), the difference between medial and lateral rotation must be 450 or more, whereas an abnormally low anteversion angle (lower than mean -2SD) could be predicted when the lateral rotation was at least 50 degrees higher than the medial rotation.
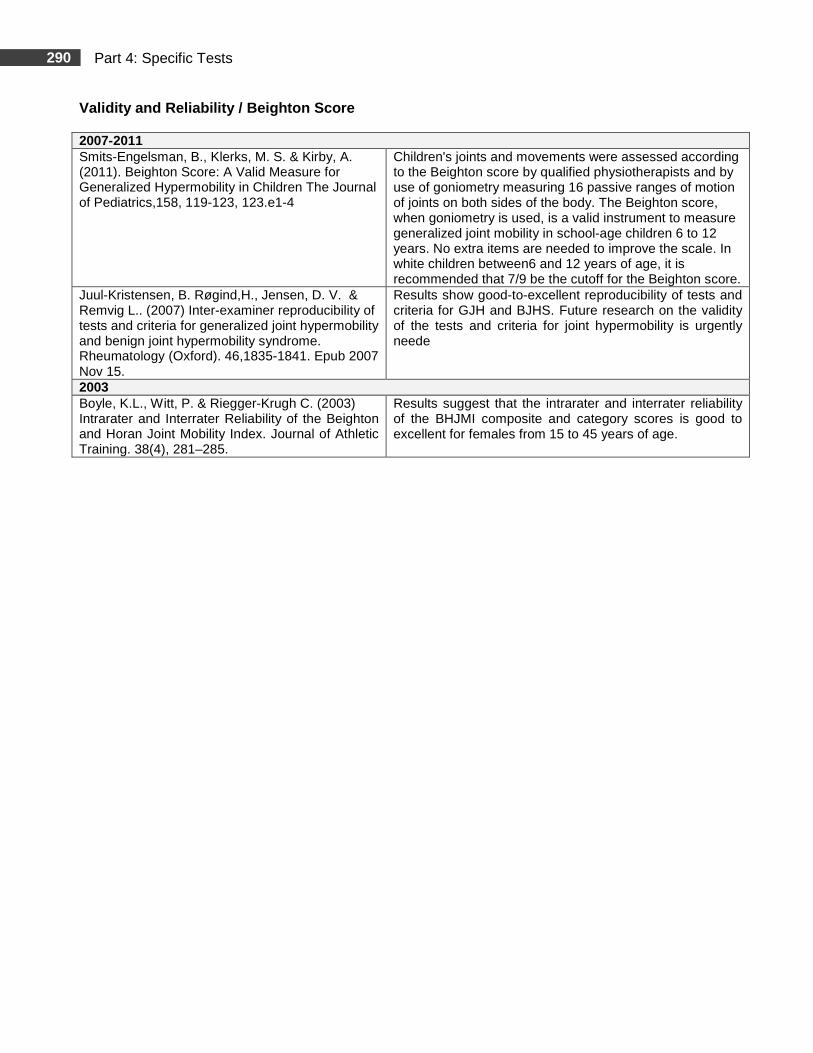
290 Part 4: Specific Tests
Validity and Reliability / Beighton Score
2007-2011 Smits-Engelsman, B., Klerks, M. S. & Kirby, A. (2011). Beighton Score: A Valid Measure for Generalized Hypermobility in Children The Journal of Pediatrics,158, 119-123, 123.e1-4
Children's joints and movements were assessed according to the Beighton score by qualified physiotherapists and by use of goniometry measuring 16 passive ranges of motion of joints on both sides of the body. The Beighton score, when goniometry is used, is a valid instrument to measure generalized joint mobility in school-age children 6 to 12 years. No extra items are needed to improve the scale. In white children between6 and 12 years of age, it is recommended that 7/9 be the cutoff for the Beighton score.
Juul-Kristensen, B. Røgind,H., Jensen, D. V. & Remvig L.. (2007) Inter-examiner reproducibility of tests and criteria for generalized joint hypermobility and benign joint hypermobility syndrome. Rheumatology (Oxford). 46,1835-1841. Epub 2007 Nov 15.
Results show good-to-excellent reproducibility of tests and criteria for GJH and BJHS. Future research on the validity of the tests and criteria for joint hypermobility is urgently neede
2003 Boyle, K.L., Witt, P. & Riegger-Krugh C. (2003) Intrarater and Interrater Reliability of the Beighton and Horan Joint Mobility Index. Journal of Athletic Training. 38(4), 281–285.
Results suggest that the intrarater and interrater reliability of the BHJMI composite and category scores is good to excellent for females from 15 to 45 years of age.