Embed Size (px)
Citation preview
PART 1
Livestock – Sheep
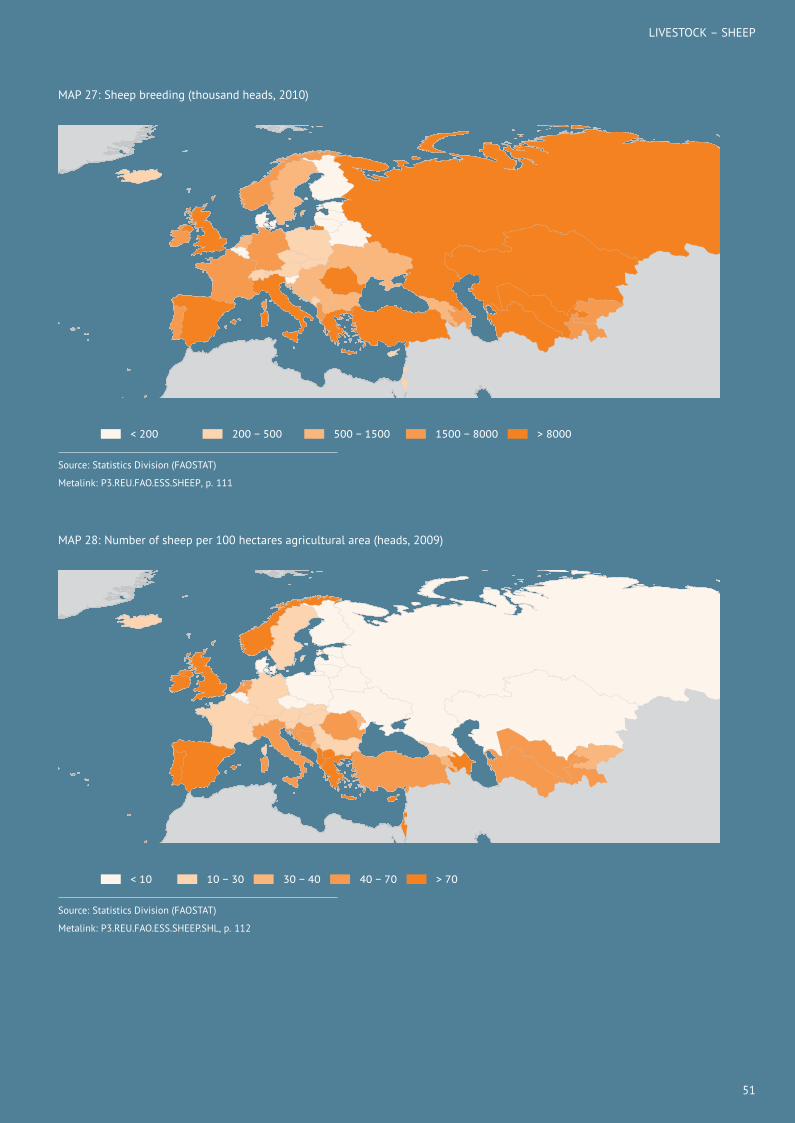
The global number of sheep exceeded 1 billion head in 2010.Sheep are cheap to maintain and can provide both food andnon-food products. These factors mean that sheep breedinghas an important role to play in the developing world. This isespecially pertinent as 70 percent of global livestock can befound in Asia and Africa.
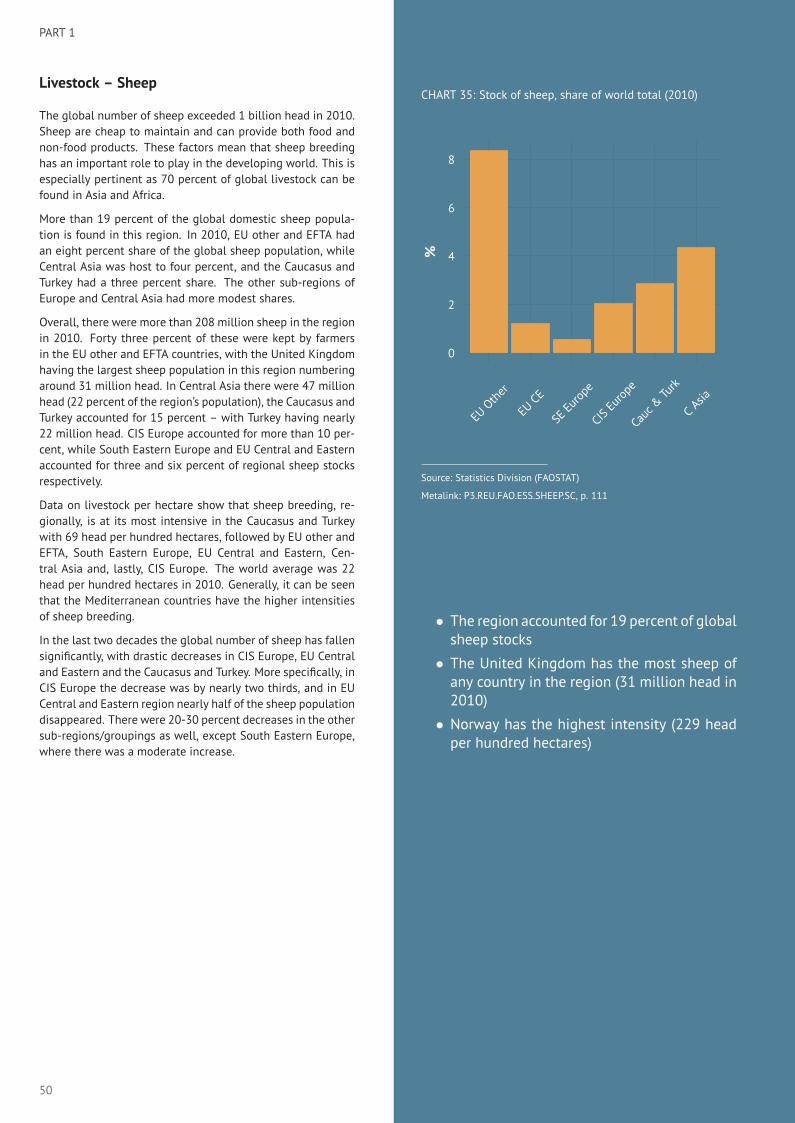
More than 19 percent of the global domestic sheep popula-tion is found in this region. In 2010, EU other and EFTA hadan eight percent share of the global sheep population, whileCentral Asia was host to four percent, and the Caucasus andTurkey had a three percent share. The other sub-regions ofEurope and Central Asia had more modest shares.
Overall, there were more than 208 million sheep in the regionin 2010. Forty three percent of these were kept by farmersin the EU other and EFTA countries, with the United Kingdomhaving the largest sheep population in this region numberingaround 31 million head. In Central Asia there were 47 millionhead (22 percent of the region’s population), the Caucasus andTurkey accounted for 15 percent – with Turkey having nearly22 million head. CIS Europe accounted for more than 10 per-cent, while South Eastern Europe and EU Central and Easternaccounted for three and six percent of regional sheep stocksrespectively.
Data on livestock per hectare show that sheep breeding, re-gionally, is at its most intensive in the Caucasus and Turkeywith 69 head per hundred hectares, followed by EU other andEFTA, South Eastern Europe, EU Central and Eastern, Cen-tral Asia and, lastly, CIS Europe. The world average was 22head per hundred hectares in 2010. Generally, it can be seenthat the Mediterranean countries have the higher intensitiesof sheep breeding.
In the last two decades the global number of sheep has fallensignificantly, with drastic decreases in CIS Europe, EU Centraland Eastern and the Caucasus and Turkey. More specifically, inCIS Europe the decrease was by nearly two thirds, and in EUCentral and Eastern region nearly half of the sheep populationdisappeared. There were 20-30 percent decreases in the othersub-regions/groupings as well, except South Eastern Europe,where there was a moderate increase.
CHART 35: Stock of sheep, share of world total (2010)
0
2
4
6
8
EUOther
EUCE
SEEurope
CISEurope
Cauc&Turk
C Asia
%
Source: Statistics Division (FAOSTAT)
Metalink: P3.REU.FAO.ESS.SHEEP.SC, p. 111
• The region accounted for 19 percent of globalsheep stocks
• The United Kingdom has the most sheep ofany country in the region (31 million head in2010)
• Norway has the highest intensity (229 headper hundred hectares)
50
LIVESTOCK – SHEEP
MAP 27: Sheep breeding (thousand heads, 2010)
< 200 200 − 500 500 − 1500 1500 − 8000 > 8000
Source: Statistics Division (FAOSTAT)
Metalink: P3.REU.FAO.ESS.SHEEP, p. 111
MAP 28: Number of sheep per 100 hectares agricultural area (heads, 2009)
< 10 10 − 30 30 − 40 40 − 70 > 70
Source: Statistics Division (FAOSTAT)
Metalink: P3.REU.FAO.ESS.SHEEP.SHL, p. 112
51
PART 1
Livestock – Poultry
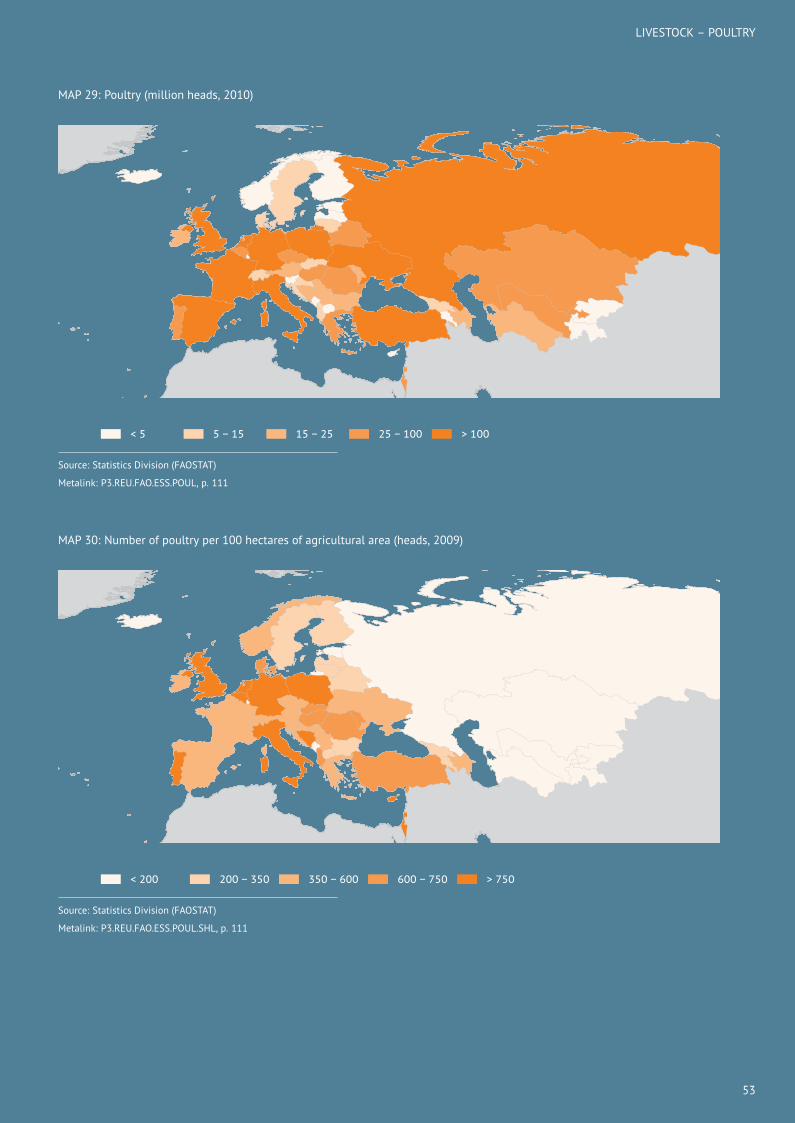
The poultry sector is one of the most rapidly growing sub-sectors of the livestock industry. Production is becoming moreintensive and vertically integrated due to technological ad-vancements. Global demand is expected to continue growing,and Asia − prominently China − is playing a main role in thistrend.
In 2010 there weremore than 21 billion heads of poultry in theworld, and 11 percent of this global stock was in this region.The EU other and EFTA accounted for five percent of the globalstock, CIS Europe for three percent, EU Central and Eastern fortwo percent. The other sub-regions of Europe and Central Asiahad lower shares.
More than 83 percent of the 2.5 billion heads of poultry in thisregion (2010 data) was in CIS Europe, and the EU and EFTAsub-regions. The Caucasus and Turkey accounted for another11 percent. Nearly 404 million heads of poultry was kept inthe Russian Federation, 234 million in Turkey and 190 millionin Ukraine. There are further significant stocks in countrieslike France, the United Kingdom, Italy and Spain.
In 2010, the average number of poultry in the world was 422thousand per hundred hectares. In this region, characteristicdifferences can be seen among the different sub-regions. Gen-erally, intensity tends to decrease fromwest to east, which canbe explained by the general economic conditions and techno-logical gaps between the countries. In EU other and EFTA theindicator was 744,000 heads per capita, while in EU Centraland Eastern the per capita figure was 662,000 and 226,000 inCIS Europe.
Globally, poultry numbers have increased by two thirds overthe last two decades. In line with this, there has been signifi-cant growth in South Eastern Europe, the Caucasus and Turkeyand in EU Central and Eastern, while contrary to this globaltrend, in CIS Europe and Central Asia the poultry populationhas fallen considerably.
CHART 36: Stock of poultry, share of world total (2010)
0
1
2
3
4
5
EUOther
EUCE
SEEurope
CISEurope
Cauc&Turk
C Asia
%
Source: Statistics Division (FAOSTAT)
Metalink: P3.REU.FAO.ESS.POUL.SC, p. 111
• The region accounts for 11 percent of theglobal poultry population
• The Russian Federation has the highest poul-try head count (403 million heads)
• The Netherlands has the highest intensity, at5.2 million heads per hundred hectares
52
LIVESTOCK – POULTRY
MAP 29: Poultry (million heads, 2010)
< 5 5 − 15 15 − 25 25 − 100 > 100
Source: Statistics Division (FAOSTAT)
Metalink: P3.REU.FAO.ESS.POUL, p. 111
MAP 30: Number of poultry per 100 hectares of agricultural area (heads, 2009)
< 200 200 − 350 350 − 600 600 − 750 > 750
Source: Statistics Division (FAOSTAT)
Metalink: P3.REU.FAO.ESS.POUL.SHL, p. 111
53