Embed Size (px)
Citation preview

1Biological Nutrient Removal

Activated Sludge Process Flow Diagram
Effluent
ClarifierInfluent Basin
Waste Activated Sludge
(WAS)
Return Activated Sludge
Mixed Liquor Suspended Solids - MLSS (“bugs” eat the crap and grow to make more bugs)
Treatment is managed by wasting excess “bugs” to control the average time MLSS stays in the system. Average time is the Sludge Residence Time (SRT) or Mean Cell Residence Time (MCRT) also known as Sludge Age.

Terminology
Free Oxygen Present?
Nitrate (NO3) Present?
Used For
Oxic/ Aerobic
Yes -- Nitrification & BOD Removal Aerobic Removal
Anoxic No Yes Denitrification & BOD Removal
Anaerobic No No Biological Phosphorous Removal

Nutrient Removal Basics
� Nitrogen
• Step 1: Nitrification
• Step 2: Denitrification• Step 2: Denitrification
� Phosphorus
• Step 1: Release
• Step 2: Uptake

How are N and P expressed?
Ammonia (NH4+1) OR ammonia Nitrogen (NH4-N)
1 mg/L of NH4+1 = 0.78 mg/L NH4-N
Nitrate (NO3-3) OR Nitrate Nitrogen (NO3-N)
1 mg/L of NO -3 = 0.23 mg/L of NO -N1 mg/L of NO3-3 = 0.23 mg/L of NO3-N
orthophosphate (PO4- 3 ) OR phosphate as P ( PO4-P)
1 mg/L of PO4- 3 = 0.33 mg/L of PO4-P
� Know how Lab results are given. Wastewater labs may report the results differently than Water labs

Step 1 - Nitrification
Responsible Bacteria
Nitrosomonas & Nitrobactor (Autotrophs)
Requires Oxygen4.6 mg O2 / mg NH4+-N4.6 mg O2 / mg NH4+-N
Consumes Alkalinity 7.1 mg CaCO3 / mg NH4
+-N
Considerations
Temperature
Inhibition
Nitrification
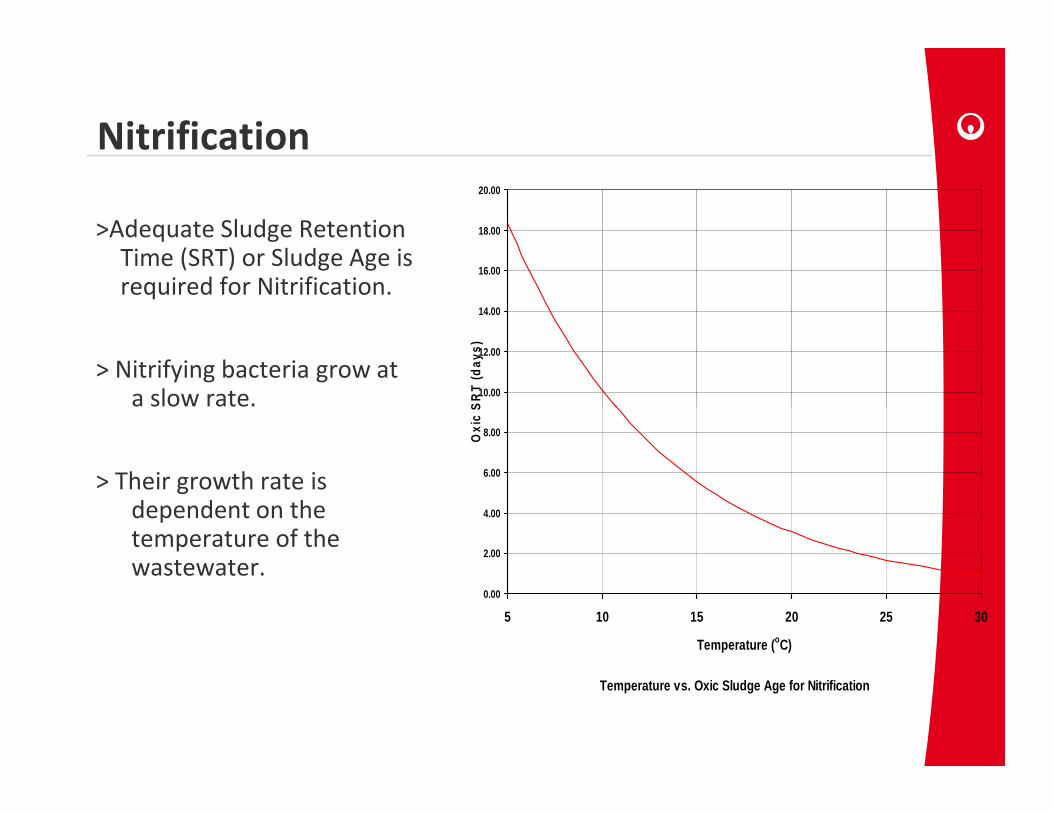
>Adequate Sludge Retention Time (SRT) or Sludge Age is required for Nitrification.
> Nitrifying bacteria grow at a slow rate. 10.00
12.00
14.00
16.00
18.00
20.00
Oxi
c S
RT
(day
s)
a slow rate.
> Their growth rate isdependent on the temperature of the wastewater.
Temperature vs. Oxic Sludge Age for Nitrification
0.00
2.00
4.00
6.00
8.00
5 10 15 20 25 30
Temperature (oC)
Oxi
c S
RT
(day
s)
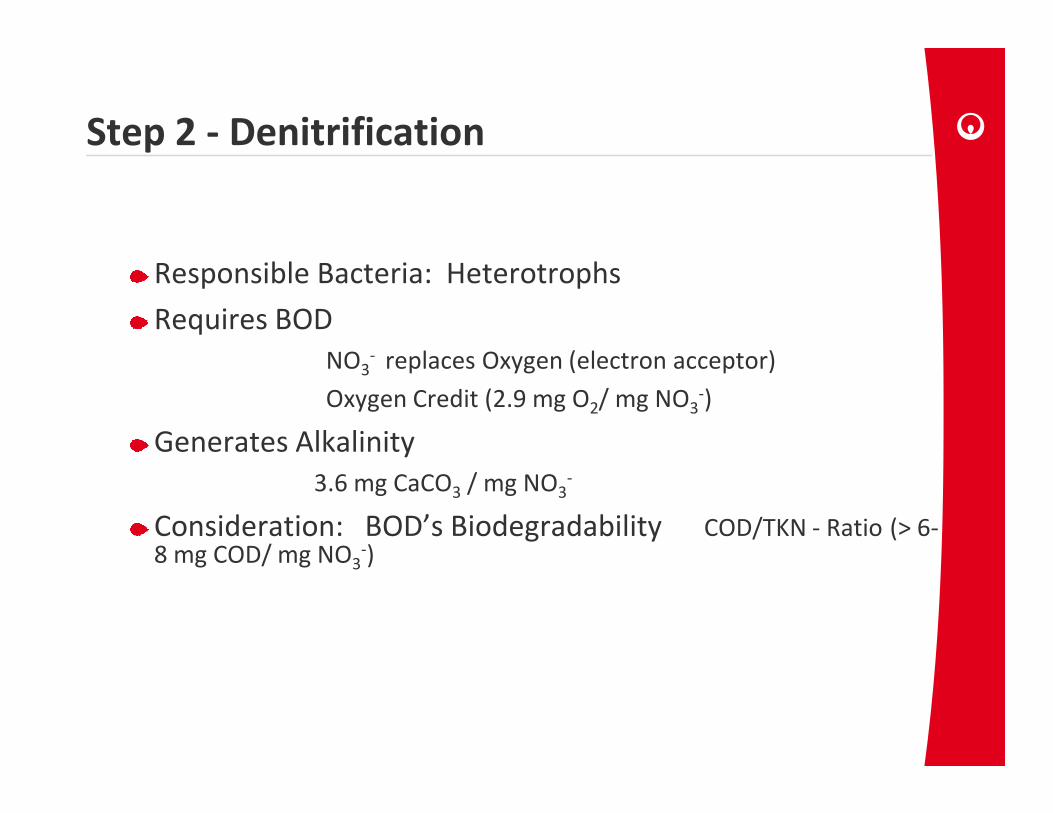
Step 2 - Denitrification
Responsible Bacteria: Heterotrophs
Requires BOD
NO3- replaces Oxygen (electron acceptor)
Oxygen Credit (2.9 mg O2/ mg NO3-)Oxygen Credit (2.9 mg O2/ mg NO3 )
Generates Alkalinity
3.6 mg CaCO3 / mg NO3-
Consideration: BOD’s Biodegradability COD/TKN - Ratio (> 6-8 mg COD/ mg NO3
-)

Benefits to Denitrification
Comply with Effluent Requirements
Saves Energy (~15%)
Regains AlkalinityRegains Alkalinity
Improves Performance of Secondary Clarifiers
Environmental Impacts
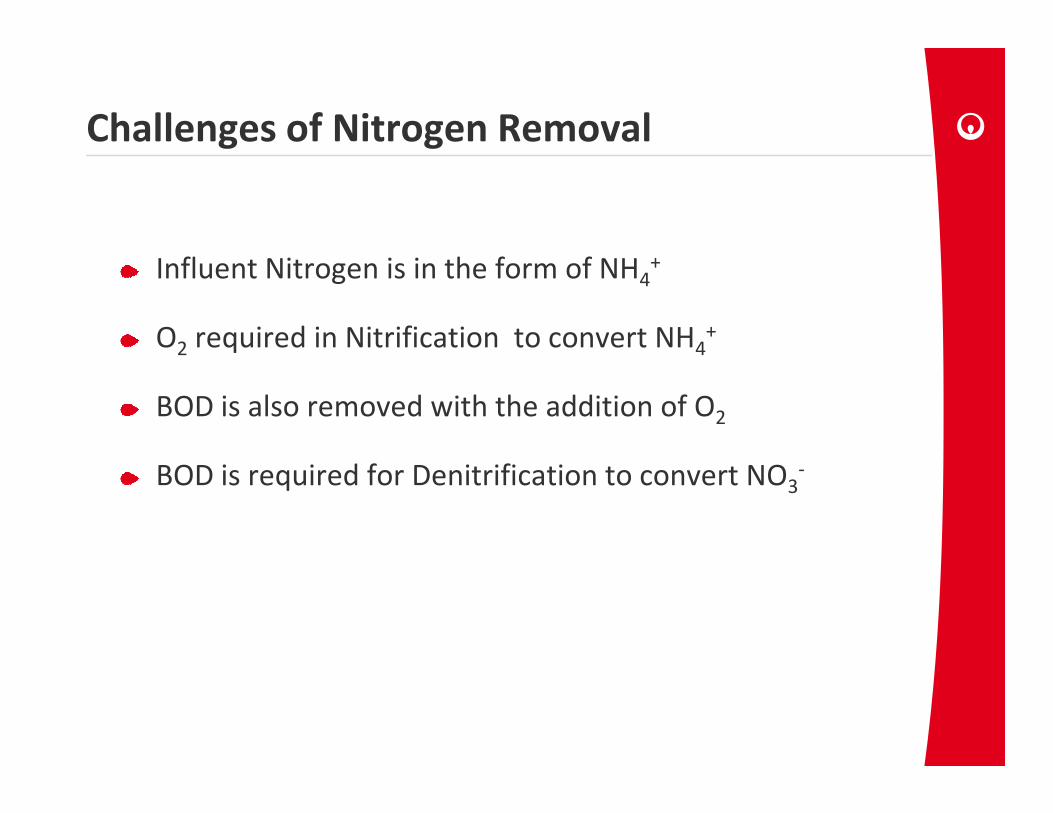
Challenges of Nitrogen Removal
Influent Nitrogen is in the form of NH4+
O2 required in Nitrification to convert NH4+
BOD is also removed with the addition of O2BOD is also removed with the addition of O2
BOD is required for Denitrification to convert NO3-

Typical 5-Stage for Bio-P and N removal
Aerobic Reaeration AnaerobicInfluentWastewater
Clarifier
PrimaryAnoxic
SecondaryAnoxic
ClarifierEffluent
Phosphorus Rich Waste Sludge
Internal Recycle
Return Activated Sludge

Meeting Low Nitrogen limits
Total Nitrogen (TN)
- NH3-N
- NO3-N + NO2-N- NO3-N + NO2-N
- Organic N (rDON = refractory dissolved organic nitrogen)
- N in effluent TSS

Effluent Total Nitrogen
What is the limit of technology (LOT)?
Effluent TSS needs to be low
o Typical 6 to 8% N content
o N in effluent solids = (5 mg/L)(0.07) = 0.35 mg/LRefractory Soluble organic (rDON)
< 0.7 mg/L – No sludge dewatering or aerobico < 0.7 mg/L – No sludge dewatering or aerobic
o >1.2 mg/L – Anaerobically Digested Sludge dewatering
�For effluent TN < 3 mg/L
1 to 2 mg/L of TN not easily removed

Breakdown for Effluent TN < 5 mg N/L
1.5
2
2.5
Org N
0
0.5
1
1.5 Org NNH3-NNO3-NN(TSS)
mg/L

Phosphorous Removal
Biological
ChemicalChemical
15

Biological Phosphorus Removal
Phosphate Accumulating Organisms (PAOs):
• Heterotrophic: Require external carbon source.
• Facultative: Thrive in both anaerobic and aerobic conditions.
BPR Process requires:
• Soluble carbon source (BOD).
• Strict anaerobic conditions (no nitrates).
• Anaerobic/aerobic cycling.

Biological Mechanism of P Removal
Anaerobic
PolyPhosphate
Organics (sBOD)
OxicOrthoPhosphate
BODOxidation
Oxygen
PolyPhosphate
Energy
OrthoPhosphate
BODOxidation
Energy
+ Soluble Phosphorus
Soluble Phosphorus

Polyphosphate shown in an A/O plant WAS sample
CONTROL SLUDGE(NO GRANULES)
POLYPHOSPHATE(GRANULES)
1000 x 1000 x

Phosphate and BOD Profiles
Anaerobic Anoxic Oxic

Anaerobic Selector Technology for Bio-P
Principle:
The microorganism which accumulates the majority of theavailable food will dominate an activate sludge culture.

Biological Phosphorus Removal
KEY CONSIDERATIONS
1. Influent Soluble BOD/P ratio ? If this is high (>25) system can be very forgiving.
2. Eliminate/minimize electron acceptors to anaerobic selector 2. Eliminate/minimize electron acceptors to anaerobic selector
- avoid adding DO
- NO3 in concentration in selector feed stream?
- recycle streams (digestion releases part of bio-P)
3. What is the design MCRT? Is sludge going to be adequately wasted? Will there be a bottleneck?

Hollister, MO P-Release Profile
15
20
25
Tota
l Ph
osp
ho
rus
(mg
/l)
10
12
14
16
18
RA
S D
O /
Nit
rate
(m
g/l
)
Selector Basin PhosphorusRAS NitrateRAS Dissolved Oxygen
Improved P release when DO and
0
5
10
5/15/96 8/23/96 12/1/96 3/11/97 6/19/97 9/27/97 1/5/98 4/15/98
Tota
l Ph
osp
ho
rus
(mg
/l)
0
2
4
6
8
10
RA
S D
O /
Nit
rate
(m
g/l
)
Improved P release when DO and
nitrate eliminated from RAS flow
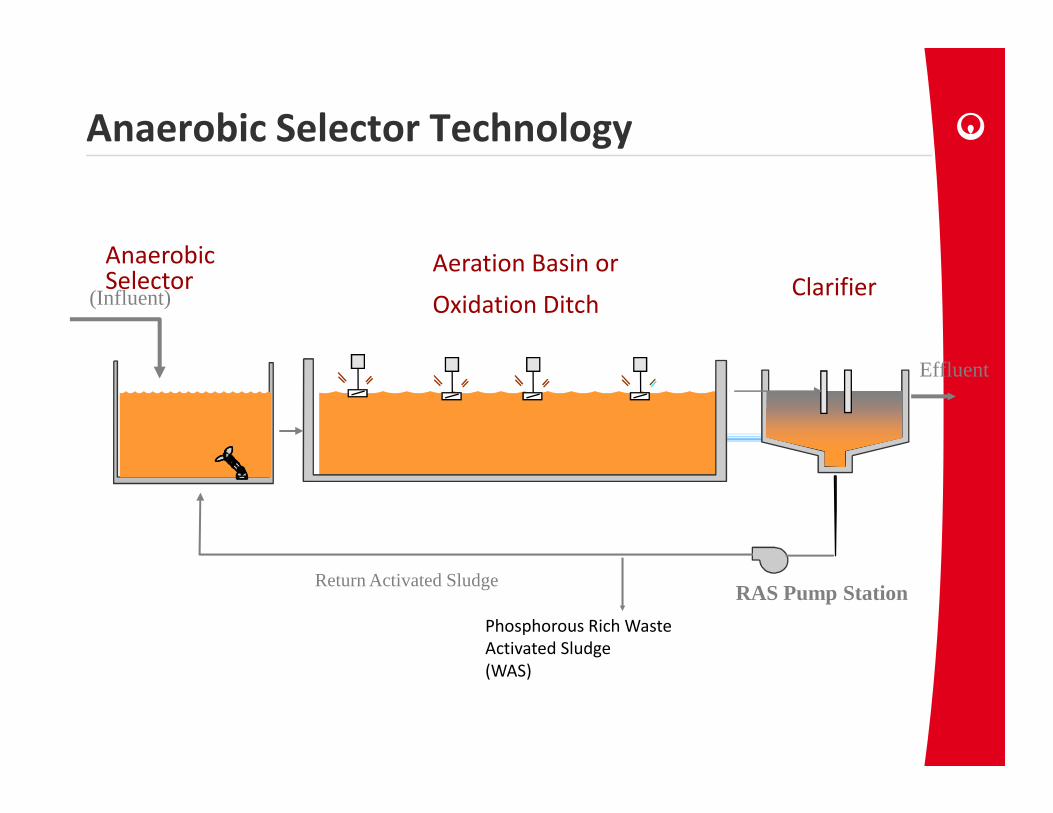
Anaerobic Selector Technology
Effluent
Clarifier(Influent)
Aeration Basin or
Oxidation Ditch
Anaerobic Selector
Phosphorous Rich Waste
Activated Sludge
(WAS)
Return Activated SludgeRAS Pump Station

To Anoxic
or Aerobic
Anoxic
Anaerobic
Influent Wastewater
Single Stage Selector
or Aerobic
Zone
RAS

Block and Hong Anaerobic Selector Configuration
Denitrification
Anaerobic
Influent
• Excellent for low
influent BOD/TP
• Avoid consumption
RAS
• Avoid consumption
of influent soluble
carbon by removing
residual NO3

Elizabethtown, PA – Block and Hong Anaerobic Selector
Block and Hong
Anaerobic Selector

Effluent TP 0.2 to 2 mg/l from Bio-P Removal
Effluent P achieved depends on influent soluble BOD in the
form of VFAs (Volitale Fatty Acids)
P in effluent TSS can be significant from Bio-P removal
For Low P - Effluent TSS needs to be very low
- Normal activated sludge P content is 2%
- Typical 4% on dry basis
- As high as 8% referenced in literature
TP in effluent solids = (5 mg/L)(0.04) = 0.2 mg/L

ApplicationsApplications
28

Typical 5-Stage for Bio-P and N removal
Aerobic Reaeration AnaerobicInfluentWastewater
Clarifier
PrimaryAnoxic
SecondaryAnoxic
ClarifierEffluent
Phosphorus Rich Waste Sludge
Internal Recycle
Return Activated Sludge

Primary Anoxic Zones
� Internal Recycle returns nitrate ahead of the oxic zone where BOD is available for Denitrification
� Utilizes BOD available in the influent
� Recycle Rates typically 200 to 400% of influent FlowFlow
� Typically can achieve 60 to 80% removal of influent TN
� 6 to 10 mg/L effluent TN
30

OVERVIEW of Secondary Anoxic Zones
� Added downstream of the aerobic (nitrification stage) in MLE, A20,
processes, etc
� 4 or 5-Stage Process (ANO)
� Typically yields 3 to 5 mg/l effluent TN
(85 to 93 % removal of oxidizable influent TKN)(85 to 93 % removal of oxidizable influent TKN)
� Low specific denitrification rates (endogenous) can result in large
volumes
o Rates 5 to 10 times lower than primary anoxic zones
� Carbon limitations may necessitate supplemental carbon addition
(i.e. methanol, acetate)
o ex: high TKN return streams from anaerobic or thermophilic sludge processing

Typically add a supplemental carbon
Achieves 2 to 4 mg/L effluent TN
The most common is methanol
Utilized only by Methylotrophs
Typical ratio 2.8 to 3.1 mg MeOH / mg NO3
OVERVIEW of Secondary Anoxic Zones
Typical ratio 2.8 to 3.1 mg MeOH / mg NO3
Current cost is $1.25/gal
Has been $2.50/gal
Typical detention time is 2 to 2.5 hours
Usually followed by an aerobic sage to burn off excess methanol
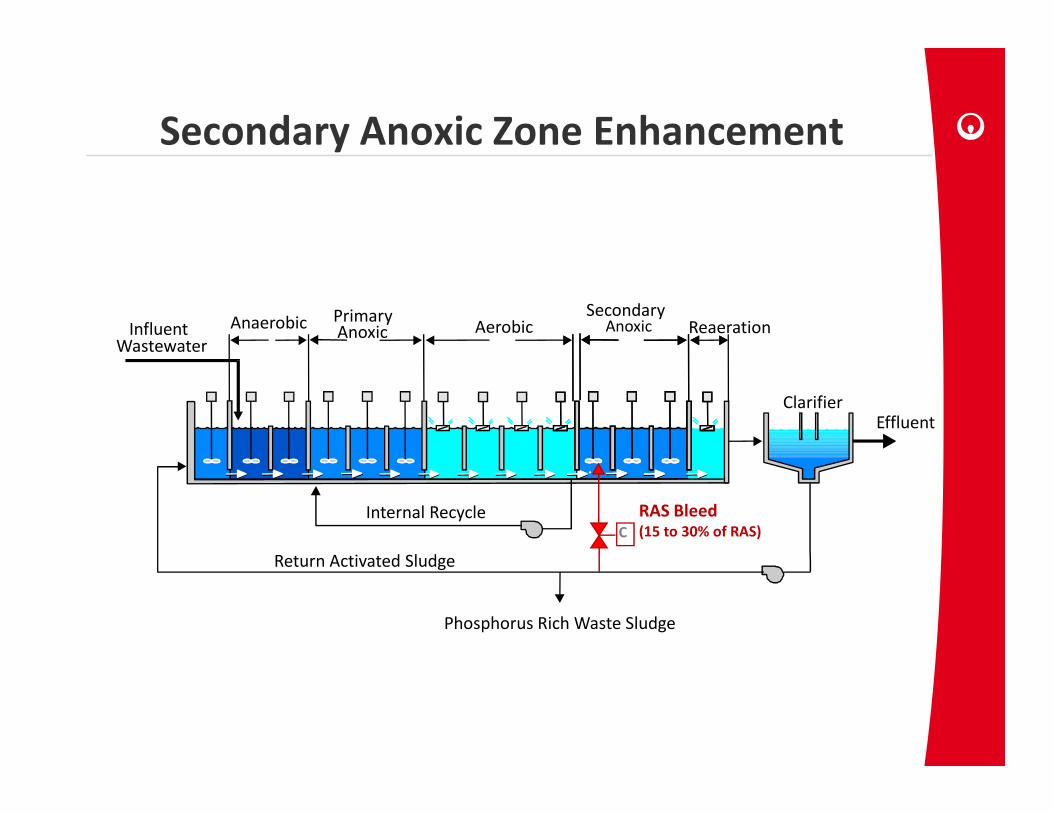
Secondary Anoxic Zone Enhancement
Aerobic Reaeration AnaerobicInfluentWastewater
Clarifier
PrimaryAnoxic
SecondaryAnoxic
ClarifierEffluent
Phosphorus Rich Waste Sludge
Internal Recycle
Return Activated Sludge
C
RAS Bleed(15 to 30% of RAS)
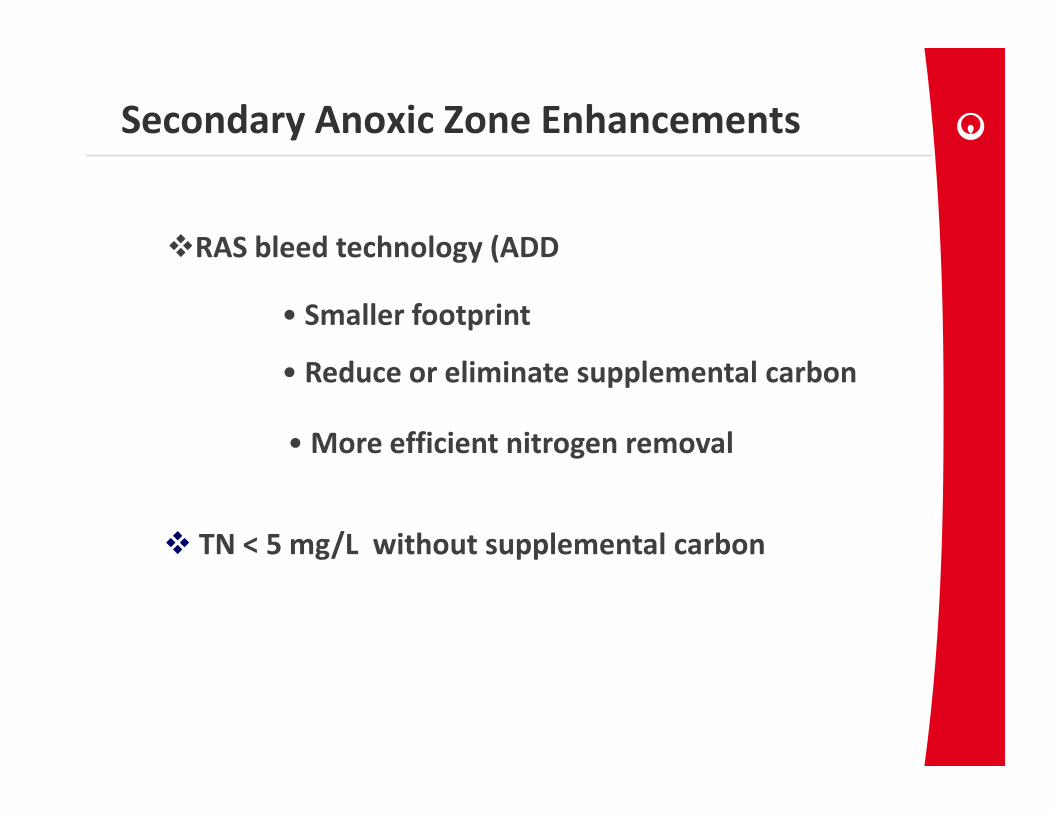
Secondary Anoxic Zone Enhancements
�RAS bleed technology (ADD
• Smaller footprint
• Reduce or eliminate supplemental carbon
• More efficient nitrogen removal
� TN < 5 mg/L without supplemental carbon
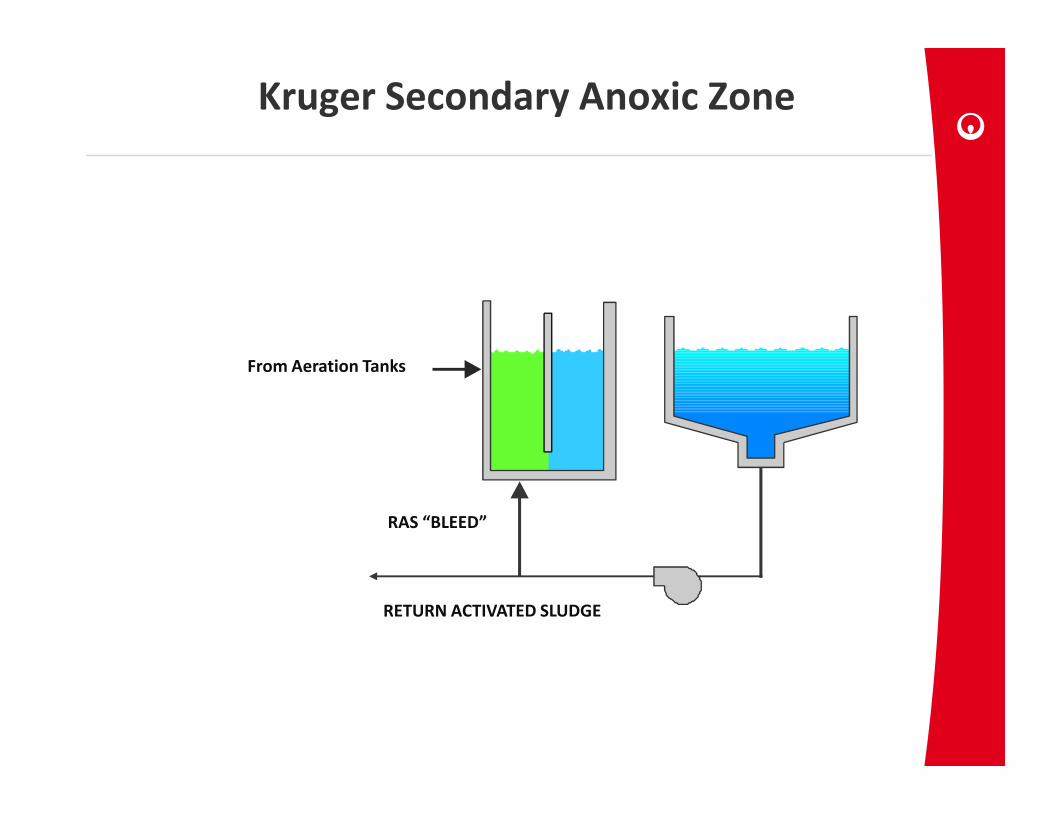
Kruger Secondary Anoxic Zone
From Aeration Tanks
RETURN ACTIVATED SLUDGE
RAS “BLEED”

� Increases working biomass
� Enhances specific denitrification rate (SDNR)
Expected Benefits of RAS Addition
� Enhances specific denitrification rate (SDNR)Additional substrate
Enzymatic adaptations completed

DERRY TOWNSHIP
WWTP
Primary
Anoxics
Oxic
Zones
Secondary
Anoxics

DERRY Township An/O Process
Anaerobic Digesters recycle ammonia back to head of plant
Low BOD/TN ratio in influent ( < 3.9 mg/L BOD / mg/L N)
Enhanced DO control based on ammonia concentration in
process (i.e Like STAC - Load Based DO control
RAS Bleed to Secondary Anoxic Zone to improve N removal

Primary Effluent Final Effluent Unit
Average Daily Flow
Peak Daily Flow
BOD
6.3
18
152
--
--
< 15
MGD
MGD
mg/l
DERRY Township An/O Process
BOD
TSS
NH3-N
TN
Temp (min/max)
152
81
30
--
8/20
< 15
< 15
< 1.0
< 7.0*
--
mg/l
mg/l
mg/l
mg/l
°C

Derry Township RAS Bleed Study
With RAS Bleed
W/O RAS Bleed
RAS Bleed (% of RAS Flow) 25 --
MLSS Increase in Secondary Anoxic Zone (mg/L) 650 ( ≈ 20% over Oxic Zone)
--
Soluble BOD in RAS (mg/L) 11 --
SDNR in 1st Stage of Secondary Anoxic Zone (mg NO3-N / g VSS•hr)
0.76 0.62
NO3-N Removed in Secondary Anoxic Zone (lbs/day) 158 109
Effluent TN (mg/L) 3.5 5.3*

Branford, CT – 6.5 MGD An/O

Branford, CT
3333
4444
5555
6666
-N (m
g/L)
-N (m
g/L)
-N (m
g/L)
-N (m
g/L)
0000
1111
2222
3333
Aug-Aug-Aug-Aug-05050505
Oct-Oct-Oct-Oct-05050505
Dec-Dec-Dec-Dec-05050505
Feb-Feb-Feb-Feb-06060606
Apr-Apr-Apr-Apr-06060606
Jun-Jun-Jun-Jun-06060606
Aug-Aug-Aug-Aug-06060606
Oct-Oct-Oct-Oct-06060606
Dec-Dec-Dec-Dec-06060606
Feb-Feb-Feb-Feb-07070707
Apr-Apr-Apr-Apr-07070707
Jun-Jun-Jun-Jun-07070707
Aug-Aug-Aug-Aug-07070707
Oct-Oct-Oct-Oct-07070707
DateDateDateDate
NO
NO
NO
NO
xx xx-N
(mg/
L)-N
(mg/
L)-N
(mg/
L)-N
(mg/
L)
Without RAS Addition With RAS Addition

BIO-DENIPHO Technology
Two or more phased ditches with an Anaerobic Selector to facilitate bio-P removal.
The ditches alternate between oxic and anoxic conditions in The ditches alternate between oxic and anoxic conditions in order to achieve efficient and flexible nitrogen removal without internal recycle pumps.
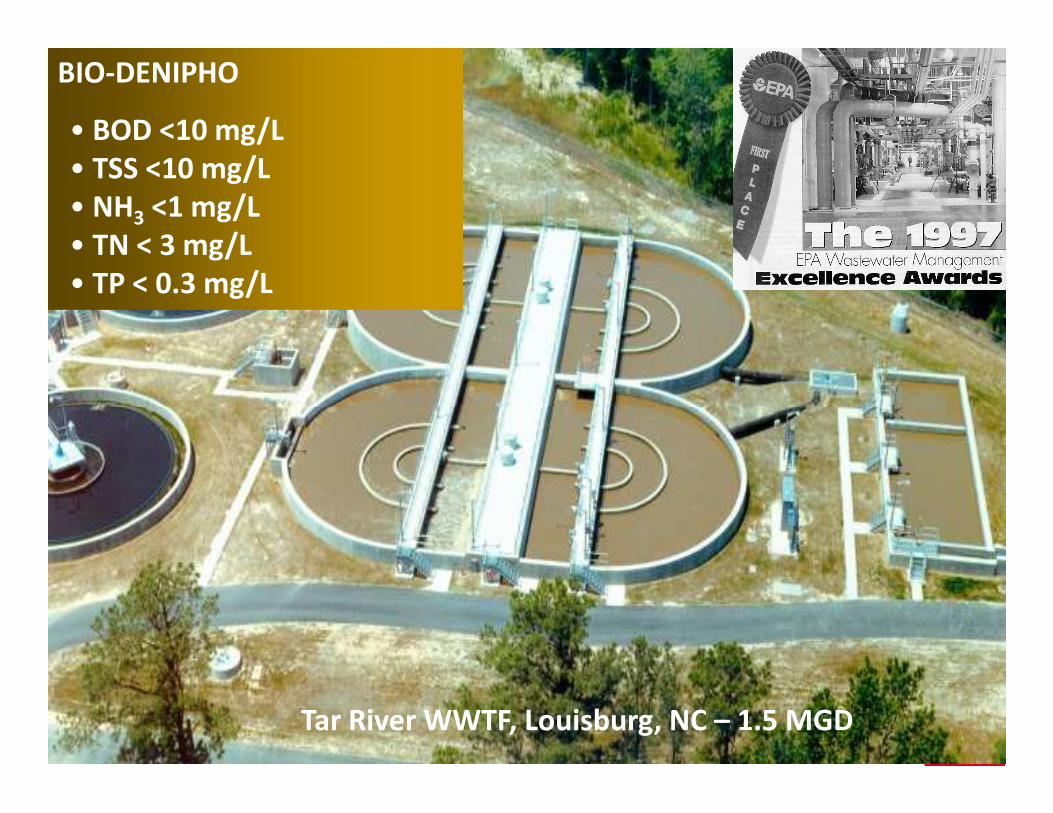
BIO-DENIPHO
• BOD <10 mg/L
• TSS <10 mg/L
• NH3 <1 mg/L
• TN < 3 mg/L
• TP < 0.3 mg/L
Tar River WWTF, Louisburg, NC – 1.5 MGD

BioDenitro/BioDenipho Phasing
Phase B and G
Influent is directed to the anoxic ditch providing BOD for denitrification reducing the NO3
-
concentration (produced in the previous phase). Flow is then directed to the oxic ditch where directed to the oxic ditch where NH4
+ and remaining BOD is removed.
Phase E and J
Influent is redirected to the second ditch. The first ditch is isolated. Both ditches nitrify during this phase to nitrify NH4
+
and remove BOD.

BioDenitro/BioBenipho
Phases G and J are mirror images of Phases B and E.
Historically Phasing was fixed time length controlled by PLC
Effluent is generally always directed out of an Oxic Ditch.
Typical PerformanceTypical Performance
• BOD < 10 mg/L
• TSS < 10 mg/L
• TN < 5 mg/L
• TP < 1 mg/L

Dynamic Phasing (Variable Phase Lengths based)
� Variable Phase length based on incoming load to plant
� End the aerobic phase if NH3 is below the setpoint
• Saves soluble organic carbon for denitrification
• Allows more time for denitrification• Allows more time for denitrification
• Reduces nitrate peaks
� End the anoxic phase if NO3 is below the setpoint
• Lowers ammonia accumulations
• Avoids potential secondary release of P if NO3 is depleted
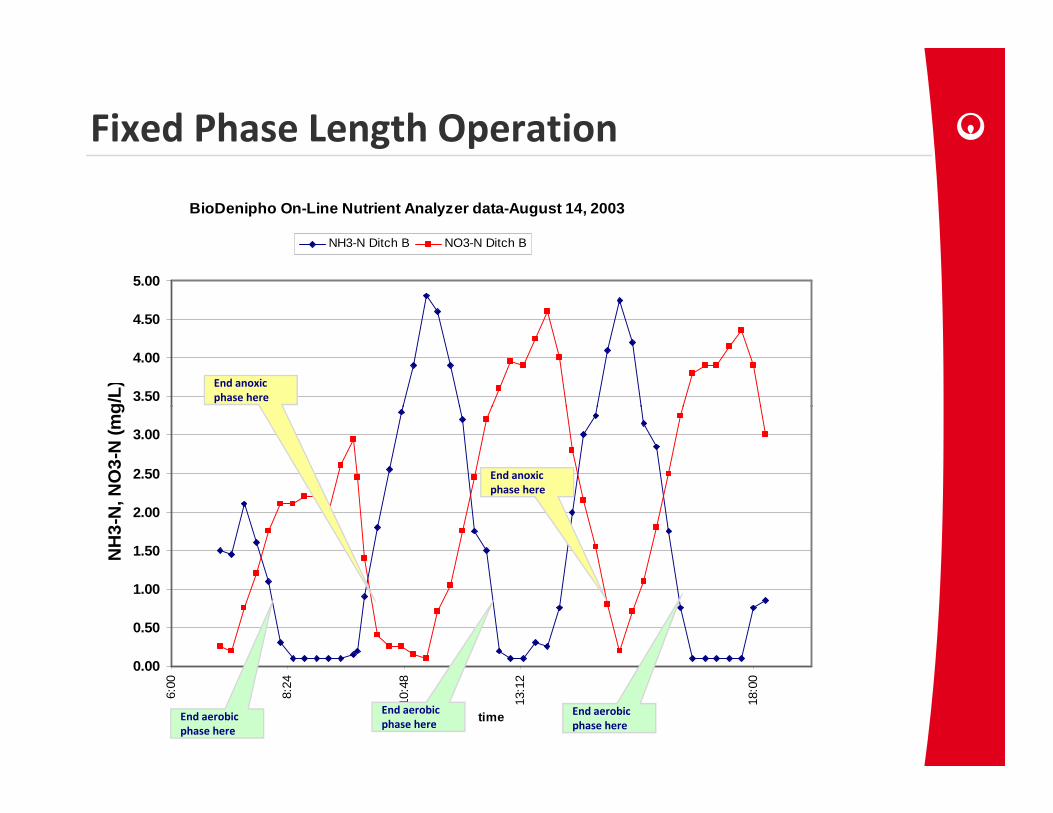
Fixed Phase Length Operation
BioDenipho On-Line Nutrient Analyzer data-August 14, 2003
3.50
4.00
4.50
5.00
NH
3-N
, NO
3-N
(mg
/L)
NH3-N Ditch B NO3-N Ditch B
End anoxic
phase here
0.00
0.50
1.00
1.50
2.00
2.50
3.00
6:00
8:24
10:4
8
13:1
2
15:3
6
18:0
0
time
NH
3-N
, NO
3-N
(mg
/L)
End aerobic
phase here
End aerobic
phase hereEnd aerobic
phase here
End anoxic
phase here

STAC – Superior Tuning & Control
� Uses on-line NH4-N and NO3-N analyzers
� Continuously adjusts oxic and anoxic phaselengths based on criteria using measured NH3
and NO3 concentrations3
� More efficient use of reactor volumes results inreduction in effluent soluble N and lowerenergy use

STAC Case Study
Conducted at Kill Creek WWTF – Gardner, KS
Demonstrated that Dynamic Phase Control
1. Improves TN Removal
2. Saves Energy

Dynamic Phasing Pilot Study
5
6Dynamic Phasing ON Dynamic Phasing Off
Kill Creek WWTP – Gardner, KS
0
1
2
3
4
(9/2) 9/4 9/6 9/8 9/10 9/12 9/13 9/15 9/17 9/19 9/21
NO
3-N
, m
g/l
end dynamic phase
control

Full Scale Results from STAC Demonstration –Kill Creek WWTP BIO-DENITRO
6.0
8.0
10.0TN
, mg/
lFixed Phase
Length Control
STAC Control
0.0
2.0
4.0
Sample Date (8/17/2004~9/29/2004)
TN, m
g/l

11
12
13
14
Ro
tor
Op
erat
ion
tim
e, h
ou
r/d
ay
Kill Creek WWTP BIO-DENITRO - Rotor Runtime Evaluation
STAC control Fixed phase
lengthSTAC control
6
7
8
9
10
9/2 9/5 9/8 9/11 9/14 9/17 9/20 9/23 9/26 9/29Date
Ro
tor
Op
erat
ion
tim
e, h
ou
r/d
ay

Kill Creek STAC Demonstration Conclusions
Increase TN removal by 2 – 3 mg/l
Reduce rotor runtime by 10 – 15%
Easy to upgrade existing control systems
Low maintenance, < 2 hours per week
Achieves effluent TN 2 to 4 mg/L without secondary anoxic zones or supplemental carbon additionAchieves effluent TN 2 to 4 mg/L without secondary anoxic zones or supplemental carbon addition