Embed Size (px)
Citation preview

ANNUAL REPORT
2011-2012 SCHOOL YEAR
Organization: DC Preparatory Academy Address: 707 Edgewood Street, NE Washington, DC 20017 Phone: 202-635-4590 Fax: 202-635-4591 Website: www.dcprep.org Contact: Kenny Wang Director of Special Projects 202-635-4590 ext. 201 [email protected] Submitted by: Mr. Le Roy (“Terry”) Eakin III Founding Board Chair

Contents
SY11-12 BOARD OF DIRECTORS ................................................................................ 1
SY11-12 SCHOOL LEADERS ....................................................................................... 3
SY11-12 FACULTY AND STAFF ROSTER ..................................................................... 4
ANNUAL REPORT NARRATIVE - SCHOOL DESCRIPTION .......................................... 9
Mission ....................................................................................................................................... 9 School Program ....................................................................................................................... 12 School Staff .............................................................................................................................. 17 Student Characteristics .......................................................................................................... 20 Governance.............................................................................................................................. 21 Finance ..................................................................................................................................... 21 Facilities ................................................................................................................................... 21
ANNUAL REPORT NARRATIVE - SCHOOL PERFORMANCE ..................................... 22
Evidence of Performance and Progress .............................................................................. 22 Lessons Learned and Actions Taken Based on PMF Data and Review ......................... 25 Unique Accomplishments ..................................................................................................... 27
UNAUDITED YEAR-END FINANCIALS FOR FY 2011-12 .......................................... 29
APPROVED BUDGET FOR FY 2011-2012 .................................................................. 31
MONETARY AND IN-KIND DONATIONS FOR FY 2011-12 ...................................... 33
ANNUAL REPORT DATA COLLECTION TOOL WORKSHEETS
Benning Elementary Campus ............................................................................................... 34 Edgewood Elementary Campus .......................................................................................... 42 Edgewood Middle Campus .................................................................................................. 50

1
SY11-12 BOARD OF DIRECTORS *Le Roy (“Terry”) Eakin III, Founding Board Chair: Chair and CEO of EYA,
former Chair of the D.C. Public Charter School Resource Center *Bobby Baldwin, Parent Board Member: Associate with Booz Allen Hamilton *Katherine Boone: Director of Boone Family Foundation S. Joseph Bruno, CPA, Board Treasurer: President of Building Hope *Lisa Dixon, Parent Board Member: Communications Specialist with the
National Alcohol Beverage Control Association *Michela English: President and CEO of Fight for Children, former President of
Discovery Consumer Products and Discovery.com Patrick W. Gross: Chairman of the Lovell Group and Founder of American
Management Systems *Judy Kovler: Psychotherapist in private practice Deborah McGriff: Partner at NewSchools Venture Fund, former Superintendent
of Detroit Public Schools, and former Executive Vice President of Edison Learning
Arthur McKee, Ph.D, Board Secretary: Managing Director of Teacher
Preparation Studies at the National Council on Teacher Quality *Carol Pensky: Co-Founder of the Women’s Leadership Forum of the
Democratic National Committee Jerome (“Jay”) Powell: Managing Partner, Global Environment Fund, co-
founder Severn Capital Partners, and former Carlyle Group Partner

2
*Eric Price: Managing Director of AFL-CIO Housing Investment Trust and former DC Deputy Mayor for Economic Development
Valerie Wayne: Philanthropist and former special education teacher
*Note: DC resident Roster Change – Ms. Judy Kovler was unanimously elected to the Board at the May 22, 2012 Board Meeting. Ms. Kovler’s election coincided with the resignation of Mr. Jay Powell. With his recent nomination and confirmation to the Board of Governors of the Federal Reserve, Mr. Powell’s resignation was necessitated by ethics rules which prevent him from serving on Boards while he is a Governor of the Federal Reserve.

3
SY11-12 SCHOOL LEADERS Emily Lawson, Founder and CEO of DC Prep
707 Edgewood Street, NE Washington, DC 20017 (T) 202-635-4590 ext. 230 (F) 202-635-4591 (E) [email protected]
Nicole Bryan, Principal of the Edgewood Elementary Campus
707 Edgewood Street, NE Washington, DC 20017 (T) 202-635-4411 (F) 202-635-4412 (E) [email protected]
Jahi Rohrer, Principal of the Benning Elementary Campus
100 41st Street, NE Washington, DC 20019 (T) 202-398-2838 (F) 202-398-2839 (E) [email protected]
Cassie Pergament, Principal of the Edgewood Middle Campus
701 Edgewood Street, NE Washington, DC 20017 (T) 202-832-5700 (F) 202-832-5701 (E) [email protected]

SY11-12 FACULTY & STAFF ROSTER
4
Name Campus Title / Position Alleyne, Terica EEC Dean of Student Support Alsofrom, Kylie EEC Second Grade Teacher Arthur, Praneetha EEC Spanish Teacher Barragan, Amanda EEC Spanish Teacher Barry, Erika EMC Operations Manager Bauer, Megan BEC First Grade Teacher Becker, John EMC 4th Grade Math Teacher Bhatia, Judith EEC Third Grade Teacher Bivens, Samantha BEC Art Teacher Brady, Carol BEC Preschool Lead Teacher Brooks, Michael EEC / EMC Security Guard Bryan, Nicole EEC Principal Butler, Raina EMC Operations Assistant Clark, Courtney EMC Art Teacher Coker, Amani BEC School Counselor Coltrane, Bronwyn EMC 4th Grade Writing Teacher Crider, Charmayne BEC Operations Assistant Davis, Paige BEC Preschool Lead Teacher Desai, Neema EMC 4th Grade Reading & Math Teacher Donnelly, Shannon BEC First Grade Teacher Ebisuzaki, Ruth EEC Instructional Coach Edwards-Ragin, Rosee EMC School Counselor Englender, Dan EMC Assistant Principal Fabian, Kathryn BEC Instructional Coach Fofanah, Yenkie BEC Preschool Lead Teacher Fray-Evans, Jillian EEC Counselor Frere, Thomas BEC Special Education Teacher Froehlich, Robin EMC Special Education Teacher

SY11-12 FACULTY & STAFF ROSTER
5
Name Campus Title / Position Gantt, Lakisha EEC Preschool Resident Teacher Garcia, Cristino EEC / EMC Buildings Engineer Gentzler, Megan EEC Instructional Coach Glass, Kendra BEC Operations Assistant Goldman, Jaime EMC Special Education Teacher Goode, Joshua EMC 5th Grade Social Studies & Science Teacher Grinneby, Maria-Teresa BEC Second Grade Teacher Hankin, Laura EEC Special Education Coordinator Hardy, Erica BEC Second Grade Teacher Harris, Tiye EEC Prekindergarten Lead Teacher Hendricks, Angel EEC First Grade Teacher Hennessie, Sylvia BEC Prekindergarten Lead Teacher Herlihy, Erin EEC First Grade Teacher Hernandez, Jamie BEC Kindergarten Teacher Hess, Michelle BEC Special Education Coordinator Hinds, Marie EEC Music Teacher Hobbs, Ieshia EMC Administrative Assistant Hoffman, Alexandra BEC Special Education Teacher Hoffman, Georgia EEC Prekindergarten Lead Teacher Horgan, Carys EEC Preschool Lead Teacher Host, Jon EEC Operations Manager Hyland, Hollis EMC 6th Grade Reading Teacher Iqbal, Tara EMC Dean of Academic Support Jennings, Shomari EMC 7th Grade Math Teacher Johnson, Amia BEC Instructional Coach Jones, Crystal EEC Operations Assistant King, Julia EMC 5th Grade Reading & Math Teacher Kipperman, Dan EMC Physical Education Teacher

SY11-12 FACULTY & STAFF ROSTER
6
Name Campus Title / Position Kopecky, Brianne EMC 7th & 8th Grade Science Teacher Krauser, Valerie BEC First Grade Teacher Kret, Morgan EEC Prekindergarten Lead Teacher Kroll, Britt BEC Preschool Resident Teacher Kwon, Connie BEC Music Teacher Lashley, Allison EMC 8th Grade Math Teacher Leslie, Amy EEC Prekindergarten Lead Teacher
Lewis, Melani BEC / EEC Director of Early Childhood Curriculum and Resident Teacher Development
Locklin, Kayla EEC School Support Specialist Long, Melissa EEC Assistant Principal Lovett, Ashlynn EEC Prekindergarten Resident Teacher Lowe, Kelly BEC Spanish Teacher Lucas, Elizabeth EEC Second Grade Teacher Mackenzie, Tracy EMC 6th Grade Reading & Math Teacher Massenberg, Cullen BEC Physical Education Teacher McClam, Rachel EMC 5th Grade Math Teacher McDermott, Bill EMC 7th & 8th Grade Social Studies Teacher McNally, Mary EEC Prekindergarten Lead Teacher Merkerson, Pamela EEC Administrative Assistant Michaels, Katie EMC 5th Grade Writing Teacher Moeller, Julie EMC Director of High School Placement Mumby, Alcine EMC Dean of Student Support Myaing, Terri EEC Preschool Lead Teacher Norton, Cody BEC Prekindergarten Lead Teacher Olowomeye, Oluseyi EMC 6th Grade Social Studies & Science Teacher Orzechowski, Lauren EMC 8th Grade ELA Teacher Palathra, Elizabeth EEC Special Education Teacher Palmieri, Kathleen BEC Preschool Lead Teacher

SY11-12 FACULTY & STAFF ROSTER
7
Name Campus Title / Position Payne, Ashia BEC Preschool Resident Teacher Perez, Samantha BEC Prekindergarten Resident Teacher Pergament, Cassie EMC Principal Perl, Naomi EEC Third Grade Teacher Piccirilli, Kara EMC 6th Grade Math Teacher Pillion, Elizabeth BEC Operations Manager Polmateer, Dana EEC Kindergarten Teacher Reed, Heidi EMC 5th Grade Reading Teacher Robinson, Christine BEC Prekindergarten Resident Teacher Rohrer, Jahi BEC Principal Rose, Stephanie EMC 4th Grade Social Studies & Science Teacher Rosenberg, Meredith EMC Spanish & ELL Teacher Rydstrom, Justin EMC Dean of Student Support Scanlin, Erin EEC Third Grade Teacher Schaeffer, Camilla EEC Art Teacher Shumake, Cheryl EEC Preschool Lead Teacher Shupe, Ellen EEC Special Education Teacher Silva, Amanda EMC Special Education Teacher Sims, Eleanor BEC Prekindergarten Lead Teacher Small, Nicole EEC Preschool Lead Teacher Snodgrass, Drew EEC Second Grade Teacher Sparks, Susanne EMC 6th Grade Writing Teacher Spears, Jane BEC Kindergarten Teacher Sprouse, Daniel EEC Physical Education Teacher Stuart, Lindsay BEC Second Grade Teacher Sutton, Tony BEC Dean of Student Support Tate, Beth BEC Preschool Lead Teacher Taylor, Grace-Ann EEC Kindergarten Teacher

SY11-12 FACULTY & STAFF ROSTER
8
Name Campus Title / Position Terrill, Kate EMC Special Education Coordinator Thomas, AnnMarie EEC Kindergarten Teacher Tichnell, Shay EEC Preschool Resident Teacher Toner, Anna BEC Preschool Lead Teacher Touchette, Andrew EEC Dean of Student Support Valley, Jordan BEC Prekindergarten Lead Teacher Walbert, Leslie EEC Preschool Lead Teacher Walsh, Fatima BEC Spanish Teacher Watts, Alisha EMC Special Education Teacher Weatherly, Mary Frances EEC First Grade Teacher Wilson, Ashli EMC Special Education Teacher Wims, Kristin BEC Kindergarten Teacher Wolf, Katherine EMC 4th Grade Reading Teacher Wright, Lucy EEC Preschool Resident Teacher Yarborough, Phil EMC 7th Grade ELA Teacher

9
I. School Description MISSION DC Prep’s goal is to bridge the educational divide in Washington, DC by increasing the number of students from underserved communities with the academic preparation and personal character to succeed in competitive high schools and colleges. We are accomplishing this mission by:
Creating excellent schools in underserved communities; Providing an outstanding education that emphasizes rigorous academics and character
development; and, Ensuring that our graduates have the knowledge, skills, and attitudes for success in top-
tier high schools, college, and adult life; and, Working with other education leaders to improve public education in DC.
In the fall of 2003, DC Prep opened its first campus — a small middle school with 100 students in 4th and 5th grade. Over the past eight years, DC Prep has expanded significantly, serving more than 1,000 students in Preschool through 8th grade across three campuses – Edgewood Middle Campus (opened in 2003), Edgewood Elementary Campus (opened in 2007), and Benning Elementary Campus (opened in 2008). Over the next decade, DC Prep will continue to grow to serve more students, ultimately enrolling 3,300 students on ten campuses in Ward 5, 7, and 8. Students at all DC Prep campuses are making significant academic gains; results from the 2012 DC CAS1 offer dramatic proof of just how well our DC Preppies are performing. For example: Third grade students at EEC made substantial gains, moving from 65% proficient last year
to 76% proficient this year in Reading, and from 60% proficient to 72% proficient in Math – making the Edgewood Elementary Campus the highest-performing elementary school east of Rock Creek Park.
Our middle school students continue to uphold their tradition of excellence, with 72% proficient in Reading, and 89% proficient in Math, making EMC the highest-performing public charter school in the city.2
The DC CAS data also point to the effectiveness of DC Prep’s early childhood program. Of the 3rd graders who have been at DC Prep since Prekindergarten, 83% scored proficient in Reading and 87% achieved proficiency in Math — scores that rival those of the highest-performing elementary schools in the city such as Lafayette, Mann, Murch, and Oyster.
1 In spring 2013, 3rd grade students at the Benning Elementary Campus will take the test for the first time. We are confident that they, too, will perform at high levels. 2 Excluding schools whose students exclusively take the DC-CAS ALT

10
Even more important — and consistent with our mission — all 190 students in DC Prep’s first five graduating classes have been accepted by a college-prep high school. And the majority has been offered admission to selective independent, parochial, and public magnet schools, with 80% of the Class of 2012 headed to selective high schools this fall. The high schools to which DC Prep students have been accepted are listed on the following page. In addition, 94% of the students in DC Prep’s first two 8th grade graduating classes (Class of 2007 and Class of 2008) have earned their high school diplomas. And this fall, 80% of these alumni will be enrolled in college. See the following page for a list of DC Prep alumni’s college acceptances. Listings of the high school and colleges to which DC Prep students have been accepted are presented on the following page.

11
HIGH SCHOOL ACCEPTANCES
Phillips Academy Andover (MA) Archbishop Carroll Benjamin Banneker Bishop McNamara Bullis School Edmund Burke Capital City PCS Cesar Chavez PCS Christchurch School (VA) DeMatha Catholic High School Don Bosco Cristo Rey Duke Ellington School for the Arts Edmund Burke E.L. Haynes PCS Elizabeth Seton High School The Field School Foxcroft Georgetown Visitation Gonzaga College High School Hebron Academy (ME) Holton-Arms School The Hun School Kent’s Hill School (ME) KIPP College Prep Landon School McKinley Technology High School Mercersburg Academy (PA) National Collegiate Academy PCS Oldfields School (MD) Phelps Architecture, Construction, and Engineering High School Potomac School Proctor Academy (NH) Sandy Springs Friends School School Without Walls St. Albans School St. James (MD) St. Margaret’s (VA) Sidwell Friends School Solebury School (PA) Stone Ridge School of the Sacred Heart Strath Haven (PA) Stuart Hall School (VA) Thurgood Marshall PCS Washington Math Science Tech PCS Washington Latin PCS The Webb School (TN) Western Reserve Academy (OH) White Mountain School (NH) Wilson High School Academies Woodberry Forest (VA)
COLLEGE ACCEPTANCES
Alabama State University Arcadia University Bennett College Bethune-Cookman University Boston University Bowie State University Cabrini College Cal Arts Coastal Carolina University College of Charleston College of William and Mary Columbia College – Chicago Coppin State University Delaware State University Earlham College Fairleigh-Dickinson University Fayetteville State University Florida A & M University Frostburg State George Mason University Georgetown University The George Washington University Gettysburg College Goucher College Hampden-Sydney College Hampton University Howard University Johnson and Wales University LaSalle University Lincoln University Marymount University McDaniel College Montgomery College Morehouse College Morgan State University Norfolk State University North Carolina A & T Pennsylvania State University Pine Manor College Potomac State College Radford University Riverside College Rochester Institute of Technology Shaw University Shepherd University Spelman College St. Johns University (NY) Towson University Trinity University (DC) University of Delaware University of the District of Columbia University of Maryland – College Park University of North Carolina – Wilmington University of Pittsburgh University of Virginia Virginia Commonwealth University Virginia State University Wesley College

12
SCHOOL PROGRAM DC Prep’s Academic Program offers students a research-based, results-oriented curriculum designed to graduate students who have mastered the basics, absorbed rich and stimulating content, and are on their way to developing higher order, analytical skills. Our students are also immersed in a Character Education Program that seeks to create self-aware, reflective learners who embrace the school’s values and strive to demonstrate them in their daily interactions. Details of each aspect of DC Prep’s school program are presented below. The Academic Program DC Prep’s academic program reflects the practices that are associated with high-performing urban schools throughout the country: more time on task (including nightly homework); standards-based instruction; research-based curricula; regular assessments and tailored interventions; and horizon-broadening activities. More Time on Task: DC Prep students spend approximately 25% more time in school than other DC public school students.
The first day of school for DC Prep’s 1st – 8th grade students was Monday, August 22, with early childhood students starting one day later. The last day of school was Tuesday, June 12.
Elementary campus students attend school from 8:00 AM – 4:00 PM with optional after-care until 6:00 PM.
At the middle campus, all 4th graders, new 5th and 6th graders, and students receiving tutoring through Prep Hour attend school from 8:00 AM – 5:00 PM. All other middle school students are in school from 8:00 AM – 4:00 PM.
Students are assigned nightly homework: elementary school homework is introduced in a graduated sequence from the earliest years through 3rd grade; middle-schoolers receive two hours of homework each evening.
Teachers are on call every evening until 8:00 PM to assist students with homework questions and challenges.
Standards-Based Instruction: DC Prep uses DC’s high-quality standards as the centerpiece of its instruction.
Curriculum maps aligned with DC standards guide instruction at the middle school. The elementary schools use DC standards as a base and have expanded upon them and
enhanced the Preschool standards significantly. As the city transitions to the Common Core Standards, we are reworking curriculum
maps to ensure they are aligned with the scope and sequence of the new standards. Rigorous Curriculum: DC Prep is in the process of creating its own curriculum for all grades, using standards as the foundation. Teachers draw on useful resources and approaches to convey the curriculum to students.
OWL (Opening the World of Learning) and Big Math for Little Kids are commonly-used resources in the early childhood program.
The ELA program uses a balanced literacy approach: Reader’s Workshop for students in K – 3, and Reader's and Writer's Workshop for students at the middle campus. The elementary campuses also use Reading Mastery to develop students’ phonics skills.
13
In Math, elementary teachers draw from Go Math, Envisions Math, TAI and Everyday Math to plan and present lessons. Saxon Math and Connected Math are consulted at the middle school.
Continuous Assessment: Regular monitoring of student progress ensures an academic program that is targeted and appropriate for every child. DC Prep uses a range of assessment tools, selected for their validity and their developmental appropriateness.
Preschool and Prekindergarten students are assessed using PALS, TEMA, and DECA to measure progress in language development, beginning reading skills, mathematics and social-emotional development.
The STEP Assessment is a developmental literacy assessment, instructional tool, and data management system that will be employed with students in Prekindergarten through 3rd grade.
Our 2nd – 8th grade students are assessed four times each year in Reading and Math using interim assessments from the Achievement Network.
Post-interim student data conferences enable teachers to explore each student's progress toward mastery of grade-level content and to design "re-teaching" strategies as appropriate.
All new students at the middle campus and those below grade level are tested at least twice yearly using the Fountas and Pinnell assessment to determine their current reading level and inform targeted instruction.
The annual DC-CAS is an important gauge of progress for students in 3rd-8th grade. These results determine DC Prep’s standing under the No Child Left Behind legislation. In addition, DC-CAS scores are a key determinant for a student’s high school options.
Weekly professional development sessions led by DC Prep’s instructional leaders provide forums for modeling best practices, analyzing data, reviewing student work and tailoring instructional practice to address areas of need.
Targeted Intervention: DC Prep provides a program of intensive academic support for students who enter school significantly below grade level or who have special learning needs.
An individualized academic intervention program is designed to ensure that every student is being taught at the appropriate level.
Read Naturally, Wilson Reading and Waterford Early Learning are used to support students who are significantly behind grade level in reading.
Two teachers in each Preschool and Prekindergarten classroom ensure small group learning for the youngest students.
The Instructional Coaches (all campuses) and the Director of Academic Support (middle campus only) provide additional services and support to students and assist teachers with designing effective approaches for all learners.
An integral part of DC Prep’s mission is to promote integration of students with special needs in regular classrooms and activities. Special education teachers provide small group and individualized support in a resource setting to students requiring extra help or specific strategies to address their disabilities that cannot be provided in the general education classroom.

14
DC Prep’s ELL teacher works across campuses to ensure that students who are limited- or non-English proficient are assisted both in the classroom and in small groups, to master English and improve literacy skills.
Horizon-Broadening Activities. Students are exposed to a broad range of cultural and athletic activities across the grades.
Elementary school students regularly participate in Art, Music, Physical Education and Spanish led by teachers specializing in these subjects.
Junior Academy students at the Edgewood Middle Campus (4th, 5th, and 6th graders) also participate in Music, Art, and Physical Education classes. 4th graders began taking Spanish this school year.

15
Character Education DC Prep aims to create self-aware, reflective, and disciplined learners. Therefore, character education — both the articulation of the school's core values and the day-to-day demonstration of these values — is an essential component of DC Prep’s approach. A founding premise of DC Prep is the belief that students' academic and personal success is grounded in a set of values and habits, and the character education program sets forth the attitudes and behaviors expected of students. The program includes the following key elements. School Motto: Students at each campus are guided by a student-friendly motto that captures the school's core values.
The elementary campuses have adopted DC PREP standing for Determined, Caring, Patient, Respectful, Engaging, and Proud.
At the middle school it's "Do the RIGHT Thing", where RIGHT stands for Respectful, Intelligent, Genuine, Hard-working, and Team-oriented.
At all campuses, DC Prep's values permeate the atmosphere and are modeled and reinforced by the adults.
Social Skills Development. Students participate in developmentally-appropriate programs that contribute to healthy social development, build strong study and work habits, and foster a positive learning community.
Students at the elementary campuses are guided by Project Class and Second Step, which give students the tools to build strong relationships with their peers and adults.
Middle school students participate in Prep ED — DC Prep's customized version of a nationally-recognized character education program.
Sweating the Small Stuff: A detailed set of expectations, a strong incentive system, and a clear and transparent Code of Character are communicated to all students and family members.
We pay close attention to the smallest details of student behavior including attendance, punctuality, and homework completion.
An incentive system in which students can gain – and lose – DC Prep "dollars" provides a very concrete measure of student performance in the character arena.
In K-8th grades, biweekly or weekly character reports keep parents apprised of their children's behavior.
Teachers are united in reinforcing the school values, the discipline policy, and the incentive system so that students receive clear and consistent messages about appropriate and productive behavior.
All students wear the DC Prep uniform. Community-Building: Creating a shared culture and sense of place helps to involve all students.
At the elementary campuses, award ceremonies are held to validate and award students who exemplify the DC Prep Way as well as achieve their academic goals.
Each day at the middle school begins with a homeroom advisory meeting where faculty and students explore and reflect upon the school's core values and important academic and character data points

16
Parent Communication: We foster a home-school partnership and shared aspirations. Every DC Prep Parent signs The Parent Promise which lays out an explicit set of
responsibilities for families in support of their child’s school success and in support of DC Prep.
At the middle school, parents receive biweekly bank statements detailing students' behavior including attendance, punctuality, uniform, homework completion and positive participation in class. Elementary school parents also receive such communications on a frequent basis.
Family Literacy and Family Math nights occur several times a year at all campuses. The Parents Association is developing in concert with the growing campuses, with the
most mature PA at the middle campus. Parents at all campuses are involved in planning social and educational activities that support the school and the parent community.
Leadership: Character development is nurtured and rewarded.
Students at the middle campus have opportunities to grow into leadership roles. 7th and 8th graders participate in a leadership program called Prep Squad

17
SCHOOL STAFF DC Prep’s organizational structure has separated the business and educational functions, thereby ensuring that each school leader is able to focus on student achievement and professional development. The Home Office team is charged with overseeing finance, operations, real estate, student and staff recruitment, and fundraising while the Principals serves as the instructional leaders of their schools. The Home Office and School Leadership Teams for the 2011 – 2012 school year included: Home Office Leadership Emily Lawson is the Founder and CEO. Since 2002, she has led the growth of DC Prep from a single middle school to one of the highest-performing Charter Management Organizations in the nation’s capital. Ms. Lawson’s work at DC Prep has been featured in The Washington Post and on the News Hour with Jim Lehrer, and has attracted the support of major national foundations focused on public education reform. Before launching DC Prep, Ms. Lawson was the Vice President of Operations for Victory Schools, a school management company. She was also a member of the start-up team at the Academy of the Pacific Rim, a Boston charter school. Ms. Lawson holds an M.B.A. with Distinction from Harvard Business School and an M.P.A., with a focus on education, from the Kennedy School of Government. Her business career includes three years at The Boston Consulting Group and two years at the New York private equity firm, New Mountain Capital. She is a Phi Beta Kappa graduate of the University of North Carolina where she was a Morehead Scholar. In May 2007, she completed the Broad Foundation's Associate Residency in Urban Education Wendy Scott, Chief Operating Officer, is responsible for operations, finance, and real estate. Ms. Scott came to DC Prep through the Broad Residency in Urban Education, a two-year executive development program of the Broad Foundation. Before joining DC Prep, Ms. Scott was a Strategy and Operations Manager for Deloitte Consulting LLP, where she supported the management, administration, and oversight of federal government charge card programs. Her business career also includes time spent at Citigroup, Accenture, and PricewaterhouseCoopers. Ms. Scott holds an MBA from Howard University, and a bachelor’s degree from the University of Pennsylvania Alicia Robinson, Chief Talent Officer, leads DC Prep's personnel and student recruitment efforts. Ms. Robinson came to DC Prep from New Leaders for New Schools where she managed the recruitment and admissions process for New Leaders' candidates. Previously she served as the Senior Director for Education and Outreach at the Washington Scholarship Fund, overseeing the recruitment, placement and academic support for more than 2,000 students receiving scholarships through the Fund. Ms. Robinson is a graduate of American University, earning both a bachelor's degree in Public Communication and a master's in Elementary Education. Ms. Robinson entered teaching through DC Teaching Fellows. She was a member of DC Prep’s Founding Faculty. Ibby Jeppson, PhD, Director of Resource Development, is responsible for development, strategic partnerships and communications. She has more than 30 years experience in not-for-profit management, program development, and social policy. Before joining DC Prep, she taught in the Pediatrics Department at the Uniformed Services University of the Health Sciences. Dr. Jeppson has authored numerous books and produced three award-winning

18
documentary films. Her career began in the classroom, as a member of the National Teacher Corps. She holds a master’s degree in early childhood education and a doctorate in special education. Katie Severn, Chief Academic Officer, works with the principals of all three DC Prep campuses to ensure alignment among schools and the highest academic quality across the organization. Ms. Severn served as Principal of DC Prep's award-winning Edgewood Middle Campus from 2008-2011.Previously, she worked at SEED Public Charter School, where she served as Principal, Assistant Principal, and Special Education Coordinator. She began her career as an English teacher in Namibia with the Center for Global Education. Upon her return to the States, Ms. Severn joined Teach For America in Houston where she was recognized as both the New Teacher of the Year and the Special Education Teacher of the Year. She is a graduate of New Leaders and holds a bachelor's degree in sociology from Grinnell College and master's degrees in special education and educational administration. Kenny Wang, Director of Special Projects, works on emerging organizational and policy issues, compliance, and federal and state grants. Before joining DC Prep, Mr. Wang worked at the Match School in Boston where he helped co-found the Match Teacher Residency program. He also served as a Match Corps Fellow. Mr. Wang spent two years with L.E.K. Consulting before becoming involved in education reform. He holds a bachelor's degree in Economics from Harvard College and a master’s in public policy from the Harvard Kennedy School of Government. School Leadership Nicole Bryan, is the Principal of the Edgewood Elementary Campus. Previously she served as the school's Director of Curriculum, Instruction, and Assessment where she provided coaching and professional development. Ms. Bryan was a classroom teacher for six years working in both elementary and early childhood programs. She holds a BA in Spanish from Georgetown University and a master's degree in education from George Washington University with a dual concentration in Curriculum and Instruction and Bilingual Special Education. Ms. Bryan is currently pursuing her doctorate at George Washington with a focus on Leadership for Diverse Students. Cassie Meltzer Pergament is the Principal of the Edgewood Middle Campus. She came to DC Prep as a teacher in 2004 and has served in a variety of roles including Instructional Coach, Chair of the English Department, and member of the school Leadership Team. She began her teaching career with Teach For America in Compton, California where she designed and implemented a program for Gifted and Talented students. Ms. Pergament also taught at the KIPP: Bridge Charter School in Oakland. She holds a BA in Political Science from the University of Rochester and a MAT from Loyola Marymount University. During the 2010-11 school year, Ms. Pergament earned her MEd in School Leadership and participated in an intensive residency program at High Tech High in San Diego. Jahi Rohrer is the Principal of the Benning Elementary Campus. Mr. Rohrer joined the DC Prep team in 2010 as an Instructional Coach. He began his teaching career as a Teach for America Corps member in New York, and has four years of elementary teaching experience. Mr. Rohrer came to DC Prep with four years in school leadership (including two as a Principal) in New

19
York, the Virgin Islands, and Washington, DC. He holds an undergraduate degree from Middlebury College, a Masters' degree in Elementary Education from Pace University, and has completed the School Leadership Program at Teachers' College at Columbia University. School Staff During the 2011-12 school year, DC Prep employed 85 lead or co-lead teachers and eight resident teachers. We did not employ teacher aides at any of our three campuses. DC Prep teachers undergo a rigorous screening and interview process that includes a resume screen, an initial phone interview, an on-campus interview, a group interview with the school leadership team, and thorough reference checks. To be considered for a position, candidates must have a demonstrated track record of success in developing and implementing strategies to meet the needs of young students with a variety of learning needs, preferably at least two years of urban teaching experience, and a “whatever it takes” attitude to ensure that all students succeed at a high level. The average class size across the entire organization was 21 students, with an overall average student to teacher ratio of 11 to 1. We respectfully decline to share our average salaries and salary ranges at this time. Additional data on school staff characteristics can be found in the Data Collection Templates beginning on page 34.

20
STUDENT CHARACTERISTICS
Student Characteristics Table – Edgewood Middle Campus
Number f Students Enrolled
4th Grade – 76 students* 5th Grade – 69 students* 6th Grade – 61 students* 7th Grade – 43 students* 8th Grade – 31 students*
Student Re-enrollment Rate 89% Average Daily Attendance 98% In-seat Attendance Rate 96%
Student Characteristics Table – Edgewood Elementary Campus
Number of Students Enrolled
Preschool – 74 students* Pre-K – 65 students*
Kindergarten – 70 students* 1st Grade – 67 students* 2nd Grade – 66 students* 3rd Grade – 68 students*
Student Re-enrollment Rate 88% Average Daily Attendance 96% In-seat Attendance Rate 94%
Student Characteristics Table – Benning Elementary Campus
Number of Students Enrolled
Preschool – 71 students* Pre-K – 67 students*
Kindergarten – 64 students* 1st Grade – 62 students* 2nd Grade – 68 students*
Student Re-enrollment Rate 76% Average Daily Attendance 96% In-seat Attendance Rate 93%
Student demographic information and discipline data can be found in the Data Collection Templates beginning on page 34.

21
GOVERNANCE DC Prep’s Board of Directors is a diverse and multi-talented group. Drawn to the school by a deep commitment to the Washington community and to education reform, the Board brings a sophisticated understanding of best organizational practices and strategic leadership to its work. The Board’s mix of business, education, community and philanthropic leaders has resulted in a tremendously cohesive and effective governing body. DC Prep’s Board of Directors meets every two months, with pre-meeting reading materials distributed several days in advance of the meeting. Meetings are organized around a central theme (e.g. student performance, accountability, development) allowing for in-depth reporting and discussion of key strategic questions that are essential to DC Prep’s success. Updates are also given on all major areas so that the Board stays abreast of important issues. Newly elected Board members are on-boarded prior to their initial Board meetings by the Governance Chair and Home Office staff to ensure that they are able to participate and contribute from the very first day of their terms. In addition, an Advisory Board, comprised of education, business, and philanthropic professionals, provides additional counsel to the DC Prep leadership team and expands the pool of talented and generous individuals who are helping us accomplish our mission. FINANCE DC Prep’s unaudited year-end financials for Fiscal Year 2011-12 has been provided on pages 29 and 30 of this Annual Report. A copy of the organization’s approved budget for FY 2011-12 has been provided on pages 31 and 32. A list of all donors and grantors who have made monetary or in-kind donations of $500 or greater during the last fiscal year is included on page 33. FACILITIES Facilities information such as square footage, room inventory by grade and subject, and student/classroom and teacher/classroom ratios has been provided in the Data Collection Templates beginning on page 34.

22
II. School Performance
EVIDENCE OF PERFORMANCE AND PROGRESS Student Academic Performance – Performance Management Framework While the Edgewood Elementary Campus and Benning Elementary Campus will be reviewed using Early Childhood Accountability Plans, the Edgewood Middle Campus is subject to the Performance Management Framework. The EMC’s performance in each of the PMF categories is described below: Student Progress. Student progress on the PMF is measured using the Median Growth Model. By this metric, students at the Edgewood Middle Campus had a very successful year. In Reading, the Median Growth Percentile for EMC students on the 2012 DC CAS was 62, meaning that the median (or typical) EMC student outgrew more than 60% of his/her academic peers throughout Washington, DC. The progress of EMC students in Math was even more impressive. The MGP in Math was 68, meaning that the median EMC student was in the top third in growth among his/her academic peers. On the strength of these results, we are confident that we will receive nearly full points on the PMF’s Student Progress measure. Student Achievement. A total of 132 4th and 5th graders at the Edgewood Middle Campus were tested on the 2012 DC CAS. Of these students, 69% (91 of 132) scored proficient or advanced in Reading while 88% (116 of 132) achieved those levels in Math. 14% (19 of 132) scored advanced in Reading, 32% (42 of 132) in Math. The results in DC Prep’s upper grade levels – the students who have been at DC Prep the longest – were even more impressive. A total of 128 students in the 6th, 7th, and 8th grades were tested on the 2012 DC CAS. Of these students, 75% (96 of 128) scored proficient or advanced in Reading while 90% (115 of 128) achieved those levels in Math. 20% (26 of 128) scored advanced in Reading, 45% (58 of 128) in Math. On the strength of these outstanding results, the Edgewood Middle Campus is the highest-performing public charter school in the city.3 Gateway. All but one DC Prep 8th grader – or 26 of 27 students – achieved Proficient or Advanced on the 2012 Math DC CAS. In comparison, the city-wide Math proficiency rate for that grade level is well short of 60%. Given our 96% proficiency rate in this area, we will receive nearly full points on the PMF’s Gateway measure. Leading Indicators. While harder to measure than straightforward academic achievement, an assessment of student intentions to “Do the RIGHT Thing!4” is an essential component of measuring DC Prep’s success. We use a number of measures to track and encourage student progress in this area including monitoring attendance. In 2010-11, DC Prep’s average daily attendance rate at the Edgewood Middle Campus was 97%, or two points higher than the
3 Excluding schools whose students exclusively take the DC-CAS ALT 4 Do the RIGHT Thing is the school’s motto — Respectful, Intelligent, Genuine, Hardworking, and Team-Oriented.

23
PMF’s target attendance of 95%. Attendance in 2011-12 was better still, reaching 97.7% for the year. Given that, we will be receiving full points on the Attendance indicator of the PMF. The other Leading Indicator incorporated into the PMF is student re-enrollment. Last year, the EMC reported an 81% re-enrollment rate. Re-enrollment was far stronger this year, climbing 8 points to reach 89%.To help ensure steady student re-enrollment, DC Prep surveys parents at the end of each school year to find out about our schools’ foremost strengths and areas of improvement from the perspectives of DC Prep’s most important stakeholders. In addition, since the 2010-11 school year, we have used a student withdrawal form that includes additional questions about why a parent/guardian is choosing to withdraw his/her child from DC Prep. Data from both of these sources has been instrumental in helping us bring our re-enrollment rate closer to the PMF target rate of 90%. Student Academic Performance – Accountability Plans Both the Edgewood Elementary Campus and the Benning Elementary Campus successfully met all but one target on their 2011-12 Early Childhood Accountability Plans. The schools’ performance in each section of the Accountability Plan is discussed below. Student Progress. For the Student Progress section of the Accountability Plan, DC Prep’s two elementary campuses used three assessment tools – PALS Letter ID for preschoolers, PALS Letter Sound for prekindergarten students, and NWEA MAP/MGP for elementary aged students (K-3rd for Edgewood, K-2nd for Benning). For PALS Letter ID, we aimed for preschool students to either master at least 21 letter IDs by the end of the year or to increase their scores by an average of at least 7 letters between the fall administration and spring administration. At Edgewood Elementary, 77.4% of students ended the year with at least 21 letters identified; the remaining 22.6% of students achieved an average growth of 13.4 letter IDs. At Benning Elementary, 72% of students ended the year with at least 21 letters identified, with the remaining 28% achieving an average growth of 14.9 letter IDs. For PALS Letter Sound, we set the following target at each campus – from the fall administration to the spring administration, prekindergarten students will either master at least 24 letter sounds or will increase their scores by an average of at least 7 letters. At Edgewood Elementary, 80% of students ended the year identifying at least 24 letter sounds while the remaining 20% achieved an average growth of 15.7 letter sounds. At the Benning, 68% averaged identified 24 or more letter sounds on the spring administration while 32% achieved an average growth of 14.6 letter sounds. Unfortunately, both schools failed to meet their progress goals on the NWEA MAP/MGP assessments. Both campuses had targeted an average student growth of 7 percentile points for its elementary school-aged children. Average growth ended up at just 2.3 percentile points at Benning. At Edgewood, average growth was just 0.1 percentile points. Student Achievement. For the Student Achievement section of the Accountability Plan, DC Prep’s Edgewood Elementary Campus used three assessment tools – NWEA MAP/MGP, STEP, and the Reading section of the DC CAS. The Accountability Plan for the Benning Elementary

24
Campus included NWEA MAP/MGP and STEP but not the DC CAS since the school does not yet serve 3rd grade students. For NWEA MAP/MGP, both campuses set the following target – by the spring administration, 50% of students (K-3rd for the EEC, K-2nd for the BEC) will score at or above the 40th percentile. Both schools comfortably surpassed this target as 67.4% of Edgewood Elementary students and 54.6% of BEC students scored at or above the 40th percentile. Similarly, the two campuses also easily surpassed the STEP target of having 50% of K-2nd grade students score at or above grade level by the end-of-year administration of this literacy assessment. 76% of Edgewood Elementary students scored at or above grade level by the end of the year, while 54.6% hit the target at Benning. The final metric in the Student Achievement section of the EEC Accountability Plan was DC CAS Reading. The target for the 2012 Reading DC CAS was for the school’s 3rd graders to achieve the Safe Harbor target in Reading. With a proficiency rate of 76%, the EEC successfully met this target with several points to spare. Leading Indicators. The final two targets on the Edgewood Elementary and Benning Elementary Accountability Plans relate to average daily attendance. Both schools targeted 88% average daily attendance for their early childhood students (Preschool and Prekindergarten) and 92% average daily attendance for their elementary students (K-3rd for Edgewood, K-2nd for Benning). Once again, both schools dramatically outperformed their Accountability Plan targets. At the Edgewood Elementary Campus, early childhood students attended 94.9% of the school days while elementary students achieved 96.7% average daily attendance. At Benning Elementary, average daily attendance was 95.3% for preschool and prekindergarten students, and 96.3% for elementary students.

25
LESSONS LEARNED AND ACTIONS TAKEN 1. After evaluating the Accountability Plans of our Benning Elementary Campus and
Edgewood Elementary Campus and conducting an internal needs assessment, we have determined that while elementary students who enter DC Prep significantly behind grade level are making progress over the course of the school year, they are often still not making progress as quickly as we would hope. To help address this gap, and to ensure a smooth transition to the rigor of the new Common Core Standards, we are implementing three important changes to our two elementary campuses during the 2012-13 school year:
a. We will departmentalize in 1st through 3rd grades so that teachers in those grade levels can focus and become experts on particular content areas.
b. We are changing our teacher coaching model in 1st through 3rd grades so that instructional coaches also focus on particular content areas (Reading or Math), rather than focusing on specific grade levels.
c. We are introducing a daily “Prep Session” intervention block for all of our students in 1st through 3rd grades. During Prep Session, students receive small group instruction in literacy that is tailored to their individual needs. Students who meet and/or exceed grade level standards participate in academic enrichment activities, while those who have demonstrated deficits receive targeted intervention around their specific needs. Prep Session's small, leveled groupings allow teachers to make optimal use of assessment data and deliver tailored instruction to ensure that all DC Prep students achieve mastery.
2. As noted in our 2010-11 Annual Report, we significantly increased our capacity to
provide educational support to all three DC Prep campuses at the start of the 2011-12 school year with the addition of a Chief Academic Officer, Director of Special Education, and a Director of Student Support Services to the Home Office team. After just one year, each of these Home Office additions has made a significant contribution to managing quality across the three campuses and ensuring that the overall educational program is coherent, sequential, and developmentally appropriate. To further support the DC Prep campuses, we have added the three more exceptional educators to the DC Prep Home Office Academic Team:
a. Melodie Barron, Instructional Support Specialist, joined the full-time staff of DC Prep in 2012. Her primary focus is on curriculum development, instructional quality, and programmatic improvement in DC Prep's Early Childhood programs. Over the past several years, she has been a consultant to DC Prep’s educational programs at all three campuses and has helped the organization develop in several key areas related to instruction, including teacher support and evaluation system, as well as instructional planning, delivery, and coaching. Melodie received a BA from Furman University and a MEd from Converse College
26
b. MaryKate Hughes, Director of Curriculum and Instruction, joined DC Prep in 2003 as a founding faculty member and works closely with the Home Office Academic Team to refine teacher support and professional development programs, providing ongoing feedback to campus-based instructional leaders. In addition, she oversees curriculum development and revision across all campuses. In her tenure at DC Prep, MaryKate has also served as a Math teacher, master teacher and Math department chair at the Edgewood Middle Campus. She entered teaching through the DC Teaching Fellows program, and received the notable Milken Teaching Award in the spring of 2007 for her exemplary teaching and commitment to education. Prior to DC Prep, MaryKate taught 5th grade at DCPS. She received a BA from Boston College, and a MAT from American University.
c. Tara O’Flaherty, Leadership Support Specialist, joined DC Prep in 2012 and supports the Academic Team’s work across all campuses. Prior to DC Prep, she helped found and open Chavez Prep as its Assistant Principal and then moved into the Principalship. She served as a school leader for Chavez for seven years and in her final year there was named Principal of the Year. Tara has a BA from Drew University, a MEd from Lesley University, and a MA from The George Washington University.

27
UNIQUE ACCOMPLISHMENTS We are thrilled to report that DC Prep was the highest-performing Charter Management Organization in Washington, DC based on the results of the 2012 DC-CAS! Additional highlights from the 2011-12 school year include: Benning Elementary Campus (BEC)
In its debut year in 2nd grade Achievement Network interims, Benning Elementary Campus beat the network by 17 percentage points in Reading and 31 points in Math, ending the year at 74% proficient in Reading and 76% proficient in Math.
From the BOY PALS assessment to the EOY PALS assessment, the percent of BEC Preschool students who scored at the advanced level increased by 66 percentage points from 18% to 85%.
By the end of year STEP literacy assessment, 82% of BEC Kindergarten students scored on or above grade level.
DC Prep added the 2nd grade to its Benning Elementary Campus. The campus, which is part of OSSE’s Incubator Initiative, will “grow up” a grade each year until students reach the 3rd grade.
Edgewood Elementary Campus (EEC)
On the 2012 DC CAS, the Edgewood Elementary Campus was the highest-performing elementary school east of Rock Creek Park.
EEC received the 2012 Champion of Quality Award from Fight For Children, a DC area non-profit. The prestigious $50,000 award was given in recognition of the Edgewood Elementary Campus’ outstanding faculty and exceptional degree of student learning taking place at the school. Edgewood Elementary Campus was the only elementary school in Washington to be honored in this way.
EEC was one of only two DC schools selected as a 2011 National Title I Distinguished School for closing the achievement gap between student groups.
DC Prep’s Edgewood Elementary Principal, Nicole Bryan, received the “Ed Reform Champion Under 40” award from the Black Alliance for Educational Options.
Drew Snodgrass (2nd Grade Lead Teacher) was one of three Finalists for DC Teacher of the Year.
Judith Bhatia (3rd Grade Math Teacher), was selected to present on DC Prep’s elementary-level departmentalization efforts in the July 2012 DC Data Summit.
Edgewood Middle Campus (EMC)
The Edgewood Middle Campus remains the highest-performing public charter middle school on the DC CAS citywide, and also has the highest scores on the 2012 DC CAS general assessment of any public charter in the city.
EMC was named as an EPIC Silver Gain School for the second time in three years by New Leaders. In addition, three of its faculty members were selected as 2012 EPIC Spotlight Teacher Award Winners.
5th Grade Math teacher Rachel McClam was selected as a Finalist in the prestigious, highly-competitive inaugural TNTP Fishman Prize for Superlative Classroom Practice.

28
In addition, two other Edgewood Middle Campus teachers were Semi-Finalists for the prize, Julia King and John Becker.
Seyi Oloweyme won Teach For America’s Edith Tatel Award for Excellence in Teaching. Faculty member John Becker stood behind President Obama as he announced changes to
No Child Left Behind, and received a special shout out in the fall of 2011.

Unaudited Year-End Financials DC Preparatory AcademyFiscal Year 2011-12
Year to Date
Actual Budget Variance
REVENUE
01. Per Pupil Charter Payments 11,616,004 11,232,767 383,237
02. Per Pupil Facilities Allowance 2,828,000 2,741,200 86,800
03. Federal Entitlements 1,146,529 744,532 401,998
04. Other Government Funding/Grants 1,644,861 1,134,876 509,984
05. Private Grants and Donations 1,260,046 1,351,037 (90,991)
06. Activity Fees 207,378 72,935 134,442
07. Other Income (please describe in footnote) 118,782 22,200 96,582
TOTAL REVENUES 18,821,600 17,299,548 1,522,052
OPERATING EXPENSE
Personnel Salaries and Benefits
08. Principal/Executive Salary 1,311,812 1,194,661 (117,151)
09. Teachers Salaries 5,233,040 5,160,163 (72,878)
10. Teacher Aides/Assistance Salaries - - -
11. Other Education Professionals Salaries - - -
12. Business/Operations Salaries 842,451 919,046 76,594
13. Clerical Salaries 102,612 142,326 39,714
14. Custodial Salaries 43,434 41,200 (2,234)
15. Other Staff Salaries 1,904,391 1,974,234 69,844
16. Employee Benefits 1,720,389 1,959,206 238,816
17. Contracted Staff 96,175 66,095 (30,080)
18. Staff Development Expense 193,927 95,438 (98,489)
Subtotal: Personnel Expense 11,448,232 11,552,368 104,136
Direct Student Expense
17. Textbooks 63,323 60,000 (3,323)
18. Student Supplies and Materials 114,030 163,484 49,454
19. Library and Media Center Materials 5,013 7,000 1,987
20. Student Assessment Materials 51,924 100,000 48,076
21. Contracted Student Services 487,009 555,252 68,243
22. Miscellaneous Student Expense ** 78,356 93,870 15,514
Subtotal: Direct Student Expense 799,655 979,606 179,951
Occupancy Expenses
23. Rent 868,653 798,560 (70,093)
24. Building Maintenance and Repairs 47,208 57,500 10,292
25. Utilities 202,736 233,701 30,966
26. Janitorial Supplies 16,553 22,098 5,545
27. Contracted Building Services 291,507 286,879 (4,628)
Subtotal: Occupancy Expenses 1,426,658 1,398,739 (27,919)
Office Expenses
28. Office Supplies and Materials 100,882 129,288 28,406
29. Office Equipment Rental and Maintenance 90,765 91,372 606
30. Telephone/Telecommunications 58,466 50,057 (8,409)
31. Legal, Accounting and Payroll Services 369,410 320,862 (48,548)
32. Printing and Copying 27,201 46,500 19,299
33. Postage and Shipping 14,337 18,159 3,822
34. Other 1,626 6,941 5,315
Subtotal: Office Expenses 662,688 663,179 492
29

Unaudited Year-End Financials DC Preparatory AcademyFiscal Year 2011-12
Year to Date
Actual Budget Variance
General Expenses
35. Insurance 41,374 53,619 12,245
36. Transportation 94,813 82,600 (12,213)
37. Food Service 535,011 570,495 35,484
38. Administration Fee (to PCSB) 73,478 68,370 (5,108)
39. Management Fee - - -
40. Other General Expense 725,549 637,351 (88,198)
41. Unforeseen Expenses - 291,000 291,000
Subtotal: General Expenses 1,470,225 1,703,434 233,210
TOTAL OPERATING EXPENSES 15,807,457 16,297,327 489,869
NET OPERATING INCOME 3,014,142 1,002,221 2,011,921
42. Depreciation Expense 623,700 632,114 8,414
43. Interest Payments 180,902 275,449 94,547
NET INCOME 2,209,540 94,658 2,114,882
*Other Income includes paid meal sales, school store sales, interest, student fundraising sales, and miscellaneous income;
it also includes unrealized gains (losses), including those on interest rate swaps hedging DCP's variable rate bonds
**Misc. Student Expense is primarily student recruiting, student events, student fundraising costs, student alumni costs,
and other miscs student costs
30

DC Preparatory AcademyFY11-12 Annual Budget
Annual Budget
REVENUE
01. Per Pupil Charter Payments 11,232,767
02. Per Pupil Facilities Allowance 2,741,200
03. Federal Entitlements 744,532
04. Other Government Funding/Grants 1,134,876
05. Private Grants and Donations 1,351,037
06. Activity Fees 72,935
07. Other Income (please describe in footnote) 22,200
TOTAL REVENUES 17,299,548
OPERATING EXPENSE
Personnel Salaries and Benefits
08. Principals/Executives Salary 1,194,661
09. Teachers Salaries 5,160,163
10. Teacher Aides/Assistance Salaries -
11. Other Education Professionals Salaries -
12. Business/Operations Salaries 919,046
13. Clerical Salaries 142,326
14. Custodial Salaries 41,200
15. Other Staff Salaries 1,974,234
16. Employee Benefits 1,959,206
17. Contracted Staff 66,095
18. Staff Development Expense 95,438
Subtotal: Personnel Expense 11,552,368
Direct Student Expense
17. Textbooks 60,000
18. Student Supplies and Materials 163,484
19. Library and Media Center Materials 7,000
20. Student Assessment Materials 100,000
21. Contracted Student Services 555,252
22. Miscellaneous Student Expense ** 93,870
Subtotal: Direct Student Expense 979,606
Occupancy Expenses
23. Rent 798,560
24. Building Maintenance and Repairs 57,500
25. Utilities 233,701
26. Janitorial Supplies 22,098
27. Contracted Building Services 286,879
Subtotal: Occupancy Expenses 1,398,739
Office Expenses
28. Office Supplies and Materials 129,288
29. Office Equipment Rental and Maintenance 91,372
30. Telephone/Telecommunications 50,057
31. Legal, Accounting and Payroll Services 320,862
32. Printing and Copying 46,500
33. Postage and Shipping 18,159
34. Other 6,941
Subtotal: Office Expenses 663,179
31
DC Preparatory AcademyFY11-12 Annual Budget
Annual Budget
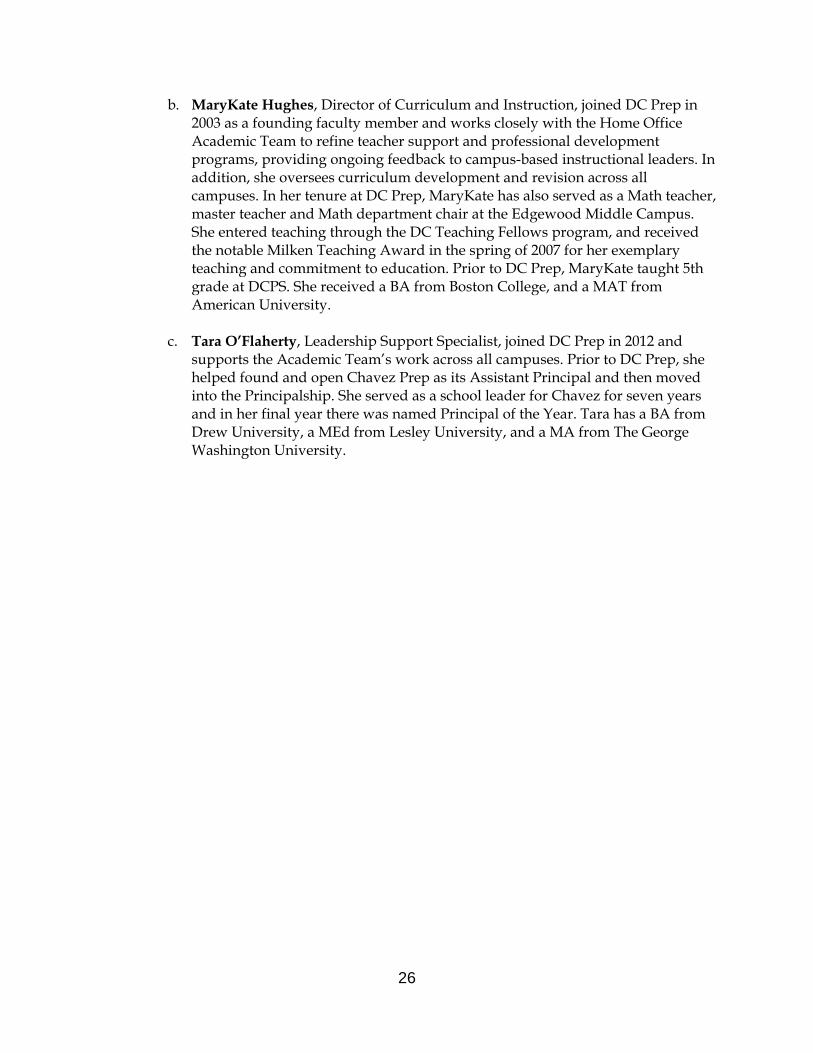
General Expenses
35. Insurance 53,619
36. Transportation 82,600
37. Food Service 570,495
38. Administration Fee (to PCSB) 68,370
39. Management Fee -
40. Other General Expense 637,351
41. Unforeseen Expenses 291,000
Subtotal: General Expenses 1,703,434
TOTAL OPERATING EXPENSES 16,297,327
NET OPERATING INCOME 1,002,221
42. Depreciation Expense 632,114
43. Interest Payments 275,449
NET INCOME 94,658
Paid meal sales, school store sales, student fundraising, and general miscellaneous revenue
comprise "07. Other Income."
**Student recruiting, student scholarships, and general miscellaneous student expense comprise
"22. Miscellaneous Student Expense."
32

33
MONETARY AND IN-KIND DONATIONS OF $500 OR GREATER Anonymous Ms. Patty Abramson and Mr. Les Silverman Mr. and Mrs. George Allen Mrs. Patricia Barmeyer Mr. and Mrs. John Beaty Mr. and Mrs. Albert Beveridge Ms. Katherine Boone Boone Family Foundation Mr. Stephen M. Boyd Mr. and Mrs. Alexander Boyle Mr. and Mrs. Steven Bralove Mr. and Mrs. Raymond Brophy Mr. and Mrs. Preston Brown Mr. and Mrs. Anthony Bruce Building Hope Mr. and Mrs. John Chapoton Mrs. Virginia Chew CityBridge Foundation Clark Charitable Foundation Mr. and Mrs. William Cooper DC Public Charter School Board The Dana Foundation Ms. Tina Daniels Mr. and Mrs. Porter Dawson Mr. and Mrs. Henry Diamond Mr. and Mrs. Ryan Drant Mrs. Louisa C. Duemling Mr. and Mrs. LeRoy Eakin Ms. Michela English and Mr. Rob Quartel Mrs. Norman Farquhar Dr. Anthony Fauci and Ms. Christine Grady Fight For Children Mr. and Mrs. Lee Folger Mrs. Nancy Folger Mr. and Mrs. Jerry Fotheringill Mr. and Mrs. John Franklin Susan Gage Caterers Mr. and Mrs. Michael Galvin Mr. Thomas Gardner General Mills/United Way Ms. Nathalie Gilfoyle Mr. and Mrs. Michael Glosserman Mr. Richard Gluck Grafik Marketing Communications Mrs. Pam Green Mr. and Mrs. David Gries Mr. and Mrs. Patrick Gross Mrs. Cynthia Guill Mr. and Mrs. Ridgway Hall
Mr. and Mrs. Erik Heyer Mr. and Mrs. Jeff Huvelle Mr. and Mrs. Adam Isles Jockey Hollow Foundation Kaiser Permanente (Rails-to-Trails) Mrs. Louis Kaplan Mr. and Mrs. Peter Kaplan Klingenstein Foundation Ms. Emily Lawson and Mr. Tom Amis Mr. and Mrs. Eugene Lawson Mr. James Lemon Mr. and Mrs. Peter Lockwood Mr. and Mrs. Mark Lynch Mr. and Mrs. Jonathan Marks Mr. and Mrs. Mark McFadden Mr. and Mrs. Allan McKelvie Mr. and Mrs. Roderick McKelvie Newmyer Family Foundation Mr. and Mrs. Lawrence Nussdorf Mr. and Mrs. David Nygaard Mr. and Mrs. Hubert O’Bannon Office of the State Superintendent of
Education Old St. Patrick’s Church Mr. and Mrs. David Pensky Perkins Hunter Foundation Fund Ms. Hilary Peterson and Mr. Frank Swain Mr. and Mrs. Jerome Powell Mr. and Mrs. Eric Price Mr. and Mrs. Whayne Quin Senator and Mrs. John Rockefeller Mr. and Mrs. James Rooney Mr. and Mrs. Lewis Rumford Mr. and Mrs. John Scully The Shanahan Firm Mrs. Leonard Shapiro Mr. and Mrs. Robert Silberman Mr. Gerard Smith Mr. and Mrs. John Smith Mr. and Mrs. Robert Smith Mr. David Steinberg Mr. and Mrs. Brendan Sullivan Mr. and Mrs. Bowdoin Train US Department of Education Mr. and Mrs. Stephen Urbanczyk Walton Family Foundation Mr. and Mrs. Steven Wayne Mr. and Mrs. Edwin Williamson

34
DATA COLLECTION TEMPLATE – Benning Elementary Campus
LEA ANNUAL REPORT
2011‐2012 SCHOOL YEAR
Data Collection Template The 2011‐12 school year annual report collects campus‐level data in the following three areas: Name and Contact Information, Verified Data Elements, and Unverified Data Elements. Please fill out these three sections for each campus served by the LEA. The data collection template is designed for only one campus. For LEAs with multiple campuses, please complete this template for each school campus it operates and submit to Timothy Harwood at [email protected] by August 24. Additionally, include this template for each school campus in the final annual report submission, due September 20.
Section 1 Name and Contact Information
LEA name: DC Prep
Campus name: Benning Elementary Campus
Address 1 100 41st Street, NE
Address 2 Washington, DC 20019
Phone: 202‐398‐2838
Fax: 202‐398‐2839
Website: www.dcprep.org
Section 2 Verified Data Elements Use data validated during PMF AYP validation window, attendance/re‐enrollment validation window, and discipline data validation window.
DC Prep Benning Elementary Campus School Program Data
Grade levels served Preschool (PK‐3) to Second Grade
Ages served 3 to 9 years old
Enrollment by grade level (Please place a check mark next to the grades served by the campus)
☒PK‐3; ☒PK‐4; ☒PK; ☒KG; ☒01; ☒02; ☐03; ☐04;
☐05; ☐06; ☐07; ☐08; ☐09; ☐10; ☐11; ☐12;
☐Ungraded; ☐AO/PG
School instruction dates Beginning Date: 08/22/2011.
End Date: 06/12/2012.
Total # of instructional days: # 180

35
Student Demographic Data
Demographics (%)^ Race/ethnicity: African American 98% Hispanic/Latino 2% Caucasian 0% Asian/Pacific Islander 0% Other race 0%
Gender: Male 48% Female 52%
Limited or Non‐English Proficient* 2%
Free or Reduced‐Price Lunch^ 83%
Special Education+ 6%
*Applies to any student enrolled during SY2011‐12 who have been and/or currently fall in the respective category
(this is not limited to the current school year).
^ Data from ProActive SY11‐12 Full Report
* Data from Enrollment Audit
+ Data from Spring 2012 special education supplemental funding request

36
Elementary/Middle School PMF Metrics (Leave section(s) blank if not applicable to campus or data is not available by time of submission)
Percent proficient and advanced, whole school population
N/A Percent advanced, whole school population
Percent proficient and advanced, for grade 3 and grade 8
Median Growth Percentile, whole school population
High School PMF Metrics (Leave section(s) blank if not applicable to campus or data is not available by time of submission)
2012 Graduation rate
N/A
PSAT performance, 11th grade
SAT performance, 12th grade
College acceptance rate
Percent proficient and advanced, whole school population
Percent advanced, whole school population
AP/IB – number passing exam scores per 100 students (Grade 12)
Median Growth Percentile, whole school population
Attendance Data (Leave section(s) blank if not applicable to campus)
Average Daily Attendance, whole school (Use validated ADA percentage in column C from the discipline verification spreadsheet)
95.9%
In‐seat Attendance Rate, whole school (Use validated ADA percentage in column F from the discipline verification spreadsheet)
92.9%
Chronically Absent Rate, whole school (Use validated ADA percentage in column G from the discipline verification spreadsheet)
6.9%

37
Accountability Plan Results (Leave section(s) blank if not applicable to campus)
Targets Results Target Met
K‐2nd grade students will increase their math percentile scores by an average of at least 7 points by the spring administration of NWEA MAP/MGP
Students achieved average growth of 2.3 percentile points
No
PK‐3 students will either increase their scores by an average of at least 7 letter identifications or master at least 21 letters by the spring administration of PALS
27.7% of students increased their scores by an average of 14.9 letter IDs and 72.3% mastered at least 21 letters
Yes
PK‐4 students will either increase their scores by an average of at least 7 letter sounds or master at least 24 letter sounds by the spring administration of STEP
32.3% of students increased their scores by an average of 14.6 letter sounds and 67.7% mastered at least 24 letter sounds
Yes
50% of K‐2nd grade students will score at or above the 40th percentile on NWEA MAP/MGP
54.6% of students scored at or above the 40th percentile
Yes
50% of K‐2nd grade students will score at or above grade level on STEP
54.6% of students scored at or above grade level
Yes
Average daily attendance for PK‐3 and PK‐4 students will be at least 88%
Average daily attendance of 95.3% for PK‐3 and PK‐4 students
Yes
Average daily attendance for K‐2nd students will be at least 92%
Average daily attendance of 96.3% for K‐2nd grade students
Yes
Discipline Data
Number of Unique Students with Discipline Records, whole school population (Use validated ADA percentage in column J from the discipline verification spreadsheet)
# 81
Incident : Student Ratio, whole school population (Use validated ADA percentage in column L from the discipline verification spreadsheet)
2.52
Percent of Instructional Days Lost, whole school population (Use validated ADA percentage in column M from the discipline verification spreadsheet)
0.44%
38
Section 3
Unverified Data Elements
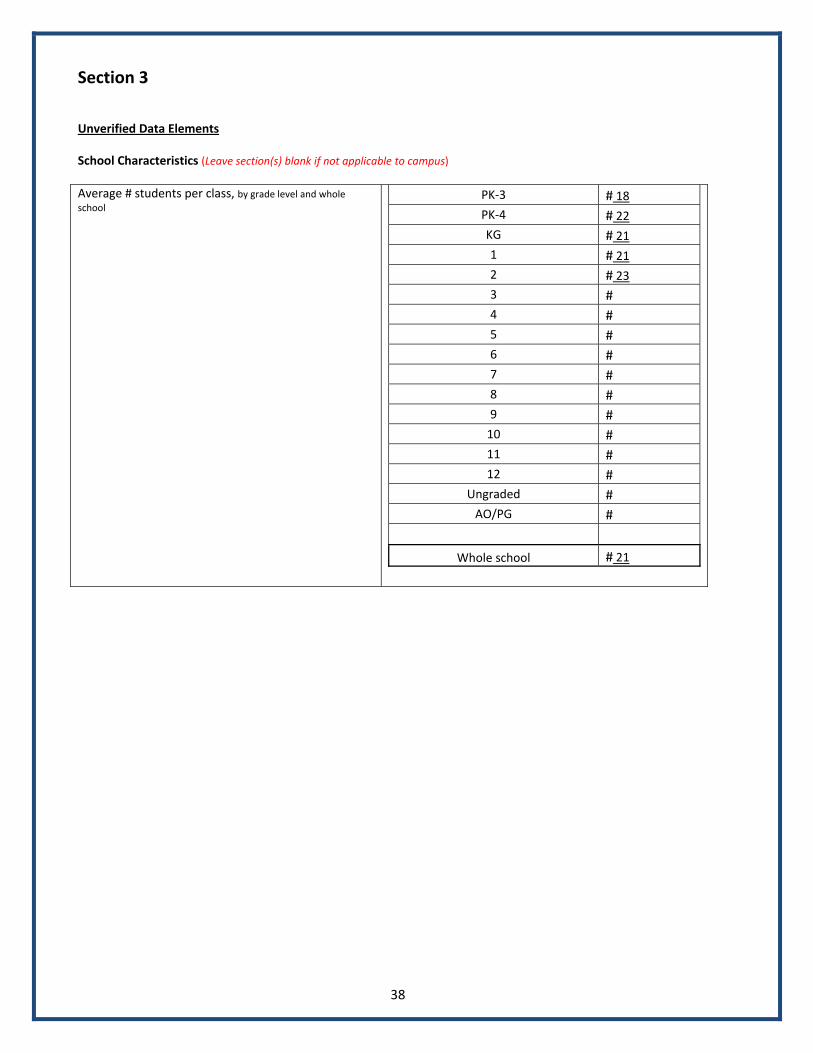
School Characteristics (Leave section(s) blank if not applicable to campus)
Average # students per class, by grade level and whole school
PK‐3 # 18
PK‐4 # 22
KG # 21
1 # 21
2 # 23
3 #
4 #
5 #
6 #
7 #
8 #
9 #
10 #
11 #
12 #
Ungraded #
AO/PG #
Whole school # 21

39
Student : Teacher Ratio, average by grade level and whole school
Student : Teacher Ratio
PK‐3 9: 1.
PK‐4 11: 1.
KG 21: 1.
1 21: 1.
2 23: 1.
3 : .
4 : .
5 : .
6 : .
7 : .
8 : .
9 : .
10 : .
11 : .
12 : .
Ungraded : .
AO/PG : .
Whole school 11: 1.
Staff Characteristics
Teacher Years of service, number and percentage for Teachers
and Teacher Aides. (Years of service = total years of teaching experience)
Number Percentage*
0 to 3 years # 18 69%
4 to 7 years # 6 23%
8 or more years # 2 8%
* Number of teachers in years of service band as a percentage of all teachers at the school
Teacher Attrition, number and percentage for Teachers and
Teacher Aides By years of service:
Number Percentage^
0 to 3 years # 6 33%
4 to 7 years # 2 33%
8 or more years # 0 0%
^ Number of teachers in years of service band who left the school as a percentage of all teachers in years of service band

40
Salary Teachers
Average Decline to state
Range Decline to state
Teacher aides
Average N/A
Range
Staff
Average Decline to state
Range Decline to state
School administration
Average Decline to state
Range Decline to state
Central Office
Average Decline to state
Range Decline to state
HQT Count
Number of teachers # 15

41
Facilities
Square footage
Entire for building(includes entire building, lot, and land) # 78,000
Entire for total classroom space
Not available
Room inventory Number of rooms by subject:
Math # 12
Science # 12
Social Studies # 12
English/Language Arts # 12
Art/Music/PE/Other # 4
Library # 1
Number of rooms by grade level:
PK‐3: # 4
PK‐4: # 3
KG: # 3
1 # 3
2 # 3
3
N/A
4
5
6
7
8
9
10
11
12
Ungraded: # 4
AO/PG: N/A
Room to students and teacher ratio, average for whole school
Student to Classroom ratio 16.6: 1.
Teacher to Classroom ratio 1.5: 1.

42
DATA COLLECTION TEMPLATE – Edgewood Elementary Campus
LEA ANNUAL REPORT
2011‐2012 SCHOOL YEAR
Data Collection Template The 2011‐12 school year annual report collects campus‐level data in the following three areas: Name and Contact Information, Verified Data Elements, and Unverified Data Elements. Please fill out these three sections for each campus served by the LEA. The data collection template is designed for only one campus. For LEAs with multiple campuses, please complete this template for each school campus it operates and submit to Timothy Harwood at [email protected] by August 24. Additionally, include this template for each school campus in the final annual report submission, due September 20.
Section 1 Name and Contact Information
LEA name: DC Prep
Campus name: Edgewood Elementary Campus
Address 1 707 Edgewood Street, NE
Address 2 Washington, DC 20017
Phone: 202‐635‐4411
Fax: 202‐635‐4412
Website: www.dcprep.org
Section 2 Verified Data Elements Use data validated during PMF AYP validation window, attendance/re‐enrollment validation window, and discipline data validation window.
DC Prep Edgewood Elementary Campus School Program Data
Grade levels served Preschool (PK‐3) to Third Grade
Ages served 3 to 10 years old
Enrollment by grade level (Please place a check mark next to the grades served by the campus)
☒PK‐3; ☒PK‐4; ☒PK; ☒KG; ☒01; ☒02; ☒03; ☐04;
☐05; ☐06; ☐07; ☐08; ☐09; ☐10; ☐11; ☐12;
☐Ungraded; ☐AO/PG
School instruction dates Beginning Date: 08/22/2011.
End Date: 06/12/2012.
Total # of instructional days: # 180

43
Student Demographic Data
Demographics (%)^ Race/ethnicity: African American 94% Hispanic/Latino 5% Caucasian 0% Asian/Pacific Islander 0% Other race 0%
Gender: Male 50% Female 50%
Limited or Non‐English Proficient* 6%
Free or Reduced‐Price Lunch^ 88%
Special Education+ 5%
*Applies to any student enrolled during SY2011‐12 who have been and/or currently fall in the respective category
(this is not limited to the current school year).
^ Data from ProActive SY11‐12 Full Report
* Data from Enrollment Audit
+ Data from Spring 2012 special education supplemental funding request

44
Elementary/Middle School PMF Metrics (Leave section(s) blank if not applicable to campus or data is not available by time of submission)
Percent proficient and advanced, whole school population
N/A Percent advanced, whole school population
Percent proficient and advanced, for grade 3 and grade 8
Median Growth Percentile, whole school population
High School PMF Metrics (Leave section(s) blank if not applicable to campus or data is not available by time of submission)
2012 Graduation rate
N/A
PSAT performance, 11th grade
SAT performance, 12th grade
College acceptance rate
Percent proficient and advanced, whole school population
Percent advanced, whole school population
AP/IB – number passing exam scores per 100 students (Grade 12)
Median Growth Percentile, whole school population
Attendance Data (Leave section(s) blank if not applicable to campus)
Average Daily Attendance, whole school (Use validated ADA percentage in column C from the discipline verification spreadsheet)
96.1%
In‐seat Attendance Rate, whole school (Use validated ADA percentage in column F from the discipline verification spreadsheet)
94.3%
Chronically Absent Rate, whole school (Use validated ADA percentage in column G from the discipline verification spreadsheet)
4.6%

45
Accountability Plan Results (Leave section(s) blank if not applicable to campus)
Targets Results Target Met
K‐3rd grade students will increase their math percentile scores by an average of at least 7 points by the spring administration of NWEA MAP/MGP
Students achieved average growth of 0.1 percentile points
No
PK‐3 students will either increase their scores by an average of at least 7 letter identifications or master at least 21 letters by the spring administration of PALS
22.6% of students increased their scores by an average of 13.4 letter IDs and 77.4% mastered at least 21 letters
Yes
PK‐4 students will either increase their scores by an average of at least 7 letter sounds or master at least 24 letter sounds by the spring administration of STEP
19.7% of students increased their scores by an average of 15.7 letter sounds and 80.3% mastered at least 24 letter sounds
Yes
50% of K‐3rd grade students will score at or above the 40th percentile on NWEA MAP/MGP
67.4% of students scored at or above the 40th percentile
Yes
50% of K‐2nd grade students will score at or above grade level on STEP
76.1% of students scored at or above grade level
Yes
3rd grade students will achieve DC Prep’s safe harbor target on the Reading DC CAS
76.2% of student scored proficient Yes
Average daily attendance for PK‐3 and PK‐4 students will be at least 88%
Average daily attendance of 94.9% for PK‐3 and PK‐4 students
Yes
Average daily attendance for K‐3rd students will be at least 92%
Average daily attendance of 96.7% for K‐2nd grade students
Yes
Discipline Data
Number of Unique Students with Discipline Records, whole school population (Use validated ADA percentage in column J from the discipline verification spreadsheet)
# 48
Incident : Student Ratio, whole school population (Use validated ADA percentage in column L from the discipline verification spreadsheet)
2.31
Percent of Instructional Days Lost, whole school population (Use validated ADA percentage in column M from the discipline verification spreadsheet)
0.18%

46
Section 3
Unverified Data Elements
School Characteristics (Leave section(s) blank if not applicable to campus)
Average # students per class, by grade level and whole school
PK‐3 # 18.5
PK‐4 # 22
KG # 23
1 # 22
2 # 22
3 # 23
4 #
5 #
6 #
7 #
8 #
9 #
10 #
11 #
12 #
Ungraded #
AO/PG #
Whole school # 22

47
Student : Teacher Ratio, average by grade level and whole school
Student : Teacher Ratio
PK‐3 9: 1.
PK‐4 11: 1.
KG 23: 1.
1 22: 1.
2 22: 1.
3 23: 1.
4 : .
5 : .
6 : .
7 : .
8 : .
9 : .
10 : .
11 : .
12 : .
Ungraded : .
AO/PG : .
Whole school 12: 1.
Staff Characteristics
Teacher Years of service, number and percentage for Teachers
and Teacher Aides. (Years of service = total years of teaching experience)
Number Percentage*
0 to 3 years # 14 48%
4 to 7 years # 4 14%
8 or more years # 11 38%
* Number of teachers in years of service band as a percentage of all teachers at the school
Teacher Attrition, number and percentage for Teachers and
Teacher Aides By years of service:
Number Percentage^
0 to 3 years # 6 43%
4 to 7 years # 2 50%
8 or more years # 1 9%
^ Number of teachers in years of service band who left the school as a percentage of all teachers in years of service band

48
Salary Teachers
Average Decline to state
Range Decline to state
Teacher aides
Average N/A
Range
Staff
Average Decline to state
Range Decline to state
School administration
Average Decline to state
Range Decline to state
Central Office
Average Decline to state
Range Decline to state
HQT Count
Number of teachers # 18

49
Facilities
Square footage
Entire for building(includes entire building, lot, and land) # 50,050
Entire for total classroom space
Not available
Room inventory Number of rooms by subject:
Math # 17
Science # 17
Social Studies # 17
English/Language Arts # 17
Art/Music/PE/Other # 4
Library # 1
Number of rooms by grade level:
PK‐3: # 4
PK‐4: # 3
KG: # 3
1 # 3
2 # 3
3 # 3
4
N/A
5
6
7
8
9
10
11
12
Ungraded: # 4
AO/PG: N/A
Room to students and teacher ratio, average for whole school
Student to Classroom ratio 18: 1.
Teacher to Classroom ratio 1.4: 1.

50
DATA COLLECTION TEMPLATE – Edgewood Middle Campus
LEA ANNUAL REPORT
2011‐2012 SCHOOL YEAR
Data Collection Template The 2011‐12 school year annual report collects campus‐level data in the following three areas: Name and Contact Information, Verified Data Elements, and Unverified Data Elements. Please fill out these three sections for each campus served by the LEA. The data collection template is designed for only one campus. For LEAs with multiple campuses, please complete this template for each school campus it operates and submit to Timothy Harwood at [email protected] by August 24. Additionally, include this template for each school campus in the final annual report submission, due September 20.
Section 1 Name and Contact Information
LEA name: DC Prep
Campus name: Edgewood Middle Campus
Address 1 701 Edgewood Street, NE
Address 2 Washington, DC 20017
Phone: 202‐832‐5700
Fax: 202‐832‐5701
Website: www.dcprep.org
Section 2 Verified Data Elements Use data validated during PMF AYP validation window, attendance/re‐enrollment validation window, and discipline data validation window.
DC Prep Edgewood Middle Campus School Program Data
Grade levels served 4th to 8th Grade
Ages served 8 to 15 years old
Enrollment by grade level (Please place a check mark next to the grades served by the campus)
☐PK‐3; ☐PK‐4; ☐PK; ☐KG; ☐01; ☐02; ☐03; ☒04;
☒05; ☒06; ☒07; ☒08; ☐09; ☐10; ☐11; ☐12;
☐Ungraded; ☐AO/PG
School instruction dates Beginning Date: 08/22/2011.
End Date: 06/12/2012.
Total # of instructional days: # 180

51
Student Demographic Data
Demographics (%)^ Race/ethnicity: African American 95% Hispanic/Latino 5% Caucasian 0% Asian/Pacific Islander 0% Other race 0%
Gender: Male 50% Female 50%
Limited or Non‐English Proficient* 1%
Free or Reduced‐Price Lunch^ 82%
Special Education+ 16%
*Applies to any student enrolled during SY2011‐12 who have been and/or currently fall in the respective category
(this is not limited to the current school year).
^ Data from ProActive SY11‐12 Full Report
* Data from Enrollment Audit
+ Data from Spring 2012 special education supplemental funding request

52
Elementary/Middle School PMF Metrics (Leave section(s) blank if not applicable to campus or data is not available by time of submission)
Percent proficient and advanced, whole school population Math: 89% Reading: 72%
Percent advanced, whole school population Math: 38% Reading: 17%
Percent proficient and advanced, for grade 3 and grade 8 Grade 3 Reading: N/A Grade 8 Math: 96%
Median Growth Percentile, whole school population Math: 68 Reading: 62
High School PMF Metrics (Leave section(s) blank if not applicable to campus or data is not available by time of submission)
2012 Graduation rate
N/A
PSAT performance, 11th grade
SAT performance, 12th grade
College acceptance rate
Percent proficient and advanced, whole school population
Percent advanced, whole school population
AP/IB – number passing exam scores per 100 students (Grade 12)
Median Growth Percentile, whole school population
Attendance Data (Leave section(s) blank if not applicable to campus)
Average Daily Attendance, whole school (Use validated ADA percentage in column C from the discipline verification spreadsheet)
97.7%
In‐seat Attendance Rate, whole school (Use validated ADA percentage in column F from the discipline verification spreadsheet)
95.6%
Chronically Absent Rate, whole school (Use validated ADA percentage in column G from the discipline verification spreadsheet)
2.9%

53
Accountability Plan Results (Leave section(s) blank if not applicable to campus)
Targets Results Target Met
N/A
Discipline Data
Number of Unique Students with Discipline Records, whole school population (Use validated ADA percentage in column J from the discipline verification spreadsheet)
# 111
Incident : Student Ratio, whole school population (Use validated ADA percentage in column L from the discipline verification spreadsheet)
2.43
Percent of Instructional Days Lost, whole school population (Use validated ADA percentage in column M from the discipline verification spreadsheet)
0.62%

54
Section 3
Unverified Data Elements
School Characteristics (Leave section(s) blank if not applicable to campus)
Average # students per class, by grade level and whole school
PK‐3 #
PK‐4 #
KG #
1 #
2 #
3 #
4 # 25
5 # 23
6 # 20
7 # 22
8 # 16
9 #
10 #
11 #
12 #
Ungraded #
AO/PG #
Whole school # 22

55
Student : Teacher Ratio, average by grade level and whole school
Student : Teacher Ratio
PK‐3 : .
PK‐4 : .
KG : .
1 : .
2 : .
3 : .
4 15: 1.
5 14: 1.
6 12: 1.
7 14: 1.
8 10: 1.
9 : .
10 : .
11 : .
12 : .
Ungraded : .
AO/PG : .
Whole school 9: 1.
Staff Characteristics
Teacher Years of service, number and percentage for Teachers
and Teacher Aides. (Years of service = total years of teaching experience)
Number Percentage*
0 to 3 years # 8 28%
4 to 7 years # 15 52%
8 or more years # 6 21%
* Number of teachers in years of service band as a percentage of all teachers at the school
Teacher Attrition, number and percentage for Teachers and
Teacher Aides By years of service:
Number Percentage^
0 to 3 years # 2 25%
4 to 7 years # 3 20%
8 or more years # 2 33%
^ Number of teachers in years of service band who left the school as a percentage of all teachers in years of service band

56
Salary Teachers
Average Decline to state
Range Decline to state
Teacher aides
Average N/A
Range
Staff
Average Decline to state
Range Decline to state
School administration
Average Decline to state
Range Decline to state
Central Office
Average Decline to state
Range Decline to state
HQT Count
Number of teachers # 28

57
Facilities
Square footage
Entire for building(includes entire building, lot, and land) # 39,746
Entire for total classroom space
Not available
Room inventory Number of rooms by subject:
Math # 5
Science # 1
Social Studies # 5
English/Language Arts # 8
Art/Music/PE/Other # 5
Library # 1
Number of rooms by grade level:
PK‐3:
N/A
PK‐4:
KG:
1
2
3
4 # 3
5 # 3
6 # 3
7 # 2
8 # 2
9
N/A 10
11
12
Ungraded: # 6
AO/PG: N/A
Room to students and teacher ratio, average for whole school
Student to Classroom ratio 15: 1.
Teacher to Classroom ratio 1.6: 1.