Embed Size (px)
Citation preview
Parnassus Funds Annual Report December 31, 2018
Parnassus FundSM Investor Shares: PARNX | Institutional Shares: PFPRX
Parnassus Core Equity FundSM Investor Shares: PRBLX | Institutional Shares: PRILX
Parnassus Endeavor FundSM Investor Shares: PARWX | Institutional Shares: PFPWX
Parnassus Mid Cap FundSM Investor Shares: PARMX | Institutional Shares: PFPMX
Parnassus Fixed Income FundSM Investor Shares: PRFIX | Institutional Shares: PFPLX

Beginning on January 1, 2021, as permitted by regulations adopted by the SEC, paper copies of the Funds’ shareholder reports will no longer be sent by mail, unless you specifically request paper copies of the reports from the Funds or from your financial intermediary, such as a broker-dealer or bank. Instead, the reports will be made available on the Funds’ website (www.parnassus.com), and you will be notified by mail each time a report is posted and provided with a website link to access the report.
If you already elected to receive shareholder reports electronically, you will not be affected by this change and you need not take any action. You may elect to receive shareholder reports and other communications from the Funds by contacting your financial intermediary (such as a broker-dealer or bank) or, if you are a direct investor, by calling 800-999-3505 or by sending an email request to [email protected].
You may elect to receive all future reports in paper copies free of charge. If you invest through a financial intermediary, you can contact your financial intermediary to request that you continue to receive paper copies of your shareholder reports. If you invest directly with the Funds, you can call 800-999-3505 or send an email request to [email protected] to let the Funds know you wish to continue receiving paper copies of your shareholder reports. Your election to receive paper copies of reports will apply to all funds held in your account if you invest through your financial intermediary.
Table of Contents
Letter from Parnassus Investments .........................................................................................4
Fund Performance and Commentary
Parnassus Fund ..........................................................................................................................5
Parnassus Core Equity Fund ....................................................................................................9
Parnassus Endeavor Fund ........................................................................................................13
Parnassus Mid Cap Fund ..........................................................................................................17
Parnassus Fixed Income Fund .................................................................................................21
Responsible Investing Notes ...................................................................................................24
Fund Expenses ...........................................................................................................................26
Report of Independent Public Accounting Firm ..................................................................28
Portfolios of Investments
Parnassus Fund ..........................................................................................................................29
Parnassus Core Equity Fund ....................................................................................................31
Parnassus Endeavor Fund ........................................................................................................33
Parnassus Mid Cap Fund ..........................................................................................................35
Parnassus Fixed Income Fund .................................................................................................37
Financial Statements .................................................................................................................42
Notes to Financial Statements .................................................................................................48
Financial Highlights ...................................................................................................................60
Additional Information ..............................................................................................................64
3
Annual Report • 2018
February 8, 2019
Dear Shareholder,
After nine consecutive annual gains, the S&P 500 finally stumbled in 2018. Thankfully, it was a modest loss of just 4.38%. The Russell Midcap did worse, as it returned a loss of 9.06% for the year. Our equity funds were a mixed bag this year, as two of them outperformed their benchmarks and two fell short. Our most popular offering, the Parnassus Core Equity Fund, was easily our best-performing fund in 2018, beating the S&P 500 Index and its Lipper peer group average by over 4% and 7%, respectively. Lead portfolio manager Todd Ahlsten, with his nearly two decades of tenure on the Fund, deserves the lion’s share of credit for the terrific performance in 2018. The Parnassus Mid Cap Fund, managed by Matthew Gershuny and Lori Keith, also outperformed its Index and Lipper peer group average for the year. These two funds share a similar style, in that they are managed with an emphasis on minimizing downside risk. This approach paid off during the volatile fourth quarter.
The two equity funds that trailed their benchmarks, the Parnassus Endeavor Fund and the Parnassus Fund, still boast attractive long-term track records. Despite a challenging 2018, I’m confident that these funds will return to form in 2019 by posting attractive investment results.
Please see the following pages for more detailed information regarding each fund’s performance and the risks associated with investing in the Funds. Also included are the investment outlooks of our portfolio managers for the coming year. I hope you enjoy the reports and find them informative.
New Employee
During the fourth quarter, Leah Weaver joined Parnassus’s marketing team full time. She had previously interned with us while completing her undergraduate studies at the University of California, Berkeley. Leah earned a double major in legal studies and rhetoric, with honors in rhetoric and distinction in general scholarship. She worked throughout her college career, including positions ranging from museum assistant to venture capital intern. Leah is a classically trained singer and enjoys hiking, reading and writing.
Thank you for investing with the Parnassus Funds.
Yours truly,
Benjamin E. Allen President and CEO
4
Annual Report • 2018
Parnassus Fund
Ticker: Investor Shares - PARNX Ticker: Institutional Shares - PFPRX
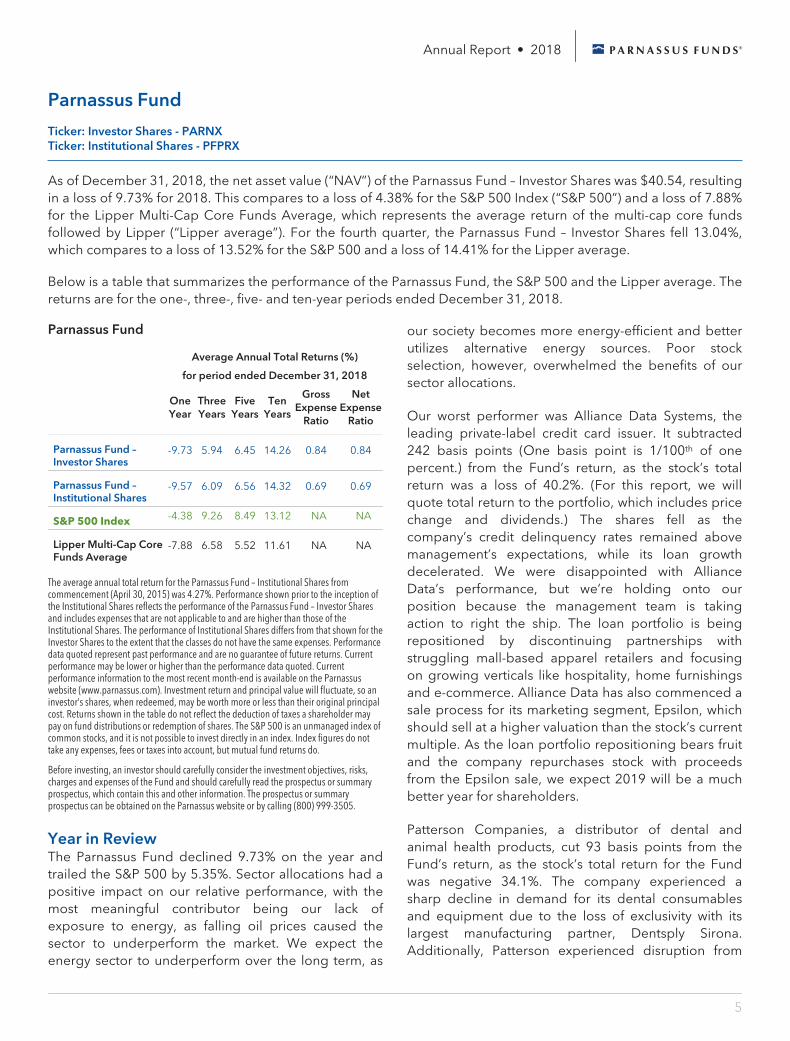
As of December 31, 2018, the net asset value (“NAV”) of the Parnassus Fund – Investor Shares was $40.54, resulting in a loss of 9.73% for 2018. This compares to a loss of 4.38% for the S&P 500 Index (“S&P 500”) and a loss of 7.88% for the Lipper Multi-Cap Core Funds Average, which represents the average return of the multi-cap core funds followed by Lipper (“Lipper average”). For the fourth quarter, the Parnassus Fund – Investor Shares fell 13.04%, which compares to a loss of 13.52% for the S&P 500 and a loss of 14.41% for the Lipper average.
Below is a table that summarizes the performance of the Parnassus Fund, the S&P 500 and the Lipper average. The returns are for the one-, three-, five- and ten-year periods ended December 31, 2018.
Parnassus Fund
Average Annual Total Returns (%)
for period ended December 31, 2018
One Year
Three Years
Five Years
Ten Years
Gross Expense
Ratio
Net Expense
Ratio
Parnassus Fund – Investor Shares
-9.73 5.94 6.45 14.26 0.84 0.84
Parnassus Fund – Institutional Shares
-9.57 6.09 6.56 14.32 0.69 0.69
S&P 500 Index -4.38 9.26 8.49 13.12 NA NA
Lipper Multi-Cap Core Funds Average
-7.88 6.58 5.52 11.61 NA NA
The average annual total return for the Parnassus Fund – Institutional Shares from commencement (April 30, 2015) was 4.27%. Performance shown prior to the inception of the Institutional Shares reflects the performance of the Parnassus Fund – Investor Shares and includes expenses that are not applicable to and are higher than those of the Institutional Shares. The performance of Institutional Shares differs from that shown for the Investor Shares to the extent that the classes do not have the same expenses. Performance data quoted represent past performance and are no guarantee of future returns. Current performance may be lower or higher than the performance data quoted. Current performance information to the most recent month-end is available on the Parnassus website (www.parnassus.com). Investment return and principal value will fluctuate, so an investor’s shares, when redeemed, may be worth more or less than their original principal cost. Returns shown in the table do not reflect the deduction of taxes a shareholder may pay on fund distributions or redemption of shares. The S&P 500 is an unmanaged index of common stocks, and it is not possible to invest directly in an index. Index figures do not take any expenses, fees or taxes into account, but mutual fund returns do.
Before investing, an investor should carefully consider the investment objectives, risks, charges and expenses of the Fund and should carefully read the prospectus or summary prospectus, which contain this and other information. The prospectus or summary prospectus can be obtained on the Parnassus website or by calling (800) 999-3505.
Year in Review The Parnassus Fund declined 9.73% on the year and trailed the S&P 500 by 5.35%. Sector allocations had a positive impact on our relative performance, with the most meaningful contributor being our lack of exposure to energy, as falling oil prices caused the sector to underperform the market. We expect the energy sector to underperform over the long term, as
our society becomes more energy-efficient and better utilizes alternative energy sources. Poor stock selection, however, overwhelmed the benefits of our sector allocations.
Our worst performer was Alliance Data Systems, the leading private-label credit card issuer. It subtracted 242 basis points (One basis point is 1/100th of one percent.) from the Fund’s return, as the stock’s total return was a loss of 40.2%. (For this report, we will quote total return to the portfolio, which includes price change and dividends.) The shares fell as the company’s credit delinquency rates remained above management’s expectations, while its loan growth decelerated. We were disappointed with Alliance Data’s performance, but we’re holding onto our position because the management team is taking action to right the ship. The loan portfolio is being repositioned by discontinuing partnerships with struggling mall-based apparel retailers and focusing on growing verticals like hospitality, home furnishings and e-commerce. Alliance Data has also commenced a sale process for its marketing segment, Epsilon, which should sell at a higher valuation than the stock’s current multiple. As the loan portfolio repositioning bears fruit and the company repurchases stock with proceeds from the Epsilon sale, we expect 2019 will be a much better year for shareholders.
Patterson Companies, a distributor of dental and animal health products, cut 93 basis points from the Fund’s return, as the stock’s total return for the Fund was negative 34.1%. The company experienced a sharp decline in demand for its dental consumables and equipment due to the loss of exclusivity with its largest manufacturing partner, Dentsply Sirona. Additionally, Patterson experienced disruption from
5
Annual Report • 2018
internal sales-force changes and greater competition from online players such as Amazon. We sold the stock during the year after we lost confidence in management’s turnaround plan.
First Horizon National, a Tennessee-based regional bank, reduced the Fund’s return by 91 basis points, as its stock yielded a negative total return of 32.3%. The shares fell after loan growth came in below expectations when it took longer than expected to integrate its acquisition of Capital Bank. With the integration now complete, loan growth should accelerate in 2019. We believe that First Horizon’s dominant position in Tennessee, its diversified, low-risk loan book, and its new growth markets in the Carolinas and South Florida from the Capital Bank acquisition position the bank to outperform going forward.
Moving on to happier subjects, luxury hotelier Belmond was the Fund’s biggest winner, contributing 172 basis points to the Fund’s return, as its stock generated an amazing total return of 104.3%. The shares soared when the company announced it was selling itself for $25 per share to Paris-based luxury goods conglomerate LVMH. We’ve owned Belmond since 2013, and we remained confident that the stock price would eventually rise to reflect the value of the company’s iconic hotels. We’re happy that our patience was rewarded.
Motorola Solutions, the largest provider of mission-critical communications solutions, added 105 basis points to the Fund’s return as its total return was 29.6%. The stock moved higher as the company raised its full-year earnings guidance three times during the year due to broad-based demand for its land mobile radio systems and surveillance solutions from Avigilon, a recent acquisition. Motorola is winning market share and expanding its addressable markets by providing the most innovative and complete communications solutions to its public safety and corporate clients.
Thomson Reuters provides information and data for professionals in the legal, tax, accounting and financial sectors. The stock generated a total return of 14.3% and contributed 79 basis points to the Fund’s performance. The shares declined at the beginning of the year, as investors were initially disappointed by the company’s decision to sell a 55% interest in its financial segment to Blackstone. We added to our position on the weakness, because the sale allows Thomson
Reuters to focus on its higher-growth and higher-margin segments. Investors eventually came around to our perspective and the stock rebounded, then continued to move higher as revenue growth in its legal segment accelerated.
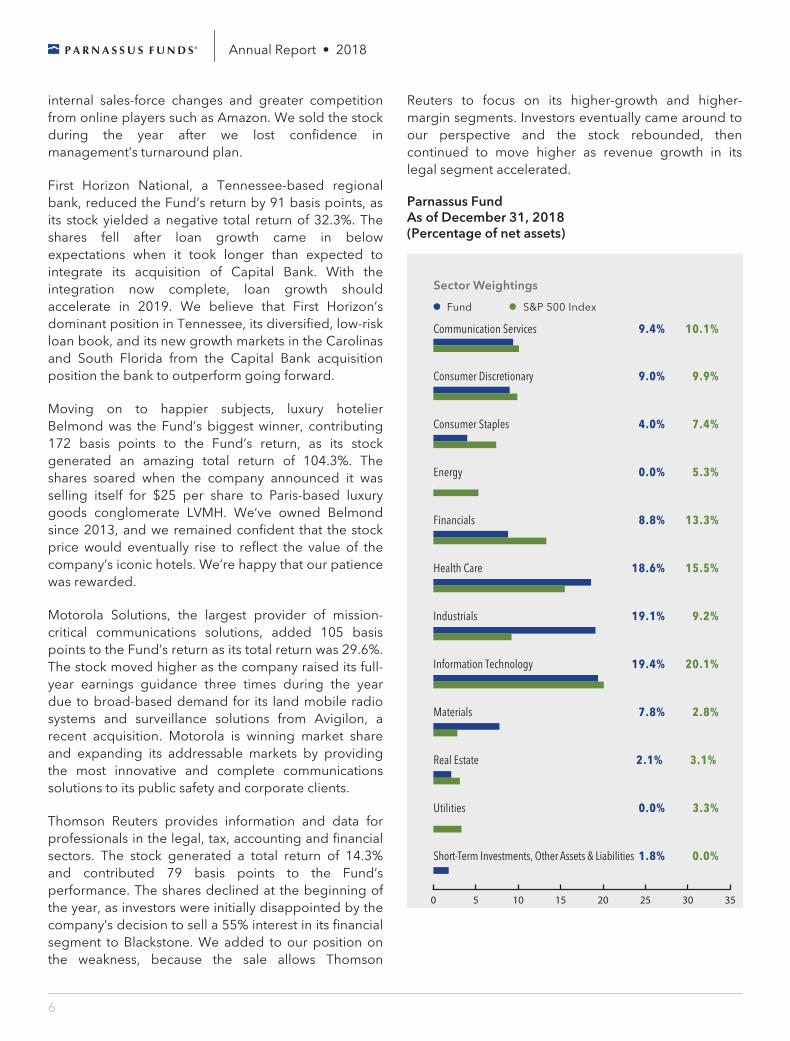
Parnassus Fund As of December 31, 2018 (Percentage of net assets)
Sector Weightings
Fund
10.1%9.4%
7.4%4.0%
9.9%9.0%
0.0%1.8%
5.3%0.0%
13.3%8.8%
15.5%18.6%
20.1%19.4%
9.2%19.1%
2.8%7.8%
3.3%0.0%
3.1% 2.1%
S&P 500 Index
0 5 10 15 3520 25 30
Communication Services
Consumer Staples
Consumer Discretionary
Short-Term Investments, Other Assets & Liabilities
Energy
Financials
Health Care
Information Technology
Industrials
Materials
Utilities
Real Estate
6
Annual Report • 2018
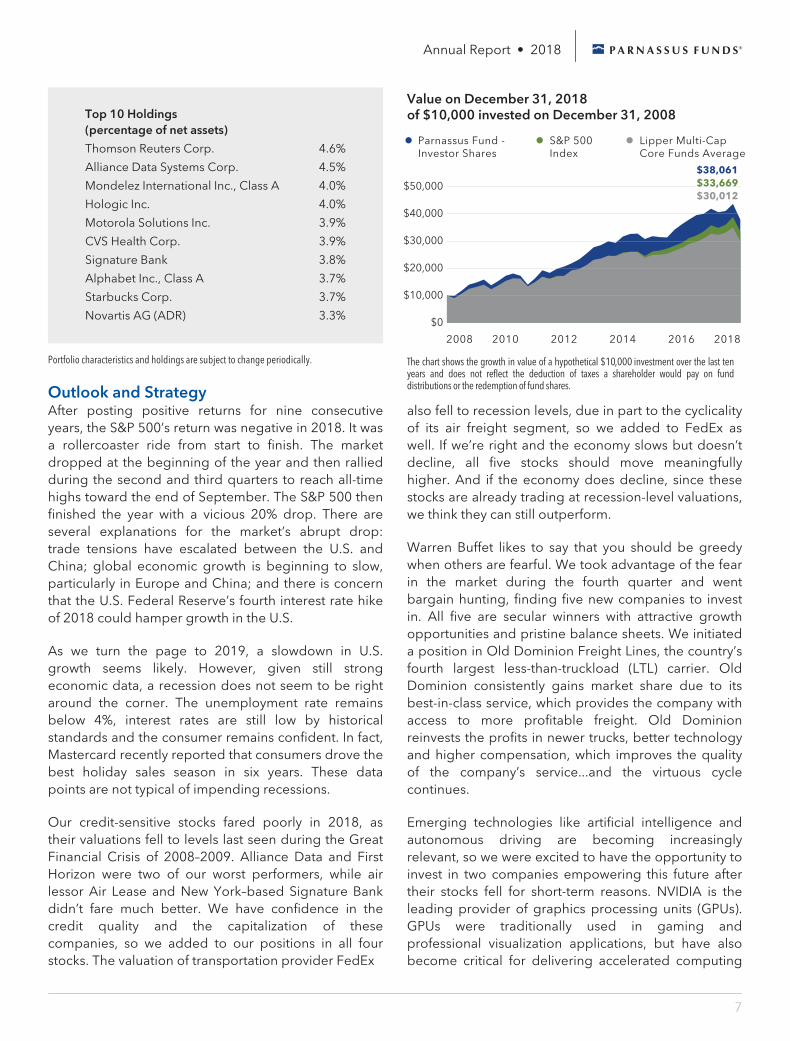
Top 10 Holdings (percentage of net assets)
Thomson Reuters Corp. 4.6%
Alliance Data Systems Corp. 4.5%
Mondelez International Inc., Class A 4.0%
Hologic Inc. 4.0%
Motorola Solutions Inc. 3.9%
CVS Health Corp. 3.9%
Signature Bank 3.8%
Alphabet Inc., Class A 3.7%
Starbucks Corp. 3.7%
Novartis AG (ADR) 3.3%
Portfolio characteristics and holdings are subject to change periodically.
Outlook and Strategy After posting positive returns for nine consecutive years, the S&P 500’s return was negative in 2018. It was a rollercoaster ride from start to finish. The market dropped at the beginning of the year and then rallied during the second and third quarters to reach all-time highs toward the end of September. The S&P 500 then finished the year with a vicious 20% drop. There are several explanations for the market’s abrupt drop: trade tensions have escalated between the U.S. and China; global economic growth is beginning to slow, particularly in Europe and China; and there is concern that the U.S. Federal Reserve’s fourth interest rate hike of 2018 could hamper growth in the U.S.
As we turn the page to 2019, a slowdown in U.S. growth seems likely. However, given still strong economic data, a recession does not seem to be right around the corner. The unemployment rate remains below 4%, interest rates are still low by historical standards and the consumer remains confident. In fact, Mastercard recently reported that consumers drove the best holiday sales season in six years. These data points are not typical of impending recessions.
Our credit-sensitive stocks fared poorly in 2018, as their valuations fell to levels last seen during the Great Financial Crisis of 2008–2009. Alliance Data and First Horizon were two of our worst performers, while air lessor Air Lease and New York–based Signature Bank didn’t fare much better. We have confidence in the credit quality and the capitalization of these companies, so we added to our positions in all four stocks. The valuation of transportation provider FedEx
Value on December 31, 2018 of $10,000 invested on December 31, 2008
$50,000
$30,000
$40,000
$20,000
$10,000
$0
Parnassus Fund -Investor Shares
S&P 500Index
Lipper Multi-CapCore Funds Average
$38,061
2008 2010 2012 2014 2016 2018
$33,669$30,012
The chart shows the growth in value of a hypothetical $10,000 investment over the last ten years and does not reflect the deduction of taxes a shareholder would pay on fund distributions or the redemption of fund shares.
also fell to recession levels, due in part to the cyclicality of its air freight segment, so we added to FedEx as well. If we’re right and the economy slows but doesn’t decline, all five stocks should move meaningfully higher. And if the economy does decline, since these stocks are already trading at recession-level valuations, we think they can still outperform.
Warren Buffet likes to say that you should be greedy when others are fearful. We took advantage of the fear in the market during the fourth quarter and went bargain hunting, finding five new companies to invest in. All five are secular winners with attractive growth opportunities and pristine balance sheets. We initiated a position in Old Dominion Freight Lines, the country’s fourth largest less-than-truckload (LTL) carrier. Old Dominion consistently gains market share due to its best-in-class service, which provides the company with access to more profitable freight. Old Dominion reinvests the profits in newer trucks, better technology and higher compensation, which improves the quality of the company’s service...and the virtuous cycle continues.
Emerging technologies like artificial intelligence and autonomous driving are becoming increasingly relevant, so we were excited to have the opportunity to invest in two companies empowering this future after their stocks fell for short-term reasons. NVIDIA is the leading provider of graphics processing units (GPUs). GPUs were traditionally used in gaming and professional visualization applications, but have also become critical for delivering accelerated computing
7
Annual Report • 2018
power in data centers, autonomous driving and machine learning. We believe the company is uniquely positioned to take advantage of these large and rapidly growing markets. We also initiated a position in Cadence Systems, which sells design hardware and software to semiconductor companies. Cadence is benefitting from an expanding customer base, increasing chip complexity and emerging technologies, all of which are creating exponential growth in data processing and storage needs. We think that earnings growth could meaningfully accelerate over the next few years, so we’re excited to own Cadence in the Fund.
In addition, we added Cerner, the largest publicly traded health care information technology company. Cerner has a history of innovation, providing a wide range of software, hardware and services that are used across hospitals, pharmacies and physician practices. The company recently signed a ten-year, $10 billion contract with the United States Department of Veterans Affairs, the largest health system in the world. Going forward, we believe Cerner has several exciting growth opportunities and the ability to expand margins.
Our last new holding is Adobe, inventor of the PDF file format and a leading software-as-a-service provider of creative and digital marketing solutions. Adobe’s products are mission critical in creating digital content, which is becoming increasingly relevant in today’s digital economy.
To make room for these positions, we sold three stocks during the fourth quarter. We exited eBay due to our concern that online niche marketplaces have disrupted its broad marketplace, which will result in slower growth. We sold Intel after generating a solid profit because we believe it’s losing market share in its important data center business. Finally, we exited long-term holding Redwood Trust for valuation reasons, as the stock was trading at book value.
At year-end, we believe that our portfolio is well positioned to deal with lower, but still positive, economic growth in 2019. We took advantage of the market’s swoon in the fourth quarter to add to our favorite cyclical names and pick up five new secular winners, so we’re excited about the Fund’s prospects.
Thank you for your investment in the Parnassus Fund.
Yours truly,
Robert J. Klaber Portfolio Manager
Ian E. Sexsmith Portfolio Manager
8
Annual Report • 2018
Parnassus Core Equity Fund
Ticker: Investor Shares - PRBLX Ticker: Institutional Shares - PRILX
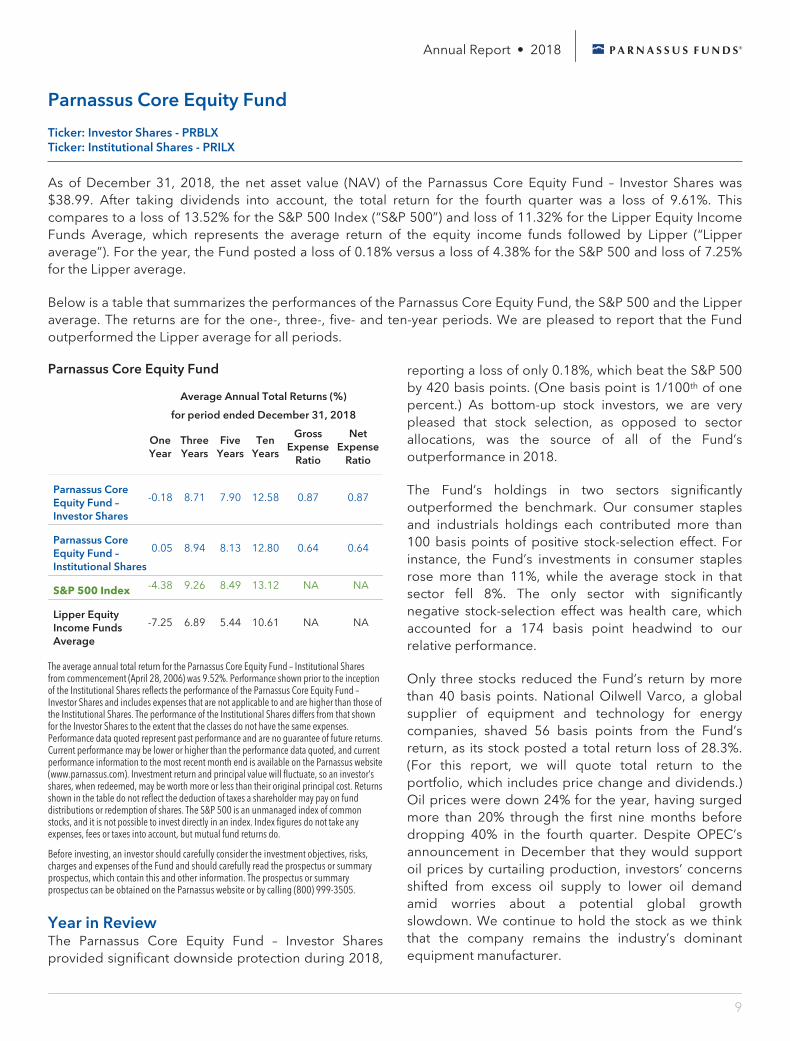
As of December 31, 2018, the net asset value (NAV) of the Parnassus Core Equity Fund – Investor Shares was $38.99. After taking dividends into account, the total return for the fourth quarter was a loss of 9.61%. This compares to a loss of 13.52% for the S&P 500 Index (“S&P 500”) and loss of 11.32% for the Lipper Equity Income Funds Average, which represents the average return of the equity income funds followed by Lipper (“Lipper average”). For the year, the Fund posted a loss of 0.18% versus a loss of 4.38% for the S&P 500 and loss of 7.25% for the Lipper average.
Below is a table that summarizes the performances of the Parnassus Core Equity Fund, the S&P 500 and the Lipper average. The returns are for the one-, three-, five- and ten-year periods. We are pleased to report that the Fund outperformed the Lipper average for all periods.
Parnassus Core Equity Fund
Average Annual Total Returns (%)
for period ended December 31, 2018
One Year
Three Years
Five Years
Ten Years
Gross Expense
Ratio
Net Expense
Ratio
Parnassus Core Equity Fund – Investor Shares
-0.18 8.71 7.90 12.58 0.87 0.87
Parnassus Core Equity Fund – Institutional Shares
0.05 8.94 8.13 12.80 0.64 0.64
S&P 500 Index -4.38 9.26 8.49 13.12 NA NA
Lipper Equity Income Funds Average
-7.25 6.89 5.44 10.61 NA NA
The average annual total return for the Parnassus Core Equity Fund – Institutional Shares from commencement (April 28, 2006) was 9.52%. Performance shown prior to the inception of the Institutional Shares reflects the performance of the Parnassus Core Equity Fund – Investor Shares and includes expenses that are not applicable to and are higher than those of the Institutional Shares. The performance of the Institutional Shares differs from that shown for the Investor Shares to the extent that the classes do not have the same expenses. Performance data quoted represent past performance and are no guarantee of future returns. Current performance may be lower or higher than the performance data quoted, and current performance information to the most recent month end is available on the Parnassus website (www.parnassus.com). Investment return and principal value will fluctuate, so an investor’s shares, when redeemed, may be worth more or less than their original principal cost. Returns shown in the table do not reflect the deduction of taxes a shareholder may pay on fund distributions or redemption of shares. The S&P 500 is an unmanaged index of common stocks, and it is not possible to invest directly in an index. Index figures do not take any expenses, fees or taxes into account, but mutual fund returns do.
Before investing, an investor should carefully consider the investment objectives, risks, charges and expenses of the Fund and should carefully read the prospectus or summary prospectus, which contain this and other information. The prospectus or summary prospectus can be obtained on the Parnassus website or by calling (800) 999-3505.
Year in Review The Parnassus Core Equity Fund – Investor Shares provided significant downside protection during 2018,
reporting a loss of only 0.18%, which beat the S&P 500 by 420 basis points. (One basis point is 1/100th of one percent.) As bottom-up stock investors, we are very pleased that stock selection, as opposed to sector allocations, was the source of all of the Fund’s outperformance in 2018.
The Fund’s holdings in two sectors significantly outperformed the benchmark. Our consumer staples and industrials holdings each contributed more than 100 basis points of positive stock-selection effect. For instance, the Fund’s investments in consumer staples rose more than 11%, while the average stock in that sector fell 8%. The only sector with significantly negative stock-selection effect was health care, which accounted for a 174 basis point headwind to our relative performance.
Only three stocks reduced the Fund’s return by more than 40 basis points. National Oilwell Varco, a global supplier of equipment and technology for energy companies, shaved 56 basis points from the Fund’s return, as its stock posted a total return loss of 28.3%. (For this report, we will quote total return to the portfolio, which includes price change and dividends.) Oil prices were down 24% for the year, having surged more than 20% through the first nine months before dropping 40% in the fourth quarter. Despite OPEC’s announcement in December that they would support oil prices by curtailing production, investors’ concerns shifted from excess oil supply to lower oil demand amid worries about a potential global growth slowdown. We continue to hold the stock as we think that the company remains the industry’s dominant equipment manufacturer.
9
Annual Report • 2018
Charles Schwab, the San Francisco–based bank and brokerage firm, returned a negative 18.4%, trimming our return by 45 basis points. While Schwab’s earnings grew impressively during 2018, the stock fell significantly during the fourth quarter. The prospect of slower economic growth lowered the outlook for future interest rate hikes, which would limit the company’s ability to increase the yield on its deposits. In addition, the fourth quarter stock market drop trimmed client assets, which will be a headwind to 2019 earnings growth. While 2018 was a tough year for the stock, we’re holding our Schwab position because the company continues to gain market share due to its intuitive online platform and terrific client service.
UPS, the package delivery company, returned a negative 15.5%, reducing the Fund’s return by 44 basis points. The company increased capital spending during the year and said that it will maintain an elevated level of spending over the next three years. In the short-to-medium-term, these investments in new sorting facilities, equipment, automation and technology will depress earnings and cash flows. Investors also remained cautious amid reporting that Amazon may introduce a competing delivery service. The risk of disruption from Amazon delivery seems relatively low for now because it is more likely aimed at supplementing rather than supplanting existing delivery networks. We think that UPS is undervalued, and that margin headwinds should fade with better pricing and continued network productivity.
Despite a negative year for the S&P 500, we are pleased that the Fund held three stocks that boosted the Fund’s return by at least 50 basis points. Mastercard, the leading payments company, had another terrific year, adding 70 basis points to the Fund’s return as the stock gained 25.3%. The company continues to grow revenues and earnings at a strong clip due to payment volume growth and new partnerships.
Motorola Solutions, the largest provider of mission-critical communications solutions, added 58 basis points to the Fund’s return with a 29.6% return for the stock. Motorola’s stock moved higher as the company raised its 2018 earnings guidance three times over the year due to broad-based demand for land mobile radio systems and surveillance solutions from Avigilon, a recently acquired subsidiary. Motorola is gaining market share and expanding its addressable markets by providing the most innovative and complete communications solutions to its public safety and corporate clients.
WD-40, the global multi-purpose maintenance product company, increased the Fund’s return by 52 basis points as the stock gained 57.7%. The company’s sales and earnings reached record highs during the year, as management continued its strategy to distribute its products into new markets. The company also plans to increase its capital investment to support new product innovation that will lower manufacturing costs and improve gross margins over the long term.
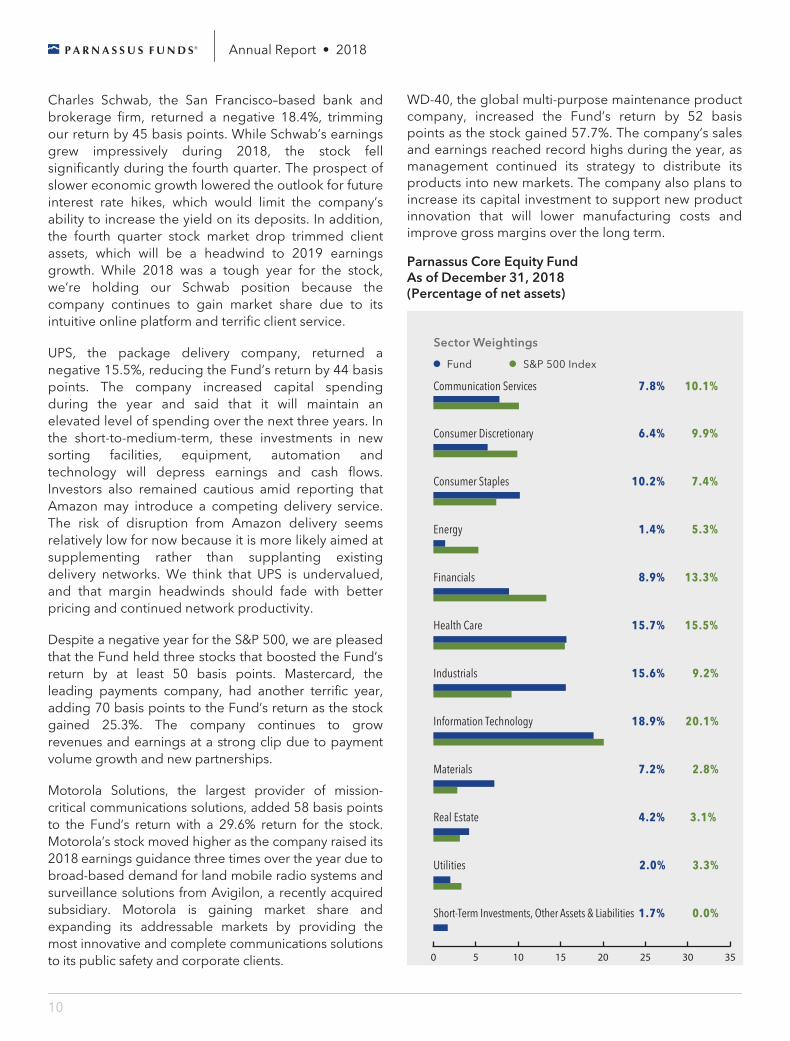
Parnassus Core Equity Fund As of December 31, 2018 (Percentage of net assets)
Sector Weightings
Fund
10.1%7.8%
7.4%10.2%
9.9%6.4%
0.0%1.7%
5.3%1.4%
13.3%8.9%
15.5%15.7%
20.1%18.9%
9.2%15.6%
2.8%7.2%
3.3%2.0%
3.1% 4.2%
S&P 500 Index
0 5 10 15 35302520
Communication Services
Consumer Staples
Consumer Discretionary
Short-Term Investments, Other Assets & Liabilities
Energy
Financials
Health Care
Information Technology
Industrials
Materials
Utilities
Real Estate
10
Annual Report • 2018
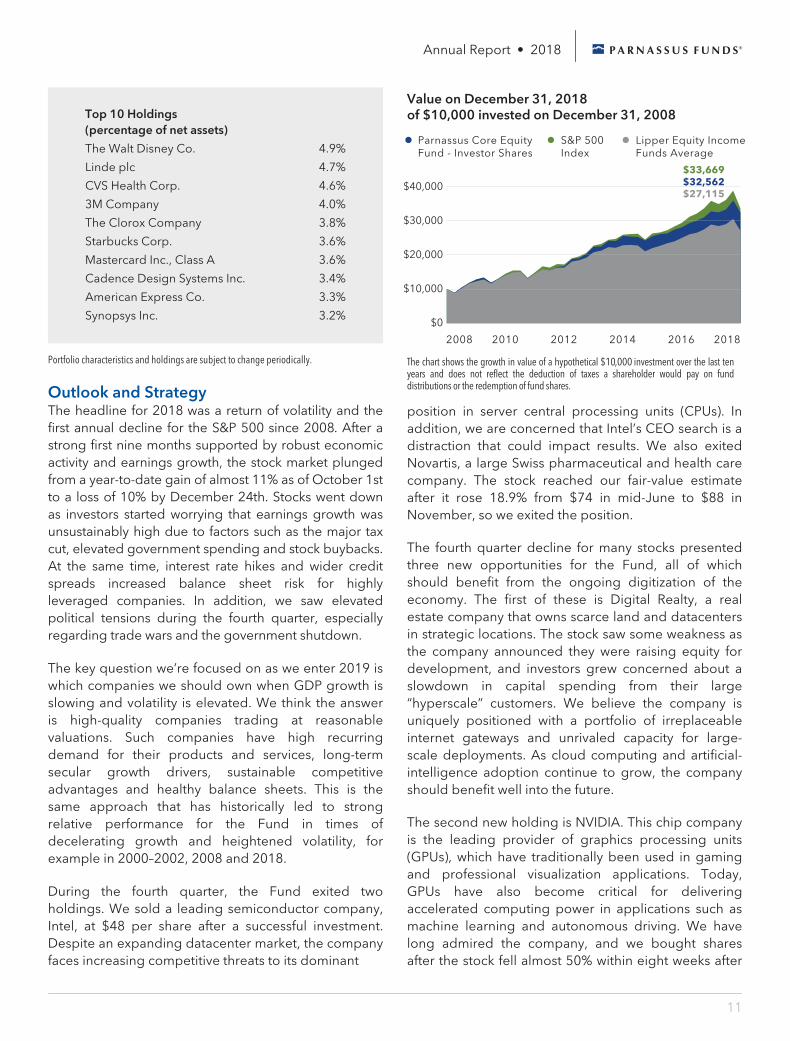
Top 10 Holdings (percentage of net assets)
The Walt Disney Co. 4.9%
Linde plc 4.7%
CVS Health Corp. 4.6%
3M Company 4.0%
The Clorox Company 3.8%
Starbucks Corp. 3.6%
Mastercard Inc., Class A 3.6%
Cadence Design Systems Inc. 3.4%
American Express Co. 3.3%
Synopsys Inc. 3.2%
Portfolio characteristics and holdings are subject to change periodically.
Outlook and Strategy The headline for 2018 was a return of volatility and the first annual decline for the S&P 500 since 2008. After a strong first nine months supported by robust economic activity and earnings growth, the stock market plunged from a year-to-date gain of almost 11% as of October 1st to a loss of 10% by December 24th. Stocks went down as investors started worrying that earnings growth was unsustainably high due to factors such as the major tax cut, elevated government spending and stock buybacks. At the same time, interest rate hikes and wider credit spreads increased balance sheet risk for highly leveraged companies. In addition, we saw elevated political tensions during the fourth quarter, especially regarding trade wars and the government shutdown.
The key question we’re focused on as we enter 2019 is which companies we should own when GDP growth is slowing and volatility is elevated. We think the answer is high-quality companies trading at reasonable valuations. Such companies have high recurring demand for their products and services, long-term secular growth drivers, sustainable competitive advantages and healthy balance sheets. This is the same approach that has historically led to strong relative performance for the Fund in times of decelerating growth and heightened volatility, for example in 2000–2002, 2008 and 2018.
During the fourth quarter, the Fund exited two holdings. We sold a leading semiconductor company, Intel, at $48 per share after a successful investment. Despite an expanding datacenter market, the company faces increasing competitive threats to its dominant
Value on December 31, 2018 of $10,000 invested on December 31, 2008
$40,000
$30,000
$20,000
$10,000
$0
Parnassus Core EquityFund - Investor Shares
S&P 500Index
Lipper Equity IncomeFunds Average
2008 2010 2012 2014 2016 2018
$33,669$32,562$27,115
The chart shows the growth in value of a hypothetical $10,000 investment over the last ten years and does not reflect the deduction of taxes a shareholder would pay on fund distributions or the redemption of fund shares.
position in server central processing units (CPUs). In addition, we are concerned that Intel’s CEO search is a distraction that could impact results. We also exited Novartis, a large Swiss pharmaceutical and health care company. The stock reached our fair-value estimate after it rose 18.9% from $74 in mid-June to $88 in November, so we exited the position.
The fourth quarter decline for many stocks presented three new opportunities for the Fund, all of which should benefit from the ongoing digitization of the economy. The first of these is Digital Realty, a real estate company that owns scarce land and datacenters in strategic locations. The stock saw some weakness as the company announced they were raising equity for development, and investors grew concerned about a slowdown in capital spending from their large “hyperscale” customers. We believe the company is uniquely positioned with a portfolio of irreplaceable internet gateways and unrivaled capacity for large-scale deployments. As cloud computing and artificial-intelligence adoption continue to grow, the company should benefit well into the future.
The second new holding is NVIDIA. This chip company is the leading provider of graphics processing units (GPUs), which have traditionally been used in gaming and professional visualization applications. Today, GPUs have also become critical for delivering accelerated computing power in applications such as machine learning and autonomous driving. We have long admired the company, and we bought shares after the stock fell almost 50% within eight weeks after
11
Annual Report • 2018
a disappointing earnings report. The stock’s plunge, largely related to temporary cryptocurrency-related channel issues, provided an attractive entry opportunity.
The last stock we added is Microsoft, the leading provider of business productivity software and the number two provider of cloud computing services. Microsoft has unrivaled enterprise relationships and a comprehensive portfolio of offerings across information technology, from infrastructure to software. The enterprise transition to the cloud is still nascent and, as it matures, Microsoft should become even more engrained in the digitized economy.
With the additions of NVIDIA and Microsoft, we reduced our underweight allocation to the information technology sector. The Fund’s largest underweight at year-end relative to the S&P 500 was the financials sector. This is due to the heightened probability that the yield curve will invert, which would be a headwind for bank earnings. We are still significantly underweight in energy stocks, as oil prices suffer from excess supply and weak demand. Our third significant underweight allocation is to the consumer discretionary sector, where valuations for many companies, especially Amazon, remain elevated relative to our appraisal of their fundamentals.
The Fund’s largest overweight sectors are industrials and materials, where we own a basket of companies that feature high recurring revenues and increasingly relevant products for the global economy. We remain overweight in the consumer staples sector, where we own solid franchises with defensive characteristics. Given these sector weightings and other portfolio characteristics, we think the Fund should perform well relative to the S&P 500, especially if volatility remains elevated throughout 2019.
Thank you for your confidence and investment in the Parnassus Core Equity Fund.
Sincerely,
Todd C. Ahlsten Lead Portfolio Manager
Benjamin E. Allen Portfolio Manager
12
Annual Report • 2018
Parnassus Endeavor Fund Ticker: Investor Shares - PARWX Ticker: Institutional Shares - PFPWX
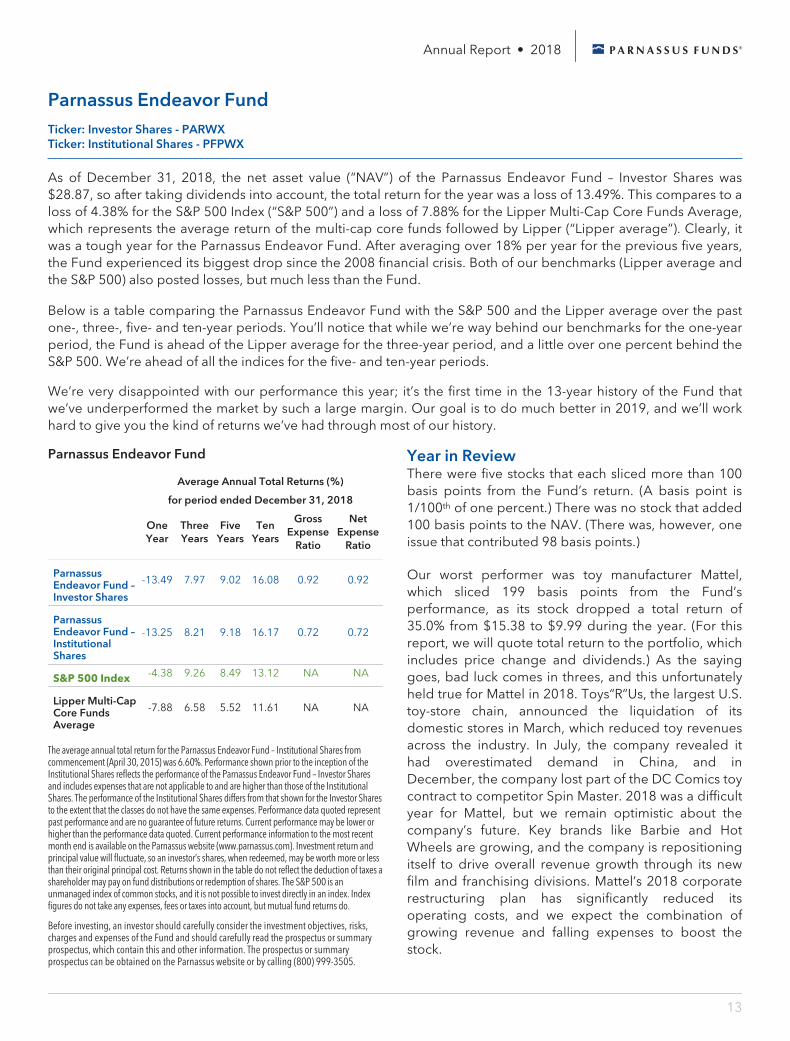
As of December 31, 2018, the net asset value (“NAV”) of the Parnassus Endeavor Fund – Investor Shares was $28.87, so after taking dividends into account, the total return for the year was a loss of 13.49%. This compares to a loss of 4.38% for the S&P 500 Index (“S&P 500”) and a loss of 7.88% for the Lipper Multi-Cap Core Funds Average, which represents the average return of the multi-cap core funds followed by Lipper (“Lipper average”). Clearly, it was a tough year for the Parnassus Endeavor Fund. After averaging over 18% per year for the previous five years, the Fund experienced its biggest drop since the 2008 financial crisis. Both of our benchmarks (Lipper average and the S&P 500) also posted losses, but much less than the Fund.
Below is a table comparing the Parnassus Endeavor Fund with the S&P 500 and the Lipper average over the past one-, three-, five- and ten-year periods. You’ll notice that while we’re way behind our benchmarks for the one-year period, the Fund is ahead of the Lipper average for the three-year period, and a little over one percent behind the S&P 500. We’re ahead of all the indices for the five- and ten-year periods.
We’re very disappointed with our performance this year; it’s the first time in the 13-year history of the Fund that we’ve underperformed the market by such a large margin. Our goal is to do much better in 2019, and we’ll work hard to give you the kind of returns we’ve had through most of our history.
Parnassus Endeavor Fund
Average Annual Total Returns (%)
for period ended December 31, 2018
One Year
Three Years
Five Years
Ten Years
Gross Expense
Ratio
Net Expense
Ratio
Parnassus Endeavor Fund – Investor Shares
-13.49 7.97 9.02 16.08 0.92 0.92
Parnassus Endeavor Fund – Institutional Shares
-13.25 8.21 9.18 16.17 0.72 0.72
S&P 500 Index -4.38 9.26 8.49 13.12 NA NA
Lipper Multi-Cap Core Funds Average
-7.88 6.58 5.52 11.61 NA NA
The average annual total return for the Parnassus Endeavor Fund – Institutional Shares from commencement (April 30, 2015) was 6.60%. Performance shown prior to the inception of the Institutional Shares reflects the performance of the Parnassus Endeavor Fund – Investor Shares and includes expenses that are not applicable to and are higher than those of the Institutional Shares. The performance of the Institutional Shares differs from that shown for the Investor Shares to the extent that the classes do not have the same expenses. Performance data quoted represent past performance and are no guarantee of future returns. Current performance may be lower or higher than the performance data quoted. Current performance information to the most recent month end is available on the Parnassus website (www.parnassus.com). Investment return and principal value will fluctuate, so an investor’s shares, when redeemed, may be worth more or less than their original principal cost. Returns shown in the table do not reflect the deduction of taxes a shareholder may pay on fund distributions or redemption of shares. The S&P 500 is an unmanaged index of common stocks, and it is not possible to invest directly in an index. Index figures do not take any expenses, fees or taxes into account, but mutual fund returns do.
Before investing, an investor should carefully consider the investment objectives, risks, charges and expenses of the Fund and should carefully read the prospectus or summary prospectus, which contain this and other information. The prospectus or summary prospectus can be obtained on the Parnassus website or by calling (800) 999-3505.
Year in Review There were five stocks that each sliced more than 100 basis points from the Fund’s return. (A basis point is 1/100th of one percent.) There was no stock that added 100 basis points to the NAV. (There was, however, one issue that contributed 98 basis points.)
Our worst performer was toy manufacturer Mattel, which sliced 199 basis points from the Fund’s performance, as its stock dropped a total return of 35.0% from $15.38 to $9.99 during the year. (For this report, we will quote total return to the portfolio, which includes price change and dividends.) As the saying goes, bad luck comes in threes, and this unfortunately held true for Mattel in 2018. Toys“R”Us, the largest U.S. toy-store chain, announced the liquidation of its domestic stores in March, which reduced toy revenues across the industry. In July, the company revealed it had overestimated demand in China, and in December, the company lost part of the DC Comics toy contract to competitor Spin Master. 2018 was a difficult year for Mattel, but we remain optimistic about the company’s future. Key brands like Barbie and Hot Wheels are growing, and the company is repositioning itself to drive overall revenue growth through its new film and franchising divisions. Mattel’s 2018 corporate restructuring plan has significantly reduced its operating costs, and we expect the combination of growing revenue and falling expenses to boost the stock.
13
Annual Report • 2018
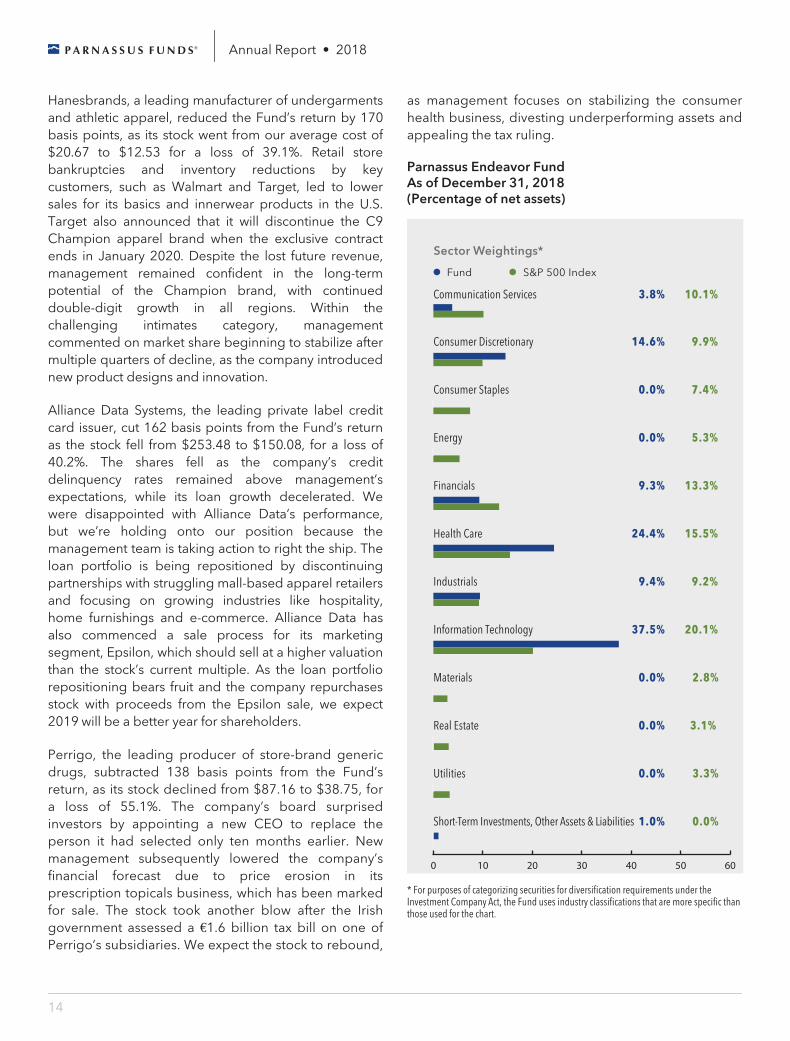
Hanesbrands, a leading manufacturer of undergarments and athletic apparel, reduced the Fund’s return by 170 basis points, as its stock went from our average cost of $20.67 to $12.53 for a loss of 39.1%. Retail store bankruptcies and inventory reductions by key customers, such as Walmart and Target, led to lower sales for its basics and innerwear products in the U.S. Target also announced that it will discontinue the C9 Champion apparel brand when the exclusive contract ends in January 2020. Despite the lost future revenue, management remained confident in the long-term potential of the Champion brand, with continued double-digit growth in all regions. Within the challenging intimates category, management commented on market share beginning to stabilize after multiple quarters of decline, as the company introduced new product designs and innovation.
Alliance Data Systems, the leading private label credit card issuer, cut 162 basis points from the Fund’s return as the stock fell from $253.48 to $150.08, for a loss of 40.2%. The shares fell as the company’s credit delinquency rates remained above management’s expectations, while its loan growth decelerated. We were disappointed with Alliance Data’s performance, but we’re holding onto our position because the management team is taking action to right the ship. The loan portfolio is being repositioned by discontinuing partnerships with struggling mall-based apparel retailers and focusing on growing industries like hospitality, home furnishings and e-commerce. Alliance Data has also commenced a sale process for its marketing segment, Epsilon, which should sell at a higher valuation than the stock’s current multiple. As the loan portfolio repositioning bears fruit and the company repurchases stock with proceeds from the Epsilon sale, we expect 2019 will be a better year for shareholders.
Perrigo, the leading producer of store-brand generic drugs, subtracted 138 basis points from the Fund’s return, as its stock declined from $87.16 to $38.75, for a loss of 55.1%. The company’s board surprised investors by appointing a new CEO to replace the person it had selected only ten months earlier. New management subsequently lowered the company’s financial forecast due to price erosion in its prescription topicals business, which has been marked for sale. The stock took another blow after the Irish government assessed a €1.6 billion tax bill on one of Perrigo’s subsidiaries. We expect the stock to rebound,
as management focuses on stabilizing the consumer health business, divesting underperforming assets and appealing the tax ruling.
Parnassus Endeavor Fund As of December 31, 2018 (Percentage of net assets)
Sector Weightings*
Fund
10.1%3.8%
7.4%0.0%
9.9%14.6%
0.0%1.0%
5.3%0.0%
13.3%9.3%
15.5%
9.2%
24.4%
20.1%37.5%
9.4%
2.8%0.0%
3.3%0.0%
3.1% 0.0%
S&P 500 Index
0 10 605030 4020
Communication Services
Consumer Staples
Consumer Discretionary
Short-Term Investments, Other Assets & Liabilities
Energy
Financials
Health Care
Information Technology
Industrials
Materials
Utilities
Real Estate
* For purposes of categorizing securities for diversification requirements under the Investment Company Act, the Fund uses industry classifications that are more specific than those used for the chart.
14
Annual Report • 2018
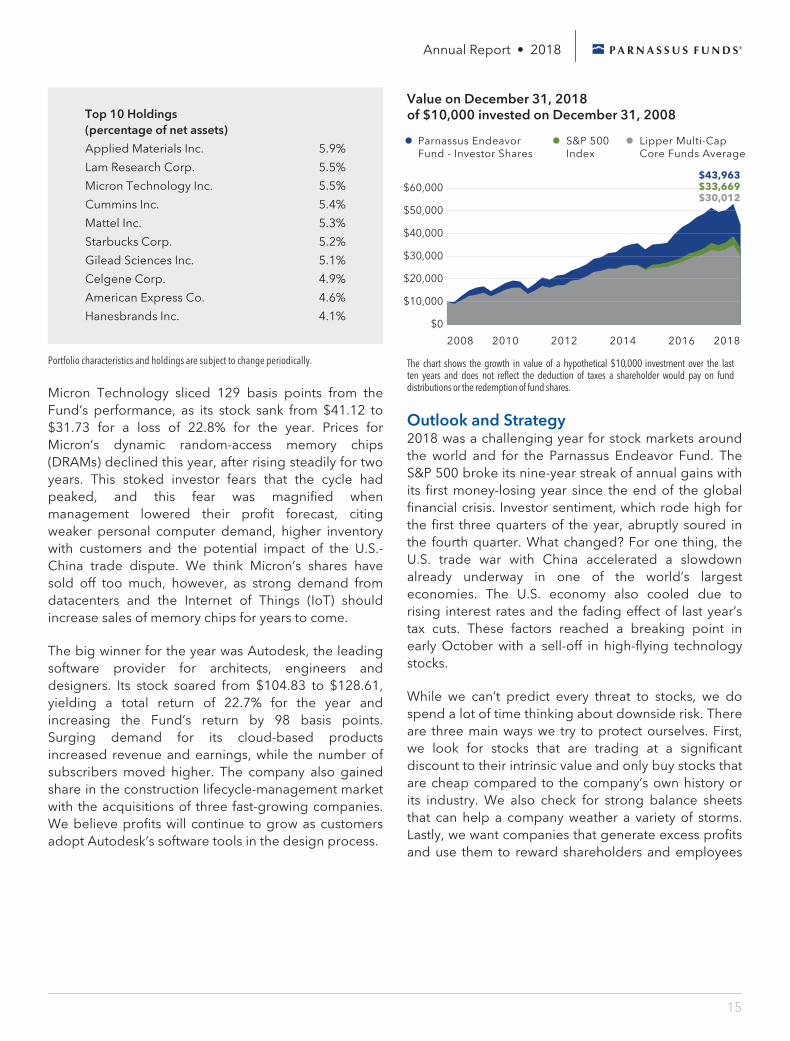
Top 10 Holdings (percentage of net assets)
Applied Materials Inc. 5.9%
Lam Research Corp. 5.5%
Micron Technology Inc. 5.5%
Cummins Inc. 5.4%
Mattel Inc. 5.3%
Starbucks Corp. 5.2%
Gilead Sciences Inc. 5.1%
Celgene Corp. 4.9%
American Express Co. 4.6%
Hanesbrands Inc. 4.1%
Portfolio characteristics and holdings are subject to change periodically.
Micron Technology sliced 129 basis points from the Fund’s performance, as its stock sank from $41.12 to $31.73 for a loss of 22.8% for the year. Prices for Micron’s dynamic random-access memory chips (DRAMs) declined this year, after rising steadily for two years. This stoked investor fears that the cycle had peaked, and this fear was magnified when management lowered their profit forecast, citing weaker personal computer demand, higher inventory with customers and the potential impact of the U.S.-China trade dispute. We think Micron’s shares have sold off too much, however, as strong demand from datacenters and the Internet of Things (IoT) should increase sales of memory chips for years to come.
The big winner for the year was Autodesk, the leading software provider for architects, engineers and designers. Its stock soared from $104.83 to $128.61, yielding a total return of 22.7% for the year and increasing the Fund’s return by 98 basis points. Surging demand for its cloud-based products increased revenue and earnings, while the number of subscribers moved higher. The company also gained share in the construction lifecycle-management market with the acquisitions of three fast-growing companies. We believe profits will continue to grow as customers adopt Autodesk’s software tools in the design process.
Value on December 31, 2018 of $10,000 invested on December 31, 2008
$60,000
$40,000
$20,000
$10,000
$0
Parnassus EndeavorFund - Investor Shares
S&P 500Index
Lipper Multi-CapCore Funds Average
2008 2010 2012 2014 2016 2018
$50,000
$30,000
$30,012$33,669$43,963
The chart shows the growth in value of a hypothetical $10,000 investment over the last ten years and does not reflect the deduction of taxes a shareholder would pay on fund distributions or the redemption of fund shares.
Outlook and Strategy 2018 was a challenging year for stock markets around the world and for the Parnassus Endeavor Fund. The S&P 500 broke its nine-year streak of annual gains with its first money-losing year since the end of the global financial crisis. Investor sentiment, which rode high for the first three quarters of the year, abruptly soured in the fourth quarter. What changed? For one thing, the U.S. trade war with China accelerated a slowdown already underway in one of the world’s largest economies. The U.S. economy also cooled due to rising interest rates and the fading effect of last year’s tax cuts. These factors reached a breaking point in early October with a sell-off in high-flying technology stocks.
While we can’t predict every threat to stocks, we do spend a lot of time thinking about downside risk. There are three main ways we try to protect ourselves. First, we look for stocks that are trading at a significant discount to their intrinsic value and only buy stocks that are cheap compared to the company’s own history or its industry. We also check for strong balance sheets that can help a company weather a variety of storms. Lastly, we want companies that generate excess profits and use them to reward shareholders and employees
15
Annual Report • 2018
alike. These measures are by no means foolproof. In the short term, the stock market can ignore our assessments of quality and value, as it did this year, and cause the Fund to underperform. We’re confident our holdings are worth more than what we paid for them, and at some point, our stocks should move higher. In the meantime, our short-term performance can vary widely from the overall market.
We’re not changing our approach because we know that it works. The Parnassus Endeavor Fund’s long-term track record is excellent and includes periods of temporary underperformance such as this one. When we’re in it, the rough patches are extremely painful, to be sure, but they’re also opportunities to stock up on companies that will roar back when investor worries abate. Unfortunately, there’s no way of knowing how
long that will take. Experience gives us the confidence that buying high-quality companies at bargain prices will eventually reward the patient investor.
Thank you for investing in the Parnassus Endeavor Fund.
Jerome L. Dodson Lead Portfolio Manager
Billy J. Hwan Portfolio Manager
16
Annual Report • 2018
Parnassus Mid Cap Fund
Ticker: Investor Shares - PARMX Ticker: Institutional Shares - PFPMX
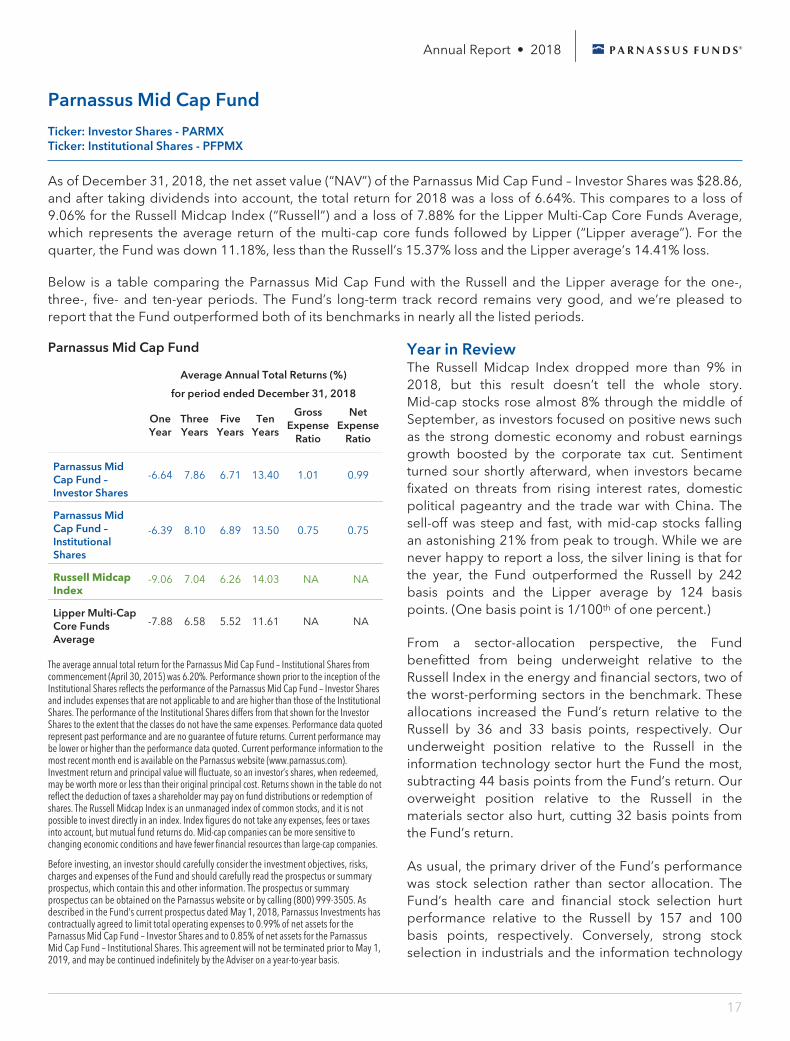
As of December 31, 2018, the net asset value (“NAV”) of the Parnassus Mid Cap Fund – Investor Shares was $28.86, and after taking dividends into account, the total return for 2018 was a loss of 6.64%. This compares to a loss of 9.06% for the Russell Midcap Index (“Russell”) and a loss of 7.88% for the Lipper Multi-Cap Core Funds Average, which represents the average return of the multi-cap core funds followed by Lipper (“Lipper average”). For the quarter, the Fund was down 11.18%, less than the Russell’s 15.37% loss and the Lipper average’s 14.41% loss.
Below is a table comparing the Parnassus Mid Cap Fund with the Russell and the Lipper average for the one-, three-, five- and ten-year periods. The Fund’s long-term track record remains very good, and we’re pleased to report that the Fund outperformed both of its benchmarks in nearly all the listed periods.
Parnassus Mid Cap Fund
Average Annual Total Returns (%)
for period ended December 31, 2018
One Year
Three Years
Five Years
Ten Years
Gross Expense
Ratio
Net Expense
Ratio
Parnassus Mid Cap Fund – Investor Shares
-6.64 7.86 6.71 13.40 1.01 0.99
Parnassus Mid Cap Fund – Institutional Shares
-6.39 8.10 6.89 13.50 0.75 0.75
Russell Midcap Index
-9.06 7.04 6.26 14.03 NA NA
Lipper Multi-Cap Core Funds Average
-7.88 6.58 5.52 11.61 NA NA
The average annual total return for the Parnassus Mid Cap Fund – Institutional Shares from commencement (April 30, 2015) was 6.20%. Performance shown prior to the inception of the Institutional Shares reflects the performance of the Parnassus Mid Cap Fund – Investor Shares and includes expenses that are not applicable to and are higher than those of the Institutional Shares. The performance of the Institutional Shares differs from that shown for the Investor Shares to the extent that the classes do not have the same expenses. Performance data quoted represent past performance and are no guarantee of future returns. Current performance may be lower or higher than the performance data quoted. Current performance information to the most recent month end is available on the Parnassus website (www.parnassus.com). Investment return and principal value will fluctuate, so an investor’s shares, when redeemed, may be worth more or less than their original principal cost. Returns shown in the table do not reflect the deduction of taxes a shareholder may pay on fund distributions or redemption of shares. The Russell Midcap Index is an unmanaged index of common stocks, and it is not possible to invest directly in an index. Index figures do not take any expenses, fees or taxes into account, but mutual fund returns do. Mid-cap companies can be more sensitive to changing economic conditions and have fewer financial resources than large-cap companies.
Before investing, an investor should carefully consider the investment objectives, risks, charges and expenses of the Fund and should carefully read the prospectus or summary prospectus, which contain this and other information. The prospectus or summary prospectus can be obtained on the Parnassus website or by calling (800) 999-3505. As described in the Fund’s current prospectus dated May 1, 2018, Parnassus Investments has contractually agreed to limit total operating expenses to 0.99% of net assets for the Parnassus Mid Cap Fund – Investor Shares and to 0.85% of net assets for the Parnassus Mid Cap Fund – Institutional Shares. This agreement will not be terminated prior to May 1, 2019, and may be continued indefinitely by the Adviser on a year-to-year basis.
Year in Review The Russell Midcap Index dropped more than 9% in 2018, but this result doesn’t tell the whole story. Mid-cap stocks rose almost 8% through the middle of September, as investors focused on positive news such as the strong domestic economy and robust earnings growth boosted by the corporate tax cut. Sentiment turned sour shortly afterward, when investors became fixated on threats from rising interest rates, domestic political pageantry and the trade war with China. The sell-off was steep and fast, with mid-cap stocks falling an astonishing 21% from peak to trough. While we are never happy to report a loss, the silver lining is that for the year, the Fund outperformed the Russell by 242 basis points and the Lipper average by 124 basis points. (One basis point is 1/100th of one percent.)
From a sector-allocation perspective, the Fund benefitted from being underweight relative to the Russell Index in the energy and financial sectors, two of the worst-performing sectors in the benchmark. These allocations increased the Fund’s return relative to the Russell by 36 and 33 basis points, respectively. Our underweight position relative to the Russell in the information technology sector hurt the Fund the most, subtracting 44 basis points from the Fund’s return. Our overweight position relative to the Russell in the materials sector also hurt, cutting 32 basis points from the Fund’s return.
As usual, the primary driver of the Fund’s performance was stock selection rather than sector allocation. The Fund’s health care and financial stock selection hurt performance relative to the Russell by 157 and 100 basis points, respectively. Conversely, strong stock selection in industrials and the information technology
17
Annual Report • 2018
sectors helped the Fund’s performance relative to the Russell by 295 and 200 basis points, respectively.
The Fund’s weakest performer was First Horizon National, a Tennessee-based regional bank. The stock subtracted 134 basis points from the Fund’s return, as its shares yielded a total negative return of 32.3%. (For this report, we will quote total return to the portfolio, which includes price change and dividends.) The shares fell after loan growth came in below expectations, as the integration of its recently completed acquisition of Capital Bank took longer than expected. First Horizon shares were also under pressure throughout the year, along with other bank stocks, as investors worried that the flattening yield curve would reduce net interest revenues and could portend a recession, which would increase credit losses. With the integration of Capital Bank now complete, we expect loan growth to accelerate in 2019. We continue to like First Horizon’s dominant position in Tennessee, its diversified, low-risk loan book, its exposure to growth markets in the Carolinas and South Florida and its cheap valuation.
Dentsply Sirona, one of the largest manufacturers of dental equipment and consumables, subtracted 123 basis points from the Fund’s return, as the total return of its stock was negative 43.0% for the year. The stock fell throughout the year because revenue growth repeatedly missed investors’ expectations. The company’s equipment business was hurt by material destocking headwinds, especially in the second half of 2018. Management unveiled a restructuring plan in late 2018, aiming to simplify the business, reduce duplicate facility costs and boost operating margins. We believe the stock is now attractively valued relative to expectations, and we see upside ahead, if management can successfully execute its restructuring plan and deliver higher revenue growth through product innovation and improved sales effectiveness.
Hanesbrands, a leading manufacturer of undergarments and athletic apparel, reduced the Fund’s return by 114 basis points, as its stock posted a 38.0% loss. Retail store bankruptcies and inventory reductions by key customers such as Walmart and Target led to sluggish demand for its basics and innerwear products in the U.S. Target also announced that it is discontinuing Hanes’s C9 Champion apparel brand when the exclusive contract ends in January 2020. Despite the lost future revenue, management
remains confident in the long-term potential of the global Champion brand, which continues to grow revenue by double-digit percentages in all regions. Within the challenging intimates category, management is introducing new product designs and innovations, which is helping to stabilize this business after multiple quarters of decline.
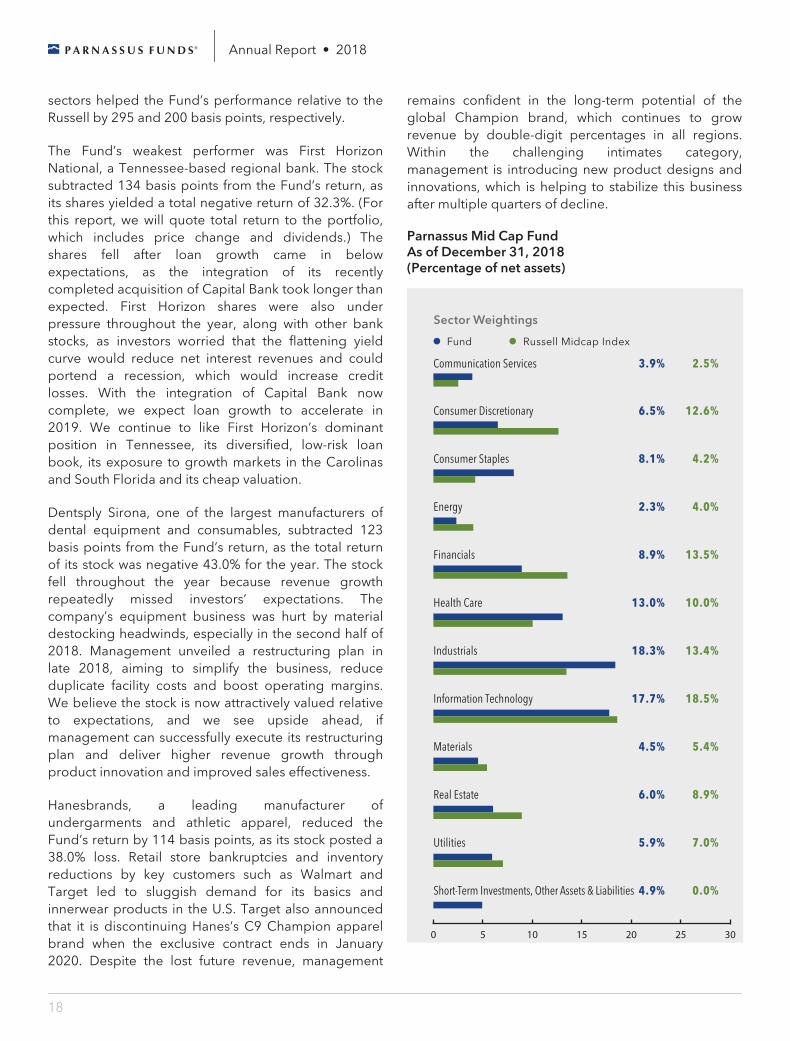
Parnassus Mid Cap Fund As of December 31, 2018 (Percentage of net assets)
Sector Weightings
Fund
Communication Services 2.5%3.9%
Consumer Staples 4.2%8.1%
Consumer Discretionary 12.6%6.5%
Short-Term Investments, Other Assets & Liabilities 0.0%4.9%
Energy 4.0%2.3%
Financials 13.5%8.9%
Health Care 10.0%13.0%
Information Technology 18.5%17.7%
Industrials 13.4%18.3%
Materials 5.4%4.5%
Utilities 7.0%5.9%
Real Estate 8.9%6.0%
Russell Midcap Index
0 5 10 15 302520
18
Annual Report • 2018
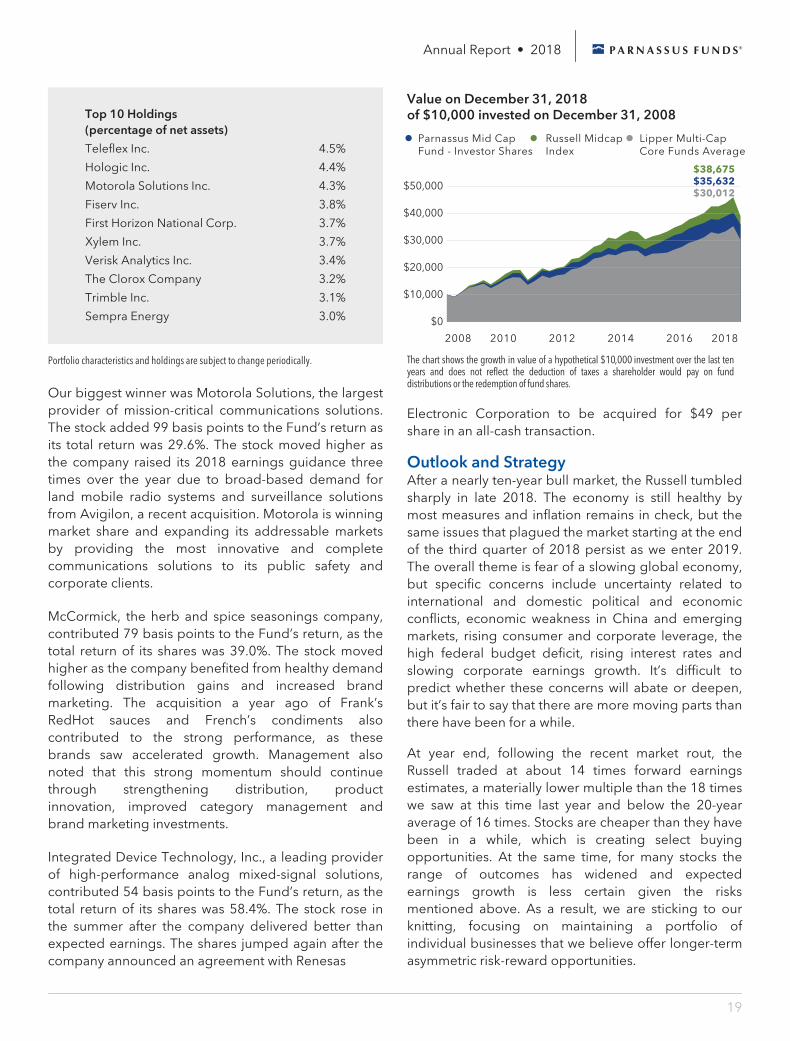
Top 10 Holdings (percentage of net assets)
Teleflex Inc. 4.5%
Hologic Inc. 4.4%
Motorola Solutions Inc. 4.3%
Fiserv Inc. 3.8%
First Horizon National Corp. 3.7%
Xylem Inc. 3.7%
Verisk Analytics Inc. 3.4%
The Clorox Company 3.2%
Trimble Inc. 3.1%
Sempra Energy 3.0%
Portfolio characteristics and holdings are subject to change periodically.
Our biggest winner was Motorola Solutions, the largest provider of mission-critical communications solutions. The stock added 99 basis points to the Fund’s return as its total return was 29.6%. The stock moved higher as the company raised its 2018 earnings guidance three times over the year due to broad-based demand for land mobile radio systems and surveillance solutions from Avigilon, a recent acquisition. Motorola is winning market share and expanding its addressable markets by providing the most innovative and complete communications solutions to its public safety and corporate clients.
McCormick, the herb and spice seasonings company, contributed 79 basis points to the Fund’s return, as the total return of its shares was 39.0%. The stock moved higher as the company benefited from healthy demand following distribution gains and increased brand marketing. The acquisition a year ago of Frank’s RedHot sauces and French’s condiments also contributed to the strong performance, as these brands saw accelerated growth. Management also noted that this strong momentum should continue through strengthening distribution, product innovation, improved category management and brand marketing investments.
Integrated Device Technology, Inc., a leading provider of high-performance analog mixed-signal solutions, contributed 54 basis points to the Fund’s return, as the total return of its shares was 58.4%. The stock rose in the summer after the company delivered better than expected earnings. The shares jumped again after the company announced an agreement with Renesas
Value on December 31, 2018 of $10,000 invested on December 31, 2008
$50,000
$40,000
$20,000
$10,000
$0
Parnassus Mid CapFund - Investor Shares
Russell MidcapIndex
Lipper Multi-CapCore Funds Average
2008 2010 2012 2014 2016 2018
$30,000
$38,675$35,632$30,012
The chart shows the growth in value of a hypothetical $10,000 investment over the last ten years and does not reflect the deduction of taxes a shareholder would pay on fund distributions or the redemption of fund shares.
Electronic Corporation to be acquired for $49 per share in an all-cash transaction.
Outlook and Strategy After a nearly ten-year bull market, the Russell tumbled sharply in late 2018. The economy is still healthy by most measures and inflation remains in check, but the same issues that plagued the market starting at the end of the third quarter of 2018 persist as we enter 2019. The overall theme is fear of a slowing global economy, but specific concerns include uncertainty related to international and domestic political and economic conflicts, economic weakness in China and emerging markets, rising consumer and corporate leverage, the high federal budget deficit, rising interest rates and slowing corporate earnings growth. It’s difficult to predict whether these concerns will abate or deepen, but it’s fair to say that there are more moving parts than there have been for a while.
At year end, following the recent market rout, the Russell traded at about 14 times forward earnings estimates, a materially lower multiple than the 18 times we saw at this time last year and below the 20-year average of 16 times. Stocks are cheaper than they have been in a while, which is creating select buying opportunities. At the same time, for many stocks the range of outcomes has widened and expected earnings growth is less certain given the risks mentioned above. As a result, we are sticking to our knitting, focusing on maintaining a portfolio of individual businesses that we believe offer longer-term asymmetric risk-reward opportunities.
19
Annual Report • 2018
We took advantage of the recent market weakness to add to many of our high-quality positions as well as buy some new stocks. We initiated a position in Digital Realty, a real estate company that owns scarce datacenter properties in attractive markets. The stock pulled back when the company announced an equity sale to fund development and growth. Investors also worried about a spending slowdown by their largest customers. We believe these are short-term concerns, and that Digital’s assets are becoming increasingly relevant as enterprises move applications to the cloud and connectivity demands increase due to the emergence of the Internet of Things and artificial intelligence. Finally, the company has a strong competitive moat supported by global scale and high switching costs for its tenants.
We also initiated a position in Cerner, the largest publicly traded health care information technology company. Cerner has a dominant market position providing a wide range of software, hardware and services, which are used across hospitals, pharmacies and physician practices. Cerner’s core product, electronic medical records, operates in a duopoly, and nearly two-thirds of the company’s revenue is recurring. The company recently signed a ten-year, $10 billion contract with the United States Department of Veterans Affairs, the largest health system in the world. Going forward, we believe the company has several exciting growth opportunities and the ability to expand margins.
Reflecting our bottom-up process, the Fund currently has a 27% weighting in the less-cyclical consumer staples, health care and utilities sectors, as compared to 21% for the Russell. Our exposure to the more cyclical financials, consumer discretionary and energy sectors is 18%, which is well below the Russell’s 30%
weighting. We continue to own slightly more industrial stocks than the benchmark. Within this sector, we own innovative companies in growing markets such as Xylem and Fortive, along with several business service companies with significant recurring revenue such as Verisk Analytics. This positioning, which isn’t too different from past years, should enable the Fund to do well in many different market environments, but especially in the event of further weakness.
We’re pleased that our strategy is providing good long-term results to shareholders. We’re especially pleased that in the down-market years over the last decade – 2008, 2011, 2015 and 2018 – the Fund handily beat its benchmarks. We will continue to focus on owning responsible, well-managed, increasingly relevant businesses with sustainable competitive advantages. We are confident that this strategy will help the Fund outperform the market over the long term, by participating in up-markets, providing down-market outperformance and avoiding permanent capital losses.
Thank you for your investment in the Parnassus Mid Cap Fund.
Yours truly,
Matthew D. Gershuny Lead Portfolio Manager
Lori A. Keith Portfolio Manager
20
Annual Report • 2018
Parnassus Fixed Income Fund
Ticker: Investor Shares - PRFIX Ticker: Institutional Shares - PFPLX
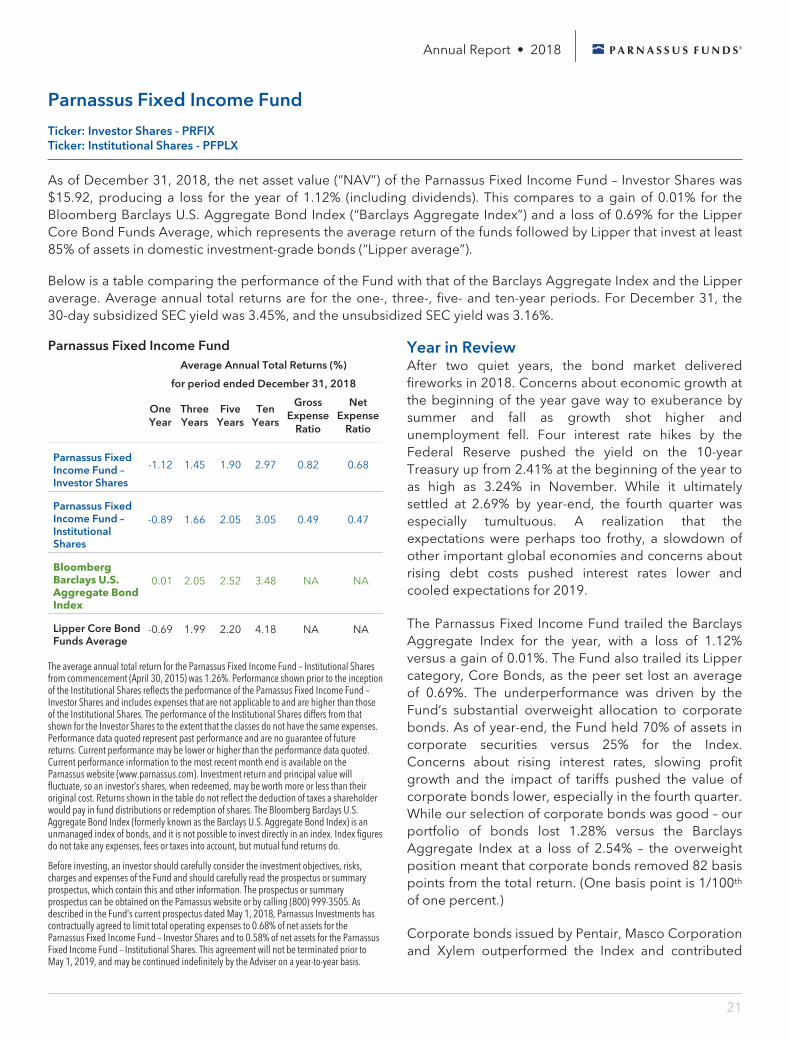
As of December 31, 2018, the net asset value (“NAV”) of the Parnassus Fixed Income Fund – Investor Shares was $15.92, producing a loss for the year of 1.12% (including dividends). This compares to a gain of 0.01% for the Bloomberg Barclays U.S. Aggregate Bond Index (“Barclays Aggregate Index”) and a loss of 0.69% for the Lipper Core Bond Funds Average, which represents the average return of the funds followed by Lipper that invest at least 85% of assets in domestic investment-grade bonds (“Lipper average”).
Below is a table comparing the performance of the Fund with that of the Barclays Aggregate Index and the Lipper average. Average annual total returns are for the one-, three-, five- and ten-year periods. For December 31, the 30-day subsidized SEC yield was 3.45%, and the unsubsidized SEC yield was 3.16%.
Parnassus Fixed Income Fund Average Annual Total Returns (%)
for period ended December 31, 2018
One Year
Three Years
Five Years
Ten Years
Gross Expense
Ratio
Net Expense
Ratio
Parnassus Fixed Income Fund – Investor Shares
-1.12 1.45 1.90 2.97 0.82 0.68
Parnassus Fixed Income Fund – Institutional Shares
-0.89 1.66 2.05 3.05 0.49 0.47
Bloomberg Barclays U.S. Aggregate Bond Index
0.01 2.05 2.52 3.48 NA NA
Lipper Core Bond Funds Average
-0.69 1.99 2.20 4.18 NA NA
The average annual total return for the Parnassus Fixed Income Fund – Institutional Shares from commencement (April 30, 2015) was 1.26%. Performance shown prior to the inception of the Institutional Shares reflects the performance of the Parnassus Fixed Income Fund – Investor Shares and includes expenses that are not applicable to and are higher than those of the Institutional Shares. The performance of the Institutional Shares differs from that shown for the Investor Shares to the extent that the classes do not have the same expenses. Performance data quoted represent past performance and are no guarantee of future returns. Current performance may be lower or higher than the performance data quoted. Current performance information to the most recent month end is available on the Parnassus website (www.parnassus.com). Investment return and principal value will fluctuate, so an investor’s shares, when redeemed, may be worth more or less than their original cost. Returns shown in the table do not reflect the deduction of taxes a shareholder would pay in fund distributions or redemption of shares. The Bloomberg Barclays U.S. Aggregate Bond Index (formerly known as the Barclays U.S. Aggregate Bond Index) is an unmanaged index of bonds, and it is not possible to invest directly in an index. Index figures do not take any expenses, fees or taxes into account, but mutual fund returns do.
Before investing, an investor should carefully consider the investment objectives, risks, charges and expenses of the Fund and should carefully read the prospectus or summary prospectus, which contain this and other information. The prospectus or summary prospectus can be obtained on the Parnassus website or by calling (800) 999-3505. As described in the Fund’s current prospectus dated May 1, 2018, Parnassus Investments has contractually agreed to limit total operating expenses to 0.68% of net assets for the Parnassus Fixed Income Fund – Investor Shares and to 0.58% of net assets for the Parnassus Fixed Income Fund – Institutional Shares. This agreement will not be terminated prior to May 1, 2019, and may be continued indefinitely by the Adviser on a year-to-year basis.
Year in Review After two quiet years, the bond market delivered fireworks in 2018. Concerns about economic growth at the beginning of the year gave way to exuberance by summer and fall as growth shot higher and unemployment fell. Four interest rate hikes by the Federal Reserve pushed the yield on the 10-year Treasury up from 2.41% at the beginning of the year to as high as 3.24% in November. While it ultimately settled at 2.69% by year-end, the fourth quarter was especially tumultuous. A realization that the expectations were perhaps too frothy, a slowdown of other important global economies and concerns about rising debt costs pushed interest rates lower and cooled expectations for 2019.
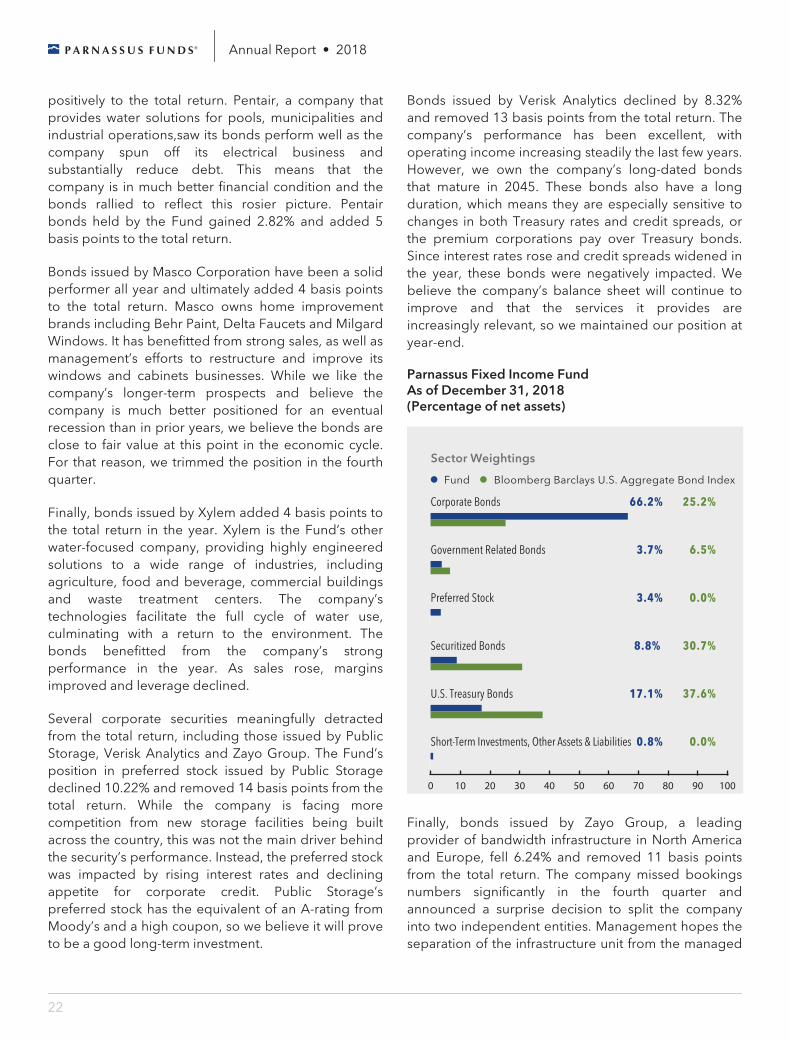
The Parnassus Fixed Income Fund trailed the Barclays Aggregate Index for the year, with a loss of 1.12% versus a gain of 0.01%. The Fund also trailed its Lipper category, Core Bonds, as the peer set lost an average of 0.69%. The underperformance was driven by the Fund’s substantial overweight allocation to corporate bonds. As of year-end, the Fund held 70% of assets in corporate securities versus 25% for the Index. Concerns about rising interest rates, slowing profit growth and the impact of tariffs pushed the value of corporate bonds lower, especially in the fourth quarter. While our selection of corporate bonds was good – our portfolio of bonds lost 1.28% versus the Barclays Aggregate Index at a loss of 2.54% – the overweight position meant that corporate bonds removed 82 basis points from the total return. (One basis point is 1/100th of one percent.)
Corporate bonds issued by Pentair, Masco Corporation and Xylem outperformed the Index and contributed
21
Annual Report • 2018
positively to the total return. Pentair, a company that provides water solutions for pools, municipalities and industrial operations,saw its bonds perform well as the company spun off its electrical business and substantially reduce debt. This means that the company is in much better financial condition and the bonds rallied to reflect this rosier picture. Pentair bonds held by the Fund gained 2.82% and added 5 basis points to the total return.
Bonds issued by Masco Corporation have been a solid performer all year and ultimately added 4 basis points to the total return. Masco owns home improvement brands including Behr Paint, Delta Faucets and Milgard Windows. It has benefitted from strong sales, as well as management’s efforts to restructure and improve its windows and cabinets businesses. While we like the company’s longer-term prospects and believe the company is much better positioned for an eventual recession than in prior years, we believe the bonds are close to fair value at this point in the economic cycle. For that reason, we trimmed the position in the fourth quarter.
Finally, bonds issued by Xylem added 4 basis points to the total return in the year. Xylem is the Fund’s other water-focused company, providing highly engineered solutions to a wide range of industries, including agriculture, food and beverage, commercial buildings and waste treatment centers. The company’s technologies facilitate the full cycle of water use, culminating with a return to the environment. The bonds benefitted from the company’s strong performance in the year. As sales rose, margins improved and leverage declined.
Several corporate securities meaningfully detracted from the total return, including those issued by Public Storage, Verisk Analytics and Zayo Group. The Fund’s position in preferred stock issued by Public Storage declined 10.22% and removed 14 basis points from the total return. While the company is facing more competition from new storage facilities being built across the country, this was not the main driver behind the security’s performance. Instead, the preferred stock was impacted by rising interest rates and declining appetite for corporate credit. Public Storage’s preferred stock has the equivalent of an A-rating from Moody’s and a high coupon, so we believe it will prove to be a good long-term investment.
Bonds issued by Verisk Analytics declined by 8.32% and removed 13 basis points from the total return. The company’s performance has been excellent, with operating income increasing steadily the last few years. However, we own the company’s long-dated bonds that mature in 2045. These bonds also have a long duration, which means they are especially sensitive to changes in both Treasury rates and credit spreads, or the premium corporations pay over Treasury bonds. Since interest rates rose and credit spreads widened in the year, these bonds were negatively impacted. We believe the company’s balance sheet will continue to improve and that the services it provides are increasingly relevant, so we maintained our position at year-end.
Parnassus Fixed Income Fund As of December 31, 2018 (Percentage of net assets)
Sector Weightings
Fund Bloomberg Barclays U.S. Aggregate Bond Index
Short-Term Investments, Other Assets & Liabilities
Government Related Bonds
Corporate Bonds
Preferred Stock
U.S. Treasury Bonds
Securitized Bonds
0.0%
6.5%
25.2%
0.0%
37.6%
30.7%
0.8%
3.7%
66.2%
3.4%
17.1%
8.8%
0 10 20 30 1009080605040 70
Finally, bonds issued by Zayo Group, a leading provider of bandwidth infrastructure in North America and Europe, fell 6.24% and removed 11 basis points from the total return. The company missed bookings numbers significantly in the fourth quarter and announced a surprise decision to split the company into two independent entities. Management hopes the separation of the infrastructure unit from the managed
22
Annual Report • 2018
services business will help improve execution, but we see this as a credit negative. We were disappointed by the news, especially since it was a new holding as of the third quarter, and sold the bonds.
Outlook and Strategy While we don’t make specific economic forecasts, we did take several steps in the second half of the year to position the Fund more conservatively. The intersection of exuberant expectations and the lapping of one-time events, like the corporate tax cut and a simulative federal budget, made us concerned about future growth expectations.
We reduced exposure to several BBB-rated companies, which sit at the low end of investment grade, as well as to some high-yield companies. Bonds issued by these companies are more volatile during times of economic uncertainty and carry more risk of a downgrade. Specifically, the Fund reduced its position in Sealed Air, a company with a high yield rating from S&P and Masco Corporation, as discussed above. Our position size increased in Microsoft, which is seeing solid growth in cloud computing and is one of the few companies with an AAA rating. We also added a position in Procter & Gamble. We believe P&G is making strides to improve the relevancy of their products as consumer preferences evolve, and we appreciate that its sales are relatively less sensitive to economic swings.
The Fund’s position in supranational bonds also increased in the year, from 2% to about 4%. Though the numbers are small, our supranational bonds did exceptionally well this year and contributed 12 basis points to the total return. Our bonds in this category have been issued by the World Bank and the International Finance Corporation, a member of the World Bank Group. These are both green bonds, which means the proceeds directly support climate-change-mitigating projects in developing countries. We are proud to have participated in the World Bank’s special 10-year anniversary issue of the first-ever green bond, and even more pleased by these bonds’ performance. Both carry excellent credit ratings and are fairly divorced from the political machines that influence Treasury bonds, so they make great investments.
Finally, the duration of the Fund increased in 2018, reflecting the more balanced nature of the interest rate
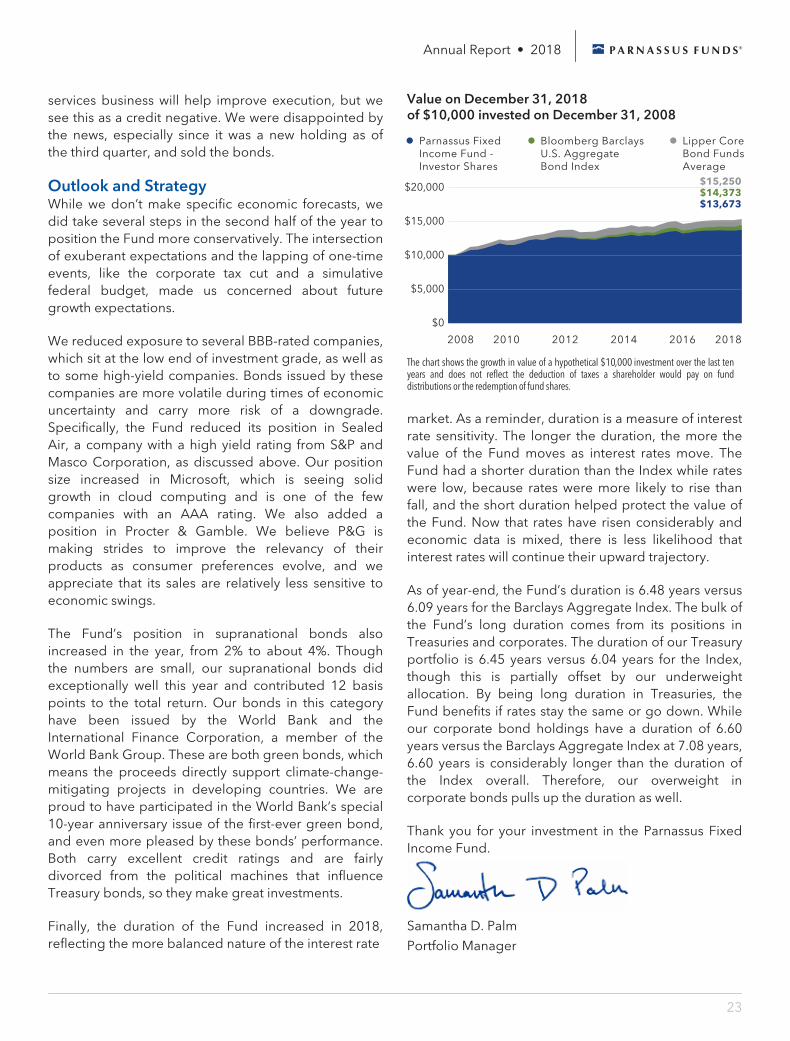
Value on December 31, 2018 of $10,000 invested on December 31, 2008
$20,000
$10,000
$5,000
$0
Parnassus FixedIncome Fund -Investor Shares
Bloomberg BarclaysU.S. AggregateBond Index
Lipper CoreBond FundsAverage
2008 2010 2012 2014 2016 2018
$15,000
$13,673$14,373$15,250
The chart shows the growth in value of a hypothetical $10,000 investment over the last ten years and does not reflect the deduction of taxes a shareholder would pay on fund distributions or the redemption of fund shares.
market. As a reminder, duration is a measure of interest rate sensitivity. The longer the duration, the more the value of the Fund moves as interest rates move. The Fund had a shorter duration than the Index while rates were low, because rates were more likely to rise than fall, and the short duration helped protect the value of the Fund. Now that rates have risen considerably and economic data is mixed, there is less likelihood that interest rates will continue their upward trajectory.
As of year-end, the Fund’s duration is 6.48 years versus 6.09 years for the Barclays Aggregate Index. The bulk of the Fund’s long duration comes from its positions in Treasuries and corporates. The duration of our Treasury portfolio is 6.45 years versus 6.04 years for the Index, though this is partially offset by our underweight allocation. By being long duration in Treasuries, the Fund benefits if rates stay the same or go down. While our corporate bond holdings have a duration of 6.60 years versus the Barclays Aggregate Index at 7.08 years, 6.60 years is considerably longer than the duration of the Index overall. Therefore, our overweight in corporate bonds pulls up the duration as well.
Thank you for your investment in the Parnassus Fixed Income Fund.
Samantha D. Palm
Portfolio Manager
23
Annual Report • 2018
Responsible Investing Notes
2018 was a fascinating year for the Parnassus Funds. Three dominant ESG themes occurred this year, each a significant matter in its own right: climate change, data privacy and workplace misconduct in Silicon Valley. I’ve written at length about data privacy in the Q2 Responsible Investing Notes, so I won’t touch upon it in this note.
In October, the Intergovernmental Panel on Climate Change gave the world 12 years to drastically cut global carbon emissions or face climate catastrophe, resulting in irreversible changes to the earth’s ecosystems. The report was issued around the time we witnessed a devastating Hurricane Florence, the massive Woolsey Fire in Southern California and the largest and deadliest wildfire in California’s history, the Camp Fire.
Nevertheless, our investments are not standing idle, and a good example is United Parcel Service (UPS). The Environmental Protection Agency reports that in 2016, the Transportation Sector contributed 28% of greenhouse gas emissions in the United States. The EPA further goes on to state that combined, light-, medium- and heavy-duty vehicles contributed 83% of the Transportation Sector’s greenhouse gas emissions.1 UPS has one of the largest fleets in the United States, coming in at 119,000 vehicles. In its 2017 UPS Corporate Sustainability Progress Report, the company disclosed that its vehicles emitted 4.6 million metric tons of CO2. The EPA has a handy CO2 calculator on its website that can give you equivalency results. 4.6 million metric tons of C02, according to the EPA, is the equivalent of 5 billion pounds of coal burned, or 551,000 homes powered for one year.2 UPS has to keep growing its business, but also find ways to mitigate its carbon footprint. In late 2017, UPS announced that it had reserved 125 all-electric Tesla Semis. This has the potential to hit our Principles and Performance® sweet spot. A shift toward electric vehicles along with the company’s relentless focus on efficient and safe routes should help them reduce their carbon footprint without sacrificing their service levels.
Remember, UPS made famous its practice of not pursuing left turns to make its vehicle routes more efficient, saving time and fuel costs. I imagine that they will continue to pursue and improve upon this practice, regardless of their vehicles’ fuel type. We spoke with the company about their Tesla Semi reservation this year, and they had positive remarks about the vehicle. Climate change is a monumental environmental challenge and it will take consumers, investors, companies, governments and various other stakeholders to work together in solving this problem. I’m pleased to see UPS taking a step in the right direction.
Workplace misconduct in Silicon Valley was a recurring theme this year, involving several companies held in our funds. Google, Intel Corporation and Lam Research Corporation came to terms with allegations that senior leaders were acting inappropriately with their direct and indirect reports. Google employees were in an uproar when the New York Times ran a story on how lenient the company was with senior executive Andy Rubin, known for creating Google’s Android mobile software, despite finding credible claims against him of sexual misconduct. Employees went as far as staging a walkout and submitting a list of demands to Google’s senior management team. Senior management did not give in to every demand, but one big win for employees was that the company would end its policy on forced arbitration for claims of sexual harassment. Employees are now able to choose whether they wish to take their case into arbitration or not. While no action could be taken against Andy Rubin because his departure preceded the revelations, this change in policy will improve manager accountability on serious workplace misconduct issues going forward. Google still maintains its reputation as an employer of choice, and I am confident that it will continue to be one going forward.
Intel Corporation and Lam Research Corporation took stronger action than Google when they were made aware of their CEOs’ conduct. Intel’s CEO, Brian Krzanich, resigned after the company was informed that he had violated a 2011 company policy that
1 “Fast Facts on Transportation Greenhouse Gas Emissions,” U.S. Environmental Protection Agency, accessed December 26, 2018, https://www.epa.gov/greenvehicles/fast-facts-transportation-greenhouse-gas-emissions. 2 “Greenhouse Gas Equivalencies Calculator.” U.S. Environmental Protection Agency, last modified December 2018, https://www.epa.gov/energy/greenhouse-gas-equivalencies-calculator.
24
Annual Report • 2018
forbade managers from having relationships with their direct or indirect reports. While the relationship in question happened over a decade ago and was consensual, the board of directors still believed Krzanich should be held accountable for his actions and accepted his resignation.
Lam Research’s CEO, Martin Anstice, resigned for more ambiguous reasons. The company was investigating Anstice for conduct that was not consistent with company values when the CEO submitted his letter of resignation. The company did not disclose specifics, but the board accepted the CEO’s resignation and did not allow him to collect his severance, which is telling. Ultimately, it is the board that is responsible for holding the CEO accountable. Not just for the long-term profitability of the company, but also in the way the CEO conducts business.
These events at Intel and Lam Research were unfortunate, but I’m pleased to see the two boards taking a strong stance against workplace misconduct and holding everyone accountable, no matter their title. I’m confident that executives and boards at other Silicon Valley companies have taken notice and are aware that workplace misconduct can be consequential to their companies, even at the highest levels.
Thank you for your investment in the Parnassus Funds. It is a privilege to have you as an investor.
Iyassu Essayas
Director of ESG Research
25
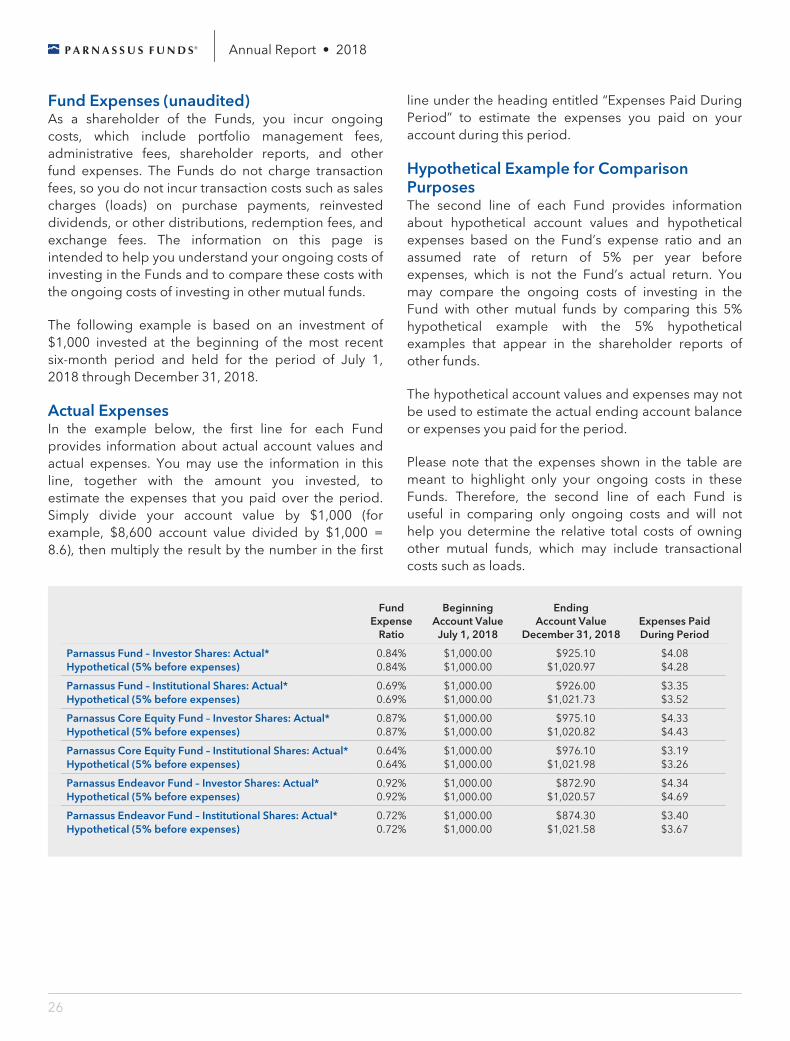
Annual Report • 2018
Fund Expenses (unaudited) As a shareholder of the Funds, you incur ongoing costs, which include portfolio management fees, administrative fees, shareholder reports, and other fund expenses. The Funds do not charge transaction fees, so you do not incur transaction costs such as sales charges (loads) on purchase payments, reinvested dividends, or other distributions, redemption fees, and exchange fees. The information on this page is intended to help you understand your ongoing costs of investing in the Funds and to compare these costs with the ongoing costs of investing in other mutual funds.
The following example is based on an investment of $1,000 invested at the beginning of the most recent six-month period and held for the period of July 1, 2018 through December 31, 2018.
Actual Expenses In the example below, the first line for each Fund provides information about actual account values and actual expenses. You may use the information in this line, together with the amount you invested, to estimate the expenses that you paid over the period. Simply divide your account value by $1,000 (for example, $8,600 account value divided by $1,000 = 8.6), then multiply the result by the number in the first
line under the heading entitled “Expenses Paid During Period” to estimate the expenses you paid on your account during this period.
Hypothetical Example for Comparison Purposes The second line of each Fund provides information about hypothetical account values and hypothetical expenses based on the Fund’s expense ratio and an assumed rate of return of 5% per year before expenses, which is not the Fund’s actual return. You may compare the ongoing costs of investing in the Fund with other mutual funds by comparing this 5% hypothetical example with the 5% hypothetical examples that appear in the shareholder reports of other funds.
The hypothetical account values and expenses may not be used to estimate the actual ending account balance or expenses you paid for the period.
Please note that the expenses shown in the table are meant to highlight only your ongoing costs in these Funds. Therefore, the second line of each Fund is useful in comparing only ongoing costs and will not help you determine the relative total costs of owning other mutual funds, which may include transactional costs such as loads.
Fund Expense
Ratio
Beginning Account Value
July 1, 2018
Ending Account Value
December 31, 2018 Expenses Paid During Period
Parnassus Fund – Investor Shares: Actual* 0.84% $1,000.00 $925.10 $4.08 Hypothetical (5% before expenses) 0.84% $1,000.00 $1,020.97 $4.28
Parnassus Fund – Institutional Shares: Actual* 0.69% $1,000.00 $926.00 $3.35 Hypothetical (5% before expenses) 0.69% $1,000.00 $1,021.73 $3.52
Parnassus Core Equity Fund – Investor Shares: Actual* 0.87% $1,000.00 $975.10 $4.33 Hypothetical (5% before expenses) 0.87% $1,000.00 $1,020.82 $4.43
Parnassus Core Equity Fund – Institutional Shares: Actual* 0.64% $1,000.00 $976.10 $3.19 Hypothetical (5% before expenses) 0.64% $1,000.00 $1,021.98 $3.26
Parnassus Endeavor Fund – Investor Shares: Actual* 0.92% $1,000.00 $872.90 $4.34 Hypothetical (5% before expenses) 0.92% $1,000.00 $1,020.57 $4.69
Parnassus Endeavor Fund – Institutional Shares: Actual* 0.72% $1,000.00 $874.30 $3.40 Hypothetical (5% before expenses) 0.72% $1,000.00 $1,021.58 $3.67
26
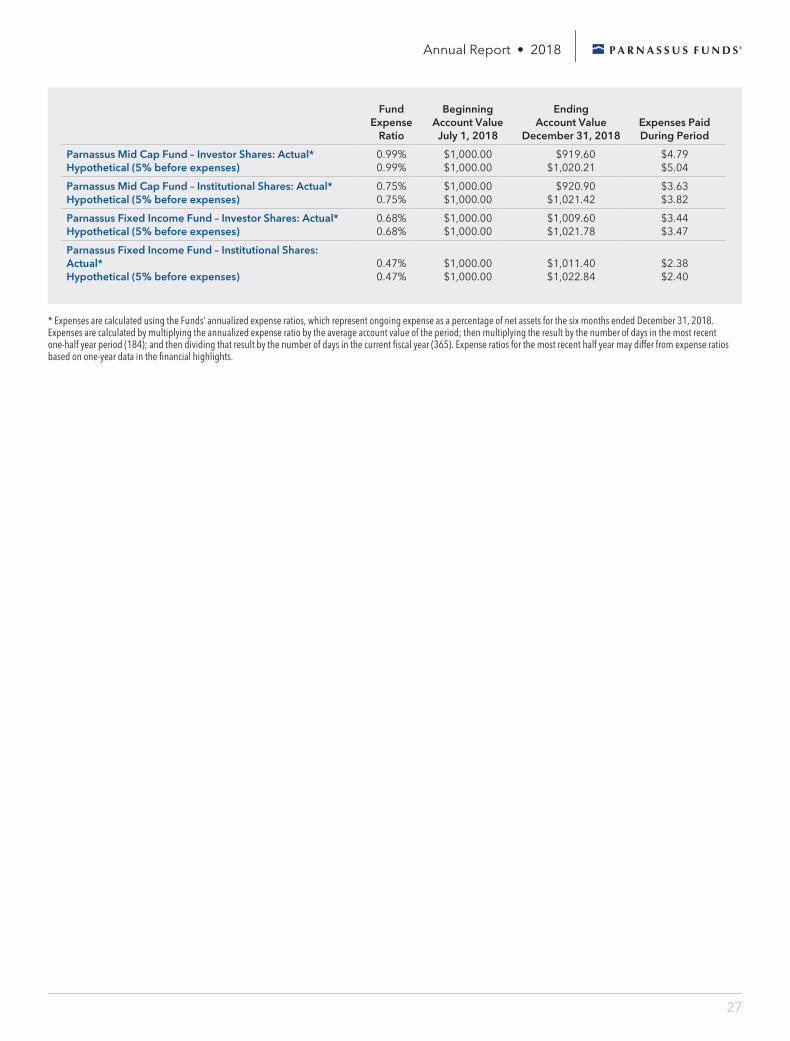
Annual Report • 2018
Fund Expense
Ratio
Beginning Account Value
July 1, 2018
Ending Account Value
December 31, 2018 Expenses Paid During Period
Parnassus Mid Cap Fund – Investor Shares: Actual* 0.99% $1,000.00 $919.60 $4.79 Hypothetical (5% before expenses) 0.99% $1,000.00 $1,020.21 $5.04
Parnassus Mid Cap Fund – Institutional Shares: Actual* 0.75% $1,000.00 $920.90 $3.63 Hypothetical (5% before expenses) 0.75% $1,000.00 $1,021.42 $3.82
Parnassus Fixed Income Fund – Investor Shares: Actual* 0.68% $1,000.00 $1,009.60 $3.44 Hypothetical (5% before expenses) 0.68% $1,000.00 $1,021.78 $3.47
Parnassus Fixed Income Fund – Institutional Shares: Actual* 0.47% $1,000.00 $1,011.40 $2.38
Hypothetical (5% before expenses) 0.47% $1,000.00 $1,022.84 $2.40
* Expenses are calculated using the Funds’ annualized expense ratios, which represent ongoing expense as a percentage of net assets for the six months ended December 31, 2018. Expenses are calculated by multiplying the annualized expense ratio by the average account value of the period; then multiplying the result by the number of days in the most recent one-half year period (184); and then dividing that result by the number of days in the current fiscal year (365). Expense ratios for the most recent half year may differ from expense ratios based on one-year data in the financial highlights.
27
Annual Report • 2018
Report of Independent Registered Public Accounting Firm
To the Shareholders and Board of Trustees of the Parnassus Funds and the Parnassus Income Funds San Francisco, California
Opinion on the Financial Statements and Financial Highlights We have audited the accompanying statements of assets and liabilities of the Parnassus Funds (comprised of Parnassus Fund, Parnassus Mid Cap Fund, and Parnassus Endeavor Fund) and the Parnassus Income Funds (comprised of Parnassus Core Equity Fund and Parnassus Fixed Income Fund) (collectively, the “Trusts”), including the portfolios of investments as of December 31, 2018, the related statements of operations for the year then ended, the statements of changes in net assets for each of the two years in the period then ended, the financial highlights for each of the five years in the period then ended for Parnassus Fund, Parnassus Mid Cap Fund, Parnassus Endeavor Fund, Parnassus Core Equity Fund, and Parnassus Fixed Income Fund, and the related notes.
In our opinion, the financial statements and financial highlights referred to above present fairly, in all material respects, the financial position of each of the Trusts constituting the Parnassus Funds and the Parnassus Income Funds as of December 31, 2018, the results of their operations for the year then ended, the changes in their net assets for each of the two years in the period then ended, and the financial highlights for each of the five years in the period then ended for Parnassus Fund, Parnassus Mid Cap Fund, Parnassus Endeavor Fund, Parnassus Core Equity Fund, and Parnassus Fixed Income Fund, in conformity with accounting principles generally accepted in the United States of America.
Basis for Opinion These financial statements and financial highlights are the responsibility of the Trusts’ management. Our responsibility is to express an opinion on these Trusts’ financial statements and financial highlights based on
our audits. We are a public accounting firm registered with the Public Company Accounting Oversight Board (United States) (PCAOB) and are required to be independent with respect to the Trusts in accordance with the U.S. federal securities laws and the applicable rules and regulations of the Securities and Exchange Commission and the PCAOB.
We conducted our audits in accordance with the standards of the PCAOB. Those standards require that we plan and perform the audit to obtain reasonable assurance about whether the financial statements and financial highlights are free of material misstatement, whether due to error or fraud. The Trusts are not required to have, nor were we engaged to perform, an audit of their internal control over financial reporting. As part of our audits we are required to obtain an understanding of internal control over financial reporting but not for the purpose of expressing an opinion on the effectiveness of the Trusts’ internal control over financial reporting. Accordingly, we express no such opinion.
Our audits included performing procedures to assess the risks of material misstatement of the financial statements and financial highlights, whether due to error or fraud, and performing procedures that respond to those risks. Such procedures included examining, on a test basis, evidence regarding the amounts and disclosures in the financial statements and financial highlights. Our audits also included evaluating the accounting principles used and significant estimates made by management, as well as evaluating the overall presentation of the financial statements and financial highlights. Our procedures included confirmation of investments owned as of December 31, 2018, by correspondence with the custodian and brokers. We believe that our audits provide a reasonable basis for our opinion.
Costa Mesa, California February 8, 2019
We have served as the Trusts’ auditor since 1987.
28
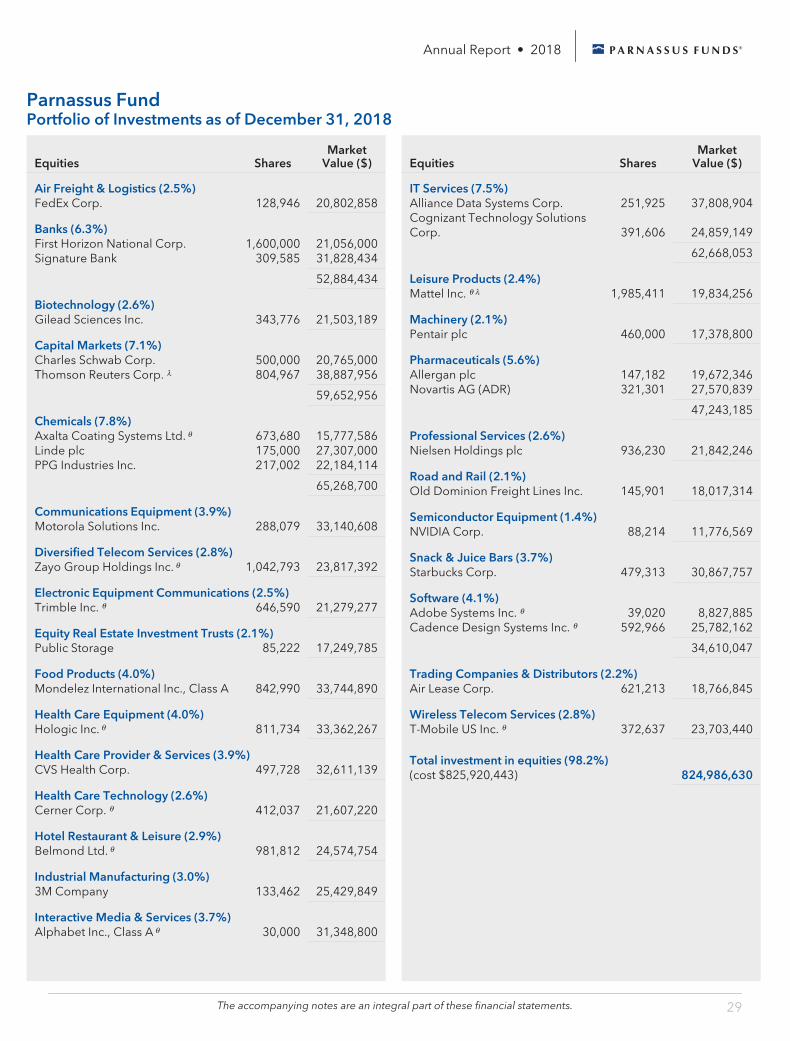
Annual Report • 2018
Parnassus Fund Portfolio of Investments as of December 31, 2018
Equities Shares Market
Value ($)
Air Freight & Logistics (2.5%) FedEx Corp. 128,946 20,802,858
Banks (6.3%) First Horizon National Corp. 1,600,000 21,056,000 Signature Bank 309,585 31,828,434
52,884,434
Biotechnology (2.6%) Gilead Sciences Inc. 343,776 21,503,189
Capital Markets (7.1%) Charles Schwab Corp. 500,000 20,765,000 Thomson Reuters Corp. λ 804,967 38,887,956
59,652,956
Chemicals (7.8%) Axalta Coating Systems Ltd. θ 673,680 15,777,586 Linde plc 175,000 27,307,000 PPG Industries Inc. 217,002 22,184,114
65,268,700
Communications Equipment (3.9%) Motorola Solutions Inc. 288,079 33,140,608
Diversified Telecom Services (2.8%) Zayo Group Holdings Inc. θ 1,042,793 23,817,392
Electronic Equipment Communications (2.5%) Trimble Inc. θ 646,590 21,279,277
Equity Real Estate Investment Trusts (2.1%) Public Storage 85,222 17,249,785
Food Products (4.0%) Mondelez International Inc., Class A 842,990 33,744,890
Health Care Equipment (4.0%) Hologic Inc. θ 811,734 33,362,267
Health Care Provider & Services (3.9%) CVS Health Corp. 497,728 32,611,139
Health Care Technology (2.6%) Cerner Corp. θ 412,037 21,607,220
Hotel Restaurant & Leisure (2.9%) Belmond Ltd. θ 981,812 24,574,754
Industrial Manufacturing (3.0%) 3M Company 133,462 25,429,849
Interactive Media & Services (3.7%) Alphabet Inc., Class A θ 30,000 31,348,800
Equities Shares Market
Value ($)
IT Services (7.5%) Alliance Data Systems Corp. 251,925 37,808,904 Cognizant Technology Solutions Corp. 391,606 24,859,149
62,668,053
Leisure Products (2.4%) Mattel Inc. θ λ 1,985,411 19,834,256
Machinery (2.1%) Pentair plc 460,000 17,378,800
Pharmaceuticals (5.6%) Allergan plc 147,182 19,672,346 Novartis AG (ADR) 321,301 27,570,839
47,243,185
Professional Services (2.6%) Nielsen Holdings plc 936,230 21,842,246
Road and Rail (2.1%) Old Dominion Freight Lines Inc. 145,901 18,017,314
Semiconductor Equipment (1.4%) NVIDIA Corp. 88,214 11,776,569
Snack & Juice Bars (3.7%) Starbucks Corp. 479,313 30,867,757
Software (4.1%) Adobe Systems Inc. θ 39,020 8,827,885 Cadence Design Systems Inc. θ 592,966 25,782,162
34,610,047
Trading Companies & Distributors (2.2%) Air Lease Corp. 621,213 18,766,845
Wireless Telecom Services (2.8%) T-Mobile US Inc. θ 372,637 23,703,440
Total investment in equities (98.2%) (cost $825,920,443) 824,986,630
The accompanying notes are an integral part of these financial statements. 29
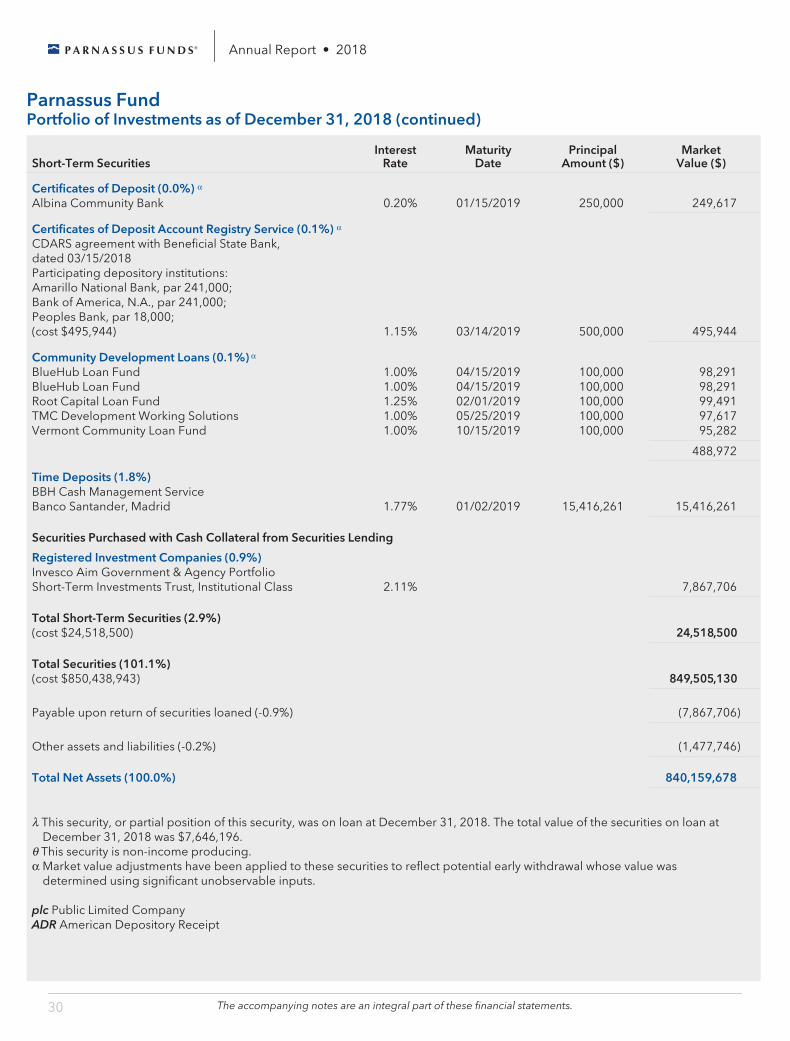
Annual Report • 2018
Parnassus Fund Portfolio of Investments as of December 31, 2018 (continued)
Short-Term Securities Interest
Rate Maturity
Date Principal
Amount ($) Market
Value ($)
Certificates of Deposit (0.0%) α Albina Community Bank 0.20% 01/15/2019 250,000 249,617
Certificates of Deposit Account Registry Service (0.1%) α CDARS agreement with Beneficial State Bank, dated 03/15/2018 Participating depository institutions: Amarillo National Bank, par 241,000; Bank of America, N.A., par 241,000; Peoples Bank, par 18,000; (cost $495,944) 1.15% 03/14/2019 500,000 495,944
Community Development Loans (0.1%) α BlueHub Loan Fund 1.00% 04/15/2019 100,000 98,291 BlueHub Loan Fund 1.00% 04/15/2019 100,000 98,291 Root Capital Loan Fund 1.25% 02/01/2019 100,000 99,491 TMC Development Working Solutions 1.00% 05/25/2019 100,000 97,617 Vermont Community Loan Fund 1.00% 10/15/2019 100,000 95,282
488,972
Time Deposits (1.8%) BBH Cash Management Service Banco Santander, Madrid 1.77% 01/02/2019 15,416,261 15,416,261
Securities Purchased with Cash Collateral from Securities Lending
Registered Investment Companies (0.9%) Invesco Aim Government & Agency Portfolio Short-Term Investments Trust, Institutional Class 2.11% 7,867,706
Total Short-Term Securities (2.9%) (cost $24,518,500) 24,518,500
Total Securities (101.1%) (cost $850,438,943) 849,505,130
Payable upon return of securities loaned (-0.9%) (7,867,706)
Other assets and liabilities (-0.2%) (1,477,746)
Total Net Assets (100.0%) 840,159,678
λ This security, or partial position of this security, was on loan at December 31, 2018. The total value of the securities on loan at
December 31, 2018 was $7,646,196. θ This security is non-income producing. α Market value adjustments have been applied to these securities to reflect potential early withdrawal whose value was
determined using significant unobservable inputs.
plc Public Limited Company ADR American Depository Receipt
The accompanying notes are an integral part of these financial statements. 30
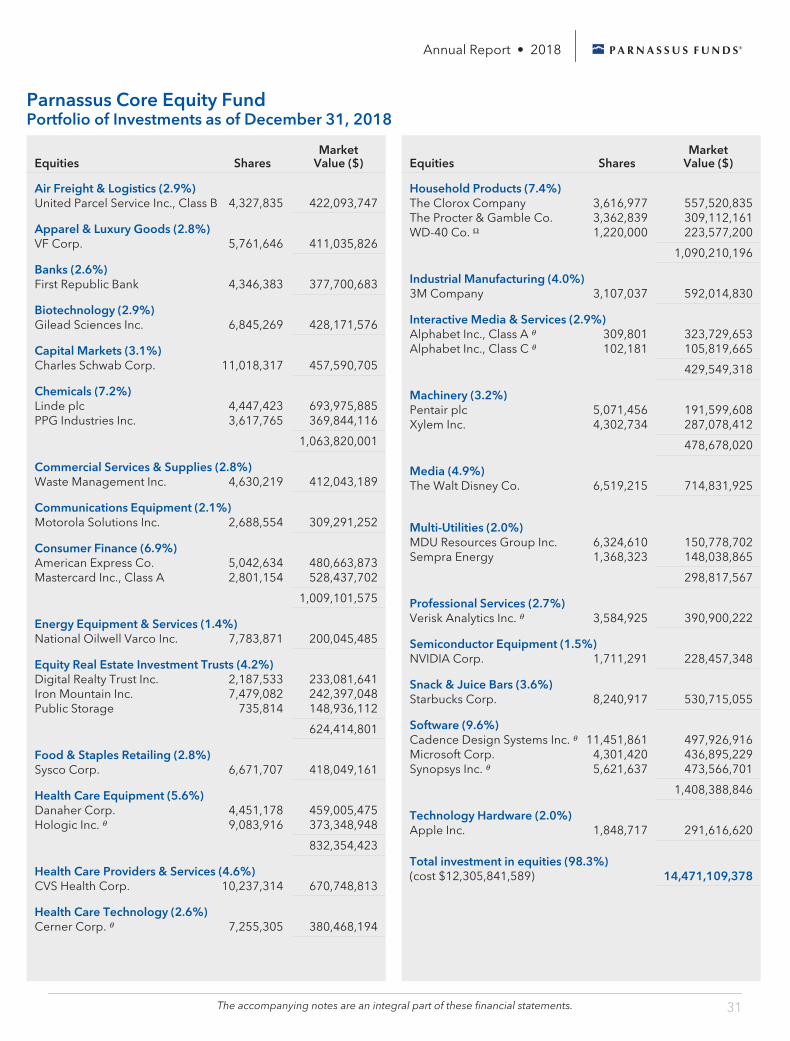
Annual Report • 2018
Parnassus Core Equity Fund Portfolio of Investments as of December 31, 2018
Equities Shares Market
Value ($)
Air Freight & Logistics (2.9%) United Parcel Service Inc., Class B 4,327,835 422,093,747
Apparel & Luxury Goods (2.8%) VF Corp. 5,761,646 411,035,826
Banks (2.6%) First Republic Bank 4,346,383 377,700,683
Biotechnology (2.9%) Gilead Sciences Inc. 6,845,269 428,171,576
Capital Markets (3.1%) Charles Schwab Corp. 11,018,317 457,590,705
Chemicals (7.2%) Linde plc 4,447,423 693,975,885 PPG Industries Inc. 3,617,765 369,844,116
1,063,820,001
Commercial Services & Supplies (2.8%) Waste Management Inc. 4,630,219 412,043,189
Communications Equipment (2.1%) Motorola Solutions Inc. 2,688,554 309,291,252
Consumer Finance (6.9%) American Express Co. 5,042,634 480,663,873 Mastercard Inc., Class A 2,801,154 528,437,702
1,009,101,575
Energy Equipment & Services (1.4%) National Oilwell Varco Inc. 7,783,871 200,045,485
Equity Real Estate Investment Trusts (4.2%) Digital Realty Trust Inc. 2,187,533 233,081,641 Iron Mountain Inc. 7,479,082 242,397,048 Public Storage 735,814 148,936,112
624,414,801
Food & Staples Retailing (2.8%) Sysco Corp. 6,671,707 418,049,161
Health Care Equipment (5.6%) Danaher Corp. 4,451,178 459,005,475 Hologic Inc. θ 9,083,916 373,348,948
832,354,423
Health Care Providers & Services (4.6%) CVS Health Corp. 10,237,314 670,748,813
Health Care Technology (2.6%) Cerner Corp. θ 7,255,305 380,468,194
Equities Shares Market
Value ($)
Household Products (7.4%) The Clorox Company 3,616,977 557,520,835 The Procter & Gamble Co. 3,362,839 309,112,161 WD-40 Co. Ω 1,220,000 223,577,200
1,090,210,196
Industrial Manufacturing (4.0%) 3M Company 3,107,037 592,014,830
Interactive Media & Services (2.9%) Alphabet Inc., Class A θ 309,801 323,729,653 Alphabet Inc., Class C θ 102,181 105,819,665
429,549,318
Machinery (3.2%) Pentair plc 5,071,456 191,599,608 Xylem Inc. 4,302,734 287,078,412
478,678,020
Media (4.9%) The Walt Disney Co. 6,519,215 714,831,925
Multi-Utilities (2.0%) MDU Resources Group Inc. 6,324,610 150,778,702 Sempra Energy 1,368,323 148,038,865
298,817,567
Professional Services (2.7%) Verisk Analytics Inc. θ 3,584,925 390,900,222
Semiconductor Equipment (1.5%) NVIDIA Corp. 1,711,291 228,457,348
Snack & Juice Bars (3.6%) Starbucks Corp. 8,240,917 530,715,055
Software (9.6%) Cadence Design Systems Inc. θ 11,451,861 497,926,916 Microsoft Corp. 4,301,420 436,895,229 Synopsys Inc. θ 5,621,637 473,566,701
1,408,388,846
Technology Hardware (2.0%) Apple Inc. 1,848,717 291,616,620
Total investment in equities (98.3%) (cost $12,305,841,589) 14,471,109,378
The accompanying notes are an integral part of these financial statements. 31
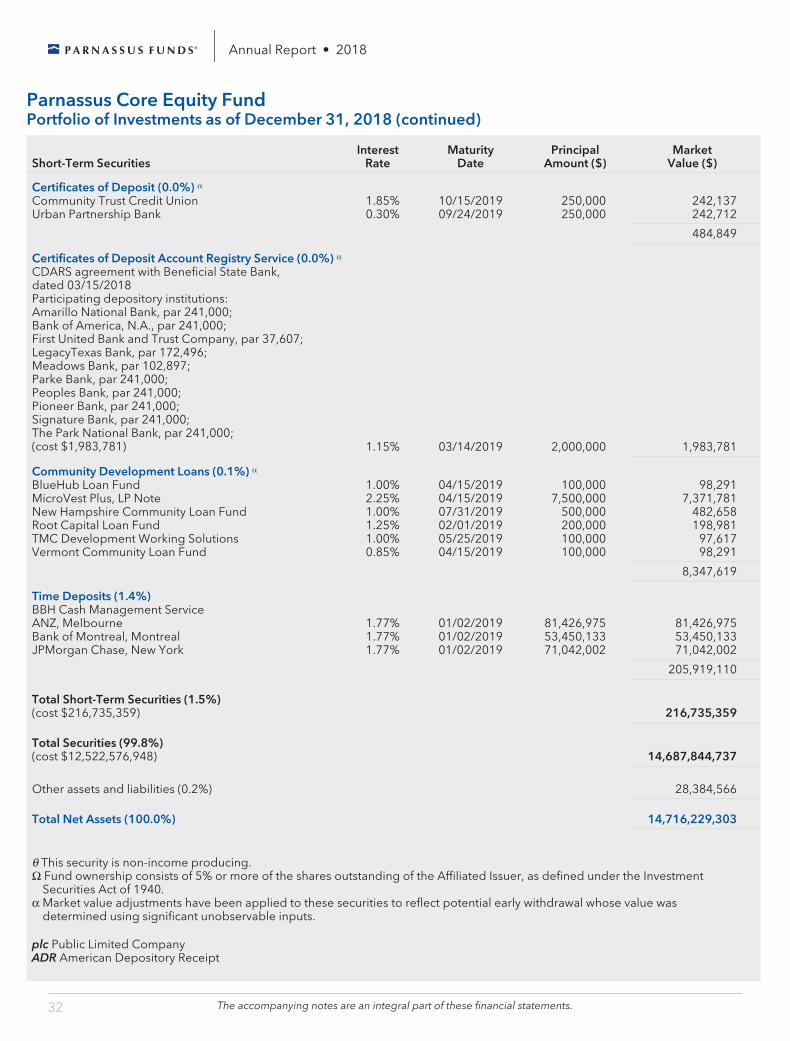
Annual Report • 2018
Parnassus Core Equity Fund Portfolio of Investments as of December 31, 2018 (continued)
Short-Term Securities Interest
Rate Maturity
Date Principal
Amount ($) Market
Value ($)
Certificates of Deposit (0.0%) α Community Trust Credit Union 1.85% 10/15/2019 250,000 242,137 Urban Partnership Bank 0.30% 09/24/2019 250,000 242,712
484,849
Certificates of Deposit Account Registry Service (0.0%) α CDARS agreement with Beneficial State Bank, dated 03/15/2018 Participating depository institutions: Amarillo National Bank, par 241,000; Bank of America, N.A., par 241,000; First United Bank and Trust Company, par 37,607; LegacyTexas Bank, par 172,496; Meadows Bank, par 102,897; Parke Bank, par 241,000; Peoples Bank, par 241,000; Pioneer Bank, par 241,000; Signature Bank, par 241,000; The Park National Bank, par 241,000; (cost $1,983,781) 1.15% 03/14/2019 2,000,000 1,983,781
Community Development Loans (0.1%) α BlueHub Loan Fund 1.00% 04/15/2019 100,000 98,291 MicroVest Plus, LP Note 2.25% 04/15/2019 7,500,000 7,371,781 New Hampshire Community Loan Fund 1.00% 07/31/2019 500,000 482,658 Root Capital Loan Fund 1.25% 02/01/2019 200,000 198,981 TMC Development Working Solutions 1.00% 05/25/2019 100,000 97,617 Vermont Community Loan Fund 0.85% 04/15/2019 100,000 98,291
8,347,619
Time Deposits (1.4%) BBH Cash Management Service ANZ, Melbourne 1.77% 01/02/2019 81,426,975 81,426,975 Bank of Montreal, Montreal 1.77% 01/02/2019 53,450,133 53,450,133 JPMorgan Chase, New York 1.77% 01/02/2019 71,042,002 71,042,002
205,919,110
Total Short-Term Securities (1.5%) (cost $216,735,359) 216,735,359
Total Securities (99.8%) (cost $12,522,576,948) 14,687,844,737
Other assets and liabilities (0.2%) 28,384,566
Total Net Assets (100.0%) 14,716,229,303
θ This security is non-income producing. Ω Fund ownership consists of 5% or more of the shares outstanding of the Affiliated Issuer, as defined under the Investment
Securities Act of 1940. α Market value adjustments have been applied to these securities to reflect potential early withdrawal whose value was
determined using significant unobservable inputs.
plc Public Limited Company ADR American Depository Receipt
The accompanying notes are an integral part of these financial statements. 32
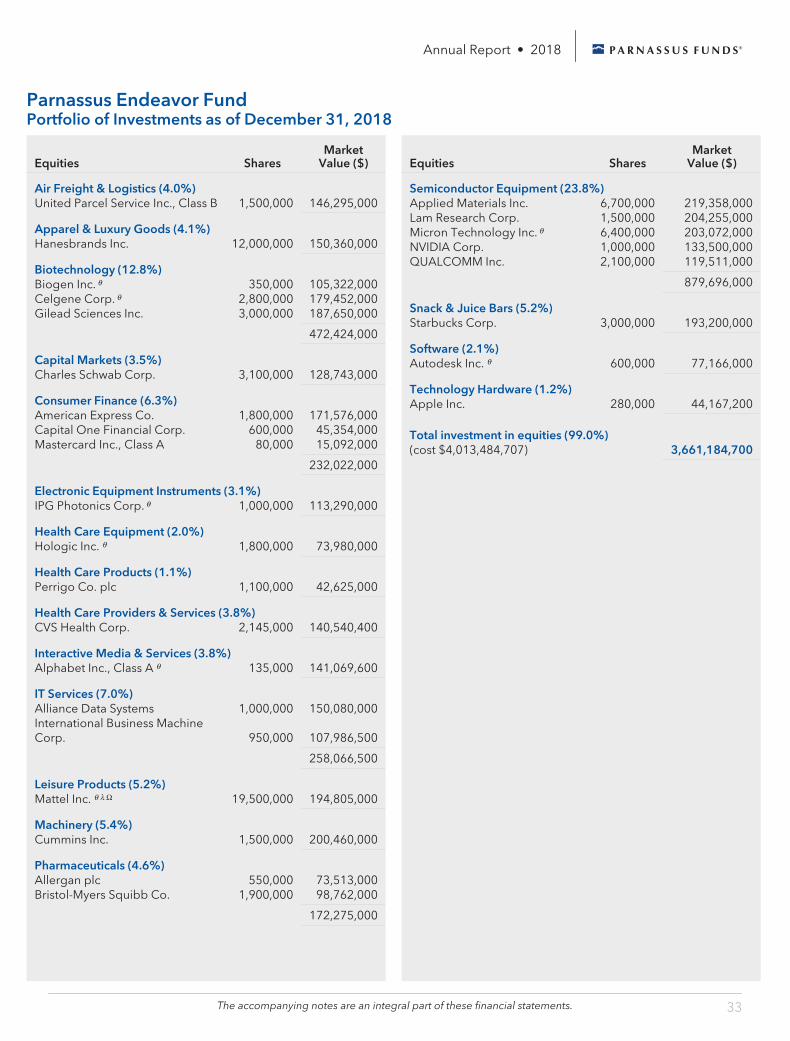
Annual Report • 2018
Parnassus Endeavor Fund Portfolio of Investments as of December 31, 2018
Equities Shares Market
Value ($)
Air Freight & Logistics (4.0%) United Parcel Service Inc., Class B 1,500,000 146,295,000
Apparel & Luxury Goods (4.1%) Hanesbrands Inc. 12,000,000 150,360,000
Biotechnology (12.8%) Biogen Inc. θ 350,000 105,322,000 Celgene Corp. θ 2,800,000 179,452,000 Gilead Sciences Inc. 3,000,000 187,650,000
472,424,000
Capital Markets (3.5%) Charles Schwab Corp. 3,100,000 128,743,000
Consumer Finance (6.3%) American Express Co. 1,800,000 171,576,000 Capital One Financial Corp. 600,000 45,354,000 Mastercard Inc., Class A 80,000 15,092,000
232,022,000
Electronic Equipment Instruments (3.1%) IPG Photonics Corp. θ 1,000,000 113,290,000
Health Care Equipment (2.0%) Hologic Inc. θ 1,800,000 73,980,000
Health Care Products (1.1%) Perrigo Co. plc 1,100,000 42,625,000
Health Care Providers & Services (3.8%) CVS Health Corp. 2,145,000 140,540,400
Interactive Media & Services (3.8%) Alphabet Inc., Class A θ 135,000 141,069,600
IT Services (7.0%) Alliance Data Systems 1,000,000 150,080,000 International Business Machine Corp. 950,000 107,986,500
258,066,500
Leisure Products (5.2%) Mattel Inc. θ λ Ω 19,500,000 194,805,000
Machinery (5.4%) Cummins Inc. 1,500,000 200,460,000
Pharmaceuticals (4.6%) Allergan plc 550,000 73,513,000 Bristol-Myers Squibb Co. 1,900,000 98,762,000
172,275,000
Equities Shares Market
Value ($)
Semiconductor Equipment (23.8%) Applied Materials Inc. 6,700,000 219,358,000 Lam Research Corp. 1,500,000 204,255,000 Micron Technology Inc. θ 6,400,000 203,072,000 NVIDIA Corp. 1,000,000 133,500,000 QUALCOMM Inc. 2,100,000 119,511,000
879,696,000
Snack & Juice Bars (5.2%) Starbucks Corp. 3,000,000 193,200,000
Software (2.1%) Autodesk Inc. θ 600,000 77,166,000
Technology Hardware (1.2%) Apple Inc. 280,000 44,167,200
Total investment in equities (99.0%) (cost $4,013,484,707) 3,661,184,700
The accompanying notes are an integral part of these financial statements. 33
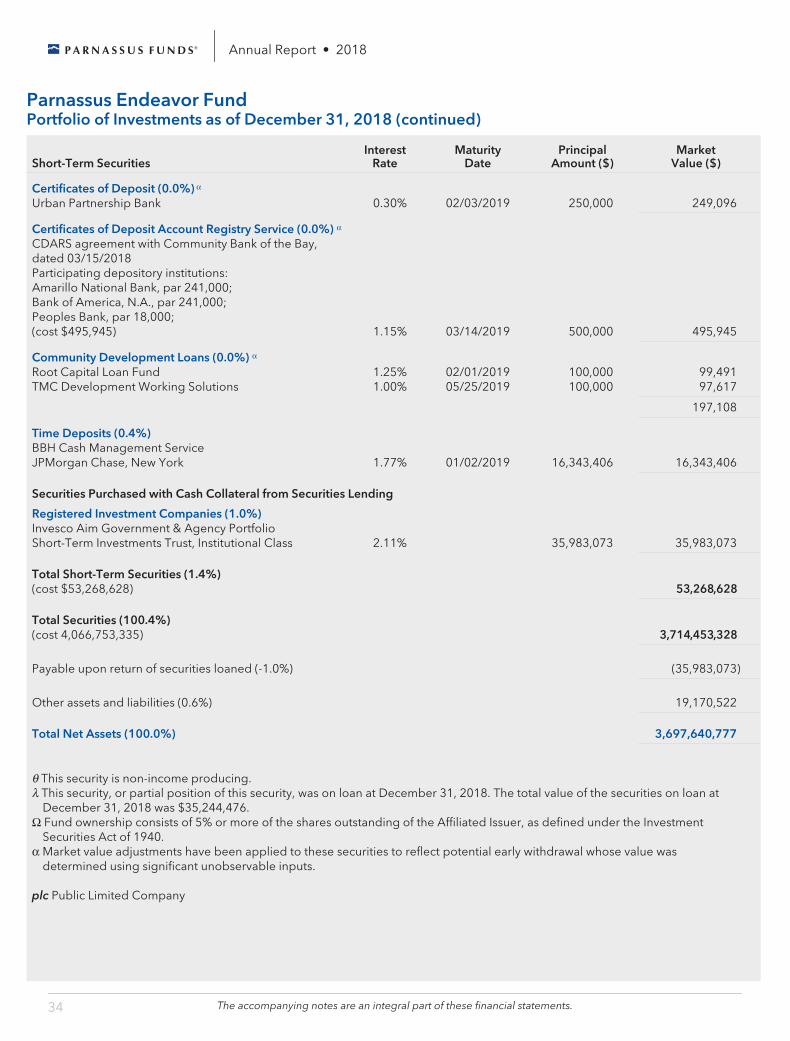
Annual Report • 2018
Parnassus Endeavor Fund Portfolio of Investments as of December 31, 2018 (continued)
Short-Term Securities Interest
Rate Maturity
Date Principal
Amount ($) Market
Value ($)
Certificates of Deposit (0.0%) α Urban Partnership Bank 0.30% 02/03/2019 250,000 249,096
Certificates of Deposit Account Registry Service (0.0%) α CDARS agreement with Community Bank of the Bay, dated 03/15/2018 Participating depository institutions: Amarillo National Bank, par 241,000; Bank of America, N.A., par 241,000; Peoples Bank, par 18,000; (cost $495,945) 1.15% 03/14/2019 500,000 495,945
Community Development Loans (0.0%) α Root Capital Loan Fund 1.25% 02/01/2019 100,000 99,491 TMC Development Working Solutions 1.00% 05/25/2019 100,000 97,617
197,108
Time Deposits (0.4%) BBH Cash Management Service JPMorgan Chase, New York 1.77% 01/02/2019 16,343,406 16,343,406
Securities Purchased with Cash Collateral from Securities Lending
Registered Investment Companies (1.0%) Invesco Aim Government & Agency Portfolio Short-Term Investments Trust, Institutional Class 2.11% 35,983,073 35,983,073
Total Short-Term Securities (1.4%) (cost $53,268,628) 53,268,628
Total Securities (100.4%) (cost 4,066,753,335) 3,714,453,328
Payable upon return of securities loaned (-1.0%) (35,983,073)
Other assets and liabilities (0.6%) 19,170,522
Total Net Assets (100.0%) 3,697,640,777
θ This security is non-income producing. λ This security, or partial position of this security, was on loan at December 31, 2018. The total value of the securities on loan at
December 31, 2018 was $35,244,476. Ω Fund ownership consists of 5% or more of the shares outstanding of the Affiliated Issuer, as defined under the Investment
Securities Act of 1940. α Market value adjustments have been applied to these securities to reflect potential early withdrawal whose value was
determined using significant unobservable inputs.
plc Public Limited Company
The accompanying notes are an integral part of these financial statements. 34
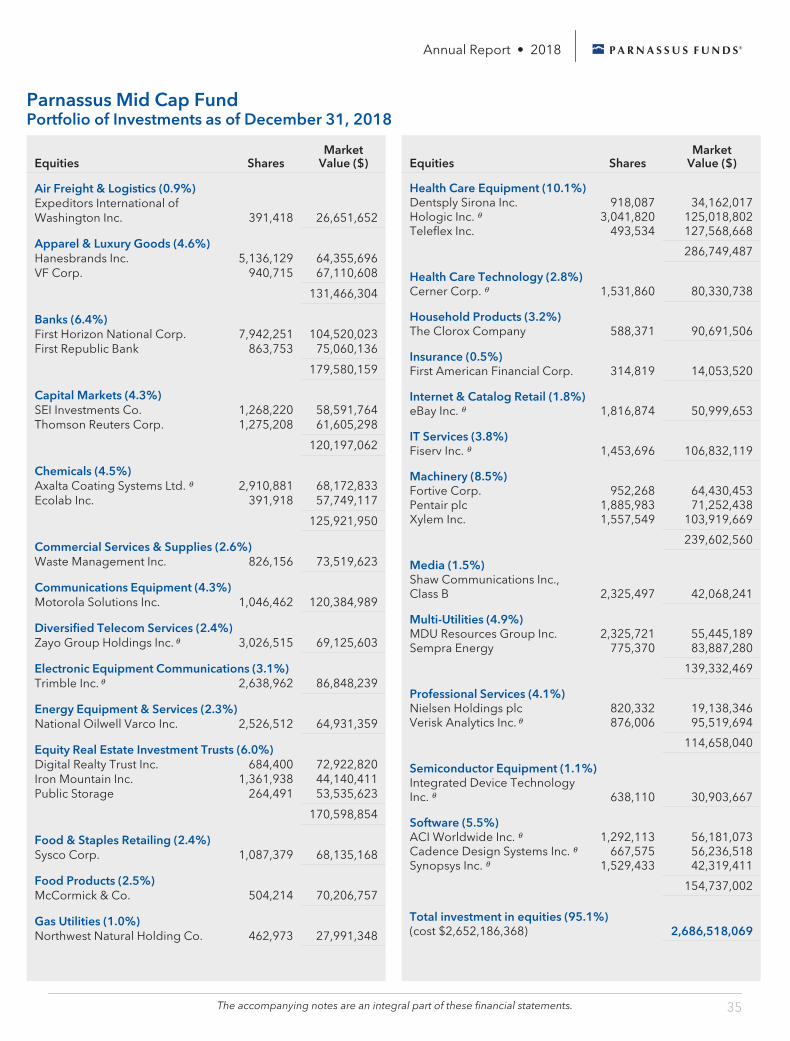
Annual Report • 2018
Parnassus Mid Cap Fund Portfolio of Investments as of December 31, 2018
Equities Shares Market
Value ($)
Air Freight & Logistics (0.9%) Expeditors International of Washington Inc. 391,418 26,651,652
Apparel & Luxury Goods (4.6%) Hanesbrands Inc. 5,136,129 64,355,696 VF Corp. 940,715 67,110,608
131,466,304
Banks (6.4%) First Horizon National Corp. 7,942,251 104,520,023 First Republic Bank 863,753 75,060,136
179,580,159
Capital Markets (4.3%) SEI Investments Co. 1,268,220 58,591,764 Thomson Reuters Corp. 1,275,208 61,605,298
120,197,062
Chemicals (4.5%) Axalta Coating Systems Ltd. θ 2,910,881 68,172,833 Ecolab Inc. 391,918 57,749,117
125,921,950
Commercial Services & Supplies (2.6%) Waste Management Inc. 826,156 73,519,623
Communications Equipment (4.3%) Motorola Solutions Inc. 1,046,462 120,384,989
Diversified Telecom Services (2.4%) Zayo Group Holdings Inc. θ 3,026,515 69,125,603
Electronic Equipment Communications (3.1%) Trimble Inc. θ 2,638,962 86,848,239
Energy Equipment & Services (2.3%) National Oilwell Varco Inc. 2,526,512 64,931,359
Equity Real Estate Investment Trusts (6.0%) Digital Realty Trust Inc. 684,400 72,922,820 Iron Mountain Inc. 1,361,938 44,140,411 Public Storage 264,491 53,535,623
170,598,854
Food & Staples Retailing (2.4%) Sysco Corp. 1,087,379 68,135,168
Food Products (2.5%) McCormick & Co. 504,214 70,206,757
Gas Utilities (1.0%) Northwest Natural Holding Co. 462,973 27,991,348
Equities Shares Market
Value ($)
Health Care Equipment (10.1%) Dentsply Sirona Inc. 918,087 34,162,017 Hologic Inc. θ 3,041,820 125,018,802 Teleflex Inc. 493,534 127,568,668
286,749,487
Health Care Technology (2.8%) Cerner Corp. θ 1,531,860 80,330,738
Household Products (3.2%) The Clorox Company 588,371 90,691,506
Insurance (0.5%) First American Financial Corp. 314,819 14,053,520
Internet & Catalog Retail (1.8%) eBay Inc. θ 1,816,874 50,999,653
IT Services (3.8%) Fiserv Inc. θ 1,453,696 106,832,119
Machinery (8.5%) Fortive Corp. 952,268 64,430,453 Pentair plc 1,885,983 71,252,438 Xylem Inc. 1,557,549 103,919,669
239,602,560
Media (1.5%) Shaw Communications Inc., Class B 2,325,497 42,068,241
Multi-Utilities (4.9%) MDU Resources Group Inc. 2,325,721 55,445,189 Sempra Energy 775,370 83,887,280
139,332,469
Professional Services (4.1%) Nielsen Holdings plc 820,332 19,138,346 Verisk Analytics Inc. θ 876,006 95,519,694
114,658,040
Semiconductor Equipment (1.1%) Integrated Device Technology Inc. θ 638,110 30,903,667
Software (5.5%) ACI Worldwide Inc. θ 1,292,113 56,181,073 Cadence Design Systems Inc. θ 667,575 56,236,518 Synopsys Inc. θ 1,529,433 42,319,411
154,737,002
Total investment in equities (95.1%) (cost $2,652,186,368) 2,686,518,069
The accompanying notes are an integral part of these financial statements. 35
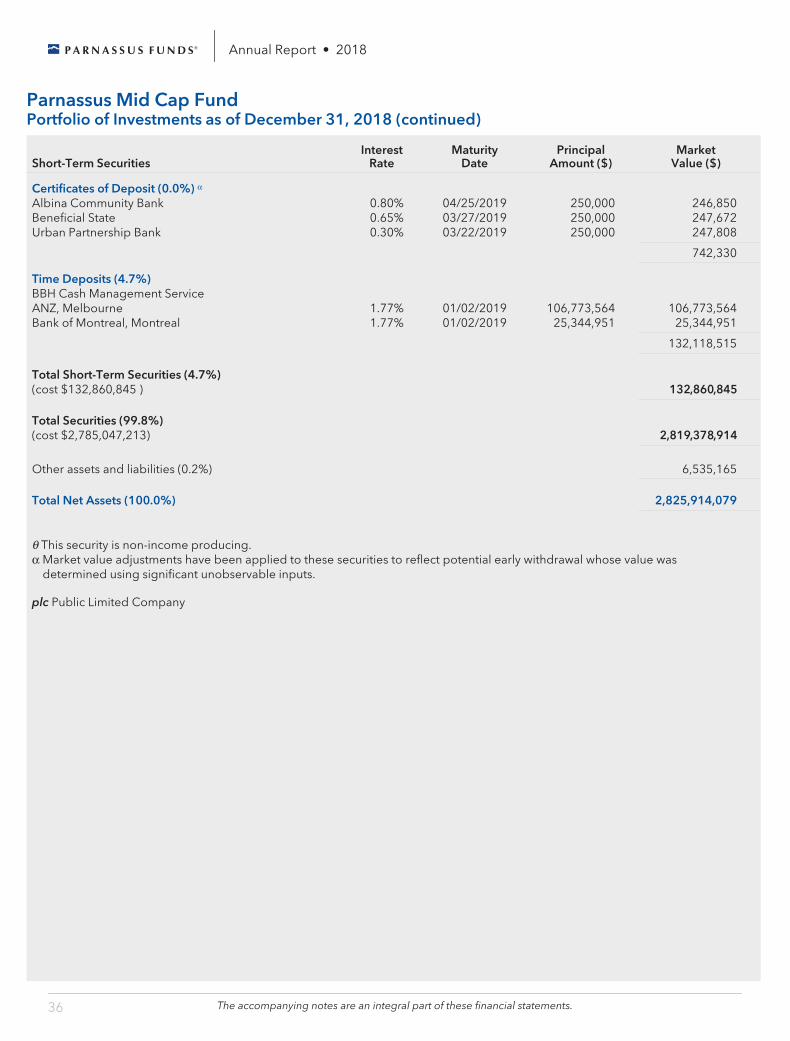
Annual Report • 2018
Parnassus Mid Cap Fund Portfolio of Investments as of December 31, 2018 (continued)
Short-Term Securities Interest
Rate Maturity
Date Principal
Amount ($) Market
Value ($)
Certificates of Deposit (0.0%) α Albina Community Bank 0.80% 04/25/2019 250,000 246,850 Beneficial State 0.65% 03/27/2019 250,000 247,672 Urban Partnership Bank 0.30% 03/22/2019 250,000 247,808
742,330
Time Deposits (4.7%) BBH Cash Management Service ANZ, Melbourne 1.77% 01/02/2019 106,773,564 106,773,564 Bank of Montreal, Montreal 1.77% 01/02/2019 25,344,951 25,344,951
132,118,515
Total Short-Term Securities (4.7%) (cost $132,860,845 ) 132,860,845
Total Securities (99.8%) (cost $2,785,047,213) 2,819,378,914
Other assets and liabilities (0.2%) 6,535,165
Total Net Assets (100.0%) 2,825,914,079
θ This security is non-income producing. α Market value adjustments have been applied to these securities to reflect potential early withdrawal whose value was
determined using significant unobservable inputs.
plc Public Limited Company
The accompanying notes are an integral part of these financial statements. 36
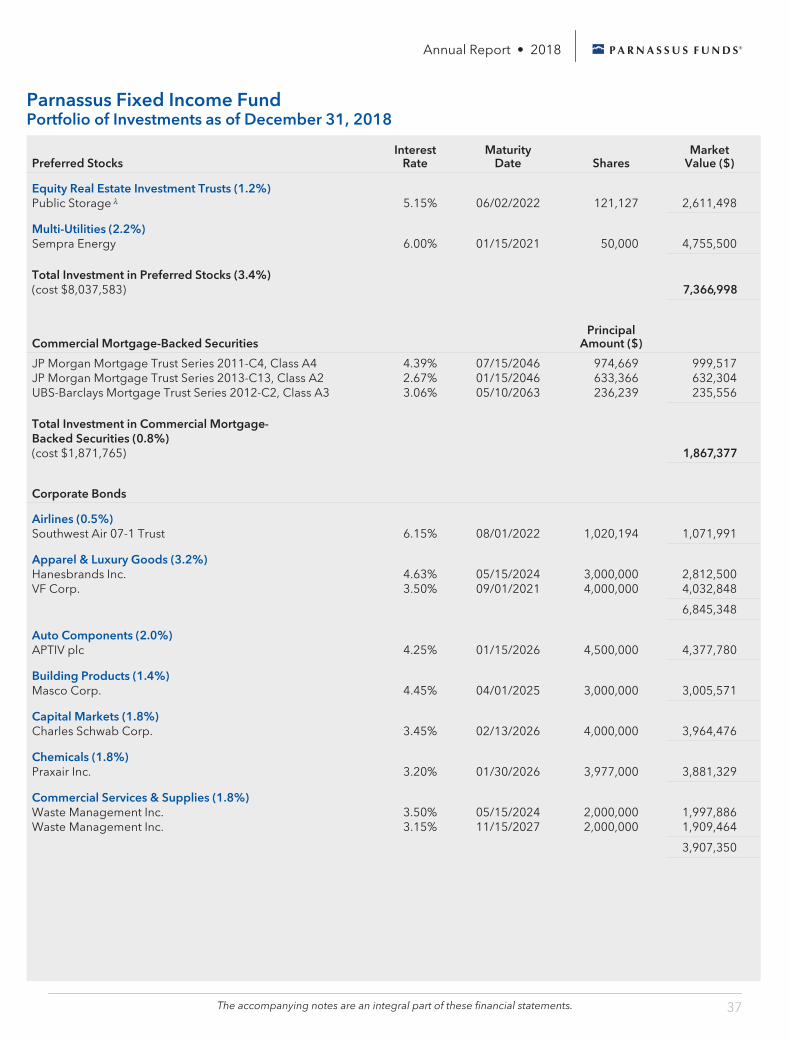
Annual Report • 2018
Parnassus Fixed Income Fund Portfolio of Investments as of December 31, 2018
Preferred Stocks Interest
Rate Maturity
Date Shares Market
Value ($)
Equity Real Estate Investment Trusts (1.2%) Public Storage λ 5.15% 06/02/2022 121,127 2,611,498
Multi-Utilities (2.2%) Sempra Energy 6.00% 01/15/2021 50,000 4,755,500
Total Investment in Preferred Stocks (3.4%) (cost $8,037,583) 7,366,998
Commercial Mortgage-Backed Securities Principal
Amount ($)
JP Morgan Mortgage Trust Series 2011-C4, Class A4 4.39% 07/15/2046 974,669 999,517 JP Morgan Mortgage Trust Series 2013-C13, Class A2 2.67% 01/15/2046 633,366 632,304 UBS-Barclays Mortgage Trust Series 2012-C2, Class A3 3.06% 05/10/2063 236,239 235,556
Total Investment in Commercial Mortgage-Backed Securities (0.8%) (cost $1,871,765) 1,867,377
Corporate Bonds
Airlines (0.5%) Southwest Air 07-1 Trust 6.15% 08/01/2022 1,020,194 1,071,991
Apparel & Luxury Goods (3.2%) Hanesbrands Inc. 4.63% 05/15/2024 3,000,000 2,812,500 VF Corp. 3.50% 09/01/2021 4,000,000 4,032,848
6,845,348
Auto Components (2.0%) APTIV plc 4.25% 01/15/2026 4,500,000 4,377,780
Building Products (1.4%) Masco Corp. 4.45% 04/01/2025 3,000,000 3,005,571
Capital Markets (1.8%) Charles Schwab Corp. 3.45% 02/13/2026 4,000,000 3,964,476
Chemicals (1.8%) Praxair Inc. 3.20% 01/30/2026 3,977,000 3,881,329
Commercial Services & Supplies (1.8%) Waste Management Inc. 3.50% 05/15/2024 2,000,000 1,997,886 Waste Management Inc. 3.15% 11/15/2027 2,000,000 1,909,464
3,907,350
The accompanying notes are an integral part of these financial statements. 37
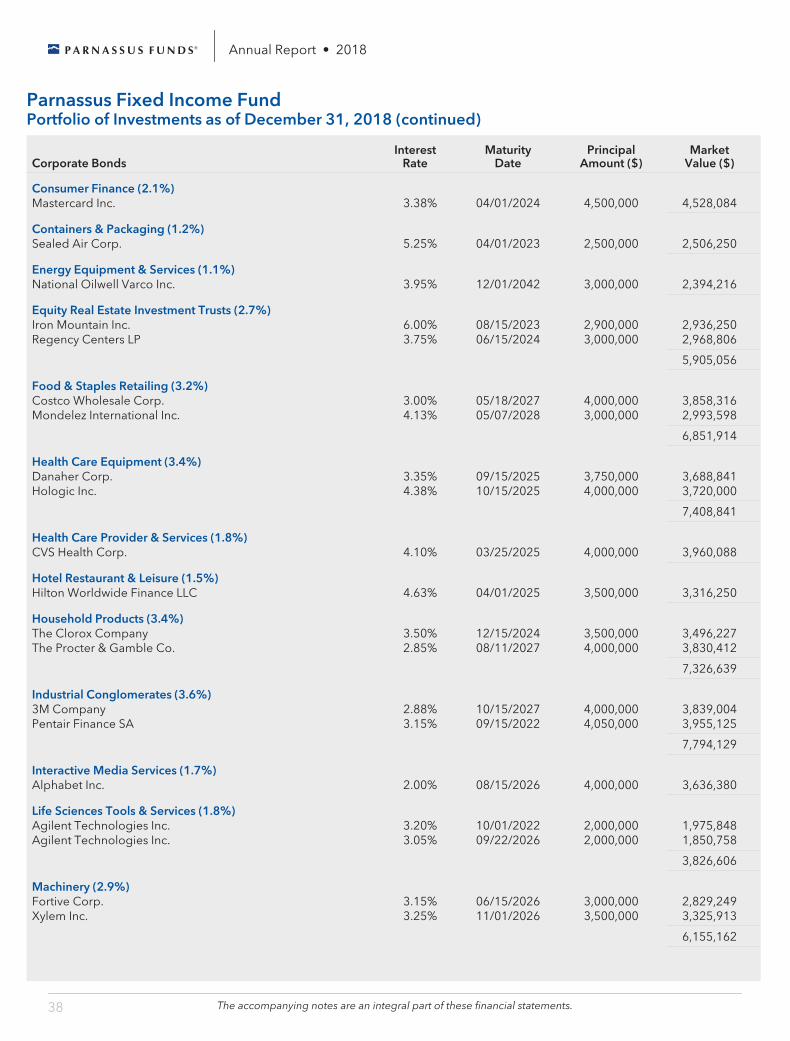
Annual Report • 2018
Parnassus Fixed Income Fund Portfolio of Investments as of December 31, 2018 (continued)
Corporate Bonds Interest
Rate Maturity
Date Principal
Amount ($) Market
Value ($)
Consumer Finance (2.1%) Mastercard Inc. 3.38% 04/01/2024 4,500,000 4,528,084
Containers & Packaging (1.2%) Sealed Air Corp. 5.25% 04/01/2023 2,500,000 2,506,250
Energy Equipment & Services (1.1%) National Oilwell Varco Inc. 3.95% 12/01/2042 3,000,000 2,394,216
Equity Real Estate Investment Trusts (2.7%) Iron Mountain Inc. 6.00% 08/15/2023 2,900,000 2,936,250 Regency Centers LP 3.75% 06/15/2024 3,000,000 2,968,806
5,905,056
Food & Staples Retailing (3.2%) Costco Wholesale Corp. 3.00% 05/18/2027 4,000,000 3,858,316 Mondelez International Inc. 4.13% 05/07/2028 3,000,000 2,993,598
6,851,914
Health Care Equipment (3.4%) Danaher Corp. 3.35% 09/15/2025 3,750,000 3,688,841 Hologic Inc. 4.38% 10/15/2025 4,000,000 3,720,000
7,408,841
Health Care Provider & Services (1.8%) CVS Health Corp. 4.10% 03/25/2025 4,000,000 3,960,088
Hotel Restaurant & Leisure (1.5%) Hilton Worldwide Finance LLC 4.63% 04/01/2025 3,500,000 3,316,250
Household Products (3.4%) The Clorox Company 3.50% 12/15/2024 3,500,000 3,496,227 The Procter & Gamble Co. 2.85% 08/11/2027 4,000,000 3,830,412
7,326,639
Industrial Conglomerates (3.6%) 3M Company 2.88% 10/15/2027 4,000,000 3,839,004 Pentair Finance SA 3.15% 09/15/2022 4,050,000 3,955,125
7,794,129
Interactive Media Services (1.7%) Alphabet Inc. 2.00% 08/15/2026 4,000,000 3,636,380
Life Sciences Tools & Services (1.8%) Agilent Technologies Inc. 3.20% 10/01/2022 2,000,000 1,975,848 Agilent Technologies Inc. 3.05% 09/22/2026 2,000,000 1,850,758
3,826,606
Machinery (2.9%) Fortive Corp. 3.15% 06/15/2026 3,000,000 2,829,249 Xylem Inc. 3.25% 11/01/2026 3,500,000 3,325,913
6,155,162
The accompanying notes are an integral part of these financial statements. 38
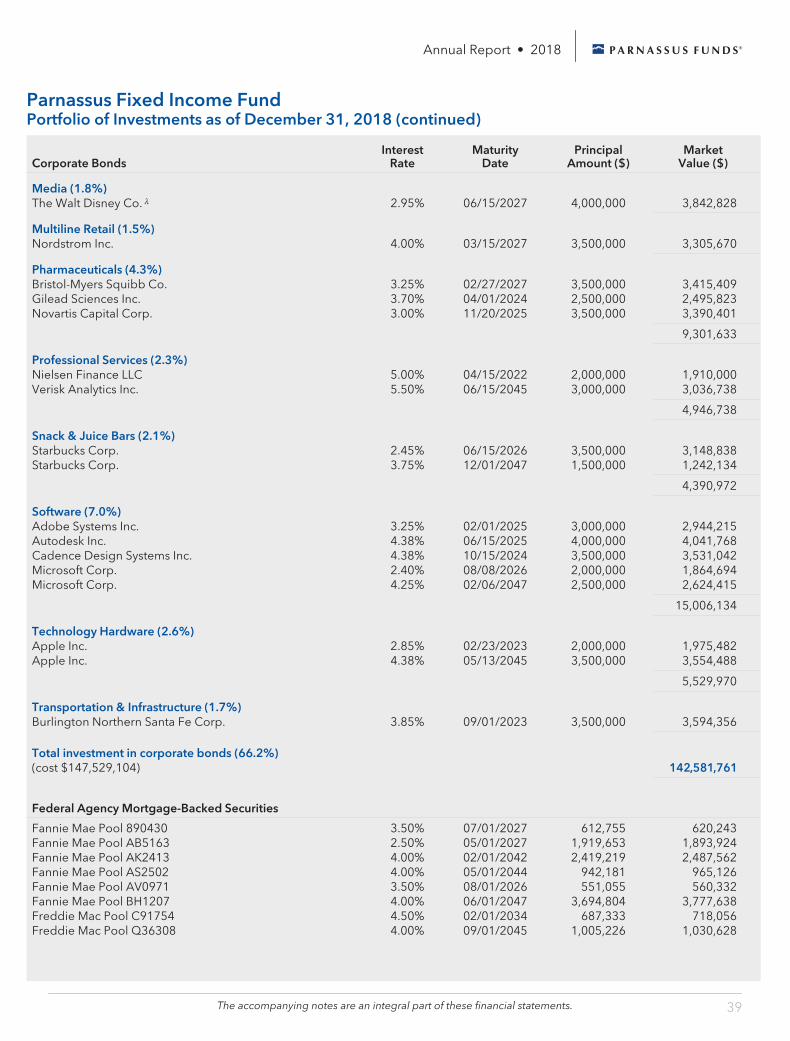
Annual Report • 2018
Parnassus Fixed Income Fund Portfolio of Investments as of December 31, 2018 (continued)
Corporate Bonds Interest
Rate Maturity
Date Principal
Amount ($) Market
Value ($)
Media (1.8%) The Walt Disney Co. λ 2.95% 06/15/2027 4,000,000 3,842,828
Multiline Retail (1.5%) Nordstrom Inc. 4.00% 03/15/2027 3,500,000 3,305,670
Pharmaceuticals (4.3%) Bristol-Myers Squibb Co. 3.25% 02/27/2027 3,500,000 3,415,409 Gilead Sciences Inc. 3.70% 04/01/2024 2,500,000 2,495,823 Novartis Capital Corp. 3.00% 11/20/2025 3,500,000 3,390,401
9,301,633
Professional Services (2.3%) Nielsen Finance LLC 5.00% 04/15/2022 2,000,000 1,910,000 Verisk Analytics Inc. 5.50% 06/15/2045 3,000,000 3,036,738
4,946,738
Snack & Juice Bars (2.1%) Starbucks Corp. 2.45% 06/15/2026 3,500,000 3,148,838 Starbucks Corp. 3.75% 12/01/2047 1,500,000 1,242,134
4,390,972
Software (7.0%) Adobe Systems Inc. 3.25% 02/01/2025 3,000,000 2,944,215 Autodesk Inc. 4.38% 06/15/2025 4,000,000 4,041,768 Cadence Design Systems Inc. 4.38% 10/15/2024 3,500,000 3,531,042 Microsoft Corp. 2.40% 08/08/2026 2,000,000 1,864,694 Microsoft Corp. 4.25% 02/06/2047 2,500,000 2,624,415
15,006,134
Technology Hardware (2.6%) Apple Inc. 2.85% 02/23/2023 2,000,000 1,975,482 Apple Inc. 4.38% 05/13/2045 3,500,000 3,554,488
5,529,970
Transportation & Infrastructure (1.7%) Burlington Northern Santa Fe Corp. 3.85% 09/01/2023 3,500,000 3,594,356
Total investment in corporate bonds (66.2%) (cost $147,529,104) 142,581,761
Federal Agency Mortgage-Backed Securities
Fannie Mae Pool 890430 3.50% 07/01/2027 612,755 620,243 Fannie Mae Pool AB5163 2.50% 05/01/2027 1,919,653 1,893,924 Fannie Mae Pool AK2413 4.00% 02/01/2042 2,419,219 2,487,562 Fannie Mae Pool AS2502 4.00% 05/01/2044 942,181 965,126 Fannie Mae Pool AV0971 3.50% 08/01/2026 551,055 560,332 Fannie Mae Pool BH1207 4.00% 06/01/2047 3,694,804 3,777,638 Freddie Mac Pool C91754 4.50% 02/01/2034 687,333 718,056 Freddie Mac Pool Q36308 4.00% 09/01/2045 1,005,226 1,030,628
The accompanying notes are an integral part of these financial statements. 39
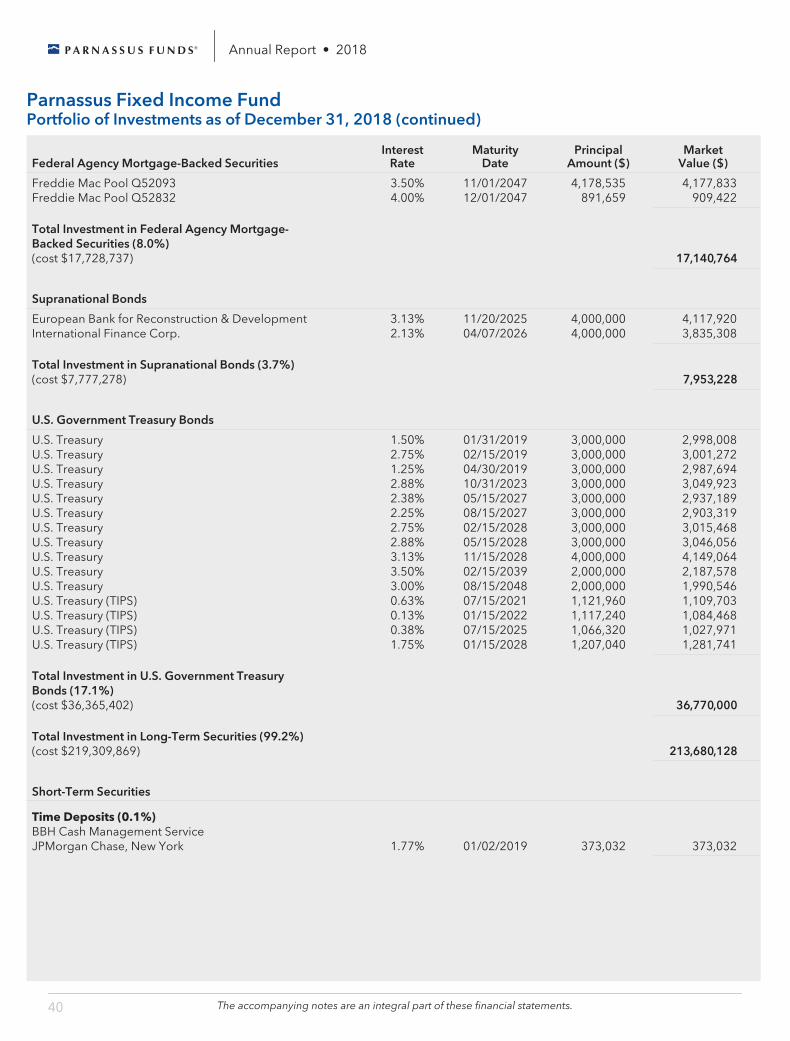
Annual Report • 2018
Parnassus Fixed Income Fund Portfolio of Investments as of December 31, 2018 (continued)
Federal Agency Mortgage-Backed Securities Interest
Rate Maturity
Date Principal
Amount ($) Market
Value ($)
Freddie Mac Pool Q52093 3.50% 11/01/2047 4,178,535 4,177,833 Freddie Mac Pool Q52832 4.00% 12/01/2047 891,659 909,422
Total Investment in Federal Agency Mortgage-Backed Securities (8.0%) (cost $17,728,737) 17,140,764
Supranational Bonds
European Bank for Reconstruction & Development 3.13% 11/20/2025 4,000,000 4,117,920 International Finance Corp. 2.13% 04/07/2026 4,000,000 3,835,308
Total Investment in Supranational Bonds (3.7%) (cost $7,777,278) 7,953,228
U.S. Government Treasury Bonds
U.S. Treasury 1.50% 01/31/2019 3,000,000 2,998,008 U.S. Treasury 2.75% 02/15/2019 3,000,000 3,001,272 U.S. Treasury 1.25% 04/30/2019 3,000,000 2,987,694 U.S. Treasury 2.88% 10/31/2023 3,000,000 3,049,923 U.S. Treasury 2.38% 05/15/2027 3,000,000 2,937,189 U.S. Treasury 2.25% 08/15/2027 3,000,000 2,903,319 U.S. Treasury 2.75% 02/15/2028 3,000,000 3,015,468 U.S. Treasury 2.88% 05/15/2028 3,000,000 3,046,056 U.S. Treasury 3.13% 11/15/2028 4,000,000 4,149,064 U.S. Treasury 3.50% 02/15/2039 2,000,000 2,187,578 U.S. Treasury 3.00% 08/15/2048 2,000,000 1,990,546 U.S. Treasury (TIPS) 0.63% 07/15/2021 1,121,960 1,109,703 U.S. Treasury (TIPS) 0.13% 01/15/2022 1,117,240 1,084,468 U.S. Treasury (TIPS) 0.38% 07/15/2025 1,066,320 1,027,971 U.S. Treasury (TIPS) 1.75% 01/15/2028 1,207,040 1,281,741
Total Investment in U.S. Government Treasury Bonds (17.1%) (cost $36,365,402) 36,770,000
Total Investment in Long-Term Securities (99.2%) (cost $219,309,869) 213,680,128
Short-Term Securities
Time Deposits (0.1%) BBH Cash Management Service JPMorgan Chase, New York 1.77% 01/02/2019 373,032 373,032
The accompanying notes are an integral part of these financial statements. 40
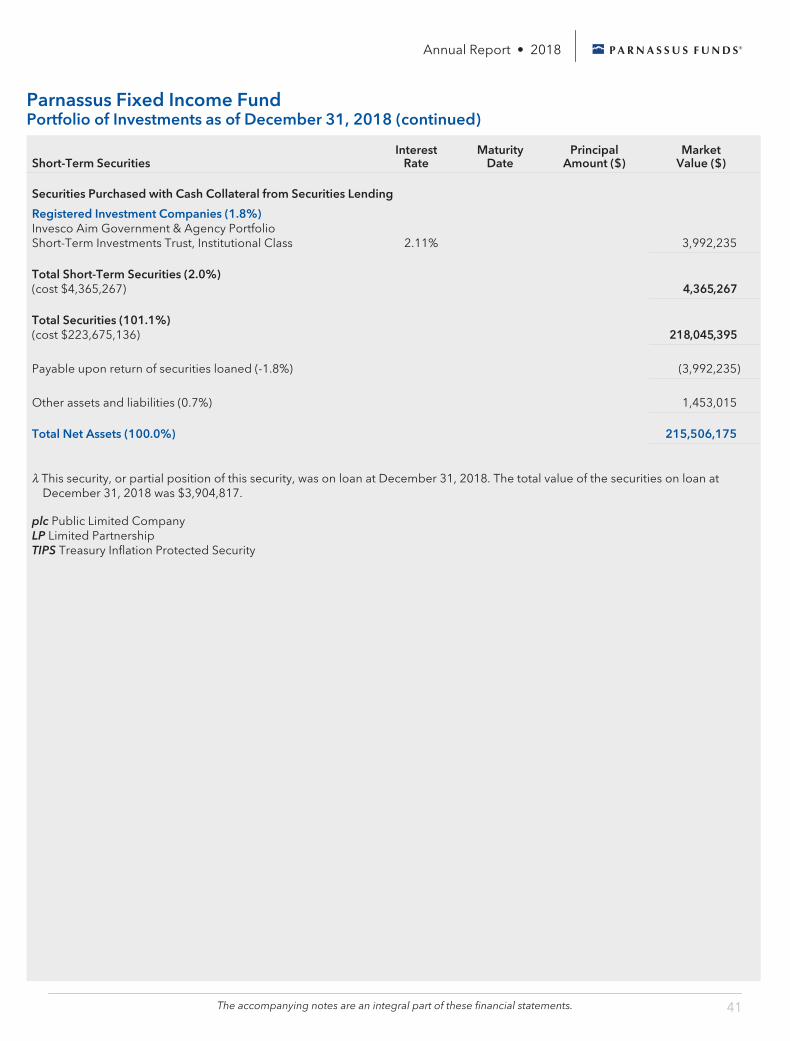
Annual Report • 2018
Parnassus Fixed Income Fund Portfolio of Investments as of December 31, 2018 (continued)
Short-Term Securities Interest
Rate Maturity
Date Principal
Amount ($) Market
Value ($)
Securities Purchased with Cash Collateral from Securities Lending
Registered Investment Companies (1.8%) Invesco Aim Government & Agency Portfolio Short-Term Investments Trust, Institutional Class 2.11% 3,992,235
Total Short-Term Securities (2.0%) (cost $4,365,267) 4,365,267
Total Securities (101.1%) (cost $223,675,136) 218,045,395
Payable upon return of securities loaned (-1.8%) (3,992,235)
Other assets and liabilities (0.7%) 1,453,015
Total Net Assets (100.0%) 215,506,175
λ This security, or partial position of this security, was on loan at December 31, 2018. The total value of the securities on loan at
December 31, 2018 was $3,904,817.
plc Public Limited Company LP Limited Partnership TIPS Treasury Inflation Protected Security
The accompanying notes are an integral part of these financial statements. 41
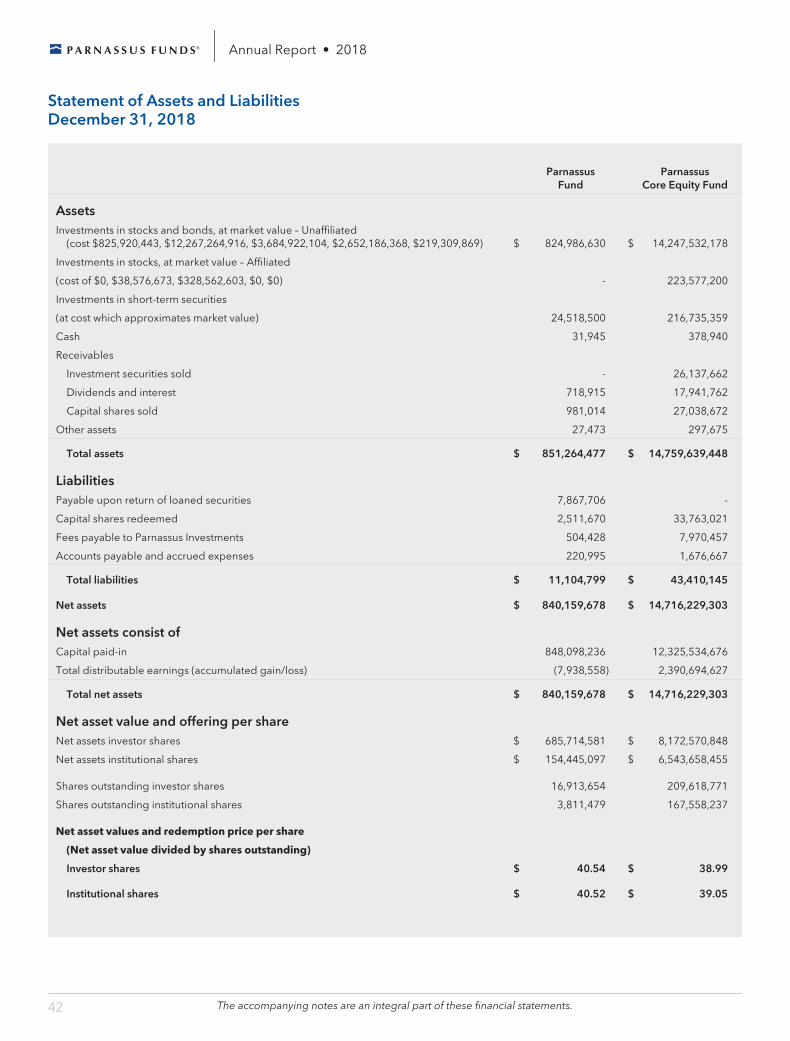
Annual Report • 2018
Statement of Assets and Liabilities December 31, 2018
Parnassus
Fund Parnassus
Core Equity Fund
Assets Investments in stocks and bonds, at market value – Unaffiliated
(cost $825,920,443, $12,267,264,916, $3,684,922,104, $2,652,186,368, $219,309,869) $ 824,986,630 $ 14,247,532,178
Investments in stocks, at market value – Affiliated
(cost of $0, $38,576,673, $328,562,603, $0, $0) - 223,577,200
Investments in short-term securities
(at cost which approximates market value) 24,518,500 216,735,359
Cash 31,945 378,940
Receivables
Investment securities sold - 26,137,662
Dividends and interest 718,915 17,941,762
Capital shares sold 981,014 27,038,672
Other assets 27,473 297,675
Total assets $ 851,264,477 $ 14,759,639,448
Liabilities Payable upon return of loaned securities 7,867,706 -
Capital shares redeemed 2,511,670 33,763,021
Fees payable to Parnassus Investments 504,428 7,970,457
Accounts payable and accrued expenses 220,995 1,676,667
Total liabilities $ 11,104,799 $ 43,410,145
Net assets $ 840,159,678 $ 14,716,229,303
Net assets consist of Capital paid-in 848,098,236 12,325,534,676
Total distributable earnings (accumulated gain/loss) (7,938,558) 2,390,694,627
Total net assets $ 840,159,678 $ 14,716,229,303
Net asset value and offering per share Net assets investor shares $ 685,714,581 $ 8,172,570,848
Net assets institutional shares $ 154,445,097 $ 6,543,658,455
Shares outstanding investor shares 16,913,654 209,618,771
Shares outstanding institutional shares 3,811,479 167,558,237
Net asset values and redemption price per share
(Net asset value divided by shares outstanding)
Investor shares $ 40.54 $ 38.99
Institutional shares $ 40.52 $ 39.05
The accompanying notes are an integral part of these financial statements. 42
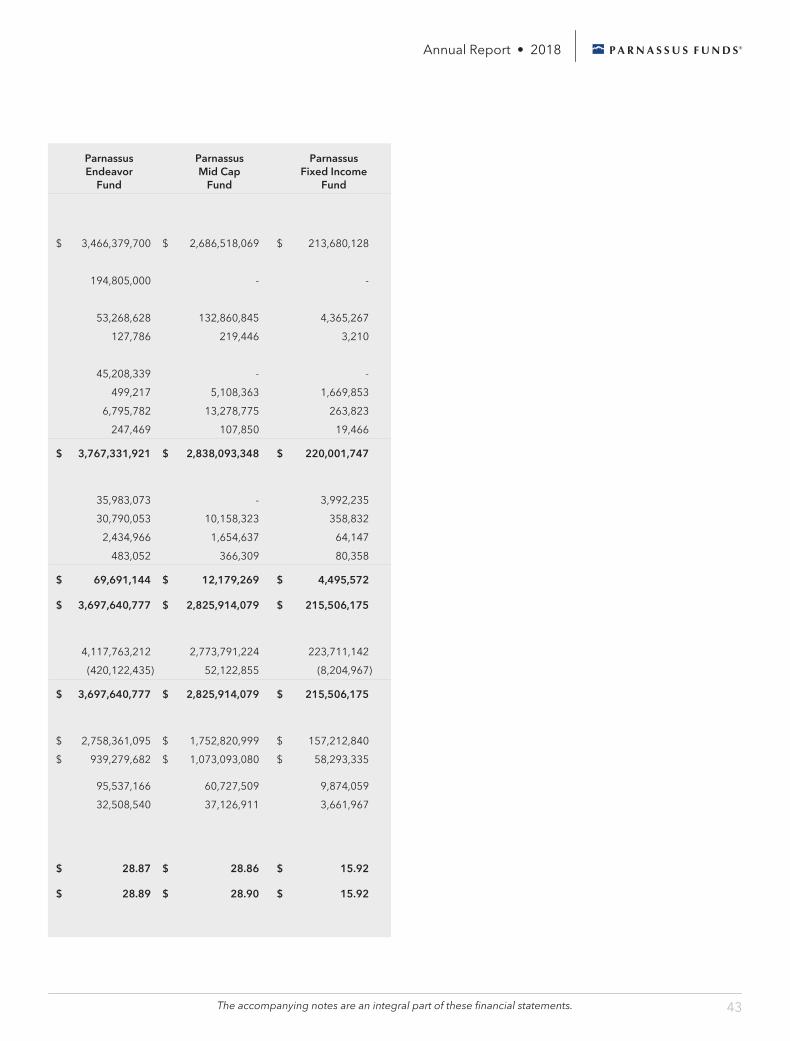
Annual Report • 2018
Parnassus Endeavor
Fund
Parnassus Mid Cap
Fund
Parnassus Fixed Income
Fund
$ 3,466,379,700 $ 2,686,518,069 $ 213,680,128
194,805,000 - -
53,268,628 132,860,845 4,365,267
127,786 219,446 3,210
45,208,339 - -
499,217 5,108,363 1,669,853
6,795,782 13,278,775 263,823
247,469 107,850 19,466
$ 3,767,331,921 $ 2,838,093,348 $ 220,001,747
35,983,073 - 3,992,235
30,790,053 10,158,323 358,832
2,434,966 1,654,637 64,147
483,052 366,309 80,358
$ 69,691,144 $ 12,179,269 $ 4,495,572
$ 3,697,640,777 $ 2,825,914,079 $ 215,506,175
4,117,763,212 2,773,791,224 223,711,142
(420,122,435) 52,122,855 (8,204,967)
$ 3,697,640,777 $ 2,825,914,079 $ 215,506,175
$ 2,758,361,095 $ 1,752,820,999 $ 157,212,840
$ 939,279,682 $ 1,073,093,080 $ 58,293,335
95,537,166 60,727,509 9,874,059
32,508,540 37,126,911 3,661,967
$ 28.87 $ 28.86 $ 15.92
$ 28.89 $ 28.90 $ 15.92
The accompanying notes are an integral part of these financial statements. 43
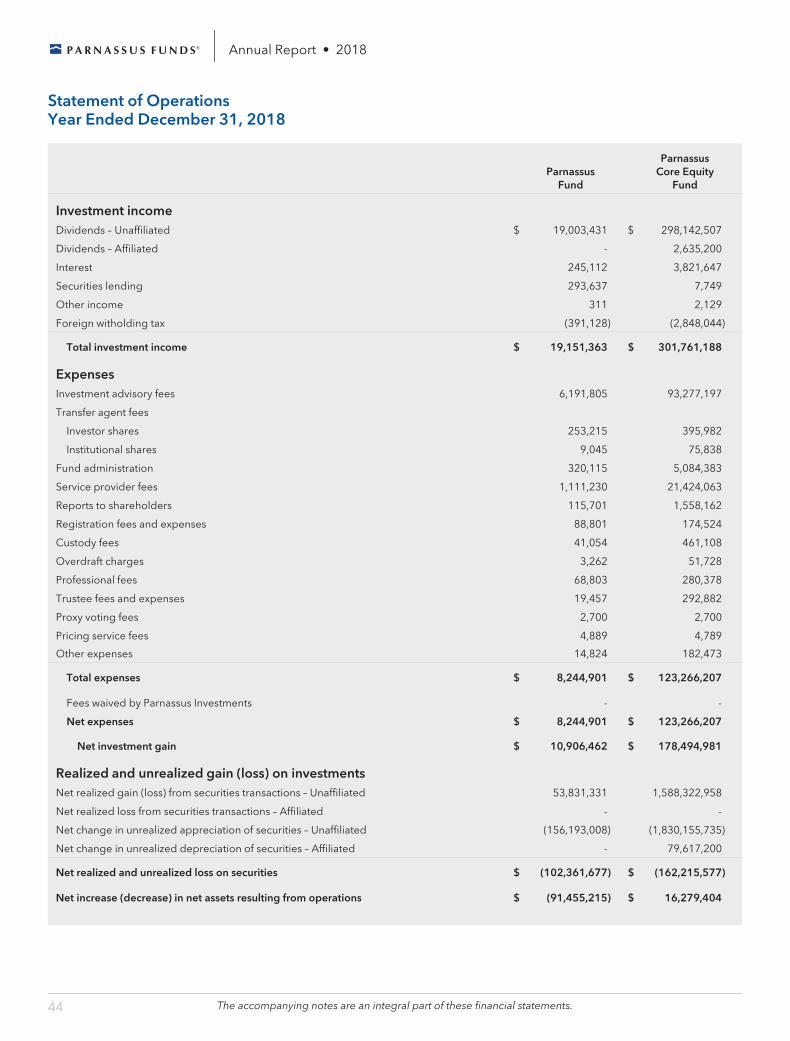
Annual Report • 2018
Statement of Operations Year Ended December 31, 2018
Parnassus
Fund
Parnassus Core Equity
Fund
Investment income Dividends – Unaffiliated $ 19,003,431 $ 298,142,507
Dividends – Affiliated - 2,635,200
Interest 245,112 3,821,647
Securities lending 293,637 7,749
Other income 311 2,129
Foreign witholding tax (391,128) (2,848,044)
Total investment income $ 19,151,363 $ 301,761,188
Expenses Investment advisory fees 6,191,805 93,277,197
Transfer agent fees
Investor shares 253,215 395,982
Institutional shares 9,045 75,838
Fund administration 320,115 5,084,383
Service provider fees 1,111,230 21,424,063
Reports to shareholders 115,701 1,558,162
Registration fees and expenses 88,801 174,524
Custody fees 41,054 461,108
Overdraft charges 3,262 51,728
Professional fees 68,803 280,378
Trustee fees and expenses 19,457 292,882
Proxy voting fees 2,700 2,700
Pricing service fees 4,889 4,789
Other expenses 14,824 182,473
Total expenses $ 8,244,901 $ 123,266,207
Fees waived by Parnassus Investments - -
Net expenses $ 8,244,901 $ 123,266,207
Net investment gain $ 10,906,462 $ 178,494,981
Realized and unrealized gain (loss) on investments Net realized gain (loss) from securities transactions – Unaffiliated 53,831,331 1,588,322,958
Net realized loss from securities transactions – Affiliated - -
Net change in unrealized appreciation of securities – Unaffiliated (156,193,008) (1,830,155,735)
Net change in unrealized depreciation of securities – Affiliated - 79,617,200
Net realized and unrealized loss on securities $ (102,361,677) $ (162,215,577)
Net increase (decrease) in net assets resulting from operations $ (91,455,215) $ 16,279,404
The accompanying notes are an integral part of these financial statements. 44
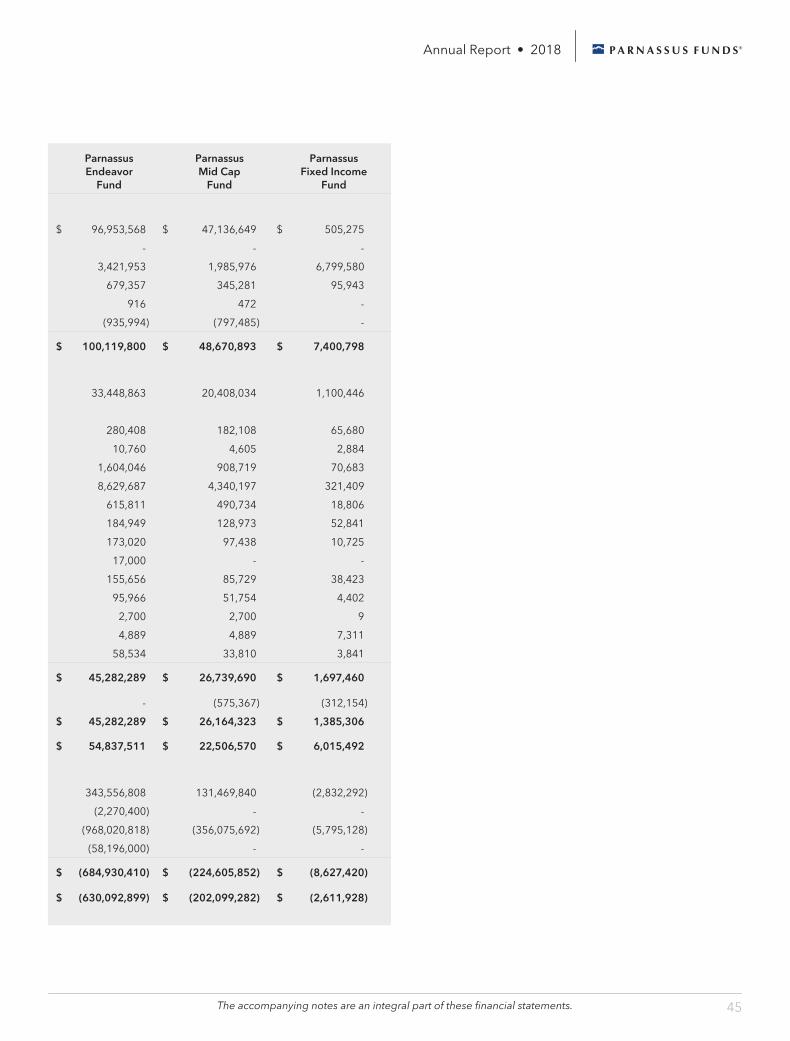
Annual Report • 2018
Parnassus Endeavor
Fund
Parnassus Mid Cap
Fund
Parnassus Fixed Income
Fund
$ 96,953,568 $ 47,136,649 $ 505,275
- - -
3,421,953 1,985,976 6,799,580
679,357 345,281 95,943
916 472 -
(935,994) (797,485) -
$ 100,119,800 $ 48,670,893 $ 7,400,798
33,448,863 20,408,034 1,100,446
280,408 182,108 65,680
10,760 4,605 2,884
1,604,046 908,719 70,683
8,629,687 4,340,197 321,409
615,811 490,734 18,806
184,949 128,973 52,841
173,020 97,438 10,725
17,000 - -
155,656 85,729 38,423
95,966 51,754 4,402
2,700 2,700 9
4,889 4,889 7,311
58,534 33,810 3,841
$ 45,282,289 $ 26,739,690 $ 1,697,460
- (575,367) (312,154)
$ 45,282,289 $ 26,164,323 $ 1,385,306
$ 54,837,511 $ 22,506,570 $ 6,015,492
343,556,808 131,469,840 (2,832,292)
(2,270,400) - -
(968,020,818) (356,075,692) (5,795,128)
(58,196,000) - -
$ (684,930,410) $ (224,605,852) $ (8,627,420)
$ (630,092,899) $ (202,099,282) $ (2,611,928)
The accompanying notes are an integral part of these financial statements. 45
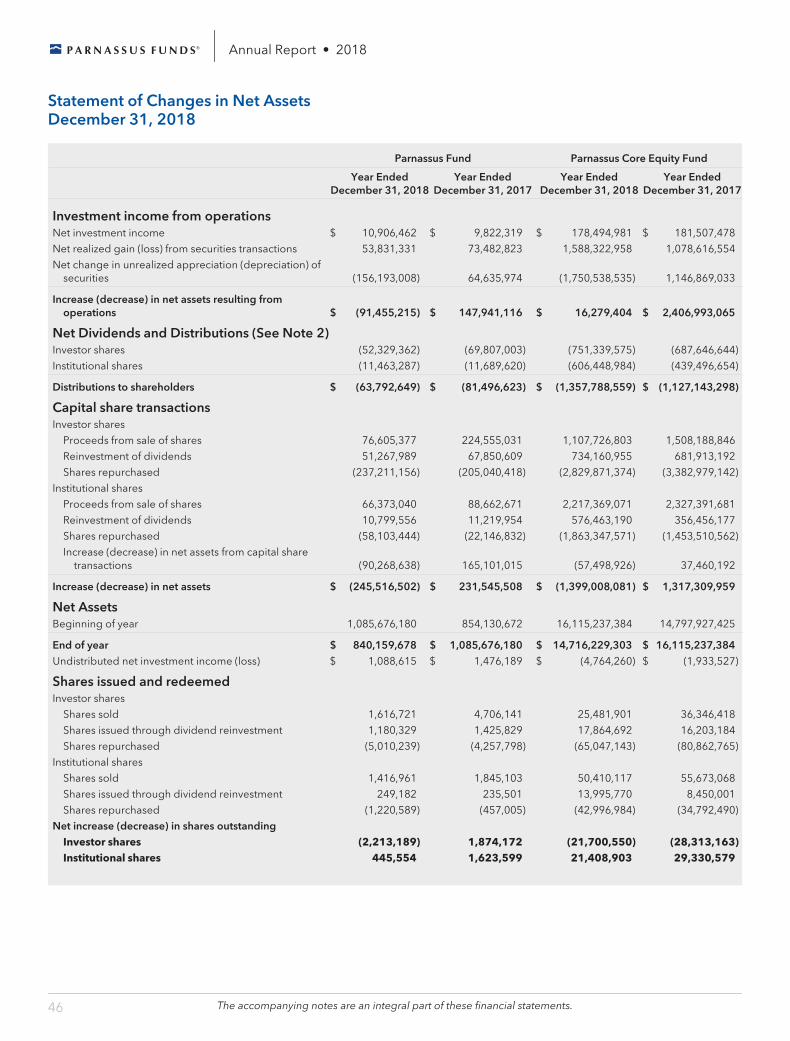
Annual Report • 2018
Statement of Changes in Net Assets December 31, 2018
Parnassus Fund Parnassus Core Equity Fund
Year Ended
December 31, 2018 Year Ended
December 31, 2017 Year Ended
December 31, 2018 Year Ended
December 31, 2017
Investment income from operations Net investment income $ 10,906,462 $ 9,822,319 $ 178,494,981 $ 181,507,478
Net realized gain (loss) from securities transactions 53,831,331 73,482,823 1,588,322,958 1,078,616,554
Net change in unrealized appreciation (depreciation) of securities (156,193,008) 64,635,974 (1,750,538,535) 1,146,869,033
Increase (decrease) in net assets resulting from operations $ (91,455,215) $ 147,941,116 $ 16,279,404 $ 2,406,993,065
Net Dividends and Distributions (See Note 2) Investor shares (52,329,362) (69,807,003) (751,339,575) (687,646,644)
Institutional shares (11,463,287) (11,689,620) (606,448,984) (439,496,654)
Distributions to shareholders $ (63,792,649) $ (81,496,623) $ (1,357,788,559) $ (1,127,143,298)
Capital share transactions Investor shares
Proceeds from sale of shares 76,605,377 224,555,031 1,107,726,803 1,508,188,846
Reinvestment of dividends 51,267,989 67,850,609 734,160,955 681,913,192
Shares repurchased (237,211,156) (205,040,418) (2,829,871,374) (3,382,979,142)
Institutional shares
Proceeds from sale of shares 66,373,040 88,662,671 2,217,369,071 2,327,391,681
Reinvestment of dividends 10,799,556 11,219,954 576,463,190 356,456,177
Shares repurchased (58,103,444) (22,146,832) (1,863,347,571) (1,453,510,562)
Increase (decrease) in net assets from capital share transactions (90,268,638) 165,101,015 (57,498,926) 37,460,192
Increase (decrease) in net assets $ (245,516,502) $ 231,545,508 $ (1,399,008,081) $ 1,317,309,959
Net Assets Beginning of year 1,085,676,180 854,130,672 16,115,237,384 14,797,927,425
End of year $ 840,159,678 $ 1,085,676,180 $ 14,716,229,303 $ 16,115,237,384 Undistributed net investment income (loss) $ 1,088,615 $ 1,476,189 $ (4,764,260) $ (1,933,527)
Shares issued and redeemed Investor shares
Shares sold 1,616,721 4,706,141 25,481,901 36,346,418
Shares issued through dividend reinvestment 1,180,329 1,425,829 17,864,692 16,203,184
Shares repurchased (5,010,239) (4,257,798) (65,047,143) (80,862,765)
Institutional shares
Shares sold 1,416,961 1,845,103 50,410,117 55,673,068
Shares issued through dividend reinvestment 249,182 235,501 13,995,770 8,450,001
Shares repurchased (1,220,589) (457,005) (42,996,984) (34,792,490)
Net increase (decrease) in shares outstanding Investor shares (2,213,189) 1,874,172 (21,700,550) (28,313,163) Institutional shares 445,554 1,623,599 21,408,903 29,330,579
The accompanying notes are an integral part of these financial statements. 46
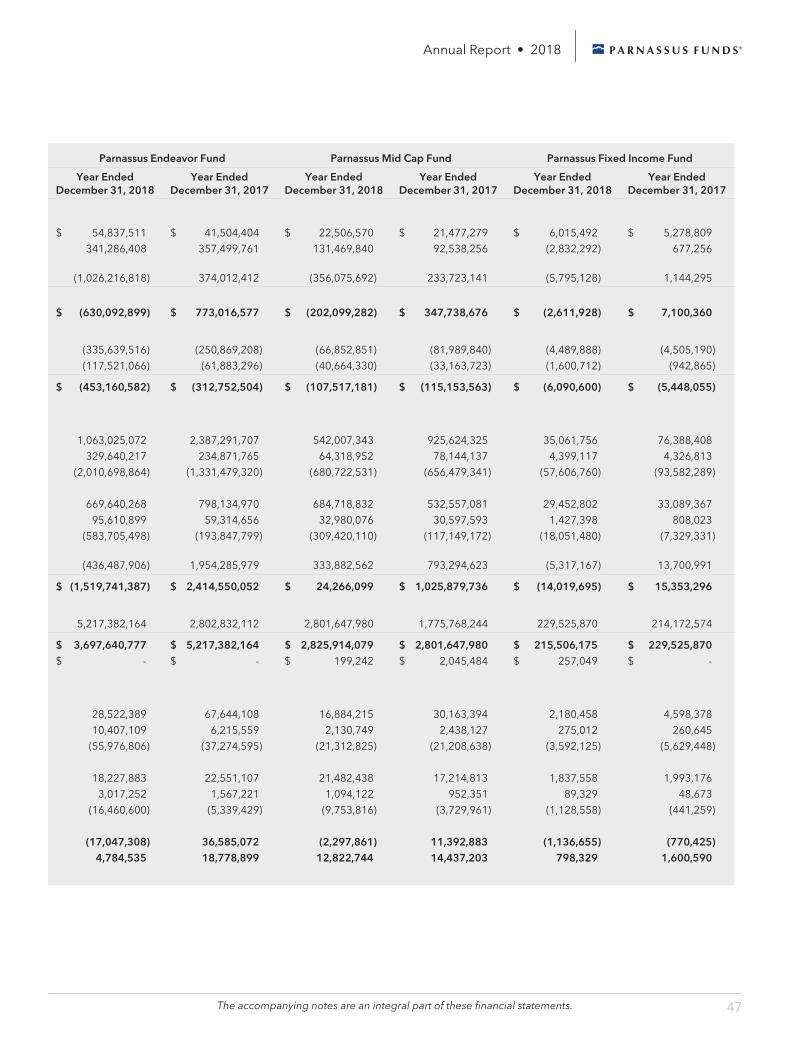
Annual Report • 2018
Parnassus Endeavor Fund Parnassus Mid Cap Fund Parnassus Fixed Income Fund
Year Ended December 31, 2018
Year Ended December 31, 2017
Year Ended December 31, 2018
Year Ended December 31, 2017
Year Ended December 31, 2018
Year Ended December 31, 2017
$ 54,837,511 $ 41,504,404 $ 22,506,570 $ 21,477,279 $ 6,015,492 $ 5,278,809
341,286,408 357,499,761 131,469,840 92,538,256 (2,832,292) 677,256
(1,026,216,818) 374,012,412 (356,075,692) 233,723,141 (5,795,128) 1,144,295
$ (630,092,899) $ 773,016,577 $ (202,099,282) $ 347,738,676 $ (2,611,928) $ 7,100,360
(335,639,516) (250,869,208) (66,852,851) (81,989,840) (4,489,888) (4,505,190)
(117,521,066) (61,883,296) (40,664,330) (33,163,723) (1,600,712) (942,865)
$ (453,160,582) $ (312,752,504) $ (107,517,181) $ (115,153,563) $ (6,090,600) $ (5,448,055)
1,063,025,072 2,387,291,707 542,007,343 925,624,325 35,061,756 76,388,408
329,640,217 234,871,765 64,318,952 78,144,137 4,399,117 4,326,813
(2,010,698,864) (1,331,479,320) (680,722,531) (656,479,341) (57,606,760) (93,582,289)
669,640,268 798,134,970 684,718,832 532,557,081 29,452,802 33,089,367
95,610,899 59,314,656 32,980,076 30,597,593 1,427,398 808,023
(583,705,498) (193,847,799) (309,420,110) (117,149,172) (18,051,480) (7,329,331)
(436,487,906) 1,954,285,979 333,882,562 793,294,623 (5,317,167) 13,700,991
$ (1,519,741,387) $ 2,414,550,052 $ 24,266,099 $ 1,025,879,736 $ (14,019,695) $ 15,353,296
5,217,382,164 2,802,832,112 2,801,647,980 1,775,768,244 229,525,870 214,172,574
$ 3,697,640,777 $ 5,217,382,164 $ 2,825,914,079 $ 2,801,647,980 $ 215,506,175 $ 229,525,870 $ - $ - $ 199,242 $ 2,045,484 $ 257,049 $ -
28,522,389 67,644,108 16,884,215 30,163,394 2,180,458 4,598,378
10,407,109 6,215,559 2,130,749 2,438,127 275,012 260,645
(55,976,806) (37,274,595) (21,312,825) (21,208,638) (3,592,125) (5,629,448)
18,227,883 22,551,107 21,482,438 17,214,813 1,837,558 1,993,176
3,017,252 1,567,221 1,094,122 952,351 89,329 48,673
(16,460,600) (5,339,429) (9,753,816) (3,729,961) (1,128,558) (441,259)
(17,047,308) 36,585,072 (2,297,861) 11,392,883 (1,136,655) (770,425) 4,784,535 18,778,899 12,822,744 14,437,203 798,329 1,600,590
The accompanying notes are an integral part of these financial statements. 47
Annual Report • 2018
Notes to Financial Statements
1. Organization The Parnassus Funds are comprised of two Trusts, the Parnassus Funds trust and the Parnassus Income Funds trust (collectively the “Trusts”), organized as Massachusetts Business Trusts registered under the Investment Company Act of 1940 as diversified, open-end investment management companies, and are comprised of five separate funds (collectively the “Funds”). The Parnassus Funds trust includes the Parnassus Fund, which commenced operations on December 27, 1984, the Parnassus Endeavor Fund and the Parnassus Mid Cap Fund, both of which commenced operations on April 29, 2005. The Parnassus Income Funds trust includes the Parnassus Core Equity Fund and the Parnassus Fixed Income Fund, both of which commenced operations on August 31, 1992. Each Fund has distinct investment objectives. In general, each of the Funds seeks long-term capital appreciation. Prior to May 1, 2014, the Parnassus Core Equity Fund was known as the Parnassus Equity Income Fund, and the Parnassus Endeavor Fund was known as the Parnassus Workplace Fund.
2. Significant Accounting Policies The Funds are investment companies that apply the accounting and reporting guidance issued in Topic 946 by the U.S. Financial Accounting Standards Board. The presentation of the financial statements is made using specialized accounting principles applicable to investment companies.
Short-Term Securities Short-term securities represent investments of excess cash and consist of time deposits, community development loans, certificates of deposit and money market funds.
Security Transactions and Related Investment Income and Expenses Securities transactions are recorded on the date the securities are purchased or sold (trade date). Realized gains and losses on securities transactions are determined on the basis of first-in, first-out for both financial statement and federal income tax purposes. Dividend income is recognized on the ex-dividend date and interest income is recognized on an accrual basis. Discounts and premiums on securities purchased are amortized over the lives of the respective securities using the constant yield method, which approximates the interest method. Expenses are recorded on an accrual basis.
Class Allocations Income, fees and expenses (other than class-specific fees and expenses) and realized and unrealized gains and losses are allocated daily among the various shares classes based on their relative net assets. Class-specific fees and expenses, such as broker service fees, administrative and shareholder services, are charged directly to the respective share class.
Dividends and Distributions to Shareholders Dividends and distributions to shareholders are recorded on the ex-dividend date to shareholders of record on the record date. The Parnassus Core Equity Fund pays income dividends quarterly and capital-gain dividends annually. The Parnassus Fixed Income Fund pays income dividends monthly and capital-gain dividends annually. The other Funds pay income and capital-gain dividends annually.
Effective with the current reporting period, it is no longer required to present certain line items on the Statements of Changes in Net Assets. Such disclosure
48
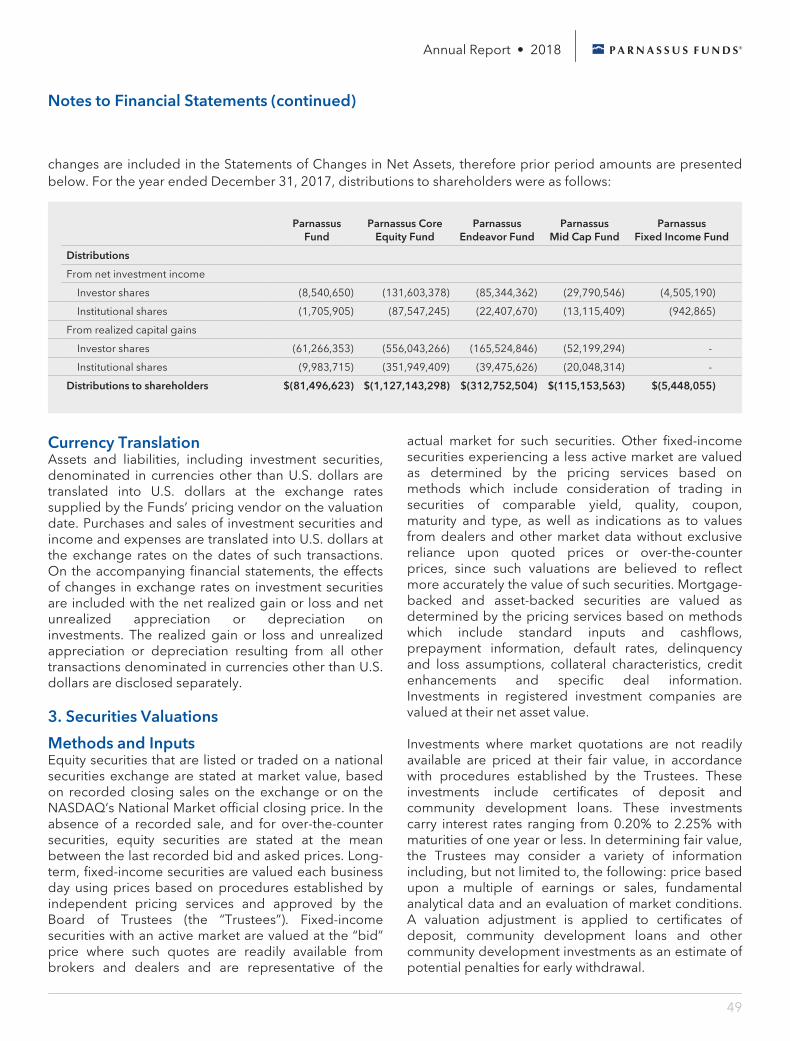
Annual Report • 2018
Notes to Financial Statements (continued)
changes are included in the Statements of Changes in Net Assets, therefore prior period amounts are presented below. For the year ended December 31, 2017, distributions to shareholders were as follows:
Parnassus
Fund Parnassus Core
Equity Fund Parnassus
Endeavor Fund Parnassus
Mid Cap Fund Parnassus
Fixed Income Fund
Distributions
From net investment income
Investor shares (8,540,650) (131,603,378) (85,344,362) (29,790,546) (4,505,190)
Institutional shares (1,705,905) (87,547,245) (22,407,670) (13,115,409) (942,865)
From realized capital gains
Investor shares (61,266,353) (556,043,266) (165,524,846) (52,199,294) -
Institutional shares (9,983,715) (351,949,409) (39,475,626) (20,048,314) -
Distributions to shareholders $(81,496,623) $(1,127,143,298) $(312,752,504) $(115,153,563) $(5,448,055)
Currency Translation Assets and liabilities, including investment securities, denominated in currencies other than U.S. dollars are translated into U.S. dollars at the exchange rates supplied by the Funds’ pricing vendor on the valuation date. Purchases and sales of investment securities and income and expenses are translated into U.S. dollars at the exchange rates on the dates of such transactions. On the accompanying financial statements, the effects of changes in exchange rates on investment securities are included with the net realized gain or loss and net unrealized appreciation or depreciation on investments. The realized gain or loss and unrealized appreciation or depreciation resulting from all other transactions denominated in currencies other than U.S. dollars are disclosed separately.
3. Securities Valuations
Methods and Inputs Equity securities that are listed or traded on a national securities exchange are stated at market value, based on recorded closing sales on the exchange or on the NASDAQ’s National Market official closing price. In the absence of a recorded sale, and for over-the-counter securities, equity securities are stated at the mean between the last recorded bid and asked prices. Long-term, fixed-income securities are valued each business day using prices based on procedures established by independent pricing services and approved by the Board of Trustees (the “Trustees”). Fixed-income securities with an active market are valued at the “bid” price where such quotes are readily available from brokers and dealers and are representative of the
actual market for such securities. Other fixed-income securities experiencing a less active market are valued as determined by the pricing services based on methods which include consideration of trading in securities of comparable yield, quality, coupon, maturity and type, as well as indications as to values from dealers and other market data without exclusive reliance upon quoted prices or over-the-counter prices, since such valuations are believed to reflect more accurately the value of such securities. Mortgage-backed and asset-backed securities are valued as determined by the pricing services based on methods which include standard inputs and cashflows, prepayment information, default rates, delinquency and loss assumptions, collateral characteristics, credit enhancements and specific deal information. Investments in registered investment companies are valued at their net asset value.
Investments where market quotations are not readily available are priced at their fair value, in accordance with procedures established by the Trustees. These investments include certificates of deposit and community development loans. These investments carry interest rates ranging from 0.20% to 2.25% with maturities of one year or less. In determining fair value, the Trustees may consider a variety of information including, but not limited to, the following: price based upon a multiple of earnings or sales, fundamental analytical data and an evaluation of market conditions. A valuation adjustment is applied to certificates of deposit, community development loans and other community development investments as an estimate of potential penalties for early withdrawal.
49
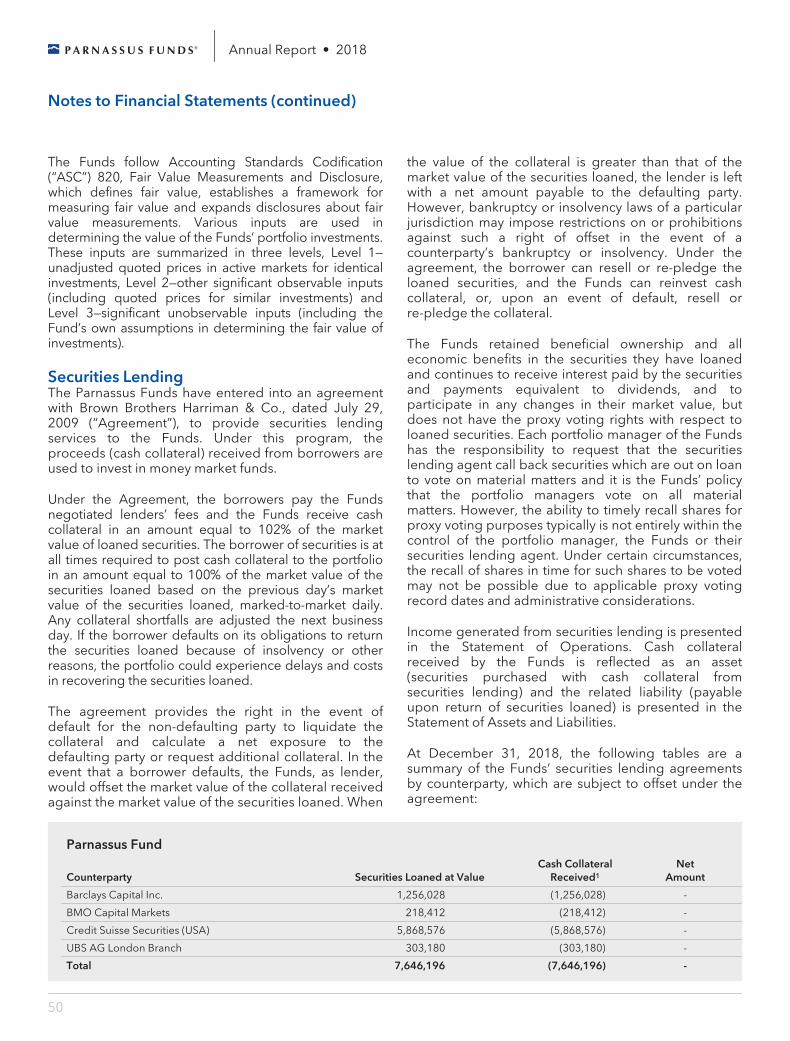
Annual Report • 2018
Notes to Financial Statements (continued)
The Funds follow Accounting Standards Codification (“ASC”) 820, Fair Value Measurements and Disclosure, which defines fair value, establishes a framework for measuring fair value and expands disclosures about fair value measurements. Various inputs are used in determining the value of the Funds’ portfolio investments. These inputs are summarized in three levels, Level 1—unadjusted quoted prices in active markets for identical investments, Level 2—other significant observable inputs (including quoted prices for similar investments) and Level 3—significant unobservable inputs (including the Fund’s own assumptions in determining the fair value of investments).
Securities Lending The Parnassus Funds have entered into an agreement with Brown Brothers Harriman & Co., dated July 29, 2009 (“Agreement”), to provide securities lending services to the Funds. Under this program, the proceeds (cash collateral) received from borrowers are used to invest in money market funds.
Under the Agreement, the borrowers pay the Funds negotiated lenders’ fees and the Funds receive cash collateral in an amount equal to 102% of the market value of loaned securities. The borrower of securities is at all times required to post cash collateral to the portfolio in an amount equal to 100% of the market value of the securities loaned based on the previous day’s market value of the securities loaned, marked-to-market daily. Any collateral shortfalls are adjusted the next business day. If the borrower defaults on its obligations to return the securities loaned because of insolvency or other reasons, the portfolio could experience delays and costs in recovering the securities loaned.
The agreement provides the right in the event of default for the non-defaulting party to liquidate the collateral and calculate a net exposure to the defaulting party or request additional collateral. In the event that a borrower defaults, the Funds, as lender, would offset the market value of the collateral received against the market value of the securities loaned. When
the value of the collateral is greater than that of the market value of the securities loaned, the lender is left with a net amount payable to the defaulting party. However, bankruptcy or insolvency laws of a particular jurisdiction may impose restrictions on or prohibitions against such a right of offset in the event of a counterparty’s bankruptcy or insolvency. Under the agreement, the borrower can resell or re-pledge the loaned securities, and the Funds can reinvest cash collateral, or, upon an event of default, resell or re-pledge the collateral.
The Funds retained beneficial ownership and all economic benefits in the securities they have loaned and continues to receive interest paid by the securities and payments equivalent to dividends, and to participate in any changes in their market value, but does not have the proxy voting rights with respect to loaned securities. Each portfolio manager of the Funds has the responsibility to request that the securities lending agent call back securities which are out on loan to vote on material matters and it is the Funds’ policy that the portfolio managers vote on all material matters. However, the ability to timely recall shares for proxy voting purposes typically is not entirely within the control of the portfolio manager, the Funds or their securities lending agent. Under certain circumstances, the recall of shares in time for such shares to be voted may not be possible due to applicable proxy voting record dates and administrative considerations.
Income generated from securities lending is presented in the Statement of Operations. Cash collateral received by the Funds is reflected as an asset (securities purchased with cash collateral from securities lending) and the related liability (payable upon return of securities loaned) is presented in the Statement of Assets and Liabilities.
At December 31, 2018, the following tables are a summary of the Funds’ securities lending agreements by counterparty, which are subject to offset under the agreement:
Parnassus Fund
Counterparty Securities Loaned at Value Cash Collateral
Received1 Net
Amount
Barclays Capital Inc. 1,256,028 (1,256,028) -
BMO Capital Markets 218,412 (218,412) -
Credit Suisse Securities (USA) 5,868,576 (5,868,576) -
UBS AG London Branch 303,180 (303,180) -
Total 7,646,196 (7,646,196) -
50
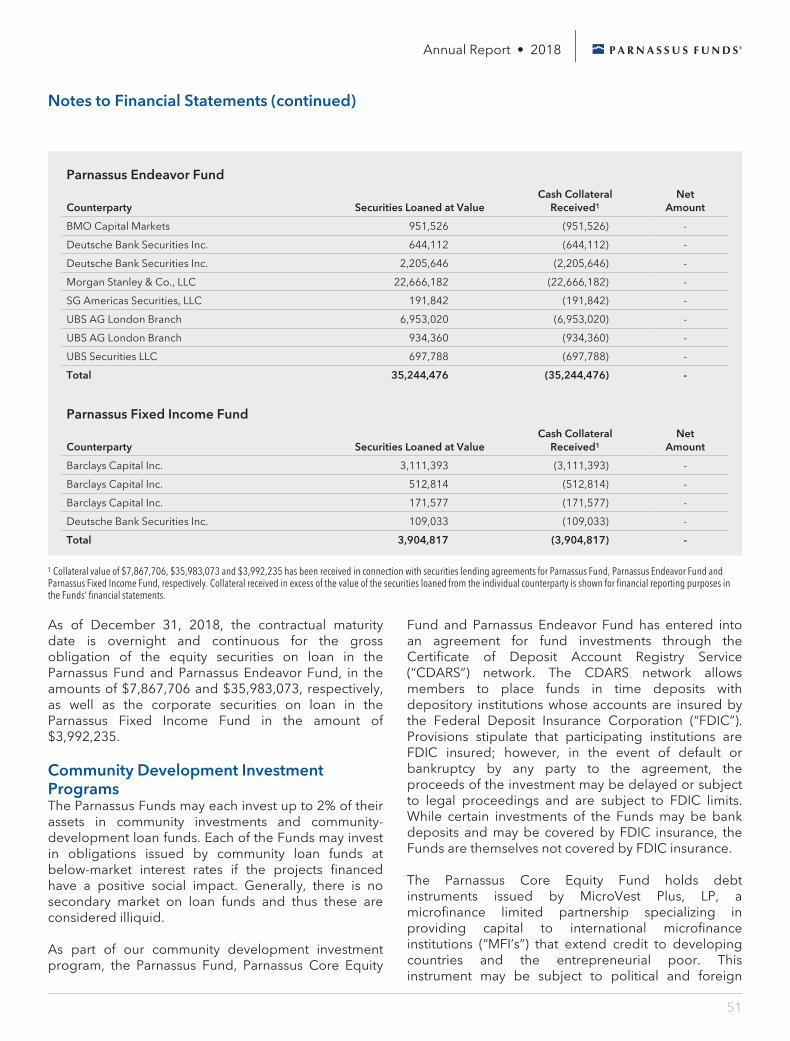
Annual Report • 2018
Notes to Financial Statements (continued)
Parnassus Endeavor Fund
Counterparty Securities Loaned at Value Cash Collateral
Received1 Net
Amount
BMO Capital Markets 951,526 (951,526) -
Deutsche Bank Securities Inc. 644,112 (644,112) -
Deutsche Bank Securities Inc. 2,205,646 (2,205,646) -
Morgan Stanley & Co., LLC 22,666,182 (22,666,182) -
SG Americas Securities, LLC 191,842 (191,842) -
UBS AG London Branch 6,953,020 (6,953,020) -
UBS AG London Branch 934,360 (934,360) -
UBS Securities LLC 697,788 (697,788) -
Total 35,244,476 (35,244,476) -
Parnassus Fixed Income Fund
Counterparty Securities Loaned at Value Cash Collateral
Received1 Net
Amount
Barclays Capital Inc. 3,111,393 (3,111,393) -
Barclays Capital Inc. 512,814 (512,814) -
Barclays Capital Inc. 171,577 (171,577) -
Deutsche Bank Securities Inc. 109,033 (109,033) -
Total 3,904,817 (3,904,817) -
1 Collateral value of $7,867,706, $35,983,073 and $3,992,235 has been received in connection with securities lending agreements for Parnassus Fund, Parnassus Endeavor Fund and Parnassus Fixed Income Fund, respectively. Collateral received in excess of the value of the securities loaned from the individual counterparty is shown for financial reporting purposes in the Funds’ financial statements.
As of December 31, 2018, the contractual maturity date is overnight and continuous for the gross obligation of the equity securities on loan in the Parnassus Fund and Parnassus Endeavor Fund, in the amounts of $7,867,706 and $35,983,073, respectively, as well as the corporate securities on loan in the Parnassus Fixed Income Fund in the amount of $3,992,235.
Community Development Investment Programs The Parnassus Funds may each invest up to 2% of their assets in community investments and community-development loan funds. Each of the Funds may invest in obligations issued by community loan funds at below-market interest rates if the projects financed have a positive social impact. Generally, there is no secondary market on loan funds and thus these are considered illiquid.
As part of our community development investment program, the Parnassus Fund, Parnassus Core Equity
Fund and Parnassus Endeavor Fund has entered into an agreement for fund investments through the Certificate of Deposit Account Registry Service (“CDARS”) network. The CDARS network allows members to place funds in time deposits with depository institutions whose accounts are insured by the Federal Deposit Insurance Corporation (“FDIC”). Provisions stipulate that participating institutions are FDIC insured; however, in the event of default or bankruptcy by any party to the agreement, the proceeds of the investment may be delayed or subject to legal proceedings and are subject to FDIC limits. While certain investments of the Funds may be bank deposits and may be covered by FDIC insurance, the Funds are themselves not covered by FDIC insurance.
The Parnassus Core Equity Fund holds debt instruments issued by MicroVest Plus, LP, a microfinance limited partnership specializing in providing capital to international microfinance institutions (“MFI’s”) that extend credit to developing countries and the entrepreneurial poor. This instrument may be subject to political and foreign
51
Annual Report • 2018
Notes to Financial Statements (continued)
currency exchange risk not normally associated with domestic debt instruments. MicroVest Plus, LP’s investment in MFI’s can be affected by, among other factors, commodity prices, inflation, interest rates, taxation, social instability, and other political, economic or diplomatic developments in or affecting the various countries where MFI’s operate.
Use of Estimates The preparation of financial statements in conformity with GAAP requires management to make estimates and assumptions that affect the reported amounts of assets and liabilities at the date of the financial statements and the reported amount of revenues and expenses during the reporting period. Actual results could differ from those estimates.
Subsequent Events Management has evaluated the impact of all subsequent events on the Funds through the date the financial statements were issued and has determined that there were no subsequent events requiring adjustment to or additional disclosure in the financial statements.
4. Risk Factors Investing in the Parnassus Funds may involve certain risks including, but not limited to the following:
Market Conditions The prices of, and the income generated by, the common stocks and other securities held by the Funds may decline in response to certain events taking place around the world, including those directly involving the companies whose securities are owned by the Funds; conditions affecting the general economy; overall market changes; local, regional or global political, social or economic instability; and currency, interest rate and commodity price fluctuations. Additionally, the values of, and the income generated by, most debt securities held by the Funds may be affected by changing interest rates and by changes in the effective maturities and credit ratings of these debt securities. The Funds’ investment adviser attempts to reduce these risks through diversification of the portfolio and ongoing credit analysis as well as by monitoring economic and legislative developments, but there can be no assurance that it will be successful at doing so. Investments in securities issued by entities based outside the U.S. may also be affected by currency controls; different accounting, auditing, financial
reporting, and legal standards and practices; expropriation; changes in tax policy; greater market volatility; different securities market structures and higher transaction costs.
Investing Outside the U.S. Securities of issuers domiciled outside the U.S., or with significant operations outside the U.S., may lose value because of political, social, economic or market developments or instability in the countries or regions in which the issuer operates. These securities may also lose value due to changes in foreign currency exchange rates against the U.S. dollar and/or currencies of other countries. Securities markets in certain countries may be more volatile and/or less liquid than those in the U.S. Investment outside the U.S. may also be subject to different settlement and accounting practices and different regulatory, legal and reporting standards, and may be more difficult to value, than those in the U.S. The risks of investing outside the U.S. may be heightened in connection with investments in emerging and developing countries.
Contractual Obligations Under the Trusts’ organizational documents, its officers and Trustees may be indemnified against certain liabilities and expenses arising out of the performance of their duties to the Trusts. Additionally, the Trusts have a variety of indemnification obligations under contracts with its service providers. The Trusts’ maximum exposure under these arrangements is unknown, as this would involve future claims that may be made against the Trusts that have not yet occurred.
5. Taxation and Distributions
Federal Income Taxes The Trusts intend to comply with the requirements of the Internal Revenue Code applicable to regulated investment companies and to distribute all taxable income to shareholders. Therefore, no federal income tax provision is required. Income distributions and capital-gain distributions are determined in accordance with income tax regulations, which may differ from U.S. Generally Accepted Accounting Principles (“GAAP”).
The Funds follow ASC 740, Income Taxes, relating to uncertainty in income taxes and disclosures. ASC 740 establishes a minimum threshold for income tax benefits to be recognized in the financial statements.
52
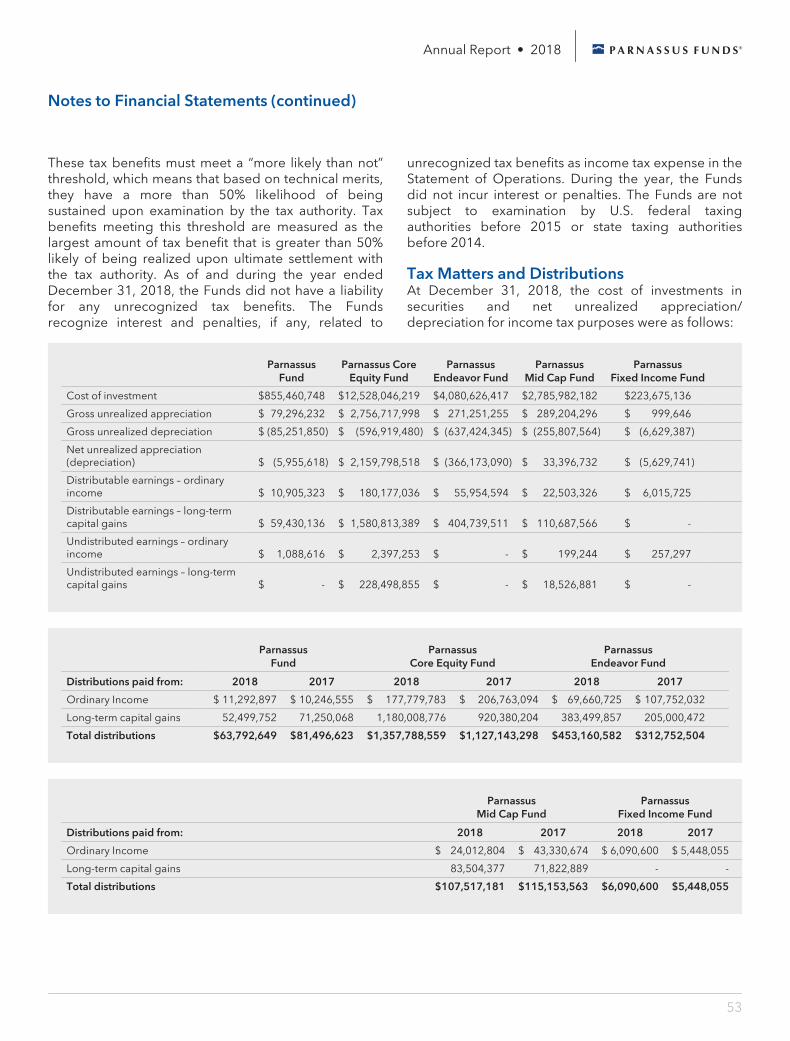
Annual Report • 2018
Notes to Financial Statements (continued)
These tax benefits must meet a “more likely than not” threshold, which means that based on technical merits, they have a more than 50% likelihood of being sustained upon examination by the tax authority. Tax benefits meeting this threshold are measured as the largest amount of tax benefit that is greater than 50% likely of being realized upon ultimate settlement with the tax authority. As of and during the year ended December 31, 2018, the Funds did not have a liability for any unrecognized tax benefits. The Funds recognize interest and penalties, if any, related to
unrecognized tax benefits as income tax expense in the Statement of Operations. During the year, the Funds did not incur interest or penalties. The Funds are not subject to examination by U.S. federal taxing authorities before 2015 or state taxing authorities before 2014.
Tax Matters and Distributions At December 31, 2018, the cost of investments in securities and net unrealized appreciation/depreciation for income tax purposes were as follows:
Parnassus
Fund Parnassus Core
Equity Fund Parnassus
Endeavor Fund Parnassus
Mid Cap Fund Parnassus
Fixed Income Fund
Cost of investment $855,460,748 $12,528,046,219 $4,080,626,417 $2,785,982,182 $223,675,136
Gross unrealized appreciation $ 79,296,232 $ 2,756,717,998 $ 271,251,255 $ 289,204,296 $ 999,646
Gross unrealized depreciation $ (85,251,850) $ (596,919,480) $ (637,424,345) $ (255,807,564) $ (6,629,387)
Net unrealized appreciation (depreciation) $ (5,955,618) $ 2,159,798,518 $ (366,173,090) $ 33,396,732 $ (5,629,741)
Distributable earnings – ordinary income $ 10,905,323 $ 180,177,036 $ 55,954,594 $ 22,503,326 $ 6,015,725
Distributable earnings – long-term capital gains $ 59,430,136 $ 1,580,813,389 $ 404,739,511 $ 110,687,566 $ -
Undistributed earnings – ordinary income $ 1,088,616 $ 2,397,253 $ - $ 199,244 $ 257,297
Undistributed earnings – long-term capital gains $ - $ 228,498,855 $ - $ 18,526,881 $ -
Parnassus
Fund Parnassus
Core Equity Fund Parnassus
Endeavor Fund
Distributions paid from: 2018 2017 2018 2017 2018 2017
Ordinary Income $ 11,292,897 $ 10,246,555 $ 177,779,783 $ 206,763,094 $ 69,660,725 $ 107,752,032
Long-term capital gains 52,499,752 71,250,068 1,180,008,776 920,380,204 383,499,857 205,000,472
Total distributions $63,792,649 $81,496,623 $1,357,788,559 $1,127,143,298 $453,160,582 $312,752,504
Parnassus
Mid Cap Fund Parnassus
Fixed Income Fund
Distributions paid from: 2018 2017 2018 2017
Ordinary Income $ 24,012,804 $ 43,330,674 $ 6,090,600 $ 5,448,055
Long-term capital gains 83,504,377 71,822,889 - -
Total distributions $107,517,181 $115,153,563 $6,090,600 $5,448,055
53
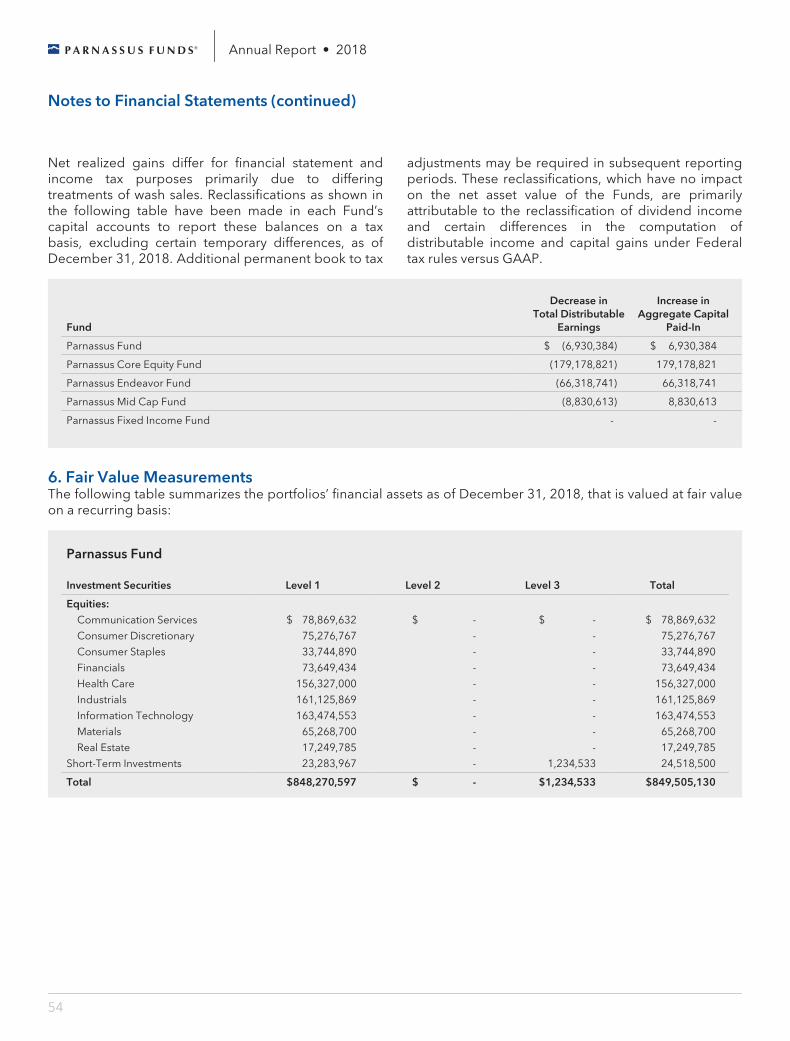
Annual Report • 2018
Notes to Financial Statements (continued)
Net realized gains differ for financial statement and income tax purposes primarily due to differing treatments of wash sales. Reclassifications as shown in the following table have been made in each Fund’s capital accounts to report these balances on a tax basis, excluding certain temporary differences, as of December 31, 2018. Additional permanent book to tax
adjustments may be required in subsequent reporting periods. These reclassifications, which have no impact on the net asset value of the Funds, are primarily attributable to the reclassification of dividend income and certain differences in the computation of distributable income and capital gains under Federal tax rules versus GAAP.
Fund
Decrease in Total Distributable
Earnings
Increase in Aggregate Capital
Paid-In
Parnassus Fund $ (6,930,384) $ 6,930,384
Parnassus Core Equity Fund (179,178,821) 179,178,821
Parnassus Endeavor Fund (66,318,741) 66,318,741
Parnassus Mid Cap Fund (8,830,613) 8,830,613
Parnassus Fixed Income Fund - -
6. Fair Value Measurements The following table summarizes the portfolios’ financial assets as of December 31, 2018, that is valued at fair value on a recurring basis:
Parnassus Fund
Investment Securities Level 1 Level 2 Level 3 Total
Equities:
Communication Services $ 78,869,632 $ - $ - $ 78,869,632
Consumer Discretionary 75,276,767 - - 75,276,767
Consumer Staples 33,744,890 - - 33,744,890
Financials 73,649,434 - - 73,649,434
Health Care 156,327,000 - - 156,327,000
Industrials 161,125,869 - - 161,125,869
Information Technology 163,474,553 - - 163,474,553
Materials 65,268,700 - - 65,268,700
Real Estate 17,249,785 - - 17,249,785
Short-Term Investments 23,283,967 - 1,234,533 24,518,500
Total $848,270,597 $ - $1,234,533 $849,505,130
54
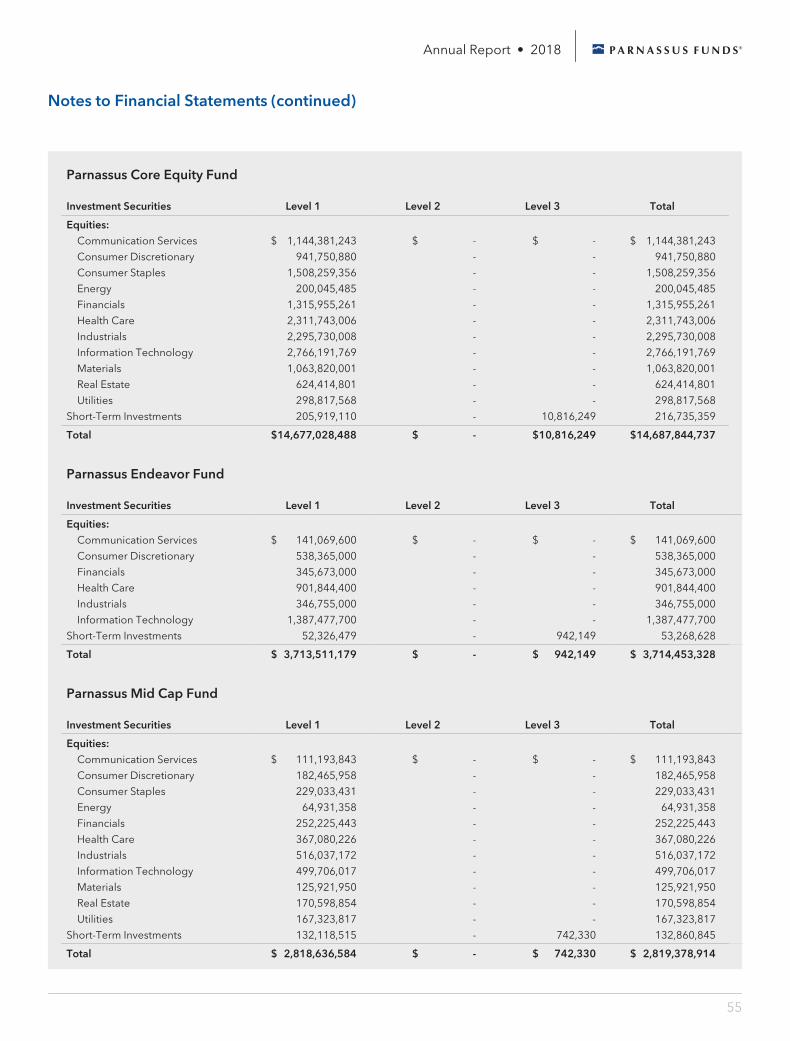
Annual Report • 2018
Notes to Financial Statements (continued)
Parnassus Core Equity Fund
Investment Securities Level 1 Level 2 Level 3 Total
Equities:
Communication Services $ 1,144,381,243 $ - $ - $ 1,144,381,243
Consumer Discretionary 941,750,880 - - 941,750,880
Consumer Staples 1,508,259,356 - - 1,508,259,356
Energy 200,045,485 - - 200,045,485
Financials 1,315,955,261 - - 1,315,955,261
Health Care 2,311,743,006 - - 2,311,743,006
Industrials 2,295,730,008 - - 2,295,730,008
Information Technology 2,766,191,769 - - 2,766,191,769
Materials 1,063,820,001 - - 1,063,820,001
Real Estate 624,414,801 - - 624,414,801
Utilities 298,817,568 - - 298,817,568
Short-Term Investments 205,919,110 - 10,816,249 216,735,359
Total $14,677,028,488 $ - $10,816,249 $14,687,844,737
Parnassus Endeavor Fund
Investment Securities Level 1 Level 2 Level 3 Total
Equities: Communication Services $ 141,069,600 $ - $ - $ 141,069,600
Consumer Discretionary 538,365,000 - - 538,365,000
Financials 345,673,000 - - 345,673,000
Health Care 901,844,400 - - 901,844,400
Industrials 346,755,000 - - 346,755,000
Information Technology 1,387,477,700 - - 1,387,477,700
Short-Term Investments 52,326,479 - 942,149 53,268,628
Total $ 3,713,511,179 $ - $ 942,149 $ 3,714,453,328
Parnassus Mid Cap Fund
Investment Securities Level 1 Level 2 Level 3 Total
Equities: Communication Services $ 111,193,843 $ - $ - $ 111,193,843
Consumer Discretionary 182,465,958 - - 182,465,958
Consumer Staples 229,033,431 - - 229,033,431
Energy 64,931,358 - - 64,931,358
Financials 252,225,443 - - 252,225,443
Health Care 367,080,226 - - 367,080,226
Industrials 516,037,172 - - 516,037,172
Information Technology 499,706,017 - - 499,706,017
Materials 125,921,950 - - 125,921,950
Real Estate 170,598,854 - - 170,598,854
Utilities 167,323,817 - - 167,323,817
Short-Term Investments 132,118,515 - 742,330 132,860,845
Total $ 2,818,636,584 $ - $ 742,330 $ 2,819,378,914
55
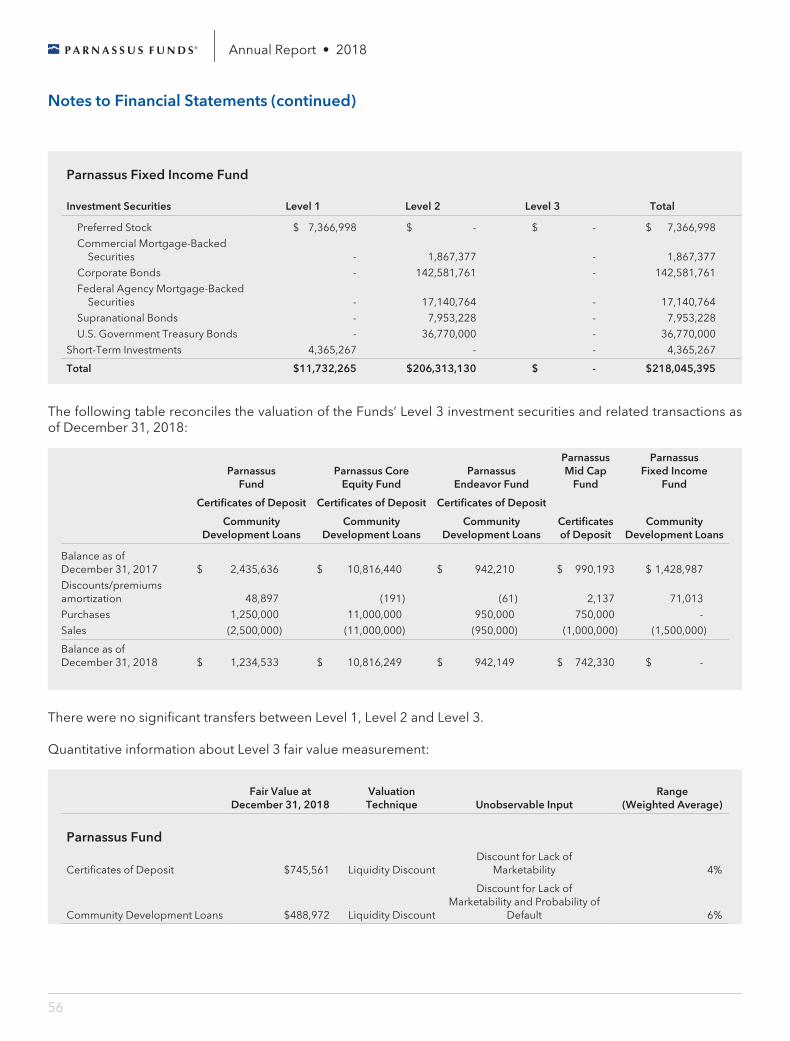
Annual Report • 2018
Notes to Financial Statements (continued)
Parnassus Fixed Income Fund
Investment Securities Level 1 Level 2 Level 3 Total
Preferred Stock $ 7,366,998 $ - $ - $ 7,366,998
Commercial Mortgage-Backed Securities - 1,867,377 - 1,867,377
Corporate Bonds - 142,581,761 - 142,581,761
Federal Agency Mortgage-Backed Securities - 17,140,764 - 17,140,764
Supranational Bonds - 7,953,228 - 7,953,228
U.S. Government Treasury Bonds - 36,770,000 - 36,770,000
Short-Term Investments 4,365,267 - - 4,365,267
Total $11,732,265 $206,313,130 $ - $218,045,395
The following table reconciles the valuation of the Funds’ Level 3 investment securities and related transactions as of December 31, 2018:
Parnassus
Fund Parnassus Core
Equity Fund Parnassus
Endeavor Fund
Parnassus Mid Cap
Fund
Parnassus Fixed Income
Fund
Certificates of Deposit Certificates of Deposit Certificates of Deposit
Community
Development Loans Community
Development Loans Community
Development Loans Certificates of Deposit
Community Development Loans
Balance as of December 31, 2017 $ 2,435,636 $ 10,816,440 $ 942,210 $ 990,193 $ 1,428,987
Discounts/premiums amortization 48,897 (191) (61) 2,137 71,013
Purchases 1,250,000 11,000,000 950,000 750,000 -
Sales (2,500,000) (11,000,000) (950,000) (1,000,000) (1,500,000)
Balance as of December 31, 2018 $ 1,234,533 $ 10,816,249 $ 942,149 $ 742,330 $ -
There were no significant transfers between Level 1, Level 2 and Level 3.
Quantitative information about Level 3 fair value measurement:
Fair Value at
December 31, 2018 Valuation Technique Unobservable Input
Range (Weighted Average)
Parnassus Fund
Certificates of Deposit $745,561 Liquidity Discount Discount for Lack of
Marketability 4%
Community Development Loans $488,972 Liquidity Discount
Discount for Lack of Marketability and Probability of
Default 6%
56
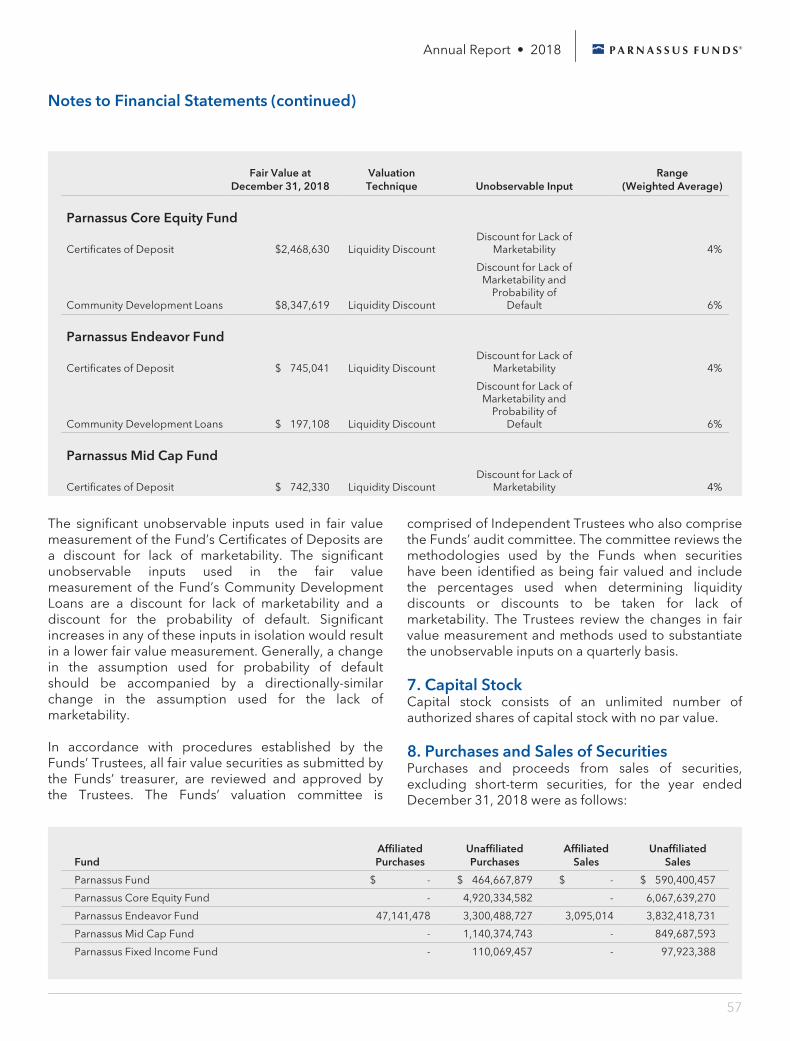
Annual Report • 2018
Notes to Financial Statements (continued)
Fair Value at
December 31, 2018 Valuation Technique Unobservable Input
Range (Weighted Average)
Parnassus Core Equity Fund
Certificates of Deposit $2,468,630 Liquidity Discount Discount for Lack of
Marketability 4%
Community Development Loans $8,347,619 Liquidity Discount
Discount for Lack of Marketability and
Probability of Default 6%
Parnassus Endeavor Fund
Certificates of Deposit $ 745,041 Liquidity Discount Discount for Lack of
Marketability 4%
Community Development Loans $ 197,108 Liquidity Discount
Discount for Lack of Marketability and
Probability of Default 6%
Parnassus Mid Cap Fund
Certificates of Deposit $ 742,330 Liquidity Discount Discount for Lack of
Marketability 4%
The significant unobservable inputs used in fair value measurement of the Fund’s Certificates of Deposits are a discount for lack of marketability. The significant unobservable inputs used in the fair value measurement of the Fund’s Community Development Loans are a discount for lack of marketability and a discount for the probability of default. Significant increases in any of these inputs in isolation would result in a lower fair value measurement. Generally, a change in the assumption used for probability of default should be accompanied by a directionally-similar change in the assumption used for the lack of marketability.
In accordance with procedures established by the Funds’ Trustees, all fair value securities as submitted by the Funds’ treasurer, are reviewed and approved by the Trustees. The Funds’ valuation committee is
comprised of Independent Trustees who also comprise the Funds’ audit committee. The committee reviews the methodologies used by the Funds when securities have been identified as being fair valued and include the percentages used when determining liquidity discounts or discounts to be taken for lack of marketability. The Trustees review the changes in fair value measurement and methods used to substantiate the unobservable inputs on a quarterly basis.
7. Capital Stock Capital stock consists of an unlimited number of authorized shares of capital stock with no par value.
8. Purchases and Sales of Securities Purchases and proceeds from sales of securities, excluding short-term securities, for the year ended December 31, 2018 were as follows:
Fund Affiliated Purchases
Unaffiliated Purchases
Affiliated Sales
Unaffiliated Sales
Parnassus Fund $ - $ 464,667,879 $ - $ 590,400,457
Parnassus Core Equity Fund - 4,920,334,582 - 6,067,639,270
Parnassus Endeavor Fund 47,141,478 3,300,488,727 3,095,014 3,832,418,731
Parnassus Mid Cap Fund - 1,140,374,743 - 849,687,593
Parnassus Fixed Income Fund - 110,069,457 - 97,923,388
57
Annual Report • 2018
Notes to Financial Statements (continued)
The above includes purchases and sales of U.S. Government securities in the amount of $32,856,211 and $33,199,297, respectively, within the Parnassus Fixed Income Fund.
9. Investment Advisory Agreement and Transactions with Affiliates Under terms of an agreement which provides for furnishing investment management and advice to the Funds, Parnassus Investments is entitled to receive fees payable monthly, based on each Fund’s average daily net assets for the month, at the following annual rates:
Parnassus Fund: 0.70% of the first $100,000,000, 0.65% of the next $100,000,000 and 0.60% of the amount above $200,000,000. Parnassus Endeavor Fund: 0.85% of the first $100,000,000, 0.80% of the next $100,000,000, 0.75% of the next $300,000,000 and 0.65% of the amount above $500,000,000. Parnassus Mid Cap Fund: 0.85% of the first $100,000,000, 0.80% of the next $100,000,000, 0.75% of the next $300,000,000 and 0.70% of the amount above $500,000,000. For the year ended December 31, 2018, Parnassus Investments has contractually agreed to limit total operating expenses to 0.99% of the net assets of the Parnassus Fund – Investor Shares and to 0.94% of the net assets of the Parnassus Fund – Institutional Shares, 0.95% of net assets for the Parnassus Endeavor Fund – Investor Shares and to 0.83% of net assets for the Parnassus Endeavor Fund Institutional Shares, 0.99% of net assets for the Parnassus Mid Cap Fund – Investor Shares and to 0.85% of net assets for the Parnassus Mid Cap Fund – Institutional Shares.
Parnassus Core Equity Fund: 0.75% of the first $30,000,000, 0.70% of the next $70,000,000, 0.65% of the next $400,000,000, 0.60% of the next $9,500,000,000 and 0.55% of the amount above $10,000,000,000. Parnassus Fixed Income Fund: 0.50% of the first $200,000,000, 0.45% of the next $200,000,000 and 0.40% of the amount above $400,000,000. For the year ended December 31, 2018, Parnassus Investments has contractually agreed to limit total operating expenses to 0.87% of net assets of the Parnassus Core Equity Fund – Investor Shares and to 0.78% of net assets for the Parnassus Core Equity Fund
– Institutional Shares and 0.68% of net assets for the Parnassus Fixed Income Fund – Investor Shares and to 0.58% of net assets for the Parnassus Fixed Income Fund – Institutional Shares.
Parnassus Investments receives fees under terms of a separate agreement which provides for furnishing transfer agent and fund administration services to the Funds. The transfer agent fee was $2.50 per month per account plus any out-of-pocket expenses for the Parnassus Fund, Parnassus Endeavor Fund and Parnassus Mid Cap Fund. The transfer agent fee was $2.70 per month per account plus any out-of-pocket expenses for the Parnassus Core Equity Fund and Parnassus Fixed Income Fund. The Funds pay the monthly fee based on the number of accounts on record at each month-end. The fund administration reflects annual rates based on net assets for all Funds managed by Parnassus Investments and was allocated based on respective Fund net assets at the following annual rates: 0.08% of the first $500,000,000, 0.07% of the next $500,000,000 and 0.03% of the amount above $1,000,000,000. The fund administration services fee was 0.03% of average net assets under this new agreement for the year ended December 31, 2018.
Parnassus Investments may also arrange for third parties to provide certain services, including account maintenance, recordkeeping and other personal services to their clients who invest in the Funds. For these services, the Parnassus Funds – Investor Shares may pay service providers an aggregate service fee on investment accounts at a rate not to exceed 0.25% per annum of average daily net assets. The Parnassus Funds – Institutional Shares do not incur service provider fees.
10. Investments in affiliates The 1940 Act defines “affiliated companies” to include investments in portfolio companies in which a Fund owns 5% or more of the outstanding voting shares. During the year ended December 31, 2018, the Funds below held 5% or more of the outstanding voting shares of the noted portfolio companies. During this period, other Funds in the Trust may also have held voting shares of the issuers at a level below 5%.
58
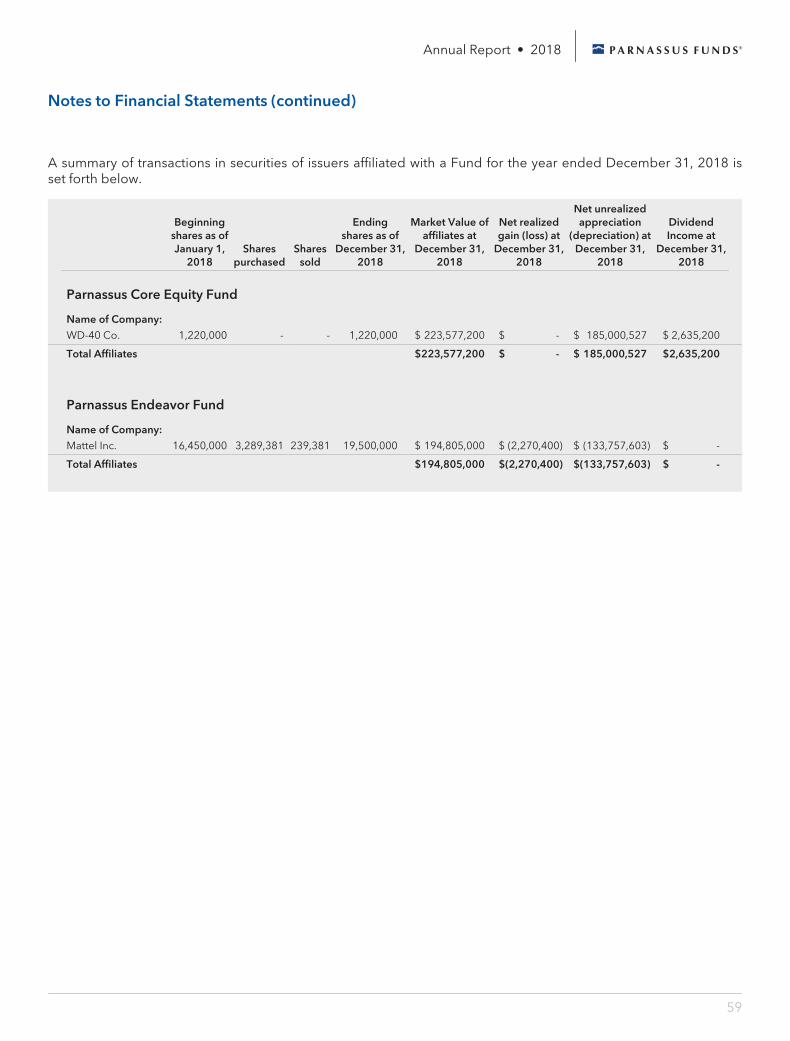
Annual Report • 2018
Notes to Financial Statements (continued)
A summary of transactions in securities of issuers affiliated with a Fund for the year ended December 31, 2018 is set forth below.
Beginning shares as of January 1,
2018 Shares
purchased Shares
sold
Ending shares as of
December 31, 2018
Market Value of affiliates at
December 31, 2018
Net realized gain (loss) at
December 31, 2018
Net unrealized appreciation
(depreciation) at December 31,
2018
Dividend Income at
December 31, 2018
Parnassus Core Equity Fund
Name of Company: WD-40 Co. 1,220,000 - - 1,220,000 $ 223,577,200 $ - $ 185,000,527 $ 2,635,200
Total Affiliates $223,577,200 $ - $ 185,000,527 $2,635,200
Parnassus Endeavor Fund
Name of Company: Mattel Inc. 16,450,000 3,289,381 239,381 19,500,000 $ 194,805,000 $ (2,270,400) $ (133,757,603) $ -
Total Affiliates $194,805,000 $(2,270,400) $(133,757,603) $ -
59
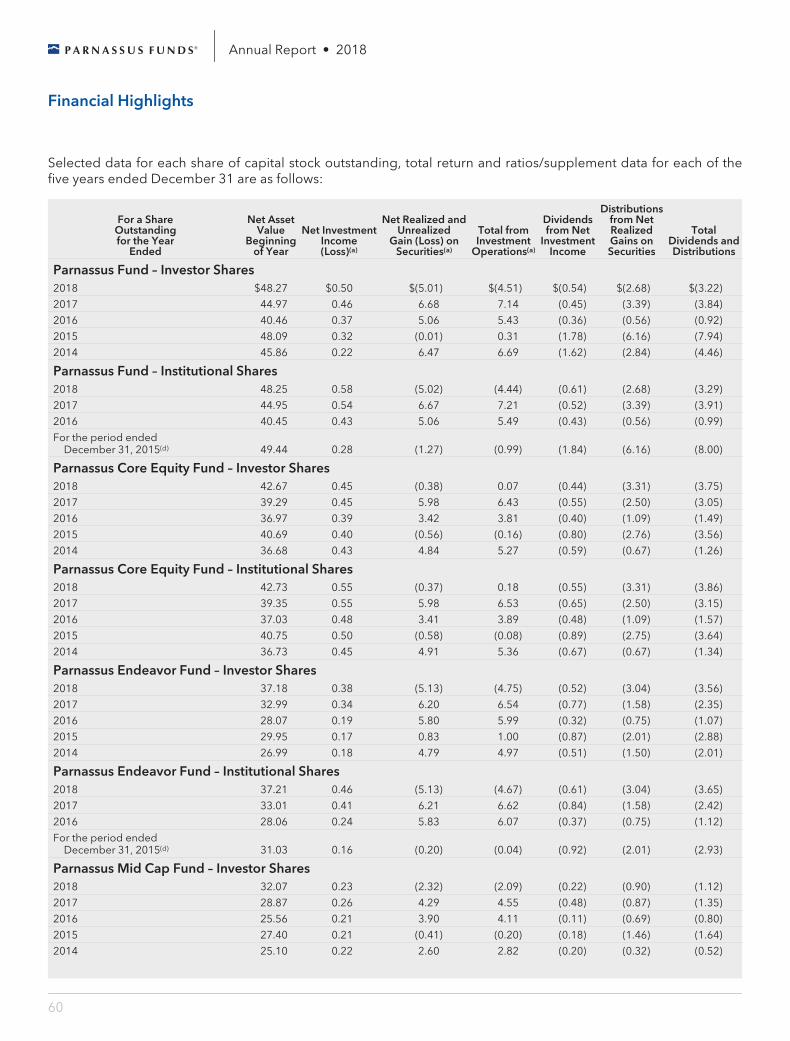
Annual Report • 2018
Financial Highlights
Selected data for each share of capital stock outstanding, total return and ratios/supplement data for each of the five years ended December 31 are as follows:
For a Share Outstanding for the Year
Ended
Net Asset Value
Beginning of Year
Net Investment Income (Loss)(a)
Net Realized and Unrealized
Gain (Loss) on Securities(a)
Total from Investment
Operations(a)
Dividends from Net
Investment Income
Distributions from Net Realized Gains on Securities
Total Dividends and Distributions
Parnassus Fund – Investor Shares 2018 $48.27 $0.50 $(5.01) $(4.51) $(0.54) $(2.68) $(3.22)
2017 44.97 0.46 6.68 7.14 (0.45) (3.39) (3.84)
2016 40.46 0.37 5.06 5.43 (0.36) (0.56) (0.92)
2015 48.09 0.32 (0.01) 0.31 (1.78) (6.16) (7.94)
2014 45.86 0.22 6.47 6.69 (1.62) (2.84) (4.46)
Parnassus Fund – Institutional Shares 2018 48.25 0.58 (5.02) (4.44) (0.61) (2.68) (3.29)
2017 44.95 0.54 6.67 7.21 (0.52) (3.39) (3.91)
2016 40.45 0.43 5.06 5.49 (0.43) (0.56) (0.99)
For the period ended December 31, 2015(d) 49.44 0.28 (1.27) (0.99) (1.84) (6.16) (8.00)
Parnassus Core Equity Fund – Investor Shares 2018 42.67 0.45 (0.38) 0.07 (0.44) (3.31) (3.75)
2017 39.29 0.45 5.98 6.43 (0.55) (2.50) (3.05)
2016 36.97 0.39 3.42 3.81 (0.40) (1.09) (1.49)
2015 40.69 0.40 (0.56) (0.16) (0.80) (2.76) (3.56)
2014 36.68 0.43 4.84 5.27 (0.59) (0.67) (1.26)
Parnassus Core Equity Fund – Institutional Shares 2018 42.73 0.55 (0.37) 0.18 (0.55) (3.31) (3.86)
2017 39.35 0.55 5.98 6.53 (0.65) (2.50) (3.15)
2016 37.03 0.48 3.41 3.89 (0.48) (1.09) (1.57)
2015 40.75 0.50 (0.58) (0.08) (0.89) (2.75) (3.64)
2014 36.73 0.45 4.91 5.36 (0.67) (0.67) (1.34)
Parnassus Endeavor Fund – Investor Shares 2018 37.18 0.38 (5.13) (4.75) (0.52) (3.04) (3.56)
2017 32.99 0.34 6.20 6.54 (0.77) (1.58) (2.35)
2016 28.07 0.19 5.80 5.99 (0.32) (0.75) (1.07)
2015 29.95 0.17 0.83 1.00 (0.87) (2.01) (2.88)
2014 26.99 0.18 4.79 4.97 (0.51) (1.50) (2.01)
Parnassus Endeavor Fund – Institutional Shares 2018 37.21 0.46 (5.13) (4.67) (0.61) (3.04) (3.65)
2017 33.01 0.41 6.21 6.62 (0.84) (1.58) (2.42)
2016 28.06 0.24 5.83 6.07 (0.37) (0.75) (1.12)
For the period ended December 31, 2015(d) 31.03 0.16 (0.20) (0.04) (0.92) (2.01) (2.93)
Parnassus Mid Cap Fund – Investor Shares 2018 32.07 0.23 (2.32) (2.09) (0.22) (0.90) (1.12)
2017 28.87 0.26 4.29 4.55 (0.48) (0.87) (1.35)
2016 25.56 0.21 3.90 4.11 (0.11) (0.69) (0.80)
2015 27.40 0.21 (0.41) (0.20) (0.18) (1.46) (1.64)
2014 25.10 0.22 2.60 2.82 (0.20) (0.32) (0.52)
60
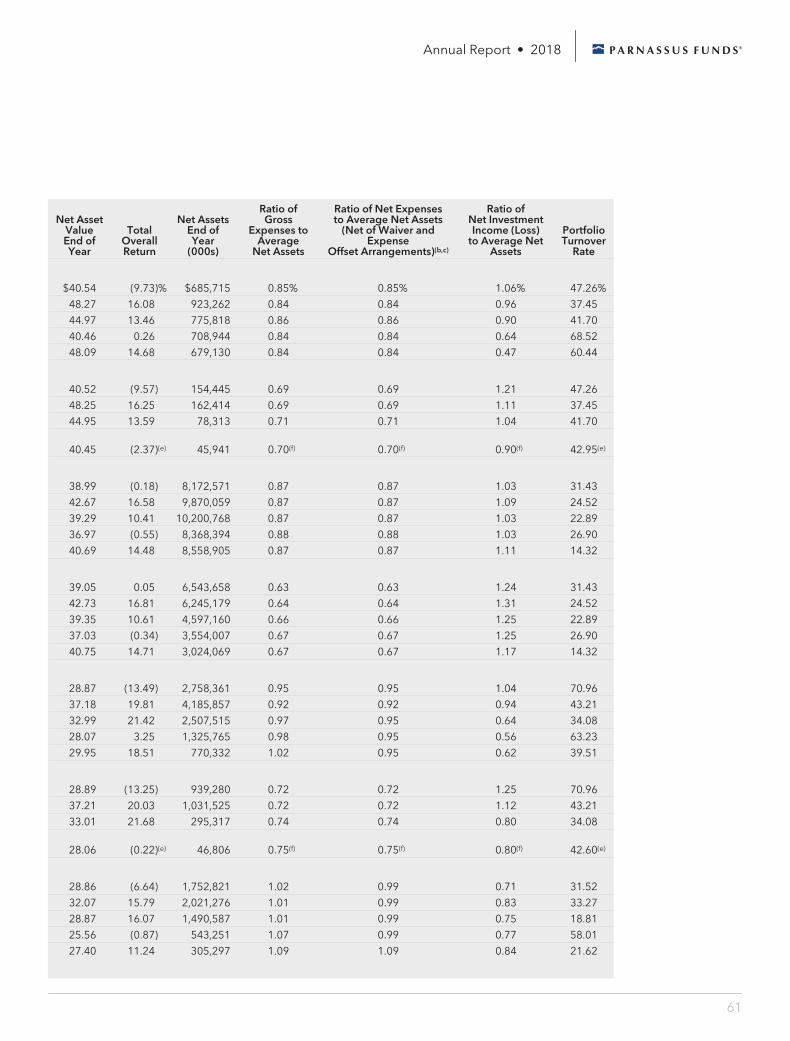
Annual Report • 2018
Net Asset Value End of Year
Total Overall Return
Net Assets End of Year
(000s)
Ratio of Gross
Expenses to Average
Net Assets
Ratio of Net Expenses to Average Net Assets
(Net of Waiver and Expense
Offset Arrangements)(b,c)
Ratio of Net Investment Income (Loss)
to Average Net Assets
Portfolio Turnover
Rate
$40.54 (9.73)% $685,715 0.85% 0.85% 1.06% 47.26%
48.27 16.08 923,262 0.84 0.84 0.96 37.45
44.97 13.46 775,818 0.86 0.86 0.90 41.70
40.46 0.26 708,944 0.84 0.84 0.64 68.52
48.09 14.68 679,130 0.84 0.84 0.47 60.44
40.52 (9.57) 154,445 0.69 0.69 1.21 47.26
48.25 16.25 162,414 0.69 0.69 1.11 37.45
44.95 13.59 78,313 0.71 0.71 1.04 41.70
40.45 (2.37)(e) 45,941 0.70(f) 0.70(f) 0.90(f) 42.95(e)
38.99 (0.18) 8,172,571 0.87 0.87 1.03 31.43
42.67 16.58 9,870,059 0.87 0.87 1.09 24.52
39.29 10.41 10,200,768 0.87 0.87 1.03 22.89
36.97 (0.55) 8,368,394 0.88 0.88 1.03 26.90
40.69 14.48 8,558,905 0.87 0.87 1.11 14.32
39.05 0.05 6,543,658 0.63 0.63 1.24 31.43
42.73 16.81 6,245,179 0.64 0.64 1.31 24.52
39.35 10.61 4,597,160 0.66 0.66 1.25 22.89
37.03 (0.34) 3,554,007 0.67 0.67 1.25 26.90
40.75 14.71 3,024,069 0.67 0.67 1.17 14.32
28.87 (13.49) 2,758,361 0.95 0.95 1.04 70.96
37.18 19.81 4,185,857 0.92 0.92 0.94 43.21
32.99 21.42 2,507,515 0.97 0.95 0.64 34.08
28.07 3.25 1,325,765 0.98 0.95 0.56 63.23
29.95 18.51 770,332 1.02 0.95 0.62 39.51
28.89 (13.25) 939,280 0.72 0.72 1.25 70.96
37.21 20.03 1,031,525 0.72 0.72 1.12 43.21
33.01 21.68 295,317 0.74 0.74 0.80 34.08
28.06 (0.22)(e) 46,806 0.75(f) 0.75(f) 0.80(f) 42.60(e)
28.86 (6.64) 1,752,821 1.02 0.99 0.71 31.52
32.07 15.79 2,021,276 1.01 0.99 0.83 33.27
28.87 16.07 1,490,587 1.01 0.99 0.75 18.81
25.56 (0.87) 543,251 1.07 0.99 0.77 58.01
27.40 11.24 305,297 1.09 1.09 0.84 21.62
61
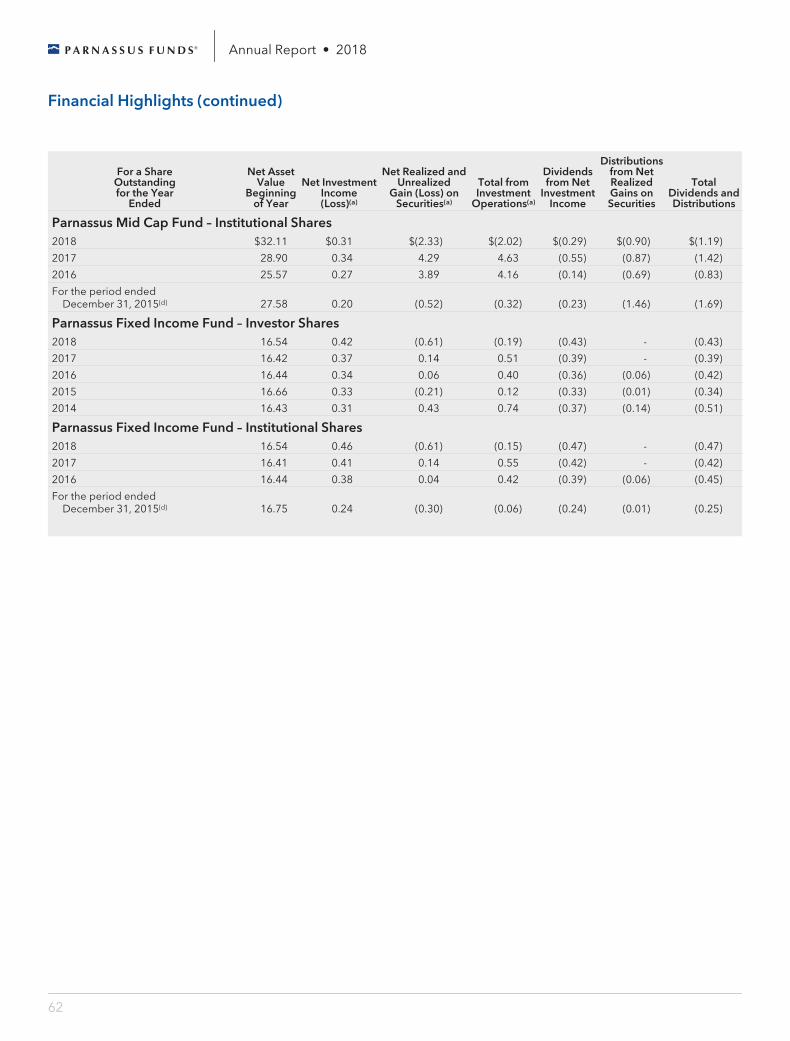
Annual Report • 2018
Financial Highlights (continued)
For a Share Outstanding for the Year
Ended
Net Asset Value
Beginning of Year
Net Investment Income (Loss)(a)
Net Realized and Unrealized
Gain (Loss) on Securities(a)
Total from Investment
Operations(a)
Dividends from Net
Investment Income
Distributions from Net Realized Gains on Securities
Total Dividends and Distributions
Parnassus Mid Cap Fund – Institutional Shares 2018 $32.11 $0.31 $(2.33) $(2.02) $(0.29) $(0.90) $(1.19)
2017 28.90 0.34 4.29 4.63 (0.55) (0.87) (1.42)
2016 25.57 0.27 3.89 4.16 (0.14) (0.69) (0.83)
For the period ended December 31, 2015(d) 27.58 0.20 (0.52) (0.32) (0.23) (1.46) (1.69)
Parnassus Fixed Income Fund – Investor Shares 2018 16.54 0.42 (0.61) (0.19) (0.43) - (0.43)
2017 16.42 0.37 0.14 0.51 (0.39) - (0.39)
2016 16.44 0.34 0.06 0.40 (0.36) (0.06) (0.42)
2015 16.66 0.33 (0.21) 0.12 (0.33) (0.01) (0.34)
2014 16.43 0.31 0.43 0.74 (0.37) (0.14) (0.51)
Parnassus Fixed Income Fund – Institutional Shares 2018 16.54 0.46 (0.61) (0.15) (0.47) - (0.47)
2017 16.41 0.41 0.14 0.55 (0.42) - (0.42)
2016 16.44 0.38 0.04 0.42 (0.39) (0.06) (0.45)
For the period ended December 31, 2015(d) 16.75 0.24 (0.30) (0.06) (0.24) (0.01) (0.25)
62
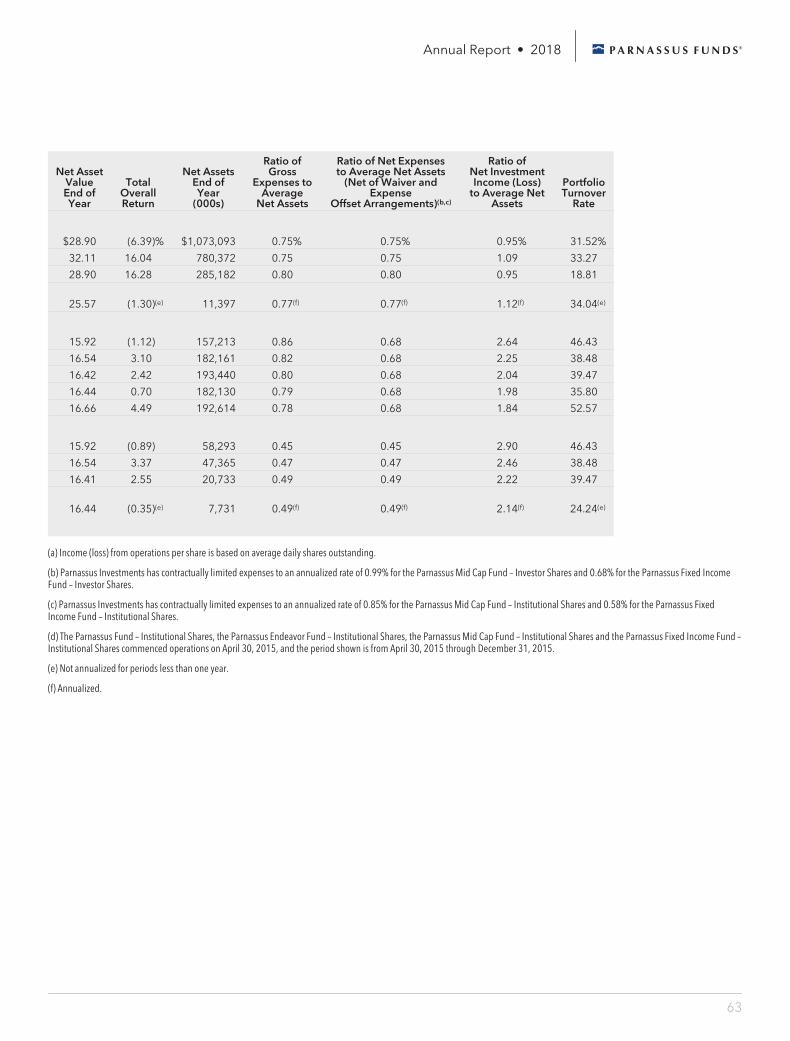
Annual Report • 2018
Net Asset Value End of Year
Total Overall Return
Net Assets End of Year
(000s)
Ratio of Gross
Expenses to Average
Net Assets
Ratio of Net Expenses to Average Net Assets
(Net of Waiver and Expense
Offset Arrangements)(b,c)
Ratio of Net Investment Income (Loss)
to Average Net Assets
Portfolio Turnover
Rate
$28.90 (6.39)% $1,073,093 0.75% 0.75% 0.95% 31.52%
32.11 16.04 780,372 0.75 0.75 1.09 33.27
28.90 16.28 285,182 0.80 0.80 0.95 18.81
25.57 (1.30)(e) 11,397 0.77(f) 0.77(f) 1.12(f) 34.04(e)
15.92 (1.12) 157,213 0.86 0.68 2.64 46.43
16.54 3.10 182,161 0.82 0.68 2.25 38.48
16.42 2.42 193,440 0.80 0.68 2.04 39.47
16.44 0.70 182,130 0.79 0.68 1.98 35.80
16.66 4.49 192,614 0.78 0.68 1.84 52.57
15.92 (0.89) 58,293 0.45 0.45 2.90 46.43
16.54 3.37 47,365 0.47 0.47 2.46 38.48
16.41 2.55 20,733 0.49 0.49 2.22 39.47
16.44 (0.35)(e) 7,731 0.49(f) 0.49(f) 2.14(f) 24.24(e)
(a) Income (loss) from operations per share is based on average daily shares outstanding.
(b) Parnassus Investments has contractually limited expenses to an annualized rate of 0.99% for the Parnassus Mid Cap Fund – Investor Shares and 0.68% for the Parnassus Fixed Income Fund – Investor Shares.
(c) Parnassus Investments has contractually limited expenses to an annualized rate of 0.85% for the Parnassus Mid Cap Fund – Institutional Shares and 0.58% for the Parnassus Fixed Income Fund – Institutional Shares.
(d) The Parnassus Fund – Institutional Shares, the Parnassus Endeavor Fund – Institutional Shares, the Parnassus Mid Cap Fund – Institutional Shares and the Parnassus Fixed Income Fund – Institutional Shares commenced operations on April 30, 2015, and the period shown is from April 30, 2015 through December 31, 2015.
(e) Not annualized for periods less than one year.
(f) Annualized.
63
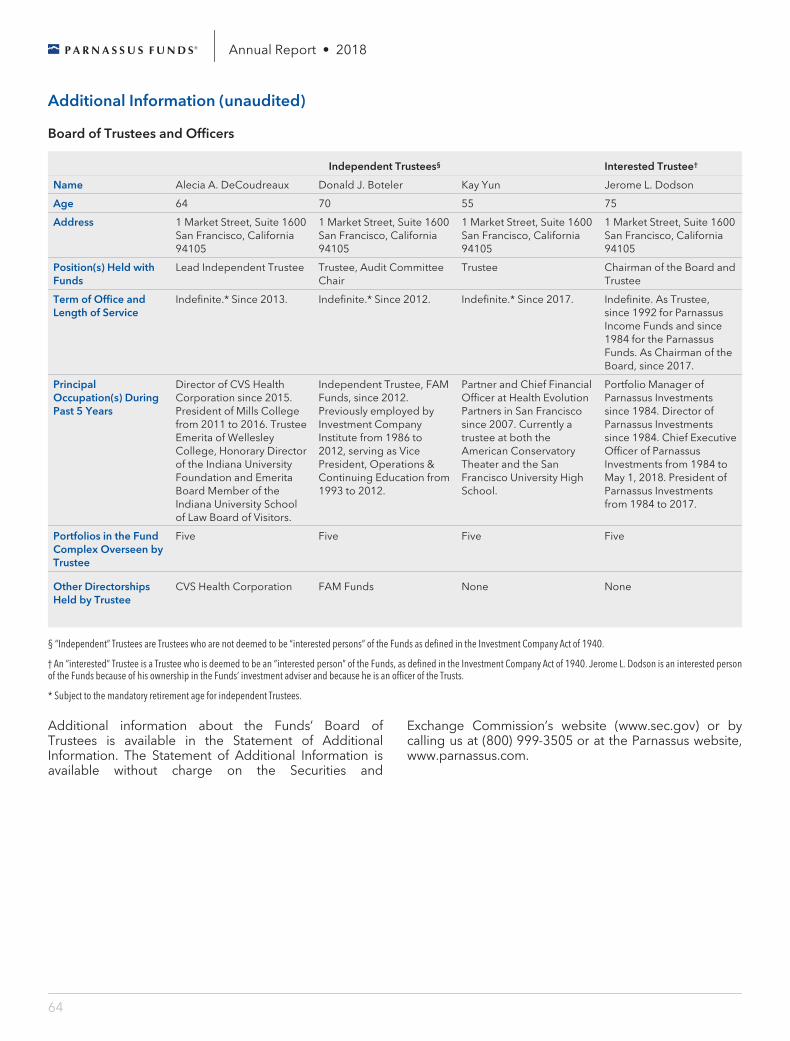
Annual Report • 2018
Additional Information (unaudited)
Board of Trustees and Officers
Independent Trustees§ Interested Trustee†
Name Alecia A. DeCoudreaux Donald J. Boteler Kay Yun Jerome L. Dodson
Age 64 70 55 75
Address 1 Market Street, Suite 1600 San Francisco, California 94105
1 Market Street, Suite 1600 San Francisco, California 94105
1 Market Street, Suite 1600 San Francisco, California 94105
1 Market Street, Suite 1600 San Francisco, California 94105
Position(s) Held with Funds
Lead Independent Trustee Trustee, Audit Committee Chair
Trustee Chairman of the Board and Trustee
Term of Office and Length of Service
Indefinite.* Since 2013. Indefinite.* Since 2012. Indefinite.* Since 2017. Indefinite. As Trustee, since 1992 for Parnassus Income Funds and since 1984 for the Parnassus Funds. As Chairman of the Board, since 2017.
Principal Occupation(s) During Past 5 Years
Director of CVS Health Corporation since 2015. President of Mills College from 2011 to 2016. Trustee Emerita of Wellesley College, Honorary Director of the Indiana University Foundation and Emerita Board Member of the Indiana University School of Law Board of Visitors.
Independent Trustee, FAM Funds, since 2012. Previously employed by Investment Company Institute from 1986 to 2012, serving as Vice President, Operations & Continuing Education from 1993 to 2012.
Partner and Chief Financial Officer at Health Evolution Partners in San Francisco since 2007. Currently a trustee at both the American Conservatory Theater and the San Francisco University High School.
Portfolio Manager of Parnassus Investments since 1984. Director of Parnassus Investments since 1984. Chief Executive Officer of Parnassus Investments from 1984 to May 1, 2018. President of Parnassus Investments from 1984 to 2017.
Portfolios in the Fund Complex Overseen by Trustee
Five Five Five Five
Other Directorships Held by Trustee
CVS Health Corporation FAM Funds None None
§ “Independent” Trustees are Trustees who are not deemed to be “interested persons” of the Funds as defined in the Investment Company Act of 1940.
† An “interested” Trustee is a Trustee who is deemed to be an “interested person” of the Funds, as defined in the Investment Company Act of 1940. Jerome L. Dodson is an interested person of the Funds because of his ownership in the Funds’ investment adviser and because he is an officer of the Trusts.
* Subject to the mandatory retirement age for independent Trustees.
Additional information about the Funds’ Board of Trustees is available in the Statement of Additional Information. The Statement of Additional Information is available without charge on the Securities and
Exchange Commission’s website (www.sec.gov) or by calling us at (800) 999-3505 or at the Parnassus website, www.parnassus.com.
64
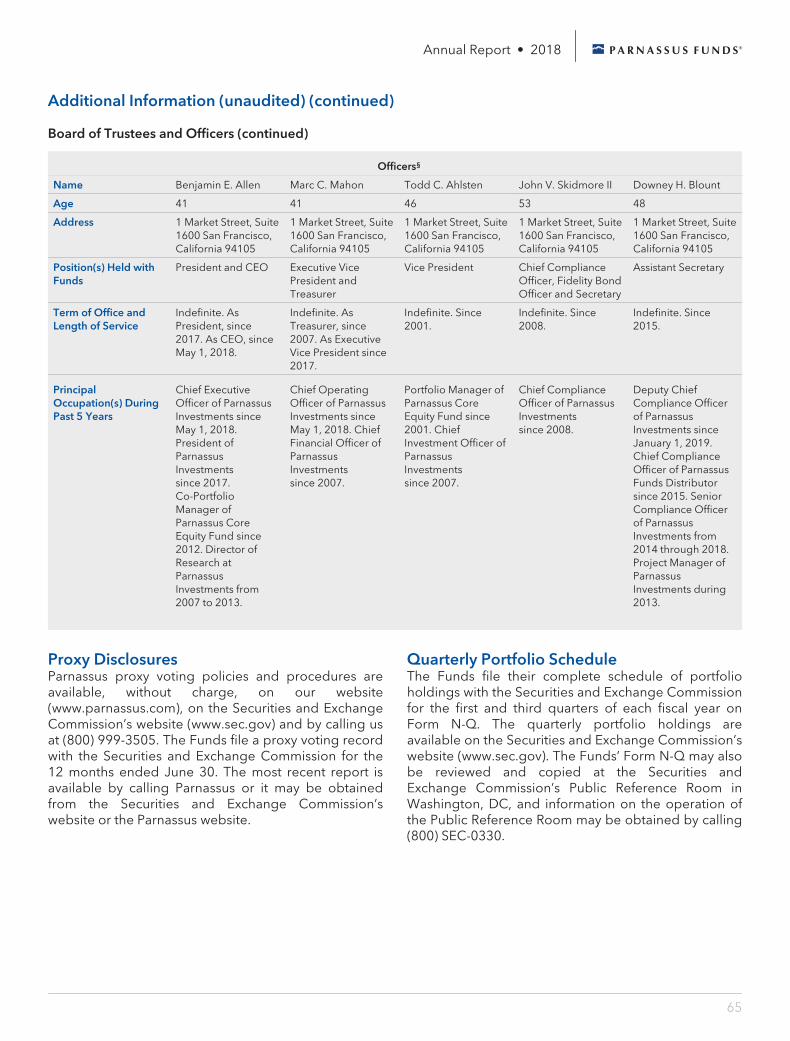
Annual Report • 2018
Additional Information (unaudited) (continued)
Board of Trustees and Officers (continued)
Officers§
Name Benjamin E. Allen Marc C. Mahon Todd C. Ahlsten John V. Skidmore II Downey H. Blount
Age 41 41 46 53 48
Address 1 Market Street, Suite 1600 San Francisco, California 94105
1 Market Street, Suite 1600 San Francisco, California 94105
1 Market Street, Suite 1600 San Francisco, California 94105
1 Market Street, Suite 1600 San Francisco, California 94105
1 Market Street, Suite 1600 San Francisco, California 94105
Position(s) Held with Funds
President and CEO Executive Vice President and Treasurer
Vice President Chief Compliance Officer, Fidelity Bond Officer and Secretary
Assistant Secretary
Term of Office and Length of Service
Indefinite. As President, since 2017. As CEO, since May 1, 2018.
Indefinite. As Treasurer, since 2007. As Executive Vice President since 2017.
Indefinite. Since 2001.
Indefinite. Since 2008.
Indefinite. Since 2015.
Principal Occupation(s) During Past 5 Years
Chief Executive Officer of Parnassus Investments since May 1, 2018. President of Parnassus Investments since 2017. Co-Portfolio Manager of Parnassus Core Equity Fund since 2012. Director of Research at Parnassus Investments from 2007 to 2013.
Chief Operating Officer of Parnassus Investments since May 1, 2018. Chief Financial Officer of Parnassus Investments since 2007.
Portfolio Manager of Parnassus Core Equity Fund since 2001. Chief Investment Officer of Parnassus Investments since 2007.
Chief Compliance Officer of Parnassus Investments since 2008.
Deputy Chief Compliance Officer of Parnassus Investments since January 1, 2019. Chief Compliance Officer of Parnassus Funds Distributor since 2015. Senior Compliance Officer of Parnassus Investments from 2014 through 2018. Project Manager of Parnassus Investments during 2013.
Proxy Disclosures Parnassus proxy voting policies and procedures are available, without charge, on our website (www.parnassus.com), on the Securities and Exchange Commission’s website (www.sec.gov) and by calling us at (800) 999-3505. The Funds file a proxy voting record with the Securities and Exchange Commission for the 12 months ended June 30. The most recent report is available by calling Parnassus or it may be obtained from the Securities and Exchange Commission’s website or the Parnassus website.
Quarterly Portfolio Schedule The Funds file their complete schedule of portfolio holdings with the Securities and Exchange Commission for the first and third quarters of each fiscal year on Form N-Q. The quarterly portfolio holdings are available on the Securities and Exchange Commission’s website (www.sec.gov). The Funds’ Form N-Q may also be reviewed and copied at the Securities and Exchange Commission’s Public Reference Room in Washington, DC, and information on the operation of the Public Reference Room may be obtained by calling (800) SEC-0330.
65
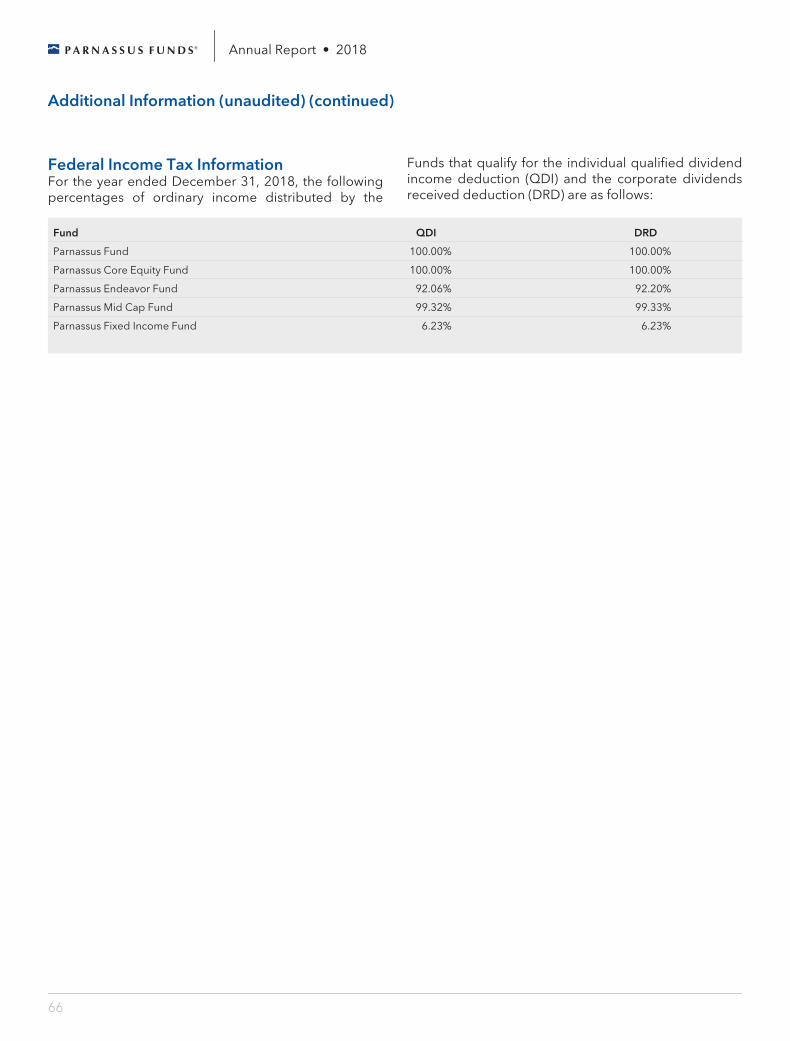
Annual Report • 2018
Additional Information (unaudited) (continued)
Federal Income Tax Information For the year ended December 31, 2018, the following percentages of ordinary income distributed by the
Funds that qualify for the individual qualified dividend income deduction (QDI) and the corporate dividends received deduction (DRD) are as follows:
Fund QDI DRD
Parnassus Fund 100.00% 100.00%
Parnassus Core Equity Fund 100.00% 100.00%
Parnassus Endeavor Fund 92.06% 92.20%
Parnassus Mid Cap Fund 99.32% 99.33%
Parnassus Fixed Income Fund 6.23% 6.23%
66

Investment Adviser Parnassus Investments 1 Market Street, Suite 1600 San Francisco, CA 94105
Independent Registered Public Accounting Firm Deloitte and Touche LLP 555 Mission Street San Francisco, CA 94105
Legal Counsel Foley and Lardner LLP 777 E. Wisconsin Ave. Milwaukee, WI 53202
Distributor Parnassus Funds Distributor 1 Market Street, Suite 1600 San Francisco, CA 94105
Go Paperless with E-Delivery Sign up for electronic delivery of prospectuses, shareholder reports and account statements at www.parnassus.com/gopaperless If you do not hold your account directly with Parnassus, please contact the firm that holds your account to inquire about electronic delivery.
1 Market Street, Suite 1600 San Francisco, CA 94105 | (800) 999-3505 | www.parnassus.com