Embed Size (px)
Citation preview
EN EN
EUROPEAN COMMISSION
Brussels, 22.2.2017
SWD(2017) 75 final
COMMISSION STAFF WORKING DOCUMENT
Country Report France 2017
Including an In-Depth Review on the prevention and correction of macroeconomic
imbalances
Accompanying the document
COMMUNICATION FROM THE COMMISSION TO THE EUROPEAN
PARLIAMENT, THE COUNCIL, THE EUROPEAN CENTRAL BANK AND THE
EUROGROUP
2017 European Semester: Assessment of progress on structural reforms,
prevention and correction of macroeconomic imbalances, and results of in-depth reviews
under Regulation (EU) No 1176/2011
{COM(2017) 90 final}
{SWD(2017) 67 final to SWD(2017) 93 final}
Executive summary 1
1. Economic situation and outlook 4
2. Progress with country-specific recommendations 10
3. Summary of the main findings from the MIP in-depth review 13
4. Reform priorities 21
4.1. Public finances and taxation 21
4.2. Financial sector 29
4.3. Labour market, education and social policies 32
4.4. Competitiveness 39
4.5. Sectoral policies 48
A. Overview Table 54
B. MIP Scoreboard 611
C. Standard Tables 622
References 677
LIST OF TABLES
1.1. Key economic, financial and social indicators – France 9
2.1. Summary Table on 2016 CSR assessment 11
3.1. MIP Assessment Matrix (*) – France 2017 19
4.2.1. Financial soundness indicators, all banks in France 29
4.4.1. Labour productivity growth (per person employed) in France and in the rest of the euro
area 412
B.1. The MIP scoreboard for France 611
C.1. Financial market indicators 622
C.2. Labour market and social indicators 63
C.3. Labour market indicators (cont.) 64
C.4. Product market performance and policy indicators 65
C.5. Green growth 66
LIST OF GRAPHS
1.1. Contributions to GDP growth (2010-2018) 4
CONTENTS
1.2. Potential GDP growth breakdown in France 5
1.3. Import penetration in selected EU countries 5
1.4. Trade in services – France 6
1.5. Net lending/borrowing by institutional sectors – France 6
1.6. Private debt in France and in the euro area 7
3.1. Export market shares in value and in volume – France and euro area 13
3.2. Real compensation per employee and productivity in France 14
4.1.1. Difference in debt dynamics between France and the euro area 21
4.1.2. Public debt projections of French public debt under different scenarios 22
4.1.3. Changes in the composition of public expenditure 24
4.1.4. Healthcare expenditure as a share of GDP in selected countries (2005-2015) 24
4.1.5. Composition of total taxes on companies, 2015 26
4.1.6. Taxes on consumption as percentage of total taxation in 2014 27
4.2.1. Funding of non-financial corporations 30
4.3.1. Unemployment rate in France, 2006-2015 32
4.4.1. Export market share breakdown for France – Goods 39
4.4.2. French export performance – Goods 39
4.4.3. Exports of selected sectors (in value) – France 40
4.4.4. Share of export values per 5 categories of quality rank – France (% of total exports) 40
4.4.5. Exports market shares in value and in volume – France 41
4.4.6. Share of services in total exports in selected EU countries 41
4.4.7. Real unit labour costs in selected EA countries (deflated by GDP deflator) – whole
economy 42
4.4.8. Breakdown of real unit labour costs in France – whole economy 42
4.4.9. Sectoral breakdown of unit labour costs (average annual growth rate 2008-2015) 43
4.4.10. Investment composition (% of value added) – whole economy 434
4.5.1. Performance of France's innovation system - distance to EU innovation leaders and to EU
average 48
4.5.2. Efficiency of public funding of private R&D 49
4.5.3. Competition per service sector and country 50
4.5.4. Regulatory restrictions, France and EU 50
LIST OF BOXES
2.1. Contribution of the EU budget to structural change 12
3.1. Euro area spillovers 17
4.1.1. Effects of a tax shift from taxes on production factors to indirect taxes 28
4.3.1. Selected highlights: recent reforms to promote flexicurity in France 38
4.4.1. Investment challenges and reforms in France 446
4.5.1. Indebtedness of the State-owned network industries and implications for investment 53
1
This report assesses France’s economy in the light
of the European Commission’s Annual Growth
Survey published on 16 November 2016. In the
survey the Commission calls on EU Member
States to redouble their efforts on the three
elements of the virtuous triangle of economic
policy — boosting investment, pursuing structural
reforms and ensuring responsible fiscal policies. In
so doing, Member States should focus on
improving social fairness in order to deliver more
inclusive growth. At the same time, the
Commission published the Alert Mechanism
Report (AMR) that initiated the sixth round of the
macroeconomic imbalance procedure. The in-
depth review, which the 2017 AMR concluded
should be undertaken for the French economy, is
presented in this report.
Economic growth is forecast to accelerate
moderately. GDP growth declined slightly to
1.2% in 2016 from 1.3% in 2015, despite the
acceleration in domestic demand, as net exports
represented a drag on growth of almost 1 pp. of
GDP growth. The Commission 2017 winter
forecast projects French GDP to grow by 1.4 % in
2017 and 1.7 % in 2018. The recovery in exports is
expected to rebalance growth away from private
consumption and help sustain the recovery,
although net exports are forecast to continue to be
a drag on growth. Inflation is expected to moderate
gradually, as the effects of past oil price increases
fade. In the long term, growth is expected to
remain moderate, as, in line with an EU wide
trend, France’s potential growth has been eroded
since the 2008 financial crisis, to 0.9 % in 2015.
Export performance remains subdued. Export
market shares have stabilised since 2012 but
exports barely grew in 2016. The trade deficit
deteriorated in 2016 and is expected to widen
further, as imports remain more vigorous than
exports and oil prices rebound. While external
sustainability is not a concern for France in the
short term, the weak export performance weighs
on growth prospects.
Cost competitiveness is improving without
having fully regained past losses, while
substantial improvements in non-cost
competitiveness are still to materialise. The
growth of unit labour costs has slowed down
thanks to labour tax cuts and continued wage
moderation, but low productivity growth prevents
a faster recovery of France’s competitiveness. Low
levels of product market competition and slow
adoption of technology hamper productivity
growth. Incentives for employers to hire on open-
ended contracts have been introduced. In addition,
derogations through firm-level agreements from
branch-wide and general legal provisions are
becoming more systematic. However, the
minimum wage indexation mechanism has not
been revised and the labour market remains
segmented holding back the improvement of the
labour force's skills. Finally, the tax burden for
companies is high compared to other EU countries.
France's public indebtedness is high. The deficit
is expected to decline below the threshold value of
3 % of GDP in 2017, but the pace of fiscal
adjustment is slow as the adjustment of
government spending proves difficult. This raises
concerns about the durability of the deficit
correction. The still comparatively high
deficit - coupled with the low inflation
environment and low growth - indicates that debt,
expected at 96.4 % of GDP in 2016, continues to
increase. More progress has been made on fiscal
structural reforms: the sustainability of the pension
system has been improved, territorial reform is
allowing local government to make efficiency
gains and setting-up the High Council of Public
Finances has strengthened fiscal governance.
Unemployment is falling from the peak reached
in 2015, while long-term unemployment
continues to rise in contrast with the EU trend.
After increasing steadily since 2008,
unemployment started to fall, from 10.4 % in 2015
to 10.0 % in 2016, and is forecast to fall further in
the coming years. Yet, unemployment for young
people and low-qualified remains high and, as a
percentage of total unemployment, long-term
unemployment reached 44.2 % in the third quarter
of 2016, contrary to the decreasing trend in the
EU.
Overall, France has made some progress in
addressing the 2016 country-specific
recommendations. Substantial progress has been
made in ensuring that labour cost reductions are
sustained and in reforming the labour law. The
2016 Labour Act paves the way for a
comprehensive review of the Labour Code and
introduced measures aimed at improving firms’
capacity to adjust. However, no progress has been
EXECUTIVE SUMMARY
Executive summary
2
made on reforming the unemployment benefit
system. Some progress has been made in
improving the system of vocational education and
training. Also, some progress has been made on
removing barriers to activity in the services sector
and in simplifying administrative, accounting and
fiscal rules for companies. By contrast, limited
progress has been made in reducing taxes on
production and the corporate income tax,
simplifying innovation policy schemes and
boosting the savings identified by the spending
reviews. No progress has been made in alleviating
the effects on firms of size-related legal thresholds.
Although the deficit is projected to decline below
the 3 % Treaty threshold, the limited progress
made in taking the required structural budgetary
measures means that there are no fiscal buffers
against unforeseen circumstances.
Regarding progress in reaching national targets
under the Europe 2020 Strategy, France is
performing well in decreasing greenhouse gas
emissions, improving energy efficiency and
reducing early school leaving. At the same time,
more action is needed to increase the employment
rate, R&D intensity, use of renewable energy, and
to reduce poverty.
The main findings of the in-depth review
contained in this report, and the related policy
challenges, are as follows:
French exports continue to suffer from weak
competitiveness. The increased specialisation
of goods exports on a few sectors makes
France’s export performance more vulnerable
to negative developments in these sectors.
Moreover, the quality of goods exports has
declined slightly in recent years. Export market
shares in services have been more resilient than
those in goods since 2008.
Cost competitiveness has improved in recent
years. Since 2013, unit labour cost growth has
been lower in France than in the rest of the
euro area, in particular thanks to measures
taken to reduce the labour tax wedge, but
accumulated past losses have not been made up
for yet. Wage moderation continues, but low
productivity growth is preventing cost
competitiveness from recovering faster.
France performs well in terms of investment
levels. Productive investment in machinery and
equipment has started to pick up supported by
fiscal measures. The quality of investment is
however uneven. Investment in R&D is mainly
in sectors whose relative weight is declining,
and businesses are relatively slow to take up
digital technologies. While barriers to
investment are overall moderate, investment is
highly concentrated around a limited number of
larger firms. These investment patterns weigh
on labour productivity and competitiveness and
affect the long-term growth potential of the
whole French economy.
The design of the tax system weighs on
competitiveness. The high tax burden on
companies may be an obstacle to investment
and firms' growth. It is combined with a
relatively low level of consumption taxes. The
tax wedge on labour is being reduced but
remains above EU average at the average
wage. In addition, the complexity of the tax
system may also be a barrier to a well-
functioning business environment.
The French business environment is middle-
ranking in comparison to major
competitors. While the government has tried
to simplify the regulatory burden for
businesses, the latter are still faced with a high
regulatory burden and fast-changing
legislation. Size-related thresholds in social and
tax legislation also continue to weigh on firms’
growth. Competition has improved in some
service sectors, but is still weak in several
sectors of major economic importance. Given
the targeted scope of already adopted reforms,
serious barriers remain in place.
High public debt coupled with low growth
could be a source of significant risks for
public finances in future. Short term
sustainability risks remain low. In the long
term, risks are also contained, notably due to
pension indexation rules and favourable
demographic developments compared to the
rest of the EU. Nonetheless, there are
significant consolidation needs in the coming
years to bring down the public debt. The debt
burden for the private sector is stabilising albeit
Executive summary
3
at a high level. The combination of high public
and private debt is an additional risk factor.
The expenditure-based consolidation
strategy has relied mainly on declining
interest rates and cuts in public investment.
The already very high revenue-to-GDP ratio
leaves little margin for further tax hikes,
suggesting that further consolidation needs to
be expenditure-based. However, it is unlikely
that the low interest rate environment will
prevail in the medium term and if productive
investment is cut the economic potential could
be harmed. In contrast, the spending reviews
have identified a number of possible efficiency
gains, most of which have not been
implemented yet.
Its large economy and close integration with
the rest of the euro area makes France a
potentially significant source of cross-border
spillovers. Structural reforms in France can
have positive spill-over effects in other
Member States. Model simulations suggest that
product and labour market reforms or a growth-
friendly tax shift in France can yield positive
GDP effects for both France and for the rest of
the euro area. These effects should remain in
the long-term.
Other key economic issues analysed in this report
that point to particular challenges facing France’s
economy are the following:
Measures to reduce the cost of labour have
had an effect on employment. The recent
evaluations of the crédit d'impôt pour la
compétitivité et l'emploi (CICE) highlighted its
positive effect on employment, although an
increase in its credit rate was not found to have
an increased impact on employment. The
Labour Act also aims to reduce labour market
rigidities. Nonetheless, the French labour
market remains segmented, while women and
people from a migrant background continue to
be affected by lower employment rates. The
unemployment benefit system continues to be
in deficit and its rules reinforce the labour
market segmentation by favouring successive
short periods of work.
Educational inequalities remain high and
the vocational education and training system
is not sufficiently adjusted to labour market
needs. France performs well with respect to the
Europe 2020 indicators concerning education.
However, educational inequalities linked to
socioeconomic background are among the
highest in the OECD. The system of initial
vocational education and training does not lead
to a satisfactory integration of young people in
the labour market. Access to the continuous
vocational training system is uneven for
different categories of workers.
France scores better than the EU average in
relation to poverty, social exclusion and
inequality. Social situation indicators show no
major changes. Yet, some population groups
remain more exposed to poverty, notably part-
time workers and single-parent families. For
very low income earners, access to affordable
housing remains challenging.
The French national innovation system does
not match the performance of Europe's
innovation leaders. A high degree of
complexity remains and overall coordination is
a challenge. The discrepancy between the
amount of public support granted and France's
middling innovation performance raises
questions about the efficiency of public support
schemes.
4
GDP growth
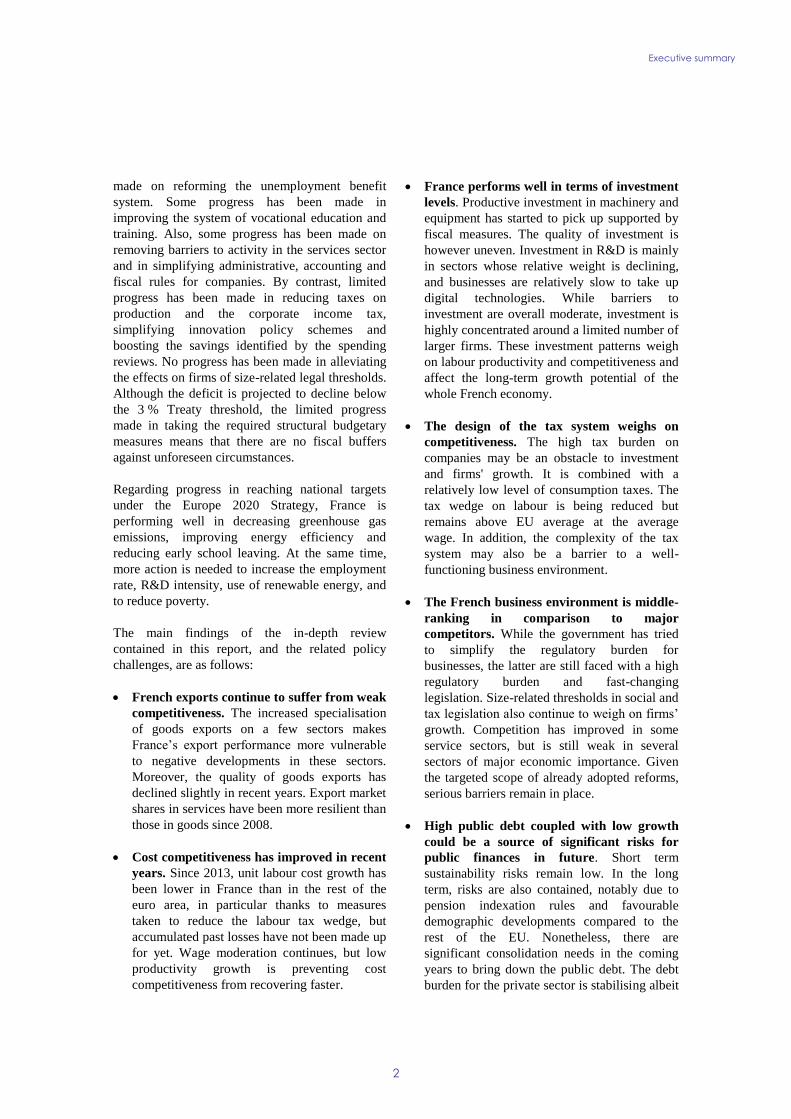
Economic growth is forecast to accelerate
moderately. GDP growth declined slightly to
1.2% in 2016 from 1.3% in 2015, despite growth
reaching 0.4% in the fourth quarter. Private
consumption accelerated on the back of dynamic
household purchasing power, while investment
growth has been boosted by anticipation of the end
of the over-amortisation scheme, a fiscal incentive
for firms to invest. However, after an exceptional
performance in 2015, export growth fell to 1.0% in
2016, due to several temporary factors, while
imports remained relatively dynamic. As a result,
net exports represented a drag on growth of almost
1 pp. of GDP growth in 2016. According to the
Commission 2017 winter forecast, GDP is
projected to pick up to 1.4 % in 2017 and 1.7 % in
2018 under the usual no-policy-change assumption
(Graph 1.1).
Graph 1.1: Contributions to GDP growth (2010-2018)
Source: Commission 2017 winter forecast
The recovery in exports is expected to rebalance
growth away from private consumption and
help sustain the recovery, although net exports
are forecast to continue to be a drag on growth.
Private consumption is expected to decelerate in
line with purchasing power, as the tailwinds from
lower oil prices fade out. Also, the recovery in
investment is gaining momentum, particularly in
the construction sector. After the strong growth
observed in 2016, equipment investment growth is
set to moderate somewhat. However, the
prolongation of the over-amortisation scheme until
14 April 2017, rising profit margins and easy
financing conditions are expected to sustain robust
growth rates. Export growth is expected to
gradually normalise in 2017 and 2018, in line with
the moderate recovery projected in French export
markets. Meanwhile, imports are forecast to
moderate somewhat in 2017, in a context of
decelerating domestic demand, allowing for a
more balanced contribution of net exports to GDP
growth.
The unemployment rate has been declining
since mid-2015, supported by the labour market
measures adopted since 2013. Employment is
forecast to continue growing at a sustained pace,
supported by the ongoing economic recovery and
by policy measures to encourage job creation by
reducing the labour tax wedge (the Tax Credit for
Competitiveness and Employment, the
Responsibility and Solidarity Pact, and the Hiring
Subsidy). Moreover, the emergency plan for
employment announced in January 2016 is further
decreasing the unemployment rate by providing
training to unemployed people who subsequently
do not appear as unemployed any more.
Consequently, the unemployment rate is forecast
to decline to 9.9% in 2017 and 9.6% in 2018.
Inflation is set to moderate gradually. Inflation
rose sharply to 1.6% in January 2017, from 0.8%
in December 2016. Overall, HICP is expected to
average 1.5% in 2017, before declining slightly to
1.3%, as the strong positive contribution from
recent oil price increases fades out and domestic
price pressures increase only gradually.
Risks to the outlook are more balanced. Despite
continued global uncertainty, risks to the forecast
for France are less tilted to the downside than in
the autumn. The improvement of labour market
conditions could allow for a more significant drop
in the household saving rate and thus stronger
private consumption.
Potential growth
In the long term, growth is expected to remain
moderate as potential growth has slowed since
the 2008 financial crisis. Averaging 1.8 % from
2000 to 2008, France’s potential GDP growth
declined to 0.9 % on average from 2009 to 2015
-1
0
1
2
3
10 11 12 13 14 15 16 (f) 17 (f) 18 (f)
Changes in inventories Net exports
Investment Government consumption
Private consumption Real GDP (y-o-y%)
%, pps.
1. ECONOMIC SITUATION AND OUTLOOK
1. Economic situation and outlook
5
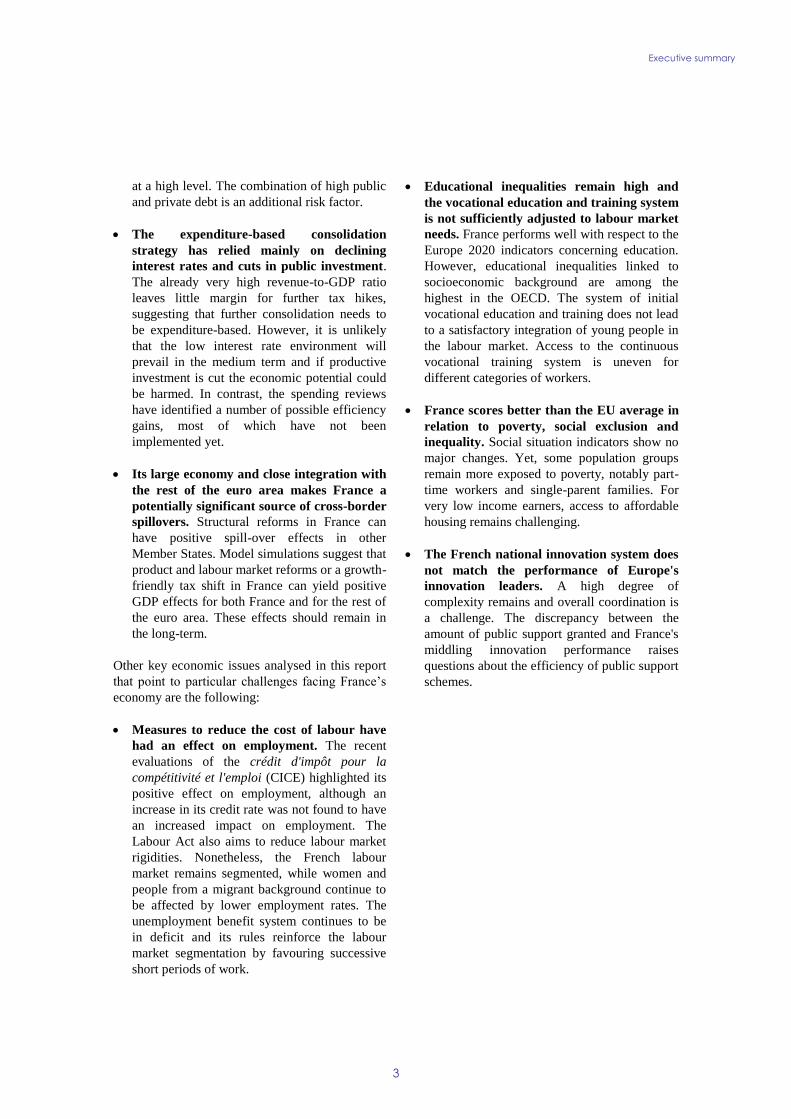
and is expected to pick up only moderately, to
1.3 % by 2018. While this decline has been
observed in all major euro area economies, France
is characterised by a stronger decline in total factor
productivity (TFP) growth, while capital
accumulation and labour force remained relatively
dynamic (1). France’s decline in total factor
productivity (TFP) growth, at −0.5 pp. from 2000-
2008 to 2009-2015 (Graph 1.2), is larger than that
of Germany (−0.3 pp.), Italy (−0.2 pp.) or Spain
(+0.1 pp.). As a result, potential TFP growth in
France has decoupled from Germany, although it
remained higher than in Spain and Italy.
Graph 1.2: Potential GDP growth breakdown in France
Source: Commission 2017 winter forecast
The decline in total factor productivity growth
contributes to the weak competitiveness and
exacerbates the challenges linked to the high
public debt. Although wage increases have
moderated in recent years, the slowdown of labour
productivity growth, largely due to a decline in
TFP growth despite a continued increase in capital
intensity, prevents a faster recovery of cost
competitiveness (see Section 4.4). The decline in
potential GDP also makes it more difficult for
France to bring down its public debt without
greater fiscal consolidation efforts
(see Section 4.1).
Structural reforms are key to addressing the
economic challenges associated with the
declining potential growth. Labour and product
(1) European Commission (2016c).
market rigidities weigh on total factor productivity
by hampering resource reallocation. Labour market
segmentation limits the improvement of labour
force’s skills (see Section 4.3). Moreover size-
related social and tax thresholds and slow adoption
of technology also weigh on total factor
productivity growth (see Section 4.5). Finally, the
tax structure is not growth-friendly.
Imports
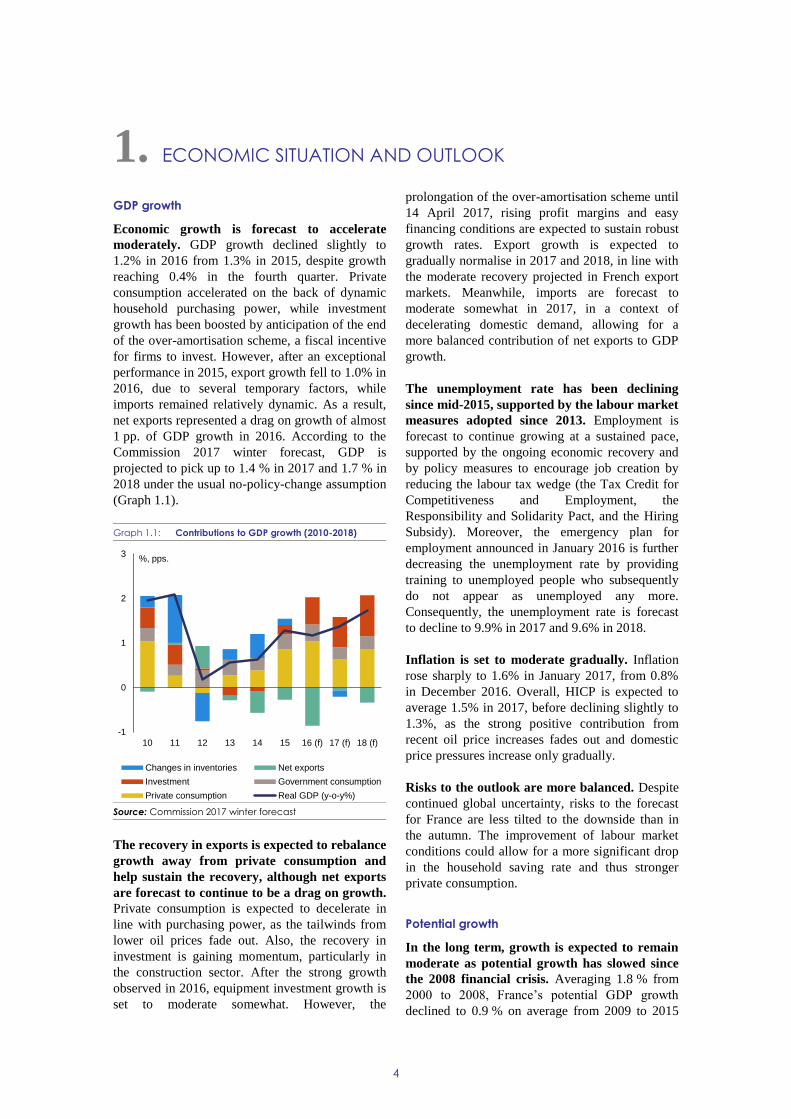
Imports have been relatively more dynamic
than final demand since 2008. The increase in
import penetration reflects first and foremost
general trends in world trade as a result of
globalisation. However, import penetration has
increased relatively more in France than in other
major EU economies (Graph 1.3). This
deterioration in the French market shares in the
domestic market reflects the weak cost and non-
cost competitiveness of the French economy.
Graph 1.3: Import penetration in selected EU countries
Source: European Commission
France has been increasingly importing
intermediate goods, which currently represent
half of all imports of goods. The import content
of its goods exports has also been growing over the
years (from 33 % in 1995 to 39 % in 2009). Yet,
French companies seem to be less integrated in
global value chains, certainly less so than German
companies. France's goods imports remain mostly
downstream in the production chain (i.e. near final
demand). Based on Andras 'upstreamness
indicators', 46.3 % of French goods imports are
-0.5%
0.0%
0.5%
1.0%
1.5%
2.0%
2.5%
00 01 02 03 04 05 06 07 08 09 10 11 12 13 14 15 16 17 18
Total labour (hours) contribution
Capital accumulation contribution
TFP contribution
Potential GDP growth
85
90
95
100
105
110
115
120
08 09 10 11 12 13 14 15 16(f) 17(f) 18(f)
2008=100
Ratio of imports over final demand (in volume)
FR DE IT ES UK EA-19
1. Economic situation and outlook
6
near final demand against 39.7 % of German
imports. Additionally, the ratio of domestic added
value in French exports to foreign added value in
its imports fell between 1995 and 2011 (from 51 %
to 43 %), while again increasing in Germany (from
59 % to 67 %) in the same period.
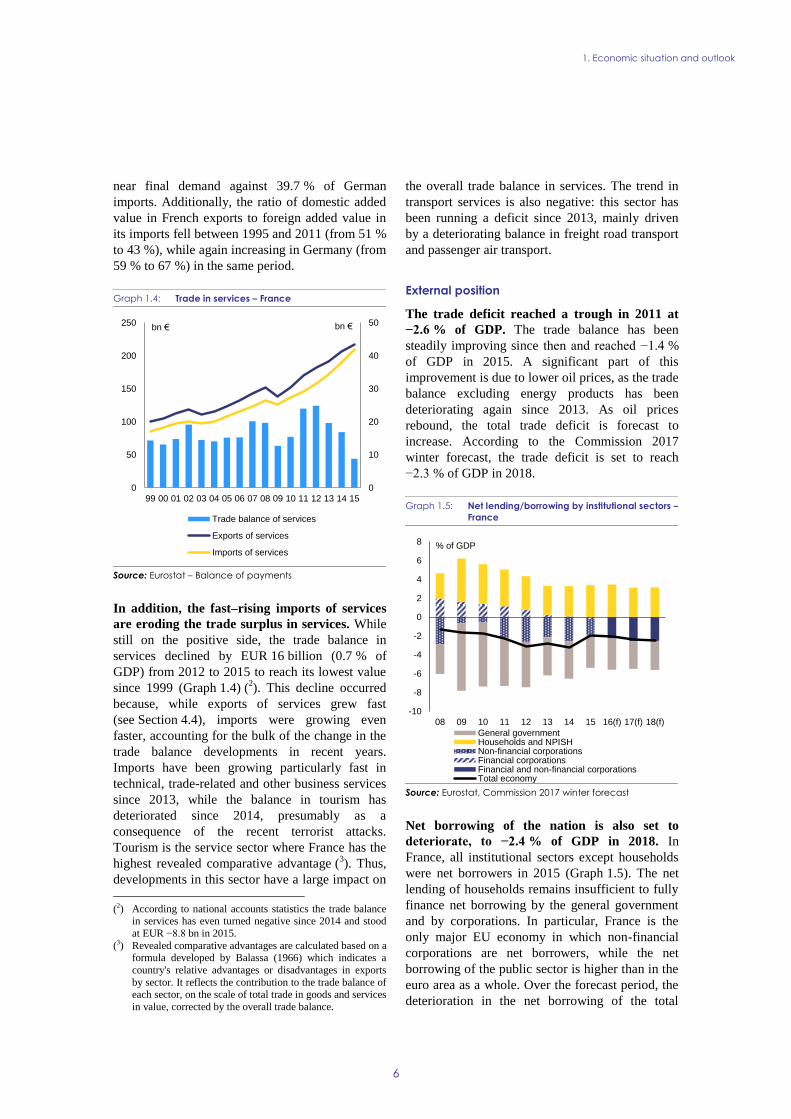
Graph 1.4: Trade in services – France
Source: Eurostat – Balance of payments
In addition, the fast–rising imports of services
are eroding the trade surplus in services. While
still on the positive side, the trade balance in
services declined by EUR 16 billion (0.7 % of
GDP) from 2012 to 2015 to reach its lowest value
since 1999 (Graph 1.4) (2). This decline occurred
because, while exports of services grew fast
(see Section 4.4), imports were growing even
faster, accounting for the bulk of the change in the
trade balance developments in recent years.
Imports have been growing particularly fast in
technical, trade-related and other business services
since 2013, while the balance in tourism has
deteriorated since 2014, presumably as a
consequence of the recent terrorist attacks.
Tourism is the service sector where France has the
highest revealed comparative advantage (3). Thus,
developments in this sector have a large impact on
(2) According to national accounts statistics the trade balance
in services has even turned negative since 2014 and stood
at EUR −8.8 bn in 2015.
(3) Revealed comparative advantages are calculated based on a formula developed by Balassa (1966) which indicates a
country's relative advantages or disadvantages in exports
by sector. It reflects the contribution to the trade balance of each sector, on the scale of total trade in goods and services
in value, corrected by the overall trade balance.
the overall trade balance in services. The trend in
transport services is also negative: this sector has
been running a deficit since 2013, mainly driven
by a deteriorating balance in freight road transport
and passenger air transport.
External position
The trade deficit reached a trough in 2011 at
−2.6 % of GDP. The trade balance has been
steadily improving since then and reached −1.4 %
of GDP in 2015. A significant part of this
improvement is due to lower oil prices, as the trade
balance excluding energy products has been
deteriorating again since 2013. As oil prices
rebound, the total trade deficit is forecast to
increase. According to the Commission 2017
winter forecast, the trade deficit is set to reach
−2.3 % of GDP in 2018.
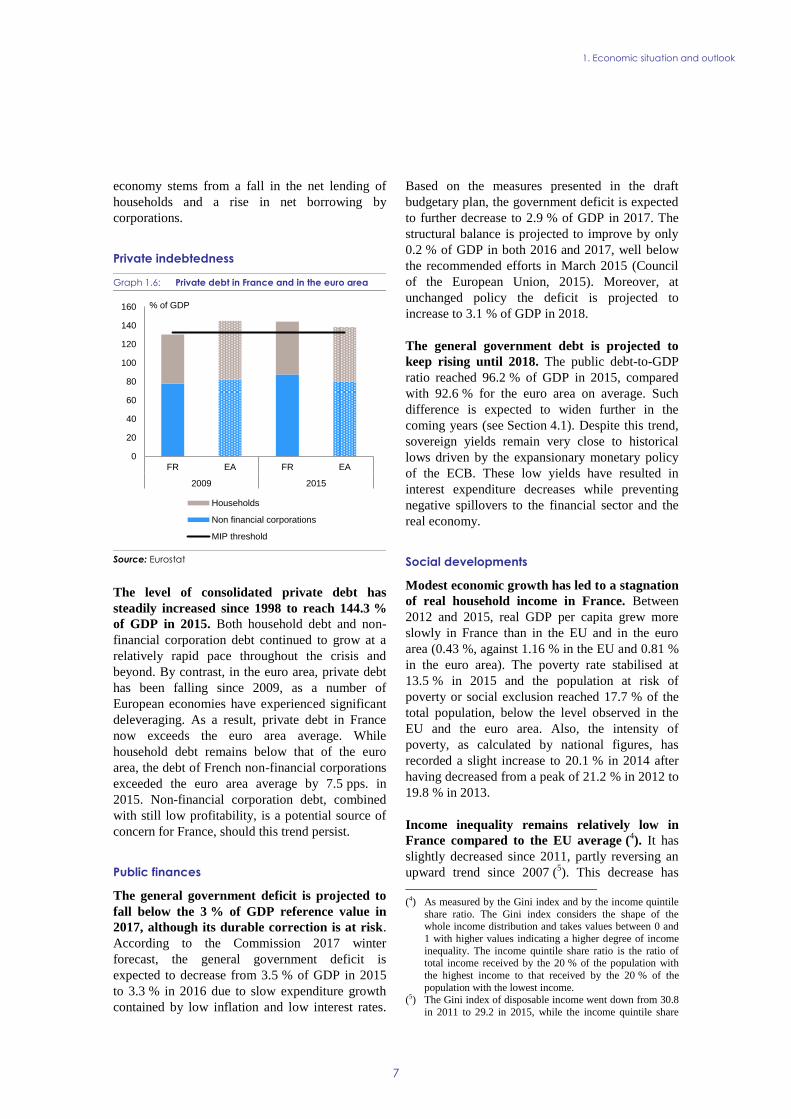
Graph 1.5: Net lending/borrowing by institutional sectors –
France
Source: Eurostat, Commission 2017 winter forecast
Net borrowing of the nation is also set to
deteriorate, to −2.4 % of GDP in 2018. In
France, all institutional sectors except households
were net borrowers in 2015 (Graph 1.5). The net
lending of households remains insufficient to fully
finance net borrowing by the general government
and by corporations. In particular, France is the
only major EU economy in which non-financial
corporations are net borrowers, while the net
borrowing of the public sector is higher than in the
euro area as a whole. Over the forecast period, the
deterioration in the net borrowing of the total
0
10
20
30
40
50
0
50
100
150
200
250
99 00 01 02 03 04 05 06 07 08 09 10 11 12 13 14 15
Trade balance of services
Exports of services
Imports of services
bn € bn €
-10
-8
-6
-4
-2
0
2
4
6
8
08 09 10 11 12 13 14 15 16(f) 17(f) 18(f)
General governmentHouseholds and NPISHNon-financial corporationsFinancial corporationsFinancial and non-financial corporationsTotal economy
% of GDP
1. Economic situation and outlook
7
economy stems from a fall in the net lending of
households and a rise in net borrowing by
corporations.
Private indebtedness
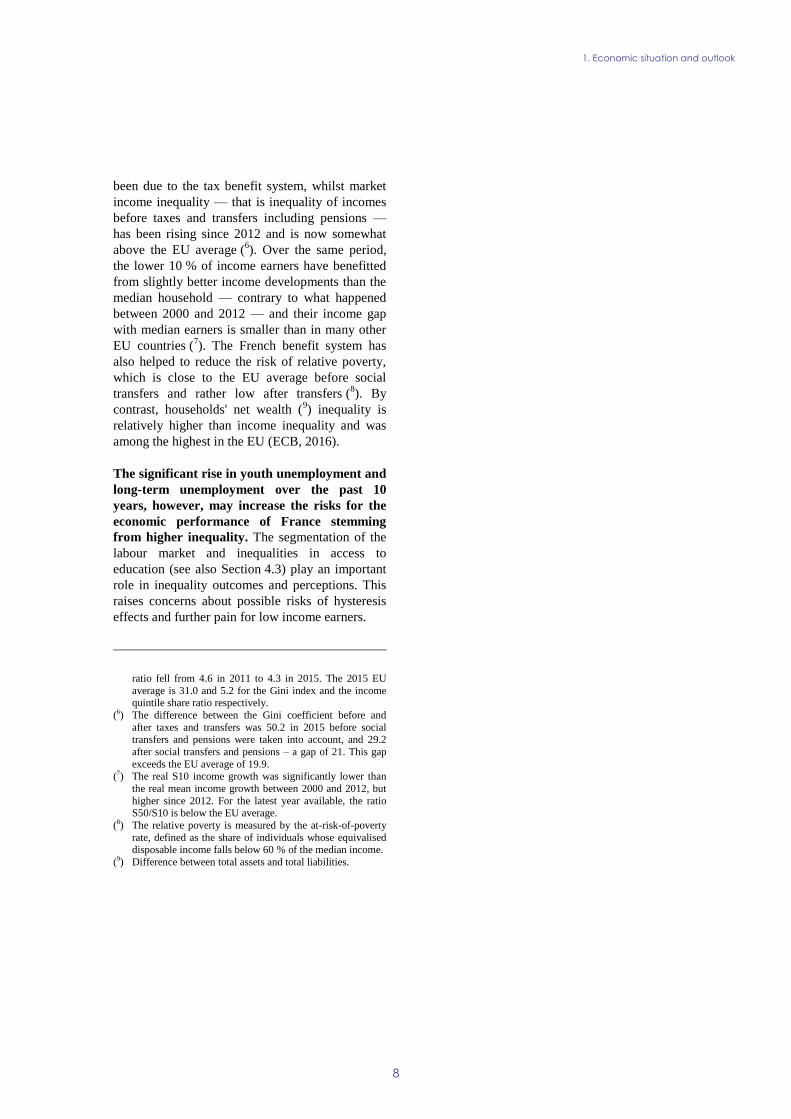
Graph 1.6: Private debt in France and in the euro area
Source: Eurostat
The level of consolidated private debt has
steadily increased since 1998 to reach 144.3 %
of GDP in 2015. Both household debt and non-
financial corporation debt continued to grow at a
relatively rapid pace throughout the crisis and
beyond. By contrast, in the euro area, private debt
has been falling since 2009, as a number of
European economies have experienced significant
deleveraging. As a result, private debt in France
now exceeds the euro area average. While
household debt remains below that of the euro
area, the debt of French non-financial corporations
exceeded the euro area average by 7.5 pps. in
2015. Non-financial corporation debt, combined
with still low profitability, is a potential source of
concern for France, should this trend persist.
Public finances
The general government deficit is projected to
fall below the 3 % of GDP reference value in
2017, although its durable correction is at risk.
According to the Commission 2017 winter
forecast, the general government deficit is
expected to decrease from 3.5 % of GDP in 2015
to 3.3 % in 2016 due to slow expenditure growth
contained by low inflation and low interest rates.
Based on the measures presented in the draft
budgetary plan, the government deficit is expected
to further decrease to 2.9 % of GDP in 2017. The
structural balance is projected to improve by only
0.2 % of GDP in both 2016 and 2017, well below
the recommended efforts in March 2015 (Council
of the European Union, 2015). Moreover, at
unchanged policy the deficit is projected to
increase to 3.1 % of GDP in 2018.
The general government debt is projected to
keep rising until 2018. The public debt-to-GDP
ratio reached 96.2 % of GDP in 2015, compared
with 92.6 % for the euro area on average. Such
difference is expected to widen further in the
coming years (see Section 4.1). Despite this trend,
sovereign yields remain very close to historical
lows driven by the expansionary monetary policy
of the ECB. These low yields have resulted in
interest expenditure decreases while preventing
negative spillovers to the financial sector and the
real economy.
Social developments
Modest economic growth has led to a stagnation
of real household income in France. Between
2012 and 2015, real GDP per capita grew more
slowly in France than in the EU and in the euro
area (0.43 %, against 1.16 % in the EU and 0.81 %
in the euro area). The poverty rate stabilised at
13.5 % in 2015 and the population at risk of
poverty or social exclusion reached 17.7 % of the
total population, below the level observed in the
EU and the euro area. Also, the intensity of
poverty, as calculated by national figures, has
recorded a slight increase to 20.1 % in 2014 after
having decreased from a peak of 21.2 % in 2012 to
19.8 % in 2013.
Income inequality remains relatively low in
France compared to the EU average (4). It has
slightly decreased since 2011, partly reversing an
upward trend since 2007 (5). This decrease has
(4) As measured by the Gini index and by the income quintile
share ratio. The Gini index considers the shape of the whole income distribution and takes values between 0 and
1 with higher values indicating a higher degree of income
inequality. The income quintile share ratio is the ratio of total income received by the 20 % of the population with
the highest income to that received by the 20 % of the
population with the lowest income. (5) The Gini index of disposable income went down from 30.8
in 2011 to 29.2 in 2015, while the income quintile share
0
20
40
60
80
100
120
140
160
FR EA FR EA
2009 2015
Households
Non financial corporations
MIP threshold
% of GDP
1. Economic situation and outlook
8
been due to the tax benefit system, whilst market
income inequality — that is inequality of incomes
before taxes and transfers including pensions —
has been rising since 2012 and is now somewhat
above the EU average (6). Over the same period,
the lower 10 % of income earners have benefitted
from slightly better income developments than the
median household — contrary to what happened
between 2000 and 2012 — and their income gap
with median earners is smaller than in many other
EU countries (7). The French benefit system has
also helped to reduce the risk of relative poverty,
which is close to the EU average before social
transfers and rather low after transfers (8). By
contrast, households' net wealth (9) inequality is
relatively higher than income inequality and was
among the highest in the EU (ECB, 2016).
The significant rise in youth unemployment and
long-term unemployment over the past 10
years, however, may increase the risks for the
economic performance of France stemming
from higher inequality. The segmentation of the
labour market and inequalities in access to
education (see also Section 4.3) play an important
role in inequality outcomes and perceptions. This
raises concerns about possible risks of hysteresis
effects and further pain for low income earners.
ratio fell from 4.6 in 2011 to 4.3 in 2015. The 2015 EU
average is 31.0 and 5.2 for the Gini index and the income quintile share ratio respectively.
(6) The difference between the Gini coefficient before and
after taxes and transfers was 50.2 in 2015 before social transfers and pensions were taken into account, and 29.2
after social transfers and pensions – a gap of 21. This gap
exceeds the EU average of 19.9. (7) The real S10 income growth was significantly lower than
the real mean income growth between 2000 and 2012, but
higher since 2012. For the latest year available, the ratio S50/S10 is below the EU average.
(8) The relative poverty is measured by the at-risk-of-poverty
rate, defined as the share of individuals whose equivalised disposable income falls below 60 % of the median income.
(9) Difference between total assets and total liabilities.
1. Economic situation and outlook
9
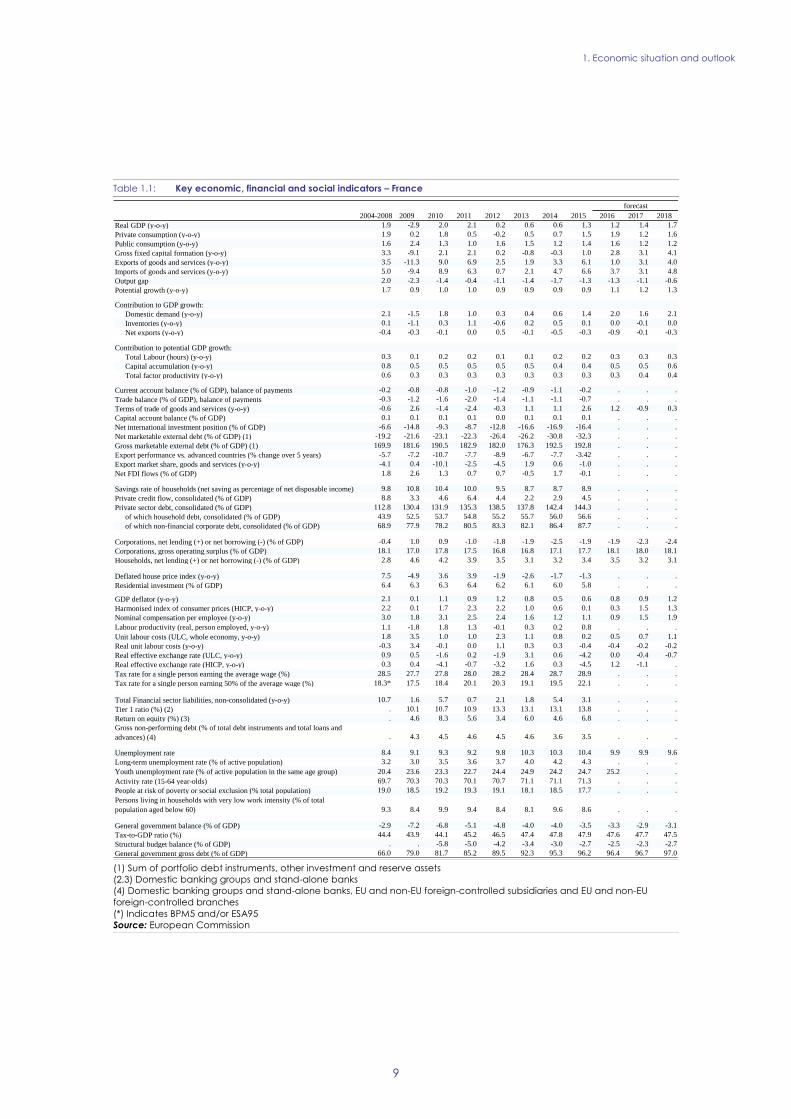
Table 1.1: Key economic, financial and social indicators – France
(1) Sum of portfolio debt instruments, other investment and reserve assets
(2,3) Domestic banking groups and stand-alone banks
(4) Domestic banking groups and stand-alone banks, EU and non-EU foreign-controlled subsidiaries and EU and non-EU
foreign-controlled branches
(*) Indicates BPM5 and/or ESA95
Source: European Commission
2004-2008 2009 2010 2011 2012 2013 2014 2015 2016 2017 2018
Real GDP (y-o-y) 1.9 -2.9 2.0 2.1 0.2 0.6 0.6 1.3 1.2 1.4 1.7
Private consumption (y-o-y) 1.9 0.2 1.8 0.5 -0.2 0.5 0.7 1.5 1.9 1.2 1.6
Public consumption (y-o-y) 1.6 2.4 1.3 1.0 1.6 1.5 1.2 1.4 1.6 1.2 1.2
Gross fixed capital formation (y-o-y) 3.3 -9.1 2.1 2.1 0.2 -0.8 -0.3 1.0 2.8 3.1 4.1
Exports of goods and services (y-o-y) 3.5 -11.3 9.0 6.9 2.5 1.9 3.3 6.1 1.0 3.1 4.0
Imports of goods and services (y-o-y) 5.0 -9.4 8.9 6.3 0.7 2.1 4.7 6.6 3.7 3.1 4.8
Output gap 2.0 -2.3 -1.4 -0.4 -1.1 -1.4 -1.7 -1.3 -1.3 -1.1 -0.6
Potential growth (y-o-y) 1.7 0.9 1.0 1.0 0.9 0.9 0.9 0.9 1.1 1.2 1.3
Contribution to GDP growth:
Domestic demand (y-o-y) 2.1 -1.5 1.8 1.0 0.3 0.4 0.6 1.4 2.0 1.6 2.1
Inventories (y-o-y) 0.1 -1.1 0.3 1.1 -0.6 0.2 0.5 0.1 0.0 -0.1 0.0
Net exports (y-o-y) -0.4 -0.3 -0.1 0.0 0.5 -0.1 -0.5 -0.3 -0.9 -0.1 -0.3
Contribution to potential GDP growth:
Total Labour (hours) (y-o-y) 0.3 0.1 0.2 0.2 0.1 0.1 0.2 0.2 0.3 0.3 0.3
Capital accumulation (y-o-y) 0.8 0.5 0.5 0.5 0.5 0.5 0.4 0.4 0.5 0.5 0.6
Total factor productivity (y-o-y) 0.6 0.3 0.3 0.3 0.3 0.3 0.3 0.3 0.3 0.4 0.4
Current account balance (% of GDP), balance of payments -0.2 -0.8 -0.8 -1.0 -1.2 -0.9 -1.1 -0.2 . . .
Trade balance (% of GDP), balance of payments -0.3 -1.2 -1.6 -2.0 -1.4 -1.1 -1.1 -0.7 . . .
Terms of trade of goods and services (y-o-y) -0.6 2.6 -1.4 -2.4 -0.3 1.1 1.1 2.6 1.2 -0.9 0.3
Capital account balance (% of GDP) 0.1 0.1 0.1 0.1 0.0 0.1 0.1 0.1 . . .
Net international investment position (% of GDP) -6.6 -14.8 -9.3 -8.7 -12.8 -16.6 -16.9 -16.4 . . .
Net marketable external debt (% of GDP) (1) -19.2 -21.6 -23.1 -22.3 -26.4 -26.2 -30.8 -32.3 . . .
Gross marketable external debt (% of GDP) (1) 169.9 181.6 190.5 182.9 182.0 176.3 192.5 192.8 . . .
Export performance vs. advanced countries (% change over 5 years) -5.7 -7.2 -10.7 -7.7 -8.9 -6.7 -7.7 -3.42 . . .
Export market share, goods and services (y-o-y) -4.1 0.4 -10.1 -2.5 -4.5 1.9 0.6 -1.0 . . .
Net FDI flows (% of GDP) 1.8 2.6 1.3 0.7 0.7 -0.5 1.7 -0.1 . . .
Savings rate of households (net saving as percentage of net disposable income) 9.8 10.8 10.4 10.0 9.5 8.7 8.7 8.9 . . .
Private credit flow, consolidated (% of GDP) 8.8 3.3 4.6 6.4 4.4 2.2 2.9 4.5 . . .
Private sector debt, consolidated (% of GDP) 112.8 130.4 131.9 135.3 138.5 137.8 142.4 144.3 . . .
of which household debt, consolidated (% of GDP) 43.9 52.5 53.7 54.8 55.2 55.7 56.0 56.6 . . .
of which non-financial corporate debt, consolidated (% of GDP) 68.9 77.9 78.2 80.5 83.3 82.1 86.4 87.7 . . .
Corporations, net lending (+) or net borrowing (-) (% of GDP) -0.4 1.0 0.9 -1.0 -1.8 -1.9 -2.5 -1.9 -1.9 -2.3 -2.4
Corporations, gross operating surplus (% of GDP) 18.1 17.0 17.8 17.5 16.8 16.8 17.1 17.7 18.1 18.0 18.1
Households, net lending (+) or net borrowing (-) (% of GDP) 2.8 4.6 4.2 3.9 3.5 3.1 3.2 3.4 3.5 3.2 3.1
Deflated house price index (y-o-y) 7.5 -4.9 3.6 3.9 -1.9 -2.6 -1.7 -1.3 . . .
Residential investment (% of GDP) 6.4 6.3 6.3 6.4 6.2 6.1 6.0 5.8 . . .
GDP deflator (y-o-y) 2.1 0.1 1.1 0.9 1.2 0.8 0.5 0.6 0.8 0.9 1.2
Harmonised index of consumer prices (HICP, y-o-y) 2.2 0.1 1.7 2.3 2.2 1.0 0.6 0.1 0.3 1.5 1.3
Nominal compensation per employee (y-o-y) 3.0 1.8 3.1 2.5 2.4 1.6 1.2 1.1 0.9 1.5 1.9
Labour productivity (real, person employed, y-o-y) 1.1 -1.8 1.8 1.3 -0.1 0.3 0.2 0.8 . . .
Unit labour costs (ULC, whole economy, y-o-y) 1.8 3.5 1.0 1.0 2.3 1.1 0.8 0.2 0.5 0.7 1.1
Real unit labour costs (y-o-y) -0.3 3.4 -0.1 0.0 1.1 0.3 0.3 -0.4 -0.4 -0.2 -0.2
Real effective exchange rate (ULC, y-o-y) 0.9 0.5 -1.6 0.2 -1.9 3.1 0.6 -4.2 0.0 -0.4 -0.7
Real effective exchange rate (HICP, y-o-y) 0.3 0.4 -4.1 -0.7 -3.2 1.6 0.3 -4.5 1.2 -1.1 .
Tax rate for a single person earning the average wage (%) 28.5 27.7 27.8 28.0 28.2 28.4 28.7 28.9 . . .
Tax rate for a single person earning 50% of the average wage (%) 18.3* 17.5 18.4 20.1 20.3 19.1 19.5 22.1 . . .
Total Financial sector liabilities, non-consolidated (y-o-y) 10.7 1.6 5.7 0.7 2.1 1.8 5.4 3.1 . . .
Tier 1 ratio (%) (2) . 10.1 10.7 10.9 13.3 13.1 13.1 13.8 . . .
Return on equity (%) (3) . 4.6 8.3 5.6 3.4 6.0 4.6 6.8 . . .
Gross non-performing debt (% of total debt instruments and total loans and
advances) (4) . 4.3 4.5 4.6 4.5 4.6 3.6 3.5 . . .
Unemployment rate 8.4 9.1 9.3 9.2 9.8 10.3 10.3 10.4 9.9 9.9 9.6
Long-term unemployment rate (% of active population) 3.2 3.0 3.5 3.6 3.7 4.0 4.2 4.3 . . .
Youth unemployment rate (% of active population in the same age group) 20.4 23.6 23.3 22.7 24.4 24.9 24.2 24.7 25.2 . .
Activity rate (15-64 year-olds) 69.7 70.3 70.3 70.1 70.7 71.1 71.1 71.3 . . .
People at risk of poverty or social exclusion (% total population) 19.0 18.5 19.2 19.3 19.1 18.1 18.5 17.7 . . .
Persons living in households with very low work intensity (% of total
population aged below 60) 9.3 8.4 9.9 9.4 8.4 8.1 9.6 8.6 . . .
General government balance (% of GDP) -2.9 -7.2 -6.8 -5.1 -4.8 -4.0 -4.0 -3.5 -3.3 -2.9 -3.1
Tax-to-GDP ratio (%) 44.4 43.9 44.1 45.2 46.5 47.4 47.8 47.9 47.6 47.7 47.5
Structural budget balance (% of GDP) . . -5.8 -5.0 -4.2 -3.4 -3.0 -2.7 -2.5 -2.3 -2.7
General government gross debt (% of GDP) 66.0 79.0 81.7 85.2 89.5 92.3 95.3 96.2 96.4 96.7 97.0
forecast
10
Progress with implementing the
recommendations addressed to France in
2016 (10
) has to be seen in a longer-term
perspective since the introduction of the
European Semester in 2011. As regards public
finances, the general government deficit was
reduced from 4.8 % of GDP in 2012 to 3.3 % in
2016 and was 1.5 pp. higher than in the rest of the
euro area in 2016. In terms of fiscal structural
reforms the sustainability of the pension schemes
has been improved, the territorial reform has
provided a framework to realise efficiency gains at
local level and the fiscal governance has been
strengthened with the setting-up of the High
Council of Public Finances. However, less
progress has been made concerning the
identification of efficiency gains in public
spending, raising concerns about the durability of
the deficit correction.
Measures have been adopted to improve the
functioning of the labour market. The cost of
labour has been reduced, notably thanks to some
fiscal measures (Sections 4.3 and 4.4). At the same
time, the 2013 accord national interprofessionnel
(ANI), the 2014 reform of the unemployment
benefit system, and the Labour Act of 8 August
2016 have aimed to tackle some of the major
rigidities hampering the good functioning of the
labour market, although the social partners' take-up
of the flexibility they offer is key in determining
their impact on the labour market segmentation.
Moreover, no ad-hoc increases of the minimum
wage have been adopted since 2012, although its
indexation mechanism has not been reviewed. The
implementation of the 2014 reform of the
vocational training system is ongoing.
The French authorities have taken some action
to improve the middle-ranking business
environment. A number of service sectors have
been reformed and access to regulated professions
has been eased in some cases. Efforts to reduce red
tape for firms have been stepped up, notably
through the multi-year simplification programme
which has been in effect since 2013. The social
dialogue law of 2015 and the 2016 budget law
have attempted to soften the impact on firms’
(10) For the assessment of other reforms implemented in the
past, see in particular section 4.
growth of size-related regulations, but their scope
has been limited overall.
The composition of the tax burden has
somewhat improved, but distortive features
remain and the potential for simplifying the tax
system remains largely untapped. The total tax
burden on companies increased between 2010 and
2013, with policy measures such as the CICE, the
responsibility and solidarity pact and the phase-out
of the C3S started to reverse the trend in 2014.
These measures have been partly financed by an
increase in VAT rates and environmental taxation,
but the burden of taxation continues to fall less on
consumption than it does in other EU countries.
While some tax expenditures were phased out at
the beginning of the period, overall the tax system
has not been simplified, with tax expenditures
rising as a share of GDP.
Overall, France has made some (11
) progress in
addressing the 2016 country-specific
recommendations, which are all relevant to the
macroeconomic imbalance procedure (MIP).
Since the publication of the CSRs, few
consolidation strategy measures have been taken
on the expenditure side and tools to rein in
spending growth have not been strengthened
significantly. Progress in addressing CSR 1 has
therefore been limited. The continued
implementation of the CICE and the responsibility
and solidarity pact (RSP) and the adoption in
August 2016 of the Labour Act suggest substantial
progress with CSR 2. Progress in implementing
CSR 3 has been limited. Employment prospects
offered by the initial vocational training system are
not satisfactory, while the reform of the
unemployment benefit system is still pending.
Some progress has been made in improving the
business environment (CSR 4). Competition has
improved in some service sectors, some very
preliminary steps are being taken to rationalise the
innovation support system and the simplification
of companies administrative, fiscal and accounting
rules is ongoing. By contrast, no action has been
taken since the end of 2015 to further reform size-
related criteria in business regulations. Finally,
(11) Information on the level of progress and actions taken to
address the policy advice in each respective subpart of a
CSR is presented in the Overview Table in the Annex. This overall assessment does not include an assessment of
compliance with the Stability and Growth Pact.
2. PROGRESS WITH COUNTRY-SPECIFIC RECOMMENDATIONS
2. Progress with country-specific recommendations
11
progress in improving the efficiency of the tax
system as called for by CSR 5 has been limited.
The statutory corporate income tax rate is starting
to be reduced in 2017 for some SMEs, but the
turnover tax (C3S) has not been entirely phased
out and no further steps have been taken to
broaden the tax base on consumption. Apart from
government plans to introduce a withholding tax
for personal income tax, very little has been done
to streamline the tax system or to broaden the tax
base on consumption. The scrapping of taxes
yielding little or no revenue continues to progress
at a very slow pace while tax expenditures keep
increasing in number and in value.
Table 2.1: Summary Table on 2016 CSR assessment
(1) The overall assessment of CSR1 does not include an assessment of compliance with the Stability and Growth Pact.
Source: European Commission
France Overall assessment of progress with 2016 CSRs: Some
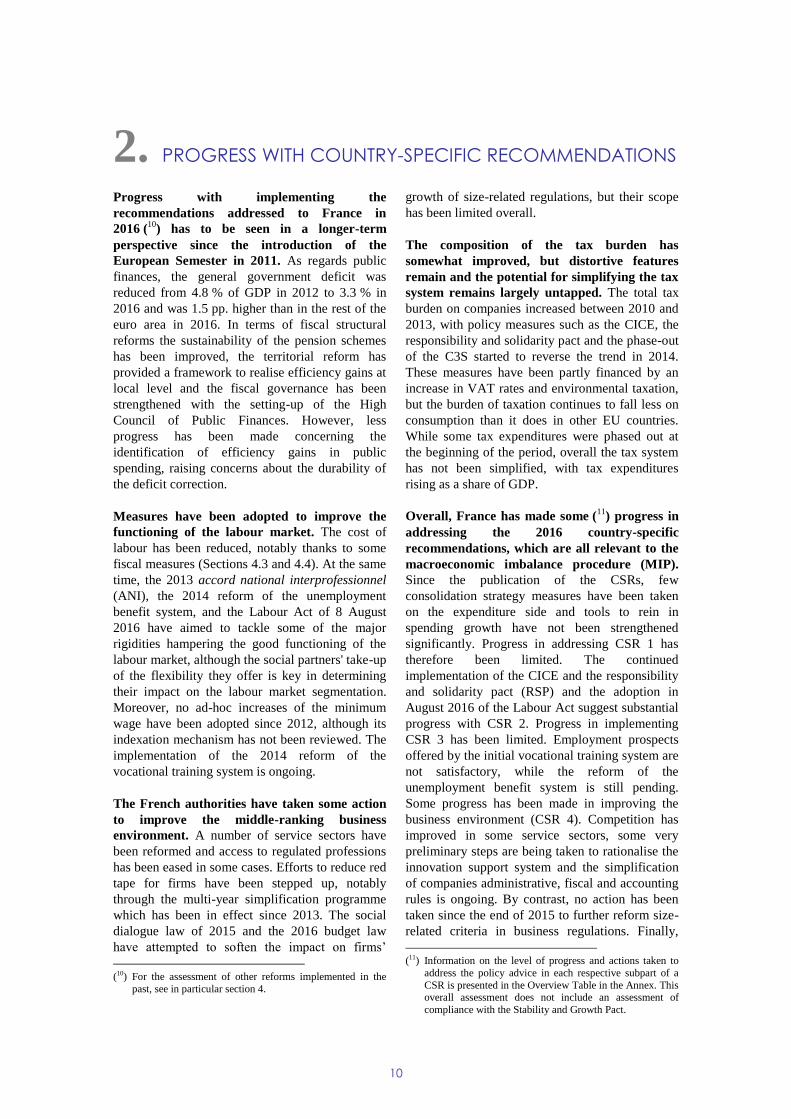
CSR 1: Ensure a durable correction of the excessive deficit
by 2017 by taking the required structural measures and by using all windfall gains for deficit and debt reduction.
Specify the expenditure cuts planned for the coming years
and step up efforts to increase the amount of savings generated by the spending reviews, including on local
government spending, by the end of 2016. Reinforce
independent public policy evaluations in order to identify efficiency gains across all sub-sectors of general
government. (MIP relevant)
Limited progress
Limited progress in reinforcing and identifying savings and efficiency gains generated by the spending reviews and
public policy evaluations.(1)
CSR 2: Ensure that the labour cost reductions are sustained
and that minimum wage developments are consistent with job creation and competitiveness. Reform the labour law to
provide more incentives for employers to hire on open-ended
contracts. (MIP relevant)
Substantial progress
Substantial progress in ensuring that labour cost reductions are sustained.
Some progress in ensuring that minimum wage
developments are consistent with job creation and competitiveness.
Substantial progress in reforming the labour law to provide more incentives for employers to hire on open-ended
contracts.
CSR 3: Improve the links between the education sector and
the labour market, in particular by reforming apprenticeships and vocational training, with emphasis on
the low-skilled. By the end of 2016, take action to reform the
unemployment benefit system in order to bring the system back to budgetary sustainability and to provide more
incentives to return to work. (MIP relevant)
Limited progress
Some progress in improving the links between the education sector and the labour market.
No progress in reforming the unemployment benefit system.
CSR 4: Remove barriers to activity in the services sector, in
particular in business services and regulated professions. Take steps to simplify and improve the efficiency of
innovation policy schemes. By the end of 2016, further
reform the size-related criteria in regulations that impede companies' growth and continue to simplify companies'
administrative, fiscal and accounting rules by pursuing the
simplification programme. (MIP relevant)
Some progress
Some progress in easing access to and exercise of activity in the services sectors.
Limited progress in improving the efficiency of innovation policy schemes.
No progress in reforming the size-related criteria in
regulations that impede companies' growth.
Some progress in pursuing the simplification programme.
CSR 5: Take action to reduce the taxes on production and
the corporate income statutory rate while broadening the tax base on consumption, in particular as regards VAT. Remove
inefficient tax expenditures, remove taxes that are yielding
little or no revenue and adopt the withholding personal income tax reform by the end of 2016. (MIP relevant)
Limited progress
Limited progress in reducing taxes on production and the corporate income tax while broadening the tax base on
consumption.
Some progress in modernizing the tax system, mainly
through adopting the withholding personal income tax. The
phasing out of tax expenditure and taxes yielding little or no
revenue is progressing very slowly.
2. Progress with country-specific recommendations
12
Box 2.1: Contribution of the EU budget to structural change
The total allocation of the European Structural and Investment Funds (ESI funds) in France amounts to EUR
28 billion under the current financial framework 2014-2020. This is equivalent to around 0.2 % of annual
GDP (calculated over the period 2014-2017) and to 4.7% of the expected national public investment (1). By
31 December 2016, an estimated EUR 6.8 billion were allocated to concrete projects. This represents around
25 % of the total allocation of ESI funds.
Financing under the European Fund for Strategic Investments (EFSI), Horizon 2020, the Connecting Europe
Facility and other directly managed EU funds is additional to the ESI funds. By end 2016, France has signed
agreements for EUR 1.9 billion for projects under the Connecting Europe Facility. The European Investment
Bank Group approved financing under EFSI amounts to EUR 4 billion as of end-2016, which is expected to
trigger nearly EUR 21 billion in total investments.
In 2015 and 2016, ESI Funds supported progress in a number of structural reforms via ex-ante
conditionalities (2) and targeted investment. Examples include smart specialisation strategies in the area of
research and innovation, in ultra-peripheral regions, the existence of waste management and the water sector
actions plans.
The relevant CSRs focusing on structural issues were taken into account when designing the 2014-2020
programmes. These included improving access and quality of initial and continuous education and training;
reinforcing active labour market policy for the most vulnerable; addressing early-school leaving; reducing
poverty and social exclusion; and increasing investment in research and innovation in the specialisation
domains identified in regional innovation strategies. To date, almost 199 000 young people have been
supported under measures financed under the Youth Employment Initiative (YEI); of whom nearly 52 000
are in employment, education or training after the end of the YEI support. The YEI supported in particular
the Garantie Jeunes, a specific intensive counselling and training scheme that targeted people who are not in
education, employment, or training (NEETS).
(1) National public investment is defined as the sum of gross capital formation, investment grants, and national
expenditure on agriculture and fisheries. (2) Before programmes are adopted, Member States are required to comply with a number of ex-ante conditionalities,
which aim at improving framework and conditions for the majority of public investments areas. For Members States
that did not fulfil all the ex-ante conditionalities by the end 2016, the Commission has the possibility to propose the temporary suspension of all or part of interim payments.
13
The 2017 Alert Mechanism Report (European
Commission, 2016b) called for further in-depth
analysis to monitor progress in the unwinding of
the excessive imbalances identified in the 2016
MIP cycle. The selection was motivated by the fact
that France was identified with excessive
imbalances in spring 2016 after an in-depth
analysis, so that a new in-depth review is needed to
assess how these imbalances evolve. The identified
excessive macroeconomic imbalances related to a
weak competitiveness and a high and increasing
public debt, in a context of low productivity
growth. Other vulnerabilities were identified,
including as regards the segmentation of the labour
market, the innovation capacity, the limited
efficiency of public spending and the complex tax
system, which weighs significantly on production
factors, as highlighted in the Review of progress
on policy measures relevant for the correction of
macroeconomic imbalances (European
Commission, 2017c). These vulnerabilities have
cross-border relevance.
Analyses included in this Country Report
provide an In-Depth Review (IDR) into how the
identified imbalances have developed. In
particular, IDR-relevant analysis is found in the
following sections: sources of imbalances related
to public debt are covered in section 4.1; the
situation of the financial sector in section 4.2;
sources of imbalances related to competitiveness in
section 4.4; and vulnerabilities associated with
market performance of the services sector in
section 4.5. Potential spillovers to the rest of the
euro area are discussed in box 3.1.
Imbalances and their gravity
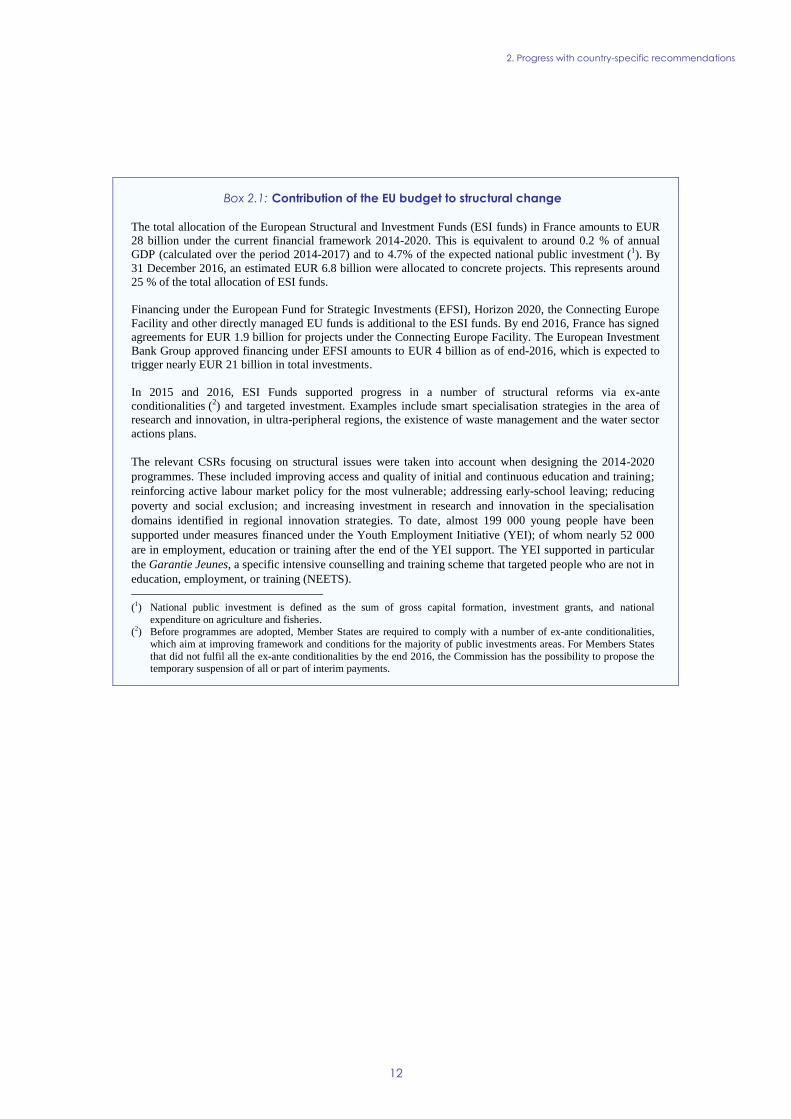
French export performance has deteriorated
significantly over the past 15 years. Since 1999,
its export market shares have fallen by 36.8 % in
value (Graph 3.1), compared to 20.4 % for the euro
area as a whole. In volume, the decline is also
significant (−25.4 %, against −11.0 % in the euro
area). This loss in export market share, linked to a
deterioration of both cost and non-cost
competitiveness, has weighed on growth
outcomes. At the same time, external sustainability
is not a concern for France in the near term as its
net international investment position remains
contained at −16 % of GDP (after −17 % in 2014).
Graph 3.1: Export market shares in value and in volume –
France and euro area
Source: Eurostat, IMF
Cost competitiveness deteriorated markedly
from 1999 to 2013. Unit labour costs increased at
a faster pace in France in both nominal and real
terms. From 1999 to 2008, the loss of cost
competitiveness was largely due to containment of
unit labour costs in the rest of the euro area, in
particular in Germany. From 2008 to 2013, there
was a disconnection between the trend in nominal
unit labour costs and the GDP deflator in France,
in a context of low productivity growth. This
resulted in a further decline in the relative cost
competitiveness in that period, this time for
domestic reasons.
Weak non-cost competitiveness has also
weighed on export performance. Despite reform
efforts, the French business environment continues
to be characterised by a relatively high regulatory
burden. Complex labour regulations, high
corporate tax rates and a complex tax system
continue to weigh on firms. Rigidities persist in a
number of sectors and prevent the downward
adjustment of tariffs to the detriment of
downstream industries that use these services.
Increased size-related social and fiscal obligations
give rise to threshold effects and discourage firms
from growing with implications for labour
60
65
70
75
80
85
90
95
100
105
110
99 00 01 02 03 04 05 06 07 08 09 10 11 12 13 14 15
FR (in value) FR (in volume)
EA (in value) EA (in volume)
1999 = 100
3. SUMMARY OF THE MAIN FINDINGS FROM THE MIP IN-
DEPTH REVIEW
3. Summary of the main findings from the MIP in-depth review
14
productivity and competitiveness. The low
profitability of non-financial corporations also
weighs on France’s non-cost competitiveness,
through its impact on the quality of investment.
Although corporate investment is relatively high
and supported by favourable macroeconomic and
framework conditions, it tends to be concentrated
in less productive purposes thereby weighing on
productivity growth.
The high public debt-to-GDP ratio is a major
source of vulnerability and compounds the risks
stemming from the weak competitiveness of the
French economy. High public debt weighs on
growth prospects by crowding out productive
public expenditure and requiring a higher tax
burden. However, in the current context of also
high (though stable) private sector debt, still weak
growth, low inflation and heightened uncertainty,
not only is public deleveraging more difficult, but
also high public debt makes France more
vulnerable as it might give rise to negative
feedback loops to the real economy and the
financial sector should a new wave of negative
shocks materialise. Moreover, sustainability risks
in the medium term are high, partly due to the
projected increase in age-related expenditure.
Given the size of the French economy, such a
situation could also entail potentially negative
spillovers to the rest of the euro area (see also
Box 3.1 on euro area spillovers).
Evolution, prospects and policy responses
Export performance remains subdued. Export
market shares have stabilised since 2012 but
export growth stalled in 2016 and is expected to
fall well short of both world trade and French
export market growth. The current account deficit
rose to −1.2 % of GDP in 2016 according to
annualised monthly data (after −0.2 % in 2015)
and is expected to deteriorate further. Taking into
account the relative position of the French
economy in the business cycle, the cyclically-
adjusted current account deficit is worse than the
headline indicator.
Cost competitiveness is improving without
having fully regained past losses. The labour tax
cuts and continued wage moderation have allowed
a slowdown of labour costs, but low productivity
growth is preventing cost competitiveness from
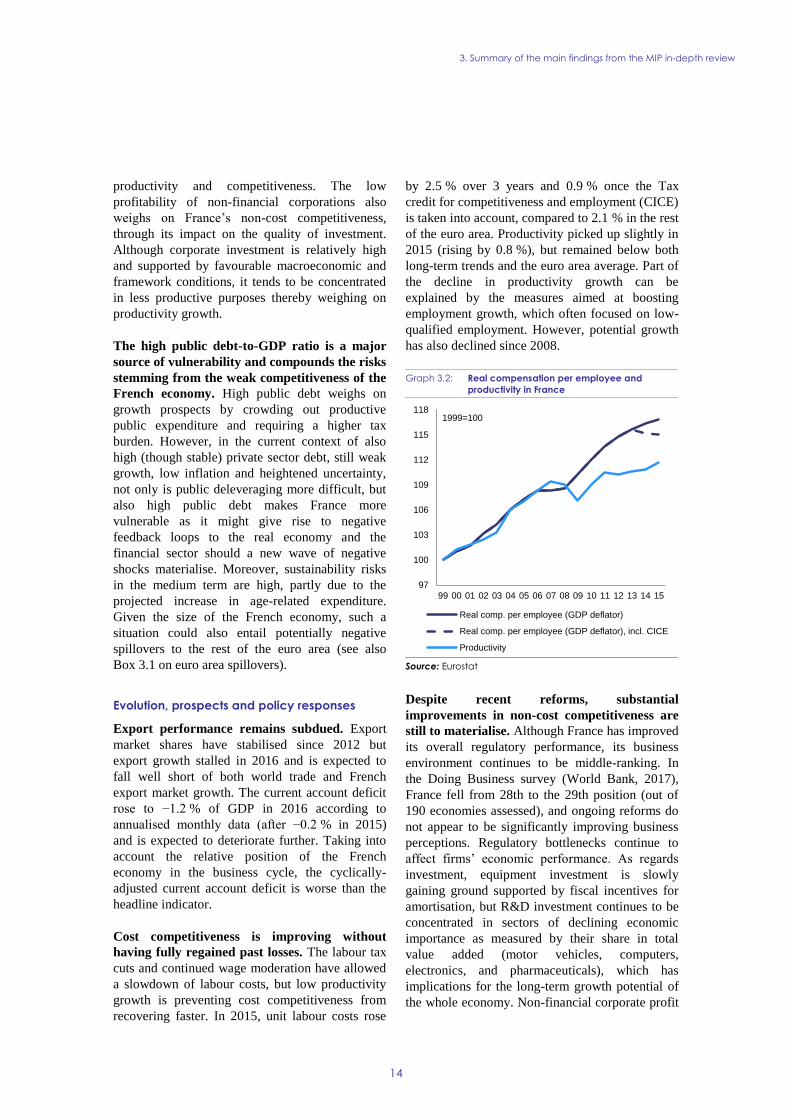
recovering faster. In 2015, unit labour costs rose
by 2.5 % over 3 years and 0.9 % once the Tax
credit for competitiveness and employment (CICE)
is taken into account, compared to 2.1 % in the rest
of the euro area. Productivity picked up slightly in
2015 (rising by 0.8 %), but remained below both
long-term trends and the euro area average. Part of
the decline in productivity growth can be
explained by the measures aimed at boosting
employment growth, which often focused on low-
qualified employment. However, potential growth
has also declined since 2008.
Graph 3.2: Real compensation per employee and
productivity in France
Source: Eurostat
Despite recent reforms, substantial
improvements in non-cost competitiveness are
still to materialise. Although France has improved
its overall regulatory performance, its business
environment continues to be middle-ranking. In
the Doing Business survey (World Bank, 2017),
France fell from 28th to the 29th position (out of
190 economies assessed), and ongoing reforms do
not appear to be significantly improving business
perceptions. Regulatory bottlenecks continue to
affect firms’ economic performance. As regards
investment, equipment investment is slowly
gaining ground supported by fiscal incentives for
amortisation, but R&D investment continues to be
concentrated in sectors of declining economic
importance as measured by their share in total
value added (motor vehicles, computers,
electronics, and pharmaceuticals), which has
implications for the long-term growth potential of
the whole economy. Non-financial corporate profit
97
100
103
106
109
112
115
118
99 00 01 02 03 04 05 06 07 08 09 10 11 12 13 14 15
Real comp. per employee (GDP deflator)
Real comp. per employee (GDP deflator), incl. CICE
Productivity
1999=100
3. Summary of the main findings from the MIP in-depth review
15
margins have somewhat recovered since 2013, in
part due to the labour tax wedge cuts and to lower
oil prices, but they remain below their pre-crisis
level.
Some action has been taken to improve
competitiveness. France has taken some measures
to address the rigidity of the wage setting process
through the labour law adopted in 2016, which
provides for company-level majority agreements
on working time. The impact of this law on the
competitiveness of the French economy, however,
will depend on its implementation and the extent to
which the social dialogue at firm level will be able
to transform the new legal possibilities granted by
law into tangible action. Also, while no ad-hoc
increase in the minimum wage has been adopted
since 2012, no revision of its indexation
mechanism has been undertaken and the French
labour market remains both segmented and
insufficiently linked with the vocational training
system. As regards the business environment,
competition has been improved in a number of
services sectors, including legal professions, retail
trade and passenger transport services. Some effort
is also being made to simplify firms'
administrative, fiscal and accounting rules through
the multiannual simplification programme.
However, the tax system remains a drag on
competitiveness despite recent reforms. Corporate
taxes are still high and France has abandoned the
phase-out of the last tranche of the turnover tax
(C3S), while the tax base on consumption remains
narrow.
Public debt is projected to keep rising due to
still high deficits. The general government debt-
to-GDP ratio is expected to increase to 97 % of
GDP in 2018, which implies growing divergence
in indebtedness vis-à-vis the euro area due to a
slower pace of deficit reduction than in the rest of
the EU (see Sections 1 and 4). The budgetary
strategy, which is to meet just the nominal
headline deficit targets, basically relies on
favourable macroeconomic conditions and interest
rate windfalls. Such a strategy is risky as, on the
one hand, it does not ensure durable correction of
the excessive deficit and, on the other hand, there
are significant consolidation needs in the coming
years to bring down the public debt.
Spending dynamics prove hard to contain.
Despite France's efforts to contain spending
increases in recent years, the consolidation
measures in the 2017 budget law have been scaled
down compared to the plans included in the April
2016 stability programme. Overall, the current
primary expenditure ratio, this is expenditure
minus the interest burden and public investment,
has continued increasing since 2012. While
spending reviews identified a considerable amount
of potential saving measures, the budgetary
measures adopted as a result of the spending
reviews have had a limited yield and have not
contributed so far to significantly improve public
spending efficiency. Furthermore, as demonstrated
in last year's country report, in key areas of public
policy, e.g. pensions and healthcare, France
achieves good results but other Member States
reach same or better outcomes at a lower cost. In
turn, the tax burden is high, with the tax system
remaining too complex and heavily reliant on
production factors, which reins in growth.
High sustainability risks show up in the
medium term mainly due to the high initial
deficit and debt ratio. Despite the high debt ratio,
short term sustainability risks are considered as
low (see section 4.1). France is able to issue long-
term debt at very low rates also bearing in mind
the expansionary monetary policy stance of the
ECB. However, the high initial deficit and debt
and the projected increase in age-related
expenditure over the next 15 years lead to a
significant sustainability gap in the medium term.
Overall assessment
France faces important sources of imbalances
related to a weak competitiveness and high and
increasing public debt, in a context of low
productivity growth. The substantial
improvement in export performance in 2015 has
proved short-lived. The current account, close to
balance in 2015, is expected to deteriorate
significantly in the coming years. Cost
competitiveness is improving but has not regained
past losses. Wage moderation continues, but the
decline in productivity growth prevents a faster
recovery of France’s cost competitiveness. The
product market reforms of the last years and
continued efforts to reduce red tape on firms could
contribute to an improvement of non-cost
competitiveness but there is still substantial scope
to increase market competition, simplify
regulation, and reduce the tax burden for
3. Summary of the main findings from the MIP in-depth review
16
companies. Public debt remains high and
increasing, which represents a major imbalance, as
it weighs on growth prospects and reduces the
fiscal space to offset adverse macroeconomic
shocks. Public debt reduction is thus important to
help improve overall French macroeconomic
performance and avert medium-term sustainability
risks.
Policy measures have been taken in recent years
in particular to reduce the labour tax wedge.
However, policy challenges remain, in particular
as regards the regulatory impediments to firms’
growth, the initial and continuous system of
vocational training and the reform of the
unemployment benefit system. In addition, the
spending review has not delivered the expected
results to address the growing public debt-to-GDP
ratio.
3. Summary of the main findings from the MIP in-depth review
17
(Continued on the next page)
Box 3.1: Euro area spillovers
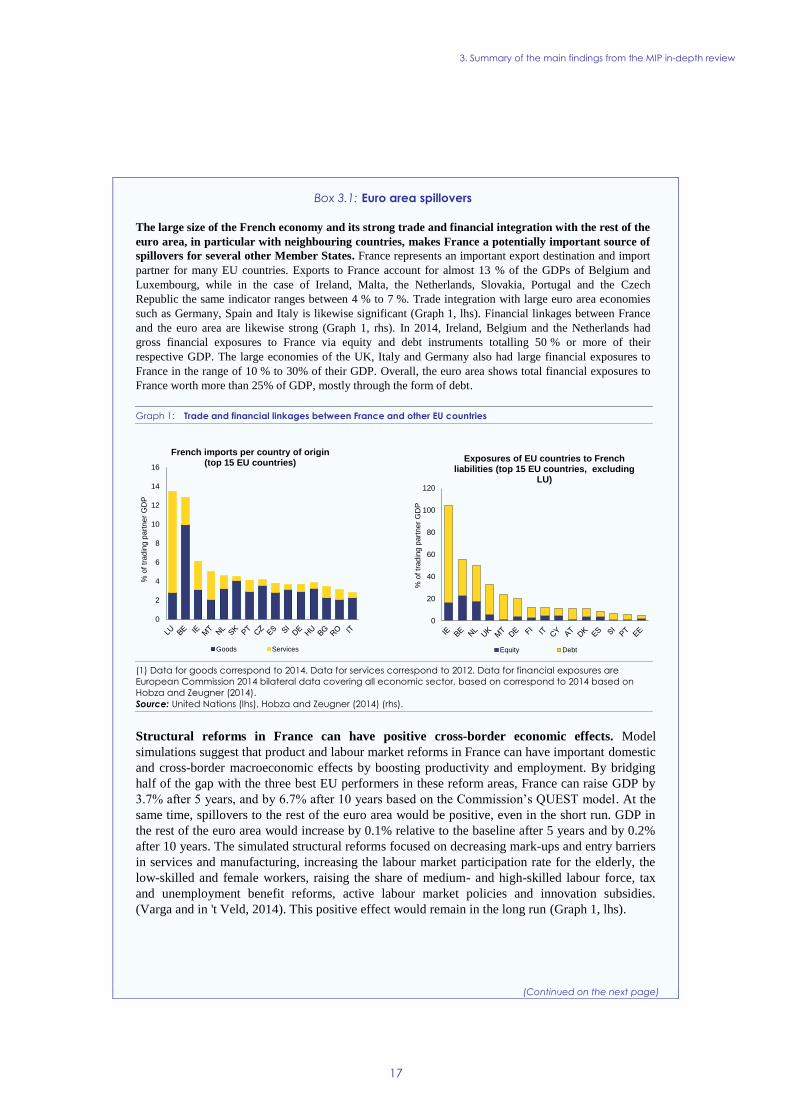
The large size of the French economy and its strong trade and financial integration with the rest of the
euro area, in particular with neighbouring countries, makes France a potentially important source of
spillovers for several other Member States. France represents an important export destination and import
partner for many EU countries. Exports to France account for almost 13 % of the GDPs of Belgium and
Luxembourg, while in the case of Ireland, Malta, the Netherlands, Slovakia, Portugal and the Czech
Republic the same indicator ranges between 4 % to 7 %. Trade integration with large euro area economies
such as Germany, Spain and Italy is likewise significant (Graph 1, lhs). Financial linkages between France
and the euro area are likewise strong (Graph 1, rhs). In 2014, Ireland, Belgium and the Netherlands had
gross financial exposures to France via equity and debt instruments totalling 50 % or more of their
respective GDP. The large economies of the UK, Italy and Germany also had large financial exposures to
France in the range of 10 % to 30% of their GDP. Overall, the euro area shows total financial exposures to
France worth more than 25% of GDP, mostly through the form of debt.
Graph 1: Trade and financial linkages between France and other EU countries
(1) Data for goods correspond to 2014. Data for services correspond to 2012. Data for financial exposures are
European Commission 2014 bilateral data covering all economic sector, based on correspond to 2014 based on
Hobza and Zeugner (2014).
Source: United Nations (lhs), Hobza and Zeugner (2014) (rhs).
Structural reforms in France can have positive cross-border economic effects. Model
simulations suggest that product and labour market reforms in France can have important domestic
and cross-border macroeconomic effects by boosting productivity and employment. By bridging
half of the gap with the three best EU performers in these reform areas, France can raise GDP by
3.7% after 5 years, and by 6.7% after 10 years based on the Commission’s QUEST model. At the
same time, spillovers to the rest of the euro area would be positive, even in the short run. GDP in
the rest of the euro area would increase by 0.1% relative to the baseline after 5 years and by 0.2%
after 10 years. The simulated structural reforms focused on decreasing mark-ups and entry barriers
in services and manufacturing, increasing the labour market participation rate for the elderly, the
low-skilled and female workers, raising the share of medium- and high-skilled labour force, tax
and unemployment benefit reforms, active labour market policies and innovation subsidies.
(Varga and in 't Veld, 2014). This positive effect would remain in the long run (Graph 1, lhs).
0
2
4
6
8
10
12
14
16
% o
f tr
adin
g p
art
ner
GD
P
French imports per country of origin (top 15 EU countries)
Goods Services
0
20
40
60
80
100
120
% o
f tr
adin
g p
art
ner
GD
P
Exposures of EU countries to French liabilities (top 15 EU countries, excluding
LU)
Equity Debt
3. Summary of the main findings from the MIP in-depth review
18
Box (continued)
Graph 2: Macroeconomic effects of structural reforms in France
(1) Left-hand side simulations are based on Varga and in't Veld (2014), percentage deviations from baseline
Source: European Commission
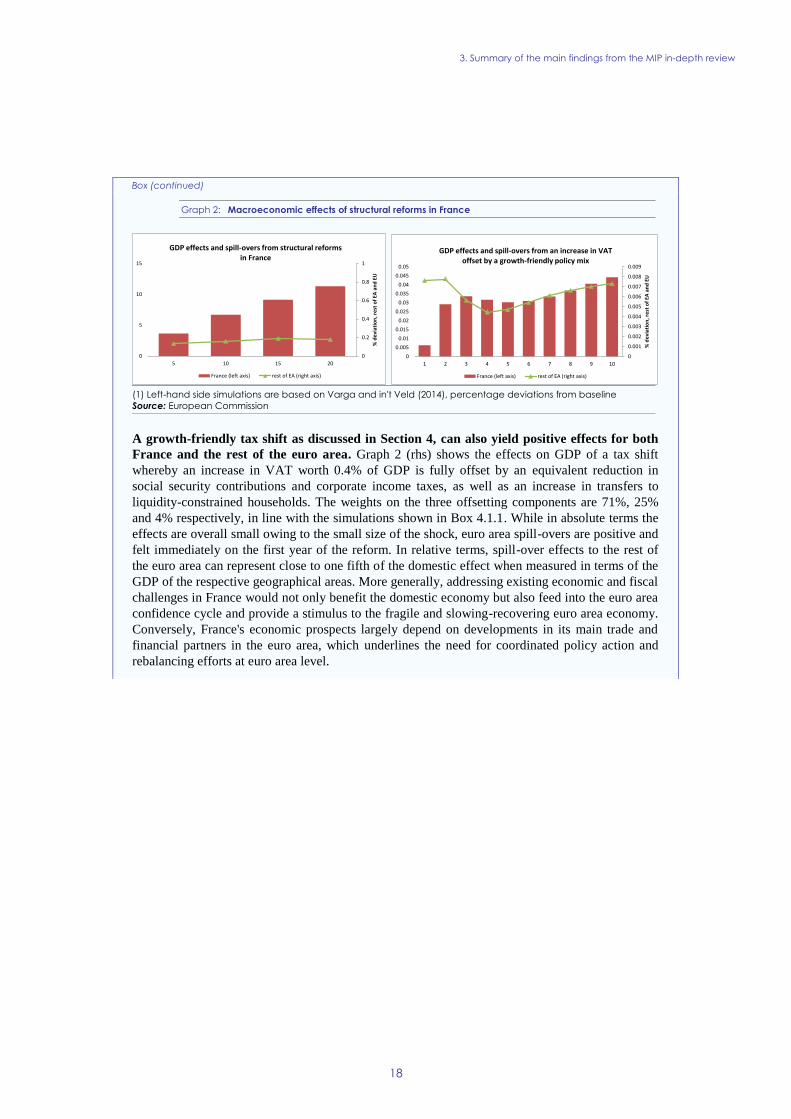
A growth-friendly tax shift as discussed in Section 4, can also yield positive effects for both
France and the rest of the euro area. Graph 2 (rhs) shows the effects on GDP of a tax shift
whereby an increase in VAT worth 0.4% of GDP is fully offset by an equivalent reduction in
social security contributions and corporate income taxes, as well as an increase in transfers to
liquidity-constrained households. The weights on the three offsetting components are 71%, 25%
and 4% respectively, in line with the simulations shown in Box 4.1.1. While in absolute terms the
effects are overall small owing to the small size of the shock, euro area spill-overs are positive and
felt immediately on the first year of the reform. In relative terms, spill-over effects to the rest of
the euro area can represent close to one fifth of the domestic effect when measured in terms of the
GDP of the respective geographical areas. More generally, addressing existing economic and fiscal
challenges in France would not only benefit the domestic economy but also feed into the euro area
confidence cycle and provide a stimulus to the fragile and slowing-recovering euro area economy.
Conversely, France's economic prospects largely depend on developments in its main trade and
financial partners in the euro area, which underlines the need for coordinated policy action and
rebalancing efforts at euro area level.
0
0.2
0.4
0.6
0.8
1
0
5
10
15
5 10 15 20
% d
evi
atio
n, r
est
of
EA a
nd
EU
France (left axis) rest of EA (right axis)
GDP effects and spill-overs from structural reforms in France
0
0.001
0.002
0.003
0.004
0.005
0.006
0.007
0.008
0.009
0
0.005
0.01
0.015
0.02
0.025
0.03
0.035
0.04
0.045
0.05
1 2 3 4 5 6 7 8 9 10
% d
evi
atio
n, r
est
of
EA a
nd
EU
France (left axis) rest of EA (right axis)
GDP effects and spill-overs from an increase in VAT offset by a growth-friendly policy mix
3. Summary of the main findings from the MIP in-depth review
19
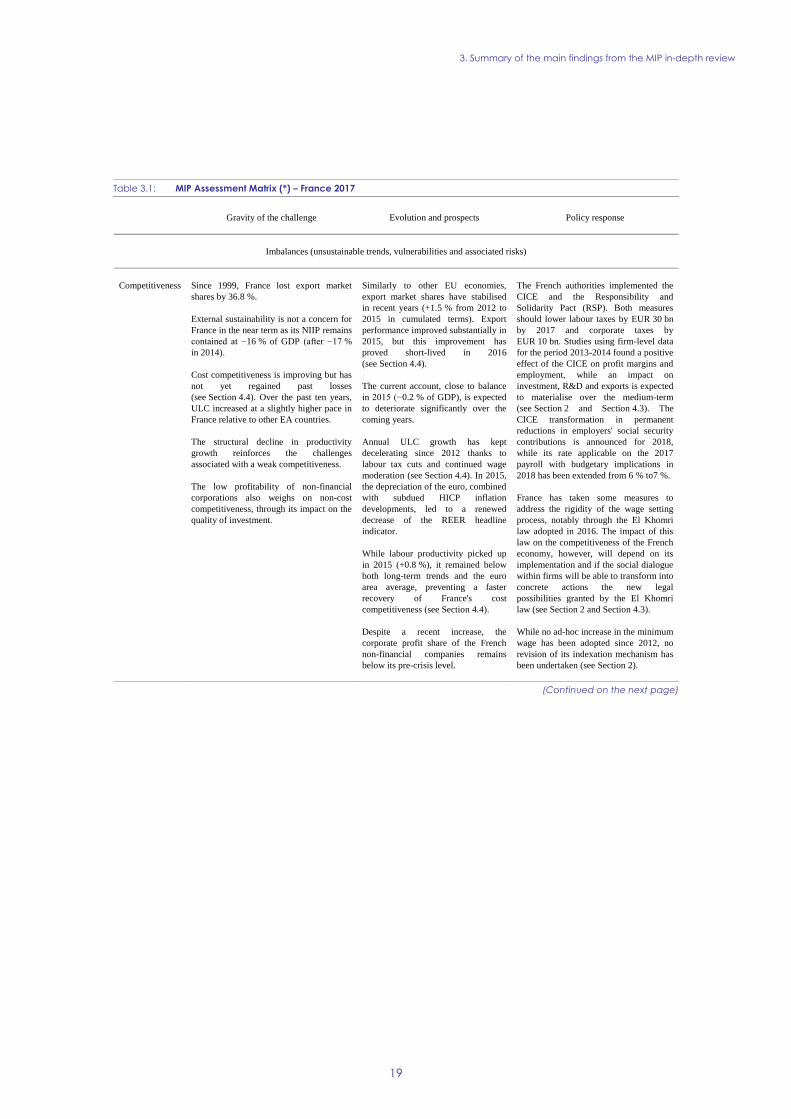
Table 3.1: MIP Assessment Matrix (*) – France 2017
(Continued on the next page)
Gravity of the challenge Evolution and prospects Policy response
Imbalances (unsustainable trends, vulnerabilities and associated risks)
Competitiveness Since 1999, France lost export market
shares by 36.8 %.
External sustainability is not a concern for
France in the near term as its NIIP remains
contained at −16 % of GDP (after −17 %
in 2014).
Cost competitiveness is improving but has
not yet regained past losses
(see Section 4.4). Over the past ten years,
ULC increased at a slightly higher pace in
France relative to other EA countries.
The structural decline in productivity
growth reinforces the challenges
associated with a weak competitiveness.
The low profitability of non-financial
corporations also weighs on non-cost
competitiveness, through its impact on the
quality of investment.
Similarly to other EU economies,
export market shares have stabilised
in recent years (+1.5 % from 2012 to
2015 in cumulated terms). Export
performance improved substantially in
2015, but this improvement has
proved short-lived in 2016
(see Section 4.4).
The current account, close to balance
in 2015 (−0.2 % of GDP), is expected
to deteriorate significantly over the
coming years.
Annual ULC growth has kept
decelerating since 2012 thanks to
labour tax cuts and continued wage
moderation (see Section 4.4). In 2015,
the depreciation of the euro, combined
with subdued HICP inflation
developments, led to a renewed
decrease of the REER headline
indicator.
While labour productivity picked up
in 2015 (+0.8 %), it remained below
both long-term trends and the euro
area average, preventing a faster
recovery of France's cost
competitiveness (see Section 4.4).
Despite a recent increase, the
corporate profit share of the French
non-financial companies remains
below its pre-crisis level.
The French authorities implemented the
CICE and the Responsibility and
Solidarity Pact (RSP). Both measures
should lower labour taxes by EUR 30 bn
by 2017 and corporate taxes by
EUR 10 bn. Studies using firm-level data
for the period 2013-2014 found a positive
effect of the CICE on profit margins and
employment, while an impact on
investment, R&D and exports is expected
to materialise over the medium-term
(see Section 2 and Section 4.3). The
CICE transformation in permanent
reductions in employers' social security
contributions is announced for 2018,
while its rate applicable on the 2017
payroll with budgetary implications in
2018 has been extended from 6 % to7 %.
France has taken some measures to
address the rigidity of the wage setting
process, notably through the El Khomri
law adopted in 2016. The impact of this
law on the competitiveness of the French
economy, however, will depend on its
implementation and if the social dialogue
within firms will be able to transform into
concrete actions the new legal
possibilities granted by the El Khomri
law (see Section 2 and Section 4.3).
While no ad-hoc increase in the minimum
wage has been adopted since 2012, no
revision of its indexation mechanism has
been undertaken (see Section 2).
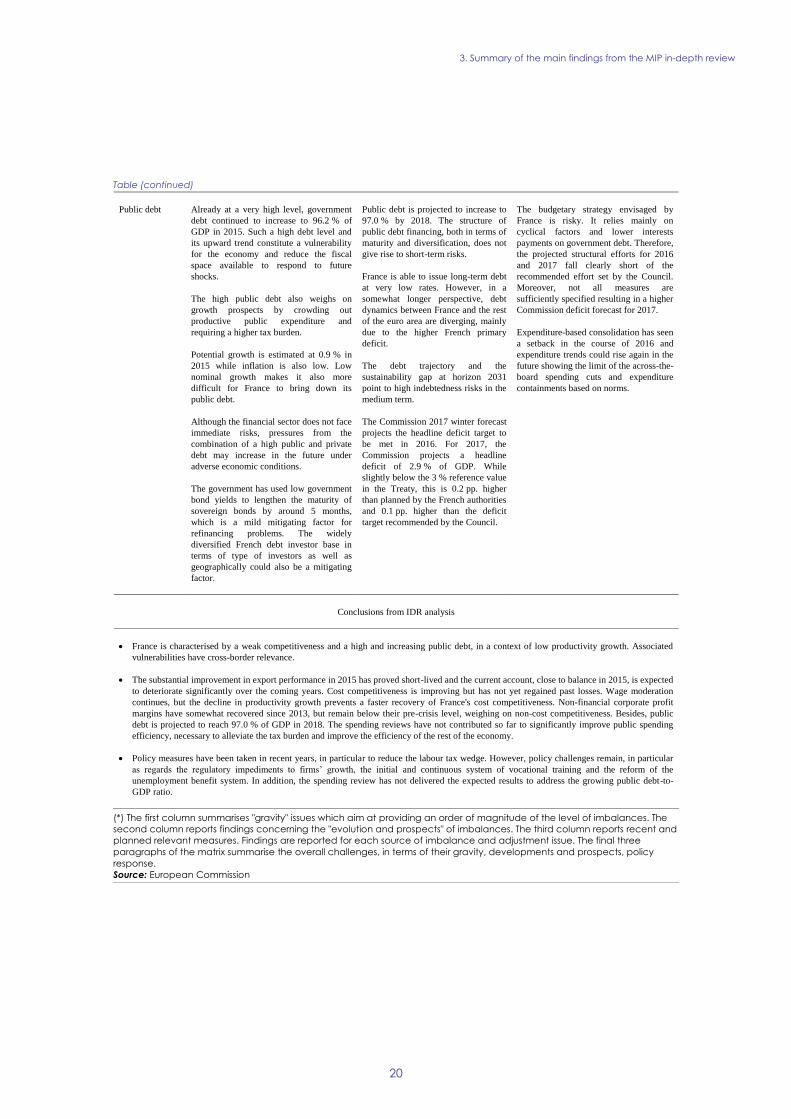
3. Summary of the main findings from the MIP in-depth review
20
Table (continued)
(*) The first column summarises "gravity" issues which aim at providing an order of magnitude of the level of imbalances. The
second column reports findings concerning the "evolution and prospects" of imbalances. The third column reports recent and
planned relevant measures. Findings are reported for each source of imbalance and adjustment issue. The final three
paragraphs of the matrix summarise the overall challenges, in terms of their gravity, developments and prospects, policy
response.
Source: European Commission
Public debt Already at a very high level, government
debt continued to increase to 96.2 % of
GDP in 2015. Such a high debt level and
its upward trend constitute a vulnerability
for the economy and reduce the fiscal
space available to respond to future
shocks.
The high public debt also weighs on
growth prospects by crowding out
productive public expenditure and
requiring a higher tax burden.
Potential growth is estimated at 0.9 % in
2015 while inflation is also low. Low
nominal growth makes it also more
difficult for France to bring down its
public debt.
Although the financial sector does not face
immediate risks, pressures from the
combination of a high public and private
debt may increase in the future under
adverse economic conditions.
The government has used low government
bond yields to lengthen the maturity of
sovereign bonds by around 5 months,
which is a mild mitigating factor for
refinancing problems. The widely
diversified French debt investor base in
terms of type of investors as well as
geographically could also be a mitigating
factor.
Public debt is projected to increase to
97.0 % by 2018. The structure of
public debt financing, both in terms of
maturity and diversification, does not
give rise to short-term risks.
France is able to issue long-term debt
at very low rates. However, in a
somewhat longer perspective, debt
dynamics between France and the rest
of the euro area are diverging, mainly
due to the higher French primary
deficit.
The debt trajectory and the
sustainability gap at horizon 2031
point to high indebtedness risks in the
medium term.
The Commission 2017 winter forecast
projects the headline deficit target to
be met in 2016. For 2017, the
Commission projects a headline
deficit of 2.9 % of GDP. While
slightly below the 3 % reference value
in the Treaty, this is 0.2 pp. higher
than planned by the French authorities
and 0.1 pp. higher than the deficit
target recommended by the Council.
The budgetary strategy envisaged by
France is risky. It relies mainly on
cyclical factors and lower interests
payments on government debt. Therefore,
the projected structural efforts for 2016
and 2017 fall clearly short of the
recommended effort set by the Council.
Moreover, not all measures are
sufficiently specified resulting in a higher
Commission deficit forecast for 2017.
Expenditure-based consolidation has seen
a setback in the course of 2016 and
expenditure trends could rise again in the
future showing the limit of the across-the-
board spending cuts and expenditure
containments based on norms.
Conclusions from IDR analysis
France is characterised by a weak competitiveness and a high and increasing public debt, in a context of low productivity growth. Associated
vulnerabilities have cross-border relevance.
The substantial improvement in export performance in 2015 has proved short-lived and the current account, close to balance in 2015, is expected
to deteriorate significantly over the coming years. Cost competitiveness is improving but has not yet regained past losses. Wage moderation
continues, but the decline in productivity growth prevents a faster recovery of France's cost competitiveness. Non-financial corporate profit
margins have somewhat recovered since 2013, but remain below their pre-crisis level, weighing on non-cost competitiveness. Besides, public
debt is projected to reach 97.0 % of GDP in 2018. The spending reviews have not contributed so far to significantly improve public spending
efficiency, necessary to alleviate the tax burden and improve the efficiency of the rest of the economy.
Policy measures have been taken in recent years, in particular to reduce the labour tax wedge. However, policy challenges remain, in particular
as regards the regulatory impediments to firms’ growth, the initial and continuous system of vocational training and the reform of the
unemployment benefit system. In addition, the spending review has not delivered the expected results to address the growing public debt-to-
GDP ratio.
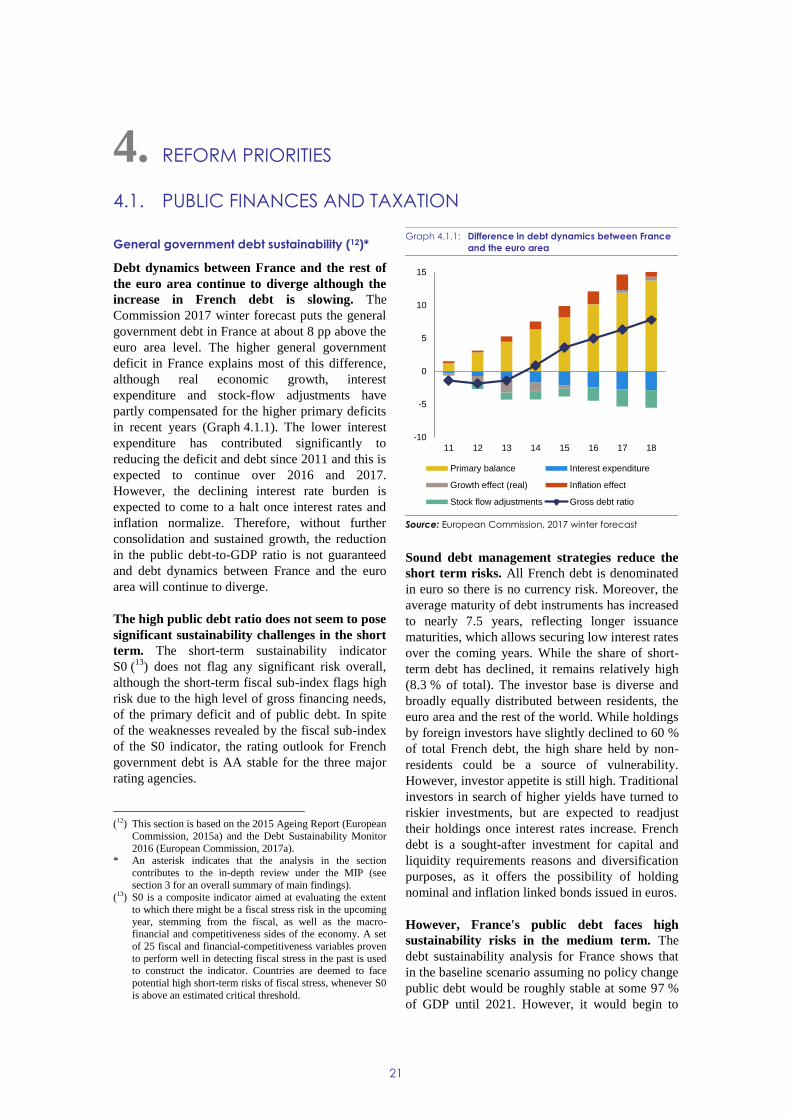
21
General government debt sustainability (12)*
Debt dynamics between France and the rest of
the euro area continue to diverge although the
increase in French debt is slowing. The
Commission 2017 winter forecast puts the general
government debt in France at about 8 pp above the
euro area level. The higher general government
deficit in France explains most of this difference,
although real economic growth, interest
expenditure and stock-flow adjustments have
partly compensated for the higher primary deficits
in recent years (Graph 4.1.1). The lower interest
expenditure has contributed significantly to
reducing the deficit and debt since 2011 and this is
expected to continue over 2016 and 2017.
However, the declining interest rate burden is
expected to come to a halt once interest rates and
inflation normalize. Therefore, without further
consolidation and sustained growth, the reduction
in the public debt-to-GDP ratio is not guaranteed
and debt dynamics between France and the euro
area will continue to diverge.
The high public debt ratio does not seem to pose
significant sustainability challenges in the short
term. The short-term sustainability indicator
S0 (13
) does not flag any significant risk overall,
although the short-term fiscal sub-index flags high
risk due to the high level of gross financing needs,
of the primary deficit and of public debt. In spite
of the weaknesses revealed by the fiscal sub-index
of the S0 indicator, the rating outlook for French
government debt is AA stable for the three major
rating agencies.
(12) This section is based on the 2015 Ageing Report (European
Commission, 2015a) and the Debt Sustainability Monitor
2016 (European Commission, 2017a). * An asterisk indicates that the analysis in the section
contributes to the in-depth review under the MIP (see
section 3 for an overall summary of main findings). (13) S0 is a composite indicator aimed at evaluating the extent
to which there might be a fiscal stress risk in the upcoming
year, stemming from the fiscal, as well as the macro-financial and competitiveness sides of the economy. A set
of 25 fiscal and financial-competitiveness variables proven
to perform well in detecting fiscal stress in the past is used
to construct the indicator. Countries are deemed to face
potential high short-term risks of fiscal stress, whenever S0
is above an estimated critical threshold.
Graph 4.1.1: Difference in debt dynamics between France
and the euro area
Source: European Commission, 2017 winter forecast
Sound debt management strategies reduce the
short term risks. All French debt is denominated
in euro so there is no currency risk. Moreover, the
average maturity of debt instruments has increased
to nearly 7.5 years, reflecting longer issuance
maturities, which allows securing low interest rates
over the coming years. While the share of short-
term debt has declined, it remains relatively high
(8.3 % of total). The investor base is diverse and
broadly equally distributed between residents, the
euro area and the rest of the world. While holdings
by foreign investors have slightly declined to 60 %
of total French debt, the high share held by non-
residents could be a source of vulnerability.
However, investor appetite is still high. Traditional
investors in search of higher yields have turned to
riskier investments, but are expected to readjust
their holdings once interest rates increase. French
debt is a sought-after investment for capital and
liquidity requirements reasons and diversification
purposes, as it offers the possibility of holding
nominal and inflation linked bonds issued in euros.
However, France's public debt faces high
sustainability risks in the medium term. The
debt sustainability analysis for France shows that
in the baseline scenario assuming no policy change
public debt would be roughly stable at some 97 %
of GDP until 2021. However, it would begin to
-10
-5
0
5
10
15
11 12 13 14 15 16 17 18
Primary balance Interest expenditure
Growth effect (real) Inflation effect
Stock flow adjustments Gross debt ratio
4. REFORM PRIORITIES
4.1. PUBLIC FINANCES AND TAXATION
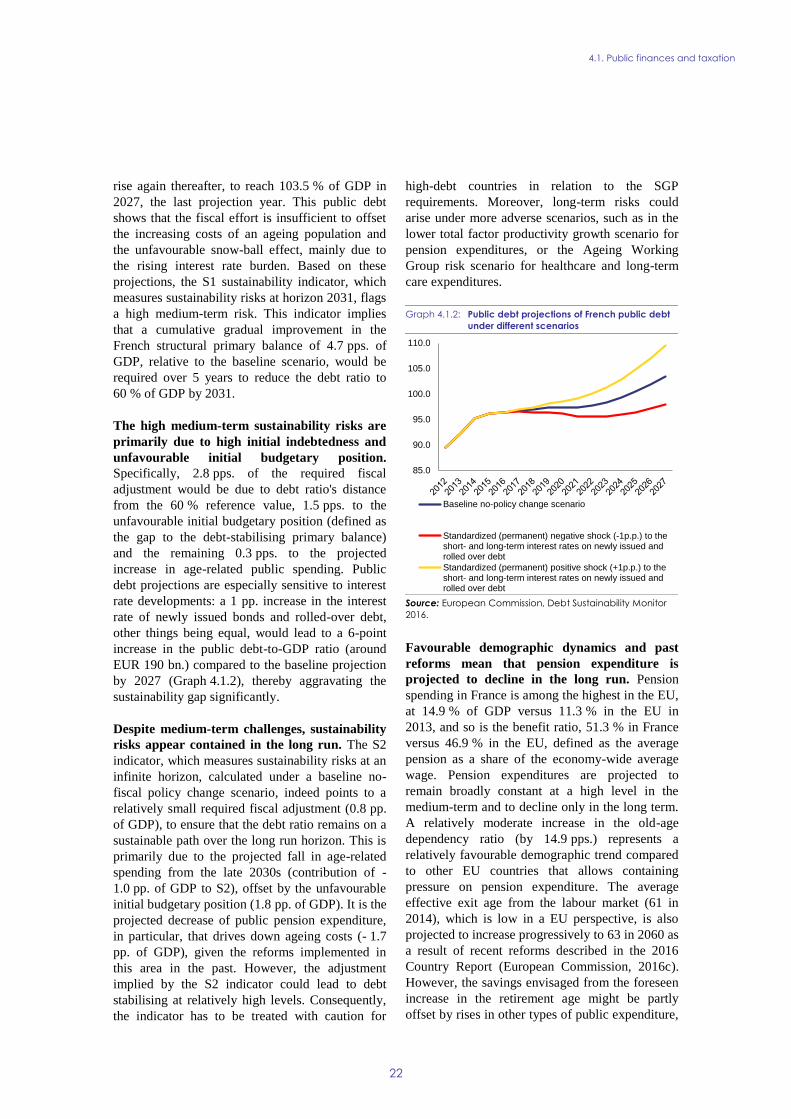
4.1. Public finances and taxation
22
rise again thereafter, to reach 103.5 % of GDP in
2027, the last projection year. This public debt
shows that the fiscal effort is insufficient to offset
the increasing costs of an ageing population and
the unfavourable snow-ball effect, mainly due to
the rising interest rate burden. Based on these
projections, the S1 sustainability indicator, which
measures sustainability risks at horizon 2031, flags
a high medium-term risk. This indicator implies
that a cumulative gradual improvement in the
French structural primary balance of 4.7 pps. of
GDP, relative to the baseline scenario, would be
required over 5 years to reduce the debt ratio to
60 % of GDP by 2031.
The high medium-term sustainability risks are
primarily due to high initial indebtedness and
unfavourable initial budgetary position.
Specifically, 2.8 pps. of the required fiscal
adjustment would be due to debt ratio's distance
from the 60 % reference value, 1.5 pps. to the
unfavourable initial budgetary position (defined as
the gap to the debt-stabilising primary balance)
and the remaining 0.3 pps. to the projected
increase in age-related public spending. Public
debt projections are especially sensitive to interest
rate developments: a 1 pp. increase in the interest
rate of newly issued bonds and rolled-over debt,
other things being equal, would lead to a 6-point
increase in the public debt-to-GDP ratio (around
EUR 190 bn.) compared to the baseline projection
by 2027 (Graph 4.1.2), thereby aggravating the
sustainability gap significantly.
Despite medium-term challenges, sustainability
risks appear contained in the long run. The S2
indicator, which measures sustainability risks at an
infinite horizon, calculated under a baseline no-
fiscal policy change scenario, indeed points to a
relatively small required fiscal adjustment (0.8 pp.
of GDP), to ensure that the debt ratio remains on a
sustainable path over the long run horizon. This is
primarily due to the projected fall in age-related
spending from the late 2030s (contribution of -
1.0 pp. of GDP to S2), offset by the unfavourable
initial budgetary position (1.8 pp. of GDP). It is the
projected decrease of public pension expenditure,
in particular, that drives down ageing costs (- 1.7
pp. of GDP), given the reforms implemented in
this area in the past. However, the adjustment
implied by the S2 indicator could lead to debt
stabilising at relatively high levels. Consequently,
the indicator has to be treated with caution for
high-debt countries in relation to the SGP
requirements. Moreover, long-term risks could
arise under more adverse scenarios, such as in the
lower total factor productivity growth scenario for
pension expenditures, or the Ageing Working
Group risk scenario for healthcare and long-term
care expenditures.
Graph 4.1.2: Public debt projections of French public debt
under different scenarios
Source: European Commission, Debt Sustainability Monitor
2016.
Favourable demographic dynamics and past
reforms mean that pension expenditure is
projected to decline in the long run. Pension
spending in France is among the highest in the EU,
at 14.9 % of GDP versus 11.3 % in the EU in
2013, and so is the benefit ratio, 51.3 % in France
versus 46.9 % in the EU, defined as the average
pension as a share of the economy-wide average
wage. Pension expenditures are projected to
remain broadly constant at a high level in the
medium-term and to decline only in the long term.
A relatively moderate increase in the old-age
dependency ratio (by 14.9 pps.) represents a
relatively favourable demographic trend compared
to other EU countries that allows containing
pressure on pension expenditure. The average
effective exit age from the labour market (61 in
2014), which is low in a EU perspective, is also
projected to increase progressively to 63 in 2060 as
a result of recent reforms described in the 2016
Country Report (European Commission, 2016c).
However, the savings envisaged from the foreseen
increase in the retirement age might be partly
offset by rises in other types of public expenditure,
85.0
90.0
95.0
100.0
105.0
110.0
Baseline no-policy change scenario
Standardized (permanent) negative shock (-1p.p.) to theshort- and long-term interest rates on newly issued androlled over debt
Standardized (permanent) positive shock (+1p.p.) to theshort- and long-term interest rates on newly issued androlled over debt
4.1. Public finances and taxation
23
such as invalidity or unemployment-related
expenditure in the short term. Despite the
favourable long-term financial prospects of the
French public pension system, some special
regimes that allow early retirement continue to
weigh negatively on the balance of the pension
system.
Quality of fiscal consolidation*
Given the already high revenue ratio, the
government adopted an expenditure based
consolidation strategy. Between 2012 and 2017,
the deficit is projected to decline from 4.8 % to
2.9 % of GDP according to the Commission 2017
winter forecast (ibid.). Over the same period, the
revenue ratio is projected to increase by 1.3 % of
GDP to 53.3 % of GDP. This ratio is forecast to be
8.5 % of GDP higher than the EU average in 2017,
with the high tax burden weighing on economic
activity (see the taxation sub-section, below). The
expenditure-to-GDP ratio is set to decline by 0.6
pp over 2012-2017, helped by lower interest rates
(Graph 4.1.3). A quarter of the planned deficit
reduction would thus be due to changes in
expenditure, in particular from the reorientation
towards an expenditure-based consolidation
strategy since the budget 2015. However, at
56.2 % of GDP in 2017, the expenditure ratio
would remain 9.7 % of GDP higher than in the EU.
The largest contributor to the decline in the
expenditure ratio is the interest burden (-0.8 pp
over 2012-2017), with broadly neutral effects on
economic activity. Interest rates are projected to
increase somewhat in the short term but remain
low by historical standards. However, the low
interest rate environment is not expected to prevail
in the medium term. For example, in the ageing
projections, the interest burden is projected to
gradually rise from 1.8 % of GDP in 2017 to 3 %
of GDP by 2025.
Expenditure growth was also contained by a
reduction in public investment. The second
largest contributor to the fall in public expenditure
is public investment which declined by 0.6 % of
GDP over the same period. Public investment cuts
typically have a stronger negative effect on
economic activity than cuts in other expenditure
items, with a multiplier for public investment of
2.5 points in the long run. However, the economic
impact of the decline in public investment has
likely been less strong than suggested by the
normal multipliers (14
). Public investment was
mainly cut by local authorities, who are
responsible for more than 50 % of total public
investment, and has mainly affected the least
efficient projects, thereby leaving the existing
public capital stock unaffected. Local investment
displays a clear cyclical pattern linked to the local
electoral cycle, but this time round the cycle seems
to have been amplified by the cut in the global
State transfers to local authorities of 0.5 % of GDP
since 2014. Nonetheless, while in a first phase the
cut in global dotations has impacted investment.
Since recently, operational expenditure of local
authorities started declining from a growth rate of
3.0 % in 2013 to 0.9 % in 2015.
Primary current expenditure increased due to a
strong increase in subsidies. The primary current
expenditure ratio is projected to increase from
49.0% of GDP in 2012 to 50.1% of GDP in 2017.
This increase in the expenditure ratio once the
interest burden and capital expenditure is filtered
out, puts into question to durability of the
expenditure containment strategy. One important
driver of spending has been an increase in
subsidies, due to the introduction of the crédit
d'impôt pour la compétitivité et l'emploi (CICE),
which is a tax credit on the salary mass of firms
introduced in 2014, focused on the lower end of
the wage scale. The effect of the increase in
subsidies on economic activity is closer to a
targeted cut in social contributions, which is a
relatively efficient way of strengthening economic
activity as opposed to other types of subsidies.
The spending reviews were scaled back in 2016.
In place since 2015, the spending reviews
identified a fraction - less than 2 % - of the overall
planned expenditure savings of EUR 50 billion
over the period 2015-2017. Based on the first wave
of reviews, savings with a total yield of EUR 325
million were included in the 2016 budget. The
second review exercise took place in 2016, but the
proposals in the draft budget 2017 relied on
measures identified already in the 2015 spending
review exercise. The planned savings would yield
EUR 400 million. In general, it appears that only a
(14) IMF (2014) World Economic Outlook, October 2014. For a
more in-depth discussion, see Cour des Comptes (2015) La situation et les perspectives des finances publiques, Juin
2015.
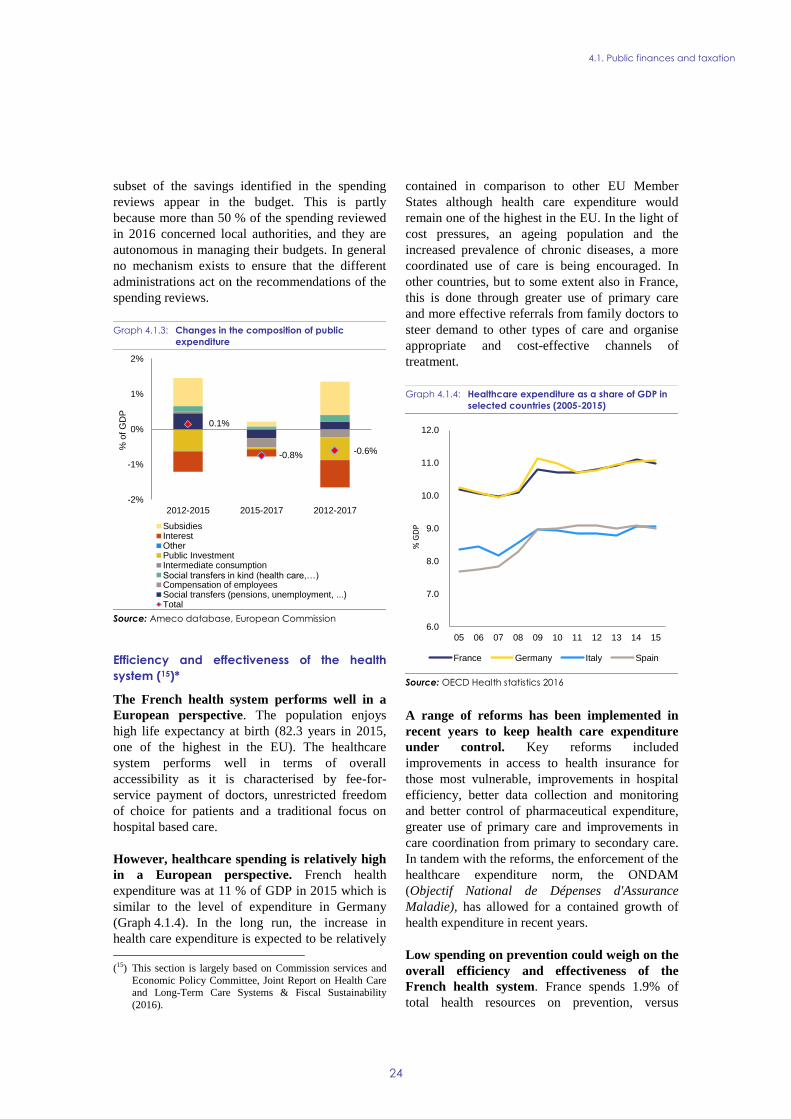
4.1. Public finances and taxation
24
subset of the savings identified in the spending
reviews appear in the budget. This is partly
because more than 50 % of the spending reviewed
in 2016 concerned local authorities, and they are
autonomous in managing their budgets. In general
no mechanism exists to ensure that the different
administrations act on the recommendations of the
spending reviews.
Graph 4.1.3: Changes in the composition of public
expenditure
Source: Ameco database, European Commission
Efficiency and effectiveness of the health
system (15)*
The French health system performs well in a
European perspective. The population enjoys
high life expectancy at birth (82.3 years in 2015,
one of the highest in the EU). The healthcare
system performs well in terms of overall
accessibility as it is characterised by fee-for-
service payment of doctors, unrestricted freedom
of choice for patients and a traditional focus on
hospital based care.
However, healthcare spending is relatively high
in a European perspective. French health
expenditure was at 11 % of GDP in 2015 which is
similar to the level of expenditure in Germany
(Graph 4.1.4). In the long run, the increase in
health care expenditure is expected to be relatively
(15) This section is largely based on Commission services and
Economic Policy Committee, Joint Report on Health Care and Long-Term Care Systems & Fiscal Sustainability
(2016).
contained in comparison to other EU Member
States although health care expenditure would
remain one of the highest in the EU. In the light of
cost pressures, an ageing population and the
increased prevalence of chronic diseases, a more
coordinated use of care is being encouraged. In
other countries, but to some extent also in France,
this is done through greater use of primary care
and more effective referrals from family doctors to
steer demand to other types of care and organise
appropriate and cost-effective channels of
treatment.
Graph 4.1.4: Healthcare expenditure as a share of GDP in
selected countries (2005-2015)
Source: OECD Health statistics 2016
A range of reforms has been implemented in
recent years to keep health care expenditure
under control. Key reforms included
improvements in access to health insurance for
those most vulnerable, improvements in hospital
efficiency, better data collection and monitoring
and better control of pharmaceutical expenditure,
greater use of primary care and improvements in
care coordination from primary to secondary care.
In tandem with the reforms, the enforcement of the
healthcare expenditure norm, the ONDAM
(Objectif National de Dépenses d'Assurance
Maladie), has allowed for a contained growth of
health expenditure in recent years.
Low spending on prevention could weigh on the
overall efficiency and effectiveness of the
French health system. France spends 1.9% of
total health resources on prevention, versus
0.1%
-0.8% -0.6%
-2%
-1%
0%
1%
2%
2012-2015 2015-2017 2012-2017
% o
f G
DP
SubsidiesInterestOtherPublic InvestmentIntermediate consumptionSocial transfers in kind (health care,…)Compensation of employeesSocial transfers (pensions, unemployment, ...)Total
6.0
7.0
8.0
9.0
10.0
11.0
12.0
05 06 07 08 09 10 11 12 13 14 15
France Germany Italy Spain
% G
DP
4.1. Public finances and taxation
25
average spending on prevention of 3% in the EU.
Low spending on prevention can lead to higher
healthcare costs in the longer run, certainly as it is
accompanied by low vaccination levels for certain
preventable diseases and comparatively high
prevalence of risky behaviour such as alcohol and
tobacco consumption.
Fiscal frameworks*
The fiscal framework has been strengthened in
the last few years, although weaknesses still
remain. Since the founding in 2012, the High
Council of Public Finances (HCFP) (16
), the
systematic positive bias in the macroeconomic
forecasts underpinning the draft budgets has
disappeared. In September 2016, the HCFP issued
a more critical opinion than in previous years on
the macroeconomic scenario underpinning the
2017 draft budgetary plan (Haut Conseil des
Finances Publiques, 2016). There is no formal
mechanism in place to reconcile divergent views
between the HCPF and the Ministry of Finance,
and in the that case, the Ministry of Finance did
not adjust the macroeconomic scenario
underpinning the 2017 DBP following the HCFP's
opinion .
Although the expenditure norms are an
effective means to control expenditure, they are
becoming more difficult to meet. The norms are
becoming more ambitious every year as
expenditure growth rates for the respective
spending categories decrease. At the same time,
new spending announcements are projected to
increase spending on a permanent basis, whereas
the savings allowing the norms to be met are
across-the-board spending cuts. Consequently, in
2017 the ceilings for the norms had to be raised for
State and health expenditure. All these
developments point to the limits of the existing
rules, as they become harder to obey without
taking structural measures. Furthermore, the cut in
transfers from the State to local authorities has
been reduced, leading to an upward revision of the
indicative spending norm for local authorities
(ODEDEL). At the same time, no correction
mechanism or alert committee exists to oversee the
ODEDEL and prevent local expenditure overruns.
(16) Created as an independent fiscal body by the organic law
of 17 December 2012
Finally, the ONDAM and the norm of the state
cover about half of public expenditure.
Taxation*
The tax wedge on labour has fallen
substantially at the lower end of income
distribution, but remains high at the average
wage. Between 2012 and 2015, the tax wedge was
reduced by around 1 ppt. at the average wage and
by more than 3 pps. for workers earning 50% of
the average wage. This change in trend is mainly
due to the introduction of the CICE and the RSP.
The tax wedge for very low income earners (50%
of the average wage), at 31.6%, was below the EU
average of 32.7% in 2015. For income earners at
the average wage, the tax wedge, at 48.7%,
remained above the EU average of 40.7% and one
of the highest in the EU, which may undermine the
functioning of the labour market.
Although employers' social security
contributions are falling, they are still relatively
high. At the average wage, France has the highest
employers' social security contributions in the EU
as a share of total labour costs paid by the
employer, which explains the relatively high tax
wedge. This partly stems from the social security
system being financed through employer's
contributions, which is only partially the case in
other countries. High employers' social security
contributions are also conducive to a large tax
burden on companies.
The high level of taxes weighing on companies
represents an obstacle to private investment
and hampers companies' growth (European
Commission, 2016e). The effective average
corporate tax rate was the highest in the EU in
2016 (38.4 %) (ZEW, 2016). French corporate
income tax combines a high nominal rate (38 % in
2014 including the surcharge, the highest in the
EU), and relatively little revenue as a share of
GDP (2.7 % of GDP in 2014, against 2.4% in the
EU, for a nominal rate of 22.9% for the same year)
because of generous tax credits and relatively low
profit margins. Finally, the debt-equity tax bias in
corporate financing remains the highest in the EU
in 2016. Due to a less favourable tax treatment,
investments financed by equity need to earn 5
percentage points more in return than investments
financed by debt to yield the same after-tax return
(ZEW, 2016).
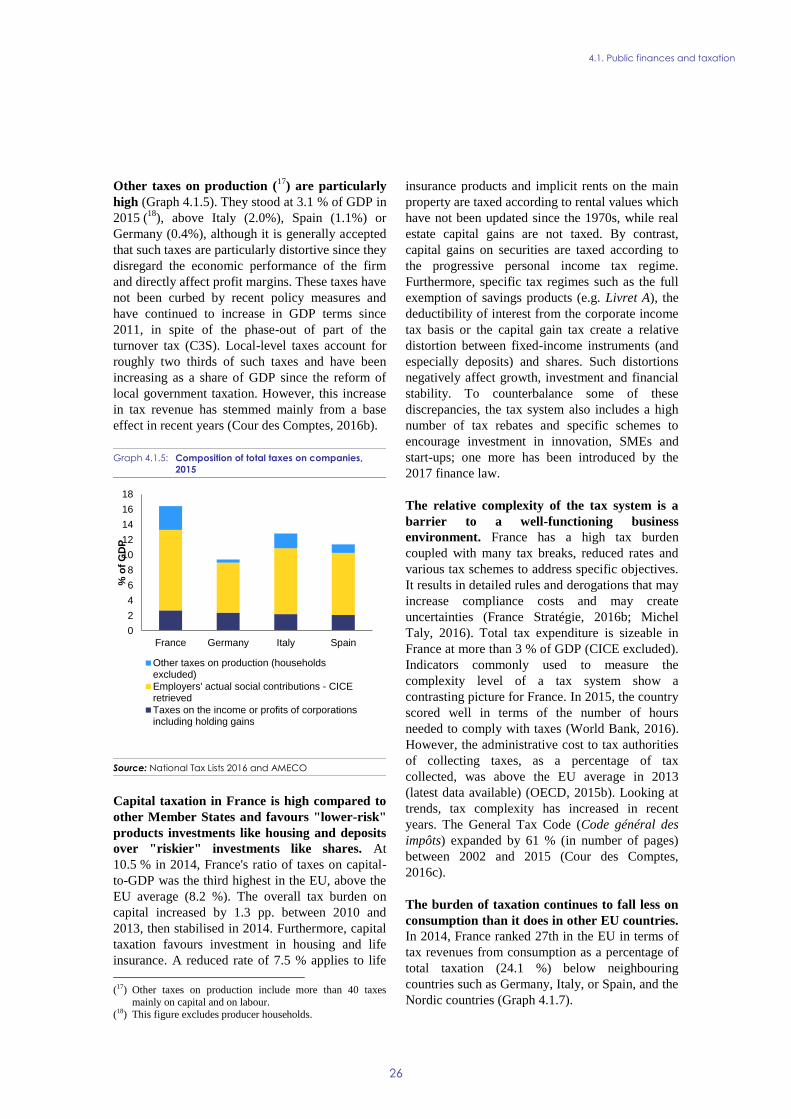
4.1. Public finances and taxation
26
Other taxes on production (17
) are particularly
high (Graph 4.1.5). They stood at 3.1 % of GDP in
2015 (18
), above Italy (2.0%), Spain (1.1%) or
Germany (0.4%), although it is generally accepted
that such taxes are particularly distortive since they
disregard the economic performance of the firm
and directly affect profit margins. These taxes have
not been curbed by recent policy measures and
have continued to increase in GDP terms since
2011, in spite of the phase-out of part of the
turnover tax (C3S). Local-level taxes account for
roughly two thirds of such taxes and have been
increasing as a share of GDP since the reform of
local government taxation. However, this increase
in tax revenue has stemmed mainly from a base
effect in recent years (Cour des Comptes, 2016b).
Graph 4.1.5: Composition of total taxes on companies,
2015
Source: National Tax Lists 2016 and AMECO
Capital taxation in France is high compared to
other Member States and favours "lower-risk"
products investments like housing and deposits
over "riskier" investments like shares. At
10.5 % in 2014, France's ratio of taxes on capital-
to-GDP was the third highest in the EU, above the
EU average (8.2 %). The overall tax burden on
capital increased by 1.3 pp. between 2010 and
2013, then stabilised in 2014. Furthermore, capital
taxation favours investment in housing and life
insurance. A reduced rate of 7.5 % applies to life
(17) Other taxes on production include more than 40 taxes
mainly on capital and on labour.
(18) This figure excludes producer households.
insurance products and implicit rents on the main
property are taxed according to rental values which
have not been updated since the 1970s, while real
estate capital gains are not taxed. By contrast,
capital gains on securities are taxed according to
the progressive personal income tax regime.
Furthermore, specific tax regimes such as the full
exemption of savings products (e.g. Livret A), the
deductibility of interest from the corporate income
tax basis or the capital gain tax create a relative
distortion between fixed-income instruments (and
especially deposits) and shares. Such distortions
negatively affect growth, investment and financial
stability. To counterbalance some of these
discrepancies, the tax system also includes a high
number of tax rebates and specific schemes to
encourage investment in innovation, SMEs and
start-ups; one more has been introduced by the
2017 finance law.
The relative complexity of the tax system is a
barrier to a well-functioning business
environment. France has a high tax burden
coupled with many tax breaks, reduced rates and
various tax schemes to address specific objectives.
It results in detailed rules and derogations that may
increase compliance costs and may create
uncertainties (France Stratégie, 2016b; Michel
Taly, 2016). Total tax expenditure is sizeable in
France at more than 3 % of GDP (CICE excluded).
Indicators commonly used to measure the
complexity level of a tax system show a
contrasting picture for France. In 2015, the country
scored well in terms of the number of hours
needed to comply with taxes (World Bank, 2016).
However, the administrative cost to tax authorities
of collecting taxes, as a percentage of tax
collected, was above the EU average in 2013
(latest data available) (OECD, 2015b). Looking at
trends, tax complexity has increased in recent
years. The General Tax Code (Code général des
impôts) expanded by 61 % (in number of pages)
between 2002 and 2015 (Cour des Comptes,
2016c).
The burden of taxation continues to fall less on
consumption than it does in other EU countries.
In 2014, France ranked 27th in the EU in terms of
tax revenues from consumption as a percentage of
total taxation (24.1 %) below neighbouring
countries such as Germany, Italy, or Spain, and the
Nordic countries (Graph 4.1.7).
0
2
4
6
8
10
12
14
16
18
France Germany Italy Spain
% o
f G
DP
Other taxes on production (householdsexcluded)
Employers' actual social contributions - CICEretrieved
Taxes on the income or profits of corporationsincluding holding gains
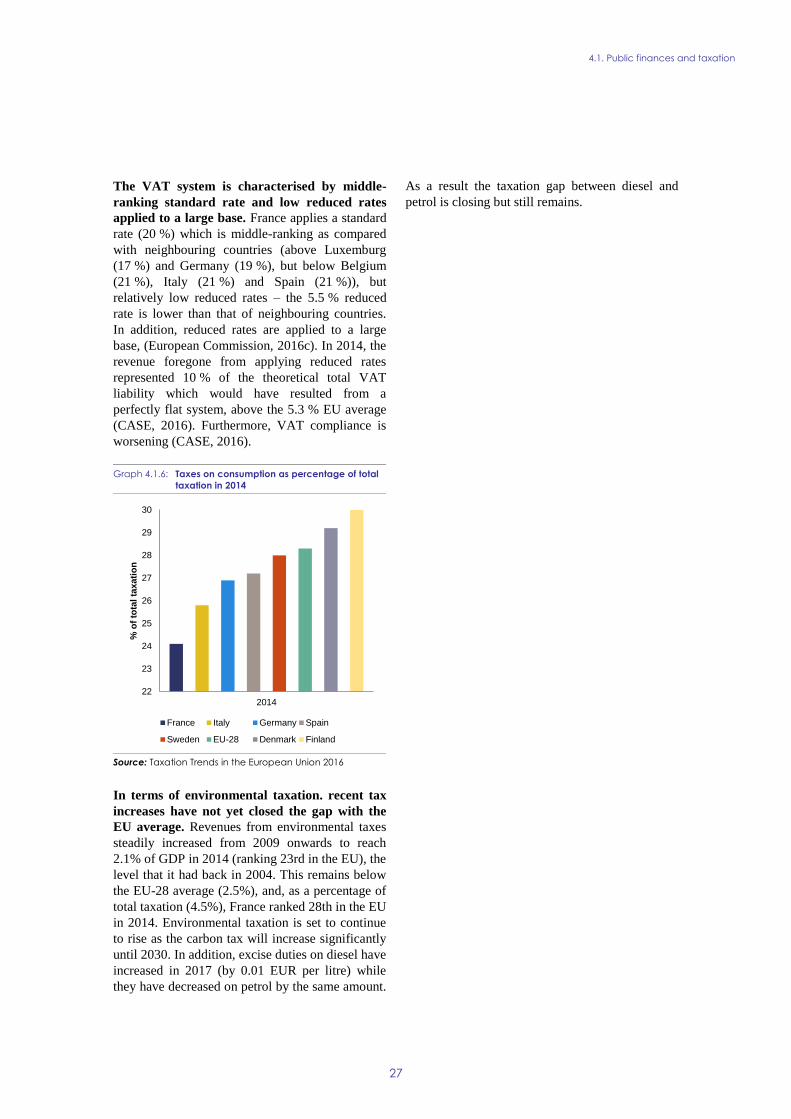
4.1. Public finances and taxation
27
The VAT system is characterised by middle-
ranking standard rate and low reduced rates
applied to a large base. France applies a standard
rate (20 %) which is middle-ranking as compared
with neighbouring countries (above Luxemburg
(17 %) and Germany (19 %), but below Belgium
(21 %), Italy (21 %) and Spain (21 %)), but
relatively low reduced rates – the 5.5 % reduced
rate is lower than that of neighbouring countries.
In addition, reduced rates are applied to a large
base, (European Commission, 2016c). In 2014, the
revenue foregone from applying reduced rates
represented 10 % of the theoretical total VAT
liability which would have resulted from a
perfectly flat system, above the 5.3 % EU average
(CASE, 2016). Furthermore, VAT compliance is
worsening (CASE, 2016).
Graph 4.1.6: Taxes on consumption as percentage of total
taxation in 2014
Source: Taxation Trends in the European Union 2016
In terms of environmental taxation. recent tax
increases have not yet closed the gap with the
EU average. Revenues from environmental taxes
steadily increased from 2009 onwards to reach
2.1% of GDP in 2014 (ranking 23rd in the EU), the
level that it had back in 2004. This remains below
the EU-28 average (2.5%), and, as a percentage of
total taxation (4.5%), France ranked 28th in the EU
in 2014. Environmental taxation is set to continue
to rise as the carbon tax will increase significantly
until 2030. In addition, excise duties on diesel have
increased in 2017 (by 0.01 EUR per litre) while
they have decreased on petrol by the same amount.
As a result the taxation gap between diesel and
petrol is closing but still remains.
22
23
24
25
26
27
28
29
30
2014
% o
f to
tal
taxati
on
France Italy Germany Spain
Sweden EU-28 Denmark Finland
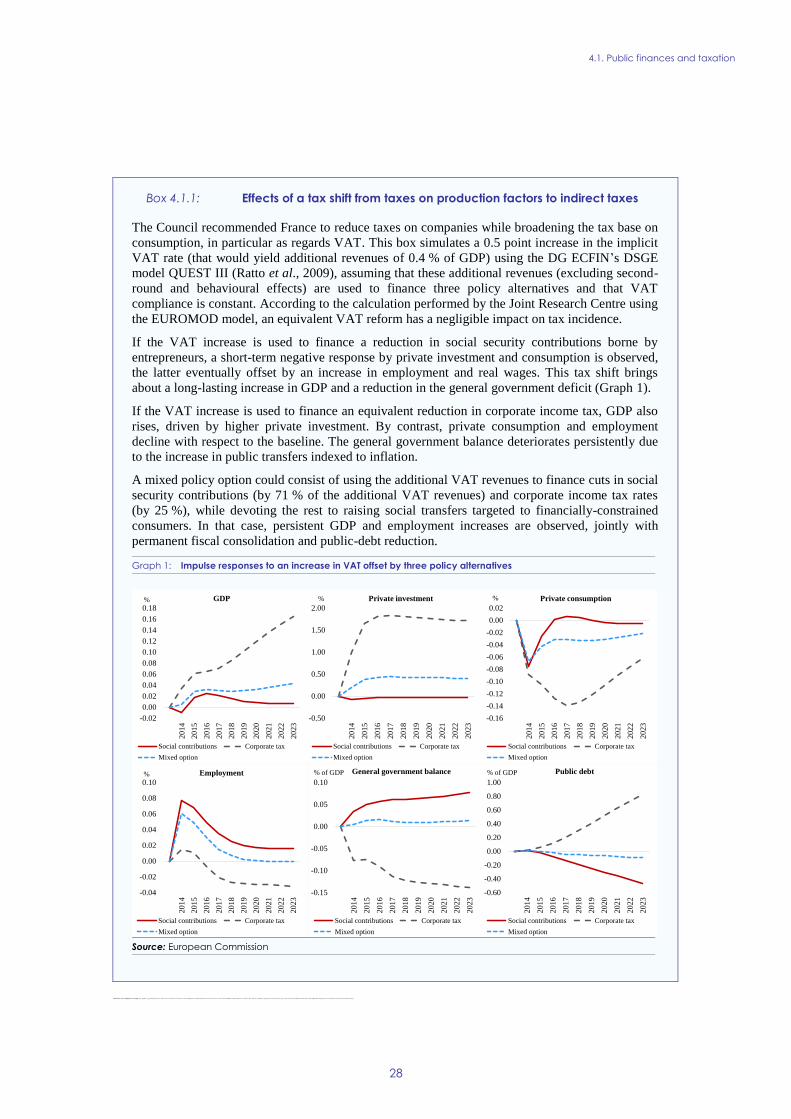
4.1. Public finances and taxation
28
Furthermore, VA T compliance is worsening. T he compliance gap, which provides an es timate of revenue loss due to fraud, tax evasion, bankrup tcies and miscalculations, has increased to 14 % of total VA T tax l iabili ties in 2014, again st 12 % in 2013. Since 2011, the compliance gap in France has increased by 5 pps. of the total VAT tax l iabili ties (CA SE, 2016). This is higher than in Spain (9 %) or Germany (10 %), but lower than in Italy (28 %).
Box 4.1.1: Effects of a tax shift from taxes on production factors to indirect taxes
The Council recommended France to reduce taxes on companies while broadening the tax base on
consumption, in particular as regards VAT. This box simulates a 0.5 point increase in the implicit
VAT rate (that would yield additional revenues of 0.4 % of GDP) using the DG ECFIN’s DSGE
model QUEST III (Ratto et al., 2009), assuming that these additional revenues (excluding second-
round and behavioural effects) are used to finance three policy alternatives and that VAT
compliance is constant. According to the calculation performed by the Joint Research Centre using
the EUROMOD model, an equivalent VAT reform has a negligible impact on tax incidence.
If the VAT increase is used to finance a reduction in social security contributions borne by
entrepreneurs, a short-term negative response by private investment and consumption is observed,
the latter eventually offset by an increase in employment and real wages. This tax shift brings
about a long-lasting increase in GDP and a reduction in the general government deficit (Graph 1).
If the VAT increase is used to finance an equivalent reduction in corporate income tax, GDP also
rises, driven by higher private investment. By contrast, private consumption and employment
decline with respect to the baseline. The general government balance deteriorates persistently due
to the increase in public transfers indexed to inflation.
A mixed policy option could consist of using the additional VAT revenues to finance cuts in social
security contributions (by 71 % of the additional VAT revenues) and corporate income tax rates
(by 25 %), while devoting the rest to raising social transfers targeted to financially-constrained
consumers. In that case, persistent GDP and employment increases are observed, jointly with
permanent fiscal consolidation and public-debt reduction.
Graph 1: Impulse responses to an increase in VAT offset by three policy alternatives
Source: European Commission
-0.02
0.00
0.02
0.04
0.06
0.08
0.10
0.12
0.14
0.16
0.18
2014
2015
2016
2017
2018
2019
2020
2021
2022
2023
Social contributions Corporate tax
Mixed option
GDP%
-0.50
0.00
0.50
1.00
1.50
2.00
2014
2015
2016
2017
2018
2019
2020
2021
2022
2023
Social contributions Corporate tax
Mixed option
Private investment%
-0.16
-0.14
-0.12
-0.10
-0.08
-0.06
-0.04
-0.02
0.00
0.02
2014
2015
2016
2017
2018
2019
2020
2021
2022
2023
Social contributions Corporate tax
Mixed option
Private consumption%
-0.15
-0.10
-0.05
0.00
0.05
0.10
2014
2015
2016
2017
2018
2019
2020
2021
2022
2023
Social contributions Corporate tax
Mixed option
General government balance% of GDP
-0.04
-0.02
0.00
0.02
0.04
0.06
0.08
0.10
2014
2015
2016
2017
2018
2019
2020
2021
2022
2023
Social contributions Corporate tax
Mixed option
Employment%
-0.60
-0.40
-0.20
0.00
0.20
0.40
0.60
0.80
1.00
2014
2015
2016
2017
2018
2019
2020
2021
2022
2023
Social contributions Corporate tax
Mixed option
Public debt% of GDP
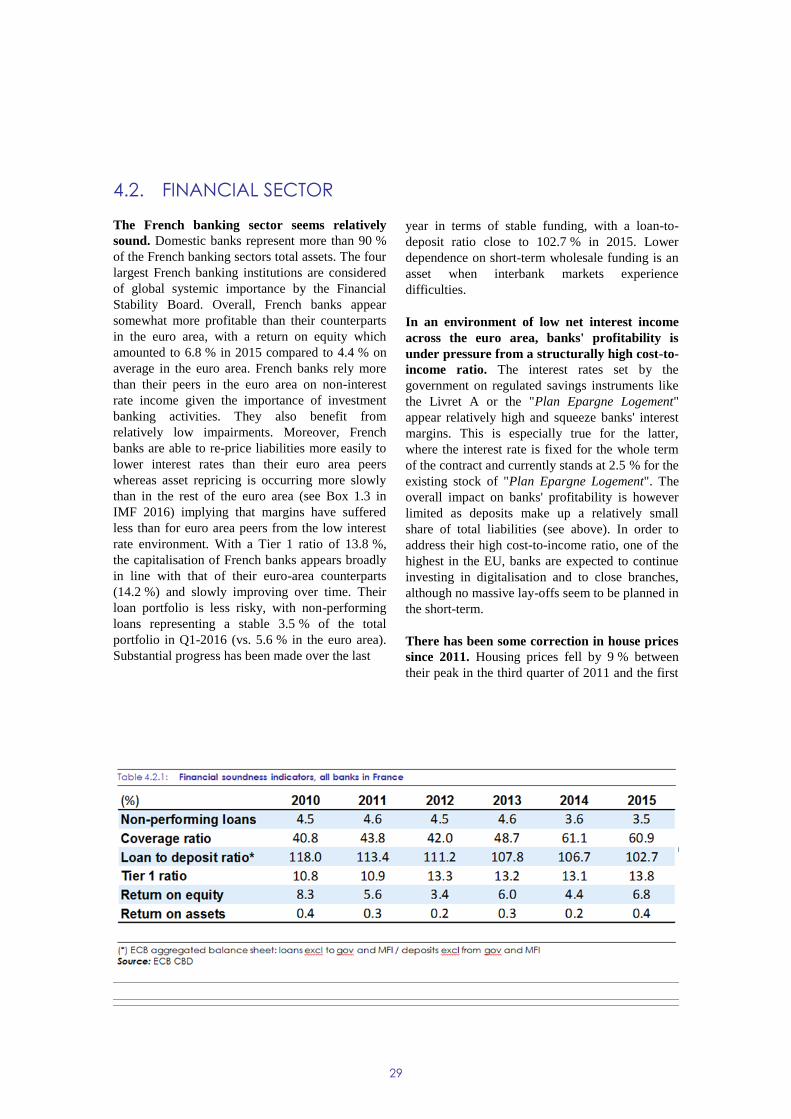
29
4.2. FINANCIAL SECTOR
The French banking sector seems relatively
sound. Domestic banks represent more than 90 %
of the French banking sectors total assets. The four
largest French banking institutions are considered
of global systemic importance by the Financial
Stability Board. Overall, French banks appear
somewhat more profitable than their counterparts
in the euro area, with a return on equity which
amounted to 6.8 % in 2015 compared to 4.4 % on
average in the euro area. French banks rely more
than their peers in the euro area on non-interest
rate income given the importance of investment
banking activities. They also benefit from
relatively low impairments. Moreover, French
banks are able to re-price liabilities more easily to
lower interest rates than their euro area peers
whereas asset repricing is occurring more slowly
than in the rest of the euro area (see Box 1.3 in
IMF 2016) implying that margins have suffered
less than for euro area peers from the low interest
rate environment. With a Tier 1 ratio of 13.8 %,
the capitalisation of French banks appears broadly
in line with that of their euro-area counterparts
(14.2 %) and slowly improving over time. Their
loan portfolio is less risky, with non-performing
loans representing a stable 3.5 % of the total
portfolio in Q1-2016 (vs. 5.6 % in the euro area).
Substantial progress has been made over the last
year in terms of stable funding, with a loan-to-
deposit ratio close to 102.7 % in 2015. Lower
dependence on short-term wholesale funding is an
asset when interbank markets experience
difficulties.
In an environment of low net interest income
across the euro area, banks' profitability is
under pressure from a structurally high cost-to-
income ratio. The interest rates set by the
government on regulated savings instruments like
the Livret A or the "Plan Epargne Logement"
appear relatively high and squeeze banks' interest
margins. This is especially true for the latter,
where the interest rate is fixed for the whole term
of the contract and currently stands at 2.5 % for the
existing stock of "Plan Epargne Logement". The
overall impact on banks' profitability is however
limited as deposits make up a relatively small
share of total liabilities (see above). In order to
address their high cost-to-income ratio, one of the
highest in the EU, banks are expected to continue
investing in digitalisation and to close branches,
although no massive lay-offs seem to be planned in
the short-term.
There has been some correction in house prices
since 2011. Housing prices fell by 9 % between
their peak in the third quarter of 2011 and the first
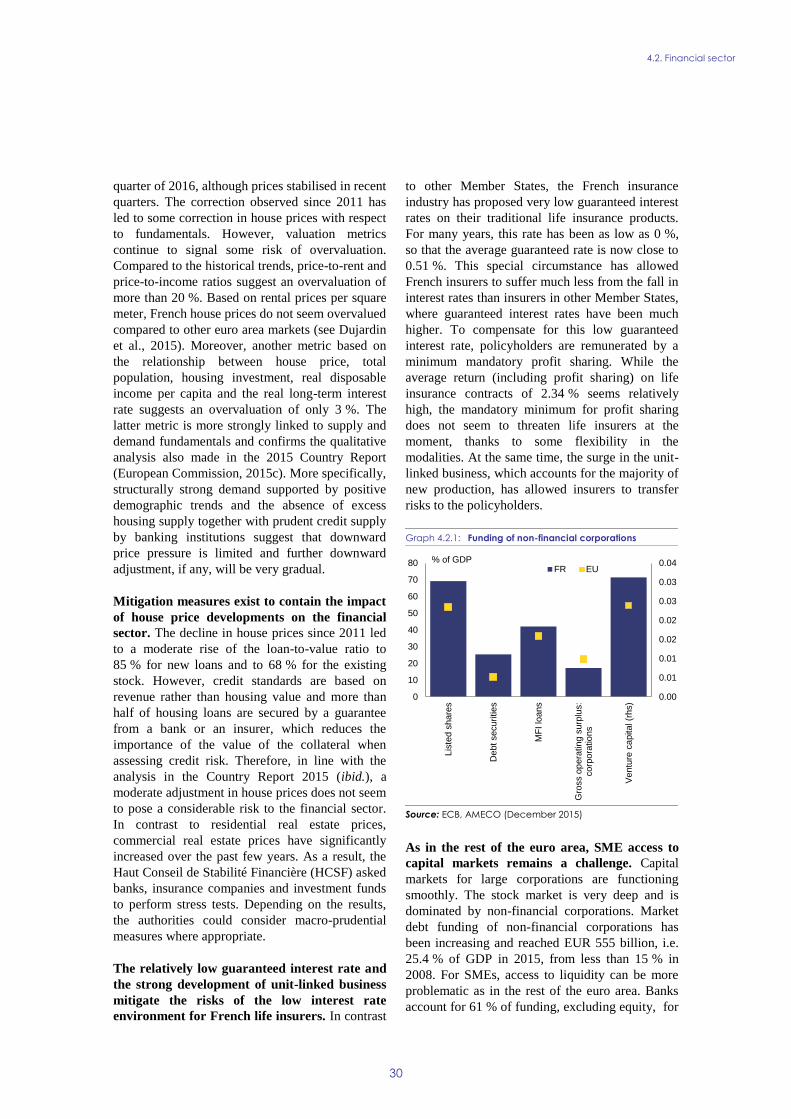
4.2. Financial sector
30
quarter of 2016, although prices stabilised in recent
quarters. The correction observed since 2011 has
led to some correction in house prices with respect
to fundamentals. However, valuation metrics
continue to signal some risk of overvaluation.
Compared to the historical trends, price-to-rent and
price-to-income ratios suggest an overvaluation of
more than 20 %. Based on rental prices per square
meter, French house prices do not seem overvalued
compared to other euro area markets (see Dujardin
et al., 2015). Moreover, another metric based on
the relationship between house price, total
population, housing investment, real disposable
income per capita and the real long-term interest
rate suggests an overvaluation of only 3 %. The
latter metric is more strongly linked to supply and
demand fundamentals and confirms the qualitative
analysis also made in the 2015 Country Report
(European Commission, 2015c). More specifically,
structurally strong demand supported by positive
demographic trends and the absence of excess
housing supply together with prudent credit supply
by banking institutions suggest that downward
price pressure is limited and further downward
adjustment, if any, will be very gradual.
Mitigation measures exist to contain the impact
of house price developments on the financial
sector. The decline in house prices since 2011 led
to a moderate rise of the loan-to-value ratio to
85 % for new loans and to 68 % for the existing
stock. However, credit standards are based on
revenue rather than housing value and more than
half of housing loans are secured by a guarantee
from a bank or an insurer, which reduces the
importance of the value of the collateral when
assessing credit risk. Therefore, in line with the
analysis in the Country Report 2015 (ibid.), a
moderate adjustment in house prices does not seem
to pose a considerable risk to the financial sector.
In contrast to residential real estate prices,
commercial real estate prices have significantly
increased over the past few years. As a result, the
Haut Conseil de Stabilité Financière (HCSF) asked
banks, insurance companies and investment funds
to perform stress tests. Depending on the results,
the authorities could consider macro-prudential
measures where appropriate.
The relatively low guaranteed interest rate and
the strong development of unit-linked business
mitigate the risks of the low interest rate
environment for French life insurers. In contrast
to other Member States, the French insurance
industry has proposed very low guaranteed interest
rates on their traditional life insurance products.
For many years, this rate has been as low as 0 %,
so that the average guaranteed rate is now close to
0.51 %. This special circumstance has allowed
French insurers to suffer much less from the fall in
interest rates than insurers in other Member States,
where guaranteed interest rates have been much
higher. To compensate for this low guaranteed
interest rate, policyholders are remunerated by a
minimum mandatory profit sharing. While the
average return (including profit sharing) on life
insurance contracts of 2.34 % seems relatively
high, the mandatory minimum for profit sharing
does not seem to threaten life insurers at the
moment, thanks to some flexibility in the
modalities. At the same time, the surge in the unit-
linked business, which accounts for the majority of
new production, has allowed insurers to transfer
risks to the policyholders.
Graph 4.2.1: Funding of non-financial corporations
Source: ECB, AMECO (December 2015)
As in the rest of the euro area, SME access to
capital markets remains a challenge. Capital
markets for large corporations are functioning
smoothly. The stock market is very deep and is
dominated by non-financial corporations. Market
debt funding of non-financial corporations has
been increasing and reached EUR 555 billion, i.e.
25.4 % of GDP in 2015, from less than 15 % in
2008. For SMEs, access to liquidity can be more
problematic as in the rest of the euro area. Banks
account for 61 % of funding, excluding equity, for
0.00
0.01
0.01
0.02
0.02
0.03
0.03
0.04
0
10
20
30
40
50
60
70
80
Lis
ted s
hare
s
Debt securitie
s
MF
I lo
ans
Gro
ss o
pera
tin
g s
urp
lus:
corp
ora
tio
ns
Ve
ntu
re c
apital (r
hs)
FR EU% of GDP

4.2. Financial sector
31
all non-financial corporations in France, but this
figure rises to 96 % for SMEs. The French
authorities are trying to improve market access for
SMEs by various means, such as ensuring that
financial information requirements are
proportionate, developing financial analysis on
SMEs and supporting institutionalisation of
crowdfunding. They are also expecting positive
effects from the Capital Markets Union.
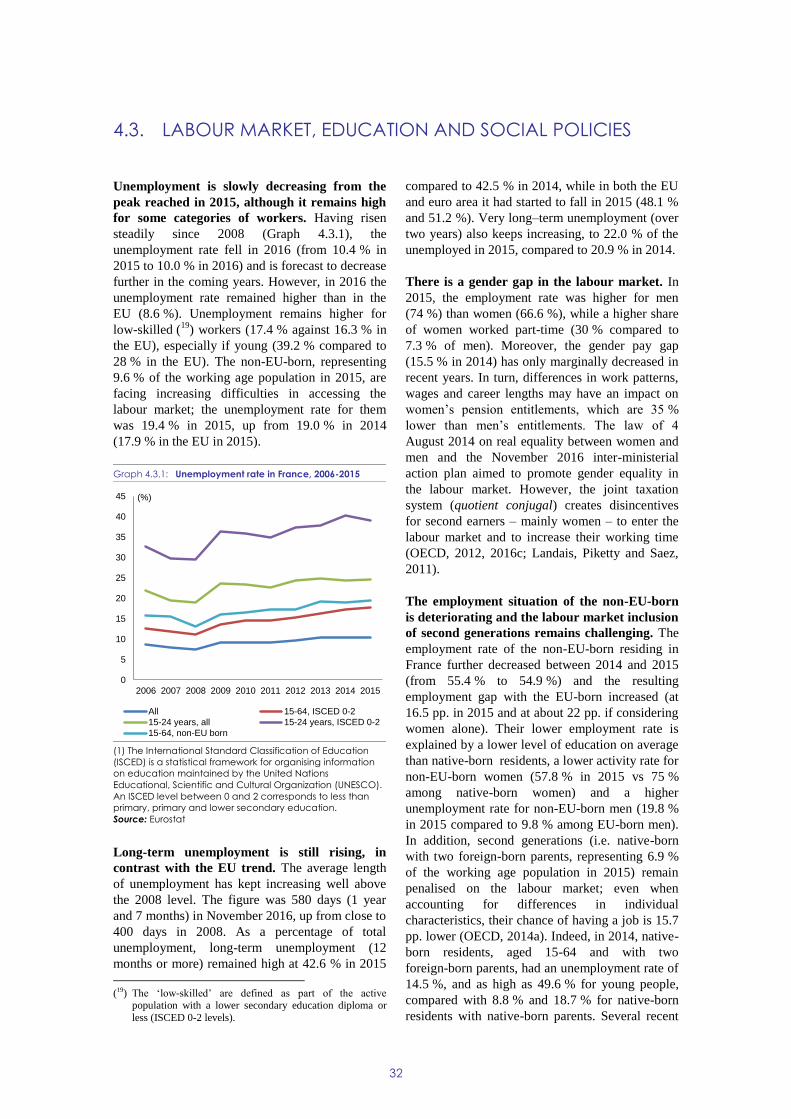
32
Unemployment is slowly decreasing from the
peak reached in 2015, although it remains high
for some categories of workers. Having risen
steadily since 2008 (Graph 4.3.1), the
unemployment rate fell in 2016 (from 10.4 % in
2015 to 10.0 % in 2016) and is forecast to decrease
further in the coming years. However, in 2016 the
unemployment rate remained higher than in the
EU (8.6 %). Unemployment remains higher for
low-skilled (19
) workers (17.4 % against 16.3 % in
the EU), especially if young (39.2 % compared to
28 % in the EU). The non-EU-born, representing
9.6 % of the working age population in 2015, are
facing increasing difficulties in accessing the
labour market; the unemployment rate for them
was 19.4 % in 2015, up from 19.0 % in 2014
(17.9 % in the EU in 2015).
Graph 4.3.1: Unemployment rate in France, 2006-2015
(1) The International Standard Classification of Education
(ISCED) is a statistical framework for organising information
on education maintained by the United Nations
Educational, Scientific and Cultural Organization (UNESCO).
An ISCED level between 0 and 2 corresponds to less than
primary, primary and lower secondary education.
Source: Eurostat
Long-term unemployment is still rising, in
contrast with the EU trend. The average length
of unemployment has kept increasing well above
the 2008 level. The figure was 580 days (1 year
and 7 months) in November 2016, up from close to
400 days in 2008. As a percentage of total
unemployment, long-term unemployment (12
months or more) remained high at 42.6 % in 2015
(19) The ‘low-skilled’ are defined as part of the active
population with a lower secondary education diploma or
less (ISCED 0-2 levels).
compared to 42.5 % in 2014, while in both the EU
and euro area it had started to fall in 2015 (48.1 %
and 51.2 %). Very long–term unemployment (over
two years) also keeps increasing, to 22.0 % of the
unemployed in 2015, compared to 20.9 % in 2014.
There is a gender gap in the labour market. In
2015, the employment rate was higher for men
(74 %) than women (66.6 %), while a higher share
of women worked part-time (30 % compared to
7.3 % of men). Moreover, the gender pay gap
(15.5 % in 2014) has only marginally decreased in
recent years. In turn, differences in work patterns,
wages and career lengths may have an impact on
women’s pension entitlements, which are 35 %
lower than men’s entitlements. The law of 4
August 2014 on real equality between women and
men and the November 2016 inter-ministerial
action plan aimed to promote gender equality in
the labour market. However, the joint taxation
system (quotient conjugal) creates disincentives
for second earners – mainly women – to enter the
labour market and to increase their working time
(OECD, 2012, 2016c; Landais, Piketty and Saez,
2011).
The employment situation of the non-EU-born
is deteriorating and the labour market inclusion
of second generations remains challenging. The
employment rate of the non-EU-born residing in
France further decreased between 2014 and 2015
(from 55.4 % to 54.9 %) and the resulting
employment gap with the EU-born increased (at
16.5 pp. in 2015 and at about 22 pp. if considering
women alone). Their lower employment rate is
explained by a lower level of education on average
than native-born residents, a lower activity rate for
non-EU-born women (57.8 % in 2015 vs 75 %
among native-born women) and a higher
unemployment rate for non-EU-born men (19.8 %
in 2015 compared to 9.8 % among EU-born men).
In addition, second generations (i.e. native-born
with two foreign-born parents, representing 6.9 %
of the working age population in 2015) remain
penalised on the labour market; even when
accounting for differences in individual
characteristics, their chance of having a job is 15.7
pp. lower (OECD, 2014a). Indeed, in 2014, native-
born residents, aged 15-64 and with two
foreign-born parents, had an unemployment rate of
14.5 %, and as high as 49.6 % for young people,
compared with 8.8 % and 18.7 % for native-born
residents with native-born parents. Several recent
0
5
10
15
20
25
30
35
40
45
2006 2007 2008 2009 2010 2011 2012 2013 2014 2015
All 15-64, ISCED 0-2
15-24 years, all 15-24 years, ISCED 0-2
15-64, non-EU born
(%)
4.3. LABOUR MARKET, EDUCATION AND SOCIAL POLICIES
4.3. Labour market, education and social policies
33
studies have stressed the persistence of
discrimination among people with a migrant
background in hiring processes and the potential
positive macroeconomic impact on GDP of
reducing the impact of discriminations.
Labour market segmentation and rigidity
Segmentation of the labour market is
entrenched. The proportion of temporary
contracts has been gradually increasing, and
reached 16.8 % of the total number of employees
in the third quarter of 2016. While the percentage
of temporary employment is slightly above the EU
average, its duration has been rapidly shortening
over time; at the end of 2015, almost one fifth of
temporary contracts were for less than one month.
On the other hand, France also appears to have one
of the lowest rates of mobility according to the EU
Labour Force Survey, with an average seniority of
11 years.
Rehiring and job instability are typical of
temporary contracts of short duration. In 2000,
temporary hires accounted for 75 % of total
hirings. In 2016, they represented 86.4 % of total
hirings, with temporary jobs of less than one
month representing 80 % of total temporary hires.
Moreover, more than two thirds of the new hires
are rehires with an old employer (Unédic, 2016);
about half of these were rehires with the last
employer - twice the proportion in 1995.
Temporary rehiring concerns both activities where
the nature of the job justifies temporary
employment (i.e. the so-called contrat à durée
déterminée d’usage) and activities which have
seen a recent rapid increase of temporary
employment (e.g. health, construction, retail trade
and public administration). The transition rate
from a fixed-term contract to an open-ended
contract remains very low, at 10.9 % in 2015
compared with 23 % across the EU.
Impact of labour market reforms
The Labour Act of 8 August 2016 addresses
some of the rigidities of the labour market. This
law paves the way for a reform of the Labour Code
aiming at clearer differentiation between rules to
be defined by regulation, branch-level and firm-
level agreement, with the express intent to extend
the perimeter of autonomous firm-level rules and
to clarify individual economic dismissal rules. The
law also contains measures to increase the
effectiveness of collective bargaining, mainly by
reducing the number of branches, introducing the
majority principle for the adoption of collective
agreements, reforming the rules underpinning the
denunciation and revision of collective
agreements, and introducing ‘offensive
agreements’ that firms can use to adjust wages and
working time arrangements, while maintaining or
increasing the level of employment. In particular,
firms will be able to adopt a collective agreement
that will prevail over individual contracts, even in
terms of working time and pay.
According to preliminary assessments, the
Labour Act is expected to reduce segmentation
of the labour market and to have a milder
impact on the level of employment. According
to Kant, Ballot and Goudet (2016) the new
definition of economic dismissal would decrease
unemployment by 150 000 jobseekers in the short
term and create 200 000 jobs over 2 years, with
strong substitution effects from short to longer-
term contracts. The same study estimates that the
decrease in the minimum overtime premium from
25 % to 10 % - that can now be agreed upon by
social partners at firm level - will have an initial
negative impact for the employment of workers
aged 25-64 over the first 2 years after the adoption
of the law, which would be compensated over the
following 2 years.
The incentives to recruit on longer-term
contracts have helped to address labour market
segmentation in smaller firms. The SME
recruitment incentive programme (prime à
l'embauche PME) (20
) had benefited about 670 000
new employees as of October 2016. Two thirds of
these were on open-ended contracts, while the
remaining third were fixed-term contracts of 6 or
more months. According to recent French Treasury
estimates, the effect of this incentive on
employment would be to create or maintain, on
average, up to 60 000 jobs per year.
(20) This programme allows for an annual, lump sum, bonus of
EUR 2000 paid quarterly over a two-year period to companies with fewer than 250 employees, which have
hired new employees on an open-ended or fixed-term
contract of more than 6 months between 18 January and 30
June 2017 for wages up to 1.3 time the statutory minimum
wage.
4.3. Labour market, education and social policies
34
The recent evaluations of the 'crédit d’impôt
pour la compétitivité et l’emploi' (CICE) have
pointed to its positive effect on firms’ profit
margins and employment, while the effects on
investment, R&D and exports are expected to
take time to materialise. Based on the analysis of
firm-level data for 2013-2014 by three groups of
researchers, the CICE has been found to have a
positive impact on employment and firms’ profit
margins, although its effect on employment did not
increase when its credit rate increased from 4 % to
6 %. By contrast, no impact has been found on
average wages, only on some categories of wages
within certain firms. Also, no effect on investment,
R&D and exports has been found, given that the
period for which firm-level data are available at
the moment is too short. No comprehensive
evaluation of all social contribution reduction
schemes is yet available to assess their
architecture, socioeconomic impact or budgetary
efficiency.
Unemployment benefit system
Since 2008, the deficit of the unemployment
insurance organisation has been rising steadily,
due to both business cycle and structural
features of the unemployment insurance system.
The 2008-2009 and 2011-2012 crises led to an
increase in the number of jobseekers eligible for
unemployment benefits from 2 million in 2008 to
2.8 million in 2016. Consequently, the budget
performance of the unemployment insurance
(Unédic) steadily worsened. In September 2016,
the deficit in the unemployment benefit system
was projected at EUR 4.3 billion in 2016 against
EUR 4.4 billion in 2015, leading to a further
increase in the system’s debt to EUR 30 billion in
2016 and to EUR 33.8 billion in 2017 (Unédic,
2016). The dynamics of the unemployment
insurance deficit and debt reflect a number of
factors beyond cyclical considerations, including
the design of unemployment benefits and job
instability linked to widespread very short
employment spells. While the replacement rate is
comparable to that of countries with similar levels
of GDP per capita, unemployment benefits are
capped at very high levels (over EUR 7 000), the
minimum contribution period is among the lowest
(4 months in 28 months) and the duration of
benefits is among the longest (24 months after
contributing for 24 months).
In addition, the benefit calculation favours a
succession of short-term work periods. The
unemployment insurance system mimics the
functioning of an unemployment account, whereby
a worker brings with him the rights acquired and
not used in previous occupations, when moving
between different jobs. This feature provides
incentives for the unemployed to look for work
more intensively since they do not lose their entire
stock of benefits by taking up a job. Yet, the
method used to calculate the unemployment
benefit gives employees an incentive to combine
revenues from short-term employment with
unemployment benefits, particularly in those
sectors where the contrats d’usage are
allowed (Cahuc and Prost, 2015). This has
favoured particular schemes, such as those
concerning the contrats d’usage, interim and
entertainment sector workers, whose structural
deficit is partly financed by a structural surplus in
the general scheme for open-ended contracts.
The financing of unemployment insurance does
not encourage firms to take into account the
consequences of their high labour turnover on
the deficit in the insurance funds. By levying
higher contribution rates from sectors with higher
turnover, the law of 14 June 2013 addresses the
problem of firms with more stable recruitment
patterns subsidising firms with less stable
recruitment patterns (21
). However, compared to
systems where contributions are firm-specific and
depend on the extent to which laid-off employees
claim unemployment benefits, the French
unemployment insurance does not require firms to
internalise the cost that layoffs impose on
unemployment insurance funds. On the contrary, it
provides an incentive for those economic
activities, usually characterised by low
productivity, which make most use of short-term
contracts interrupted by short spells of
unemployment for workers.
(21) Under the law of 14 June 2013, employers pay higher
social contributions for temporary hires of less than 3 months. For standard temporary contracts, justified to meet
the need for temporary increases in production, the
additional contribution is 3 % for contracts of less than 1 month and 1.5 % for contracts of duration between 1 and
3 months; for the contrats d’usage of less than 3 months,
the additional contribution is 0.5 %, while those of longer duration are not taxed more than permanent contracts.
4.3. Labour market, education and social policies
35
Active labour market policies
Increased active labour market policy measures
targeting low-skilled young people have
succeeded in reducing low-qualified youth
unemployment only slightly. The unemployment
rate for low-qualified young people decreased
from 40.3 % to 39.2 % between 2014 and 2015. To
address their difficulties in entering the labour
market the number of subsidised contracts
targeting low-skilled young people — emplois
d’avenir, contrat initiative emploi (CUI-CIE) and
contrat d’accompagnement dans l’emploi (CUI-
CAE) — has been increased to reach 45 800 in the
market sector (+65 % between March 2015 and
March 2016) and remain stable at 101 300 in the
non-market sector. In the first quarter of 2016,
29.2 % of all young employed were on subsidised
contracts, as were 51.7 % of young employed
people without qualifications (DARES, 2016a).
Although these contracts have a positive short-
term effect on employment, they fail to foster
sustainable inclusion in the labour market; only
40 % of young people in the non-market sector
were employed 6 months after exiting a subsidised
contract and 66 % in the market sector, where
deadweight effect is more important (Cour des
Comptes, 2016a). Also, some weaknesses were
identified in Youth Guarantee implementation in
terms of outreach, information and coordination
between actors (European Commission, 2016c).
In a flexicurity approach, training rights and
activation measures have been reinforced for
the more vulnerable. The reinforcement of
training rights through the personal training
account for low-qualified workers and activation
measures for young unemployed people in
precarious situations, with the generalisation of the
Garantie Jeunes scheme, is intended to support
personal transitions and economic adaptations.
Moreover, the personal activity account (compte
personnel d’activité, CPA), introduced in January
2017, may reduce disparities related to
employment status, by attaching training rights
directly to workers.
Education and vocational training
France faces wide performance gaps in basic
skills linked to students’ socioeconomic
background. Pupils with a migrant background
face additional difficulties. The proportion of 15-
year-old low achievers in the 2015 OECD
Programme for International Student Assessment
(PISA) is slightly above the EU average in all
three fields (22 % in science, 21 % in reading and
23 % in mathematics). Performance somewhat
worsened compared to 2012. The relationship
between socioeconomic background and student
performance remains strong. France shows one of
the largest gaps in the proportion of low achievers
in science between the lower and upper quarters on
the socioeconomic index of the 2015 PISA student
population (34.6 pp compared to an EU average
gap of 26.2 pp). There is also a large performance
gap between non-immigrants and first-generation
immigrants. Second-generation immigrants are
only partially catching up with non-immigrants.
There are large performance gaps between
schools in France. School composition often
reflects the residential concentration of people
with socioeconomic difficulties and migrant
background. Disadvantaged children are unevenly
distributed across schools. Social diversity
decreases further for upper secondary education
levels (CNESCO, 2016a). Pupils with a
disadvantaged background tend to be steered more
often towards initial vocational education, as a
remedy for school problems, without regard to
their motivation. Indeed, initial vocational
education pupils account for 87 % of early drop
outs in France in 2013, while accounting for close
to 40 % in 2015 of all secondary school enrolment
(CNESCO, 2016c; DEPP, 2016d). Also, teachers
in ‘priority education networks’ targeting schools
in disadvantaged areas (réseaux d’éducation
prioritaire) tend to be younger, less experienced
and more likely not permanent appointees (OECD,
2015a).
Reform plans are being gradually implemented
to address these challenges through the
prevention of poor educational outcomes. Begun
in 2013, the compulsory education reform seems to
go in the right direction, but its impact will depend
on actual implementation (MENESR, 2015;
CNESCO, 2016a). Full implementation of the
2014 priority education plan, further strengthening
support teaching staff among other measures, is
planned for 2017 with the creation of nearly 9000
new teaching posts at early education levels. Also,
to make the teaching profession more attractive, in
June 2016 the government announced an overhaul
of the salaries of teachers and staff to be rolled out
4.3. Labour market, education and social policies
36
between 2017 and 2020 at a cost of EUR 1 billion.
Measures to improve school and career guidance
of pupils are being generalised, including the
‘Parcours Avenir’.
The initial system of vocational education and
training (VET) does not lead to an optimal
integration of young people in the labour
market. France is one of the few OECD countries
where opting for VET does not provide better
employment outcomes than general education
(CNESCO, 2016b). Production sector
specialisations still offer better labour market
integration outcomes, while trade & sales and even
more secretarial training has a significantly lower
post-diploma employment rate, translating later
into a high unemployment rate (30 %). The figures
above cast doubt on whether the existing national
and local governance entities have been effective
in defining a range of education and initial training
based on economic needs and employment
prospects, rather than favouring available training
resources. In this respect, the 2014 VET reform
establishes new national and regional-level VET
and employment coordination bodies, while over
500 additional VET specialties in sectors with
good employment prospects have been announced
for the opening of the 2017 school year, along with
the creation of 1 000 specific teaching posts.
However, given the relative novelty of these
measures and announcements, their impact cannot
be assessed yet.
Apprenticeship presents better employment
outcomes than school-based initial VET.
Apprenticeship offers better labour market
integration perspectives, but is constrained by its
cost and its sensitivity to national and territorial
economic cycles, which affect company decisions
to hire apprentices (22
). As a result, apprenticeship
represents only one fourth of initial VET. The
introduction of a low-qualified apprentice
premium and the increased public sector
commitment have recently enabled the
stabilisation of apprenticeship figures. Entry into
apprenticeship is also expected to be eased by its
gradual opening to professional qualifications.
Synergies between school and work-based VET
have also been initiated to reduce the drop-out rate.
(22) The cost of an apprentice (all levels) is 2.5 times that of a
school-based VET pupil in the production sector
(CNEFOP, 2016a; CNESCO, 2016b).
The continuous VET system has important
imbalances. Continuous vocational training is
facing challenges as shown in France’s weak
results in the Programme for the International
Assessment of Adult Competencies (PIAAC)
survey, in numeracy, literacy and ICT skills. The
continuous VET system is mostly characterised by
imbalances in access to training depending on the
labour market status (23
): the unemployed, low-
qualified, older workers and small business
employees (24
) have less chance of receiving
training while jobseekers access to training stood
at 9.8 % in 2014. The reform of companies’
contributions to VET financing, part of the 2014
VET reform, in increasing coverage of SME
employees and the unemployed, aimed to improve
access to continuous training. It remains to be seen
if this law will have an impact on both access to
training and governance, together with the new
coordination bodies created at national (CNEFOP)
and regional level (CREFOP) to develop shared
diagnosis on training needs. These issues are even
more important given the recent measures taken to
sustain demand for training, such as the personal
training account scheme (Compte personnel de
formation, CPF) introduced on 1 January 2015,
included in the personal activity account (Compte
personnel d'activité, CPA) set up by the Labour
Act of 8 August 2016 (25
), and the plan 500 000
formations of January 2016 (26
).
Social policies
France fares better than the EU average on
poverty, social exclusion and inequalities, with
the poverty rate steadying at around 13.6 % and
decreasing to 17.7 % for the population at risk of
(23) Workers on temporary contracts (CDD) can expect on
average 8 hours of training per year, whereas workers with long-term contracts (CDI) can expect on average 19 hours
of training per year.
(24) Only 20 % of companies with 10 to 19 employees invest in training, whereas 60 % of companies with between 1 000
and 1 999 employees invest in training.
(25) The Labour Act of 8 August 2016 created the new personal activity account, including the personal training account,
extended additional training rights to 400 hours for
unskilled employees (against 150 hours normally) and unlimited rights for early-school leavers. At the same time,
it extended the personal training account to civil servants
and independent workers. (26) By January 2016, 500 000 additional training courses for
jobseekers were under way, with the aim of doubling their
number to 1 million, with financing of EUR 1 billion from the State and local coordination by the regions. By the end
of November 2016, 945 000 training courses had been run.
The plan will be further pursued in the first half of 2017.
4.3. Labour market, education and social policies
37
poverty or social exclusion in 2015 against
respectively 17.3 % and 23.7 % for the EU. The
impact of social transfers (representing 19.3 % of
GDP in 2014) (27
) on poverty reduction remains
high, at 43.1 % in 2015, compared with the EU
average of 33.5 %. The intensity of poverty, as
calculated by national figures, increased slightly to
20.1 % in 2014 after falling from a peak of 21.3 %
in 2012 to 19.8 % in 2013. Similarly to most
Member States, the 2020 objective for reducing the
number of people at risk of poverty or social
exclusion therefore will be very difficult to reach.
Inequality, as measured by the Gini index of
disposable income decreased from 30.8 in 2011 to
29.2 in 2015. The ratio of average income of the
bottom quintile to that of the first quintile of
income distribution decreased from 4.5 in 2012 to
4.3 in 2015.
However, some more vulnerable groups are
more affected. The poverty rate among
unemployed people increased again in 2015 (from
31.4 % in 2014 to 37.2 % in 2015, against the EU
average of 47.6 % in 2015), and the increasing
proportion of part-time workers, particularly those
who earn close to the minimum wage, has
translated into an increased risk of in-work poverty
since 2010 (from 6.5 % in 2010 to 7.5 % in 2015).
Although it remains below the EU average (9.5 %
in 2015), in-work poverty risk remains higher for
part-time workers (13.2 % in 2015). The
proportion of involuntary part-time employment
— as a percentage of total part-time employment
— has increased steadily in recent years and
reached 43.7 % in 2015, up from 30.8 % a decade
ago, with women representing a large majority of
involuntary part-timers. Moreover, children, young
people and single-parent families, remain at
particularly high risk of poverty (18.7 %, 17.9 %
and 36.7 % respectively in 2015). Non-EU born
are more affected by poverty and social exclusion
(33.2 % in 2015) than French native-born (15.2 %)
and their in-work poverty rate (18.5 %) is three-
time higher than that of native-born workers
(6.5 %).
Low-income earners’ access to affordable
housing remains a challenge. There is a critical
(27) This figure does not include transfers to older people,
which are treated as pensions. The impact of social transfers is calculated as the percentage difference between
the at-risk-of-poverty rate before and after social transfers.
shortage of affordable housing, including social
housing, in particular in growing urban areas.
Problems related to the lack of sufficient (social)
housing (Fondation Abbé Pierre, 2016; INSEE,
2016), affects more socially disadvantaged people
and in particular non-EU born. Around 1.7 million
people are on social housing waiting lists,
including nearly 500 000 people in Ile-de-France.
Homelessness levels are high and continue to rise;
141 000 homeless people were recorded in 2012,
which is a 50 % increase since 2001.
Measures were taken to simplify and increase
the activation component of income support
and its take-up at the bottom of the wage
scale (28
). As part of the implementation of the
multiannual antipoverty plan (adopted in January
2013) two wage support schemes (the revenu de
solidarité active activité and the prime pour
l’emploi) were merged into a single activity bonus
(the prime d’activité) as of 1 January 2016. The
latter is also open to people under 25 years of age,
unlike the previous revenu de solidarité active
activité. Data suggest that a 50 % claim rate had
already been reached by the end of the first quarter
of 2016 (i.e. 2 million beneficiaries), with over
3.8 million beneficiaries recorded in September
2016, one sixth of them being aged under 25.
Close monitoring of the effective impact of the
measures taken will be important.
(28) Complemented by a tax credit in 2014 and by abolishing
the lowest rate band in 2015, it has been further extended to benefit 12 million tax units in 2016.
4.3. Labour market, education and social policies
38
Box 4.3.1: Selected highlights: recent reforms to promote flexicurity in France
In recent years, France has adopted a number of important reforms aimed at improving the
functioning of the labour market.
Labour law has been reformed in order to increase hiring on permanent contract, by reducing legal
uncertainties in case of individual dismissal (notably defining clear layoff criteria for economic
reasons (1)) and by setting indicative floors and ceilings for financial compensation in case of
unfair individual dismissal. Furthermore, the functioning of individual work litigation courts
(prud'hommes) has been reviewed to reduce the procedural length. (2) In case of collective
dismissal, the layoff programme negotiated by social partners (3) now has to be simply validated
by the administrative court. Flexibility has also been strengthened at company level with the set-
up of ‘accords de maintien de l’emploi’, which allow the employers to reduce wages and/or
increase working hours in case of economic difficulties (4) or even, with some restrictions on
wages, in case of market expansion. The possibility to sign agreements at company level
derogating from branch level provisions has been reinforced in relation to the working time,
including on extra hours premium. Social dialogue has been reformed with the creation of a
dedicated fund for a better quality of social dialogue, the grouping of all mandatory consultations
of the Work Council into three per year, respectively on the strategy, the economic situation and
the social policy of the company (5) and the progressive application of the majority agreement at
company level.
In parallel, transitions are being progressively secured. Since 2011 the professional securing
contract has introduced more security for employees laid off in companies with less than 1000
employees or in bankrupt companies. The contract supports workers to get back to work by setting
up specific accompanying and training measures and grants. The introduction of ‘rechargeable
rights’ increases the incentive to return to a new job by preserving previously acquired rights. The
life-long learning dimension of flexicurity has been addressed with the adoption in 2014 of the
training act, (6) introducing a personal training account providing (
7) rights directly attached to any
active person in the private sector all along her career. Additional support is provided for low-
qualified and early-school leavers through this account and a specific training action (8) plan has
been set up for unemployed in order to improve their adaptability, with a focus on long term
unemployed.
Building on the personal training account, a personal activity account is operational since January
2017. This account is accessible to all, including civil servants, unemployed and self-employed. It
allows them to have access to all the rights acquired throughout their career both in terms of
training and hardship (accumulation of rights for retirement). Effective access to training for the
low-qualified and the unemployed remains to be further assessed, as well as the impact of
increased labour market flexibility on the use of permanent contracts, while the reform of the
unemployment benefit system has been delayed and is expected for 2017.
(1) Labour Act of 8 August 2016. (2) Law of 6 August 2015 on economic growth and activity and decree of May 2016.
(3) Law of 14 June 2013 on securing employment.
(4) Law of 14 June 2013 on securing employment and Law of 6 August 2015 on economic growth and activity. (5) Social dialogue Act of 17 August 2015.
(6) Law of 5 March 2014 on vocational training, employment and social democracy.
(7) Now merged with the personal activity account. (8) Plan of 500 000 additional trainings to jobseekers of January 2016.
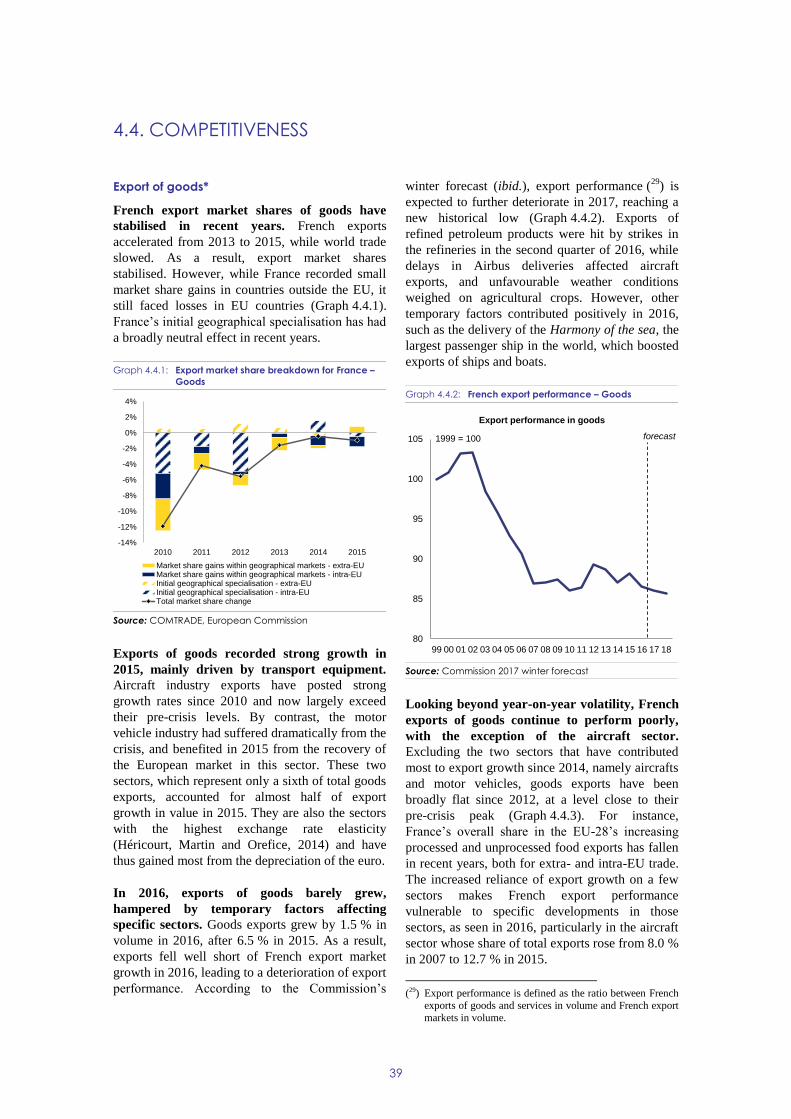
39
Export of goods*
French export market shares of goods have
stabilised in recent years. French exports
accelerated from 2013 to 2015, while world trade
slowed. As a result, export market shares
stabilised. However, while France recorded small
market share gains in countries outside the EU, it
still faced losses in EU countries (Graph 4.4.1).
France’s initial geographical specialisation has had
a broadly neutral effect in recent years.
Graph 4.4.1: Export market share breakdown for France –
Goods
Source: COMTRADE, European Commission
Exports of goods recorded strong growth in
2015, mainly driven by transport equipment.
Aircraft industry exports have posted strong
growth rates since 2010 and now largely exceed
their pre-crisis levels. By contrast, the motor
vehicle industry had suffered dramatically from the
crisis, and benefited in 2015 from the recovery of
the European market in this sector. These two
sectors, which represent only a sixth of total goods
exports, accounted for almost half of export
growth in value in 2015. They are also the sectors
with the highest exchange rate elasticity
(Héricourt, Martin and Orefice, 2014) and have
thus gained most from the depreciation of the euro.
In 2016, exports of goods barely grew,
hampered by temporary factors affecting
specific sectors. Goods exports grew by 1.5 % in
volume in 2016, after 6.5 % in 2015. As a result,
exports fell well short of French export market
growth in 2016, leading to a deterioration of export
performance. According to the Commission’s
winter forecast (ibid.), export performance (29
) is
expected to further deteriorate in 2017, reaching a
new historical low (Graph 4.4.2). Exports of
refined petroleum products were hit by strikes in
the refineries in the second quarter of 2016, while
delays in Airbus deliveries affected aircraft
exports, and unfavourable weather conditions
weighed on agricultural crops. However, other
temporary factors contributed positively in 2016,
such as the delivery of the Harmony of the sea, the
largest passenger ship in the world, which boosted
exports of ships and boats.
Graph 4.4.2: French export performance – Goods
Source: Commission 2017 winter forecast
Looking beyond year-on-year volatility, French
exports of goods continue to perform poorly,
with the exception of the aircraft sector.
Excluding the two sectors that have contributed
most to export growth since 2014, namely aircrafts
and motor vehicles, goods exports have been
broadly flat since 2012, at a level close to their
pre-crisis peak (Graph 4.4.3). For instance,
France’s overall share in the EU-28’s increasing
processed and unprocessed food exports has fallen
in recent years, both for extra- and intra-EU trade.
The increased reliance of export growth on a few
sectors makes French export performance
vulnerable to specific developments in those
sectors, as seen in 2016, particularly in the aircraft
sector whose share of total exports rose from 8.0 %
in 2007 to 12.7 % in 2015.
(29) Export performance is defined as the ratio between French
exports of goods and services in volume and French export
markets in volume.
-14%
-12%
-10%
-8%
-6%
-4%
-2%
0%
2%
4%
2010 2011 2012 2013 2014 2015
Market share gains within geographical markets - extra-EUMarket share gains within geographical markets - intra-EUInitial geographical specialisation - extra-EUInitial geographical specialisation - intra-EUTotal market share change
80
85
90
95
100
105
99 00 01 02 03 04 05 06 07 08 09 10 11 12 13 14 15 16 17 18
Export performance in goods
1999 = 100 forecast
4.4. COMPETITIVENESS
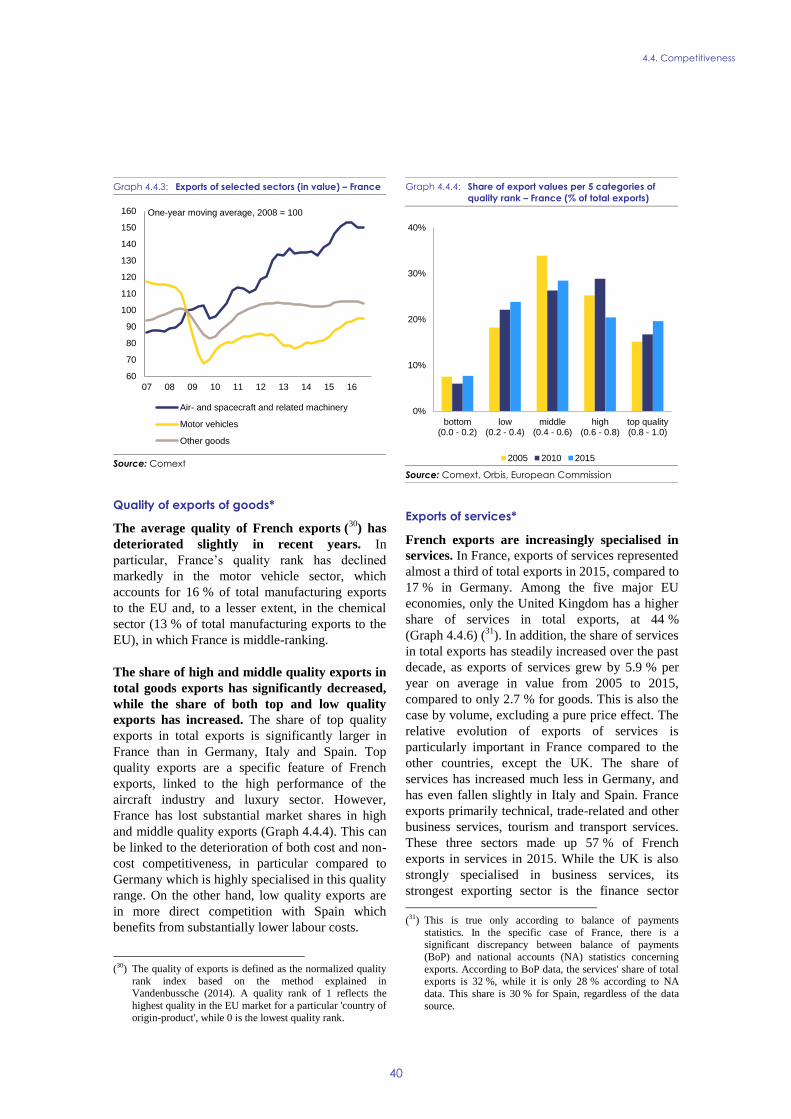
4.4. Competitiveness
40
Graph 4.4.3: Exports of selected sectors (in value) – France
Source: Comext
Quality of exports of goods*
The average quality of French exports (30
) has
deteriorated slightly in recent years. In
particular, France’s quality rank has declined
markedly in the motor vehicle sector, which
accounts for 16 % of total manufacturing exports
to the EU and, to a lesser extent, in the chemical
sector (13 % of total manufacturing exports to the
EU), in which France is middle-ranking.
The share of high and middle quality exports in
total goods exports has significantly decreased,
while the share of both top and low quality
exports has increased. The share of top quality
exports in total exports is significantly larger in
France than in Germany, Italy and Spain. Top
quality exports are a specific feature of French
exports, linked to the high performance of the
aircraft industry and luxury sector. However,
France has lost substantial market shares in high
and middle quality exports (Graph 4.4.4). This can
be linked to the deterioration of both cost and non-
cost competitiveness, in particular compared to
Germany which is highly specialised in this quality
range. On the other hand, low quality exports are
in more direct competition with Spain which
benefits from substantially lower labour costs.
(30) The quality of exports is defined as the normalized quality
rank index based on the method explained in Vandenbussche (2014). A quality rank of 1 reflects the
highest quality in the EU market for a particular 'country of
origin-product', while 0 is the lowest quality rank.
Graph 4.4.4: Share of export values per 5 categories of
quality rank – France (% of total exports)
Source: Comext, Orbis, European Commission
Exports of services*
French exports are increasingly specialised in
services. In France, exports of services represented
almost a third of total exports in 2015, compared to
17 % in Germany. Among the five major EU
economies, only the United Kingdom has a higher
share of services in total exports, at 44 %
(Graph 4.4.6) (31
). In addition, the share of services
in total exports has steadily increased over the past
decade, as exports of services grew by 5.9 % per
year on average in value from 2005 to 2015,
compared to only 2.7 % for goods. This is also the
case by volume, excluding a pure price effect. The
relative evolution of exports of services is
particularly important in France compared to the
other countries, except the UK. The share of
services has increased much less in Germany, and
has even fallen slightly in Italy and Spain. France
exports primarily technical, trade-related and other
business services, tourism and transport services.
These three sectors made up 57 % of French
exports in services in 2015. While the UK is also
strongly specialised in business services, its
strongest exporting sector is the finance sector
(31) This is true only according to balance of payments
statistics. In the specific case of France, there is a significant discrepancy between balance of payments
(BoP) and national accounts (NA) statistics concerning
exports. According to BoP data, the services' share of total exports is 32 %, while it is only 28 % according to NA
data. This share is 30 % for Spain, regardless of the data
source.
60
70
80
90
100
110
120
130
140
150
160
07 08 09 10 11 12 13 14 15 16
Air- and spacecraft and related machinery
Motor vehicles
Other goods
One-year moving average, 2008 = 100
0%
10%
20%
30%
40%
bottom(0.0 - 0.2)
low(0.2 - 0.4)
middle(0.4 - 0.6)
high(0.6 - 0.8)
top quality(0.8 - 1.0)
2005 2010 2015
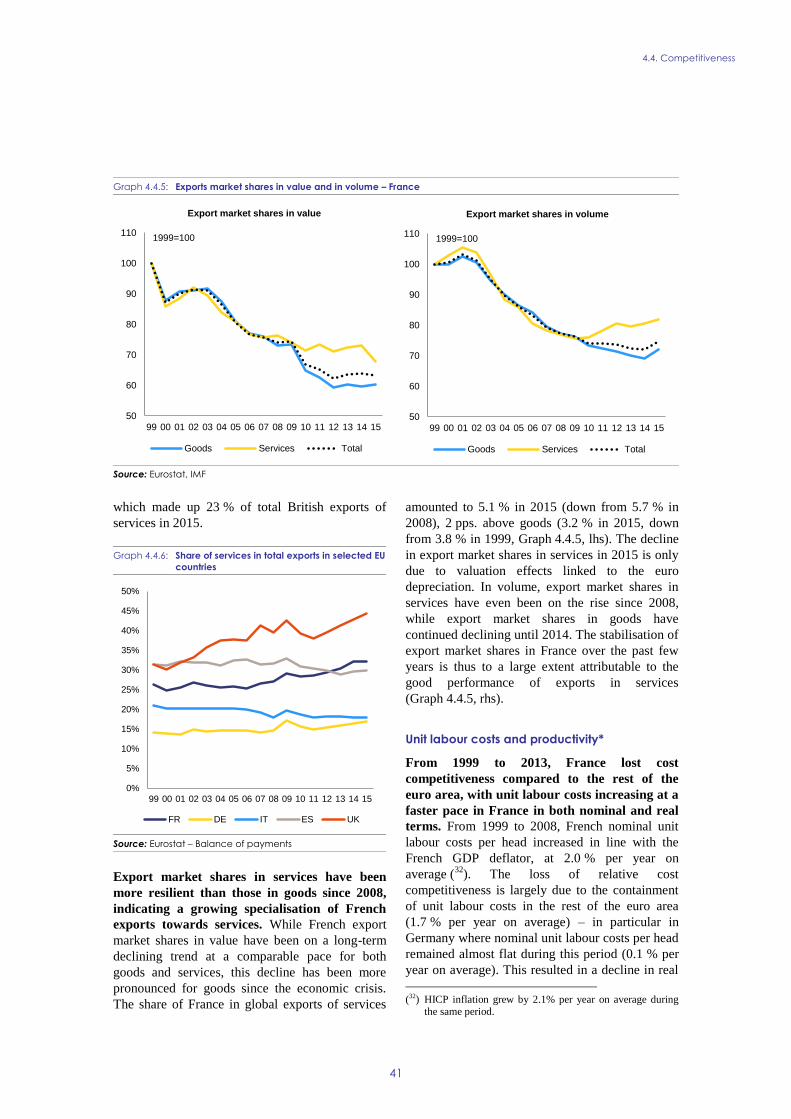
4.4. Competitiveness
41
which made up 23 % of total British exports of
services in 2015.
Graph 4.4.6: Share of services in total exports in selected EU
countries
Source: Eurostat – Balance of payments
Export market shares in services have been
more resilient than those in goods since 2008,
indicating a growing specialisation of French
exports towards services. While French export
market shares in value have been on a long-term
declining trend at a comparable pace for both
goods and services, this decline has been more
pronounced for goods since the economic crisis.
The share of France in global exports of services
amounted to 5.1 % in 2015 (down from 5.7 % in
2008), 2 pps. above goods (3.2 % in 2015, down
from 3.8 % in 1999, Graph 4.4.5, lhs). The decline
in export market shares in services in 2015 is only
due to valuation effects linked to the euro
depreciation. In volume, export market shares in
services have even been on the rise since 2008,
while export market shares in goods have
continued declining until 2014. The stabilisation of
export market shares in France over the past few
years is thus to a large extent attributable to the
good performance of exports in services
(Graph 4.4.5, rhs).
Unit labour costs and productivity*
From 1999 to 2013, France lost cost
competitiveness compared to the rest of the
euro area, with unit labour costs increasing at a
faster pace in France in both nominal and real
terms. From 1999 to 2008, French nominal unit
labour costs per head increased in line with the
French GDP deflator, at 2.0 % per year on
average (32
). The loss of relative cost
competitiveness is largely due to the containment
of unit labour costs in the rest of the euro area
(1.7 % per year on average) – in particular in
Germany where nominal unit labour costs per head
remained almost flat during this period (0.1 % per
year on average). This resulted in a decline in real
(32) HICP inflation grew by 2.1% per year on average during
the same period.
0%
5%
10%
15%
20%
25%
30%
35%
40%
45%
50%
99 00 01 02 03 04 05 06 07 08 09 10 11 12 13 14 15
FR DE IT ES UK
Graph 4.4.5: Exports market shares in value and in volume – France
Source: Eurostat, IMF
50
60
70
80
90
100
110
99 00 01 02 03 04 05 06 07 08 09 10 11 12 13 14 15
Export market shares in value
Goods Services Total
1999=100
50
60
70
80
90
100
110
99 00 01 02 03 04 05 06 07 08 09 10 11 12 13 14 15
Export market shares in volume
Goods Services Total
1999=100
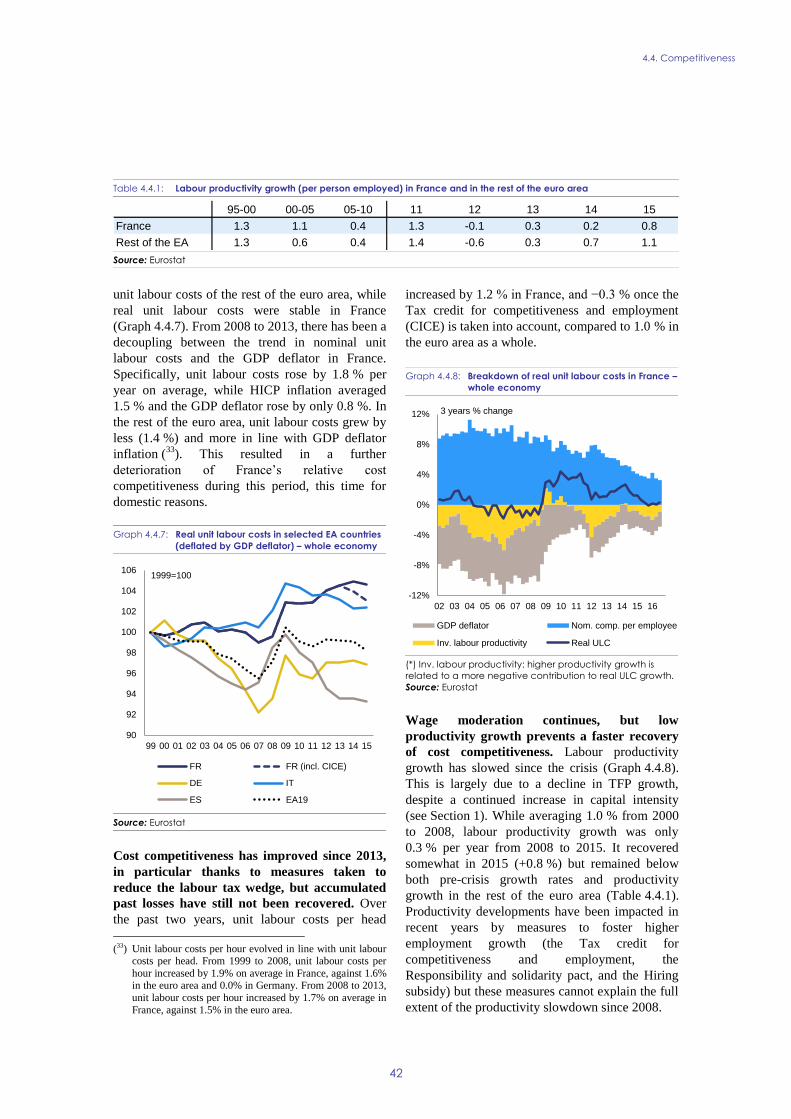
4.4. Competitiveness
42
unit labour costs of the rest of the euro area, while
real unit labour costs were stable in France
(Graph 4.4.7). From 2008 to 2013, there has been a
decoupling between the trend in nominal unit
labour costs and the GDP deflator in France.
Specifically, unit labour costs rose by 1.8 % per
year on average, while HICP inflation averaged
1.5 % and the GDP deflator rose by only 0.8 %. In
the rest of the euro area, unit labour costs grew by
less (1.4 %) and more in line with GDP deflator
inflation (33
). This resulted in a further
deterioration of France’s relative cost
competitiveness during this period, this time for
domestic reasons.
Graph 4.4.7: Real unit labour costs in selected EA countries
(deflated by GDP deflator) – whole economy
Source: Eurostat
Cost competitiveness has improved since 2013,
in particular thanks to measures taken to
reduce the labour tax wedge, but accumulated
past losses have still not been recovered. Over
the past two years, unit labour costs per head
(33) Unit labour costs per hour evolved in line with unit labour
costs per head. From 1999 to 2008, unit labour costs per
hour increased by 1.9% on average in France, against 1.6% in the euro area and 0.0% in Germany. From 2008 to 2013,
unit labour costs per hour increased by 1.7% on average in
France, against 1.5% in the euro area.
increased by 1.2 % in France, and −0.3 % once the
Tax credit for competitiveness and employment
(CICE) is taken into account, compared to 1.0 % in
the euro area as a whole.
Graph 4.4.8: Breakdown of real unit labour costs in France –
whole economy
(*) Inv. labour productivity: higher productivity growth is
related to a more negative contribution to real ULC growth.
Source: Eurostat
Wage moderation continues, but low
productivity growth prevents a faster recovery
of cost competitiveness. Labour productivity
growth has slowed since the crisis (Graph 4.4.8).
This is largely due to a decline in TFP growth,
despite a continued increase in capital intensity
(see Section 1). While averaging 1.0 % from 2000
to 2008, labour productivity growth was only
0.3 % per year from 2008 to 2015. It recovered
somewhat in 2015 (+0.8 %) but remained below
both pre-crisis growth rates and productivity
growth in the rest of the euro area (Table 4.4.1).
Productivity developments have been impacted in
recent years by measures to foster higher
employment growth (the Tax credit for
competitiveness and employment, the
Responsibility and solidarity pact, and the Hiring
subsidy) but these measures cannot explain the full
extent of the productivity slowdown since 2008.
90
92
94
96
98
100
102
104
106
99 00 01 02 03 04 05 06 07 08 09 10 11 12 13 14 15
FR FR (incl. CICE)
DE IT
ES EA19
1999=100
-12%
-8%
-4%
0%
4%
8%
12%
02 03 04 05 06 07 08 09 10 11 12 13 14 15 16
GDP deflator Nom. comp. per employee
Inv. labour productivity Real ULC
3 years % change
Table 4.4.1: Labour productivity growth (per person employed) in France and in the rest of the euro area
Source: Eurostat
95-00 00-05 05-10 11 12 13 14 15
France 1.3 1.1 0.4 1.3 -0.1 0.3 0.2 0.8
Rest of the EA 1.3 0.6 0.4 1.4 -0.6 0.3 0.7 1.1
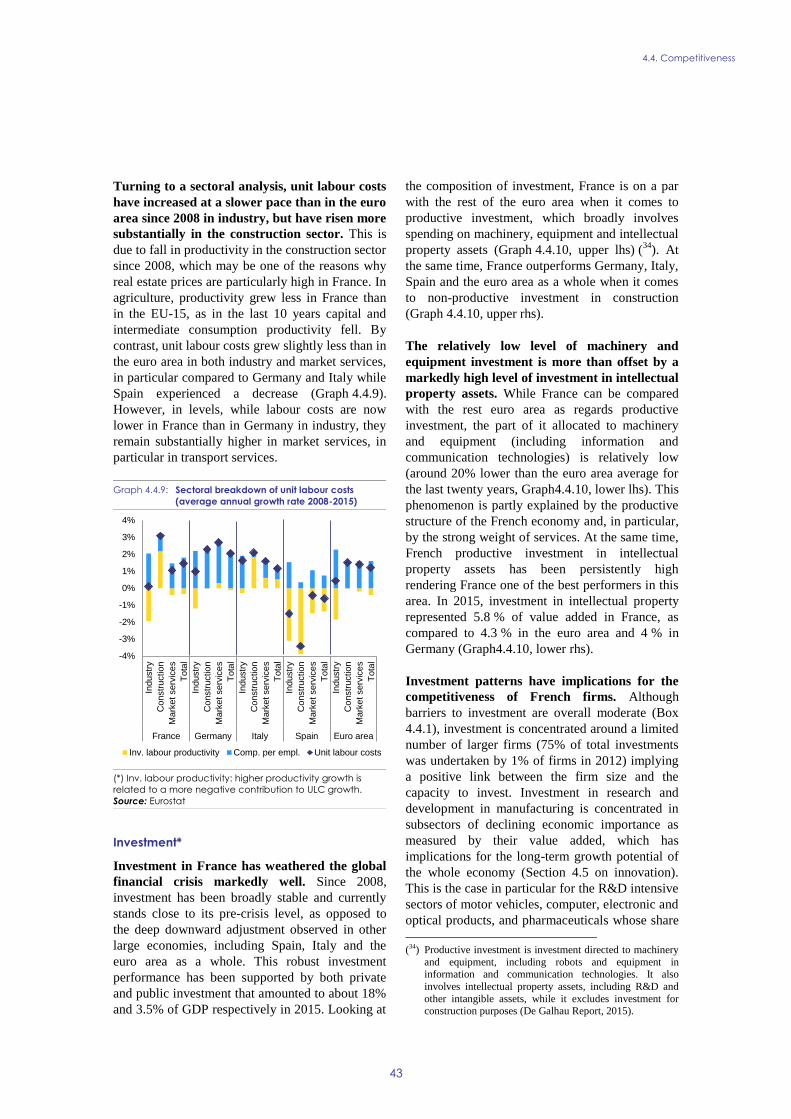
4.4. Competitiveness
43
Turning to a sectoral analysis, unit labour costs
have increased at a slower pace than in the euro
area since 2008 in industry, but have risen more
substantially in the construction sector. This is
due to fall in productivity in the construction sector
since 2008, which may be one of the reasons why
real estate prices are particularly high in France. In
agriculture, productivity grew less in France than
in the EU-15, as in the last 10 years capital and
intermediate consumption productivity fell. By
contrast, unit labour costs grew slightly less than in
the euro area in both industry and market services,
in particular compared to Germany and Italy while
Spain experienced a decrease (Graph 4.4.9).
However, in levels, while labour costs are now
lower in France than in Germany in industry, they
remain substantially higher in market services, in
particular in transport services.
Graph 4.4.9: Sectoral breakdown of unit labour costs
(average annual growth rate 2008-2015)
(*) Inv. labour productivity: higher productivity growth is
related to a more negative contribution to ULC growth.
Source: Eurostat
Investment*
Investment in France has weathered the global
financial crisis markedly well. Since 2008,
investment has been broadly stable and currently
stands close to its pre-crisis level, as opposed to
the deep downward adjustment observed in other
large economies, including Spain, Italy and the
euro area as a whole. This robust investment
performance has been supported by both private
and public investment that amounted to about 18%
and 3.5% of GDP respectively in 2015. Looking at
the composition of investment, France is on a par
with the rest of the euro area when it comes to
productive investment, which broadly involves
spending on machinery, equipment and intellectual
property assets (Graph 4.4.10, upper lhs) (34
). At
the same time, France outperforms Germany, Italy,
Spain and the euro area as a whole when it comes
to non-productive investment in construction
(Graph 4.4.10, upper rhs).
The relatively low level of machinery and
equipment investment is more than offset by a
markedly high level of investment in intellectual
property assets. While France can be compared
with the rest euro area as regards productive
investment, the part of it allocated to machinery
and equipment (including information and
communication technologies) is relatively low
(around 20% lower than the euro area average for
the last twenty years, Graph4.4.10, lower lhs). This
phenomenon is partly explained by the productive
structure of the French economy and, in particular,
by the strong weight of services. At the same time,
French productive investment in intellectual
property assets has been persistently high
rendering France one of the best performers in this
area. In 2015, investment in intellectual property
represented 5.8 % of value added in France, as
compared to 4.3 % in the euro area and 4 % in
Germany (Graph4.4.10, lower rhs).
Investment patterns have implications for the
competitiveness of French firms. Although
barriers to investment are overall moderate (Box
4.4.1), investment is concentrated around a limited
number of larger firms (75% of total investments
was undertaken by 1% of firms in 2012) implying
a positive link between the firm size and the
capacity to invest. Investment in research and
development in manufacturing is concentrated in
subsectors of declining economic importance as
measured by their value added, which has
implications for the long-term growth potential of
the whole economy (Section 4.5 on innovation).
This is the case in particular for the R&D intensive
sectors of motor vehicles, computer, electronic and
optical products, and pharmaceuticals whose share
(34) Productive investment is investment directed to machinery
and equipment, including robots and equipment in
information and communication technologies. It also
involves intellectual property assets, including R&D and
other intangible assets, while it excludes investment for construction purposes (De Galhau Report, 2015).
-4%
-3%
-2%
-1%
0%
1%
2%
3%
4%
Industr
y
Constr
uctio
n
Ma
rket serv
ice
s
To
tal
Industr
y
Constr
uction
Ma
rket serv
ice
s
To
tal
Industr
y
Constr
uctio
n
Ma
rket serv
ice
s
Tota
l
Industr
y
Constr
uctio
n
Ma
rket serv
ice
s
To
tal
Industr
y
Constr
uction
Ma
rket serv
ice
s
To
tal
France Germany Italy Spain Euro area
Inv. labour productivity Comp. per empl. Unit labour costs
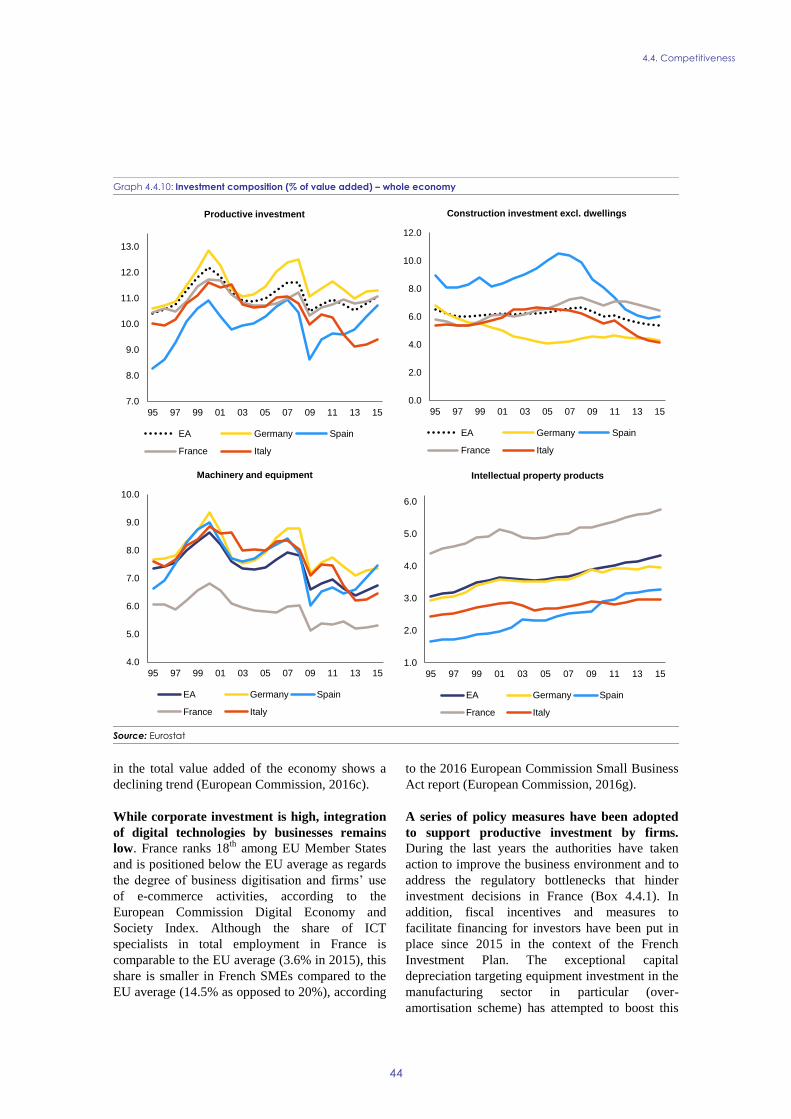
4.4. Competitiveness
44
in the total value added of the economy shows a
declining trend (European Commission, 2016c).
While corporate investment is high, integration
of digital technologies by businesses remains
low. France ranks 18th
among EU Member States
and is positioned below the EU average as regards
the degree of business digitisation and firms’ use
of e-commerce activities, according to the
European Commission Digital Economy and
Society Index. Although the share of ICT
specialists in total employment in France is
comparable to the EU average (3.6% in 2015), this
share is smaller in French SMEs compared to the
EU average (14.5% as opposed to 20%), according
to the 2016 European Commission Small Business
Act report (European Commission, 2016g).
A series of policy measures have been adopted
to support productive investment by firms.
During the last years the authorities have taken
action to improve the business environment and to
address the regulatory bottlenecks that hinder
investment decisions in France (Box 4.4.1). In
addition, fiscal incentives and measures to
facilitate financing for investors have been put in
place since 2015 in the context of the French
Investment Plan. The exceptional capital
depreciation targeting equipment investment in the
manufacturing sector in particular (over-
amortisation scheme) has attempted to boost this
Graph 4.4.10: Investment composition (% of value added) – whole economy
Source: Eurostat
7.0
8.0
9.0
10.0
11.0
12.0
13.0
95 97 99 01 03 05 07 09 11 13 15
Productive investment
EA Germany Spain
France Italy
0.0
2.0
4.0
6.0
8.0
10.0
12.0
95 97 99 01 03 05 07 09 11 13 15
Construction investment excl. dwellings
EA Germany Spain
France Italy
4.0
5.0
6.0
7.0
8.0
9.0
10.0
95 97 99 01 03 05 07 09 11 13 15
Machinery and equipment
EA Germany Spain
France Italy
1.0
2.0
3.0
4.0
5.0
6.0
95 97 99 01 03 05 07 09 11 13 15
Intellectual property products
EA Germany Spain
France Italy
4.4. Competitiveness
45
particular type of investment. This fiscal incentive
has already shown some positive results and its
validity has been extended until mid-April 2017.
Meanwhile, the co-financing capacity of the public
investment bank for tangible and intangible
investment projects has been strengthened with a
view to supporting the modernisation of French
firms. Finally, access to equity for the financing of
longer-term projects has been eased through
measures to better link savings collected by private
funds (e.g. pension or life insurance funds) with
the capital market.
Business environment*
Although France has improved its overall
regulatory performance, its business
environment continues to be middle-ranking.
According to the distance-to-frontier criterion used
in World Bank surveys (35
), since 2010 France has
closed part of the gap with the best performers in
business regulations. The World Bank’s 2017
Doing Business survey ranks France 29th
out of
190 economies assessed, one position down
compared to last year. France is also 15th
among
the EU Member States. The 2016-2017 Global
Competitiveness Report by the World Economic
Forum (WEF) ranks France 21st out of 138
countries assessed, one position up compared to
last year, given improvements in the
macroeconomic environment and building permit
procedures. According to the WEF, the three most
problematic factors for doing business in France
remain, as last year, the restrictive labour
regulations, the high tax rates and the tax
regulations. France is also in 115th
place as regards
the burden of government regulation. Some 89 %
of the French SMEs responding to a 2016
Commission Survey find that complexity of
administrative procedures is a problem for doing
business in France (EU average: 62 %) and this
score has fallen by six percentage points since
2013 (36
).
Registering property, getting credit and paying
taxes is more difficult or costly for businesses in
(35) The distance to frontier (DTF) score helps assess the
absolute level of regulatory performance of a country over time with higher values indicating a better performance. It
measures the distance of each economy to the best
performance observed on each of the indicators across all economies in the Doing Business sample.
(36) European Commission, 2016g.
France than in most other developed economies.
France fell 9 places compared to last year for
registering property, by the World Bank’s
assessment. While economies worldwide have
been making it easier for entrepreneurs to register
and transfer property, e.g. by introducing time
limits for procedures and by setting low fixed fees,
France has made transferring property more
expensive by increasing the property transfer tax
rate and by introducing an additional tax on
businesses in Paris. Registering property in France
takes 64 days and costs 7.3 % of the property
value. As regards access to credit, according to the
World Bank, the effectiveness of collateral and
bankruptcy laws is relatively low, while weak legal
rights for borrowers and lenders together with poor
sharing of credit information make access to credit
more difficult for businesses. Nevertheless,
according to Commission surveys, French SMEs’
access to finance is in line with the EU
average (37
). On the positive side, France has
improved its ranking by 10 places as regards
dealing with construction permits, by reducing the
cost of obtaining a permit, although the time
needed remains relatively long (183 days
compared to around 60 in the UK and 90 in
Germany). France also appears first in the
worldwide classification as regards ease of trading
a shipment of goods across borders.
Although trading across borders is relatively
easy and cheap, French SMEs participate less
than other European SMEs in the EU’s Single
Market (38
). Despite the low cost and short time
needed in France to trade a shipment of goods, the
percentage of French SMEs exporting within the
EU (7.8 %) is relatively low and largely focuses on
French-speaking countries such as Belgium and
Switzerland (Douanes, 2015). This trend can be
explained by a number of factors, including the
lesser need to export given the large domestic
market, the relatively smaller proportion of
medium-sized firms, language and cultural factors,
and the regulatory environment for exporting
firms.
(37) European Commission, 2016g.
(38) European Commission, 2016g.
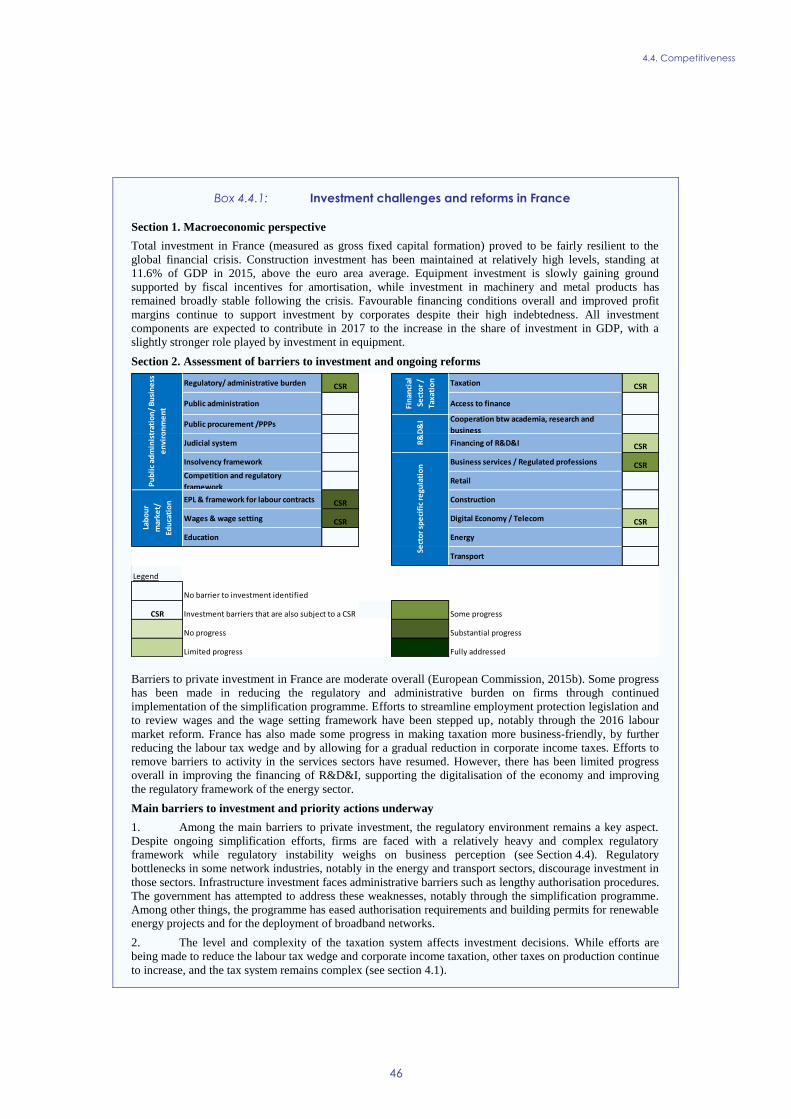
4.4. Competitiveness
46
Box 4.4.1: Investment challenges and reforms in France
Section 1. Macroeconomic perspective
Total investment in France (measured as gross fixed capital formation) proved to be fairly resilient to the
global financial crisis. Construction investment has been maintained at relatively high levels, standing at
11.6% of GDP in 2015, above the euro area average. Equipment investment is slowly gaining ground
supported by fiscal incentives for amortisation, while investment in machinery and metal products has
remained broadly stable following the crisis. Favourable financing conditions overall and improved profit
margins continue to support investment by corporates despite their high indebtedness. All investment
components are expected to contribute in 2017 to the increase in the share of investment in GDP, with a
slightly stronger role played by investment in equipment.
Section 2. Assessment of barriers to investment and ongoing reforms
Barriers to private investment in France are moderate overall (European Commission, 2015b). Some progress
has been made in reducing the regulatory and administrative burden on firms through continued
implementation of the simplification programme. Efforts to streamline employment protection legislation and
to review wages and the wage setting framework have been stepped up, notably through the 2016 labour
market reform. France has also made some progress in making taxation more business-friendly, by further
reducing the labour tax wedge and by allowing for a gradual reduction in corporate income taxes. Efforts to
remove barriers to activity in the services sectors have resumed. However, there has been limited progress
overall in improving the financing of R&D&I, supporting the digitalisation of the economy and improving
the regulatory framework of the energy sector.
Main barriers to investment and priority actions underway
1. Among the main barriers to private investment, the regulatory environment remains a key aspect.
Despite ongoing simplification efforts, firms are faced with a relatively heavy and complex regulatory
framework while regulatory instability weighs on business perception (see Section 4.4). Regulatory
bottlenecks in some network industries, notably in the energy and transport sectors, discourage investment in
those sectors. Infrastructure investment faces administrative barriers such as lengthy authorisation procedures.
The government has attempted to address these weaknesses, notably through the simplification programme.
Among other things, the programme has eased authorisation requirements and building permits for renewable
energy projects and for the deployment of broadband networks.
2. The level and complexity of the taxation system affects investment decisions. While efforts are
being made to reduce the labour tax wedge and corporate income taxation, other taxes on production continue
to increase, and the tax system remains complex (see section 4.1).
Regulatory/ administrative burden CSR Taxation CSR
Public administration Access to finance
Public procurement /PPPsCooperation btw academia, research and
business
Judicial system Financing of R&D&I CSR
Insolvency framework Business services / Regulated professions CSRCompetition and regulatory
frameworkRetail
EPL & framework for labour contracts CSR Construction
Wages & wage setting CSR Digital Economy / Telecom CSR
Education Energy
Transport
Legend
No barrier to investment identified
CSR Investment barriers that are also subject to a CSR Some progress
No progress Substantial progress
Limited progress Fully addressed
Pu
bli
c ad
min
istr
atio
n/
Bu
sin
ess
en
viro
nm
en
t
Lab
ou
r
mar
ket/
Edu
cati
on
Sect
or
spe
cifi
c re
gula
tio
n
Fin
anci
al
Sect
or
/
Taxa
tio
n
R&
D&
I
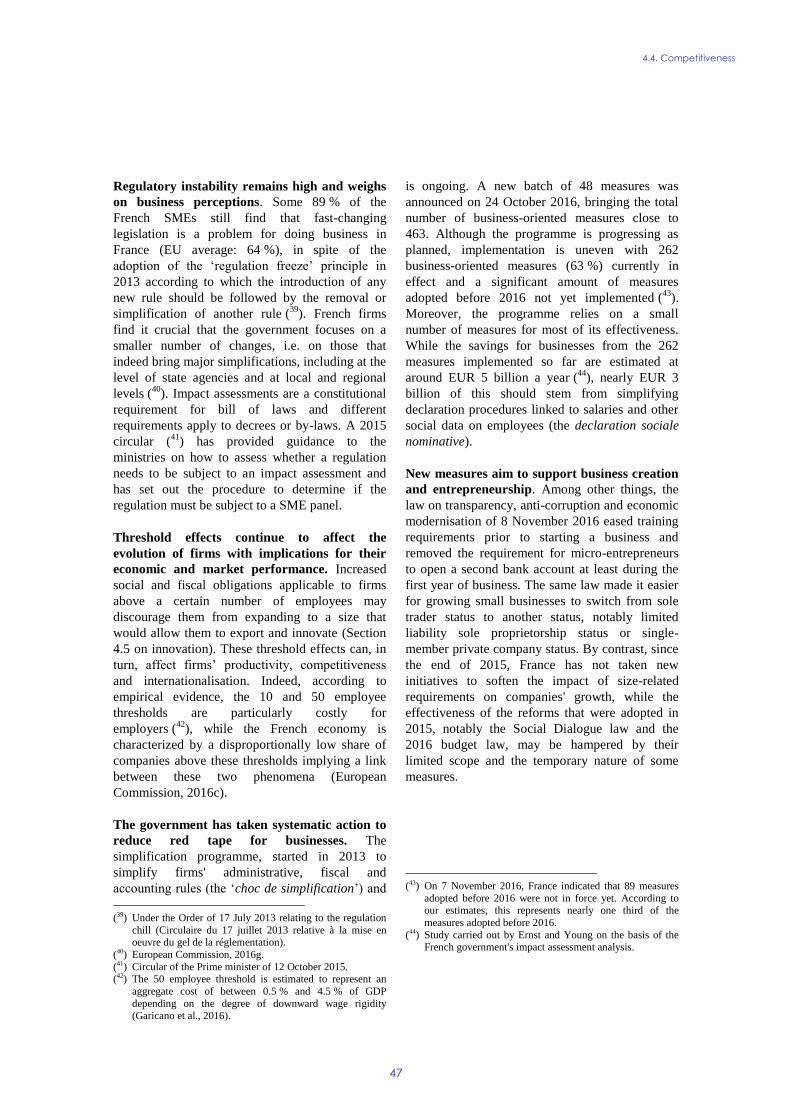
4.4. Competitiveness
47
Regulatory instability remains high and weighs
on business perceptions. Some 89 % of the
French SMEs still find that fast-changing
legislation is a problem for doing business in
France (EU average: 64 %), in spite of the
adoption of the ‘regulation freeze’ principle in
2013 according to which the introduction of any
new rule should be followed by the removal or
simplification of another rule (39
). French firms
find it crucial that the government focuses on a
smaller number of changes, i.e. on those that
indeed bring major simplifications, including at the
level of state agencies and at local and regional
levels (40
). Impact assessments are a constitutional
requirement for bill of laws and different
requirements apply to decrees or by-laws. A 2015
circular (41
) has provided guidance to the
ministries on how to assess whether a regulation
needs to be subject to an impact assessment and
has set out the procedure to determine if the
regulation must be subject to a SME panel.
Threshold effects continue to affect the
evolution of firms with implications for their
economic and market performance. Increased
social and fiscal obligations applicable to firms
above a certain number of employees may
discourage them from expanding to a size that
would allow them to export and innovate (Section
4.5 on innovation). These threshold effects can, in
turn, affect firms’ productivity, competitiveness
and internationalisation. Indeed, according to
empirical evidence, the 10 and 50 employee
thresholds are particularly costly for
employers (42
), while the French economy is
characterized by a disproportionally low share of
companies above these thresholds implying a link
between these two phenomena (European
Commission, 2016c).
The government has taken systematic action to
reduce red tape for businesses. The
simplification programme, started in 2013 to
simplify firms' administrative, fiscal and
accounting rules (the ‘choc de simplification’) and
(39) Under the Order of 17 July 2013 relating to the regulation
chill (Circulaire du 17 juillet 2013 relative à la mise en oeuvre du gel de la réglementation).
(40) European Commission, 2016g.
(41) Circular of the Prime minister of 12 October 2015.
(42) The 50 employee threshold is estimated to represent an
aggregate cost of between 0.5 % and 4.5 % of GDP
depending on the degree of downward wage rigidity (Garicano et al., 2016).
is ongoing. A new batch of 48 measures was
announced on 24 October 2016, bringing the total
number of business-oriented measures close to
463. Although the programme is progressing as
planned, implementation is uneven with 262
business-oriented measures (63 %) currently in
effect and a significant amount of measures
adopted before 2016 not yet implemented (43
).
Moreover, the programme relies on a small
number of measures for most of its effectiveness.
While the savings for businesses from the 262
measures implemented so far are estimated at
around EUR 5 billion a year (44
), nearly EUR 3
billion of this should stem from simplifying
declaration procedures linked to salaries and other
social data on employees (the declaration sociale
nominative).
New measures aim to support business creation
and entrepreneurship. Among other things, the
law on transparency, anti-corruption and economic
modernisation of 8 November 2016 eased training
requirements prior to starting a business and
removed the requirement for micro-entrepreneurs
to open a second bank account at least during the
first year of business. The same law made it easier
for growing small businesses to switch from sole
trader status to another status, notably limited
liability sole proprietorship status or single-
member private company status. By contrast, since
the end of 2015, France has not taken new
initiatives to soften the impact of size-related
requirements on companies' growth, while the
effectiveness of the reforms that were adopted in
2015, notably the Social Dialogue law and the
2016 budget law, may be hampered by their
limited scope and the temporary nature of some
measures.
(43) On 7 November 2016, France indicated that 89 measures
adopted before 2016 were not in force yet. According to our estimates, this represents nearly one third of the
measures adopted before 2016.
(44) Study carried out by Ernst and Young on the basis of the French government's impact assessment analysis.
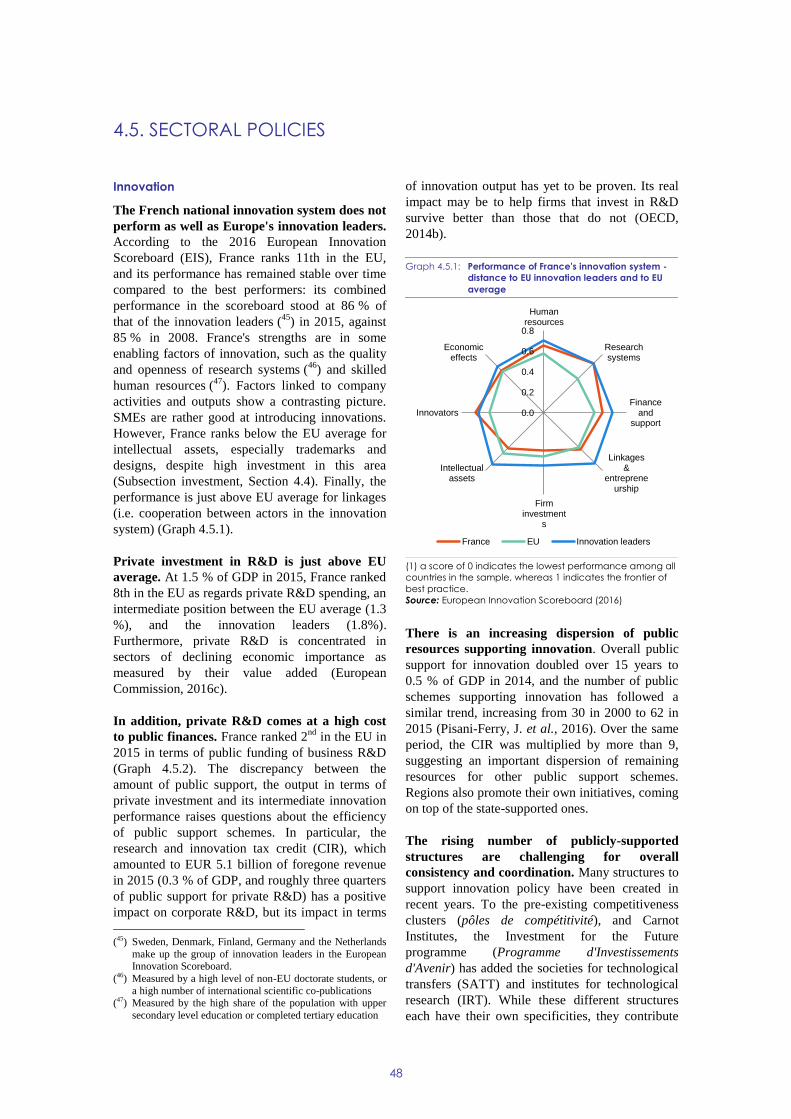
48
Innovation
The French national innovation system does not
perform as well as Europe's innovation leaders.
According to the 2016 European Innovation
Scoreboard (EIS), France ranks 11th in the EU,
and its performance has remained stable over time
compared to the best performers: its combined
performance in the scoreboard stood at 86 % of
that of the innovation leaders (45
) in 2015, against
85 % in 2008. France's strengths are in some
enabling factors of innovation, such as the quality
and openness of research systems (46
) and skilled
human resources (47
). Factors linked to company
activities and outputs show a contrasting picture.
SMEs are rather good at introducing innovations.
However, France ranks below the EU average for
intellectual assets, especially trademarks and
designs, despite high investment in this area
(Subsection investment, Section 4.4). Finally, the
performance is just above EU average for linkages
(i.e. cooperation between actors in the innovation
system) (Graph 4.5.1).
Private investment in R&D is just above EU
average. At 1.5 % of GDP in 2015, France ranked
8th in the EU as regards private R&D spending, an
intermediate position between the EU average (1.3
%), and the innovation leaders (1.8%).
Furthermore, private R&D is concentrated in
sectors of declining economic importance as
measured by their value added (European
Commission, 2016c).
In addition, private R&D comes at a high cost
to public finances. France ranked 2nd
in the EU in
2015 in terms of public funding of business R&D
(Graph 4.5.2). The discrepancy between the
amount of public support, the output in terms of
private investment and its intermediate innovation
performance raises questions about the efficiency
of public support schemes. In particular, the
research and innovation tax credit (CIR), which
amounted to EUR 5.1 billion of foregone revenue
in 2015 (0.3 % of GDP, and roughly three quarters
of public support for private R&D) has a positive
impact on corporate R&D, but its impact in terms
(45) Sweden, Denmark, Finland, Germany and the Netherlands
make up the group of innovation leaders in the European Innovation Scoreboard.
(46) Measured by a high level of non-EU doctorate students, or
a high number of international scientific co-publications (47) Measured by the high share of the population with upper
secondary level education or completed tertiary education
of innovation output has yet to be proven. Its real
impact may be to help firms that invest in R&D
survive better than those that do not (OECD,
2014b).
Graph 4.5.1: Performance of France's innovation system -
distance to EU innovation leaders and to EU
average
(1) a score of 0 indicates the lowest performance among all
countries in the sample, whereas 1 indicates the frontier of
best practice.
Source: European Innovation Scoreboard (2016)
There is an increasing dispersion of public
resources supporting innovation. Overall public
support for innovation doubled over 15 years to
0.5 % of GDP in 2014, and the number of public
schemes supporting innovation has followed a
similar trend, increasing from 30 in 2000 to 62 in
2015 (Pisani-Ferry, J. et al., 2016). Over the same
period, the CIR was multiplied by more than 9,
suggesting an important dispersion of remaining
resources for other public support schemes.
Regions also promote their own initiatives, coming
on top of the state-supported ones.
The rising number of publicly-supported
structures are challenging for overall
consistency and coordination. Many structures to
support innovation policy have been created in
recent years. To the pre-existing competitiveness
clusters (pôles de compétitivité), and Carnot
Institutes, the Investment for the Future
programme (Programme d'Investissements
d'Avenir) has added the societies for technological
transfers (SATT) and institutes for technological
research (IRT). While these different structures
each have their own specificities, they contribute
0.0
0.2
0.4
0.6
0.8
Humanresources
Researchsystems
Financeand
support
Linkages&
entrepreneurship
Firminvestment
s
Intellectualassets
Innovators
Economiceffects
France EU Innovation leaders
4.5. SECTORAL POLICIES
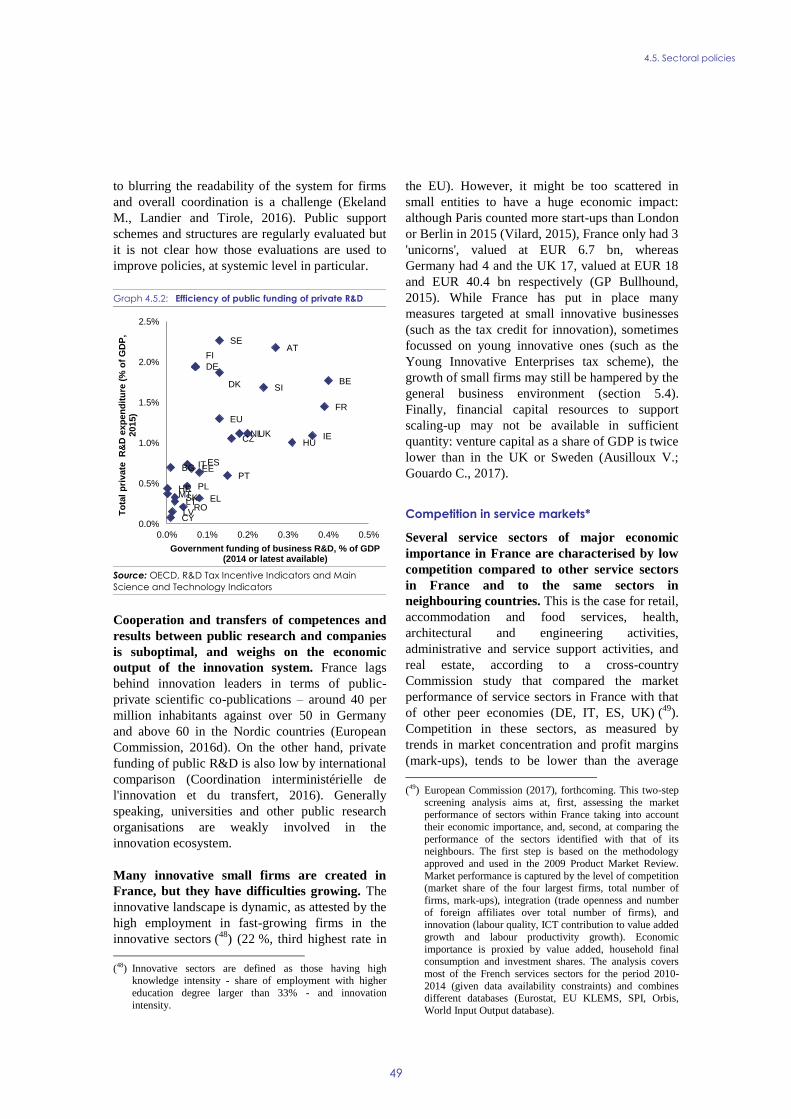
4.5. Sectoral policies
49
to blurring the readability of the system for firms
and overall coordination is a challenge (Ekeland
M., Landier and Tirole, 2016). Public support
schemes and structures are regularly evaluated but
it is not clear how those evaluations are used to
improve policies, at systemic level in particular.
Graph 4.5.2: Efficiency of public funding of private R&D
Source: OECD, R&D Tax Incentive Indicators and Main
Science and Technology Indicators
Cooperation and transfers of competences and
results between public research and companies
is suboptimal, and weighs on the economic
output of the innovation system. France lags
behind innovation leaders in terms of public-
private scientific co-publications – around 40 per
million inhabitants against over 50 in Germany
and above 60 in the Nordic countries (European
Commission, 2016d). On the other hand, private
funding of public R&D is also low by international
comparison (Coordination interministérielle de
l'innovation et du transfert, 2016). Generally
speaking, universities and other public research
organisations are weakly involved in the
innovation ecosystem.
Many innovative small firms are created in
France, but they have difficulties growing. The
innovative landscape is dynamic, as attested by the
high employment in fast-growing firms in the
innovative sectors (48
) (22 %, third highest rate in
(48) Innovative sectors are defined as those having high
knowledge intensity - share of employment with higher
education degree larger than 33% - and innovation
intensity.
the EU). However, it might be too scattered in
small entities to have a huge economic impact:
although Paris counted more start-ups than London
or Berlin in 2015 (Vilard, 2015), France only had 3
'unicorns', valued at EUR 6.7 bn, whereas
Germany had 4 and the UK 17, valued at EUR 18
and EUR 40.4 bn respectively (GP Bullhound,
2015). While France has put in place many
measures targeted at small innovative businesses
(such as the tax credit for innovation), sometimes
focussed on young innovative ones (such as the
Young Innovative Enterprises tax scheme), the
growth of small firms may still be hampered by the
general business environment (section 5.4).
Finally, financial capital resources to support
scaling-up may not be available in sufficient
quantity: venture capital as a share of GDP is twice
lower than in the UK or Sweden (Ausilloux V.;
Gouardo C., 2017).
Competition in service markets*
Several service sectors of major economic
importance in France are characterised by low
competition compared to other service sectors
in France and to the same sectors in
neighbouring countries. This is the case for retail,
accommodation and food services, health,
architectural and engineering activities,
administrative and service support activities, and
real estate, according to a cross-country
Commission study that compared the market
performance of service sectors in France with that
of other peer economies (DE, IT, ES, UK) (49
).
Competition in these sectors, as measured by
trends in market concentration and profit margins
(mark-ups), tends to be lower than the average
(49) European Commission (2017), forthcoming. This two-step
screening analysis aims at, first, assessing the market performance of sectors within France taking into account
their economic importance, and, second, at comparing the
performance of the sectors identified with that of its neighbours. The first step is based on the methodology
approved and used in the 2009 Product Market Review.
Market performance is captured by the level of competition (market share of the four largest firms, total number of
firms, mark-ups), integration (trade openness and number
of foreign affiliates over total number of firms), and innovation (labour quality, ICT contribution to value added
growth and labour productivity growth). Economic
importance is proxied by value added, household final consumption and investment shares. The analysis covers
most of the French services sectors for the period 2010-
2014 (given data availability constraints) and combines different databases (Eurostat, EU KLEMS, SPI, Orbis,
World Input Output database).
BE
FR
IEHU
AT
SI
UKNLCZ
PT
SE
DK
EL
ES
DE
FI
EEIT
PL
ROSKLT
LV
BG
CY
HRMT
EU
0.0%
0.5%
1.0%
1.5%
2.0%
2.5%
0.0% 0.1% 0.2% 0.3% 0.4% 0.5%
To
tal
pri
vate
R
&D
exp
en
dit
ure
(%
of
GD
P,
2015)
Government funding of business R&D, % of GDP (2014 or latest available)
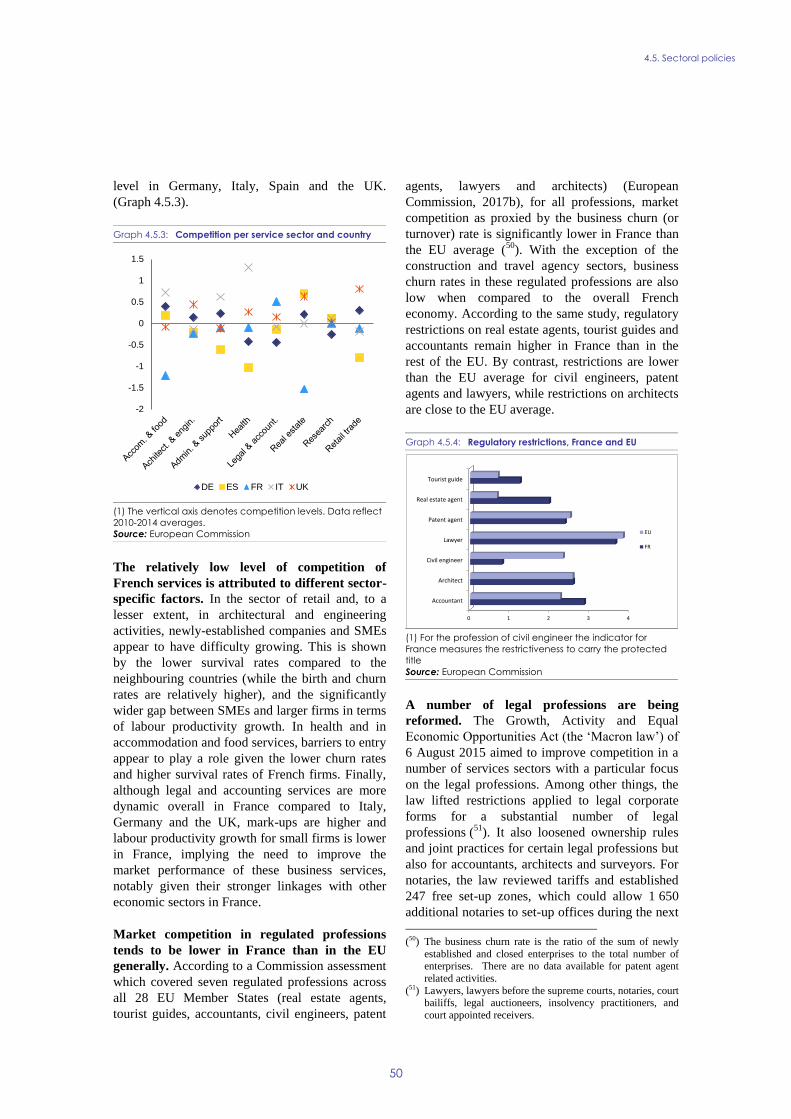
4.5. Sectoral policies
50
level in Germany, Italy, Spain and the UK.
(Graph 4.5.3).
Graph 4.5.3: Competition per service sector and country
(1) The vertical axis denotes competition levels. Data reflect
2010-2014 averages.
Source: European Commission
The relatively low level of competition of
French services is attributed to different sector-
specific factors. In the sector of retail and, to a
lesser extent, in architectural and engineering
activities, newly-established companies and SMEs
appear to have difficulty growing. This is shown
by the lower survival rates compared to the
neighbouring countries (while the birth and churn
rates are relatively higher), and the significantly
wider gap between SMEs and larger firms in terms
of labour productivity growth. In health and in
accommodation and food services, barriers to entry
appear to play a role given the lower churn rates
and higher survival rates of French firms. Finally,
although legal and accounting services are more
dynamic overall in France compared to Italy,
Germany and the UK, mark-ups are higher and
labour productivity growth for small firms is lower
in France, implying the need to improve the
market performance of these business services,
notably given their stronger linkages with other
economic sectors in France.
Market competition in regulated professions
tends to be lower in France than in the EU
generally. According to a Commission assessment
which covered seven regulated professions across
all 28 EU Member States (real estate agents,
tourist guides, accountants, civil engineers, patent
agents, lawyers and architects) (European
Commission, 2017b), for all professions, market
competition as proxied by the business churn (or
turnover) rate is significantly lower in France than
the EU average (50
). With the exception of the
construction and travel agency sectors, business
churn rates in these regulated professions are also
low when compared to the overall French
economy. According to the same study, regulatory
restrictions on real estate agents, tourist guides and
accountants remain higher in France than in the
rest of the EU. By contrast, restrictions are lower
than the EU average for civil engineers, patent
agents and lawyers, while restrictions on architects
are close to the EU average.
Graph 4.5.4: Regulatory restrictions, France and EU
(1) For the profession of civil engineer the indicator for
France measures the restrictiveness to carry the protected
title
Source: European Commission
A number of legal professions are being
reformed. The Growth, Activity and Equal
Economic Opportunities Act (the ‘Macron law’) of
6 August 2015 aimed to improve competition in a
number of services sectors with a particular focus
on the legal professions. Among other things, the
law lifted restrictions applied to legal corporate
forms for a substantial number of legal
professions (51
). It also loosened ownership rules
and joint practices for certain legal professions but
also for accountants, architects and surveyors. For
notaries, the law reviewed tariffs and established
247 free set-up zones, which could allow 1 650
additional notaries to set-up offices during the next
(50) The business churn rate is the ratio of the sum of newly
established and closed enterprises to the total number of enterprises. There are no data available for patent agent
related activities.
(51) Lawyers, lawyers before the supreme courts, notaries, court bailiffs, legal auctioneers, insolvency practitioners, and
court appointed receivers.
-2
-1.5
-1
-0.5
0
0.5
1
1.5
DE ES FR IT UK
0 1 2 3 4
Accountant
Architect
Civil engineer
Lawyer
Patent agent
Real estate agent
Tourist guide
EU
FR
4.5. Sectoral policies
51
two years, although a decree adopted in November
2016 allowed established notaries operating in
professional civil partnerships from now on to
open several offices. (52
) Some of the 1 650
openings may be therefore occupied by existing
notaries.
Access to professions and services in the
healthcare sector is not optimal. While the
Healthcare Act of 26 January 2016 (Loi Santé)
allowed inter alia for an extension of the remit of
certain professions that are restricted by law (such
as midwives, and medical and dental assistants), it
created or extended reserved activities for others
(such as orthoptists and opticians). The overall
impact of the law on health professions is therefore
to be seen. The regulatory framework for home-
care services was also reformed through the law of
28 December 2015 on the ageing society.
However, the role of local authorities will be
crucial to ensuring full implementation of the new
common regime in order to prevent any
discrimination between existing and newly
authorised providers. Meanwhile, the quota on
medical students (the so-called numerus clausus)
has been increased by 11 % for 2017, with 478
additional places, 131 of them targeting regions
where there are fewer doctors.
A number of passenger transport services are
currently being reformed. The Macron law
established a regulator for all land transport
(ARAFER) and opened intercity domestic coach
services to competition, which, combined with car-
sharing services, has increased the range of long-
distance transport services in France. According to
ARAFER, as of 30 September 2016, 2050 direct
jobs had been created and about 5.3 million
passengers had been transported since the opening
of the market in August 2015 (53
). There are about
1 310 commercial routes serving 208 French towns
outside of a public initiative. The new Public
Service Obligation Regulation under the fourth
European railway package is expected to increase
competition in the domestic rail passenger market
and improve the quality of services. The
government and the association of French regions
are considering setting up a legal framework (loi
d'expérimentation) to allow regional authorities to
(52) Decree 2016-1509 of 9 November 2016.
(53) ARAFER, Analyse du marché libéralisé des services interurbains par autocar, Bilan du 3e trimestre 2016
award public service contracts on a competitive
basis for certain regional lines or sub-networks as
from 2019. On the other hand, there is no
indication that France plans to review the legal
monopoly of the SNCF for regional passenger rail
transport before the end of the transition period in
2023.
The taxi and private hire vehicle sectors are still
characterised by restrictions. Only a small
number of new licences for taxis are issued every
about 10 years, while the private hire vehicle
sector, which pertains to the market of pre-booked
rides, has grown rapidly since the relaxation of
market entry rules in 2009. Nevertheless,
following the adoption of sectorial legislation over
the last three years, the operation of private hire
vehicles is still subject to restrictions, such as the
obligation to return to business premises after each
ride unless the next ride is already booked. Among
other things and in addition to the Thévenoud law
of 2014 (54
), a law affecting taxis and private hire
vehicles was adopted on 29 December 2016 (55
). It
includes a revision of certain provisions applicable
to these two sectors that aims to make the use of
digital platforms more widespread, as well as some
modifications concerning the provision of
transport services. While the impact of the law will
also depend on its implementation, it imposes
some requirements which may limit the provision
of reservation intermediation and transport
services.
France is engaged in establishing the regulatory
framework for collaborative economy activities
introducing new requirements for collaborative
platforms and related service providers. French
consumers are particularly keen to use
collaborative economy services. (56
) These
activities may have a significant potential for
growth and innovation.(57
) France is a leader as
regards start-up creation with more than 50
collaborative economy organisations currently
(54) Loi n° 2014-1104 du 1er octobre 2014 relative aux taxis et
aux voitures de transport avec chauffeur. (55) Loi relative à la régulation, à la responsabilisation et à la
simplification dans le secteur du transport public particulier
de personnes (Loi Grandguillaume). 56) Eurobarometer 2016.
(57) Together with the US, France is one of the world leaders,
in terms of size and variety of collaborative economy activities (Pipame, 2015, p. 16).
4.5. Sectoral policies
52
founded in France (58
).At the same time, France is
engaged in establishing a specific regulatory
framework for collaborative platforms and related
service providers. (59
) The rules proposed often
increase the obligations and liability of
collaborative economy actors, in particular
collaborative platforms, with regard to the services
offered by related providers.
Energy policy
Energy sector reforms have aimed to liberalise
wholesale and retail markets. By progressively
phasing out regulated prices for final consumers,
France can help decrease market concentration,
encourage competition in the energy sector and
provide incentives to private consumers in terms of
energy efficiency. In recent years, France has
progressively phased out regulated prices for large
commercial customers. Gas prices increased by
4 % and stood 2 % above the EU average in 2015.
Electricity wholesale prices in France remain well
below the EU average thanks to the low marginal
costs of nuclear power generation (4 % below the
EU average in 2015), although since 2008 this
price differential has narrowed substantially. These
prices remain higher than in Germany (by 22% in
2015). Meanwhile, real unit energy costs have
increased and are higher in France than in the EU,
reflecting not only the French industry mix and the
increase in real energy prices observed over the
past 10 years but also the slow improvements in
energy intensity in the manufacturing sector.
Undertaking new investments in generation on a
pure market basis is a challenge in the current
investment climate of low wholesale electricity
prices and energy demand.
(58) Pricewaterhouse Coopers for the European Commission
(2016), p. 8. (59) The 2016 budget law and the related rectifying law
imposed information requirements on intermediary
platforms vis-à-vis services providers concerning their social and fiscal obligations, and vis-à-vis the fiscal
administration concerning the amount of revenues paid to
the service providers; the ‘El-Khomri’ law provided for certain rights for platform workers, for instance regarding
work accidents; the "loi Lemaire" regulated specific
aspects of the collaborative economy, in particular in the accommodation sector; the 2017 draft law on financing of
social welfare obliged persons who are active in short-term
rental activities to declare themselves as self-employed and
hence pay social security contributions once they reach an
annual turnover threshold. These measures add to the
reform of taxis and vehicles with drivers.
France is making efforts to develop a more
integrated framework for addressing the 2020
climate and energy targets and other longer-
term objectives. The renewable energy share in
2014 (14.3 %) is in line with the interim trajectory
of 14.1% for 2013/2014, but well below the 2014
target of 16 % set by the French National
Renewable Energy Plan Regarding energy
efficiency, the regulatory and tax measures
adopted in 2014 have not yet showed results.
Energy intensity in the transport, industry and
buildings sectors in France is below the EU
average and has been decreasing (-0.7 %/year)
over the last 10 years, although it remains above
the levels of Germany, Italy and the UK. However,
France would need to reduce its primary and final
energy consumption further to reach its ambitious
indicative national 2020 targets. Moreover,
following the adoption of the Energy Transition
Act on 17 August 2015, additional measures would
allow for more energy savings (e.g. in buildings)
and support investment in renewable energy in
France partly with a view to the objective of
reducing nuclear electricity's share to 50 % by
2025. As regards greenhouse gas emissions,
France shows good results in terms of emission
reductions in power generation, but results have
not yet materialised in agriculture, which
represents the second largest source of emissions,
but also in industry and transport.
Regional cooperation and interconnections have
improved. Overall, France is well interconnected
with its neighbours. At 10.4 % in 2015, the
interconnection capacity for electricity stands
above the Energy Union 2020 target (10 %). In
gas, output capacity has doubled and entry
capacity has increased by 50 % in the last 10 years.
The upcoming liquefied natural gas terminal in
Dunkirk will also improve gas interconnection
with Belgium.
4.5. Sectoral policies
53
Box 4.5.1: Indebtedness of the State-owned network industries and implications for
investment
The reported net debts of some State-owned energy companies and of the railway network operator
are reaching high levels (1). The net debt of the railway infrastructure manager (SNCF Réseau) rose to
EUR 39 billion by the end of 2015, more than doubling since the first railway reform in France in 1997, due
mainly to significant investment in high-speed lines and maintenance, and to operational inefficiencies. At
EUR 37 billion, the net debt of the French electric utility company EdF has also increased by a factor of 2.3
since 2007, in particular to support strong cross-border expansion of the company’s activity, but also to
support an ambitious investment programme and a sustained dividend policy. The net debt of AREVA, the
French nuclear energy company, was EUR 6.3 billion at the end of 2015.
This indebtedness comes at a time of challenging market developments and greater need for
productive investment. The average age of the railway network is about 32 years in France against 17 in
Germany. The speed limit had to be reduced in 2015 for 600 km of railways due to safety reasons, bringing
the total distance of the network subject to speed limits due to ageing to 4 000 km. EdF is confronted with
structural changes in electricity markets, especially with a sharp fall in wholesale electricity prices in the
past 5 years in Europe. AREVA is facing a market downturn following the Fukushima nuclear accident and
a series of investment decisions with negative legal and economic implications. Coupled with the
companies’ high indebtedness, these adverse market developments accentuate the constraints on investment
in maintenance and growth.
The financial situation of these state-owned companies represents a challenge for financing the
necessary investments. EdF is expected to invest about EUR 10-15 billion per year for the next 10 years
mostly across the EU to maintain, modernise and develop the company’s productive assets. In the case of
the SNCF Réseau, investment needs are projected at EUR 4-5 billion per year over the same period and
broadly involve projects to renovate and expand the existing railway network. Investment in AREVA’s new
core business on nuclear fuel cycle has fallen from an annual average of EUR 1.3 billion in the period 2012-
2014 to EUR 0.6 billion in 2015, reflecting the company’s ongoing restructuring. Investment is expected to
remain broadly at current levels for 2017-2020. Without healthy balance sheets these investment needs will
not be met or will face delays with consequences for other sectors of the economy.
The French State is responding with a mix of capital increases and structural reforms, but the plans
are subject to uncertainties and delays. The key measures of the 2014 railway sector reform, in particular,
to manage SNCF Réseau's indebtedness are being finalised. The multi-annual performance contract with the
State was approved on 20 December 2016 by its Board of Directors, while ARAFER, the French transport
regulator issued its opinion on the implementing decree for the investment prudential rule on 7 December
2016. The State’s contribution to strengthening EdF will involve subscribing up to EUR 3 billion in a EUR 4
billion capital increase decided by EdF and the agreement to receive dividends for the fiscal years 2016 and
2017 in shares. Pushed by an unsustainable balance sheet and increasing global competition, AREVA has
started a complete restructuring of its activities. The restructuring plan, formally investigated and cleared by
the Commission under EU State aid rules, is a complex financing and industrial operation. Among other
things, it aims at refocusing the company’s core business on the nuclear fuel cycle by transferring these
activities to the New AREVA Holding (NewCo).
(1) The net debt (or net financial debt) corresponds to the liabilities and debts of a company minus its cash and other
similar liquid assets.
54
2016 Country-specific recommendations (CSRs)
CSR 1: Ensure a durable correction of the excessive
deficit by 2017 by taking the required structural
measures and by using all windfall gains for deficit
and debt reduction. Specify the expenditure cuts
planned for the coming years and step up efforts to
increase the amount of savings generated by the
spending reviews, including on local government
spending, by the end of 2016. Reinforce independent
public policy evaluations in order to identify
efficiency gains across all sub-sectors of general
government.
Ensure a durable correction of the excessive
deficit by 2017 by taking the required structural
measures and by using all windfall gains for
deficit and debt reduction. Specify the
expenditure cuts planned for the coming years
and step up efforts to increase the amount of
savings generated by the spending reviews,
including on local government spending, by the
end of 2016.
Reinforce independent public policy evaluations
in order to identify efficiency gains across all sub-
sectors of general government.
France has made limited progress in
addressing CSR 1 (this overall assessment of
CSR 1 does not include an assessment of
compliance with the Stability and Growth
Pact):
The compliance assessment with the
Stability and Growth Pact will be included
in spring when final data for 2016 will be
available.
Limited progress has been made in
reinforcing the identification of savings
and efficiency gains generated by the
spending reviews and public policy
evaluations. The savings made following
(60) The following categories are used to assess progress in implementing the 2016 country-specific recommendations: No progress: The Member State has not credibly announced or adopted any measure to address the CSR. Below a number of non-
exhaustive typical situations that could be covered under this, to be interpreted on a case by case basis taking into account
country-specific conditions:
• no legal, administrative, or budgetary measure has been announced in the National Reform Programme or in other official
communication to the national Parliament / relevant parliamentary committees, the European Commission, or announced in
public (e.g. in a press statement, information on government's website); • no non-legislative act has been presented by the governing or legislator body;
• the Member State has taken initial steps in addressing the CSR, such as commissioning a study or setting up a study group to
analyse possible measures that would need to be taken (unless the CSR explicitly asks for orientations or exploratory actions), while clearly-specified measure(s) to address the CSR has not been proposed.
Limited progress: The Member State has:
• announced certain measures but these only address the CSR to a limited extent; and/or
• presented legislative acts in the governing or legislator body but these have not been adopted yet and substantial non-legislative
further work is needed before the CSR will be implemented; • presented non-legislative acts, yet with no further follow-up in terms of implementation which is needed to address the CSR.
Some progress: The Member State has adopted measures that partly address the CSR;
and/or the Member State has adopted measures that address the CSR, but a fair amount of work is still needed to fully address the CSR as
only a few of the adopted measures have been implemented. For instance: adopted by national parliament; by ministerial
decision; but no implementing decisions are in place. Substantial progress: The Member State has adopted measures that go a long way in addressing the CSR and most of which have
been implemented.
Full implementation: The Member State has implemented all measures needed to address the CSR appropriately.
ANNEX A
Overview Table
Commitments Summary assessment (60
)
A. Overview Table
55
the spending reviews in the PLF 2017 total
EUR 400 million, which is a small
amount given the structural efforts
required. Also, the second wave of
spending reviews has not resulted in any
proposed savings. A number of further
public policy evaluations were launched
and a meta-evaluation is ongoing.
CSR 2: Ensure that the labour cost reductions are
sustained and that minimum wage developments are
consistent with job creation and competitiveness.
Reform the labour law to provide more incentives for
employers to hire on open-ended contracts.
Ensure that the labour cost reductions are
sustained
and that minimum wage developments are
consistent with job creation and competitiveness.
Reform the labour law to provide more incentives
for employers to hire on open-ended contracts.
France has made substantial progress in
addressing CSR 2:
Substantial progress has been made in
ensuring that labour cost reductions are
sustained. The second phase of reductions
in employers’ social security contributions
planned under the solidarity and
responsibility pact started in April 2016,
after the first phase introduced in 2015. In
addition, the government has increased the
tax credit for competitiveness and
employment (CICE) from 6 % to 7 %. The
2016 national reform programme
announced that the CICE would be
transformed into permanent reductions in
employers’ social security contributions by
2018, but no details are available at the
moment.
Some progress has been made in ensuring
that changes in the minimum wage are
consistent with job creation and
competitiveness. The minimum wage
followed its indexation rule, leading to a
0.6 % increase on 1 January 2016. No
intent to review the indexation mechanism
has been expressed by the government.
Substantial progress has been made in
reforming the labour law. The El Khomri
law on labour, social dialogue and
professional pathways was adopted in July
2016. However, its final effect will depend
on its full implementation and on social
partners taking ownership of the flexibility
the law offers. The reform of Labour
A. Overview Table
56
Courts introduced by the 2015 Macron law
was completed with the adoption, in
November 2016, of a decree reviewing the
indicative ceilings for unjustified
individual dismissals.
CSR 3: Improve the links between the education
sector and the labour market, in particular by
reforming apprenticeships and vocational training,
with emphasis on the low-skilled. By the end of
2016, take action to reform the unemployment
benefit system in order to bring the system back to
budgetary sustainability and to provide more
incentives to return to work.
Improve the links between the education sector
and the labour market, in particular by reforming
apprenticeships and vocational training, with
emphasis on the low-skilled.
By the end of 2016, take action to reform the
unemployment benefit system in order to bring
the system back to budgetary sustainability and to
provide more incentives to return to work.
France has made limited progress in
addressing CSR 3:
Some progress has been made in
improving the links between the education
sector and the labour market. The
implementation of the 2014 vocational
training reform is ongoing.
Apprenticeship figures stopped decreasing
in 2015. The El Khomri labour law
introduces a new personal activity account
(CPA), entering into force in January 2017.
It mostly reinforces training rights for non-
qualified active workers.
No progress has been made in reforming
the unemployment benefit system. Social
partners failed to agree on a new
unemployment benefit convention in July,
leading to an extension of the current 2014
convention. The timeline for adopting a
reform of the unemployment benefit
system is not clear yet.
CSR 4: Remove barriers to activity in the services
sector, in particular in business services and regulated
professions. Take steps to simplify and improve the
efficiency of innovation policy schemes. By the end
of 2016, further reform the size-related criteria in
regulations that impede companies’ growth and
continue to simplify companies’ administrative, fiscal
and accounting rules by pursuing the simplification
programme.
Remove barriers to activity in the services sector,
in particular in business services and regulated
France has made some progress in
addressing CSR 4:
Some progress has been made regarding
the removal of barriers to activity in the
regulated professions through sectoral
A. Overview Table
57
professions.
Take steps to simplify and improve the efficiency
of innovation policy schemes.
By the end of 2016, further reform the size-
related criteria in regulations that impede
companies' growth
and continue to simplify companies'
administrative, fiscal and accounting rules by
pursuing the simplification programme.
legislation, notably the Loi Macron and the
Loi Santé. France has adopted almost all
the secondary legislation needed to
implement provisions on liberalisation of
professions that were not directly
applicable. In other fields where reforms
of the service sector were adopted in 2015
(e.g. home-care services), the legal
framework was completed in 2016 and
awaits implementation by local authorities.
However, the ambition of measures to
increase competition in regulated
professions is lower than initially
announced, mainly because of the
implementation measures (for instance, as
regards notaries). Some steps have also
been taken to introduce competition in
regional rail transport services for
passengers on an experimental basis.
Limited progress has been made to
simplify and improve the efficiency of
innovation policy schemes. While no
recent measures have been adopted in this
area, clear action to systematically
evaluate innovation policy has been
promoted in recent year(s), in particular by
the National Commission for the
Evaluation of Innovation Policies together
with France Stratégie. These efforts
include the evaluation of individual
schemes (e.g. the CIR), and of the
efficiency of the innovation policy as a
whole. How these evaluations will be
translated into policy practice is still to be
seen.
No progress to reform the size-related
criteria in social and tax legislation has
been made, as no new measures have been
adopted in this area since the end of 2015.
Some progress has been made to simplify
companies’ administrative, fiscal and
accounting rules. The simplification
programme is ongoing and encompasses
A. Overview Table
58
new measures, but its implementation is
slow. The ‘Sapin II law’ makes it easier
for certain small companies to switch legal
status, while it facilitates business creation
by easing training requirements prior to
starting a business and by removing the
requirement for micro-entrepreneurs to
open a second bank account at least during
the first year of business.
CSR 5: Take action to reduce the taxes on production
and the corporate income statutory rate while
broadening the tax base on consumption, in particular
as regards VAT. Remove inefficient tax
expenditures, remove taxes that are yielding little or
no revenue and adopt the withholding personal
income tax reform by the end of 2016.
Take action to reduce the taxes on production and
the corporate income statutory rate while
broadening the tax base on consumption, in
particular as regards VAT.
Remove inefficient tax expenditures, remove
taxes that are yielding little or no revenue and
adopt the withholding personal income tax reform
by the end of 2016.
France has made limited progress in
addressing CSR 5:
Limited progress has been made in
reducing taxes on production and the
corporate income. The last tranche of the
turnover tax (C3S) has not been abolished
and still weighs on 20 000 businesses. The
statutory rate of corporate income tax will
only be reduced to 28 % in 2017 for SMEs
up to EUR 75 000 of profits. The objective
of setting this rate at 28 % across the board
by 2020 still stands. No progress on
broadening the tax base on consumption,
as the 2017 finance law does not remove
or limit the use of reduced rates on VAT.
Some progress has been made in
modernising the tax system. The
withholding tax reform for personal
income tax has been adopted by
Parliament and will be introduced by 2018.
However, tax expenditures keep increasing
in number and in value and have exceeded
the ceiling set in the 2014-2019
multiannual budgetary framework. In
2017, 14 new tax expenditures will be
introduced while only 4 are to be
suppressed and 5 come to an end. The
removal of taxes yielding little or no
revenue is progressing at a very slow pace.
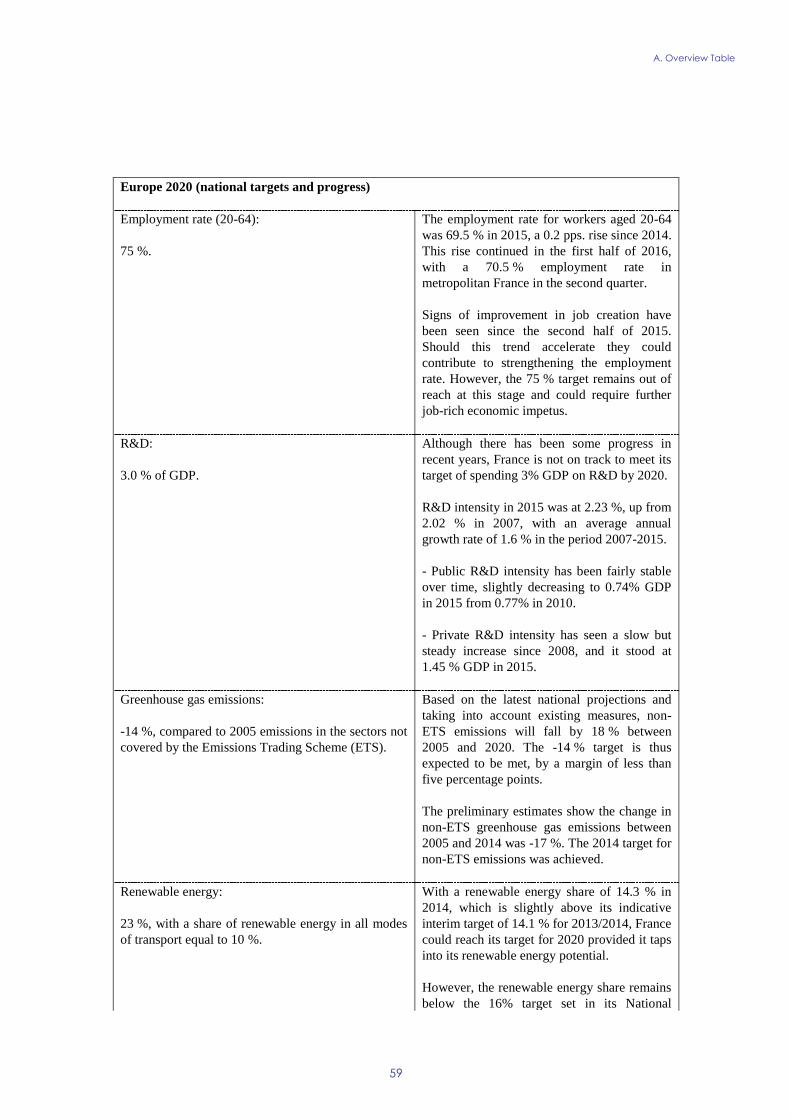
A. Overview Table
59
Europe 2020 (national targets and progress)
Employment rate (20-64):
75 %.
The employment rate for workers aged 20-64
was 69.5 % in 2015, a 0.2 pps. rise since 2014.
This rise continued in the first half of 2016,
with a 70.5 % employment rate in
metropolitan France in the second quarter.
Signs of improvement in job creation have
been seen since the second half of 2015.
Should this trend accelerate they could
contribute to strengthening the employment
rate. However, the 75 % target remains out of
reach at this stage and could require further
job-rich economic impetus.
R&D:
3.0 % of GDP.
Although there has been some progress in
recent years, France is not on track to meet its
target of spending 3% GDP on R&D by 2020.
R&D intensity in 2015 was at 2.23 %, up from
2.02 % in 2007, with an average annual
growth rate of 1.6 % in the period 2007-2015.
- Public R&D intensity has been fairly stable
over time, slightly decreasing to 0.74% GDP
in 2015 from 0.77% in 2010.
- Private R&D intensity has seen a slow but
steady increase since 2008, and it stood at
1.45 % GDP in 2015.
Greenhouse gas emissions:
-14 %, compared to 2005 emissions in the sectors not
covered by the Emissions Trading Scheme (ETS).
Based on the latest national projections and
taking into account existing measures, non-
ETS emissions will fall by 18 % between
2005 and 2020. The -14 % target is thus
expected to be met, by a margin of less than
five percentage points.
The preliminary estimates show the change in
non-ETS greenhouse gas emissions between
2005 and 2014 was -17 %. The 2014 target for
non-ETS emissions was achieved.
Renewable energy:
23 %, with a share of renewable energy in all modes
of transport equal to 10 %.
With a renewable energy share of 14.3 % in
2014, which is slightly above its indicative
interim target of 14.1 % for 2013/2014, France
could reach its target for 2020 provided it taps
into its renewable energy potential.
However, the renewable energy share remains
below the 16% target set in its National
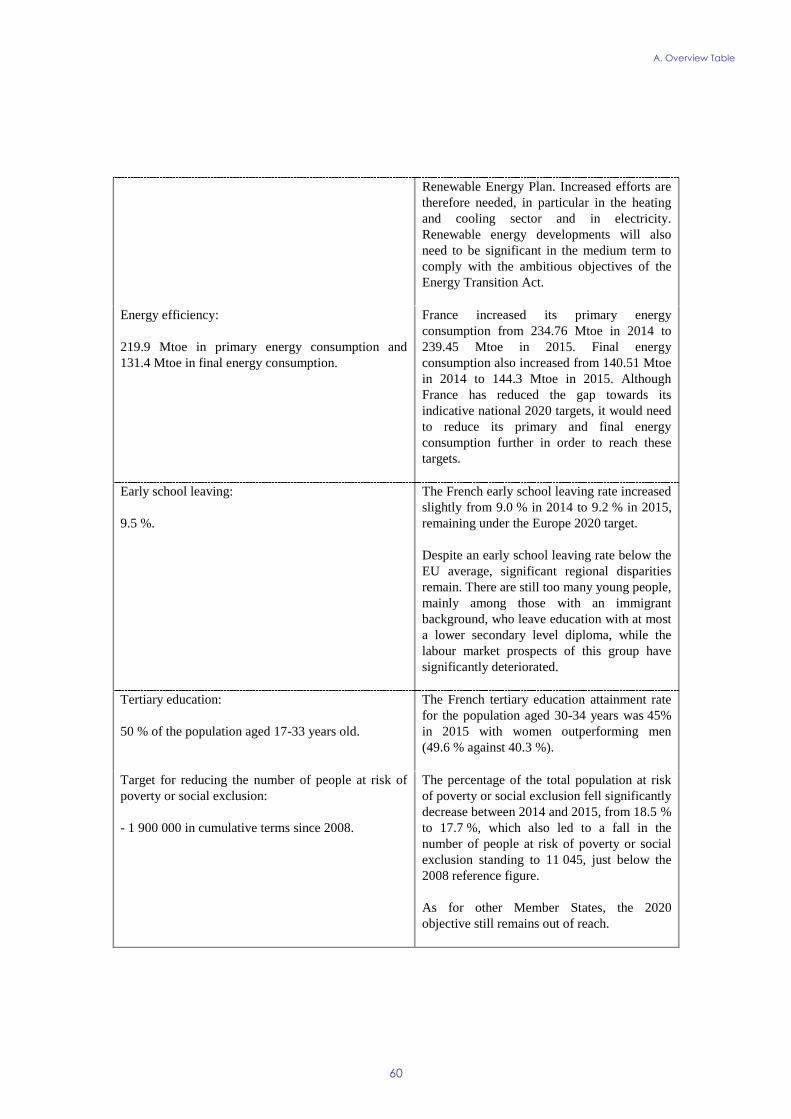
A. Overview Table
60
Renewable Energy Plan. Increased efforts are
therefore needed, in particular in the heating
and cooling sector and in electricity.
Renewable energy developments will also
need to be significant in the medium term to
comply with the ambitious objectives of the
Energy Transition Act.
Energy efficiency:
219.9 Mtoe in primary energy consumption and
131.4 Mtoe in final energy consumption.
France increased its primary energy
consumption from 234.76 Mtoe in 2014 to
239.45 Mtoe in 2015. Final energy
consumption also increased from 140.51 Mtoe
in 2014 to 144.3 Mtoe in 2015. Although
France has reduced the gap towards its
indicative national 2020 targets, it would need
to reduce its primary and final energy
consumption further in order to reach these
targets.
Early school leaving:
9.5 %.
The French early school leaving rate increased
slightly from 9.0 % in 2014 to 9.2 % in 2015,
remaining under the Europe 2020 target.
Despite an early school leaving rate below the
EU average, significant regional disparities
remain. There are still too many young people,
mainly among those with an immigrant
background, who leave education with at most
a lower secondary level diploma, while the
labour market prospects of this group have
significantly deteriorated.
Tertiary education:
50 % of the population aged 17-33 years old.
The French tertiary education attainment rate
for the population aged 30-34 years was 45%
in 2015 with women outperforming men
(49.6 % against 40.3 %).
Target for reducing the number of people at risk of
poverty or social exclusion:
- 1 900 000 in cumulative terms since 2008.
The percentage of the total population at risk
of poverty or social exclusion fell significantly
decrease between 2014 and 2015, from 18.5 %
to 17.7 %, which also led to a fall in the
number of people at risk of poverty or social
exclusion standing to 11 045, just below the
2008 reference figure.
As for other Member States, the 2020
objective still remains out of reach.
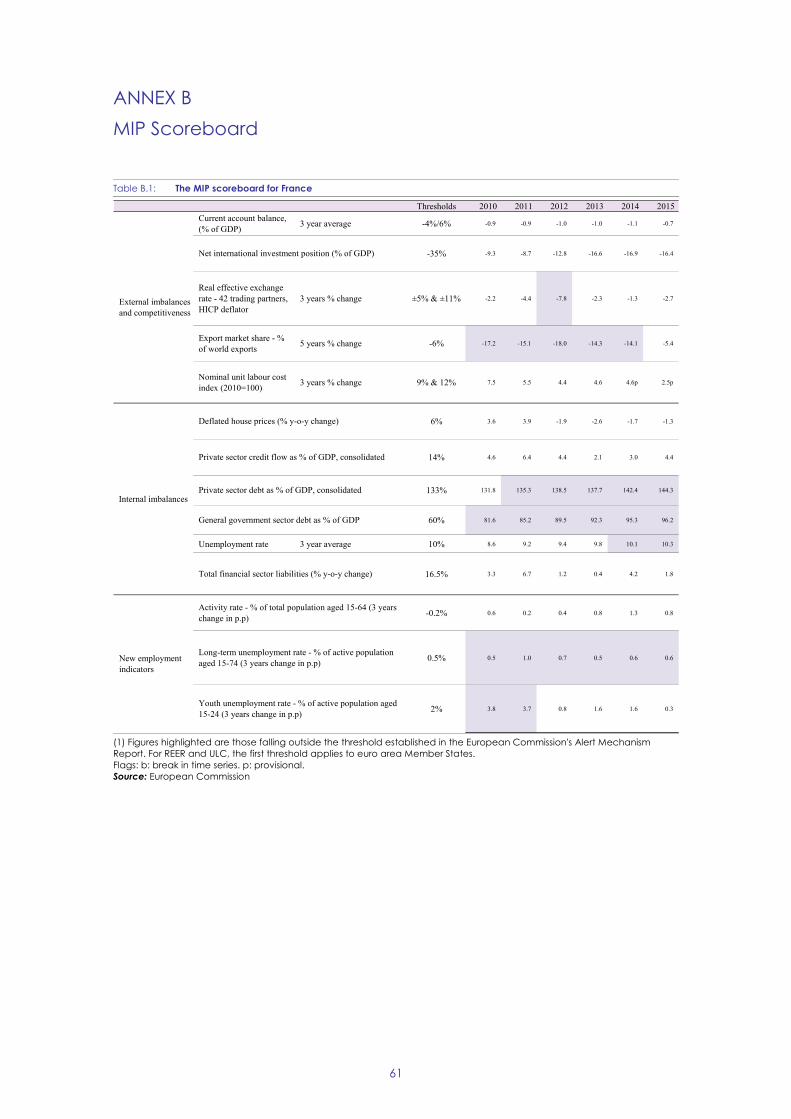
61
ANNEX B
MIP Scoreboard
Table B.1: The MIP scoreboard for France
(1) Figures highlighted are those falling outside the threshold established in the European Commission's Alert Mechanism
Report. For REER and ULC, the first threshold applies to euro area Member States.
Flags: b: break in time series. p: provisional.
Source: European Commission
Thresholds 2010 2011 2012 2013 2014 2015
Current account balance,
(% of GDP) 3 year average -4%/6% -0.9 -0.9 -1.0 -1.0 -1.1 -0.7
-35% -9.3 -8.7 -12.8 -16.6 -16.9 -16.4
Real effective exchange
rate - 42 trading partners,
HICP deflator
3 years % change ±5% & ±11% -2.2 -4.4 -7.8 -2.3 -1.3 -2.7
Export market share - %
of world exports5 years % change -6% -17.2 -15.1 -18.0 -14.3 -14.1 -5.4
Nominal unit labour cost
index (2010=100)3 years % change 9% & 12% 7.5 5.5 4.4 4.6 4.6p 2.5p
6% 3.6 3.9 -1.9 -2.6 -1.7 -1.3
14% 4.6 6.4 4.4 2.1 3.0 4.4
133% 131.8 135.3 138.5 137.7 142.4 144.3
60% 81.6 85.2 89.5 92.3 95.3 96.2
Unemployment rate 3 year average 10% 8.6 9.2 9.4 9.8 10.1 10.3
16.5% 3.3 6.7 1.2 0.4 4.2 1.8
-0.2% 0.6 0.2 0.4 0.8 1.3 0.8
0.5% 0.5 1.0 0.7 0.5 0.6 0.6
2% 3.8 3.7 0.8 1.6 1.6 0.3
External imbalances
and competitiveness
Net international investment position (% of GDP)
Internal imbalances
Deflated house prices (% y-o-y change)
Private sector credit flow as % of GDP, consolidated
Private sector debt as % of GDP, consolidated
General government sector debt as % of GDP
Total financial sector liabilities (% y-o-y change)
New employment
indicators
Activity rate - % of total population aged 15-64 (3 years
change in p.p)
Long-term unemployment rate - % of active population
aged 15-74 (3 years change in p.p)
Youth unemployment rate - % of active population aged
15-24 (3 years change in p.p)
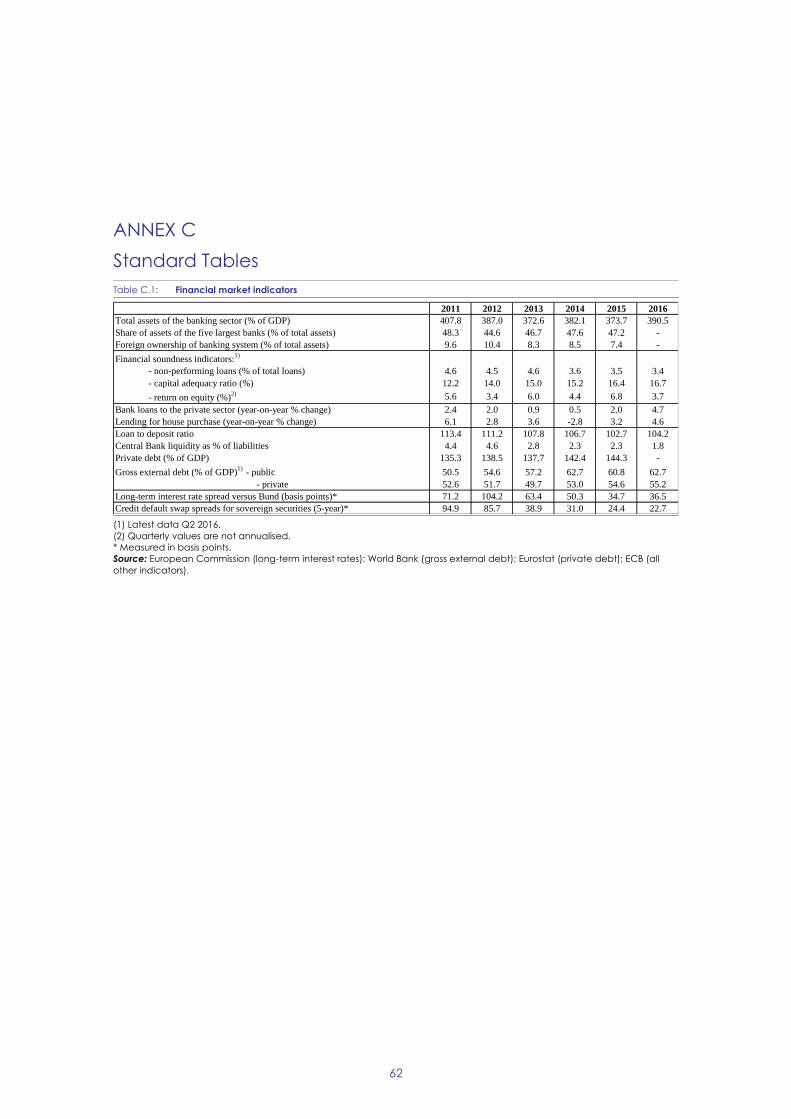
62
ANNEX C
Standard Tables
Table C.1: Financial market indicators
(1) Latest data Q2 2016.
(2) Quarterly values are not annualised.
* Measured in basis points.
Source: European Commission (long-term interest rates); World Bank (gross external debt); Eurostat (private debt); ECB (all
other indicators).
2011 2012 2013 2014 2015 2016
Total assets of the banking sector (% of GDP) 407.8 387.0 372.6 382.1 373.7 390.5
Share of assets of the five largest banks (% of total assets) 48.3 44.6 46.7 47.6 47.2 -
Foreign ownership of banking system (% of total assets) 9.6 10.4 8.3 8.5 7.4 -
Financial soundness indicators:1)
- non-performing loans (% of total loans) 4.6 4.5 4.6 3.6 3.5 3.4
- capital adequacy ratio (%) 12.2 14.0 15.0 15.2 16.4 16.7
- return on equity (%)2) 5.6 3.4 6.0 4.4 6.8 3.7
Bank loans to the private sector (year-on-year % change) 2.4 2.0 0.9 0.5 2.0 4.7
Lending for house purchase (year-on-year % change) 6.1 2.8 3.6 -2.8 3.2 4.6
Loan to deposit ratio 113.4 111.2 107.8 106.7 102.7 104.2
Central Bank liquidity as % of liabilities 4.4 4.6 2.8 2.3 2.3 1.8
Private debt (% of GDP) 135.3 138.5 137.7 142.4 144.3 -
Gross external debt (% of GDP)1)
- public 50.5 54.6 57.2 62.7 60.8 62.7
- private 52.6 51.7 49.7 53.0 54.6 55.2
Long-term interest rate spread versus Bund (basis points)* 71.2 104.2 63.4 50.3 34.7 36.5
Credit default swap spreads for sovereign securities (5-year)* 94.9 85.7 38.9 31.0 24.4 22.7
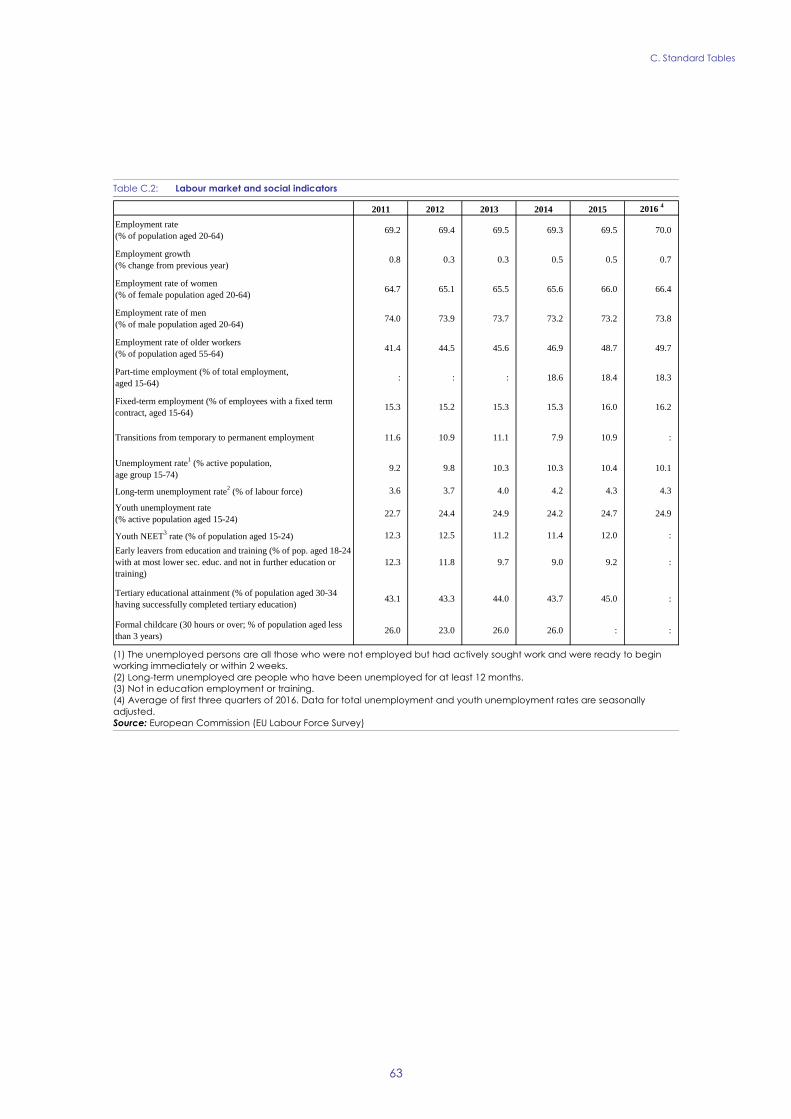
C. Standard Tables
63
Table C.2: Labour market and social indicators
(1) The unemployed persons are all those who were not employed but had actively sought work and were ready to begin
working immediately or within 2 weeks.
(2) Long-term unemployed are people who have been unemployed for at least 12 months.
(3) Not in education employment or training.
(4) Average of first three quarters of 2016. Data for total unemployment and youth unemployment rates are seasonally
adjusted.
Source: European Commission (EU Labour Force Survey)
2011 2012 2013 2014 2015 2016 4
Employment rate
(% of population aged 20-64)69.2 69.4 69.5 69.3 69.5 70.0
Employment growth
(% change from previous year)0.8 0.3 0.3 0.5 0.5 0.7
Employment rate of women
(% of female population aged 20-64)64.7 65.1 65.5 65.6 66.0 66.4
Employment rate of men
(% of male population aged 20-64)74.0 73.9 73.7 73.2 73.2 73.8
Employment rate of older workers
(% of population aged 55-64)41.4 44.5 45.6 46.9 48.7 49.7
Part-time employment (% of total employment,
aged 15-64): : : 18.6 18.4 18.3
Fixed-term employment (% of employees with a fixed term
contract, aged 15-64)15.3 15.2 15.3 15.3 16.0 16.2
Transitions from temporary to permanent employment 11.6 10.9 11.1 7.9 10.9 :
Unemployment rate1 (% active population,
age group 15-74)9.2 9.8 10.3 10.3 10.4 10.1
Long-term unemployment rate2 (% of labour force) 3.6 3.7 4.0 4.2 4.3 4.3
Youth unemployment rate
(% active population aged 15-24)22.7 24.4 24.9 24.2 24.7 24.9
Youth NEET3 rate (% of population aged 15-24) 12.3 12.5 11.2 11.4 12.0 :
Early leavers from education and training (% of pop. aged 18-24
with at most lower sec. educ. and not in further education or
training)
12.3 11.8 9.7 9.0 9.2 :
Tertiary educational attainment (% of population aged 30-34
having successfully completed tertiary education)43.1 43.3 44.0 43.7 45.0 :
Formal childcare (30 hours or over; % of population aged less
than 3 years)26.0 23.0 26.0 26.0 : :
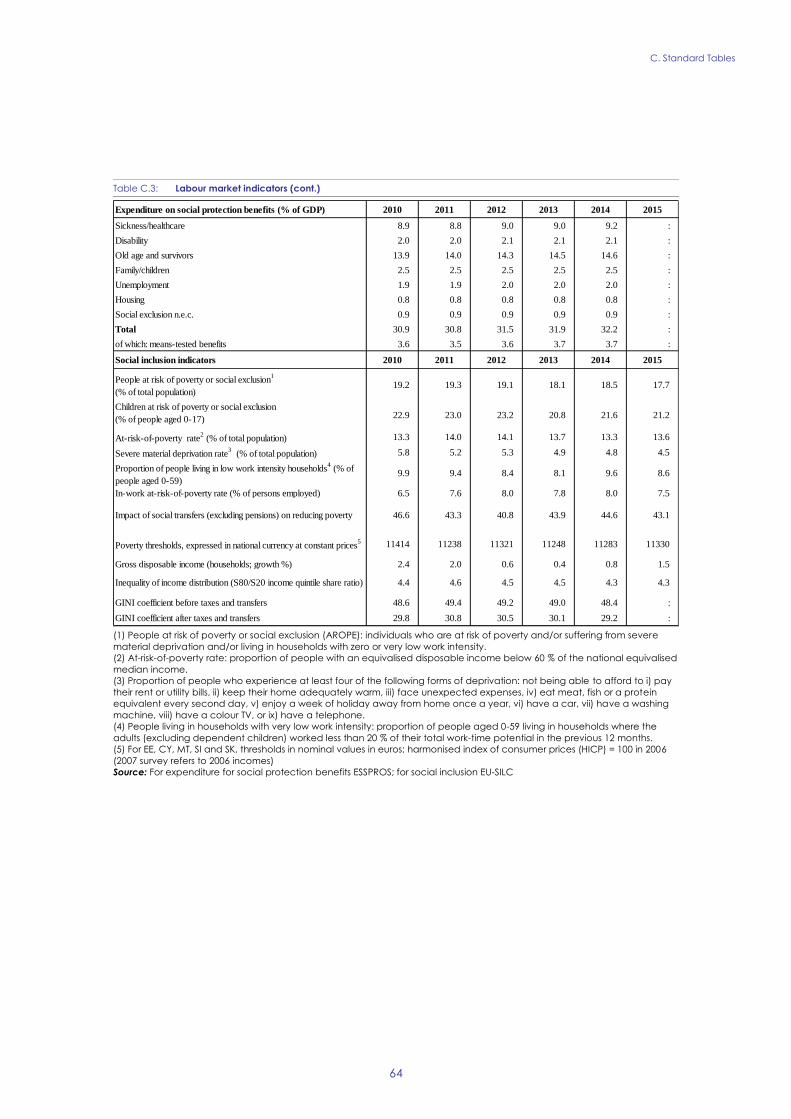
C. Standard Tables
64
Table C.3: Labour market indicators (cont.)
(1) People at risk of poverty or social exclusion (AROPE): individuals who are at risk of poverty and/or suffering from severe
material deprivation and/or living in households with zero or very low work intensity.
(2) At-risk-of-poverty rate: proportion of people with an equivalised disposable income below 60 % of the national equivalised
median income.
(3) Proportion of people who experience at least four of the following forms of deprivation: not being able to afford to i) pay
their rent or utility bills, ii) keep their home adequately warm, iii) face unexpected expenses, iv) eat meat, fish or a protein
equivalent every second day, v) enjoy a week of holiday away from home once a year, vi) have a car, vii) have a washing
machine, viii) have a colour TV, or ix) have a telephone.
(4) People living in households with very low work intensity: proportion of people aged 0-59 living in households where the
adults (excluding dependent children) worked less than 20 % of their total work-time potential in the previous 12 months.
(5) For EE, CY, MT, SI and SK, thresholds in nominal values in euros; harmonised index of consumer prices (HICP) = 100 in 2006
(2007 survey refers to 2006 incomes)
Source: For expenditure for social protection benefits ESSPROS; for social inclusion EU-SILC
Expenditure on social protection benefits (% of GDP) 2010 2011 2012 2013 2014 2015
Sickness/healthcare 8.9 8.8 9.0 9.0 9.2 :
Disability 2.0 2.0 2.1 2.1 2.1 :
Old age and survivors 13.9 14.0 14.3 14.5 14.6 :
Family/children 2.5 2.5 2.5 2.5 2.5 :
Unemployment 1.9 1.9 2.0 2.0 2.0 :
Housing 0.8 0.8 0.8 0.8 0.8 :
Social exclusion n.e.c. 0.9 0.9 0.9 0.9 0.9 :
Total 30.9 30.8 31.5 31.9 32.2 :
of which: means-tested benefits 3.6 3.5 3.6 3.7 3.7 :
Social inclusion indicators 2010 2011 2012 2013 2014 2015
People at risk of poverty or social exclusion1
(% of total population)19.2 19.3 19.1 18.1 18.5 17.7
Children at risk of poverty or social exclusion
(% of people aged 0-17) 22.9 23.0 23.2 20.8 21.6 21.2
At-risk-of-poverty rate2 (% of total population) 13.3 14.0 14.1 13.7 13.3 13.6
Severe material deprivation rate3 (% of total population) 5.8 5.2 5.3 4.9 4.8 4.5
Proportion of people living in low work intensity households4 (% of
people aged 0-59)9.9 9.4 8.4 8.1 9.6 8.6
In-work at-risk-of-poverty rate (% of persons employed) 6.5 7.6 8.0 7.8 8.0 7.5
Impact of social transfers (excluding pensions) on reducing poverty 46.6 43.3 40.8 43.9 44.6 43.1
Poverty thresholds, expressed in national currency at constant prices5 11414 11238 11321 11248 11283 11330
Gross disposable income (households; growth %) 2.4 2.0 0.6 0.4 0.8 1.5
Inequality of income distribution (S80/S20 income quintile share ratio) 4.4 4.6 4.5 4.5 4.3 4.3
GINI coefficient before taxes and transfers 48.6 49.4 49.2 49.0 48.4 :
GINI coefficient after taxes and transfers 29.8 30.8 30.5 30.1 29.2 :
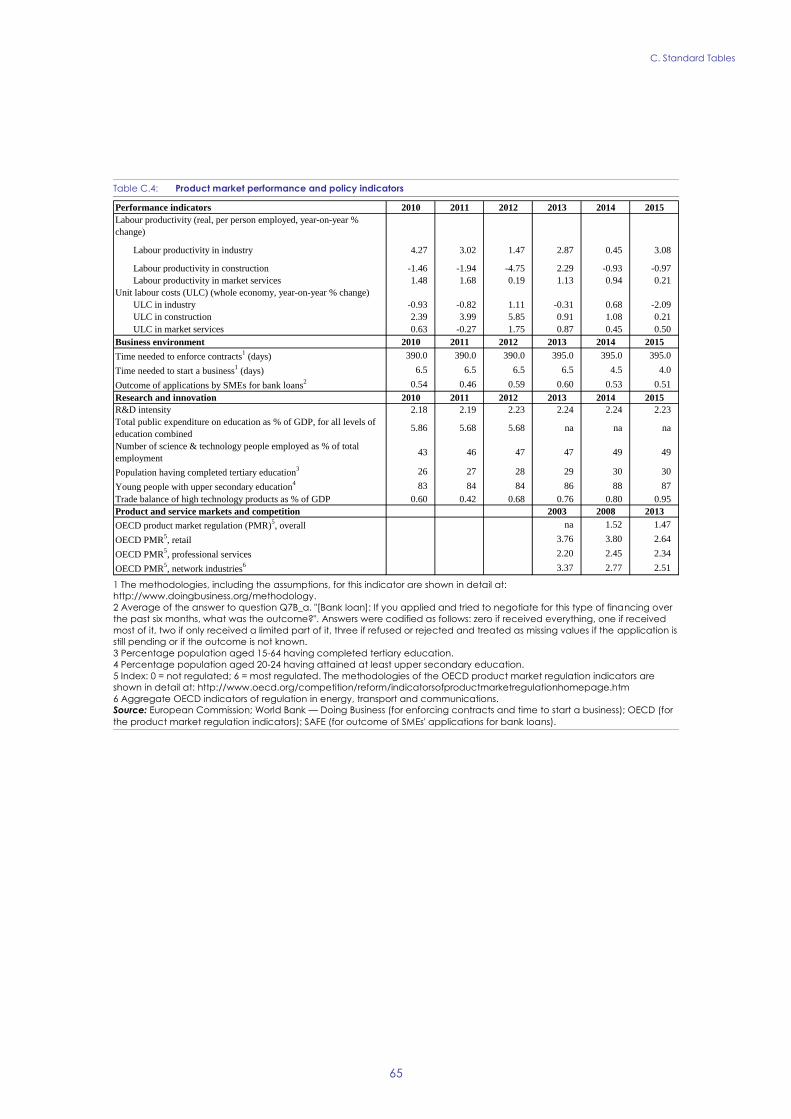
C. Standard Tables
65
Table C.4: Product market performance and policy indicators
1 The methodologies, including the assumptions, for this indicator are shown in detail at:
http://www.doingbusiness.org/methodology.
2 Average of the answer to question Q7B_a. "[Bank loan]: If you applied and tried to negotiate for this type of financing over
the past six months, what was the outcome?". Answers were codified as follows: zero if received everything, one if received
most of it, two if only received a limited part of it, three if refused or rejected and treated as missing values if the application is
still pending or if the outcome is not known.
3 Percentage population aged 15-64 having completed tertiary education.
4 Percentage population aged 20-24 having attained at least upper secondary education.
5 Index: 0 = not regulated; 6 = most regulated. The methodologies of the OECD product market regulation indicators are
shown in detail at: http://www.oecd.org/competition/reform/indicatorsofproductmarketregulationhomepage.htm
6 Aggregate OECD indicators of regulation in energy, transport and communications.
Source: European Commission; World Bank — Doing Business (for enforcing contracts and time to start a business); OECD (for
the product market regulation indicators); SAFE (for outcome of SMEs' applications for bank loans).
Performance indicators 2010 2011 2012 2013 2014 2015
Labour productivity (real, per person employed, year-on-year %
change)
Labour productivity in industry 4.27 3.02 1.47 2.87 0.45 3.08
Labour productivity in construction -1.46 -1.94 -4.75 2.29 -0.93 -0.97
Labour productivity in market services 1.48 1.68 0.19 1.13 0.94 0.21
Unit labour costs (ULC) (whole economy, year-on-year % change)
ULC in industry -0.93 -0.82 1.11 -0.31 0.68 -2.09
ULC in construction 2.39 3.99 5.85 0.91 1.08 0.21
ULC in market services 0.63 -0.27 1.75 0.87 0.45 0.50
Business environment 2010 2011 2012 2013 2014 2015
Time needed to enforce contracts1 (days) 390.0 390.0 390.0 395.0 395.0 395.0
Time needed to start a business1 (days) 6.5 6.5 6.5 6.5 4.5 4.0
Outcome of applications by SMEs for bank loans2 0.54 0.46 0.59 0.60 0.53 0.51
Research and innovation 2010 2011 2012 2013 2014 2015
R&D intensity 2.18 2.19 2.23 2.24 2.24 2.23
Total public expenditure on education as % of GDP, for all levels of
education combined5.86 5.68 5.68 na na na
Number of science & technology people employed as % of total
employment43 46 47 47 49 49
Population having completed tertiary education3 26 27 28 29 30 30
Young people with upper secondary education4 83 84 84 86 88 87
Trade balance of high technology products as % of GDP 0.60 0.42 0.68 0.76 0.80 0.95
Product and service markets and competition 2003 2008 2013
OECD product market regulation (PMR)5, overall na 1.52 1.47
OECD PMR5, retail 3.76 3.80 2.64
OECD PMR5, professional services 2.20 2.45 2.34
OECD PMR5, network industries
6 3.37 2.77 2.51
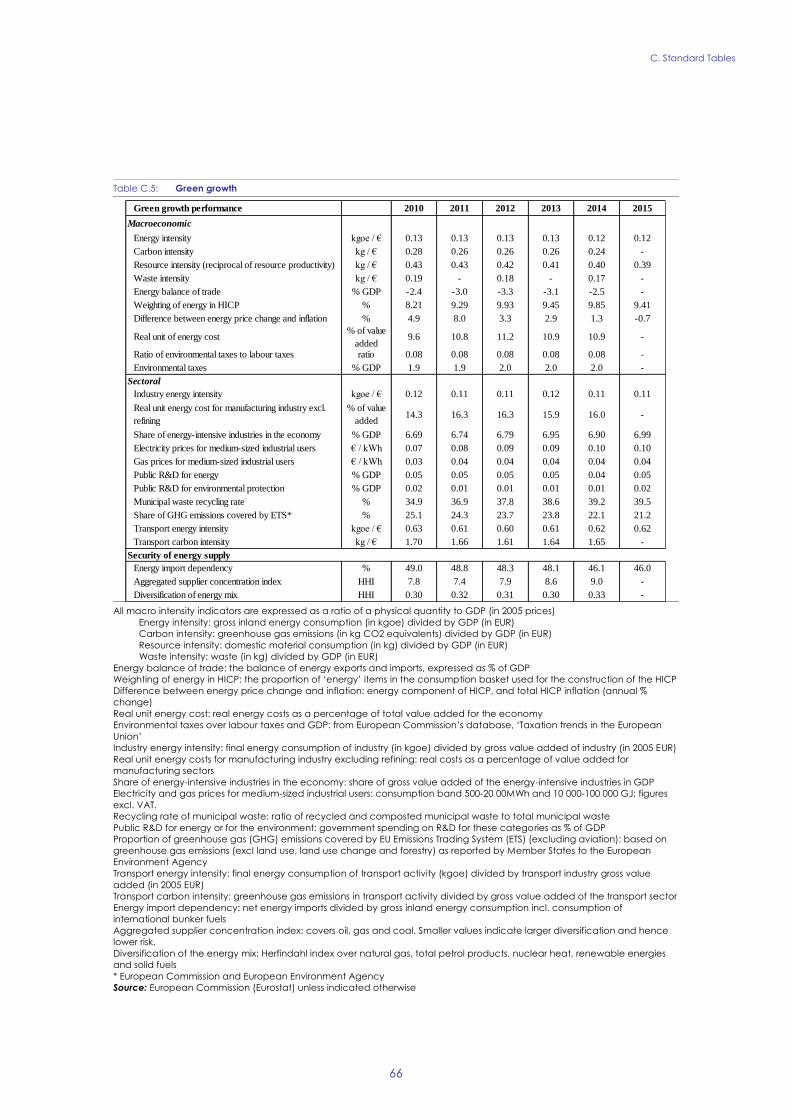
C. Standard Tables
66
Table C.5: Green growth
All macro intensity indicators are expressed as a ratio of a physical quantity to GDP (in 2005 prices)
Energy intensity: gross inland energy consumption (in kgoe) divided by GDP (in EUR)
Carbon intensity: greenhouse gas emissions (in kg CO2 equivalents) divided by GDP (in EUR)
Resource intensity: domestic material consumption (in kg) divided by GDP (in EUR)
Waste intensity: waste (in kg) divided by GDP (in EUR)
Energy balance of trade: the balance of energy exports and imports, expressed as % of GDP
Weighting of energy in HICP: the proportion of ‘energy’ items in the consumption basket used for the construction of the HICP
Difference between energy price change and inflation: energy component of HICP, and total HICP inflation (annual %
change)
Real unit energy cost: real energy costs as a percentage of total value added for the economy
Environmental taxes over labour taxes and GDP: from European Commission’s database, ‘Taxation trends in the European
Union’
Industry energy intensity: final energy consumption of industry (in kgoe) divided by gross value added of industry (in 2005 EUR)
Real unit energy costs for manufacturing industry excluding refining: real costs as a percentage of value added for
manufacturing sectors
Share of energy-intensive industries in the economy: share of gross value added of the energy-intensive industries in GDP
Electricity and gas prices for medium-sized industrial users: consumption band 500-20 00MWh and 10 000-100 000 GJ; figures
excl. VAT.
Recycling rate of municipal waste: ratio of recycled and composted municipal waste to total municipal waste
Public R&D for energy or for the environment: government spending on R&D for these categories as % of GDP
Proportion of greenhouse gas (GHG) emissions covered by EU Emissions Trading System (ETS) (excluding aviation): based on
greenhouse gas emissions (excl land use, land use change and forestry) as reported by Member States to the European
Environment Agency
Transport energy intensity: final energy consumption of transport activity (kgoe) divided by transport industry gross value
added (in 2005 EUR)
Transport carbon intensity: greenhouse gas emissions in transport activity divided by gross value added of the transport sector
Energy import dependency: net energy imports divided by gross inland energy consumption incl. consumption of
international bunker fuels
Aggregated supplier concentration index: covers oil, gas and coal. Smaller values indicate larger diversification and hence
lower risk.
Diversification of the energy mix: Herfindahl index over natural gas, total petrol products, nuclear heat, renewable energies
and solid fuels
* European Commission and European Environment Agency
Source: European Commission (Eurostat) unless indicated otherwise
Green growth performance 2010 2011 2012 2013 2014 2015
Macroeconomic
Energy intensity kgoe / € 0.13 0.13 0.13 0.13 0.12 0.12
Carbon intensity kg / € 0.28 0.26 0.26 0.26 0.24 -
Resource intensity (reciprocal of resource productivity) kg / € 0.43 0.43 0.42 0.41 0.40 0.39
Waste intensity kg / € 0.19 - 0.18 - 0.17 -
Energy balance of trade % GDP -2.4 -3.0 -3.3 -3.1 -2.5 -
Weighting of energy in HICP % 8.21 9.29 9.93 9.45 9.85 9.41
Difference between energy price change and inflation % 4.9 8.0 3.3 2.9 1.3 -0.7
Real unit of energy cost% of value
added9.6 10.8 11.2 10.9 10.9 -
Ratio of environmental taxes to labour taxes ratio 0.08 0.08 0.08 0.08 0.08 -
Environmental taxes % GDP 1.9 1.9 2.0 2.0 2.0 -
Sectoral
Industry energy intensity kgoe / € 0.12 0.11 0.11 0.12 0.11 0.11
Real unit energy cost for manufacturing industry excl.
refining
% of value
added14.3 16.3 16.3 15.9 16.0 -
Share of energy-intensive industries in the economy % GDP 6.69 6.74 6.79 6.95 6.90 6.99
Electricity prices for medium-sized industrial users € / kWh 0.07 0.08 0.09 0.09 0.10 0.10
Gas prices for medium-sized industrial users € / kWh 0.03 0.04 0.04 0.04 0.04 0.04
Public R&D for energy % GDP 0.05 0.05 0.05 0.05 0.04 0.05
Public R&D for environmental protection % GDP 0.02 0.01 0.01 0.01 0.01 0.02
Municipal waste recycling rate % 34.9 36.9 37.8 38.6 39.2 39.5
Share of GHG emissions covered by ETS* % 25.1 24.3 23.7 23.8 22.1 21.2
Transport energy intensity kgoe / € 0.63 0.61 0.60 0.61 0.62 0.62
Transport carbon intensity kg / € 1.70 1.66 1.61 1.64 1.65 -
Security of energy supply
Energy import dependency % 49.0 48.8 48.3 48.1 46.1 46.0
Aggregated supplier concentration index HHI 7.8 7.4 7.9 8.6 9.0 -
Diversification of energy mix HHI 0.30 0.32 0.31 0.30 0.33 -
67
Ausilloux V., Gouardo C. (2017), Mobiliser l’épargne pour le financement des startup, France Stratégie,
January.
Balassa B. (1966), Tariff Reductions and Trade in Manufactures among the Industrial Countries,
American Economic Review 56: 466-72, 1966.
Cahuc P. and Prost C. (2015), Améliorer l’assurance chômage pour limiter l’instabilité de l’emploi, Note
du Conseil d'Analyse Economique No. 24, September 2015.
CASE (2016), Study and reports on the VAT Gap in the EU-28 Member States: 2016 Final report,
TAXUD/2015/CC/131, Centre for Social and Economic Research, Institute for Advances Studies
Warsaw.
Comité de suivi du crédit d'impôt pour la compétitivité et l'emploi (2016), "Rapport 2016 du Comité de
suivi du crédit d'impôt pour la compétitivité et l'emploi," France Stratégie.
Coordination interministérielle de l'innovation et du transfert (2016), L'innovation en France, Indicateur
de positionnement international, Ministère de l'éducation nationale, de l'enseignement supérieur et de la
recherhce, Ministère de l'économie, de l'Indutsrie et du numérique.
Council of the European Union (2015), Council recommendation with a view to bringing an end to the
excessive government deficit in France. Available at:
http://data.consilium.europa.eu/doc/document/ST-6704-2015-INIT/en/pdf
Cour des Comptes (2016a), L’accès des jeunes à l’emploi, September 2016.
Cour des Comptes (2016b), Les finances publiques locales, Rapport sur la situation financière et la
gestion des collectivités territoriales et de leurs établissements publics, October 2016.
Cour des Comptes (2016c), Simplifier la collecte des prélèvements versés par les entreprises, July 2016.
CNESCO (2016a), Inégalités sociales. Comment l'école amplifie-t-elle les inégalités sociales et
migratoires ?, September 2016.
CNESCO (2016b), Enseignement professionnel synthèse.
CNESCO (2016c), Enseignement professionnel état des lieux.
CNEFOP (2016a), Rapport sur le financement et les effectifs de l'apprentissage en 2013, September
2016.
CNEFOP (2016b), 1er
Rapport sur la mise en œuvre du CPF et du CEP.
DARES (2016a), Tableau de Bord à fin mars 2016, activité des jeunes et politiques d’emploi, August
2016.
DARES (2016b), L'apprentissage en 2015, DARES Analyses n.2016-044, September 2016.
De Galhau F.V. (2015), Le financement de l'investissement des entreprises, September 2015.
DEPP (2016a), CEDRE 2015 Nouvelle évaluation en fin de collège: compétences langagières et littératie,
Note d’information, n°21 July 2016.
REFERENCES
References
68
DEPP (2016b), Évaluation numérique des compétences du socle en début de sixième: des niveaux de
performance contrastés selon les académies, Note d’information, n° 18, June 2016.
DEPP (2016c), Parcours scolaires, diplômes, insertion, Note d’information n° 17, June 2016.
DEPP (2016d), Repères et références statistiques (RERS), 2016.
Douanes (2015), Les opérateurs du commerce extérieur de la France – Année 2015 (résultats révisés),
Le chiffre du commerce extérieur, Direction générale des douanes et droits indirects.
Dujardin, M., Kelber, A. and Lalliard, A. (2015), Overvaluation in the housing market and returns on
residential real estate in the euro area: insights from data in euro per square metre, Banque de France
Quarterly Selection of Articles, No. 37, Spring.
Ekeland M., Landier A. and Tirole J. (2016), Renforcer le capital-risque français, Note du Conseil
d'Analyse Economique No. 33, July
European Central Bank (2016), The Household Finance and Consumption Survey: results from the
second wave, Statistics Paper Series no. 18, December 2016.
European Commission (2015a), Ageing Report 2015.
European Commission (2015b), Challenges to Member States’ Investment Environments, SWD (2015)
400 final . Available at:
http://ec.europa.eu/europe2020/challenges-to-member-states-investment-environments/index_en.htm
European Commission (2015c), 2015 Macroeconomic imbalances. Country Report – France 2015.
Available at:
http://ec.europa.eu/economy_finance/publications/occasional_paper/2015/pdf/ocp217_en.pdf
European Commission (2016b), 2017 Alert Mechanism Report. Available at:
https://ec.europa.eu/info/publications/2017-european-semester-alert-mechanism-report_en
European Commission (2016c), 2016 Country Report for France. Available at:
http://ec.europa.eu/europe2020/pdf/csr2016/cr2016_france_en.pdf
European Commission (2016d), Joint Report on Health Care and Long Term Care Systems and Fiscal
Sustainability – Vol. 2 Country Documents: Health Care Systems, France (2016), prepared by the
Commission (DG ECFIN) and the Economic Policy Committee (Ageing Working Group). Available at:
http://ec.europa.eu/economy_finance/publications/eeip/pdf/ip037bycountry/joint-report_fr_en.pdf
European Commission (2016e), EU Tax Policies: 2016 Scoreboard, Publications Office of the European
Union, Luxembourg.
European Commission (2016f), European Innovation Scoreboard. Available at:
https://ec.europa.eu/growth/industry/innovation/facts-figures/scoreboards_en
European Commission (2016g), Small Business Act (SBA) Fact sheet. Available at:
http://ec.europa.eu/growth/smes/business-friendly-environment/performance-review-2016_en#sba-fact-
sheets
European Commission (2016h), Survey on the Access to Finance and Enterprise (SAFE). Available at:
http://ec.europa.eu/growth/access-to-finance/data-surveys_en
References
69
European Commission (2016i), Report on Single Market Integration and Competitiveness in the EU and
its Member States. Available at:
https://ec.europa.eu/growth/industry/competitiveness/reports/single-market-integration-
competitiveness_en
European Commission (2017a), Debt Sustainability Monitor 2016. Available at:
https://ec.europa.eu/info/publications/debt-sustainability-monitor-2016_en
European Commission (2017b), Communication of the Commission of 10 January 2017 on reform
recommendations for regulation in professional services COM(2016)820 and accompanying staff
working document COM(2016)436
European Commission (2017c), France – Review Of Progress On Policy Measures Relevant For The
Correction Of Macroeconomic Imbalances. Available at: https://ec.europa.eu/info/business-economy-
euro/economic-performance-and-forecasts/economic-performance-country/france/macroeconomic-
surveillance-france_en
European Commission (2017d), Winter 2017 economic forecast. Available at:
https://ec.europa.eu/info/business-economy-euro/economic-performance-and-forecasts/economic-
forecasts/winter-2017-economic-forecast_en
European Commission (, forthcoming), Identifying priority sectors for reforms in services, Institutional
Papers Series. European Commission (2016, Taxation Trends in the European Union, 2016 edition, Publications Office
of the European Union, Luxembourg.
France Stratégie (2016a), Le cout économique des discriminations, September 2016. France Stratégie (2016b), Quels principes pour une fiscalité simplifiée, August 2016.
Fondation Abbé Pierre (2016), 21e rapport annuel l'Etat de mal-logement en France.
Garicano L., Lelarge C., Van Reenen J. (2016), Firm size distortions and the productivity distribution:
evidence from France, American Economic Review, Vol 11. .
GP Bullhound (2015), European unicorns: Do they have legs?, Independent Technology research.
Available at:
http://www.gpbullhound.com/wp-content/uploads/2015/06/GP-Bullhound-Research-Billion-Dollar-
Companies-2015.pdf
Haut Conseil des Finances Publiques (2016), Avis n°2016-3 relatif aux projets de lois de finances et de
financement de la sécurité sociale pour l’année 2017, 24 September 2016.
Hobza A. and Zeugner S. (2014), Current accounts and finacial flows in the euro area, Journal of
Internation Money and Finance, vol. 48, pages 291-313.
Héricourt J., Martin P. and Orefice G. (2014), Les exportations françaises face aux variations de change,
La Lettre du CEPII, January 2014.
Kant, J.-D., Ballot, G. and Goudet O. (2016), Worksim project. Available at: http://worksim.lip6.fr/
INSEE (2016), Niveaux de vie en 2014, INSEE Première no. 1614, September 2016.
References
70
International Monetary Fund (2016), Global Financial Stability Report: Potent Policies for a Successful
Normalization, April 2016.
Landais C., Piketty T. and Saez E. (2011), Pour une révolution fiscale. Un impôt sur le revenu pour le
XXIe siècle, La République des idées-Le Seuil, 2011.
MENESR (2015), Rapport annuel au parlement, Comité de suivi de la Loi de refondation de l’école, 13
November 2015.
National Tax Lists (2016). Available at:
http://ec.europa.eu/eurostat/statistics-explained/index.php/Tax_revenue_statistics
OECD (2012), Close the gender gap: Act now!, Report 2012.
OECD (2014a), International Migration Outlook 2014, OECD Publishing, Paris..
OECD (2014b), OECD Reviews of Innovation Policy: France 2014, OECD Publishing, Paris.
OECD (2015a), Débats sur les politiques migratoires No 6. L’école est-elle (encore) un des principaux
vecteurs d’intégration en France ?
OECD (2015b), Tax Administration 2015: Comparative Information on OECD and Other Advanced and
Emerging Economies, OECD Publishing, Paris.
OECD (2016a), Economic Outlook No 100, November 2016.
OECD (2016b), Low-Performing Students: Why They Fall Behind and How to Help Them Succeed,
Country note France.
OECD (2016c), Les impôts sur les salaires 2016, May 2016.
Pipame, Pôle interministériel de Prospective et d’Anticipation des Mutations économiques (2015), Enjeux
et perspectives de la consommation collaborative, June 2015. Available at:
http://www.entreprises.gouv.fr/files/files/directions_services/etudes-et-
statistiques/prospective/Numerique/2015-07-Consommation-collaborative-Rapport-final.pdf
Pisani-Ferry, J. et al. (2016), Quinze ans de politiques d'innovation en France, Rapport de la Commission
nationale d'évaluation des politiques d'innovation, January 2016.
Price Waterhouse Coopers for the European Commission (2016), Assessing the size and presence of the
collaborative economy in Europe, 2016.
Ratto M., Roeger W., and in ’t Veld J. (2009), QUEST III: An Estimated Open-Economy DSGE Model of
the Euro Area with Fiscal and Monetary Policy, Economic Modelling, 26 (2009), pp. 222-233.
Senate (2016), Information report on the annual assessment of the laws' enforcement, 31 May 2016,
Report n° 650. Available at: https://www.senat.fr/notice-rapport/2015/r15-650-notice.html
Sutherland H. and Figari F. (2013), EUROMOD: the European Union tax-benefit microsimulation model,
International Journal of Microsimulation, 6(1) pp. 4-26I.
Taly, M. (2016), Les coulisses de la politique fiscale, PUF.
References
71
Unédic (2016), Situation financière de l'Assurance chômage : prévision 2016-2017, February 2016.
Vandenbussche H. (2014), Quality in Exports, European Economy Economic Papers 528, September
2014.
Varga J. and in 't Veld J. (2014), The potential growth impact of structural reforms in the EU. A
benchmarking exercise, European Economy Economic Papers 541.
Villard N. (2015), La France, ce pays qui crée des start-up à la chaîne !, Capital, 9 June 2015, Available
at:
World Bank Group and PwC (2016), Paying taxes 2017: The Global Picture, November.
World Bank (2017), Doing Business. Available at:
http://www.doingbusiness.org/~/media/WBG/DoingBusiness/Documents/Annual-Reports/English/DB17-
Report.pdf
ZEW (2016), The Effects of Tax Reforms to Address the Debt-Equity Bias on the Cost of Capital and on
Effective Tax Rates, Taxation paper No. 65, 2016.