Embed Size (px)
Citation preview
p a r k s v i c t o r i a t e c h n i c a l s e r i e s
number 96
Yaringa and French island marine national park habitat mapping
Thomas French, Jacquomo Monk, Daniel Ierodiaconou, Adam Pope and David Ball
April 2014
© Parks Victoria
All rights reserved. This document is subject to the Copyright Act 1968, no part of this publication may be reproduced, stored in a retrieval system, or transmitted in any form, or by any means, electronic, mechanical, photocopying or otherwise without the prior permission of the publisher.
First published 2014
Published by Parks Victoria Level 10, 535 Bourke Street, Melbourne Victoria 3000
Opinions expressed by the Authors of this publication are not necessarily those of Parks Victoria, unless expressly stated. Parks Victoria and all persons involved in the preparation and distribution of this publication do not accept any responsibility for the accuracy of any of the opinions or information contained in the publication.
Authors:
Tom French, Jacquomo Monk, Daniel Ierodiaconou, Adam Pope – Deakin University, Warrnambool, Victoria.
David Ball – Habitat Ecology Section Leader – Department of Primary Industries, Queenscliff, Victoria.
National Library of Australia Cataloguing-in-publication data
Includes bibliography ISSN 1448-4935
Citation
French, T., Monk, J., Ierodiaconou, D., Pope, A., Ball, D. (2014) Yaringa and French Island Marine National Park Habitat Mapping. Parks Victoria Technical Series No. 96. Parks Victoria, Melbourne.
Printed on environmentally friendly paper
Parks Victoria Technical Paper Series No. 96
Yaringa and French Island Marine National Park Habitat Mapping
Thomas French1, Jacquomo Monk1, Daniel Ierodiaconou1, Adam Pope1 and David Ball2
1School of Life and Environmental Sciences
Deakin University 2Department of Primary Industries
September 2013
Parks Victoria Technical Series No. 96 Yaringa and French Island MNP Habitat Mapping
Executive Summary Deakin University and the Department of Primary Industries were commissioned by Parks Victoria (PV) to create two updated habitat maps for Yaringa and French Island Marine National Parks. The team obtained a ground-truth data set using in situ video and still photographs. This dataset was used to develop and assess predictive models of benthic marine habitat distributions incorporating data from World-View-2 imagery atmospherically corrected by CSIRO and LiDAR (Light Detection and Ranging) bathymetry. In addition, the team applied an unsupervised classification approach to an aerial photograph to assess the differences between the two remote sensors. This report describes the results of the mapping as well as the methodology used to produce these habitat maps.
This study has provided mapping of intertidal and subtidal habitats of Yaringa and French Island MNPs at a 2 m resolution with fair to good accuracies (Kappa 0.40-0.75). These were combined with mangrove and saltmarsh habitats recently mapped by Boon et al. (2011) to provide compete-coverage habitat maps of Yaringa and French Island MNPs.
The mapping showed that Yaringa MNP was dominated by mangroves, wet saltmarsh and dense Zostereaceae, covering 33%, 29% and 19%, respectively. Similarly, intertidal vegetation and subtidal vegetation (dominated by Zosteraceae) covered 26% and 25% of French Island MNP. However, as a result of turbidity and missing satellite imagery 27% of French Island MNP remains unmapped.
The coupling of WV-2 and LiDAR reduced potential artefacts (e.g. sun glint causing white and black pixels known as the “salt and pepper effect”).
The satellite classification appeared to provide better results than the aerial photography classification. However, since there is a two-year difference between the capture of the aerial photography and the collection of the ground-truth data this comparison is potentially temporally confounded. It must also be noted that there are differences in costs of the data, the spatial resolution between the two datasets (i.e. WV-2 = 2 m and the Aerial = 0.5 m) and the amount spectral information contained in the data (i.e. WV-2 = 8 bands and the aerial = 4 bands), which may ultimately determine its utility for a particular project.
The spatial assessment using FRAGSTATs of habitat patches within Yaringa MNP provides a viable and cost effect way to assess habitat condition (i.e. shape, size and arrangement). This spatial assessment determined that dense Zosteraceae and NVSG habitat classes were generally larger in patch size and continuity than the medium/sparse Zosteraceae habitat. The application spatial techniques to time-series mapping may provide a way to remotely monitor the change in the spatial characteristics of marine habitats.
This work was successful in providing new baseline habitat maps using a repeatable method meaning that any future changes in intertidal and shallow water marine habitats may be assessed in a consistent way with quantitative error assessments. In wider use, these maps should also allow improved conservation planning, fisheries and catchment management, and contribute toward infrastructure planning to limit impacts on Western Port.
II
Parks Victoria Technical Series No. 96 Yaringa and French Island MNP Habitat Mapping
Table of Contents
Executive Summary .............................................................................................................. II
1. Introduction .................................................................................................................... 1
2. Methods ......................................................................................................................... 3
2.1. Study Site ............................................................................................................... 3
2.2. Ground-truth data collection .................................................................................... 4
2.3. Aerial photography imagery .................................................................................... 8
2.4. LiDAR data ............................................................................................................. 8
2.5. World-View 2 imagery and atmospheric correction ............................................... 11
2.6. Habitat map classification ..................................................................................... 13
2.6.1. Aerial imagery classification ........................................................................... 13
2.6.2. Satellite imagery classification ....................................................................... 13
2.7. Error assessment .................................................................................................. 13
2.8. Analysis of habitat fragmentation within Yaringa MNP .......................................... 14
2.9. Spectral differences in subtidal and intertidal habitats ........................................... 14
2.10. Comparison of classification techniques ............................................................... 15
2.11. Incorporation of previously mapped habitats ........................................................ 15
3. Results ......................................................................................................................... 17
3.1. Ground-truthing ..................................................................................................... 17
3.2. Classification results ............................................................................................. 21
3.2.1. Unsupervised classification of Yaringa Marine National Park based on the 2009 aerial photograph .................................................................................. 21
3.2.2. Supervised classifications of Yaringa Marine National Park based on LiDAR and WV-2 data. .............................................................................................. 23
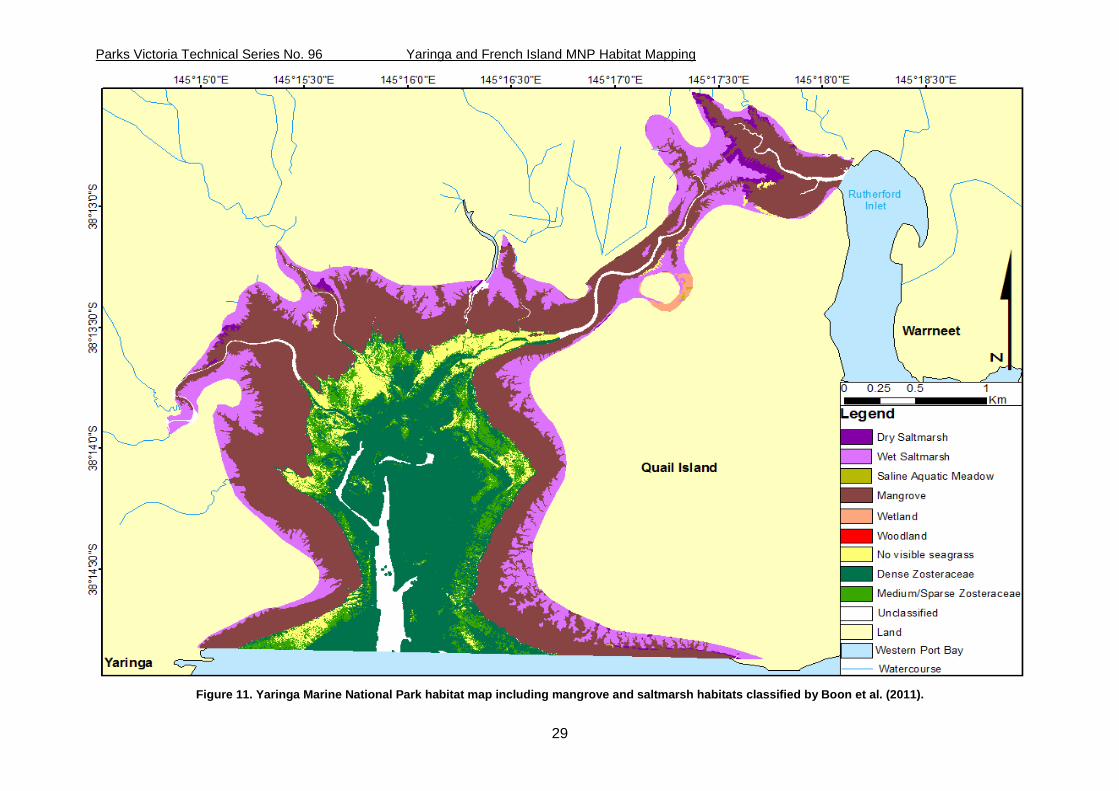
3.2.3. Complete map of Yaringa Marine National Park ............................................ 28
3.2.4. Complete map of French Island Marine National Park ................................... 30
3.3. Spatial arrangement of benthic habitats in Yaringa Marine National Park ............. 32
III
Parks Victoria Technical Series No. 96 Yaringa and French Island MNP Habitat Mapping
3.4. Comparisons between aerial and satellite classification techniques for Yaringa Marine National Park ............................................................................................ 36
3.5. Spectral differences in intertidal and subtidal habitats at Yaringa Marine National Park ...................................................................................................................... 38
4. Conclusions and recommendations ............................................................................. 40
5. Acknowledgments ........................................................................................................ 42
6. References .................................................................................................................. 42
IV
Parks Victoria Technical Series No. 96 Yaringa and French Island MNP Habitat Mapping
List of Tables
Table 1. Density-based selection criteria used to group species into habitat classes. ........... 6
Table 2. Ecological Vegetation Classes (EVC) that were mapped by Boon et al. (2011) and how they were regrouped for the current study. .................................................................. 16
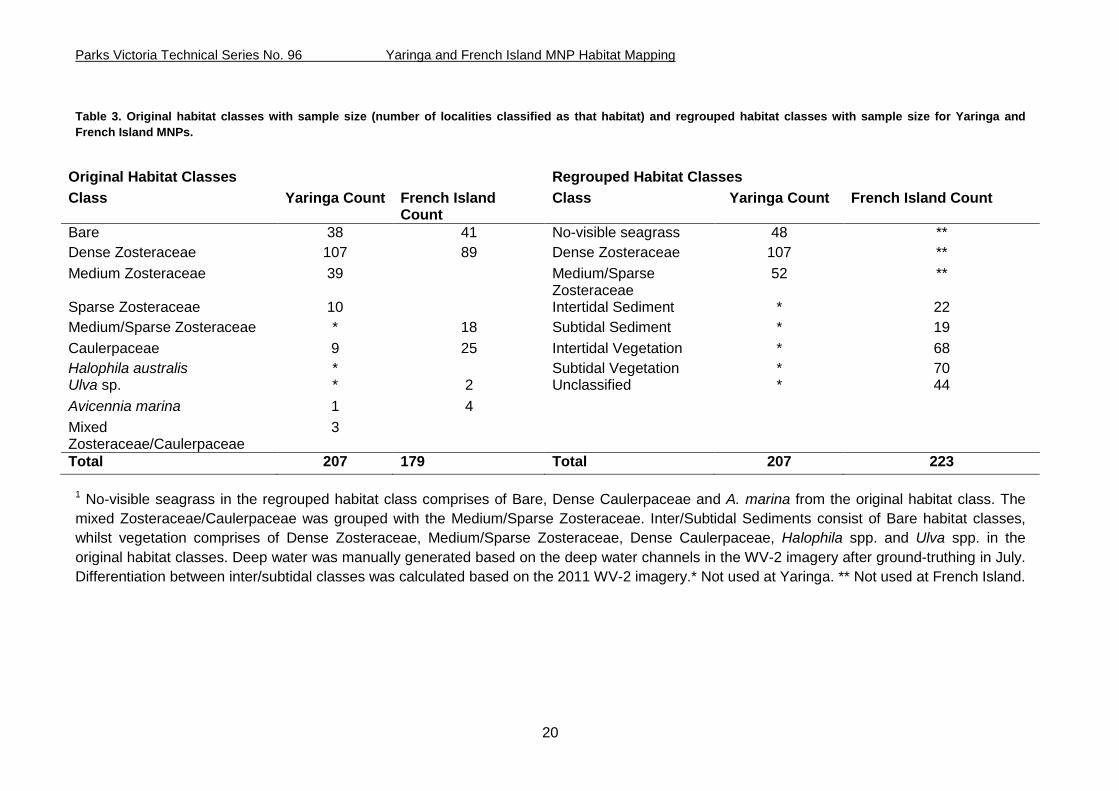
Table 3. Original habitat classes with sample size (number of localities classified as that habitat) and regrouped habitat classes with sample size for Yaringa and French Island MNPs. ............................................................................................................................... 200
Table 4. Yaringa MNP seagrass habitat areas based on the unsupervised classification of the 2009 aerial photograph. ................................................................................................ 21
Table 5. Error matrix for habitat classes mapped in Yaringa Marine National Park from the just WV-2 data validated against the 25 % of the ground truth data used for independent assessment. Overall accuracy = 71.43%; Kappa = 0.48. NVSG = no-visible seagrass. ...... 25
Table 6. Error matrix for habitat classes mapped in Yaringa Marine National Park from the WV-2 and LiDAR data validated against the 25 % of the ground truth data used for independent assessment. Overall accuracy = 71.43%; Kappa = 0.51. NVSG = No-visible seagrass ............................................................................................................................. 25
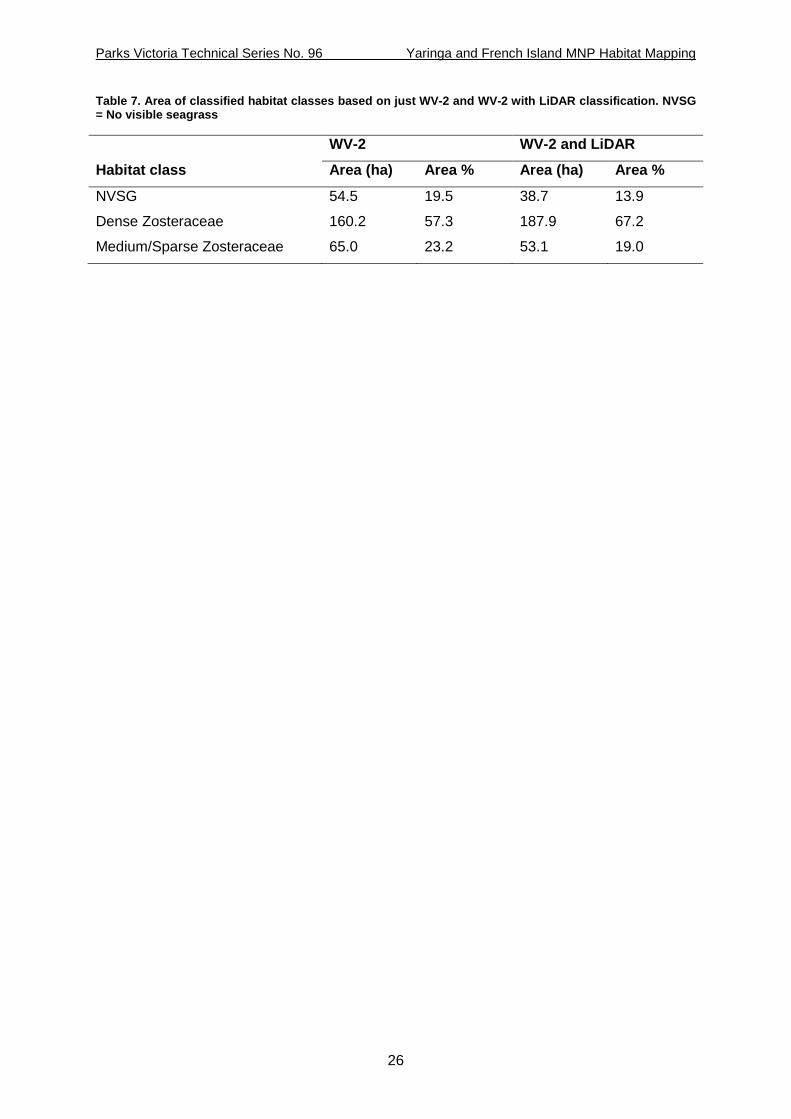
Table 7. Area of classified habitat classes based on just WV-2 and WV-2 with LiDAR classification. NVSG = No visible seagrass ......................................................................... 26
Table 8. Area of classified habitats in Yaringa Marine National Park. .................................. 30
Table 9. French Island MNP habitat map error matrix for habitat classes mapped from the 2011 satellite imagery validated against the 25 % of the ground truth data used for independent assessment. Overall accuracy = 52.73 %; Kappa = 0.38. ............................... 32
Table 10. Area of classified habitats in French Island Marine National Park. ....................... 32
Table 11. PERMANOVA results from four landscape pattern indices. Edge Density (ED), Number of Patches (NumP), Mean Patch Size (MPS) and Patch Size Standard Deviation (PSSD)................................................................................................................................ 33
Table 12. Pair-wise statistical significance of Mean Patch Size of habitat types within Yaringa MNP. NVSG = No visible seagrass, Zos = Zosteraceae. ..................................................... 33
Table 13. Error matrix for habitat classes mapped from the 2009 aerial imagery validated against the 25 % of the ground truth data used for independent assessment. Overall accuracy = 84 %; Kappa = 0.41. NVSG = no-visible seagrass. ........................................... 36
Table 14. Error matrix for habitat classes mapped from the 2011 WV-2 satellite imagery validated against the 25 % of the ground truth data used for independent assessment. Overall accuracy = 92 %; Kappa = 0.70. NVSG = no-visible seagrass. ............................... 36
V
Parks Victoria Technical Series No. 96 Yaringa and French Island MNP Habitat Mapping
Table 15. Comparisons of seagrass coverage’s against the 2009 aerial and 2012 WV-2 and LiDAR sampling techniques. NVSG = No visible seagrass. ................................................. 36
Table 16. Pair separation of mapped habitat classes for Yaringa Marine National Park. ..... 40
Table 17. Pair Separation of mapped habitat classes for French Island Marine National Park. ........................................................................................................................................... 40
VI
Parks Victoria Technical Series No. 96 Yaringa and French Island MNP Habitat Mapping
List of Figures
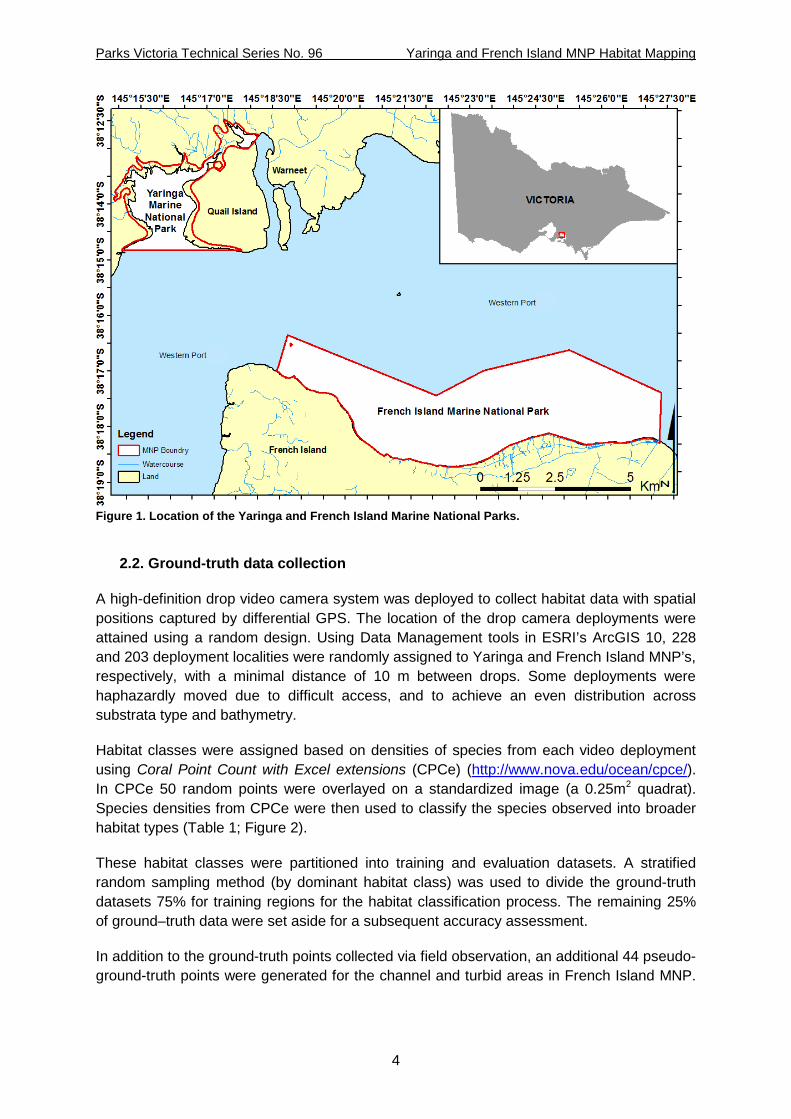
Figure 1. Location of the Yaringa and French Island Marine National Parks. ........................ 4
Figure 2. Still images of the seven original habitat classes defined within the MNP’s. (A) Bare, (B) Dense Zosteraceae, (C) Medium Zosteraceae, (D) Sparse Zosteraceae, (E) Dense Caulerpaceae, (F) Avicennia marina, (G) Mixed Zosteraceae/Caulerpaceae, (H) Halophila australis, (I) Ulva sp. ............................................................................................................. 7
Figure 3. Aerial photograph used in the classification of Yaringa MNP study site. Red line delineates MNP boundary. .................................................................................................... 8
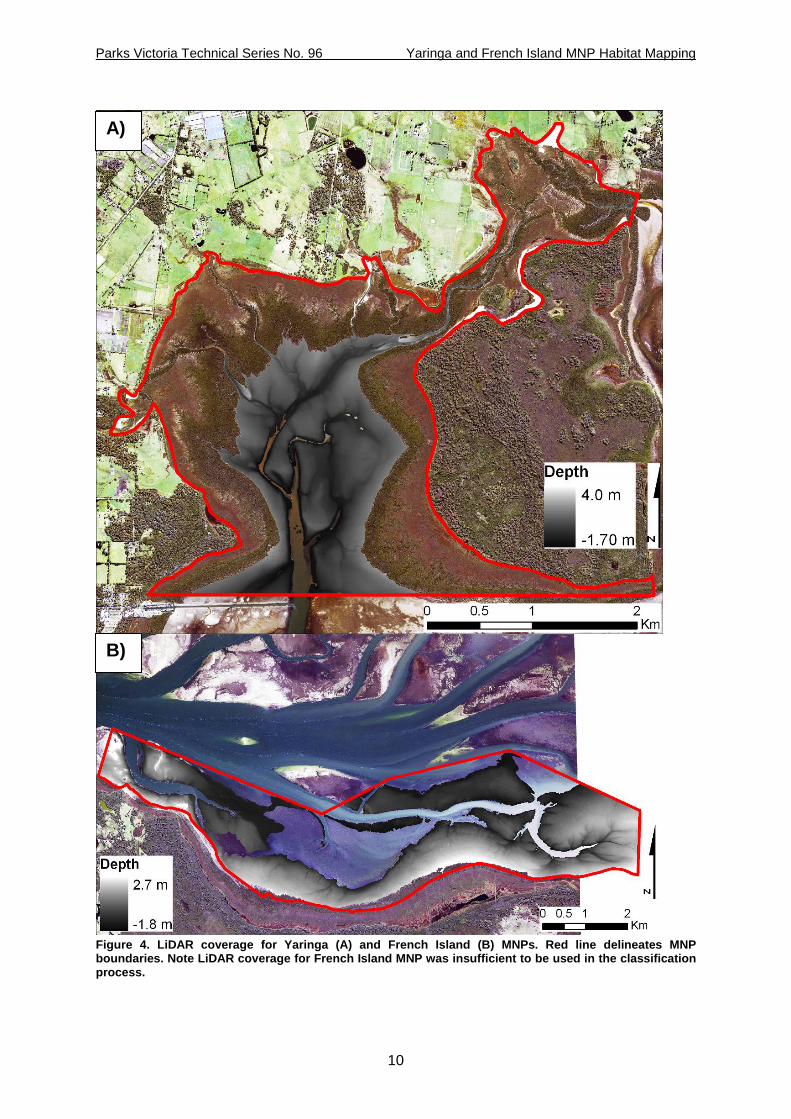
Figure 4. LiDAR coverage for Yaringa (A) and French Island (B) MNPs. Red line delineates MNP boundaries. Not LiDAR coverage for French Island MNP was insufficient to be used in the classification process. ................................................................................................... 10
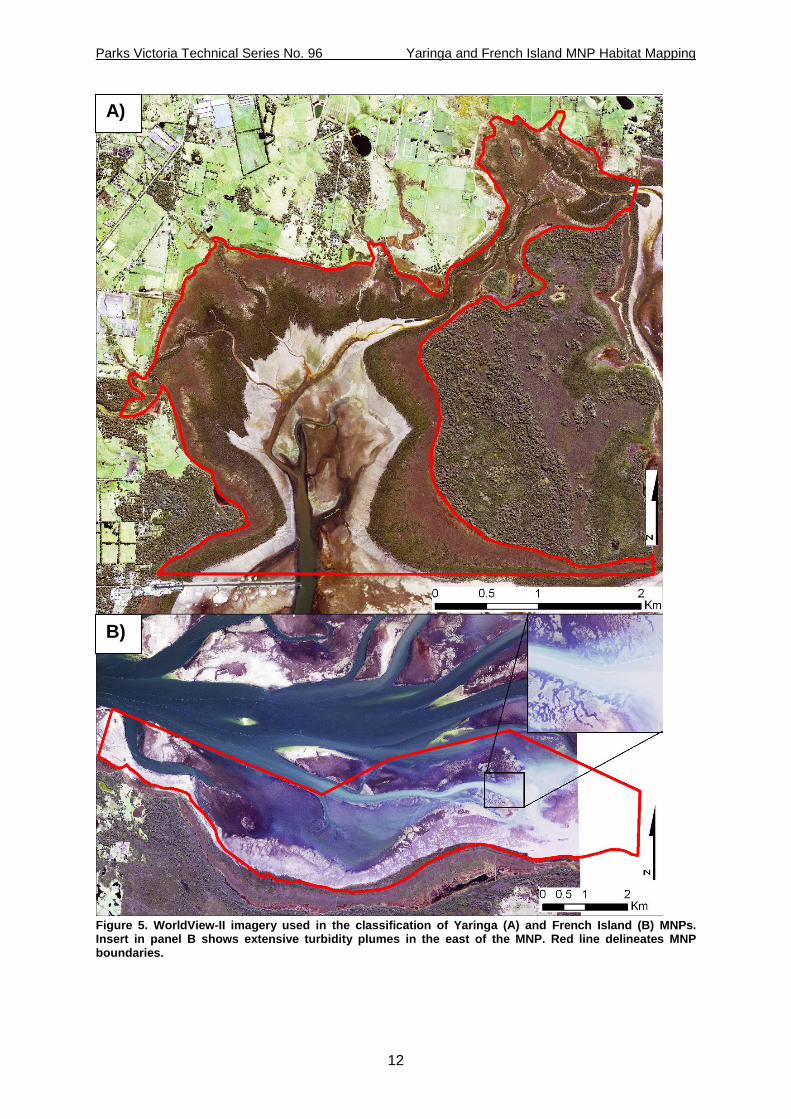
Figure 5. WorldView-II imagery used in the classification of Yaringa (A) and French Island (B) MNPs. Insert in panel B shows extensive turbidity plumes in the east of the MNP. Red line delineates MNP boundaries. ......................................................................................... 12
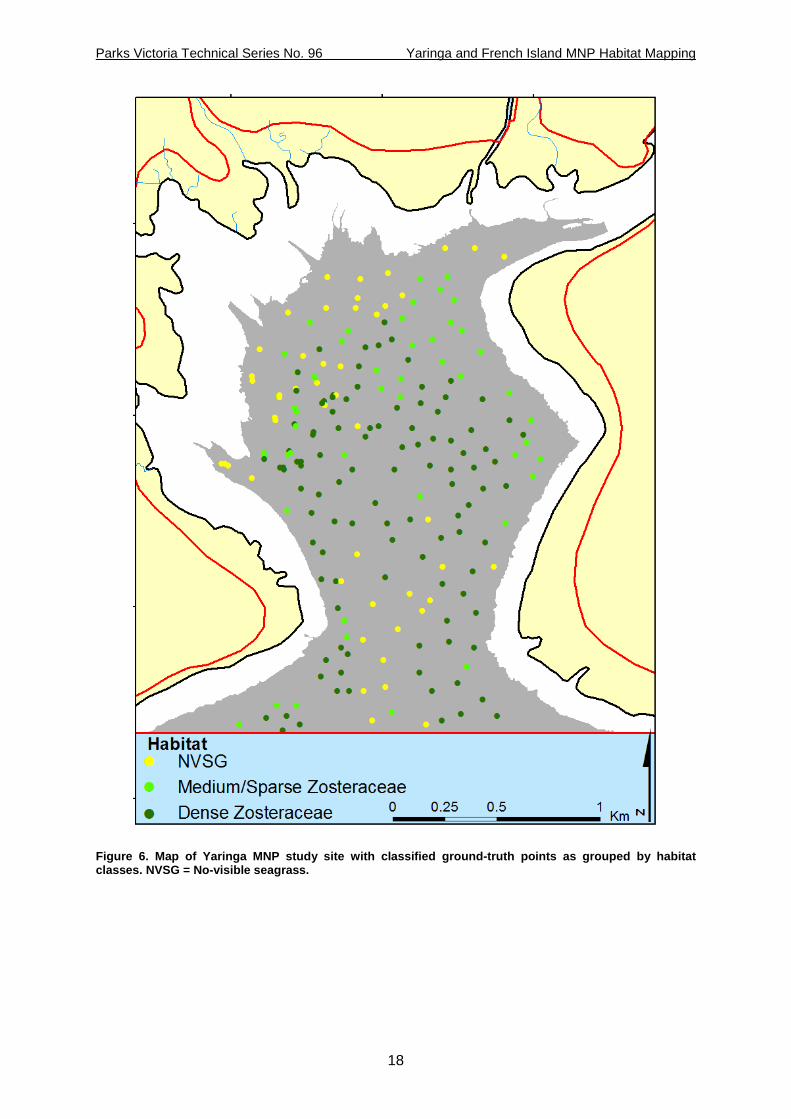
Figure 6. Map of Yaringa MNP study site with classified ground-truth points as grouped by habitat classes. NVSG = No-visible seagrass. .................................................................... 18
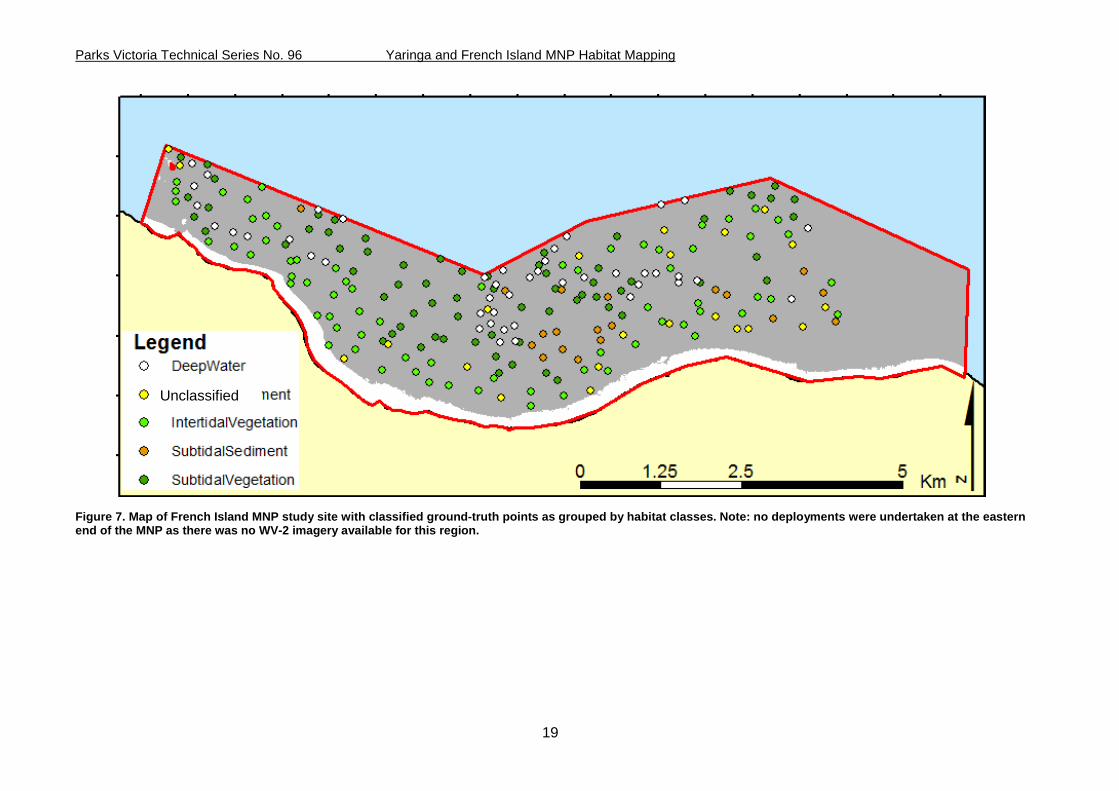
Figure 7. Map of French Island MNP study site with classified ground-truth points as grouped by habitat classes. Note: no deployments were undertaken at the eastern end of the MNP as there was no WV-2 imagery available for this region. .......................................................... 19
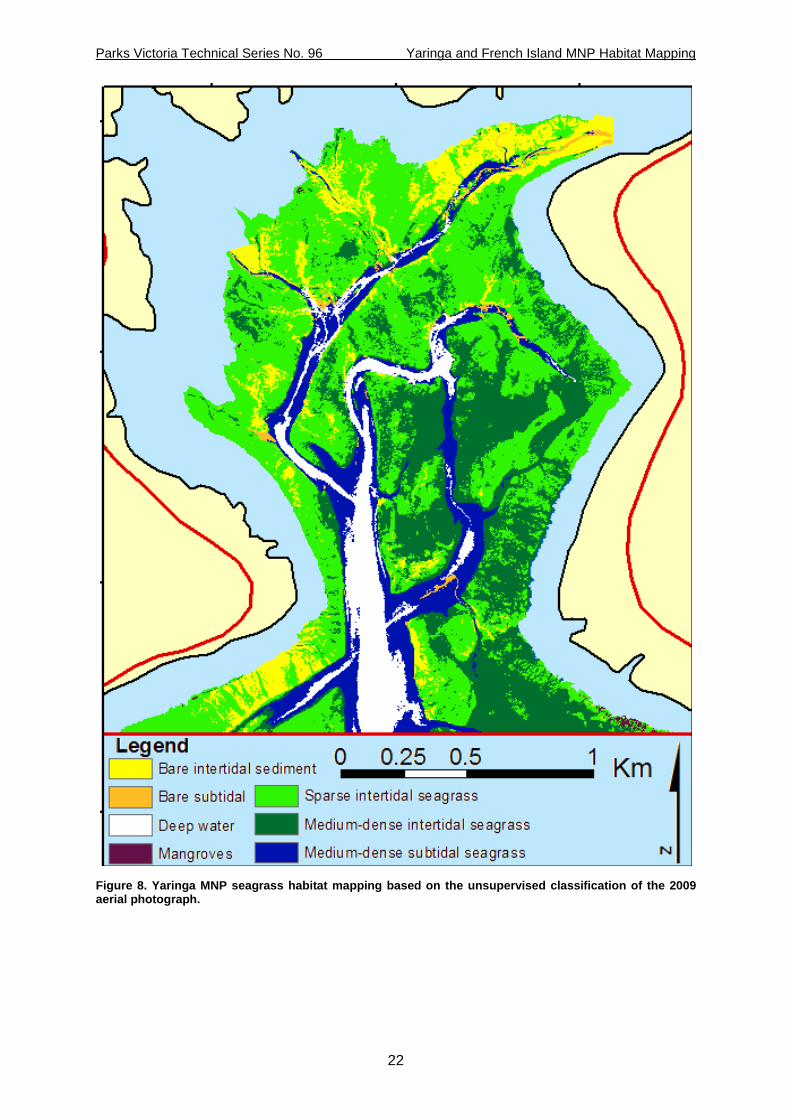
Figure 8. Yaringa MNP seagrass habitat mapping based on the unsupervised classification of the 2009 aerial photograph. ............................................................................................ 22
Figure 9. Habitat classification for Yaringa MNP using (A) just WV-2 data and (B) WV-2 and LiDAR data ......................................................................................................................... 24
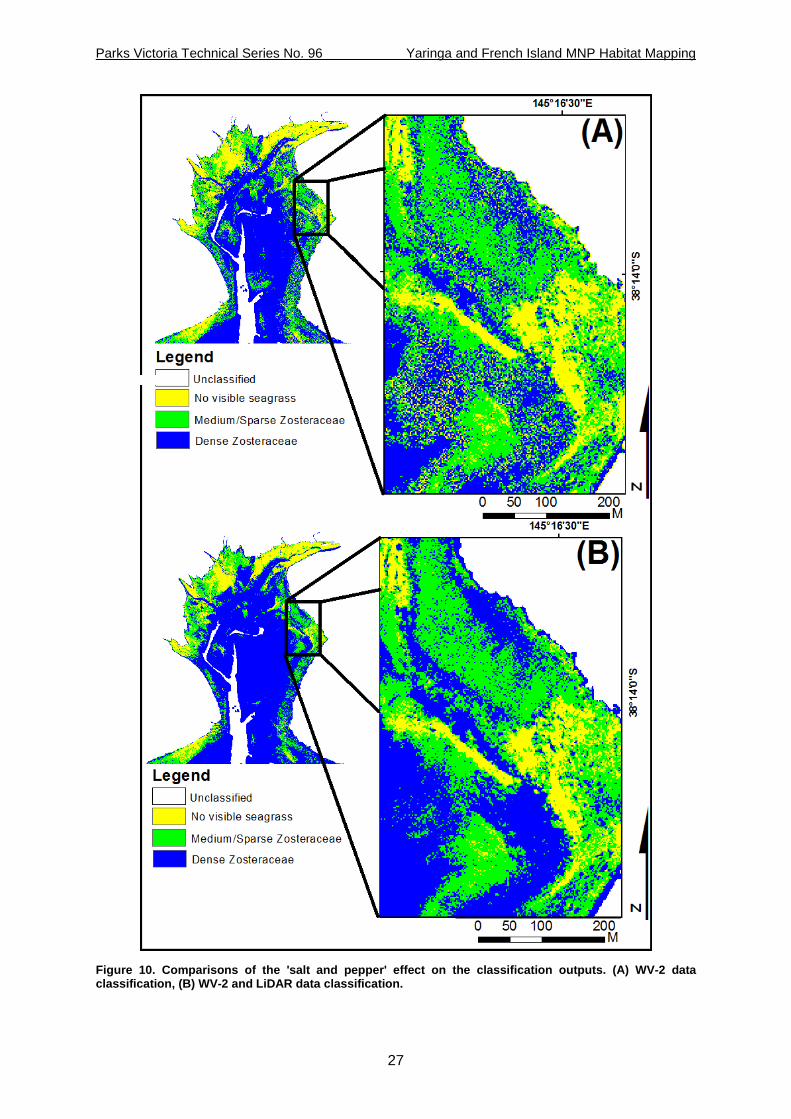
Figure 10. Comparisons of the 'salt and pepper' effect on the classification outputs. (A) WV-2 data classification, (B) WV-2 and LiDAR data classification. ............................................... 27
Figure 11. Yaringa Marine National Park habitat map including mangrove and saltmarsh habitats classified by Boon et al. (2011). ............................................................................. 29
Figure 12. French Island Marine National Park habitat map including mangrove and saltmarsh habitats classified by Boon et al. (2011). ............................................................. 31
Figure 13. WV-2 and LiDAR classification with 40 random patch analyses windows overlayed. ........................................................................................................................... 34
Figure 14. Display of fragmentation between mean patch sizes of Medium/Sparse Zosteraceae classes indicated by the light green patches. .................................................. 35
Figure 15. Mapped comparison of aerial classification (A) and satellite classification (B). . 37
VII
Parks Victoria Technical Series No. 96 Yaringa and French Island MNP Habitat Mapping
Figure 16. Mean in situ spectral responses of surveyed habitats within Yaringa MNP contributing to major habitats mapped in Figure 6 with WV-2s 8-spectral bands overlayed. 39
VIII
Parks Victoria Technical Series No. 96 Yaringa and French Island MNP Habitat Mapping
1. Introduction Parks Victoria manages a system of Marine National Parks and Sanctuaries, Marine and Coastal Parks, Marine Parks and a Marine Reserve which cover approximately 11% of state waters. Seven of these marine protected areas (MPAs) are located in Victorian embayments and include Port Phillip Heads (Swan Bay and Mud Islands), Yaringa, French Island, Churchill Island and Corner Inlet Marine National Parks, and Corner Inlet Marine and Coastal Park. These MPAs contain considerable areas of seagrass, mangrove and saltmarsh habitat and are important sites for a number of species and communities including a number of threatened shorebird species.
While some MPAs in embayments have been well-surveyed other areas are not well-understood. Considerable gaps in marine habitat maps remain for the Marine National Parks (MNPs) in Western Port Bay, parts of Bunurong and most of Wilsons Promontory. Mapping of habitats is important for understanding and communicating the distribution of natural values within MPAs, particularly as the marine environment is not as easily visualised as the terrestrial environment. For management purposes, knowledge of the distribution and extent of habitats is required to more effectively target management activities, including emergency response (e.g. oil spills and invasive species), and monitoring and research. Mapping of marine habitats also provides a baseline inventory, allows the identification of suitable monitoring sites and possible tracking of environmental change, as well as identifying areas vulnerable to particular threats or suitable for recreational activities.
Parks Victoria has recently developed draft goals and objectives, and provisional indicators for several of the MNPs, but does not currently have any monitoring programs in place to assess condition (and management effectiveness) of intertidal and subtidal communities (including seagrass, mangrove and saltmarsh communities). Parks Victoria has identified as a priority the development of a targeted monitoring program for these MNPs. Many of these MNPs are difficult to access and on-ground monitoring may cause considerable impacts on park values including trampling of seagrass, mangrove pneumatophores and saltmarsh, and disturbance of shorebirds and waders. Remote sensing tools provide an opportunity to assess the current condition of intertidal and shallow subtidal habitats in the Victorian embayment’s with minimal or no impact on the values that Parks Victoria is trying to protect.
Parks Victoria established a collaborative research project with Deakin University and the Department of Primary Industries to apply a range of remote sensing methods and different types of aerial imagery to map marine habitats at Yaringa and French Island MNPs. The project also compares the results of the different remote sensing tools and assesses the applicability of these tools for an ongoing remote sensing monitoring program for the MPAs.
The objectives for this project were to:
• Develop an unsupervised habitat map of Yaringa Marine National Park using existing high resolution aerial photography (for use in a Yaringa MNP report card).
• Trial the use of LiDAR data and World-View 2 (WV-2) imagery for developing detailed marine habitat maps (consistent with Victoria’s current marine habitat classification scheme).
• Review and verify the suitability of aerial photography, LiDAR and World-View 2 for classifying the distribution of intertidal and subtidal habitats in Yaringa and French Island Marine National Parks and use as part of an ongoing monitoring program.
1
Parks Victoria Technical Series No. 96 Yaringa and French Island MNP Habitat Mapping
• Compare the utility and suitability of the different remote sensing tools (i.e. high resolution aerial photography and LiDAR/World-View 2) for producing marine habitat maps for the parks.
• Develop recommendations for Standard Operating Procedures for a cost effective ongoing remote sensing monitoring program for Yaringa and French Island Marine National Parks.
2
Parks Victoria Technical Series No. 96 Yaringa and French Island MNP Habitat Mapping
2. Methods
2.1. Study Site
The Yaringa and French Island MNPs are located in the north western region of Western Port (WP), 50 km south-east of Melbourne, Victoria, Australia (Parks Victoria, 2007). Both MNPs are part of the Western Port RAMSAR wetlands, which consist mostly of shallow (<2 m) expanses of intertidal mud and sand flats that are exposed at low tide; making them ideal feeding grounds for a diversity of internationally important wader bird species (Parks Victoria, 2007). Traversing through the intertidal sand and mud flats are a network of incised channels that drain and fill through to WP. The littoral zones are dominated by extensive mangrove forests (Avicennia marina) and saltmarsh habitats, which were recently mapped in detail using high-resolution aerial photography (Boon et al. 2011). However, our understanding of habitat extents in the intertidal and sub-tidal areas of these MNPs is limited and was the focus of this study.
Yaringa MNP covers an area of approximately 980 ha and is located in Watsons Inlet between Watsons Creek and Quail Island (Figure 1). The MNP extends from the high water mark along 20 km of the Watsons Inlet coastline. Its southern boundary is between the shore north of the Yaringa Marina channel and the southern tip of Quail Island. This region is composed almost entirely of mud and sand flats that support seagrass beds of Zosteraceae species. Intermixed within these seagrass beds are small patches of Caulerpaceae and sparse beds of Halophila australis. The deeper channels are predominantly comprised of bare sandy sediment.
French Island MNP covers approximately 2970 ha and was located on the northern side of French Island (Figure 1). It extends offshore from the high water mark for 15 km along the northern shore of French Island, from Scrub to Palmer Points (Figure 1). The northern boundary of the MNP surrounds Barrallier Island and follows North Arm and the Horseshoe Channels aligning with their southern navigation markers (Figure 1). This region is composed almost entirely of mud and sand flats that support seagrass beds of Zosteraceae species. Intermixed within these seagrass beds are small patches of Caulerpaceae and sparse beds of H. australis. The deeper channels are predominantly comprised of bare sand. A small patch of intertidal reef was located in the far north west corner around Barrallier Island.
3
Parks Victoria Technical Series No. 96 Yaringa and French Island MNP Habitat Mapping
Figure 1. Location of the Yaringa and French Island Marine National Parks.
2.2. Ground-truth data collection
A high-definition drop video camera system was deployed to collect habitat data with spatial positions captured by differential GPS. The location of the drop camera deployments were attained using a random design. Using Data Management tools in ESRI’s ArcGIS 10, 228 and 203 deployment localities were randomly assigned to Yaringa and French Island MNP’s, respectively, with a minimal distance of 10 m between drops. Some deployments were haphazardly moved due to difficult access, and to achieve an even distribution across substrata type and bathymetry.
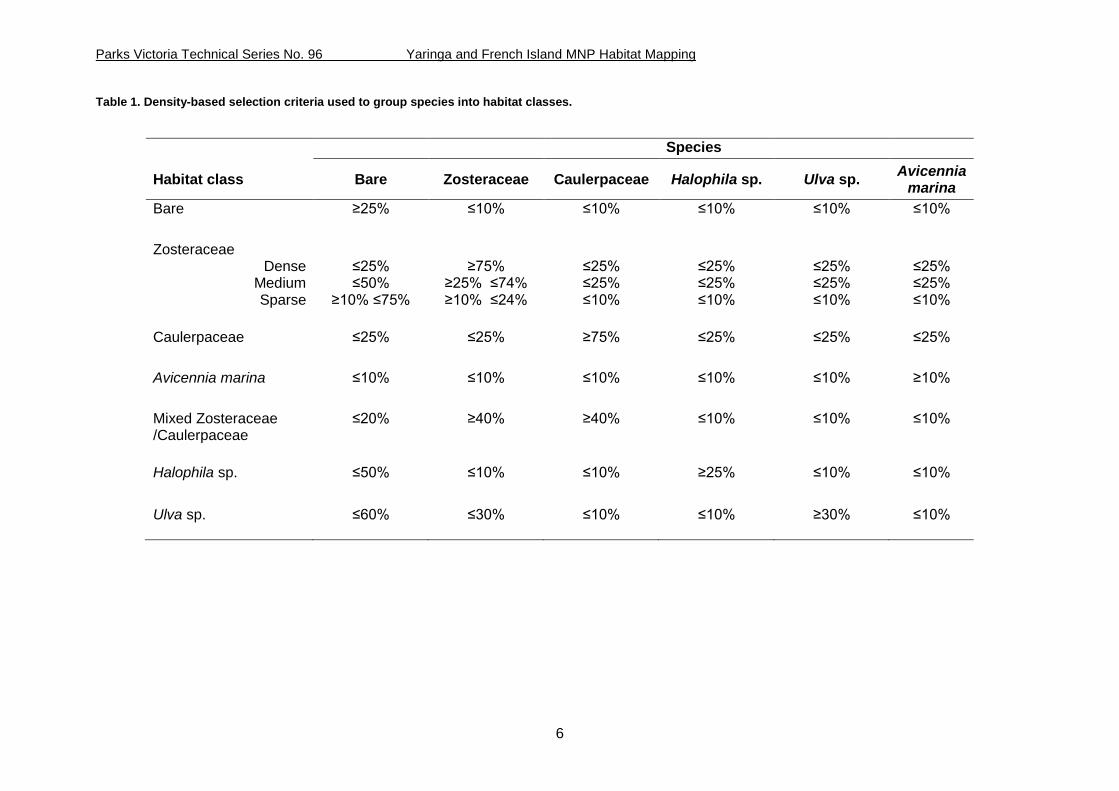
Habitat classes were assigned based on densities of species from each video deployment using Coral Point Count with Excel extensions (CPCe) (http://www.nova.edu/ocean/cpce/). In CPCe 50 random points were overlayed on a standardized image (a 0.25m2 quadrat). Species densities from CPCe were then used to classify the species observed into broader habitat types (Table 1; Figure 2).
These habitat classes were partitioned into training and evaluation datasets. A stratified random sampling method (by dominant habitat class) was used to divide the ground-truth datasets 75% for training regions for the habitat classification process. The remaining 25% of ground–truth data were set aside for a subsequent accuracy assessment.
In addition to the ground-truth points collected via field observation, an additional 44 pseudo-ground-truth points were generated for the channel and turbid areas in French Island MNP.
4
Parks Victoria Technical Series No. 96 Yaringa and French Island MNP Habitat Mapping
These points were haphazardly located using ArcMap 10. This was undertaken to improve classification accuracies by reducing the spectral variability in other habitat classes.
No ground-truthing was available from 2009 when the aerial photography was captured. Previous ground-truthing (Blake and Ball 2001) and recent video observations of marine habitats in nearby areas (Blake et al. 2012) were used to assist in interpreting the 2009 aerial photography.
5
Parks Victoria Technical Series No. 96 Yaringa and French Island MNP Habitat Mapping
Table 1. Density-based selection criteria used to group species into habitat classes.
Species
Habitat class Bare Zosteraceae Caulerpaceae Halophila sp. Ulva sp. Avicennia marina
Bare ≥25% ≤10% ≤10% ≤10% ≤10% ≤10% Zosteraceae
Dense Medium Sparse
≤25% ≤50%
≥10% ≤75%
≥75%
≥25% ≤74% ≥10% ≤24%
≤25% ≤25% ≤10%
≤25% ≤25% ≤10%
≤25% ≤25% ≤10%
≤25% ≤25% ≤10%
Caulerpaceae ≤25% ≤25% ≥75% ≤25% ≤25% ≤25% Avicennia marina ≤10% ≤10% ≤10% ≤10% ≤10% ≥10% Mixed Zosteraceae /Caulerpaceae
≤20% ≥40% ≥40% ≤10% ≤10% ≤10%
Halophila sp. ≤50% ≤10% ≤10% ≥25% ≤10% ≤10% Ulva sp. ≤60% ≤30% ≤10%
≤10%
≥30%
≤10%
6
Parks Victoria Technical Series No. 96 Yaringa and French Island MNP Habitat Mapping
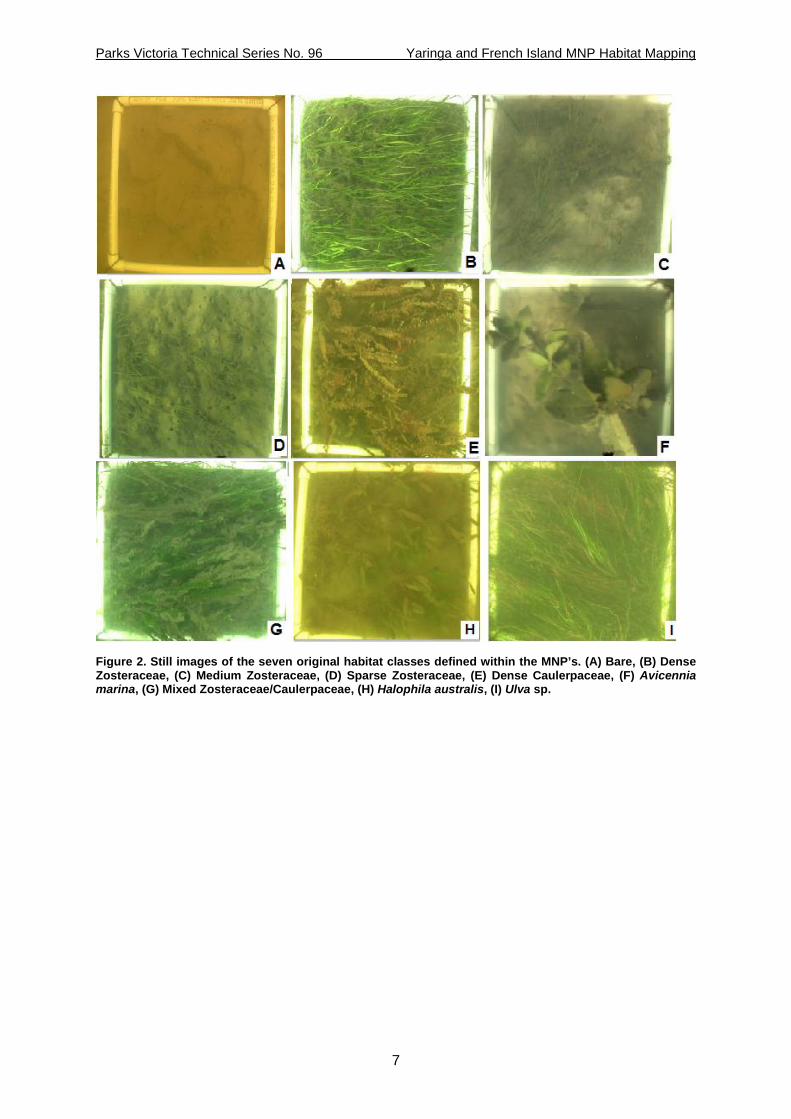
Figure 2. Still images of the seven original habitat classes defined within the MNP’s. (A) Bare, (B) Dense Zosteraceae, (C) Medium Zosteraceae, (D) Sparse Zosteraceae, (E) Dense Caulerpaceae, (F) Avicennia marina, (G) Mixed Zosteraceae/Caulerpaceae, (H) Halophila australis, (I) Ulva sp.
7
Parks Victoria Technical Series No. 96 Yaringa and French Island MNP Habitat Mapping
2.3. Aerial photography imagery
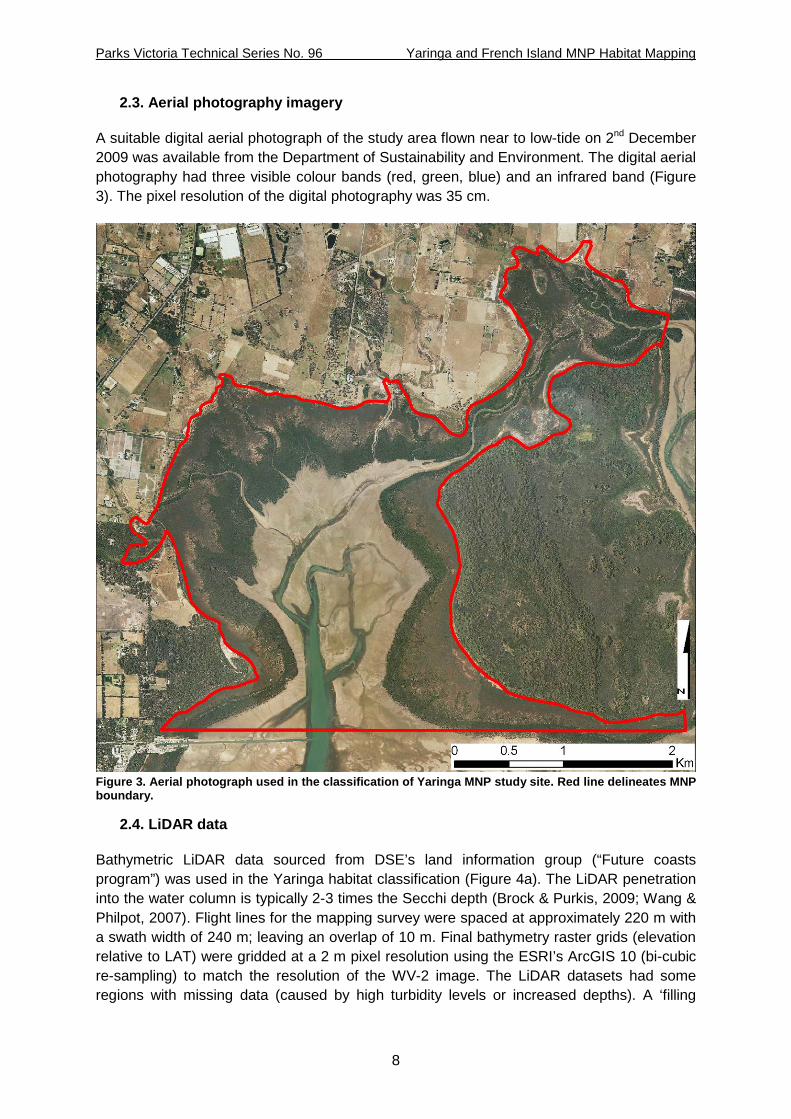
A suitable digital aerial photograph of the study area flown near to low-tide on 2nd December 2009 was available from the Department of Sustainability and Environment. The digital aerial photography had three visible colour bands (red, green, blue) and an infrared band (Figure 3). The pixel resolution of the digital photography was 35 cm.
Figure 3. Aerial photograph used in the classification of Yaringa MNP study site. Red line delineates MNP boundary.
2.4. LiDAR data
Bathymetric LiDAR data sourced from DSE’s land information group (“Future coasts program”) was used in the Yaringa habitat classification (Figure 4a). The LiDAR penetration into the water column is typically 2-3 times the Secchi depth (Brock & Purkis, 2009; Wang & Philpot, 2007). Flight lines for the mapping survey were spaced at approximately 220 m with a swath width of 240 m; leaving an overlap of 10 m. Final bathymetry raster grids (elevation relative to LAT) were gridded at a 2 m pixel resolution using the ESRI’s ArcGIS 10 (bi-cubic re-sampling) to match the resolution of the WV-2 image. The LiDAR datasets had some regions with missing data (caused by high turbidity levels or increased depths). A ‘filling
8
Parks Victoria Technical Series No. 96 Yaringa and French Island MNP Habitat Mapping
holes’ process was used to replace the ‘missing data’ regions with values based on surrounded cells. In addition, any land, saltmarsh and mangrove areas (based on the Victorian saltmarsh study by Boon et al., 2011) were clipped from the bathymetry and spectral datasets to exclude these regions from the classification analysis. Due to large turbidity plumes in French Island MNP, which resulted in reduced coverage, LiDAR was not used in the mapping of habitats in this MNP (Figure 4b).
9
Parks Victoria Technical Series No. 96 Yaringa and French Island MNP Habitat Mapping
Figure 4. LiDAR coverage for Yaringa (A) and French Island (B) MNPs. Red line delineates MNP boundaries. Note LiDAR coverage for French Island MNP was insufficient to be used in the classification process.
A)
B)
10
Parks Victoria Technical Series No. 96 Yaringa and French Island MNP Habitat Mapping
2.5. World-View 2 imagery and atmospheric correction
The World-View 2 (WV-2) satellite imagery (DigitalGlobe, Inc., USA) was acquired close to low-tide on August 20th, 2011 (Figure 5). The WV-2 satellite has eight multispectral bands across the visible and near-infrared wavelengths at a spatial resolution of 2 m. The WV-2 imagery did not cover the far eastern end of the French Island MNP.
To reduce the effects of atmosphere and water column properties the coastal Waters and Ocean MODTRAN-4 Based Atmospheric correction (‘c-WOMBAT-c’) procedure (Dekker et al., 2005) was implemented at CSIRO Land & Water Environmental Earth Observation Group to atmospherically correct the multispectral WV-2 imagery. This process corrects for particulates in the atmosphere (e.g. water vapour, smoke) and the water column (e.g. suspended organic matter, light attenuation in the water column). For a detailed description of this process see (Dekker et al. 2005). To allow atmospheric correction of the WV-2 image, a total of 199 geo-located spectral readings of the various species present (both terrestrial and aquatic) in Yaringa MNP were collected using an ASD FieldSpec® HandHeld spectroradiometer. Visual analysis of these spectral signatures also provided an opportunity to determine the spectral separability of habitat classes defined and provides a resource for future assessment of habitat extents in this region.
11
Parks Victoria Technical Series No. 96 Yaringa and French Island MNP Habitat Mapping
Figure 5. WorldView-II imagery used in the classification of Yaringa (A) and French Island (B) MNPs. Insert in panel B shows extensive turbidity plumes in the east of the MNP. Red line delineates MNP boundaries.
A)
B)
12
Parks Victoria Technical Series No. 96 Yaringa and French Island MNP Habitat Mapping
2.6. Habitat map classification
2.6.1. Aerial imagery classification An automated image processing technique combined with manual editing was applied to map seagrass cover from digital aerial photography for Yaringa MNP.
Unsupervised classification is a method to transform a digital image into a thematic map. An unsupervised classification defines those groups of pixels with a similar spectral signature and which are assumed to represent the same type of habitat (Anon, 1998). An unsupervised classification was applied to each aerial photograph mapping region using all four bands (i.e. red, green, blue, infrared). The output from this process was a single band image with 15 pixel values representing the number of groups or categories defined by the unsupervised classification.
A low pass filter was applied to smooth out “noise” in the classified image. The classified image was then overlayed on the aerial imagery to allow a visual comparison. The pixel values within the classified image were assigned to a thematic classification based on the dominant habitat type as follows:
Mangrove.
Bare intertidal/subtidal sediment (no visible seagrass).
Sparse seagrass (more sediment than seagrass visible within a seagrass bed).
Medium-dense seagrass (more seagrass than sediment visible in a seagrass bed).
Undefined or deep water (seabed not clearly visible in image).
The final phase of the mapping was to convert the classified raster image to a vector layer with a smoothing algorithm in ArcGIS. The Eliminate function in ArcGIS was then used to remove all polygons with an area <2 m2 which was assessed to be the smallest habitat feature which could be consistently differentiated from the aerial photography.
The unsupervised classification mapping approach succeeded in accurately differentiating most of the seagrass habitat boundaries. Any classification anomalies or errors from the automated mapping were fixed by manually correcting the habitat boundaries in ArcGIS.
2.6.2. Satellite imagery classification The process was undertaken in ENVI 4.7 and provided complete coverage of both study sites. Due to implications with the classification falsely classifying the main deep channels as seagrass (due to the dark turbid waters having a similar spectral response to the actual seagrass), that we know were bare from the ground truth data, the main channel systems were masked out of the classification. For the Yaringa classification, the masked LiDAR and 8-bands from the WV-2 imagery were stacked within ENVI 4.7. These stacked datasets were then combined with 75 % of the ground-truth data to enable prediction of habitats. For French Island, only the 8-bands from the WV-2 imagery were used in the classification. A Quick Unbiased Efficient Statistical Tree approach (QUEST; Loh & Shih, 1997) was applied to predict the spatial distribution of habitat classes based on the ground-truth observations. The QUEST classification was executed using Rule Gen v1.02 extension in ENVI 4.7.
2.7. Error assessment The remaining 25 % of ground-truth observations (independent of those used to develop the classification) were compared with the derived WV-2 thematic classification to produce two
13
Parks Victoria Technical Series No. 96 Yaringa and French Island MNP Habitat Mapping
forms of error assessment. First, the results were used to construct error matrices showing map accuracy measures for individual classes. Second, overall accuracy was derived by calculating the percentage of correctly classified pixels. The Kappa coefficient of agreement (Khat) was used to derive a measure of accuracy between the classified map and the independent ground-truth data. By including errors of omission and commission in the calculations, kappa analysis takes into account errors expected by chance (Foody, 2002; Jensen, 2005). The Khat coefficient of agreement gives a more accurate overall representation of the accuracy of the thematic mapping exercise and allows for better comparisons with error matrices derived from other survey areas. Fleiss’ (1981) guidelines for characterizing kappa values was used in this research: > 0.75 as excellent, 0.40-0.75 as fair to good, and <0.40 as poor.
The differences between error matrices for the WV-2 only and the WV-2 and LiDAR combined classifications was assessed using the kappa Error Matrix Analysis Module described in (Congalton, 1991; Congalton & Green, 2009). A test score of > 1.96 suggest that the two error matrices are significantly different at α < 0.05 (Congalton & Green, 2009).
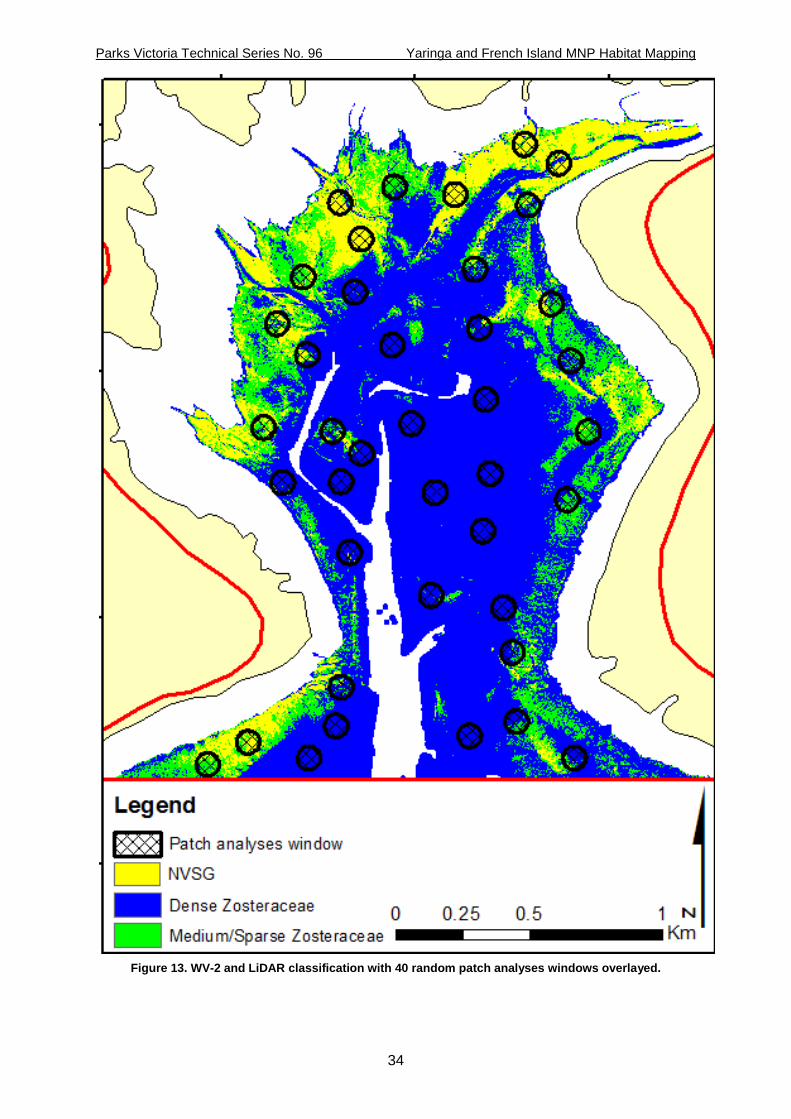
2.8. Analysis of habitat fragmentation within Yaringa MNP Forty patch analysis windows were randomly allocated across the WV-2 and LiDAR classification of Yaringa MNP to investigate the spatial fragmentation of habitat classes. The random patches were generated using ESRI’s ArcGIS random point generator. The points were assigned with a 44 m buffer, consistent with the recommendations set out by O’Neill et al. (1996) on the basis that they were large enough to contain the 98th percentile of seagrass patch size. Patch analysis took place by the Patchgrid extension in ESRI’s ArcGIS 10. The habitats present in each of the 40 random patch analysis windows were quantified against four landscape pattern indices (LPIs) (i.e. mean patch size; MPS, number of patches; NumP, edge density; ED, patch size standard deviation; PSSD) (McGarigal et al. 2012). The MPS and the NumP were both chosen as these are two of the most commonly used and simplest LPIs when quantifying habitat fragmentation (Langford et al. 2006; Sleeman et al. 2005). The MPS at the class level is a function of the number of patches in the class and the total class area, whilst the NumP is a calculation of the number of patches across a single habitat and can serve as a general index of spatial heterogeneity across an entire landscape. The ED standardizes patch edges to a per unit area basis that facilitates comparisons among landscapes of varying size, whilst PSSD is a measure of absolute variation, that is a function of the mean patch size and the difference in patch size among patches.
For each LPI, a permutational multivariate of analysis of variance (PERMANOVA) along with pair-wise comparison was used in PERMANOVA + addon in PRIMER 6 (Anderson et al 2008) to assess the differences between the three habitat classes.
2.9. Spectral differences in subtidal and intertidal habitats Overlaying the spectral bands of the WV-2 with the mean spectral signatures enabled further investigation into the discriminatory ability of this satellite sensor in mapping intertidal and subtidal habitats. In addition to overlaying the spectral bands of the WV-2 with the mean spectral signatures, a spectral separability analysis was undertaken. This computes the spectral separability between selected ground-truth classes for a given satellite image. These values range from 0 to 2.0 and indicate how well the selected ground-truth classes are statistically separate. Values greater than 1.9 indicate that the ground-truth classes have
14
Parks Victoria Technical Series No. 96 Yaringa and French Island MNP Habitat Mapping
good separability. Ground-truth classes with lower separability values (i.e. less than 1), suggests that there is very little spectral difference between them.
2.10. Comparison of classification techniques As a result of slight differences in habitat classes between the aerial (e.g. Medium/Dense Zosteraceae, Sparse Zosteraceae and Bare) and satellite (e.g. Dense Zosteraceae, Medium/Sparse Zosteraceae and Bare) classifications, both classifications will be regrouped to “seagrass” habitat and NVSG. This was also undertaken to reduce the effects of likely temporal differences in the spatial distribution of the seagrass habitats mapped from the 2009 aerial photograph and the ground-truth collected in the current project. Both classifications were assessed based on the latest ground-truth data available in this research to create error matrices, comparing the overall accuracies of both methods. Areas of mapped habitats were also compared.
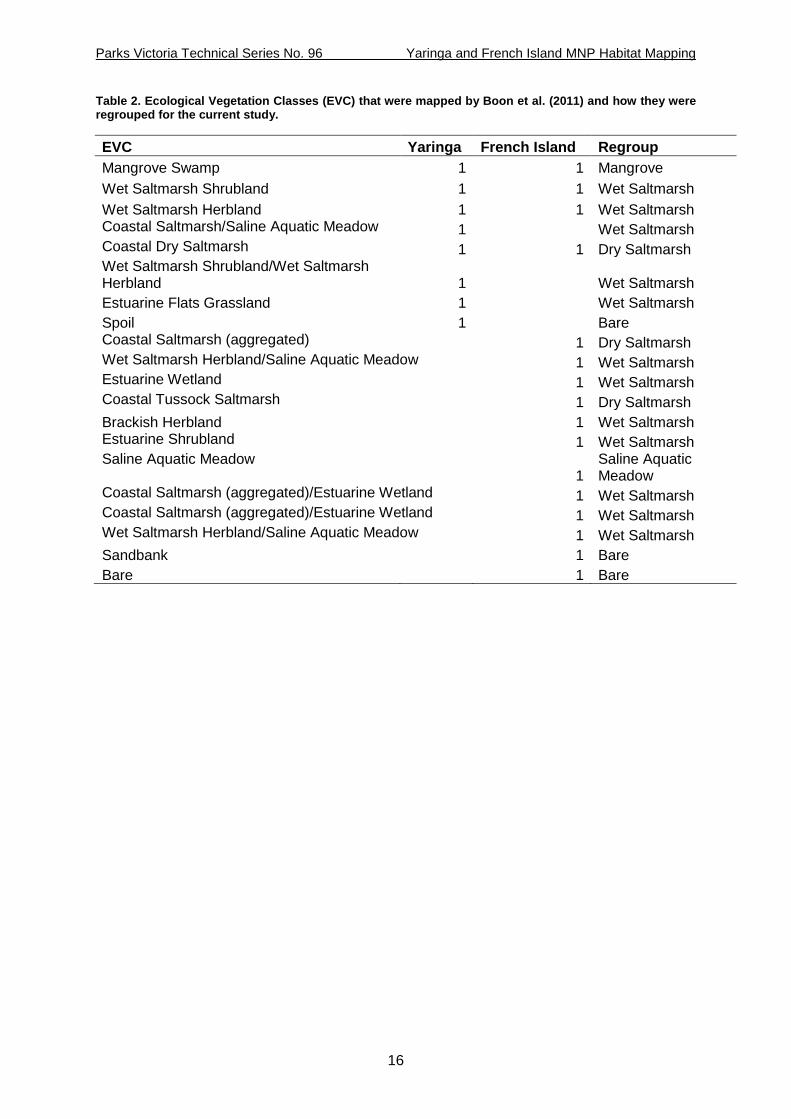
2.11. Incorporation of previously mapped habitats The final intertidal and subtidal habitat classifications for each study locality were combined with the saltmarsh and mangrove datasets mapped by Boon et al. (2011). These classes were regrouped based on the same criteria used in Monk et al. (2011) to reduce the large number of small saltmarsh classes (Table 2).
15
Parks Victoria Technical Series No. 96 Yaringa and French Island MNP Habitat Mapping
Table 2. Ecological Vegetation Classes (EVC) that were mapped by Boon et al. (2011) and how they were regrouped for the current study.
EVC Yaringa French Island Regroup Mangrove Swamp 1 1 Mangrove Wet Saltmarsh Shrubland 1 1 Wet Saltmarsh Wet Saltmarsh Herbland 1 1 Wet Saltmarsh Coastal Saltmarsh/Saline Aquatic Meadow 1
Wet Saltmarsh
Coastal Dry Saltmarsh 1 1 Dry Saltmarsh Wet Saltmarsh Shrubland/Wet Saltmarsh Herbland 1
Wet Saltmarsh
Estuarine Flats Grassland 1
Wet Saltmarsh Spoil 1
Bare
Coastal Saltmarsh (aggregated)
1 Dry Saltmarsh Wet Saltmarsh Herbland/Saline Aquatic Meadow 1 Wet Saltmarsh Estuarine Wetland
1 Wet Saltmarsh
Coastal Tussock Saltmarsh
1 Dry Saltmarsh Brackish Herbland
1 Wet Saltmarsh
Estuarine Shrubland
1 Wet Saltmarsh Saline Aquatic Meadow
1
Saline Aquatic Meadow
Coastal Saltmarsh (aggregated)/Estuarine Wetland 1 Wet Saltmarsh Coastal Saltmarsh (aggregated)/Estuarine Wetland 1 Wet Saltmarsh Wet Saltmarsh Herbland/Saline Aquatic Meadow 1 Wet Saltmarsh Sandbank
1 Bare
Bare
1 Bare
16
Parks Victoria Technical Series No. 96 Yaringa and French Island MNP Habitat Mapping
3. Results
3.1. Ground-truthing
For Yaringa MNP a total of 228 ground-truth drops were surveyed (Figure 6) over two days of sampling (21st and 24th of May, 2012) with 207 drops successfully classified. Some sampling drops were unclassifiable due to poor visibility, camera falling over or poor image quality.
For French Island a total of 203 ground-truth video drops were surveyed (Figure 7) over two days of sampling (3rd and 4th of July, 2012) with 179 drops successfully classified. The majority of unclassified drops at French Island were located in the eastern end of the MNP which experienced high turbidity levels in the water column. No deployments were undertaken at the far eastern end of the MNP as the WV-2 imagery did not cover this region.
Preliminary grouping of these habitat classes resulted in a total of seven and six habitat classes for Yaringa and French Island MNPs, respectively. However, some of these habitat classes were too small. As a result, small sample sizes (<10) were regrouped into three and five classes for Yaringa and French Island MNPs, respectively (Table 3). The dense Caulerpaceae, A. marina and bare habitat classes were grouped together as no visible seagrass (NVSG). Likewise, medium Zosteraceae, sparse Zosteraceae and mixed Zosteraceae/Caulerpaceae classes were grouped together to form a medium/sparse Zosteraceae class. The NVSG habitat class was devoid of any visible Zosteraceae (i.e. <10 % cover). However, in some instances other species (e.g. Caulerpaceae and A. marina) were observed within images at a range of densities. The Zosteraceae habitat classes were split into two densities; dense and medium/sparse.
17
Parks Victoria Technical Series No. 96 Yaringa and French Island MNP Habitat Mapping
Figure 6. Map of Yaringa MNP study site with classified ground-truth points as grouped by habitat classes. NVSG = No-visible seagrass.
18
Parks Victoria Technical Series No. 96 Yaringa and French Island MNP Habitat Mapping
Figure 7. Map of French Island MNP study site with classified ground-truth points as grouped by habitat classes. Note: no deployments were undertaken at the eastern end of the MNP as there was no WV-2 imagery available for this region.
Unclassified
19
Parks Victoria Technical Series No. 96 Yaringa and French Island MNP Habitat Mapping
Table 3. Original habitat classes with sample size (number of localities classified as that habitat) and regrouped habitat classes with sample size for Yaringa and French Island MNPs.
Original Habitat Classes Regrouped Habitat Classes Class Yaringa Count French Island
Count Class Yaringa Count French Island Count
Bare 38 41 No-visible seagrass 48 ** Dense Zosteraceae 107 89 Dense Zosteraceae 107 ** Medium Zosteraceae 39 Medium/Sparse
Zosteraceae 52 **
Sparse Zosteraceae 10 Intertidal Sediment * 22 Medium/Sparse Zosteraceae * 18 Subtidal Sediment * 19 Caulerpaceae 9 25 Intertidal Vegetation * 68 Halophila australis * Subtidal Vegetation * 70 Ulva sp. * 2 Unclassified * 44 Avicennia marina 1 4 Mixed Zosteraceae/Caulerpaceae
3
Total 207 179 Total 207 223
1 No-visible seagrass in the regrouped habitat class comprises of Bare, Dense Caulerpaceae and A. marina from the original habitat class. The mixed Zosteraceae/Caulerpaceae was grouped with the Medium/Sparse Zosteraceae. Inter/Subtidal Sediments consist of Bare habitat classes, whilst vegetation comprises of Dense Zosteraceae, Medium/Sparse Zosteraceae, Dense Caulerpaceae, Halophila spp. and Ulva spp. in the original habitat classes. Deep water was manually generated based on the deep water channels in the WV-2 imagery after ground-truthing in July. Differentiation between inter/subtidal classes was calculated based on the 2011 WV-2 imagery.* Not used at Yaringa. ** Not used at French Island.
20
Parks Victoria Technical Series No. 96 Yaringa and French Island MNP Habitat Mapping
3.2. Classification results
3.2.1. Unsupervised classification of Yaringa Marine National Park based on the 2009 aerial photograph
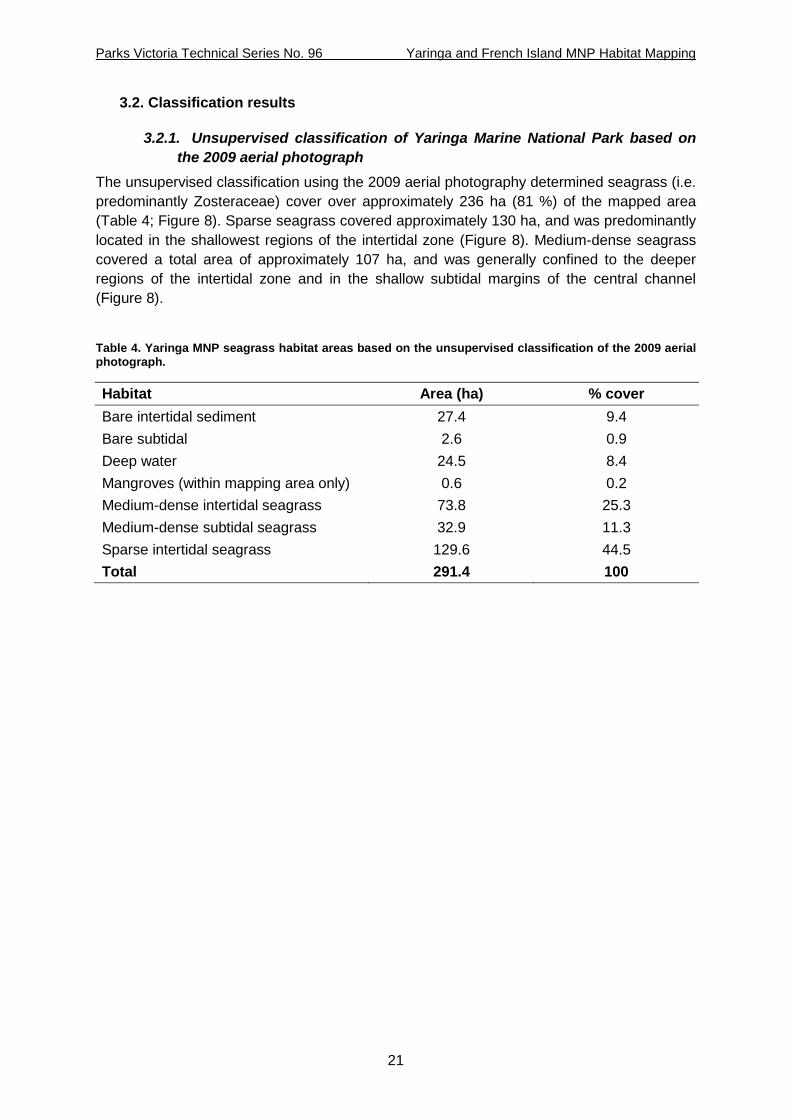
The unsupervised classification using the 2009 aerial photography determined seagrass (i.e. predominantly Zosteraceae) cover over approximately 236 ha (81 %) of the mapped area (Table 4; Figure 8). Sparse seagrass covered approximately 130 ha, and was predominantly located in the shallowest regions of the intertidal zone (Figure 8). Medium-dense seagrass covered a total area of approximately 107 ha, and was generally confined to the deeper regions of the intertidal zone and in the shallow subtidal margins of the central channel (Figure 8).
Table 4. Yaringa MNP seagrass habitat areas based on the unsupervised classification of the 2009 aerial photograph.
Habitat Area (ha) % cover Bare intertidal sediment 27.4 9.4 Bare subtidal 2.6 0.9 Deep water 24.5 8.4 Mangroves (within mapping area only) 0.6 0.2 Medium-dense intertidal seagrass 73.8 25.3 Medium-dense subtidal seagrass 32.9 11.3 Sparse intertidal seagrass 129.6 44.5 Total 291.4 100
21
Parks Victoria Technical Series No. 96 Yaringa and French Island MNP Habitat Mapping
Figure 8. Yaringa MNP seagrass habitat mapping based on the unsupervised classification of the 2009 aerial photograph.
22
Parks Victoria Technical Series No. 96 Yaringa and French Island MNP Habitat Mapping
3.2.2. Supervised classifications of Yaringa Marine National Park based on LiDAR and WV-2 data.
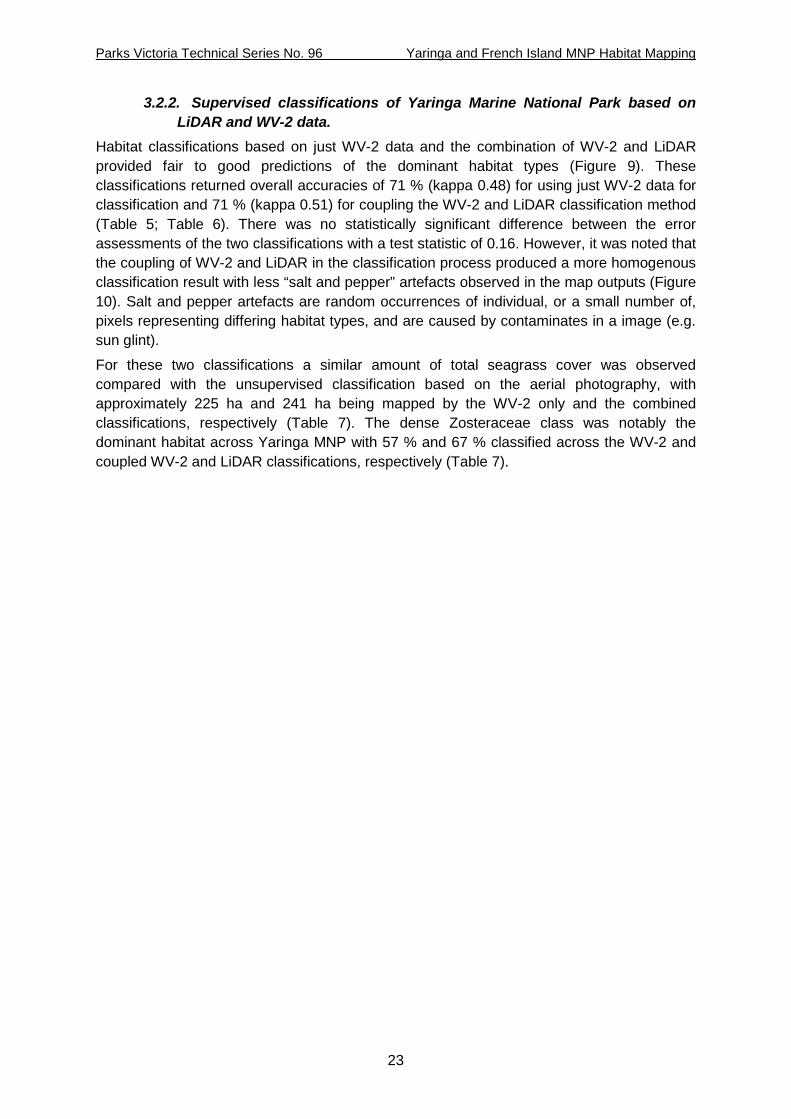
Habitat classifications based on just WV-2 data and the combination of WV-2 and LiDAR provided fair to good predictions of the dominant habitat types (Figure 9). These classifications returned overall accuracies of 71 % (kappa 0.48) for using just WV-2 data for classification and 71 % (kappa 0.51) for coupling the WV-2 and LiDAR classification method (Table 5; Table 6). There was no statistically significant difference between the error assessments of the two classifications with a test statistic of 0.16. However, it was noted that the coupling of WV-2 and LiDAR in the classification process produced a more homogenous classification result with less “salt and pepper” artefacts observed in the map outputs (Figure 10). Salt and pepper artefacts are random occurrences of individual, or a small number of, pixels representing differing habitat types, and are caused by contaminates in a image (e.g. sun glint).
For these two classifications a similar amount of total seagrass cover was observed compared with the unsupervised classification based on the aerial photography, with approximately 225 ha and 241 ha being mapped by the WV-2 only and the combined classifications, respectively (Table 7). The dense Zosteraceae class was notably the dominant habitat across Yaringa MNP with 57 % and 67 % classified across the WV-2 and coupled WV-2 and LiDAR classifications, respectively (Table 7).
23
Parks Victoria Technical Series No. 96 Yaringa and French Island MNP Habitat Mapping
Figure 9. Habitat classification for Yaringa MNP using (A) just WV-2 data and (B) WV-2 and LiDAR data
24
Parks Victoria Technical Series No. 96 Yaringa and French Island MNP Habitat Mapping
Table 5. Error matrix for habitat classes mapped in Yaringa Marine National Park from the just WV-2 data validated against the 25 % of the ground truth data used for independent assessment. Overall accuracy = 71.43 %; Kappa = 0.48. NVSG = no-visible seagrass.
Ground-truth Mapped class NVSG Dense
Zosteraceae Medium/Sparse Zosteraceae
Row total
NVSG 6 0 1 7 Dense Zosteraceae 2 22 5 29 Medium/Sparse Zosteraceae
2 4 7 13
Column Total 10 26 13 49 Table 6. Error matrix for habitat classes mapped in Yaringa Marine National Park from the WV-2 and LiDAR data validated against the 25 % of the ground truth data used for independent assessment. Overall accuracy = 71.43 %; Kappa = 0.51. NVSG = No-visible seagrass
Ground-truth Mapped class NVSG Dense Zosteraceae Medium/Sparse
Zosteraceae Row total
NVSG 6 0 0 6 Dense Zosteraceae 2 24 8 34 Medium/Sparse Zosteraceae 2 2 5 9 Column Total 10 26 13 49
25
Parks Victoria Technical Series No. 96 Yaringa and French Island MNP Habitat Mapping
Table 7. Area of classified habitat classes based on just WV-2 and WV-2 with LiDAR classification. NVSG = No visible seagrass
WV-2 WV-2 and LiDAR
Habitat class Area (ha) Area % Area (ha) Area %
NVSG 54.5 19.5 38.7 13.9
Dense Zosteraceae 160.2 57.3 187.9 67.2
Medium/Sparse Zosteraceae 65.0 23.2 53.1 19.0
26
Parks Victoria Technical Series No. 96 Yaringa and French Island MNP Habitat Mapping
Figure 10. Comparisons of the 'salt and pepper' effect on the classification outputs. (A) WV-2 data classification, (B) WV-2 and LiDAR data classification.
27
Parks Victoria Technical Series No. 96 Yaringa and French Island MNP Habitat Mapping
3.2.3. Complete map of Yaringa Marine National Park A complete-coverage habitat map was produced by combining the classification based on the WV-2 and LiDAR with the mangrove and saltmarsh spatial datasets from Boon et al. (2011) (Figure 11). Overall the littoral zones of Yaringa MNP were dominated by mangroves, with land-ward areas covered in large expanses of wet saltmarsh, covering a combined area of 612 ha (~62 % of the MNP; Table 8). Isolated areas of dry saltmarsh were also mapped in the northwest and northeast of the MNP. As mentioned above, the intertidal and subtidal regions of Yaringa MNP were dominated by Zosteraceae, covering a combined area of 241 ha (~25 % of the MNP; Table 8).
28
Parks Victoria Technical Series No. 96 Yaringa and French Island MNP Habitat Mapping
Figure 11. Yaringa Marine National Park habitat map including mangrove and saltmarsh habitats classified by Boon et al. (2011).
29
Parks Victoria Technical Series No. 96 Yaringa and French Island MNP Habitat Mapping
Table 8. Area of classified habitats in Yaringa Marine National Park.
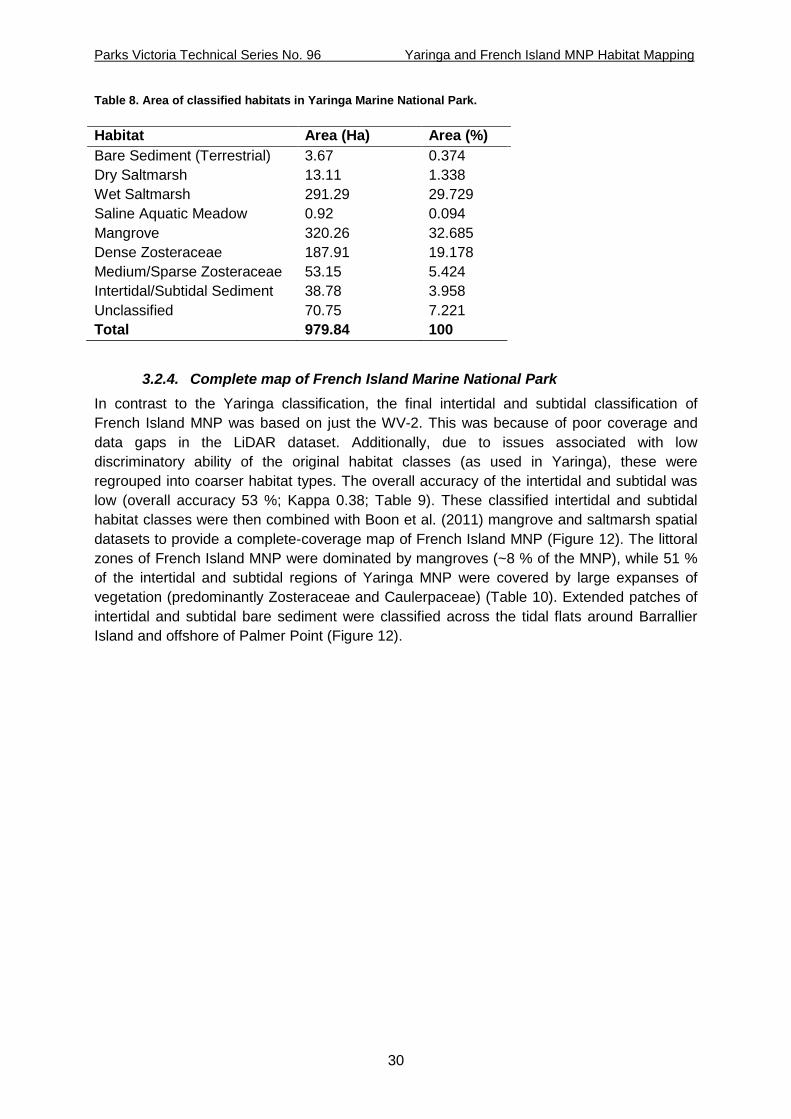
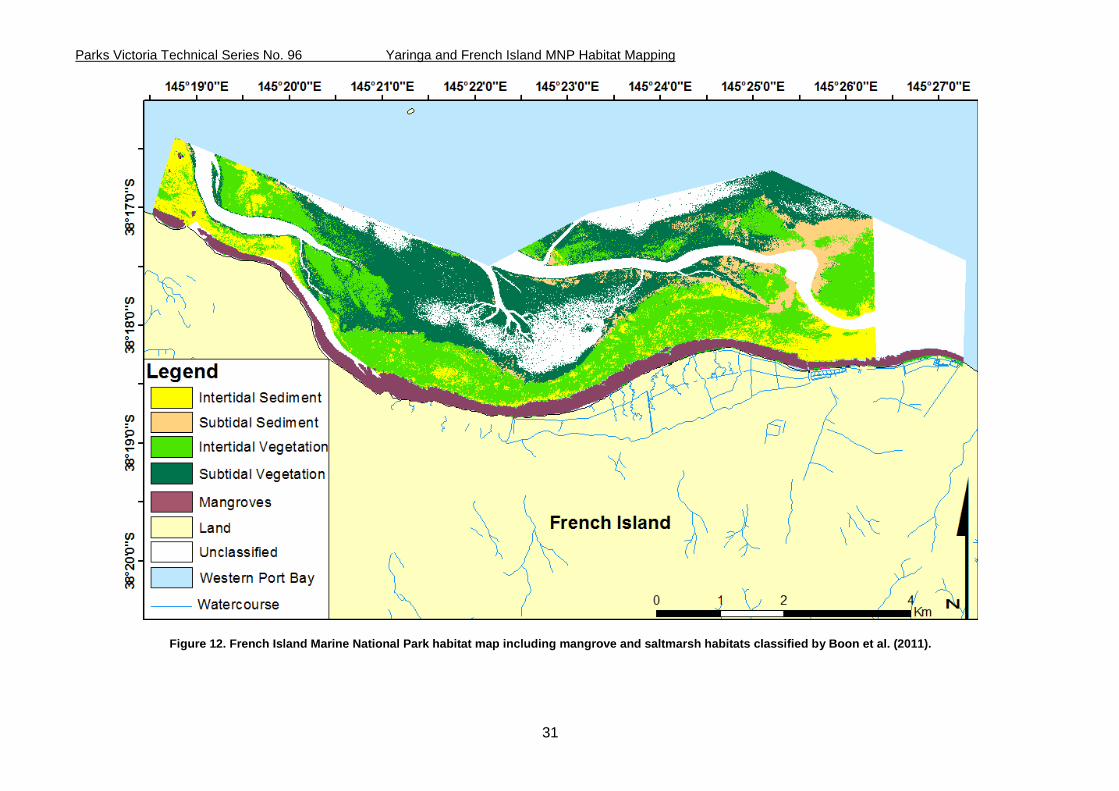
3.2.4. Complete map of French Island Marine National Park In contrast to the Yaringa classification, the final intertidal and subtidal classification of French Island MNP was based on just the WV-2. This was because of poor coverage and data gaps in the LiDAR dataset. Additionally, due to issues associated with low discriminatory ability of the original habitat classes (as used in Yaringa), these were regrouped into coarser habitat types. The overall accuracy of the intertidal and subtidal was low (overall accuracy 53 %; Kappa 0.38; Table 9). These classified intertidal and subtidal habitat classes were then combined with Boon et al. (2011) mangrove and saltmarsh spatial datasets to provide a complete-coverage map of French Island MNP (Figure 12). The littoral zones of French Island MNP were dominated by mangroves (~8 % of the MNP), while 51 % of the intertidal and subtidal regions of Yaringa MNP were covered by large expanses of vegetation (predominantly Zosteraceae and Caulerpaceae) (Table 10). Extended patches of intertidal and subtidal bare sediment were classified across the tidal flats around Barrallier Island and offshore of Palmer Point (Figure 12).
Habitat Area (Ha) Area (%) Bare Sediment (Terrestrial) 3.67 0.374 Dry Saltmarsh 13.11 1.338 Wet Saltmarsh 291.29 29.729 Saline Aquatic Meadow 0.92 0.094 Mangrove 320.26 32.685 Dense Zosteraceae 187.91 19.178 Medium/Sparse Zosteraceae 53.15 5.424 Intertidal/Subtidal Sediment 38.78 3.958 Unclassified 70.75 7.221 Total 979.84 100
30
Parks Victoria Technical Series No. 96 Yaringa and French Island MNP Habitat Mapping
Figure 12. French Island Marine National Park habitat map including mangrove and saltmarsh habitats classified by Boon et al. (2011).
31
Parks Victoria Technical Series No. 96 Yaringa and French Island MNP Habitat Mapping
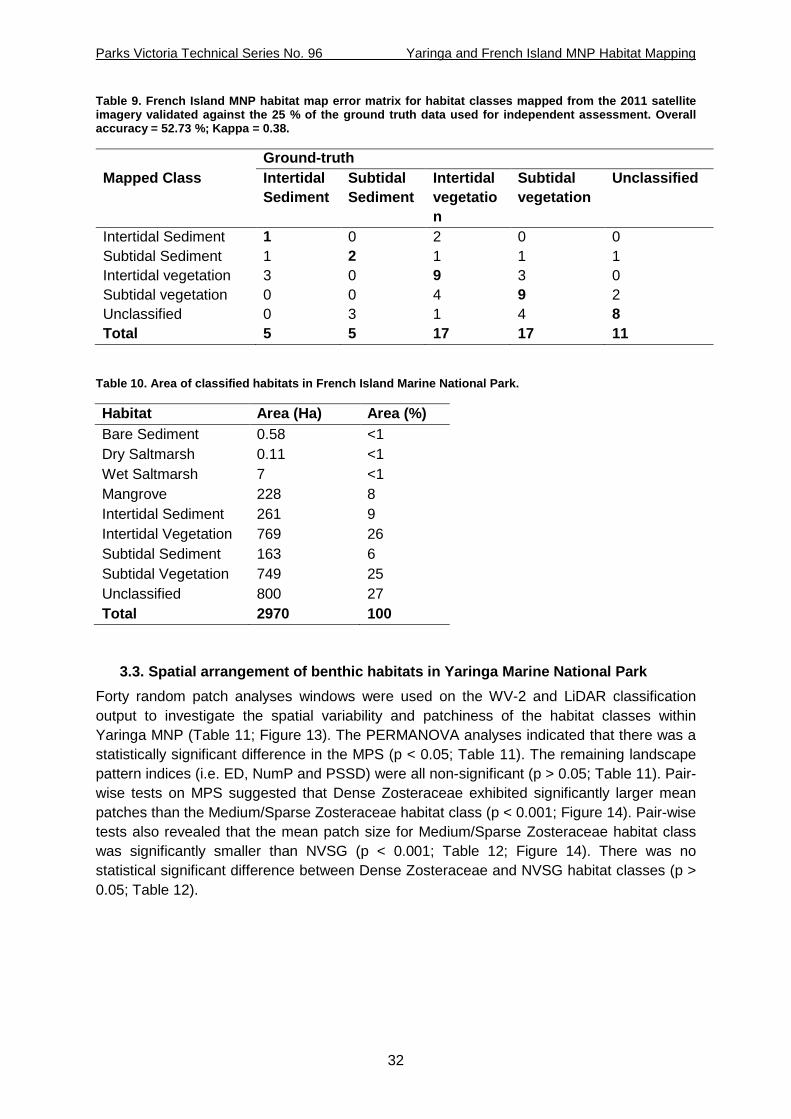
Table 9. French Island MNP habitat map error matrix for habitat classes mapped from the 2011 satellite imagery validated against the 25 % of the ground truth data used for independent assessment. Overall accuracy = 52.73 %; Kappa = 0.38.
Ground-truth Mapped Class Intertidal
Sediment Subtidal Sediment
Intertidal vegetation
Subtidal vegetation
Unclassified
Intertidal Sediment 1 0 2 0 0 Subtidal Sediment 1 2 1 1 1 Intertidal vegetation 3 0 9 3 0 Subtidal vegetation 0 0 4 9 2 Unclassified 0 3 1 4 8 Total 5 5 17 17 11
Table 10. Area of classified habitats in French Island Marine National Park.
Habitat Area (Ha) Area (%) Bare Sediment 0.58 <1 Dry Saltmarsh 0.11 <1 Wet Saltmarsh 7 <1 Mangrove 228 8 Intertidal Sediment 261 9 Intertidal Vegetation 769 26 Subtidal Sediment 163 6 Subtidal Vegetation 749 25 Unclassified 800 27 Total 2970 100
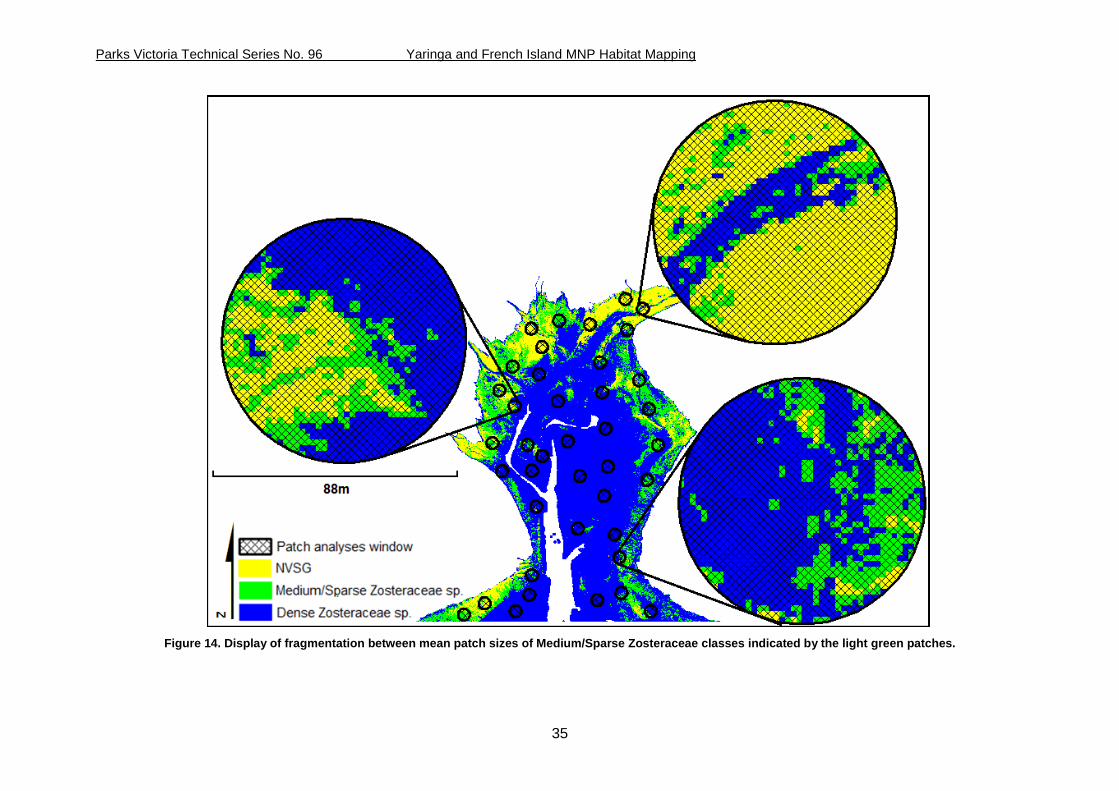
3.3. Spatial arrangement of benthic habitats in Yaringa Marine National Park Forty random patch analyses windows were used on the WV-2 and LiDAR classification output to investigate the spatial variability and patchiness of the habitat classes within Yaringa MNP (Table 11; Figure 13). The PERMANOVA analyses indicated that there was a statistically significant difference in the MPS (p < 0.05; Table 11). The remaining landscape pattern indices (i.e. ED, NumP and PSSD) were all non-significant (p > 0.05; Table 11). Pair-wise tests on MPS suggested that Dense Zosteraceae exhibited significantly larger mean patches than the Medium/Sparse Zosteraceae habitat class (p < 0.001; Figure 14). Pair-wise tests also revealed that the mean patch size for Medium/Sparse Zosteraceae habitat class was significantly smaller than NVSG (p < 0.001; Table 12; Figure 14). There was no statistical significant difference between Dense Zosteraceae and NVSG habitat classes (p > 0.05; Table 12).
32
Parks Victoria Technical Series No. 96 Yaringa and French Island MNP Habitat Mapping
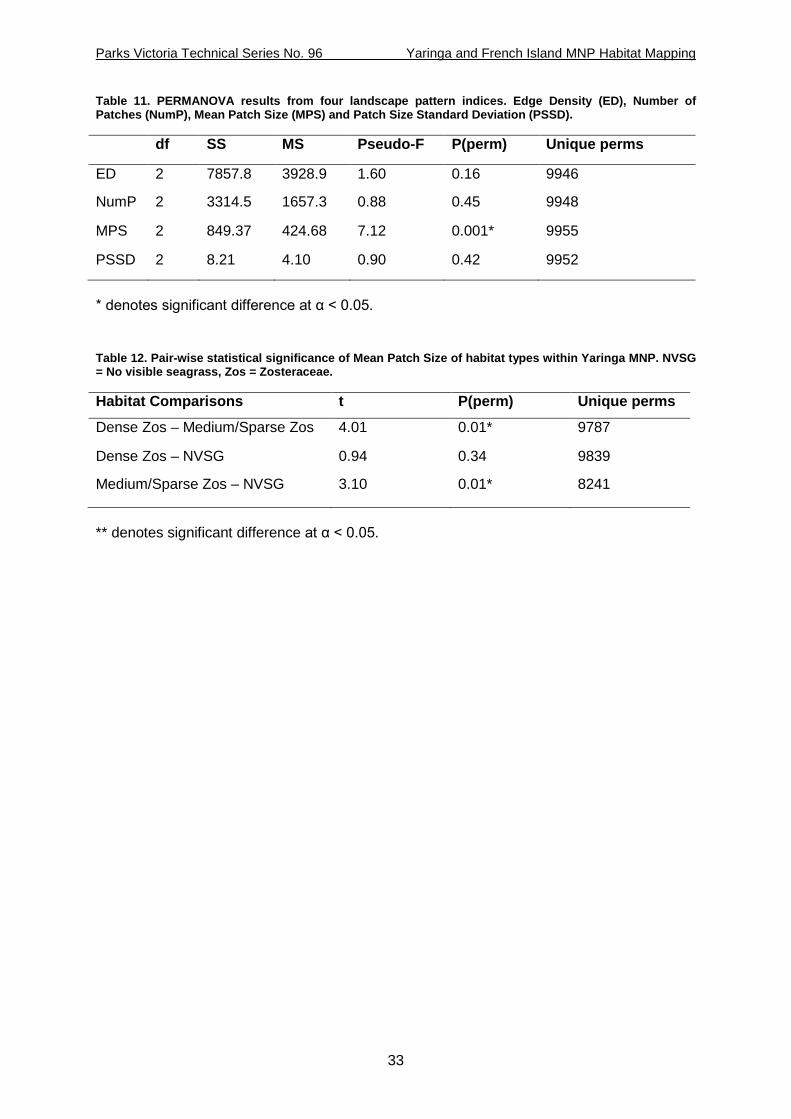
Table 11. PERMANOVA results from four landscape pattern indices. Edge Density (ED), Number of Patches (NumP), Mean Patch Size (MPS) and Patch Size Standard Deviation (PSSD).
df SS MS Pseudo-F P(perm) Unique perms
ED 2 7857.8 3928.9 1.60 0.16 9946
NumP 2 3314.5 1657.3 0.88 0.45 9948
MPS 2 849.37 424.68 7.12 0.001* 9955
PSSD 2 8.21 4.10 0.90 0.42 9952
* denotes significant difference at α < 0.05.
Table 12. Pair-wise statistical significance of Mean Patch Size of habitat types within Yaringa MNP. NVSG = No visible seagrass, Zos = Zosteraceae.
Habitat Comparisons t P(perm) Unique perms
Dense Zos – Medium/Sparse Zos 4.01 0.01* 9787
Dense Zos – NVSG 0.94 0.34 9839
Medium/Sparse Zos – NVSG 3.10 0.01* 8241
** denotes significant difference at α < 0.05.
33
Parks Victoria Technical Series No. 96 Yaringa and French Island MNP Habitat Mapping
Figure 13. WV-2 and LiDAR classification with 40 random patch analyses windows overlayed.
34
Parks Victoria Technical Series No. 96 Yaringa and French Island MNP Habitat Mapping
Figure 14. Display of fragmentation between mean patch sizes of Medium/Sparse Zosteraceae classes indicated by the light green patches.
35
Parks Victoria Technical Series No. 96 Yaringa and French Island MNP Habitat Mapping
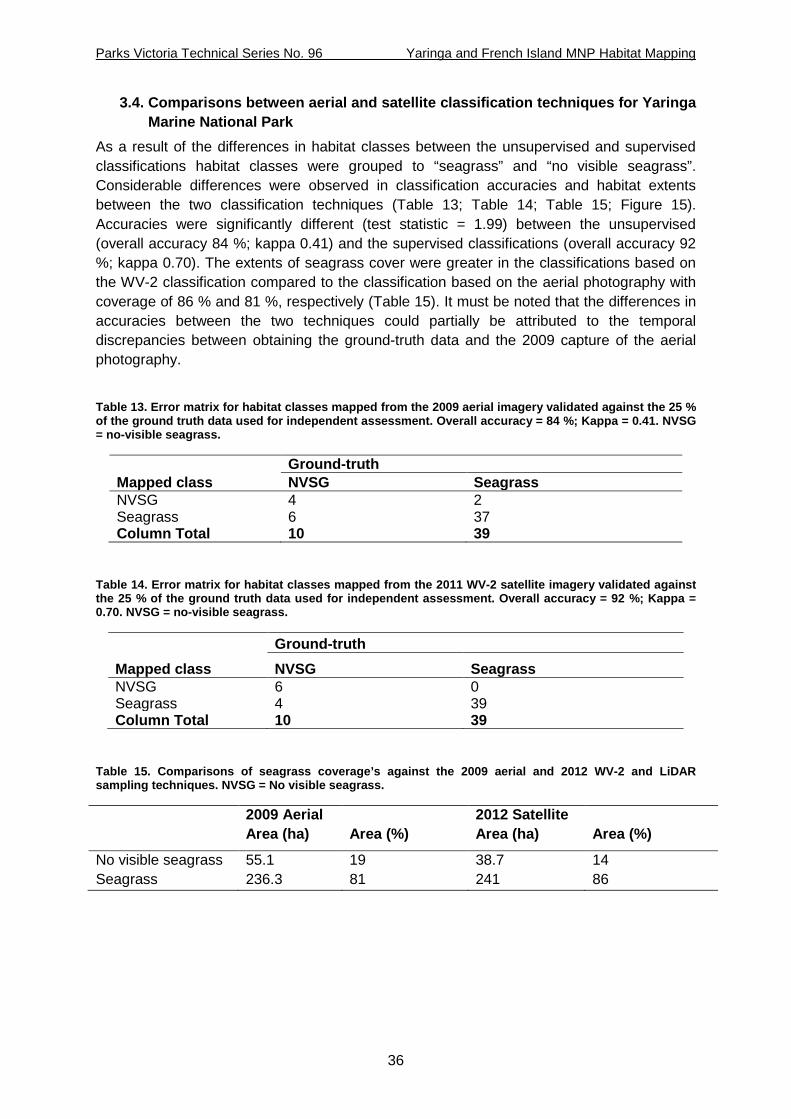
3.4. Comparisons between aerial and satellite classification techniques for Yaringa Marine National Park
As a result of the differences in habitat classes between the unsupervised and supervised classifications habitat classes were grouped to “seagrass” and “no visible seagrass”. Considerable differences were observed in classification accuracies and habitat extents between the two classification techniques (Table 13; Table 14; Table 15; Figure 15). Accuracies were significantly different (test statistic = 1.99) between the unsupervised (overall accuracy 84 %; kappa 0.41) and the supervised classifications (overall accuracy 92 %; kappa 0.70). The extents of seagrass cover were greater in the classifications based on the WV-2 classification compared to the classification based on the aerial photography with coverage of 86 % and 81 %, respectively (Table 15). It must be noted that the differences in accuracies between the two techniques could partially be attributed to the temporal discrepancies between obtaining the ground-truth data and the 2009 capture of the aerial photography.
Table 13. Error matrix for habitat classes mapped from the 2009 aerial imagery validated against the 25 % of the ground truth data used for independent assessment. Overall accuracy = 84 %; Kappa = 0.41. NVSG = no-visible seagrass.
Ground-truth Mapped class NVSG Seagrass NVSG 4 2 Seagrass 6 37 Column Total 10 39
Table 14. Error matrix for habitat classes mapped from the 2011 WV-2 satellite imagery validated against the 25 % of the ground truth data used for independent assessment. Overall accuracy = 92 %; Kappa = 0.70. NVSG = no-visible seagrass.
Ground-truth Mapped class NVSG Seagrass NVSG 6 0 Seagrass 4 39 Column Total 10 39
Table 15. Comparisons of seagrass coverage’s against the 2009 aerial and 2012 WV-2 and LiDAR sampling techniques. NVSG = No visible seagrass.
2009 Aerial 2012 Satellite Area (ha) Area (%) Area (ha) Area (%)
No visible seagrass 55.1 19 38.7 14 Seagrass 236.3 81 241 86
36
Parks Victoria Technical Series No. 96 Yaringa and French Island MNP Habitat Mapping
Figure 15. Mapped comparison of aerial classification (A) and satellite classification (B).
37
Parks Victoria Technical Series No. 96 Yaringa and French Island MNP Habitat Mapping
3.5. Spectral differences in intertidal and subtidal habitats at Yaringa Marine National Park
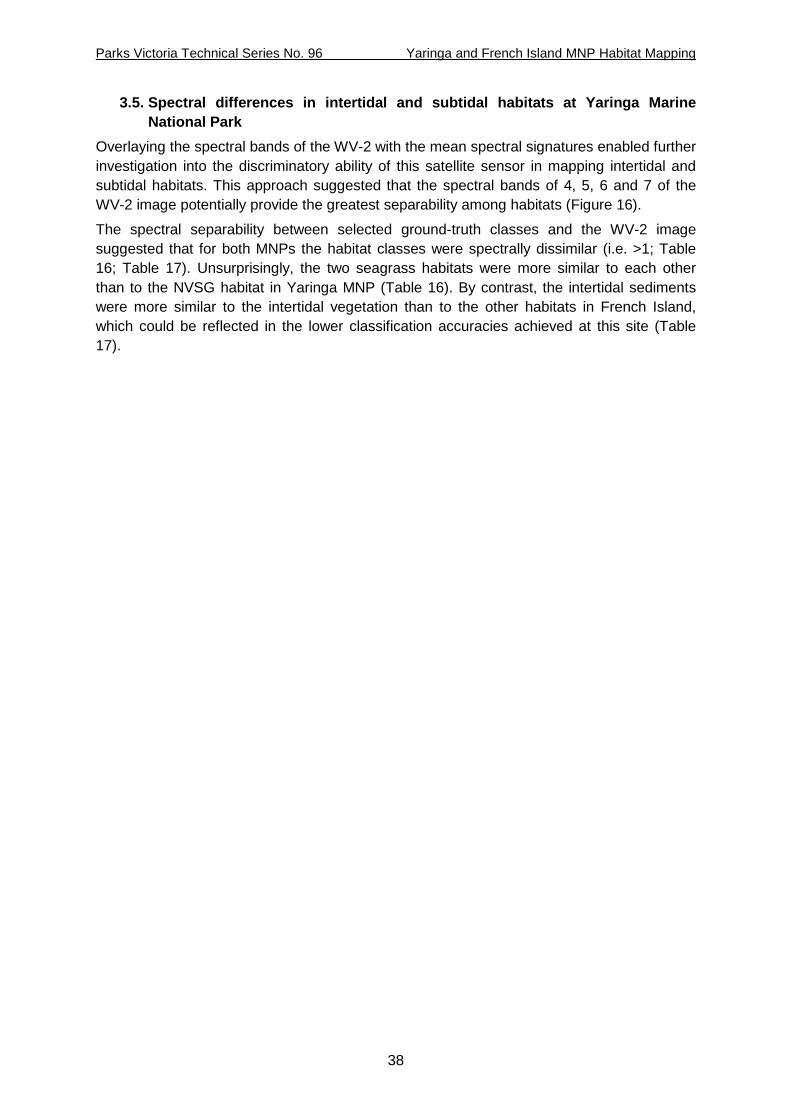
Overlaying the spectral bands of the WV-2 with the mean spectral signatures enabled further investigation into the discriminatory ability of this satellite sensor in mapping intertidal and subtidal habitats. This approach suggested that the spectral bands of 4, 5, 6 and 7 of the WV-2 image potentially provide the greatest separability among habitats (Figure 16).
The spectral separability between selected ground-truth classes and the WV-2 image suggested that for both MNPs the habitat classes were spectrally dissimilar (i.e. >1; Table 16; Table 17). Unsurprisingly, the two seagrass habitats were more similar to each other than to the NVSG habitat in Yaringa MNP (Table 16). By contrast, the intertidal sediments were more similar to the intertidal vegetation than to the other habitats in French Island, which could be reflected in the lower classification accuracies achieved at this site (Table 17).
38
Parks Victoria Technical Series No. 96 Yaringa and French Island MNP Habitat Mapping
Figure 16. Mean in situ spectral responses of surveyed habitats within Yaringa MNP contributing to major habitats mapped in Figure 9 with WV-2s 8-spectral bands overlayed.
39
Parks Victoria Technical Series No. 96 Yaringa and French Island MNP Habitat Mapping
Table 16. Pair separation of mapped habitat classes for Yaringa Marine National Park.
Habitat Class NVSG Dense Zosteraceae Dense Zosteraceae 1.53
Med/Sp Zosteraceae 1.55 1.378
Table 17. Pair Separation of mapped habitat classes for French Island Marine National Park.
Habitat Class Intertidal sediment
Subtidal sediment
Intertidal vegetation
Subtidal vegetation
Subtidal sediment 1.97 Intertidal vegetation
1.45 1.99
Subtidal Vegetation
1.97 1.84 1.85
Unclassified 1.99 1.80 1.99 1.84
4. Conclusions and recommendations This study has provided mapping of intertidal and subtidal habitats of Yaringa and French Island MNPs at a 2 m resolution with fair to good accuracies (Kappa 0.40-0.75). These were combined with mangrove and saltmarsh habitats recently mapped by Boon et al. (2011) to provide compete-coverage habitat maps.
The main conclusions of this study are that; • Supervised classification of LiDAR data and WV-2 satellite imagery created accurate
and spatially-continuous habitat maps at an improved level of detail for the two study localities.
• Yaringa MNP was dominated by mangroves, wet saltmarsh and dense Zostereaceae, covering 33 %, 29 % and 19 %, respectively. Similarly, intertidal vegetation and subtidal vegetation (dominated by Zosteraceae) covered 26 % and 25 % of French Island MNP. However, as a result of turbidity and missing satellite imagery 27 % of French Island MNP remains unmapped.
• Classification accuracies for each study locality were fair to good, with the Yaringa and French Island mapping returning overall accuracies of 71 % (Kappa = 0.51) and 53 % (Kappa = 0.48), respectively. Discrepancies between particular classes were most evident between habitats that displayed comparable spectral properties (Monk et al. 2011). Although the broad habitats were grouped according to the observed species assemblages that were distinct from each other, overlap of particular spectral and bathymetric traits were inevitable. For example, results indicated that 38 % of medium/sparse Zosteraceae was misclassified as dense Zosteraceae using WV-2 imagery alone and 61.5 % falsely identified in the WV-2 and LiDAR classification in Yaringa MNP. This confusion is partly attributed to the heterogeneous nature of the differing densities of Zosteraceae beds (i.e. dense, medium/sparse) that interface with one another at smaller spatial scales than the map resolution (i.e. < 2 m pixel resolution) and can also vary in density at similar scales. However, accuracies should be interpreted with caution as some habitat classes contained limited sample localities. Future mapping should ensure that there is an adequate allowance for
40
Parks Victoria Technical Series No. 96 Yaringa and French Island MNP Habitat Mapping
thorough ground-truthing activities. Ideally around 4 days in each MNP would have provided a more robust ground-truthing dataset that could have afforded a better understanding of classification accuracies.
• Coupling the WV-2 and LiDAR together reduced potential image artefacts (e.g. sun glint causing the salt and pepper effect). The inclusion of LiDAR, to multispectral imagery, for classifying coastal habitats, makes interpretations of the classification model more straightforward, both from the ecological point of view and when defining management guidelines, as it provides a more realistic and homogeneous distribution of geographic features (Lee & Shan 2003).
• The satellite classification appeared to provide better results than the aerial photography classifications. However, since there is a two-year difference between the capture of the aerial image and the collection of the ground-truth data this comparison is potentially temporally confounded. It should also be noted that there are differences in imagery acquisition costs, the spatial resolution between the two datasets (i.e. WV-2 = 2 m and the aerial = 0.5 m) and the amount of spectral information contained in the data (i.e. WV-2 = 8 bands and the aerial = 4 bands) which may ultimately determine its utility for a particular project.
• The spatial assessment using FRAGSTATs of habitat patches within Yaringa MNP provides a viable and cost effect way to assess habitat condition (i.e. shape, size and arrangement). This spatial assessment determined that dense Zosteraceae and NVSG habitat classes were generally larger in patch size and continuity than the medium/sparse Zosteraceae habitat. The application of these spatial analysis techniques to time-series mapping may provide a way to remotely monitor the change in the patch characteristics of marine habitats.
• Enough detail is provided to enable the replication of these analyses to classify new imagery for these two sites, as well as for other shallow-water MNPs throughout Victoria.
• Maps generated in this study provide a new baseline dataset for future assessment of habitat change, anthropogenic impacts and climate change assessment.
Summary of implications for future monitoring using these remote-sensing techniques;
• Future mapping should ensure that there is an adequate allowance for thorough ground-truthing activities. Ideally, ground-truth classes should have a minimum of 100 records per habitat category.
• Turbidity is a limiting factor for aerial, satellite and LiDAR sensors in shallow-water embayments. Imagery should be captured at, or as close to, low-tide as possible. This approach will maximise mapping coverage, whilst reducing misclassification rates.
• The satellite classification appeared to provide better results than the aerial photography classifications. However, differences in imagery acquisition costs, the spatial resolution between the datasets, and the amount of spectral information contained in the data should be considered.
• The spatial resolution of the sensor should also be considered to ensure that it is applicable to monitor the scale of change under investigation (e.g. 10’s cm or 10’s
41
Parks Victoria Technical Series No. 96 Yaringa and French Island MNP Habitat Mapping
m). This factor may ultimately determine the utility of remote-sensing for a particular application.
• Incorporating bathymetric data (e.g. LiDAR) appears to reduce sensor noise in satellite imagery. Thus, providing more homogeneous predictions of habitat classes.
• Remote-sensing provides a detailed complete-coverage assessment of the spatial extents and arrangement of habitats contained within a MNP, and should be viewed as complimentary tool to on-going in-situ monitoring programs.
Clear future directions from this work include; • Detailed change detection analyses and interpretation, including assessments of
patterns of expansion and contraction of habitat types with future satellite imagery using the current methods presented in the research.
• Further investigation into applicability of spatial assessment metrics for quantifying the differences between, and potential change in, habitat arrangement, shape and size.
• Seagrass condition assessments at suitable temporal scales. Hyperspectral imagery and in situ spectral readings of seagrass species could be used to capture seasonal and inter-annual changes in seagrass extent related to long term assessment of change. This is needed to put any change detection comparisons over longer time periods into context.
• Using the unique spectral signatures with high spectral resolution sensors similar models could be derived to potentially estimate above ground biomass of immature, mature and senescent ecologically important or invasive pest species’ (e.g. Spartina spp.; Gross et al. 1986). This may provide a useful tool to monitor the management measures used in the control of the invasive species.
5. Acknowledgments The authors would like to acknowledge Parks Victoria for the collection of WorldView-2 data made available to this research as well as the “Future Coasts Program” by DSE for the availability of LiDAR data sets. Thank you also to Arnold Dekker and Janet Anstee from CSIRO Land and Water, Environmental Earth Observation Program for the correction of the WorldView-2 imagery and to Michael Conroy at the Department of Sustainability and Environment for his assistance with access to the 2009 digital aerial photography through the DSE Coordinated Imagery Program. Sean Blake at DPI Queenscliff also assisted with the ground-truthing field-work planning and data collection.
6. References Anderson MJ, Gorley R, Clarke KR (2008) PERMANOVA+ for PRIMER: guide to software and statistical methods. Plymouth, UK: PRIMER-E.
Anon. (1998) ER Mapper User Guide. 10th revised edition. Earth Resource Mapping Pty Ltd.
Blake, S. and D. Ball (2001). Victorian Marine Habitat Database: Seagrass Mapping of Western Port. Geospatial Systems Section. Queenscliff, Marine and Freshwater Resources Institute.
42
Parks Victoria Technical Series No. 96 Yaringa and French Island MNP Habitat Mapping
Blake S., Ball D., Coots A. & Smith T. (2012) Marine video survey of Western Port. Fisheries Victoria Technical Report No. 176. Department of Primary Industries, Queenscliff, Victoria, Australia.
Boon, P., Allen, T., Brook, J., Carr, G., Frood, D., Harty, C., Hoye, J., McMahon, A., Mathews, S., Rosengren, N., Sinclair, S., White, M. & Yugovic J. (2011). Mangroves and coastal saltmarsh of Victoria: distribution, condition, threats and management. Institute for Sustainability and Innovation.
Congalton, R. (1991). A review of assessing the accuracy of classifications of remotely sensed data, Remote Sensing of Environment, 37: 35-46.
Congalton, R. & Green, K. (2009). Assessing the Accuracy of Remotely Sensed Data: Principles and Practices, 2nd edn, CRC/Taylor & Francis Group.
Dekker, AG., Brando, VE. & Anstee, JM. (2005). Retrospective seagrass change detection in a shallow coastal tidal Australian lake. Remote Sensing of Environment 97(4): 415-433.
Fleiss, J. (1981). Statistical methods for rates and proportions. John Wiley.
Foody, GM. (2002). Status of land cover classification accuracy assessment, Remote Sensing of Environment, 80: 185-201.
Gross, MF., Klemas, V., & Levasseur, JE. (1986) Remote sensing of Spartina anglica biomass in five French salt marshes. International Journal of Remote Sensing, 7: 657-664.
Jensen, JR. (2005). Introductory Image Processing, 3rd Edition, Pearson Prentice Hall.
Langford, W., Gergel, S., Dietterich, T. & Cohen, W. (2006). Map Misclassification Can Cause Large Errors in Landscape Pattern Indices: Examples from Habitat Fragmentation, Ecosystems, 9(3): 474-488.
Lee, DS. & Shan, J. (2003). Combining Lidar Elevation Data and IKONOS Multispectral Imagery for Coastal Classification Mapping, Marine Geodesy, 26(1-2): 117-127.
Loh, WY. & Shih, YS. (1997). Split selection methods for classification trees. Statistica Sinica 7(4): 815-840.
McGarigal, K., Cushman, SA. & Ene, E. (2012) FRAGSTATS v4: Spatial Pattern Analysis Program for Categorical and Continuous Maps., Computer software program produced by the authors at the University of Massachusetts, Amherst. Accessed: 15/10/2012, <http://www.umass.edu/landeco/research/fragstats/fragstats.html>.
Monk, J., Pope, A., Ierodiaconou, D., Otera, K. & Mount, R. (2011). Corner Inlet and Nooramunga Habitat Mapping Project. Deakin University.
O’Neill, RV., Hunsaker, CT., Timmins, SP., Jackson, BL., Jones, KB., Riiters, KH. & Wickham, JD. (1996) Scale problems in reporting landscape pattern at the regional scale, Landscape Ecology, 11(3): 169-180.
Parks Victoria (2007) Yaringa Marine National Park, French Island Marine National Park and Churchill Island Marine National Park Management Plan. Parks Victoria.
Sleeman, JC., Kendrick, GA., Boggs, GS. & Hegge, BJ. (2005). Measuring fragmentation of seagrass landscapes: which indices are most appropriate for detecting change? Marine and Freshwater Research, 56(6): 851-864.
43
Parks Victoria is responsible for managing the Victorian protected
area network, which ranges from wilderness areas to metropolitan
parks and includes both marine and terrestrial components.
Our role is to protect the natural and cultural values of the parks
and other assets we manage, while providing a great range of
outdoor opportunities for all Victorians and visitors.
A broad range of environmental research and monitoring activities
supported by Parks Victoria provides information to enhance park
management decisions. This Technical Series highlights some of
the environmental research and monitoring activities done within
Victoria’s protected area network.
Healthy Parks Healthy People
For more information contact the Parks Victoria Information Centre
on 13 1963, or visit www.parkweb.vic.gov.au