Embed Size (px)
DESCRIPTION
Parker S.C. -The Economics of Self-Employment and Entrepreneurship (2004)
Citation preview

The Economics of Self-Employmentand Entrepreneurship
As self-employment and entrepreneurship become increasingly impor-tant in our modern economies, Simon C. Parker provides a timely,definitive and comprehensive overview of the field. In this book he bringstogether and assesses the large and disparate literature on these sub-jects and provides an up-to-date overview of new research findings. Keyissues addressed include: the impact of ability, risk, personal characteris-tics and the macroeconomy on entrepreneurship; issues involved in rais-ing finance for entrepreneurial ventures, with an emphasis on themarketfailures that can arise as a consequence of asymmetric information; thejob creation performance of the self-employed; the growth, innovationand exit behaviour of new ventures and small firms; and the appropri-ate role for governments interested in promoting self-employment andentrepreneurship. This book will serve as an essential reference guideto researchers, students and teachers of entrepreneurship in economics,business and management and other related disciplines.
S IMON C. PARKER is Professor andHead of Economics at theUniver-sity of Durham. He is also Director of the Centre for Entrepreneurshipat Durham Business School. Professor Parker has published widelyin economics journals on a variety of issues on self-employment andentrepreneurship.


The Economics ofSelf-Employment andEntrepreneurship
Simon C. Parker

Cambridge, New York, Melbourne, Madrid, Cape Town, Singapore, São Paulo
Cambridge University PressThe Edinburgh Building, Cambridge , UK
First published in print format
- ----
- ----
© Simon C. Parker, 2004
2004
Information on this title: www.cambridge.org/9780521828130
This publication is in copyright. Subject to statutory exception and to the provision ofrelevant collective licensing agreements, no reproduction of any part may take placewithout the written permission of Cambridge University Press.
- ---
- ---
Cambridge University Press has no responsibility for the persistence or accuracy of sfor external or third-party internet websites referred to in this publication, and does notguarantee that any content on such websites is, or will remain, accurate or appropriate.
Published in the United States of America by Cambridge University Press, New York
www.cambridge.org
hardback
eBook (NetLibrary)
eBook (NetLibrary)
hardback

For Lisa


Contents
List of Figures page xiList of Tables xiiPreface xiiiGlossary of commonly used symbols xv
1 Introduction 11.1 Aims, motivation and scope of the book 21.2 Structure of the book 31.3 Definition and measurement issues 51.4 International evidence on self-employment rates
and trends 81.4.1 The OECD countries 91.4.2 The transition economies of eastern Europe 121.4.3 Developing countries 12
1.5 Self-employment incomes and income inequality 141.5.1 Incomes and relative incomes 141.5.2 Income inequality 181.5.3 Earnings functions 20
1.6 Some useful econometric models 241.6.1 Occupational choice and probit/logit models 241.6.2 The structural probit model 261.6.3 Extensions to cross-section models of occupational choice 271.6.4 Issues arising from the use of time-series and panel data 29
Notes 31
I Entrepreneurship: theories, characteristicsand evidence 37
2 Theories of entrepreneurship 392.1 ‘Early’ views about entrepreneurship 392.2 ‘Modern’ economic theories 43
2.2.1 Introduction and some definitions 432.2.2 Homogeneous individuals 462.2.3 Heterogeneous entrepreneurial ability 542.2.4 Heterogeneous risk aversion 61
2.3 Conclusion 64Notes 65
vii

viii Contents
3 Characteristics of entrepreneurs and the environmentfor entrepreneurship 683.1 Relative earnings, human and social capital 68
3.1.1 Earnings differentials 683.1.2 Human capital 703.1.3 Social capital 74
3.2 Personal characteristics and family circumstances 743.2.1 Marital status 743.2.2 Ill-health and disability 753.2.3 Psychological factors 763.2.4 Risk attitudes and risk 833.2.5 Family background 84
3.3 Entrepreneurship and macroeconomic factors 863.3.1 Economic development and changing industrial structure 863.3.2 Unemployment 943.3.3 Regional factors 993.3.4 Government policy variables 102
3.4 Conclusion 106Notes 107
4 Ethnic minority and female entrepreneurship 1134.1 Ethnic minority entrepreneurship 114
4.1.1 Discrimination 1154.1.2 Positive factors 1204.1.3 Conclusion 123
4.2 Female entrepreneurship 1244.2.1 Explaining female self-employment rates 1244.2.2 Female self-employed earnings 1264.2.3 Conclusion 129
4.3 Immigration and entrepreneurship 129Notes 132
II Financing entrepreneurial ventures 135
5 Debt finance for entrepreneurial ventures 1375.1 Models of credit rationing and under-investment 139
5.1.1 Type I credit rationing 1405.1.2 Type II credit rationing and under-investment 1425.1.3 Arguments against the credit rationing hypothesis 1505.1.4 Conclusion: evaluating the theoretical case for credit
rationing 1545.2 Over-investment 1565.3 Multiple sources of inefficiency in the credit market 1585.4 Conclusion 159Notes 160
6 Other sources of finance 1656.1 Informal sources of finance 165
6.1.1 Family finance 1656.1.2 Micro-finance schemes 167

Contents ix
6.1.3 Credit co-operatives, mutual guarantee schemesand trade credit 169
6.2 Equity finance 1716.2.1 Introduction 1716.2.2 The scale of the equity finance market for
entrepreneurs 1716.2.3 Factors affecting the availability of equity finance for
entrepreneurs 1736.2.4 Equity rationing, funding gaps and under-investment 1746.2.5 Policy recommendations 176
6.3 Conclusion 177Notes 178
7 Evidence of credit rationing 1797.1 Tests of Type I rationing 180
7.1.1 The Evans and Jovanovic (1989) model 1807.1.2 Effects of assets on becoming or being self-employed 1817.1.3 Effects of assets on firm survival 1827.1.4 Effects of assets on investment decisions 183
7.2 Critique 1837.3 Tests of Type II credit rationing 186Notes 189
III Running and terminating an enterprise 191
8 Labour demand and supply 1938.1 Entrepreneurs as employers 193
8.1.1 Evidence about self-employed ‘job creators’ 1938.1.2 Evidence about job creation by small firms 194
8.2 Entrepreneurs as suppliers of labour 1978.2.1 Hours of work 1978.2.2 Retirement 204
Notes 206
9 Growth, innovation and exit 2089.1 Jovanovic’s (1982) dynamic selection model 2089.2 Growth and innovation 213
9.2.1 Gibrat’s Law and extensions 2139.2.2 Evidence on growth rates 2159.2.3 Innovation 216
9.3 Exit 2189.3.1 Survival rates and their distribution 2189.3.2 Two useful econometric models of firm survival 2209.3.3 Determinants of entrepreneurial survival and exit 222
9.4 Conclusion 227Notes 229
IV Government policy 233
10 Government policy: issues and evidence 23510.1 Credit market interventions 236

x Contents
10.1.1 Loan Guarantee Schemes 23610.1.2 Other interventions 241
10.2 Taxation, subsidies and entrepreneurship: theory 24210.3 Tax evasion and avoidance: theory 24610.4 Taxation, tax evasion and entrepreneurship: evidence 249
10.4.1 Income under-reporting by the self-employed 24910.4.2 Tax, tax evasion and occupational choice:
econometric evidence 25110.5 Direct government assistance and regulation 253
10.5.1 Entrepreneurship schemes targeted at theunemployed 253
10.5.2 Information-based support for start-ups 25510.5.3 Regulation and other interventions 257
10.6 Conclusion 260Notes 262
11 Conclusions 26611.1 Summary 26611.2 Implications for policy-makers 268Note 271
References 272Author index 308Subject index 308

Figures
2.1 Occupational choice with two occupations,entrepreneurship (S ) and paid-employment (E ) page 59
5.1 The supply of and demand for loans 1405.2 Stiglitz and Weiss’ (1981) credit rationing model 1465.3 Redlining 1485.4 The use of two-term contracts to separate hidden types 1519.1 Selection and Survival in the Jovanovic (1982) model 211
xi

Tables
1.1 Aggregate self-employment rates in some selectedOECD countries, 1960–2000 page 9
1.2 Aggregate self-employment rates in some selectedtransition economies, 1980–1998/1999 10
1.3 Aggregate self-employment rates in developingcountries, 1960s–1990s 10
3.1 Reasons given for becoming self-employed in the UK 803.2 Self-employment rates in the British regions, 1970 and
2000 993.3 Summary of determinants of entrepreneurship 1049.1 Firm birth and death interactions 22610.1 Features of LGSs in the UK, the USA, France,
Germany and Canada 237
xii

Preface
Entrepreneurship is a subject that is commonly taught and researched inbusiness schools, but seldom if at all in economics departments. Con-sequently, most books on entrepreneurship tend to be written from abusiness and management perspective. Such books often downplay, orignore altogether, the contribution of modern economics to our under-standing of the subject. Indeed, it is common to find them referring to‘the contribution of economics’ mainly in terms of the treatises of FrankKnight and Josef Schumpeter – works that were published more than halfa century ago! Of modern economics, there is little mention, apart fromthe occasional disparaging remark that competitive general equilibriumtheory leaves little or no room for the entrepreneur, somodern economicshas little to offer the study of the subject.The present book hopes to convince the reader that the foregoing is
an unduly negative assessment, by reviewing the many contributions thatmodern economics has brought, and continues to bring, to our under-standing of self-employment and entrepreneurship. These contributionsinclude rigorous analyses of occupational choice (‘what economic fac-tors help explain who becomes an entrepreneur?’); the efficiency andeconomic impact of entrepreneurial ventures (‘what is the economic im-portance and value of entrepreneurship?’); and the appropriate role ofgovernments with respect to entrepreneurship (‘what is the rationale forintervening in the market economy to encourage entrepreneurship?’). Itis hoped that, by drawing together these contributions in this book, read-ers who have been trained to ignore or dismiss economics’ contributionsto the subject will be motivated to think again, and may learn from themany insights that it has generated.Of course, the book also addresses a target audience of economists,
with an agenda of raising the profile of entrepreneurship in that subject.It is unclear why entrepreneurship plays such a marginal role in mosteconomics departments. It is possible that economists are suspicious of asubject with an avowedly mongrel provenance, which reflects a multiplic-ity of different, and often non-quantitative, perspectives. From a personal
xiii

xiv Preface
standpoint, the multidisciplinary nature of entrepreneurship posed oneof the greatest challenges in writing this book. It also offered some of thegreatest rewards.My own view is that the multidisciplinary nature of entrepreneurship
is a potential strength, rather than a weakness. But this potential willbe achieved only if students and researchers take the trouble to breakthe boundaries of narrow scholarship, an ideal to which this book isdedicated. Indeed, the book does not confine itself exclusively to oneparadigm, despite its predominantly economics-based perspective. Thebook does attempt to reach out beyond economics in many places, andincludes several references to contributions from other disciplines.The book might never have seen the light of day without the support of
Chris Harrison, the Publishing Director of Humanities & Social Sciencesat Cambridge University Press. I am also grateful to Alison Powell atCambridge for the production of this book.

Glossary of commonly used symbols
VARIABLES
a age or years of experienceA production function shift variableα, β, γ , ϑ , ω (vectors of) parametersb a ‘bad’ (risky) entrepreneurial type or ventureB real current or lifetime wealth of an individualBAD a contract term yielding disutility to borrowersc, c(·) cost, cost functionC collateralD debt repayment an entrepreneur owes a bankdz increment of a Wiener processδ subjective intertemporal discount ratee effortE paid-employmentE the expectations operatorφ(·) the density function of the standard normal distribution(·) the distribution function of the standard normalf (·), F(·) the density and distribution functions of a random
variableg(·),G(·) the density and distribution functions of another
random variableg a ‘good’ (safe) entrepreneurial type or venture = (·, . . .) a lending contract whose arguments are the contract
termshE employee work-hourshS, h self-employed work-hoursH total employee labour inputI non-labour incomeI IN identically and independently normally distributedk physical capital input
xv

xvi Glossary of commonly used symbols
λ inverse Mills RatioL size of a bank loan; number of bank loansL likelihood functionM, NM member of a minority (non-minority) ethnic groupn the number of individuals in a samplen j the number or fraction of individuals in occupation j social welfare (function); also state-space/Kuhn–Tucker
constraintp probability of success of a new enterpriseP self-employed product priceπ profit from entrepreneurshipπ B banks’ expected profit on a loan� probability a self-employed individual is auditedq self-employed product outputq (·, . . .) self-employed production functionQ aggregate demand for self-employed productsr interest rate (rental price of capital)r A coefficient of absolute risk aversionr R coefficient of relative risk aversionR stochastic return on a risky entrepreneurial ventureRf actual return if a risky venture is unsuccessfulRs actual return if a risky venture is successfulρ the safe (deposit) interest rate = competitive banks’
expected return; also used as the correlationcoefficient
� a random variable, a random shocks aggregate self-employment rates ch years of schooling or some other measure of educationS self-employmentσ 2 variance of a stochastic regression disturbance termσ j standard deviation of income risk in occupation jt timeT the number of time periodsTi j , Ti j (·) tax liability of individual i in occupation jτ income tax rateς a subsidyθ an entrepreneur’s type, a member of �� the set of entrepreneurial typesu, v, ε stochastic (regression) disturbance termsU(·) a cardinal utility functionV(·) indirect utility, or value, function

Glossary of commonly used symbols xvii
ν non-pecuniary utility advantage to self-employmentw, wE wage rate received by employeeswS ‘wage rate’ received by the self-employedW, X, M vectors of explanatory variablesψ(·), ϕ(·) some continuous functionx (uni-dimensional) entrepreneurial abilityx the (ability of the) marginal entrepreneurxE ability in paid-employmentξ proportion of working time spent in Syj gross (i.e. pre-tax) income received in occupation jynj net (after-tax) income received in occupation jϒ the state of technologyzi a binary observed indicator variable: equal to 1 if
individual i is self-employed, else zeroz∗i an unobserved binary latent variable: the probability
individual i chooses to be self-employedζ consumption
INDEXES
i (subscript) indexes an individualj (subscript) indexes an occupation, usually
self-employment (S), paid-employment (E), orunemployment (U); but sometimes also a minority(M) or non-minority (NM) group; or a region; orgender
t (subscript) indexes a point in time
OTHER SYMBOLS
y time derivative of y (say)ˆ (when used in a sample) an estimate of a parameter∗ optimal value (except for z∗)′ (prime) vector or matrix transpose˜ a marginal type
ABBREV IAT IONS OF ORGAN I SAT IONSAND DATA - SETS
BHPS British Household Panel Survey (UK)CBO Characteristics of Business Owners (US)CPS Current Population Survey (US)FES Family Expenditure Survey (UK)GHS General Household Survey (UK)

xviii Glossary of commonly used symbols
LFS Labour Force Survey (UK)NCDS National Child Development Survey (UK)NFIB National Federation of Independent Businesses (US)NLS National Longitudinal Survey (US)NLSY National Longitudinal Survey of Youth (US)OECD Organisation for Economic Co-Operation and
DevelopmentPSID (Michigan) Panel Study of Income Dynamics (US)SBA Small Business Administration (US)SIPP Survey of Incomes and Program Participation (US)

1 Introduction
The entrepreneur is at the same time one of the most intriguing and one of themost elusive characters . . . in economic analysis. He has long been recognised asthe apex of the hierarchy that determines the behaviour of the firm and therebybears a heavy responsibility for the vitality of the free enterprise society. (Baumol,1968, p. 64)
Self-employment is unquestionably the oldest way by which individuals offer andsell their labour in a market economy. At an earlier time, it was also the primaryway. Despite this history, its principal features and the characteristics that dif-ferentiate self-employment from wage and salary employment have attracted theattention of only a handful of students of the labour market. (Aronson, 1991, p. ix)
Entrepreneurship is increasingly in the news. Governments all over theworld extol its benefits and implement policies designed to promoteit. There are several reasons for this interest in, and enthusiasm for,entrepreneurship. Owner-managers of small enterprises run the majorityof businesses in most countries. These enterprises are credited withproviding specialised goods and services that are ignored by the largestfirms. They also intensify competition, thereby increasing economic effi-ciency. Some entrepreneurs pioneer new markets for innovative products,creating new jobs and enhancing economic growth. In a few cases, today’ssmall owner-managed enterprises grow to become tomorrow’s industrialgiants. Even those that do not may create positive externalities, like thedevelopment of supply chains that help attract inward investment, orgreater social inclusion. It is sometimes also claimed that the decentrali-sation of economic production into a large number of small firms is goodfor society and democracy, as is the fostering of a self-reliant and hardy‘entrepreneurial spirit’.
Entrepreneurship has only recently come to be regarded as a subject.A complete view of it recognises its multidisciplinary academic under-pinnings, drawing as it does from Economics, Finance, Business andManagement, Sociology, Psychology, Economic Geography, EconomicHistory, Law, Politics and Anthropology. This heterogeneous provenancereflects the multidimensional nature of entrepreneurship, which partly
1

2 The Economics of Self-Employment and Entrepreneurship
contributes to the elusiveness of the entrepreneur alluded to by WilliamBaumol.
1.1 Aims, motivation and scope of the book
There is general agreement that entrepreneurship is sadly neglected inmost economics textbooks (see, e.g. Rosen, 1997; Kent and Rushing,1999). Some commentators have attributed this neglect to an inherentunsuitability of economics for studying entrepreneurship. These com-mentators allege that economics is concerned only with equilibrium out-comes in competitive markets with perfectly informed agents, whereasentrepreneurship embodies imperfect information and unexpected inno-vations that disrupt equilibria (Barreto, 1989; Kirchhoff, 1991; Harper,1996; Rosen, 1997). While it is true that economists usually take thestate of technology as given, this point should not be pushed too far.For a start, there is much more to entrepreneurship than just innova-tion. This book makes the case that the tools of modern economics areinvaluable for understanding the determinants of, and constraints on,entrepreneurship, the behaviour of entrepreneurs, the contribution ofentrepreneurs to the broader economy and the impact of governmentpolicies on entrepreneurship. It is hoped that the book will go some waytowards correcting mistaken and prejudiced impressions about the con-tribution of economics to this field, and will convince the reader that it isnot an oxymoron to talk about the ‘economics of entrepreneurship’.
One aspect of entrepreneurship that economists have researched quitethoroughly is occupational choice. Despite the limitations of employ-ing such a narrow definition – an issue we shall discuss further below –many applied labour economists have equated self-employment withentrepreneurship, and have analysed behavioural choice between paid-and self-employment. Unfortunately, here too the economics textbookshave been guilty of neglect: the above quotation from Richard Aronsonabout self-employment remains as true today as it did over a decade ago.To appreciate the economic importance of self-employment, consider thefollowing facts:1. Around 10 per cent of the workforces in most OECD economies
are self-employed. The figure climbs to about 20 per cent when in-dividuals who work for the self-employed are also included (Haber,Lamas and Lichtenstein, 1987). Two-thirds of people in the USlabour force have some linkage to self-employment, by having expe-rienced self-employment, by coming from a background in which thehousehold head was self-employed, or by having a close friend whois self-employed (Steinmetz and Wright, 1989). And by the end of

Introduction 3
their working lives, about two-fifths of the American workforce willhave had at least one spell of self-employment (Reynolds and White,1997).
2. Between 80 and 90 per cent of businesses are operated by self-employed individuals (Acs, Audretsch and Evans, 1994; Selden,1999).
3. Many employees in industrialised countries claim that they wouldlike to be self-employed. For example, according to Blanchflower(2000), 63 per cent of Americans, 48 per cent of Britons and49 per cent of Germans stated a preference for self-employment overpaid-employment.1
Why have the economics textbooks so conspicuously neglected self-employment and entrepreneurship? The answer is unclear, but mightinvolve a lingering mistrust of entrepreneurship among economists, andan inability to pigeon-hole this multifaceted subject. There is certainly nolack of research on self-employment and entrepreneurship by economists.Indeed, we hope that one of the contributions of this book is to organ-ise and assess the current state of this branching, acquisitive and rapidlygrowing literature. The book is intended to serve as a comprehensiveoverview and guide to researchers and students of entrepreneurship in avariety of disciplines, not just in Economics. The book can also be usedto support teaching in modules such as Small Business Economics andEntrepreneurship. Readers with a working knowledge of basic undergrad-uate calculus, statistics and economics should cope easily with the book’smodest technical demands. Readers without this technical backgroundwill still be able to read the majority of the book without difficulty, andunderstand the gist of the remainder by ‘reading between the Greek’.
For brevity and focus, some topics will be excluded. These in-clude entrepreneurship in education; ‘social entrepreneurship’ and‘intrapreneurship’;2 organisational, strategic and managerial decisionmaking by entrepreneurs; network and organisational ecology approachesto entrepreneurship; ‘evolutionary economics’; and practical advice(including ‘how to’ information) to entrepreneurs. Nor will we providedescriptive case studies either of individual entrepreneurs, or of smallfirms or the industries in which they operate. These topics are ably cov-ered in numerous texts in the Business/Management literature, and willnot be repeated here.
1.2 Structure of the book
The remainder of this chapter is organised as follows. Section 1.3 dis-cusses issues in the definition and measurement of entrepreneurship and

4 The Economics of Self-Employment and Entrepreneurship
self-employment. The distinction between these two concepts explainstheir joint presence in the title of this book. Sections 1.4 and 1.5 intro-duce the reader to some stylised facts about the self-employed, includingtheir number, incomes and income inequality. Section 1.6 describes someuseful econometric models of occupational choice referred to extensivelyin the book.
Part I deals with theories of entrepreneurship and the character-istics of entrepreneurs. Chapter 2 outlines economic theories of theentrepreneur and entrepreneurship, both ‘early’ (Section 2.1) and‘modern’ (Section 2.2). The former tend to paint a broad-brush pictureof entrepreneurship, whereas the latter apply the tools of microeco-nomics to the problem of entrepreneurship as an occupational choice.Chapter 3 fills out some detail by considering the roles of pecuniaryfactors, individual characteristics, family background and environmen-tal variables for explaining the decision to become an entrepreneur.Chapter 4 considers separately issues of race, gender and immigrationas they relate to entrepreneurship.
Part II treats the important problem of raising finance for en-trepreneurial ventures. Chapter 5 analyses the economic issues arisingfrom bank finance of new start-ups, bank loans being the largest andmost frequently used source of outside funds by entrepreneurs. Althoughwe will touch on such ‘practical’ issues as collateral and bank–borrowerrelationships, the focus of this chapter will be on the market failures thatcan arise as a consequence of asymmetric information, including creditrationing, under-investment and over-investment. These issues carry im-portant policy implications about whether governments should encour-age or discourage entrepreneurship. Chapter 6 considers other sourcesof funds, including equity finance, trade credit, group lending schemesand borrowing from family and friends. Chapter 7 summarises evidenceon whether, and to what extent, entrepreneurs face credit rationing.
Part III investigates what happens to new ventures after they arelaunched. Chapter 8 discusses theory and evidence about job creationby entrepreneurs, and their labour supply and retirement behaviour.Chapter 9 analyses the growth, innovation and exit behaviour of newventures and small firms. With all of this apparatus in place, it is possi-ble to explore systematically the scope for governments to intervene inthe market to promote entrepreneurship. This is the subject of part IV(chapter 10). Government policies can take several forms, includingcredit market interventions, taxation and direct assistance and regula-tion. Chapter 11 concludes, and draws together some suggestions forfuture research where our understanding of particular issues is especiallyincomplete.

Introduction 5
1.3 Definition and measurement issues
The problem of defining the word ‘entrepreneur’ and establishing the boundariesof the field of entrepreneurship still has not been solved. (Bruyat and Julien, 2001,p. 166)
Our first and most pressing task is to define entrepreneurs andentrepreneurship. Unfortunately, this happens to be one of the mostdifficult and intractable tasks faced by researchers working in the field.There is a proliferation of theories, definitions and taxonomies of en-trepreneurship which often conflict and overlap, resulting in confusionand disagreement among researchers and practitioners about preciselywhat entrepreneurship is (see Parker, 2002a). For example, consider thefollowing illustrative and abbreviated set of viewpoints. In applied work,labour economists often equate entrepreneurs with the self-employed, onthe grounds that the self-employed fulfil the entrepreneurial function ofbeing risk-bearing residual claimants. However, others think this defini-tion is too broad, claiming that only business owners who co-ordinatefactors of production (in particular, those who employ workers) are re-ally entrepreneurs. Still others think that the economist’s definition is toonarrow, because it excludes entrepreneurship in the corporate and socialspheres. Then there are those steeped in the Schumpeterian tradition whoargue that entrepreneurship is identified primarily with the introductionof new paradigm-shifting innovations. Others again have emphasised psy-chological traits and attitudes supposedly peculiar to entrepreneurship.And so the list goes on.
It is easier to define the terms ‘self-employed’ and ‘self-employment’,though even here there are measurement problems and disagreements,which we discuss below. Given the widespread availability of data on theself-employed in government and private surveys world wide, it is alsoan easier entity to operationalise in empirical research (Katz, 1990). Tocut through a paralysing and ultimately fruitless debate, and to achieveconsistency, we will adopt the following convention in this book. At theconceptual level, the terms ‘entrepreneur’ and ‘entrepreneurship’ will beused; at the practical level, where issues of measurement, estimation andpolicy are involved, we will use the closest approximation to the manifes-tation of entrepreneurship that appears to be suitable. That will usuallybe ‘self-employment’, though occasionally the term ‘small firm’ will bemore relevant. Note that the problems of defining ‘small’ firms are alsonon-trivial. Firm-size definitions are arbitrary and industry-specific, andare not obviously congruent with entrepreneurship. Not all entrepreneursrun small firms, and not every small firm is run by an entrepreneur (Brockand Evans, 1986; Holtz-Eakin, 2000).

6 The Economics of Self-Employment and Entrepreneurship
The self-employed are often taken to be individuals who earn no wageor salary but who derive their income by exercising their profession orbusiness on their own account and at their own risk. Likewise, partnersof an unincorporated business are usually classified as self-employed. Itis sometimes helpful to partition the self-employed into employers andown-account workers (the latter of which work alone), or into owners ofincorporated or unincorporated businesses. In most countries, incorpo-ration of a business renders it susceptible to company law, which requiresthe owner to publicise stipulated data about the business. In the UK andUSA, for example, these include audited accounts if business turnoverexceeds a specified level. Despite the costs and inconvenience involved,there are several advantages to incorporation. They include: protec-tion from creditors via limited liability; favourable pension contributionrules; greater credibility with customers (Storey, 1994b); and paymentof corporation tax on company profits, which at high owner incomesmay be substantially lower than personal income tax rates (Fuest, Huberand Nielsen, 2002). Incorporated business owners can either receive anemployee salary as a director of their company, or they can pay themselvesdividends – so escaping payroll taxes in some jurisdictions, includingthe UK. Most self-employed people in most countries own unincorpo-rated businesses,3 which renders their incomes liable to personal incometax.
The first definitional problem is that in many countries (including theUK and USA), owners of incorporated businesses are defined as em-ployees rather than self-employed. This is despite them resembling in allother respects (e.g. residual claimant status) the ‘self-employed’. This issometimes an important distinction in applied self-employment research.
Second, for some individuals, the legal and tax-based definitions of self-employment are at variance with each other. In law, the issue comes downto whether there is a contract of service or a contract for services. The firstindicates paid-employment, the second self-employment.4 In contrast,different criteria are often used for determining who is self-employed forthe purposes of income taxation and social security eligibility. There is noshortage of examples where the legal and tax definitions fail to coincide(Harvey, 1995; Dennis, 1996).
Third, in many government surveys used in empirical research, self-employment status is self-assessed by the survey respondents. This canlead to further differences in the classification of workers, compared withlegal and tax-based definitions (Casey and Creigh, 1988; Boden andNucci, 1997). Partly for this reason, some surveys (e.g. the UK LabourForce Survey (LFS) and the US Characteristics of Business Owners(CBO)) use tax-based definitions of self-employment.

Introduction 7
Fourth, there appears to be a ‘grey area’ between paid-employment andself-employment. Some workers classified as self-employed with apparentautonomy over their work hours are effectively employees, being ‘periph-eral’ workers subordinated to the demands of one client firm (Pollert,1988; Harvey, 1995). For example, Harvey (1995) contends that, in theconstruction industry, most self-employed workers are to all intents andpurposes direct employees, working exclusively for one contractor, andproviding independently only their labour.5 Employers provide the mate-rials, capital and plant and set the terms of work and pay. This is a poten-tial matter of concern to policy makers to the extent that self-employedworkers are engaged on worse terms than employees, lacking job secu-rity, entitlement to holidays, sick pay, employment protection, or tradesunion rights. It is sometimes argued that employers actively seek to or-ganise their workforce in self-employment contracts, to cut costs and toavoid their social obligations.6
This debate is related to one on contracting-out of labour by large firms,a phenomenon that was thought to have been particularly pronouncedin the 1980s, a decade when self-employment rates in several countriesincreased dramatically. Hakim (1988) pointed to some evidence that UKfirms made some limited moves during the 1980s to outsource work toself-employed contractors. However, according to Blackburn (1992) sub-contracting has always existed and the increase in the UK in the 1980swas relatively slight. Also, case study evidence from Leighton (1982)suggested that many employers prefer hiring employees to self-employedcontractors even in industries where self-employment is relatively com-mon. Benefits of hiring employees directly include greater control, disci-pline and stability. If this argument is valid, it suggests that the amount of‘grey’ self-employment in the form of outsourced labour has not growndramatically in the recent past, and is presumably likely to remain stablein the near future.
Other examples of workers in the ‘grey area’ between employment andself-employment include commission salespersons, freelancers, home-workers and tele-workers,7 workers contracted through temporary em-ployment agencies and franchise holders. Regarding the latter, it isoften difficult to determine whether a franchise is an independent smallbusiness or part of a large firm. Felstead (1992) argued that many ‘self-employed’ franchisees are effectively directed by their franchisor, whoholds most of the ownership rights and has a senior claim on profits.With relatively little discretion about the format of their business, onecould certainly claim that some franchisees resemble branch managersmore than independent entrepreneurs. On the other hand, one couldargue that a self-employed retailer who is pressurised into stocking the

8 The Economics of Self-Employment and Entrepreneurship
goods of mainly one goods manufacturer also has limited discretion aboutthe nature of his or her business. And like other self-employed workers,franchisees face uncertainty. In their case, not only is their income un-certain, but there is also a possibility that the franchisor will either go outof business, or refuse to renew the franchise agreement at the expirationof its term.8
Two other ‘grey’ categories include unpaid family workers who workin a business run by a self-employed person; and members of workerco-operatives, who are not obviously either employees or self-employedworkers in the conventional sense of the term. Both groups tend to bemore numerous in developing than in developed countries, and in ruralthan in urban areas. According to Bregger (1996, p. 5), ‘Unpaid familyworkers are persons who work on a family farm or in a family businessfor at least 15 hours a week and who receive no earnings or share ofthe profits of the enterprise’. Blanchflower (2000) detected substantialvariation within developed countries in the proportion of self-employedworkers who are unpaid family workers, being as high as 33 per cent inJapan, compared with 14 per cent in Italy and just 1.7 per cent in the USA.As Blanchflower points out, it may not make sense just to discard unpaidfamily workers from the self-employment count, since they often shareindirectly (e.g. via consuming household goods) the proceeds generatedby the business. Worker co-operatives are also relatively uncommon in theUK, and tend to be larger and better established in European countries,such as France, Italy and Spain (Spear, 1992).
Section 1.4 documents some international evidence on levels of, andtrends in, aggregate self-employment rates. At the aggregate level, it islikely that alternative measures of self-employment are highly correlatedwith each other, allowing trends within a given country to be identifiedfairly reliably (Blau, 1987). However, to the extent that different countriesuse different definitions of self-employment, cross-country comparisonsof levels have to be treated with caution.
1.4 International evidence on self-employment ratesand trends
There is great diversity in the level and time-series pattern of self-employment rates across countries. This is evident from tables 1.1, 1.2 and1.3, which summarise data for a selection of OECD countries, EasternEuropean transition economies and developing countries, respectively.9
Two additional features of these tables stand out. One is that self-employment rates are higher on average in developing than developedcountries. A second is that the treatment of agricultural workers makes

Introduction 9
Table 1.1 Aggregate self-employment rates in some selected OECDcountries, 1960–2000a (per cent)
1960 1970 1980 1990 2000
A All workers
USA 13.83 8.94 8.70 8.50 7.33Canadab 18.81 13.20 9.74 9.52 10.66Japan 22.68 19.18 17.18 14.05 11.34Mexico 34.25 31.29 21.67 25.64 28.53Australia 15.86c 14.09 16.16 15.05 13.49Franceb 30.51 22.17 16.79 13.26 10.56Italy 25.93 23.59 23.26 24.53 24.48Netherlandsb 21.87 16.65 12.23 9.64 10.46d
Norway 21.79 17.90 10.03 9.24 7.03Spainb 38.97 35.59 30.47 26.27 20.49UK 7.28 7.36 8.05 13.32 11.34
B Non-agricultural workers
USA 10.45 6.94 7.26 7.51 6.55Canadab 10.17 8.33 7.05 7.40 9.46Japan 17.38 14.44 13.75 11.50 9.35Mexico 23.01 25.20 14.33 19.89 25.48Australia 11.01c 10.00 12.73 12.34 11.72Franceb 16.90 12.71 10.71 9.32 8.06Italy 20.60 18.97 19.20 22.24 23.21Netherlandsb 15.08 12.02 9.06 7.84 9.25d
Norway 10.14 8.61 6.53 6.12 4.83Spainb 23.60 21.55 20.63 20.69 17.69UK 5.89 6.27 7.11 12.41 10.83
Notes: aSelf-employment rates defined as employers plus persons working on their ownaccount, as a proportion of the total workforce.bIncludes unpaid family workers c 1964 not 1960 d 1999 not 2000.Source: OECD Labour Force Statistics, issues 1980–2000, 1970–81 and 1960–71.
a substantial difference to measured self-employment rates in most (butnot all) countries.
1.4.1 The OECD countries
Consider the USA first. According to table 1.1,10 if agricultural workersare included, the US self-employment rate has been in continual declinesince at least 1960. According to Steinmetz and Wright (1989), this de-cline can actually be traced back to the 1870s, when the self-employmentrate stood at just over 40 per cent of the labour force, and it underwentan especially steep decline between 1950 and 1970 (see also table 1.1).11

10 The Economics of Self-Employment and Entrepreneurship
Table 1.2 Aggregate self-employment rates in some selected transitioneconomies, 1980–1998/1999a (per cent)
1980 1990 1992 1994 1998/99b
Poland (all workers) 25.44 27.17 22.44(non-agricultural) 3.37 9.16 11.70
Russian Federation 0.76 5.29Czech Rep. (all workers) 10.18 14.59
(non-agricultural) 10.25 14.50Hungary (all workers) 16.93 14.56
(non-agricultural) 16.94 12.81Slovak Rep. (all workers) 6.21 7.80
(non-agricultural) 6.49 8.00
Notes: aSelf-employment rates defined as employers plus persons working on their ownaccount, as a proportion of the total workforce.b ‘1998/99’ is 1998 for Poland and 1999 for the Russian Federation.Source: UN Yearbook of Labour Statistics, various issues.
Table 1.3 Aggregate self-employment rates in developing countries,1960s–1990sa (per cent)
1960sb 1970sb 1980sb 1990sb
Africa
Mauritius 13.03 10.30 n.a. 16.72Egypt 29.19 26.14 28.20 27.19
Americas
Bolivia n.a. 48.86 40.27 34.81Costa Rica 20.78 17.10 21.80 24.70Dominican Rep. 44.79 29.44 36.46 37.11Ecuador 42.97 37.81 37.27 37.03
Asia
Bangladesh 7.33 45.56 38.83 29.59Korean Rep. 44.04 33.92 33.07 28.02Pakistan 21.94 46.90 55.95 48.18Sri Lanka 26.94 22.90 24.74 26.68Thailand 29.83 29.65 29.75 28.45
Notes: aSelf-employment rates defined as employers plus persons working on their ownaccount, as a proportion of the total workforce. Includes agricultural workers.b ‘1960s’ is either 1960, 1961, 1962 or 1963 for all countries; ‘1970s’ is some year between1970 and 1976; ‘1980s’ is 1980 or 1981 except Ecuador (1982), Costa Rica (1984) andBolivia (1989); ‘1990s’ is some year between 1990 and 1996.Source: UN Yearbook of Labour Statistics, various issues.

Introduction 11
However, if agricultural workers are excluded, table 1.1 shows that a re-vival in US self-employment occurred during the 1970s and 1980s, afinding that has also been observed by some other authors.12 But unlikethese other authors, table 1.1 reveals that this revival in non-agriculturalUS self-employment has apparently come to an end: by 2000 the non-agricultural self-employment rate had fallen back to below its 1970 level.
The US experience is mirrored by France, which has also seen its over-all self-employment rate decline steadily since the start of the twentiethcentury (Steinmetz and Wright, 1989).13 However, this trend is not ob-served in every OECD country. For example, table 1.1 shows that bothCanadian self-employment rates exhibited U-shaped patterns, increas-ing particularly strongly in the 1990s.14 In contrast, both measures of theUK self-employment rate increased dramatically in the 1980s, a findingthat attracted substantial research interest when it was first discovered(Hakim, 1988; Campbell and Daly, 1992). It declined in the 1990s, es-pecially among males (Moralee, 1998). According to Storey (1994a), theUK historical trend in self-employment was one of steady decline be-tween 1910 and 1960, followed by increase from 1960 to 1990, with therate in 1990 being similar to that in 1910.
Most researchers tend to exclude agricultural workers from their def-initions of self-employment, on the grounds that farm businesses havevery different characteristics to non-farm businesses. It has been knownat least since Kuznets (1966) that the agricultural sector tends to declineas an economy develops – and that this may distort self-employmenttrends (Blanchflower, 2000). Consequently, to analyse trends we focushenceforth on panel B of table 1.1. These data indicate a striking varietyof patterns over 1960–2000. Four countries (Japan, France, Norway andSpain) had steadily declining self-employment rates. Six witnessed a re-vival in self-employment at some point within the period (USA, Canada,Mexico, Italy, the UK and the Netherlands); and one (Australia) had arelatively stable self-employment rate.
Finally, we will say a word about the relative importance of small firmsin the economy. The overwhelming majority of US businesses employfewer than five individuals (see, e.g. White, 1984; Brock and Evans, 1986,chapter 2, for details). There are high rates of business formation and dis-solution among small firms, especially in industries like retailing, wherelow capital requirements make entry easy and keep profits modest. Theaggregate number of small businesses grew in the USA in the post-warperiod, but their relative economic importance (measured in terms oftheir employment share or share of gross domestic product (GDP)) de-clined somewhat over that period. The most recent evidence suggests thatthe share of private non-farm GDP accounted for by small businesses in

12 The Economics of Self-Employment and Entrepreneurship
the USA has now stabilised, at around 50 per cent over the last twodecades (SBA, 2002a). That the earlier decline was not greater is mainlyattributable to the growth of the service sector, in which small firms aredisproportionately concentrated. We will return to the issue of changingindustrial structure later in the book.
1.4.2 The transition economies of Eastern Europe
Of special interest are the so-called ‘transition economies’ of EasternEurope, which underwent a switch from communist central planning toa more market-based system at the end of the 1980s. In the words ofEarle and Sakova (2000, p. 583): ‘it is difficult to imagine a regime morehostile towards self-employment and entrepreneurship than the centrallyplanned economies of Eastern Europe.’ These regimes fixed prices andwages, placed restrictions on hiring workers and acquiring capital andlevied confiscatory taxes on entrepreneurs. This is reflected in the lownon-agricultural self-employment rates observed in Poland in 1980, andin Russia in 1992 (see table 1.2).15
Part of the interest in studying the transition economies is that theyserve as a test-bed for the strength of dormant entrepreneurial vigourthat could be released after market liberalisation.16 Real opportunitiesemerged for entrepreneurs to exploit market gaps left by the previouscommunist regimes, especially in the provision of services and the pro-duction of consumer goods. The incentive to become self-employed wasno doubt enhanced by declining opportunities in wage employment andgrowing unemployment as the sprawling former state-run companies be-gan to contract in the 1990s. But although legal barriers to private enter-prise and self-employment came down after 1989, bureaucracy and thelimited rule of law has continued to stifle productive entrepreneurship inmany of these countries (Baumol, 1990, 1993; Dutz, Ordover and Willig,2000). For example, Baumol contended that, although the supply of en-trepreneurs varies from country to country, probably a greater source ofvariation in entrepreneurs’ social productivity is the scope to engage inprivately profitable but socially unproductive rent-seeking and organisedcrime. If payoffs to such activities are sufficiently high, entrepreneurs willrationally divert effort from productive innovation to exploit them. It re-mains to be seen what will happen to productive entrepreneurship in thetransition economies as we move further into the twenty-first century.17
1.4.3 Developing countries
In the early post-war period, researchers attached great importanceto fostering entrepreneurship in developing countries. In the words of

Introduction 13
W. Arthur Lewis (1955, p. 182): ‘Economic growth is bound to slowunless there is an adequate supply of entrepreneurs looking out for newideas, and willing to take the risk of introducing them.’ According to Leff(1979), interest in the issue had dwindled by the 1970s. Leff asserted thatthis was because of a perception that the entrepreneurial problem hadbeen ‘solved’, with high rates of real output growth serving as evidence ofentrepreneurial vigour. Subsequently, slower growth, high rates of pop-ulation growth, widespread failures of state-owned enterprises (SOEs),constraints on public sector employment and the spread of free-marketbeliefs reactivated interest in promoting entrepreneurship in developingeconomies.
Table 1.3 shows that, on average, developing countries have markedlyhigher self-employment rates than developed countries. Nevertheless,table 1.3 also reveals considerable variation in these rates. It has been not-ed elsewhere that Asian countries often have very high self-employmentrates, sometimes exceeding half the workforce.18 However, in contrast toclaims by some previous researchers that the trend in developing countriesis away from self-employment (Blau, 1987; Schultz, 1990), the evidencein table 1.3 reveals that no such trend can be generally established.
Why are self-employment rates so high in developing countries? We willreturn to the broad issue of economic development and entrepreneurshiplater in the book; here we consider just two specific factors. First, the datain table 1.3 (and those used in most other studies of these countries) in-clude agriculture. Agriculture plays a prominent role in the economies ofmany developing countries, in which high self-employment rates are tra-ditionally found. Second, high self-employment rates may reflect limiteddevelopment of formal economic and financial markets. For example,Leibenstein (1968) argued that entrepreneurship in developing coun-tries often simply involves overcoming constraints caused by poor eco-nomic and financial infrastructure, and is quite basic in nature. Thisviewpoint is related to the long-standing dual labour market model ofdevelopment, comprising a formal urban sector in which employees earnpremium wages, and an informal rural sector in which entrepreneurs re-ceive below-average incomes (Lewis, 1955; Harris and Todaro, 1970).The model predicts that as poor economies develop, labour will movefrom the informal to the formal sector, with a decline in self-employment.However, evidence from the field refutes both the prediction of higher in-come in paid-employment in developing countries, and the prediction ofworkers shifting from self- to paid-employment as they age.19 Arguably,more recent economic theories offer greater scope for explaining highself-employment rates in developing countries. We return to this topic inchapter 3, section 3.3.

14 The Economics of Self-Employment and Entrepreneurship
1.5 Self-employment incomes and income inequality
This section attempts three tasks. First, we discuss issues relating to thedefinition and measurement of self-employment incomes, and review ev-idence about the levels of and trends in average self-employment incomesrelative to average paid-employment incomes. Second, we analyse the in-equality of self-employment incomes. Third, we review evidence fromearnings functions on the determinants of self-employment incomes.
1.5.1 Incomes and relative incomes
Measurement issuesSelf-employment income can be measured in several different ways. Con-sider the following identity:
Net profit ≡ Revenue − Costs ≡ Draw + Retained earnings.
Net profit from running an enterprise is a widely used measure of self-employment income. An alternative is Draw, the amount of money drawnfrom the business on a regular basis by the owner. This represents theconsumption-generating value of the business and as such may be lessprone to income under-reporting. A less frequently used third measureis Draw augmented by the growth in business equity (Hamilton, 2000).
It should be stressed at the outset that any analysis of self-employmentincome data should be performed with the utmost caution. There areseveral reasons for this:1. Income under-reporting by the self-employed. This is possibly the most se-
rious problem with using self-employment data. It is partly attributableto self-employed respondents who over-claim business tax deductions,or under-report gross incomes to the tax authorities, mistrusting inter-viewers’ claims that they are truly independent of the tax inspectorate.Ways of estimating self-employment income under-reporting rates arediscussed in chapter 10, subsection 10.4.1.
2. Different ways of treating owners of incorporated businesses. Incorporatedself-employed individuals are usually treated as employees of theircompany. Because they are richer on average, their exclusion fromthe self-employed sample may bias downwards the average income ofthe self-employed.20 On the other hand, including the incorporatedself-employed is not without its problems, since it is not clear how tointerpret the salary that an incorporated self-employed business ownerchooses to pay her/himself.
3. Relatively high non-response rates to survey income questions by the self-employed. This problem can be quite pervasive and can substantiallybias estimates of absolute and relative returns to self-employment

Introduction 15
(Devine, 1995).21 There are several possible reasons for survey non-response. One is mistrust of survey interviewers by self-employed re-spondents, for the reasons given above. A second is that richer people(of whom a disproportionate number are self-employed – see below)have a higher marginal valuation of time, so participate less in sur-veys. Third, many self-employed do not accurately know their incomes,which according to Meager, Court and Moralee (1994) accounted fortwo-thirds of missing British income cases in the 1991 British House-hold Panel Survey (BHPS) – rather than refusal to co-operate with thesurvey.
4. A failure to deal properly with negative incomes and ‘top-coding’ can in-troduce biases (Devine, 1995). Many researchers either drop negativeincome observations or round them up to a small positive numberbefore applying logarithmic transformations; both practices impart anupward bias to average self-employment income. Top-coding on theother hand, which is a procedure of truncating very high earnings val-ues to a maximum level, imparts a downward bias.
5. Ignoring employee fringe benefits that are unavailable in self-employment bi-ases upwards any relative income advantage to self-employment. Someof these benefits can be substantial, especially employer contributionsto health care and occupational pension schemes (Holtz-Eakin, Penrodand Rosen 1996; Wellington, 2001).
6. Self-employment incomes include returns to capital as well as returns tolabour. National Accounts’ experts have long argued about how bestto disentangle these returns, which might explain why few researcherschoose to separate them in practice.22 Headen (1990) proposed anespecially straightforward approach, which works as follows. Let h j ,yj and w j denote an individual’s work hours, total ‘labour’ incomeand wage rate respectively in sector j = {E, S }, where E is paid-employment and S is self-employment. Also, let yk denote returnsto capital in self-employment. While h j and yj values are observedin most data sets, w j s are not and must be calculated (in E) or esti-mated (in S ). We have yE = wEhE and yS = wShS + yk. To estimateyk, first calculate wE = yE/hE and estimate an ‘earnings function’ likeln wE = β ′X + u, where X is a vector of personal characteristics, β isa vector of coefficients and u is a random disturbance (see chapter 1,subsection 1.5.3). This yields parameter estimates β. Second, predictwS for the self-employed from ln wS = β ′X. This can be taken as thereturn to self-employed labour assuming (i) that employee incomesare purely returns to labour, and (ii) that the self-employed have thesame rates of return to personal characteristics as employees do (seesubsection 1.5.3 for a critical assessment of this assumption). Finally,

16 The Economics of Self-Employment and Entrepreneurship
denoting sample mean values by overbars, calculate
yk/hS = yS/hS − wS .
Using this approach Headen (1990) estimated the returns to labourand capital as, respectively, 84 and 16 per cent for a sample of USself-employed physicians in 1984.In practice, few researchers have addressed any of the above six prob-
lems in much depth. Only the first two have attracted any real attention,but even here the coverage has been uneven. This caveat should be bornein mind when interpreting the following evidence.
International evidence on relative average self-employmentincomes and trends
Standard economic theory predicts that workers move between occupa-tions until incomes in each occupation are equalised. However, that pre-diction must be qualified when one takes into account the heterogeneityof individual abilities and job characteristics, including non-pecuniarycompensating differentials, risk and over-optimism among individualschoosing risky occupations. As will be seen below, few studies havefound equality between average incomes in self-employment and paid-employment.
In the USA, the evidence on the relative income position of the self-employed is mixed. This is no doubt partly attributable to the differentincome definitions and sampling frames used in different data-sets. How-ever, there is a tentative emerging consensus that the self-employed earnless on average than employees do.23 Hamilton (2000) conducted anespecially thorough study of relative self-employment incomes. Becauseof the pronounced income inequality of self-employment incomes (seebelow), Hamilton analysed median rather than mean incomes. Hamiltoncontrolled for experience when comparing incomes in self-employmentand paid-employment, and utilised all three different measures of self-employment income described at the start of this section. Using 1984Survey of Incomes and Program Participation (SIPP) data on personalcharacteristics, Hamilton estimated that on average all individuals exceptthose in the upper quartile of the self-employment income distributionwould have earned more, and enjoyed higher future income growth rates,if they had quit self-employment and become employees. For example,for individuals in business for ten years the median earnings differentialwas 35 per cent in favour of paid-employment. This finding, which wasfound to be robust to different definitions of self-employment income,may under-state the true differential since it does not take account ofemployee fringe benefits such as employer-subsidised health insurance.

Introduction 17
Conversely, however, Hamilton may have over-stated the income differ-ential by ignoring the possibility of income under-reporting and businesstax deduction opportunities for the self-employed.
There is also evidence that US median incomes in self-employmenthave lagged behind median employee incomes for several decades(Carrington, McCue and Pierce, 1996: Current Population Survey(CPS) data, 1967–92).24 Aronson (1991: US Social Security data, 1951–88) showed that a 48 per cent income advantage to the self-employed in1951–4 had dwindled to a 23 per cent advantage by 1975–9. This be-came a 10 per cent disadvantage by 1980–4, widening to a 20 per centdisadvantage by 1985–8. It appears that a similar story holds irrespectiveof occupation and education (SBA, 1986); and adjusting for the longeraverage work hours of the self-employed reduced further their relativeincome position – by around 70 per cent according to Aronson (1991).
The UK has also witnessed a downward trend in relative averageself-employment incomes since the 1970s (Robson, 1997; Clark andDrinkwater, 1998).25 In contrast to the USA, the UK evidence points to arelative income advantage to self-employment. Disagreement centres onhow large this advantage is. General Household Survey (GHS) micro-data point suggests a small premium to self-employment of 7 per centover 1983–95, according to Clark and Drinkwater (1998) (see alsoMeager, Court and Moralee, 1996). In contrast, aggregate UK NationalAccounts data suggest a greater difference, of 35 per cent in terms ofpre-tax gross income in 1993 according to Robson (1997). It may be rel-evant that the latter, unlike the former estimate, includes an adjustmentfor income under-reporting by the self-employed.
Evidence from eleven OECD countries supports the notion that inmany countries the self-employed are not well remunerated relative to em-ployees. According to OECD (1986), only in West Germany did the ratioof median self-employment to paid-employment incomes exceed unity.In Finland, Sweden and Japan the ratios were below that of the USA.Similar evidence was also found independently by Covick (1983) andKidd (1993) for Australia; and Covick noted the same downward trendin relative self-employment incomes as observed in the USA and the UK.
The special circumstances prevailing in the transition economies ofEastern Europe may help explain why opposite findings have been foundthere. Earle and Sakova (2000) studied self-employment choices andincomes in six Eastern European countries between 1988 and 1993:Poland, Russia, Slovakia, Bulgaria, Hungary and the Czech Republic.They found that, in all countries apart from Poland, the mean income ofemployees was less than that of own-account self-employed individuals,which in turn was less than the mean income of self-employed employers.

18 The Economics of Self-Employment and Entrepreneurship
We conclude this section with three puzzles. One is why, if the self-employed in the USA earn less on average than employees do, and if theyare only moderately older on average than employees are, they neverthe-less possess substantially greater savings and asset holdings (Quadrini,1999; Gentry and Hubbard, 2001). A second puzzle is why individualsremain in self-employment despite apparently earning less and work-ing longer hours (see chapter 8, section 8.2) than employees do. Third,why do entrepreneurs invest in undiversified and hence risky private busi-nesses, when they could obtain similar rates of return from less risky pub-licly traded equity (Moskowitz and Vissing-Jørgensen, 2002)? A possibleanswer to the first puzzle is income (but not asset) under-reporting by theself-employed, reflecting the greater taxation of income than wealth. Atentative answer to the second puzzle is proposed in section 8.2. Possibleanswers to the third include non-pecuniary benefits to entrepreneurship,a preference for skewed returns and systematic over-estimation by en-trepreneurs of the probability of survival and success in entrepreneurship.
1.5.2 Income inequality
It is now well established that in most countries the incomes of the self-employed are more unequal than employees’ are. This fact usually be-comes immediately obvious when histograms of incomes are graphed sep-arately for the two groups.26 Relatively large numbers of the self-employedare concentrated in the lower and upper tails of their income distribution,compared with employees. Consequently, when data from the two occu-pations are combined, the self-employed are invariably observed to bedisproportionately concentrated in both the upper and lower tails of theoverall income distribution. In their British analysis based on 1991 BHPSdata, Meager, Court and Moralee (1996) showed that this result is not anartefact of sampling error, and remained after controlling for observablecharacteristics such as gender, work status, work hours, age, education,industry and occupation.27
The same story of pronounced self-employment income inequality isobserved when sample data are mapped into scalar inequality measures,such as the Gini coefficient or the mean log deviation.28 Typical resultswere obtained by Parker (1999b), who computed a range of inequalitymeasures from UK Family Expenditure Survey (FES) data over 1979–1994/5. Parker reported that self-employment income inequality indiceswere between two and five times as great as those for employees, depend-ing on the year and the particular inequality index chosen.29 Arguably theUK context is particularly interesting because self-employment incomeinequality grew especially rapidly in the 1980s, the same decade when

Introduction 19
self-employment itself expanded substantially (see subsection 1.4.1). Theincreased self-employment income inequality in the 1980s was largeenough for Jenkins (1995) to cite it as the primary reason for the growth ofoverall UK income inequality in the 1980s, exacerbated by a greater self-employment population share. Subsequently, Parker (1999b) reportedthat by the mid-1990s UK self-employment income inequality had fallenback from its 1991 peak.
Why does self-employment income inequality tend to be so high? Moregenerally, what are the underlying factors generating self-employment in-come inequality? There is little theoretical guidance at present to helpus answer these questions. While Rosen’s (1981) theory of ‘superstars’explains why the most talented individuals command salaries that aredisproportionately higher than those of their nearest rivals, this theorycannot explain income dispersion among the bulk of the self-employed,who earn much more modest incomes. Likewise, while it follows thatif idiosyncratic ability augments the returns of entrepreneurs but not ofemployees then the upper tail of the income distribution will be dispro-portionately full of entrepreneurs (Lazear, 2002), this assumption aboutability is demanding and may not be warranted. And Parker’s (1997b)parametric model of the self-employment income distribution, whichcombines several stylised facts about income dynamics and firm sizegrowth processes, does not really reveal the underlying causes of incomedispersion.30
Unfortunately, empirical work has not improved our understandingof the causes of self-employment income inequality much either. Usingincome inequality decomposition techniques, Parker (1999b) found thatnone of age, gender, marital status, region, occupation, work status, oreducational qualification explained more than a small fraction of UKself-employment income inequality levels or trends. In contrast, thesevariables helped explain a sizeable share of employee income inequality.Parker concluded that these results reflect the marked heterogeneity ofthe self-employed, heterogeneity that increased in Britain in the 1980salong some unmeasured dimensions. It will be seen below how attemptsto explain average self-employment incomes themselves (rather than theirinequality) have also met with only limited success.
Another issue is the extent to which self-employment facilitates earn-ings and social mobility. Holtz-Eakin, Rosen and Weathers (2000)reported that becoming self-employed increases upward earnings mo-bility for low-income Americans, relative to remaining as employees.But the opposite was found for high-income Americans, for whomself-employment entailed downward mobility. Regarding social mobility,measured in terms of social class, the sociological literature reports mixed

20 The Economics of Self-Employment and Entrepreneurship
results (e.g. compare Mayer, 1975 with Bland, Elliott and Bechhofer,1978).
Finally, we mention for completeness that even less is known aboutthe wealth distribution of entrepreneurs. Although there are models ofentrepreneuria wealth transfers and accumulation (Shorrocks, 1988;Banerjee and Newman, 1993; Parker, 2000), none explains why wealthdistribution takes its observed shape. According to estimates compiled byParker (2003b), older self-employed Britons enjoy above-average wealthholdings, yet only moderate wealth inequality.
1.5.3 Earnings functions
MethodsIn this subsection we ask whether it is possible to explain individuals’self-employment incomes in terms of a few personal and economic vari-ables. The most popular method for attempting this is estimation of a so-called ‘earnings function’. Earnings functions were originally developedby human capital theorists to explain the determinants of employmentearnings. An earnings function typically regresses log earnings, ln y, ona set of explanatory variables that includes age or experience, a, years ofeducation, s ch and a vector of other personal and family characteristics,X. Let u be a stochastic disturbance term, and index individuals by i ina sample of size n. Employee earnings functions typically take the form
ln yi = β0 + β1ai + β2a2i + β3s chi + γ ′Xi + ui i = 1, . . . , n ,
(1.1)
where the βs and γ are coefficients. The β3 coefficient measures the rateof return to an extra year of education, and for this reason is of particularinterest to human capital theorists.
In principle, it is a straightforward matter to estimate (1.1) using asample of self-employed individuals. However, there are several reasonswhy one would expect the coefficients of (1.1), and their interpretation,to differ from those obtained using employee samples.
First, the self-employed rate of return to schooling may differ fromemployees’ rate of return. On one hand, entrepreneurial success is likelyto depend on numerous factors other than formal education, implyingthat the self-employed β3 will be low relative to its value for employees(Brown and Sessions, 1998, 1999). Indeed, formal education mighteven inculcate attitudes that are antithetical to entrepreneurship (Casson,2003). On the other hand, if employers demand education from theirworkers primarily as an otherwise unproductive screening device (the‘screening hypothesis’), then the self-employed who do not face this

Introduction 21
requirement can be expected to quit education before its rate of returnfalls as low as that of employees’. This implies that, if screening occurs,the self-employed β3 will be relatively high (Riley, 1979).31
Second, the self-employed earnings–age profile may differ from thatof employees. In terms of (1.1), a steeper profile implies a larger β1
and/or a smaller β2 coefficient. There are at least three reasons whythe self-employed earnings–age profile may be steeper than that ofemployees. First, the self-employed do not share the returns of their hu-man (or physical) capital investments with employers, who might smoothout their costs and returns over employees’ lifetimes. Second, if the self-employed learn about their abilities over time with the ablest surviving( Jovanovic, 1982), then one might expect to see any self-employed co-hort’s average returns increase over time. Third, investment in physicalcapital reduces earnings of the young self-employed, while the returns ofthat investment accrue to the older self-employed – again implying a steepearnings-age profile. On the other hand, if employees can shirk on the job,then employers may respond by steepening employees’ earnings profilesin order to elicit appropriate worker effort (Lazear and Moore, 1984).Naturally, no such agency problem arises in self-employment where theprincipal is the agent.32
These considerations suggest that earnings functions should be esti-mated separately for employees and the self-employed. It is not advisableto estimate an earnings function that pools data on the two occupations,such as
ln yi = β ′Xi + δzi + ui (1.2)
(as in, e.g. Amit, Muller and Cockburn, 1995), where zi is an indicator(dummy) variable for self-employment/paid-employment status. While(1.2) looks attractive by providing a direct estimate of relative occupa-tional earnings advantage, it imposes the strong restrictions of identicalrates of return to all of the explanatory variables for both occupations,which, for the reasons given above, are unlikely to hold.
When estimating earnings functions, it is necessary to avoid selectionbias. Incomes are observed only in the occupation that individuals chooseto participate in; and those who participate in self-employment mightnot be a random sample from the population. Rather, they might pos-sess characteristics that make them particularly favourably disposed toself-employment. Without correcting for this, the estimated coefficientsof (1.1) will be susceptible to bias. By correcting for this bias, it becomespossible to ask whether self-employed people (and employees) could im-prove their lot by switching into the other occupation. A popular practicalway of removing selection bias is Heckman’s (1979) method.

22 The Economics of Self-Employment and Entrepreneurship
Heckman’s method comprises two steps. The first step estimates theparticipation equation
zi = ω′Wi + vi , (1.3)
where zi is an indicator variable equalling 1 if individual i is self-employedand 0 otherwise; Wi is a set of explanatory variables, ω is a vector ofcoefficients and vi is a disturbance term, with unit variance. Second,having computed fitted values zi from this regression, the ‘Inverse MillsRatio’ λi = −φ(zi )/�(zi ) is added to the right-hand side of (1.1), whereφ(·) and �(·) are the density and cumulative distribution functions ofthe standard normal distribution. Thus one estimates the augmentedearnings function
ln yi = β0 + β1ai + β2a2i + β3s chi + γ ′Xi + αλi + ui , (1.4)
where α > 0 implies positive self-selection into self-employment.
ResultsVarious estimates of earnings functions of type (1.4) have been per-formed, using a variety of data sources and explanatory variables.33
Even more studies have estimated (1.1), i.e. without correcting forself-selection. Despite the heterogeneity of the studies to date, severalempirical regularities are detectable. First, rates of return to schoolingtend to be lower for the self-employed than for employees, and notconsistently positive and significant. For example, in their overview of theliterature, Van der Sluis, Van Praag and Vijverberg (2003) documentedan average rate of return of 6.1 per cent for self-employed Americans,compared with 7–9 per cent for American employees. In other countries,self-employed rates of return are usually lower still. These findings areconsistent with the idea that entrepreneurial skills are non-academic innature. They also do not support the screening hypothesis.34 Indeed, thescreening hypothesis is thrown into further doubt by additional findingsthat the self-employed acquire as much – and sometimes even more –formal education and vocational training as employees (Wolpin, 1977;Fredland and Little, 1981; Parker, 1999b).
Second, the evidence consistently points to flatter earnings–age profilesfor the self-employed than for employees. While this finding is in line withthe agency cost model of Lazear and Moore (1984) mentioned above,several caveats to this interpretation can be mentioned. They includemismeasurement of self-employment experience, and a failure to controlfor parental managerial experience, which is known to be very importantfor the self-employed (Lentz and Laband, 1990).
Third, few explanatory variables possess much explanatory power inself-employed earnings functions, resulting in poor goodness-of-fit: it is

Introduction 23
common to find R 2 values of 10 per cent and less. This is consistentwith the poor performance of univariate decompositions of self-employedincome inequality measures described earlier. In contrast, employeeearnings functions tend to provide much better fits.35 Subsequently, re-searchers have tried including a range of non-human capital variables inan effort to improve the explanatory power of self-employment earningsfunctions. These include dummies for industries, disabilities, ill-healthand immigration status. But few have improved matters noticeably inthis respect.
Fourth, on the sample selection issue, there is general disagreementamong the studies that have estimated (1.4) about the direction and sig-nificance of sample selection effects. There is therefore no clear-cut ev-idence that the self-employed select into self-employment because theyenjoy a comparative earnings advantage there. In contrast, many stud-ies find positive selection effects for wage employment, implying that theself-employed would earn more if they became employees.36 This mayreflect greater human capital (skills and experience) possessed by the self-employed, which commands a higher return in paid-employment than inself-employment.
ExtensionsWilliams (2001) extended the analysis of earnings comparisons to askwhether self-employed workers would earn more by becoming a fran-chisee (F) or an independent business owner (I). Williams estimatedselectivity-corrected profit functions in both F and I using data on 14,550firms taken from the 1987 CBO data set. Selectivity effects were foundto be important, with individuals in F earning less than those in I, aftercontrolling for personal characteristics. Furthermore, franchisees wereestimated to be substantially worse off if they became independent own-ers. These findings suggest that franchisees have relatively low averageability, whereas independent business owners have relatively high aver-age ability. A policy implication is that legal restrictions on franchisingactivities may therefore have deleterious effects on the material wellbeingof this group of self-employed people.
It is also possible that individuals mix their work hours between self-employment, S, and paid-employment, E. Work mixing appears to bemore widespread in developing than in developed countries (Sumner,1981; Vijverberg, 1986).37 If work mixing occurs, then (1.3) and (1.4)are inappropriate, and one should estimate a composite earnings functionof combined individual wages wi :
ln wi = (1 − ξi )β ′E XEi + ξiβ
′SXSi + ui , (1.5)

24 The Economics of Self-Employment and Entrepreneurship
where ξi is the proportion of work hours i devotes to S; the βs are vec-tors of coefficients; and the Xs are matrices of observations on personaland occupation-relevant characteristics. Because ξi may be endogenouslychosen, (1.5) can be estimated only after an equation for ξi is specifiedon a set of exogenous variables. This permits direct comparison of thetwo occupations’ β coefficients.
1.6 Some useful econometric models
This section describes several econometric models that have becomewidely used for explaining individuals’ decisions to participate in, to enterand to exit from, self-employment. The non-technical reader may skipthis section, though at the risk of missing some of the subtleties of theempirical results discussed later in the book.
1.6.1 Occupational choice and probit/logit models
Consider a cross-section of data on n individuals, indexed by i : i =1, . . . , n. There are two occupations denoted by j : self-employment,S, and paid-employment, E. Each individual has a vector of observedcharacteristics Wi and derives utility Ui j = U(Wi ; j ) + ui j if they work inoccupation j , where U(·; ·) is observable utility and ui j is idiosyncraticunobserved utility. Define the ‘latent’ variable (i.e. the relative advantageto S ) as
z∗i = U(Wi ; S) − U(Wi ; E) − ui E + ui S . (1.6)
If we assume that U(·; ·) is linear, taking the form U(Wi ; j ) = β ′j Wi , where
β j are vectors of coefficients, then we can write
z∗i = α + β ′Wi + vi , (1.7)
where β ′ := β ′S − β ′
E is a vector of coefficients, α := E[ui S − ui E] is anintercept, and where vi := ui S − ui E − α ∼ I I D(0, σ 2) is a disturbanceterm. Henceforth we shall incorporate the intercept term in Wi as a setof ones, so β will be treated as the complete set of coefficients.
Individual i chooses self-employment over paid-employment if z∗i ≥ 0.
Hence define the observable occupational indicator variable
zi :={
1 if individual i is observed in S, i.e. if z∗i ≥ 0
0 if individual i is observed in E, i.e. if z∗i < 0
Therefore the probability that an individual with characteristic vector Wi
is drawn from the population and appears in the sample is
Pr(zi = 1) = Pr(z∗i ≥ 0) . (1.8)

Introduction 25
The probit model assumes that the distribution of the disturbanceterm vi is normal. Hence Pr(zi = 1) = �(β ′Wi/σ ) and Pr(zi = 0) =1 − �(β ′Wi/σ ), where �(·) is the (cumulative) distribution function ofthe normal distribution. The likelihood function is
L =n∏
i=1
�(β ′Wi/σ )zi [1 − �(β ′Wi/σ )]1−zi . (1.9)
Non-linear methods are needed to maximise (1.9) to estimate the β pa-rameters (up to a scalar transformation since σ is unknown). It is standardto normalise σ 2 to unity without loss of generality.
The logit model arises if the distribution function of vi is assumed tobe that of the logistic distribution, in which case (1.8) becomes
Pr(zi = 1) = exp{β ′Wi }1 + exp{β ′Wi } . (1.10)
The likelihood function can be formed in a similar way as above and β ′
estimated in a like manner.In practice, estimates of β ′ tend to be insensitive to whether the probit
or logit assumption is made. Both estimators are widely implementedon computer software packages. Both dominate ordinary least squares(OLS) estimation of zi = β ′Wi + vi (called the linear probability model),since OLS is an inefficient and heteroscedastic estimator in this context,and problematically can predict probabilities outside the unit interval(see, e.g. Maddala, 1983).
It is often of interest to calculate the effects of changes in the kth ex-planatory variable of Wi , i.e. Wik, on the probability of self-employment.These effects are given by
∂ Pr(zi = 1)∂Wik
:={
βk for the linear probability modelβk Pr(zi = 1)[1 − Pr(zi = 1)] for the logit modelβkφ(β ′Wi ) for the probit model,
(1.11)
where φ(·) is the density function of the standard normal distribution. Inpractice, these calculations are usually evaluated at sample means of thevariables.
There are at least three distinct applications of the probit/logit model tooccupational choice. One (I) focuses on the probability that individualsare self-employed rather than employees. A second (II) asks the differentquestion of what factors affect the decision to become self-employed, asopposed to remaining in paid-employment. A third (III) investigates thedecision to leave self-employment, as opposed to continuing in it. All ofthese applications can be handled by the probit/logit model: they merely

26 The Economics of Self-Employment and Entrepreneurship
require different definitions of the dependent variable, zi . However, it ispossible to dispute the relative merits of each. For example, Evans andLeighton (1989b) argued that II is preferable to I, on the grounds that thelatter confounds entry and survival effects. This is because the probabilityof being self-employed at time t depends on the probability of switchinginto self-employment at some previous time and then surviving until t.On the other hand, as Wellington (2001) has pointed out, applicationII excludes people who are already successfully self-employed, which isevidently a group of some interest. Low annual switching rates from paid-employment to self-employment (see chapter 2, section 2.2) also meansthat II sometimes suffers from having small numbers of self-employed ob-servations; and the characteristics of switchers may well be different fromthose of non-switchers. There is less disagreement about the importanceof application III, which we discuss separately in chapter 9. We wouldsimply assert that all three applications generate useful information andplay an important role in applied research.
1.6.2 The structural probit model
Microeconomic theory teaches us that relative prices often affect individ-ual choices. If this precept is true for occupational choice, then one of theexplanatory variables in the matrix W above should be relative income, orits logarithm: (ln yi S − ln yi E). However, we know from subsection 1.5.3that occupational incomes are endogenous, and prone to selection ef-fects, so this information needs to be incorporated into the probit modelto obtain efficient and unbiased estimates of the parameters of interest.The structural probit model is a popular method that accomplishes this.
The first stage of the structural probit model is to estimate selectivity-corrected earnings functions separately for the self-employed andemployees. Extending the discussion in subsection 1.5.3, and letting Mdenote the vector of explanatory variables used in the earnings functions,one estimates the equations
zi = β ′Wi + vi i ∈ {S, E} (1.12)
[ln yi S|zi = 1] = γ ′SMi + ϑSλi S + ui S i ∈ S (1.13)
[ln yi E|zi = 0] = γ ′E Mi + ϑEλi E + ui E i ∈ E , (1.14)
where λi S = −φ(zi )/�(zi ) and λi E = φ(zi )/[1 − �(zi )] are the InverseMills Ratios to correct for selectivity into each occupation. Equa-tion (1.12) is called the ‘reduced form probit’ and is not of direct interest:its principal role is to correct for selection bias in the earnings functions(1.13) and (1.14).

Introduction 27
The second stage of the structural probit model generates the pre-dicted log incomes from both occupations derived from (1.13) and (1.14),namely ln yi S and ln yi E. The third stage estimates the ‘structural probit’model
zi = α[ ln yi S − ln yi E] + ω′Xi + vi , (1.15)
where X �= M is a further vector of explanatory variables such that W =X ∪ M, and where vi , ui S , ui E and vi are all assumed to be normallydistributed disturbance terms. If occupational choice depends on relativefinancial returns in each occupation, then α > 0. Standard t-statisticscan be used to test the hypothesis that an individual is more likely to beself-employed the greater is their relative income in self-employment.
Estimation at each stage is easily accomplished using standard econo-metric software, taking note of the following three points. First, becausethe relative income variable in (1.15) has been generated from previ-ous regressions (i.e. it is a ‘generated regressor’), Newey–West correctedstandard errors should be used. Second, income under-reporting by theself-employed may bias yi S and hence the coefficients in (1.15). Thisproblem should be overcome by applying income under-reporting cor-rections (if available) to the data at the outset. Third, one should ensurethat the disturbances of the earnings equations are normally distributed(Bernhardt, 1994). This can be achieved by suitable transformations ofthe earnings variables in (1.13) and (1.14) (Parker, 2003a). Unfortu-nately, many previous applications of the structural probit model haveignored these points, leading to biases of unknown magnitude.38
1.6.3 Extensions to cross-section models of occupational choice
While the models described above are widely used and appropriate formost applications, it is sometimes necessary to extend them. We describethree extensions below.
First, although individuals may wish to become self-employed, theymay not have the opportunity to do so. This motivates the use of the bi-variate probit (BVP) model, which separates individuals’ opportunities tobecome self-employed from their willingness to do so. Let z∗
1i be a latentvariable representing the former effect and let z∗
2i represent the latter ef-fect. Potentially different factors impinge on willingness and opportunity,suggesting the specifications
z∗1i = β ′
1W1i + v1i (1.16)
z∗2i = β ′
2W2i + v2i , (1.17)

28 The Economics of Self-Employment and Entrepreneurship
where (v1i , v2i ) are distributed as bivariate normal variates with correla-tion coefficient ρ: the joint distribution function is �(·, ·; ρ). As before,define zi as an indicator variable, equal to 1 if individual i becomes self-employed, and 0 otherwise. Evidently
Pr(zi = 1) = Pr[min(z∗1i , z∗
2i ) ≥ 0] = �(β ′1W1i , β ′
2W2i ; ρ) ,
and analogous to (1.9), the likelihood function is
L =n∏
i=1
�(β ′1W1i , β ′
2W2i ; ρ)zi [1 − �(β ′1W1i , β ′
2W2i ; ρ)]1−zi .
To identify this model, it is necessary that W1 �= W2. The researcher mustimpose identifying restrictions on the basis of a priori reasoning.
A second extension recognises that there may be more than two occupa-tions to choose from. For example, Earle and Sakova (2000) studied theproblem of choosing between employer self-employment, own-accountself-employment, paid-employment, or unemployment. Multiple occu-pational choices can be handled by using multinomial choice models.Perhaps the most popular model within this class is the multinomial logit(MNL) model, which can be regarded as an extension to the simple logitmodel described above. In this model, individual i must choose betweenj = 1, . . . , J alternatives. Define zi j as equal to 1 if i chooses j , and 0otherwise. Then the MNL model proposes that the probability that ichooses j is
Pr(zi j = 1|Wi , Xj ) = exp{β ′j Wi + γ ′Xj }∑
j exp{β ′j Wi + γ ′Xj } . (1.18)
Here Wi is a vector of variables whose values vary across individuals,whereas Xj is a vector of variables whose values vary across occupations.The β j coefficients must vary across occupations or else they cannot beidentified. Analogous to the genesis of the simple probit/logit model dis-cussed in subsection 1.6.1, (1.18) is the probability that results from achoice problem in which individuals maximise utility across each alter-native, where the utilities are given by Ui j = β ′
j Wi + γ ′Xj + ui j . Also asthere, the β j and γ coefficients can be estimated by maximum likelihood,a procedure that has now been incorporated in many standard economet-ric software packages.
All of the models discussed so far have assumed that individuals chooseto spend all of their time either in self-employment or in paid-employment.As noted in subsection 1.5.3, some individuals mix their work time be-tween multiple occupations. A third extension is needed to handle workmixing. Let hE denote the proportion of total available work hours that

Introduction 29
an individual is observed to spend in paid-employment, and let h∗E be
a latent variable relating the desired proportion of work hours in paid-employment to the regressors X. Consider the model
hi E =
1 if h∗i E ≥ 1
h∗i E if 0 < h∗
i E < 10 if h∗
i E ≤ 0(1.19)
h∗i E = β ′Xi + ui .
This model can be estimated by double-limit tobit maximum likelihood(see Vijverberg, 1986, for details). However, in the light of the discussionin subsection 1.6.2, a limitation of this model is its omission of relative oc-cupational returns from the set of explanatory variables, X. Incorporatingthis extension into (1.19) can be expected to complicate the estimationsubstantially – which may account for its absence from the applied en-trepreneurship literature to date.
1.6.4 Issues arising from the use of time-series and panel data
Time-series applications take a set of T time-series observations on theself-employment rate, st , and regress them against a set of explanatoryvariables Xt , as follows:
st = γ ′Xt + vt t = 1, . . . , T , (1.20)
where γ is a vector of regression coefficients and vt is a disturbanceterm.
One rationale for estimating a time-series model is that, unlikecross-section studies, it becomes possible to analyse trends in self-employment. Also, the time-series approach can identify determinantsof self-employment rates that are uniform for all or most members of across-section at a given point in time, e.g. income tax variables, interestrates and other macroeconomic variables.
Prior to the 1990s, the preferred technique for estimating (1.20) wasordinary or generalised least squares (OLS or GLS: see, e.g., Blau, 1987,Steinmetz and Wright, 1989). Since then, however, it has become knownthat least squares estimators are inappropriate when any of the regressorsin (1.20) are non-stationary.39 The application of least squares estimatorsto non-stationary data is known to generate spurious regressions and ren-ders classical inference invalid (Phillips, 1986). The R 2 goodness-of-fitmeasure is no longer informative and t and F statistics can no longer beused for hypothesis testing. The importance of this point is underlinedby the fact that self-employment rates in the USA, UK, and most other

30 The Economics of Self-Employment and Entrepreneurship
OECD countries appear to be non-stationary in practice (Parker, 1996;Parker and Robson, 2000). Hence this point appears to be of consider-able practical importance. When time-series variables are non-stationary,it is necessary to check whether they cointegrate, i.e. whether there existsat least one linear combination of the variables (called a cointegrating vec-tor) that is stationary. If so, there is said to be a long-run (non-spurious)relationship between the variables. It is then possible to obtain consistentestimates of the coefficients of that relationship, and to perform appro-priate hypothesis tests on the coefficients. It is also possible to examine adynamic (‘short-run’) error-correction model that describes how agentsbehave out of equilibrium.40
Following Parker (1996), we set out below a ‘working guide’ for es-timating and performing inference on the parameters of (1.20) usingcointegration methods:1. Check that each variable in (1.20) is non-stationary using unit root
tests.2. If at least two variables are non-stationary, use a multivariate cointe-
gration estimator to identify the number of cointegration vectors.3. If there is a unique cointegration vector, test if st is weakly exogenous.
If so, perform significance tests on each element of γ .4. Estimate an error-correction model using the cointegrating residuals
vt in order to determine the short-run determinants of aggregate self-employment.If time-series data are available for the same set of individuals (or firms
or countries) then a ‘panel’ of data is available. Panel data combinesthe case-specific variation of cross-section data with the temporal varia-tion of time-series data, and enables the researcher to control for cohortand person-specific effects that are absent from a pool of repeated cross-sections.
There is now a large literature on panel data estimation; below, wedescribe only the most widely used ones in applied self-employment re-search. Suppose that the panel comprises N individuals i observed over Ttime periods t. A simple pooled regression model corresponding to (1.20)is
si t = γ ′Xit + α + vit , (1.21)
where α is an intercept common to all individuals. A more general spec-ification allows the intercept to vary across individuals, giving rise to thefixed-effects model:
si t = γ ′Xit + αi + vit . (1.22)

Introduction 31
The random-effects model is similar to (1.22), except it assumes that theintercepts are drawn from a common distribution with mean α and vari-ance σ 2
α .Some applications of pooled and fixed- /random-effects models of self-
employment have taken the cross-section units to be countries rather thanindividuals. For example, Robson and Wren (1999) and OECD (2000a)both estimated the following dynamic specification:
� ln si t = αi + β ′�Xit − γ ln si t−1 + ω′Xi t−1 + ϑt + vit , (1.23)
where X is a matrix of explanatory variables; αi is a country-specificintercept term; and ϑt is a set of time dummies. The β coefficientscapture short-run effects of variables on self-employment whereas theω coefficients pick up long-run effects. However, as in the time-seriescase, least squares estimates of panel models will be biased if any ofthe variables in the model is non-stationary. Cointegrated panel tech-niques are appropriate in this case (see Parker and Robson, 2000, fordetails).
NOTES
1. Of course, these types of surveys can be severely criticised for asking hy-pothetical questions, without forcing individuals to bear the constraints ofself-employment as they would if they acted upon their declared preferences.Indeed, much lower rates of serious entrepreneurial intention emerge fromlongitudinal analysis of wage and salary workers (Katz, 1990). For this reason,we will often adopt in this book the standard economic practice of ignoringstudies that report interviewees’ declared preferences, focusing instead on re-vealed preferences.
2. Intrapreneurship – the practice of entrepreneurship within corporations – isan emerging field in economics. For an important recent contribution, seeGromb and Scharfstein (2002).
3. According to CPS data compiled by Bregger (1996), 38 per cent of self-employed Americans run incorporated businesses. These tend to be businessesthat employ others, which might explain why incorporation rates among new(and typically small) entrants to self-employment are about half this rate (Evansand Jovanovic, 1989).
4. Harvey (1995) cites the UK legal case of Young and Woods v. West, wherebythe criteria for a worker being under a contract of service includes the workernot determining their own hours, not supplying their own materials and equip-ment, not allocating or designating their own work, not being able to nominatea substitute to work in their place and not setting their rate of pay (see alsoLeighton, 1983).
5. See also Marsh, Heady and Matheson (1981), Casey and Creigh (1988) andHakim (1988).

32 The Economics of Self-Employment and Entrepreneurship
6. Firms certainly appear to exercise some discretion about the mode of em-ployment contract they offer. For example, in her exploration of new lawspenalising companies that misclassify employees as self-employed to avoidtax payments, Moralee (1998) found that in response to the new laws thenumber of ‘employees’ in the construction industry increased sharply whilethe number of ‘self-employed’ workers decreased sharply.
7. According to Moralee (1998), 13 per cent of the UK self-employed in 1997were home-workers, with little change in self-employed home-working takingplace over the 1990s. Moralee also observed that 61 per cent of teleworkerswere self-employed.
8. Williams (2001) argued that franchisees take less risk than independent self-employed business owners, because of profit sharing arrangements with fran-chisors and lower demand uncertainty resulting from selling a known prod-uct. Williams also observed a lower variance of self-employment incomesamong franchisees than non-franchisees in his 1987 CBO sample of full-timeself-employed workers. However, he appears to over-state the case, not leastbecause exit rates are higher among franchisees than independent businessowners (Bates, 1994).
9. Data limitations can be quite severe, especially for developing and transitioneconomies. They largely determined the countries selected, and account forthe exclusion of Germany in particular.
10. The primary source for the US entries in table 1.1 is the CPS Monthly House-hold Labour Force Survey.
11. In his historical study, Phillips (1962) characterised US self-employment asa ‘shrinking world within a growing economy’. Phillips predicted that self-employment would eventually serve as a refuge only for older, handicappedor unproductive workers as a safeguard against unemployment.
12. See Blau (1987), Steinmetz and Wright (1989), Aronson (1991), Bregger(1996) and Williams (2000).
13. See also Kuznets (1966, table 4.2) who documented declining self-employment shares between the mid-nineteenth and mid-twentieth centuryin Germany, Switzerland, Canada and the UK, as well as in the USA andFrance.
14. See also Lin, Picot and Compton (2000), Manser and Picot (2000), Kuhnand Schuetze (2001) and Moore and Mueller (2002). Self-employment ac-counted for most overall job growth in Canada in the 1990s, which was con-centrated among own-account workers.
15. Agriculture was never fully collectivised in Poland, which accounts for its highrate of self-employment for all workers inclusive of agriculture.
16. According to Blanchflower, Oswald and Stutzer (2001), Poles topped thelist of respondents to a survey of 25,000 people in twenty-three countriesasking whether they would prefer to be self-employed to being a wage worker:80 per cent responded in the affirmative. Blanchflower, Oswald and Stutzerconcluded that there is no shortage of potential entrepreneurs in the transitioneconomies.
17. For further discussion about the state of entrepreneurship in Eastern Europe,see OECD (1998, ch. XIII) and Smallbone and Welter (2001). Tyson, Petrinand Rogers (1994) and Luthans, Stajkovic and Ibrayeva (2000) describe the

Introduction 33
environmental and psychological challenges facing entrepreneurial develop-ment in transition economies.
18. This includes the Philippines and Indonesia (Le, 1999) and Nepal (Acs,Audretsch and Evans, 1994). According to Acs, Audretsch and Evans, theself-employment rate in Nepal in the 1980s reached over 85 per cent, com-pared with only 3.1 per cent in Botswana.
19. See, e.g., Blau (1985, 1986) and Teilhet-Waldorf and Waldorf (1983). Otherstudies reporting higher self-employment than paid-employment incomesin developing countries include Chiswick (1976) and Bertrand and Squire(1980) for Thailand; Mazumdar (1981) for Kuala Lumpar; and House,Ikiara, and McCormick (1993) for Kenya.
20. For example, SBA (1986) estimated that incorporated business ownersearned over twice as much on average as the unincorporated self-employed.
21. Devine (1995) calculated self-employed non-response rates of about30 per cent (CPS data, 1976–91), compared with 17–19 per cent for wageand salary workers. In related work, Devine (1994a) estimated non-responserates of 25 per cent for the incorporated and 40 per cent for the unincorpo-rated self-employed.
22. Early efforts to separate factor returns from self-employment incomes includeKravis (1959), Denison (1967), Christiansen (1971) and Chiswick (1976).See Carrington, McCue and Pierce (1996) for a discussion of the issue withregard to two US data sets: the CPS and the (Michigan) Panel Study ofIncome Dynamics (PSID).
23. Studies finding higher average incomes in paid-employment include Fain(1980), Becker (1984), SBA (1986), Haber, Lamas and Lichtenstein (1987),Carrington, McCue and Pierce (1996) and Hamilton (2000). In contrast,Form (1985), Borjas (1986), Evans and Jovanovic (1989), Ferber andWaldfogel (1998) and Quadrini (1999) reported an income advantage to self-employment on average, while Borjas and Bronars (1989, table 1) reportedsimilar average incomes. For early work see Johnson (1954) and Lebergott(1964).
24. Carrington, McCue and Pierce (1996) also reported that median hourlywages and annual incomes in self-employment were substantially and sig-nificantly more volatile and pro-cyclical than those of employees; and thatwhile economic downturns were associated with lower wages for all workers,the decline for the self-employed was some three or four times greater thanthat for employees.
25. Robson (1997) attempted to explain the trend in terms of macroeconomic andfiscal variables and the aggregate self-employment rate. However, causalitycan run both ways between average self-employment incomes and the aggre-gate self-employment rate.
26. To our knowledge, most applications have been based on UK data. See,e.g., Curran, Burrows and Evandrou (1987), Hakim (1989a), Rubery, Earn-shaw and Burchell (1993), Goodman and Webb (1994), Meager, Court andMoralee (1994, 1996) and Storey (1994a).
27. However, part-timers and females are especially likely to be found in thepoorest self-employment groups in Britain (Hakim, 1989a). Of course, it ispossible that the preponderance of self-employed in the lower tail might be

34 The Economics of Self-Employment and Entrepreneurship
partly explained by individuals choosing to reinvest profits directly in thebusiness rather than consuming them as income.
28. For British evidence, see Rees and Shah (1986), Pissarides and Weber (1989),Dolton and Makepeace (1990), Jenkins (1995), Meager, Court and Moralee(1994, 1996) and Parker (1997b, 1999b). For a Dutch example, see Nisjen(1988).
29. Parker corrected for self-employment income under-reporting and deployedinequality measures that are robust to mean-preserving measurement error.However, he did not attempt to separate returns to labour from returns tocapital.
30. Parker’s model ultimately gave rise to the Pearson Type VI distribution asa parametric form for the density function of the self-employment incomedistribution. This is a unimodal and positively skewed distribution, whichseems to fit self-employment income data quite well. It also has the advantageof being able to handle zero and negative incomes, an important propertygiven that over 6 per cent of UK self-employees had zero or negative incomesin 1991.
31. There are caveats to this hypothesis, however. The self-employed may invest ineducation as a hedge, or in order to work for others before commencing a spellof self-employment. Customers, suppliers of credit and government agenciesmay also screen self-employed workers. See Fredland and Little (1981) forfurther discussion of these points.
32. Flat self-employment earnings–age profiles can also emerge if the self-employed optimally do little investment in human capital on the job. This andother possible explanations of flat profiles are explored by Kawaguchi (2003).
33. UK studies include Rees and Shah (1986), Dolton and Makepeace (1990),Taylor (1996), Burke, Fitz-Roy and Nolan (2000), Clark and Drinkwater(2000) and Parker (2003a). US studies include Brock and Evans (1986), Gill(1988), Borjas and Bronars (1989), Evans and Jovanovic (1989), Fujii andHawley (1991), Fairlie and Meyer (1996) and Hamilton (2000). Kidd (1993)is an Australian study; Maxim (1992) and Bernhardt (1994) are Canadianstudies; and de Wit (1993) and de Wit and van Winden (1989, 1990, 1991)provide evidence for the Netherlands. Earle and Sakova (2000) used EasternEuropean data; and Blau (1985) used Malaysian data. For a detailed meta-analysis, see van der Sluis, Praag and Vijverberg (2003). The latter highlightedseveral limitations in the estimation methods used in previous studies, includ-ing failure to control for ability, endogeneity of schooling, and measurementerror.
34. Fredland and Little (1981) showed that estimates of self-employed rates ofreturn can be sensitive to the inclusion or exclusion of professionals in thesample – an important practical point that should be borne in mind whenestimating (1.1) or (1.4) using data on the self-employed.
35. Fredland and Little (1981) suggested that relatively low self-employed earn-ings function R 2s can be taken to support the screening hypothesis. However,low self-employed R 2s could be caused by a variety of factors, including un-observed heterogeneity among the self-employed.

Introduction 35
36. These findings are consistent with those of Evans and Leighton (1989b),Headen (1990), Maxim (1992) and Hamilton (2000). Of these studies,Hamilton provides the most detailed evidence of the gains to the self-employed from switching to paid-employment.
37. For example, Vijverberg (1986) reported that some 20 per cent of respondentsin a 1976 Malaysian survey data set performed work mixing. The author’scalculations using 1994/5 FES data revealed that only 1.4 per cent of UKworkers mixed paid-employment and self-employment. The proportion ofself-employed people doing work mixing (3.3 per cent) exceeded the propor-tion of employees doing so (1.1 per cent).
38. An alternative to the three-step approach is structural estimation of the param-eters of an underlying utility maximisation model (Brock and Evans, 1986).However, this approach is complicated, not obviously superior and has notbeen widely used.
39. In simple terms, a non-stationary process is one in which there is no mecha-nism forcing values of the series to revert to the mean.
40. See, e.g., Harris and Sollis (2003) for an introduction to cointegrationanalysis.


Part I
Entrepreneurship: theories,characteristics and evidence

2 Theories of entrepreneurship
Numerous thinkers have speculated on the origin and function of theentrepreneur, and on the nature of entrepreneurship. A large body ofeconomic research now exists on these topics. Section 2.1 briefly surveys‘early’ (chiefly pre-1975) views about entrepreneurship. These are mainlyconcerned with defining and identifying salient aspects of entrepreneur-ship in a fairly general way. Section 2.2 treats ‘modern’ (post-1975)contributions to the economic literature on entrepreneurship. These aretypically framed in terms of optimising choices between entrepreneurshipand paid-employment, and essentially belong to the tradition of neoclas-sical microeconomics. They tend to be less concerned with definitionalissues, usually implicitly taking entrepreneurship to be any activity whereindividuals work for themselves and trade off risk and returns. Section2.3 draws some conclusions.
2.1 ‘Early’ views about entrepreneurship
Our treatment of early views about entrepreneurship will be brief, sincemuch of this literature has been summarised before.1 We will group theseviews by theme rather than chronologically:1. Arbitrage and the bearing of uncertainty Richard Cantillon (1755)
stressed the importance of the entrepreneur as an arbitrageur or spec-ulator, who conducts all exchanges and bears risk as a result of buyingat certain prices and selling at uncertain ones. Cantillon’s is a risk the-ory of profit: anyone who receives an uncertain income can essentiallybe regarded as an entrepreneur. According to Cantillon, successful en-trepreneurs perform a key role in the economy by relieving the paralysisengendered by uncertainty, allowing production and exchange to occurand market equilibrium to be attained. Unsuccessful entrepreneurs goout of business: only the ‘fittest’ survive. Entrants appear when prof-its persist. Cantillon’s entrepreneur is not an innovator, nor does hechange supply or demand. Instead, he is perceptive, intelligent and
39
40 The Economics of Self-Employment and Entrepreneurship
willing to take risks: his role is to bring the two sides of the markettogether, bearing all the risks involved in this process.
Subsequent researchers have developed Cantillon’s thoughts in twoseparate directions. Kirzner (1973, 1985) emphasised the importanceof the entrepreneur as a middleman or arbitrageur, who is alert toprofitable opportunities that are in principle available to all. Success-ful entrepreneurs merely notice what others have overlooked and profitfrom their exceptional alertness. Kirzner did not explain where alert-ness comes from, nor whether individuals or government can deliber-ately cultivate it.2
Following Knight (1921), the second line of research highlights theimportance of uncertainty. According to Knight, entrepreneurs faceuncertainty from the unknown availability of natural resources, tech-nological change and fluctuating prices. Although factor prices arecontractible and certain, output prices (and hence profits) are not.3
Hence entrepreneurs need to possess particular characteristics suchas self-confidence, judgement, a venturesome nature, foresight – andluck. One of Knight’s key contributions was to recognise that the de-cision to become a worker or an entrepreneur depends on the risk-adjusted relative rewards in each sector. In his own words:
The labourer asks what he thinks the entrepreneur will be able to pay, and inany case will not accept less than he can get from some other entrepreneur, orby turning entrepreneur himself. In the same way the entrepreneur offers toany labourer what he thinks he must in order to secure his services. (Knight,1921, p. 273)
Thus Knight viewed individuals not as born entrepreneurs or non-entrepreneurs, but opportunists, who can turn their hand to en-trepreneurship when the risk-adjusted returns there are relativelyfavourable or alternatively to paid-employment when they are not.It will be seen in section 2.2 how modern economic research has fol-lowed directly in this tradition, making explicit the risk-adjusted re-turns Knight referred to.4
2. Co-ordination of factors of production According to Jean-Baptiste Say(1828), the chief contribution of the entrepreneur is to combine andco-ordinate factors of production. The entrepreneur stands at the cen-tre of the economic system, directing and rewarding the various factorsof production, and taking the residual as profit. Personal character-istics such as judgement, perseverance and experience required forsuccessful entrepreneurship would be in scarce supply, providing highprofits to these entrepreneurs. Furthermore, all of these characteristicswould have to be present simultaneously in order for an entrepreneur

Theories of entrepreneurship 41
to be successful. Entrepreneurs need to be resourceful, knowing howto overcome unexpected problems and to exploit (although not de-velop) existing knowledge. Although some have criticised Say’s viewof the entrepreneur as just a superior kind of worker with manage-rial duties (e.g. Hebert and Link, 1988), others have offered modernre-statements of Say’s perspective (e.g. Casson, 2003, 1999).5
3. Innovation According to Josef Schumpeter (1934, 1939), entrepre-neurship entails innovation. The entrepreneur does not operate withinconventional technological constraints, making small gradual changesto existing production methods; instead, he develops new technolo-gies or products that make discrete discontinuous changes that shiftthe paradigm altogether. In Schumpeter’s words, the entrepreneur asinnovator is responsible for ‘the doing of new things or the doing ofthings that are already being done in a new way’ (1947, p. 151). Thiscould involve (i) the creation of a new product; (ii) a new methodof production; (iii) the opening of a new market; (iv) the capture ofa new source of supply; or (v) a new organisation of industry. Simi-lar to Say, the entrepreneur is an exploiter rather than an inventor ofnew knowledge. Schumpeter regarded entrepreneurial actions as theprincipal cause of business cycles and economic development. In hisgrand vision of ‘creative destruction’, a wave of entrepreneurial inno-vation would hit the economy, displacing old products and productionprocesses, followed by rapid imitation by new competitors. Ultimatelystability would be restored and entrepreneurship would reach a tem-porary cessation before the next wave occurred. Both entrepreneurialactivity and the ensuing profits would be temporary, unless the en-trepreneur continued to innovate.6
Schumpeter viewed the entrepreneur not as a calculating utility max-imiser but as a rare, unusual creature driven by instinctive motives.He regarded profit as a residual, not a return to the entrepreneur asa ‘factor of production’, and claimed that ‘the entrepreneur is nevera risk bearer’ (1934, p. 137; and see also Schultz, 1980). However,the view that only capitalists and not entrepreneurs bear risks hasbeen roundly criticised by several subsequent writers (e.g. Kanbur,1980), for imposing an arbitrary distinction between ‘capitalists’ and‘entrepreneurs’, and for ignoring entrepreneurs’ actual and opportu-nity costs in operating ventures that can (and often do) fail.
4. Leadership and motivation In contrast to Schumpeter, others haveclaimed that a defining feature of entrepreneurs is that they bringabout changes of a gradual nature to existing products and processes,through a combination of leadership, motivation, the ability to resolvecrises and risk-taking (Leibenstein, 1968).

42 The Economics of Self-Employment and Entrepreneurship
5. Personal or psychological traits This line of thought relates entrepreneur-ship to the possession of personal characteristics. It is discussed inchapter 3, section 3.2.While not exhaustive, the above list includes many of the most influen-
tial ‘traditional’ views about entrepreneurs. The brevity of our overviewwas deliberate. Much of this material has been discussed extensively be-fore and, as others have noted, ‘A tome could be written on the connec-tions and contradictions between these theories’ (Barreto, 1989, p. 43).We close our discussion by drawing three conclusions. First, we con-tend that there is a broad dichotomy underlying these theories. The di-chotomy is between those in the neoclassical tradition (such as Knight,1921, Marshall, 1930 and Schultz, 1980) who believe that entrepreneurslead markets into equilibrium, and those in the Austrian tradition (suchas Kirzner, 1973) who see entrepreneurs as part of an ongoing disequilib-rium process. Rosen (1997) has attempted to find some common groundbetween the two schools of thought.
Second, we would argue that none of the above theories is complete.That is, none of them provides necessary or sufficient conditions for iden-tifying entrepreneurship. For example, farmers can face uncertainty andcorporate employees can contribute to the development of an innovation,without either being in any sense an ‘entrepreneur’. This is what makesentrepreneurship an elusive, and almost certainly multidimensional, con-cept (Parker, 2002a).
Third, some writers have claimed that modern economics ignores theentrepreneur (Baumol, 1968; Barreto, 1989; Kirchhoff, 1991; Rosen,1997; Casson, 2003). For example, according to Baumol, ‘the theoreti-cal firm is entrepreneur-less – the Prince of Denmark has been expungedfrom the discussion of Hamlet’ (1968, p. 66). Such writers give the im-pression that modern economic theory is concerned purely with estab-lishing general equilibrium, and that in contrast entrepreneurship is allabout disrupting that equilibrium, for example by innovation. They alsoclaim that ability (e.g. superior judgement) and other distinctive traitsof entrepreneurs are missing from the modern economist’s models. Infact, each of these criticisms misses the mark. First, economics is aboutmuch more than Arrow–Debreu general equilibrium theory, which oc-cupies only a small area within the subject. Second, economists are wellaware that market adjustment takes time: equilibrium is merely a use-ful way of thinking about the long-term effects of change. And moderneconomics can analyse innovations that change production technologies,for example establishing the conditions under which such innovations arelikely to be adopted in preference to continuation with existing technology(see, e.g., King and Levine, 1993). Third, as will be seen in section 2.2,

Theories of entrepreneurship 43
economists have long been aware of the special nature of entrepreneurs,and now routinely build into their models heterogeneous entrepreneurialabilities. It is probably true that in modern economic theory ‘one hearsof no . . . brilliant innovations, of no charisma or any of the other stuff ofwhich entrepreneurship is made’ (Baumol, 1968, p. 67). But that doesnot mean that the theoretical firm is ‘entrepreneur-less’, as we go on toshow in section 2.2. If the non-economist’s criticism is that economicshas lost the grand sweep of broad conjecture and prose eloquence, thenfew would disagree; but for their part few economists lament the pass-ing of a manner of writing that lacks a tight structural framework, cleartestable predictions and ready application to rigorous empirical testing.
2.2 ‘Modern’ economic theories
2.2.1 Introduction and some definitions
Modern economic theories of entrepreneurship differ in at least two im-portant respects from those described above. Perhaps the most importantdistinction relates to the dominance of the utility maximising paradigmin the modern literature. Modern theories take as their starting pointthe Knightian premise that individuals do not have to be entrepreneurs.They can choose between entrepreneurship and some outside option(usually taken to be paid-employment); and they choose the occupationthat offers them the greatest expected utility. Most theories treat occu-pational choice as a discrete, rather than a continuous, decision. Thisfollows Kanbur (1981), who noted the difficulty of viewing occupationalchoice as an adjustment at the margin of a continuous process, such as‘engaging a ‘little bit’ more in entrepreneurial activity’ (p. 163). How-ever, some researchers have also analysed how individuals mix their timebetween different occupations, which resembles more a continuous thana discrete choice.
A second distinctive feature of modern economic theories of en-trepreneurship is that they often assume that product markets are per-fectly competitive, that technology is given and that individual workersand entrepreneurs are price takers. These assumptions are primarily sim-plifying, and are sometimes relaxed where this does not complicate theanalysis too much. To fix ideas, consider an economy without uncertainty,where a firm’s average costs of production c(q ) are increasing in outputq . Suppose there are nS firms, each of which is run by one entrepreneur.Firms are identical and each produces q units of output. Total supply isnSq = Q(P), where product demand Q(P) is decreasing in the outputprice P. Each entrepreneur is a price taker in P, i.e. cannot influence P

44 The Economics of Self-Employment and Entrepreneurship
by their actions, and each entrepreneur produces at minimum cost. Eachentrepreneur earns a profit of
π = Pq − c(q ) . (2.1)
The number of firms, and hence aggregate output and price, is deter-mined where demand equals supply.
In this scenario occupational choice is straightforward. Individuals caneither operate a firm and earn profits or take some outside wage w > 0offered by an employer. In the absence of compensating differentials,such as pleasant or unpleasant working conditions, and absent switchingcosts, it must be the case that π = w, otherwise individuals would have anincentive to switch to the occupation with the highest return. For example,suppose π > w. This cannot be an equilibrium because workers wouldthen switch into entrepreneurship, increasing nS and therefore Q andso reducing P and profit by (2.1) until equality between π and w wasrestored. A similar argument can be used to rule out an equilibrium withπ < w.
This simple model can be used to determine the equilibrium numberof firms, or equivalently the total number (or share, if the workforce isnormalised to size unity) of entrepreneurs. It can also be used to estab-lish simple ‘comparative static’ results – for example that an exogenousincrease in the outside wage w results in fewer entrepreneurs, nS (de Wit,1993). It can also be extended to analyse, among other things, the ef-fect of uncertainty on entrepreneurship (see subsection 2.2.2 below forfurther details).
This simple model of identical competitive firms evidently suffers fromseveral serious drawbacks. It assumes that all firms are of equal sizes,and so cannot explain why large and small enterprises coexist in actualmarkets. It also rules out interesting questions such as ‘who becomes anentrepreneur?’. For these reasons, richer models have been developed,which are reviewed below.
Before proceeding, it might be helpful to define some of the terms thatwill be used extensively in what follows. While they can be found in manystandard economics texts, it is convenient to group them together andestablish a common notation.
To commence, consider a utility function U(·) whose argument is in-come, y. This utility function is assumed to be concave, having a positivefirst derivative with respect to y, i.e. Uy(y) > 0, and a negative secondderivative, i.e. Uyy(y) < 0. Viewed graphically, utility is strictly increas-ing in income, but extra units of income increase utility by progressivelysmaller amounts. This utility function is also said to embody risk aversion,something that is implied by its negative second derivative. If Uyy( y) = 0,

Theories of entrepreneurship 45
individuals would be risk neutral; and if Uyy( y) > 0 (a case where theutility function is convex), individuals would be risk lovers.7 Only the risk-averse case is of much practical interest (see below). The following defi-nitions propose some useful ways of quantifying risk aversion.
Definition 1. Given a twice-differentiable utility function U( y), the Arrow–Pratt coefficient of absolute risk aversion at income y is defined as r A( y) =−Uyy( y)/Uy( y).
Definition 2. The utility function U( y) exhibits decreasing absolute riskaversion if r A( y) is a decreasing function of y.
Definition 3. Given a twice-differentiable utility function U( y), the co-efficient of relative risk aversion at income y is defined as r R( y) =−yUyy( y)/Uy( y).
The concept of absolute risk aversion is useful for describing prefer-ences over risky outcomes that involve absolute gains or losses of income.In contrast, relative risk aversion is more appropriate for risky situationswhere outcomes are percentage gains or losses of income. Individualswhose preferences are described by decreasing absolute risk aversion(Definition 2) take more risks as they become better off. While this oftenyields economically reasonable results about risk taking behaviour, it issometimes too weak and is complemented by the stronger assumption ofnon-increasing relative risk aversion. This assumption states that individu-als become more willing to risk fractions of their income as their incomeincreases. It is a stronger assumption than decreasing absolute risk aver-sion because, by r R( y) = yr A( y), decreasing relative risk aversion impliesdecreasing absolute risk aversion, but the converse does not necessarilyfollow. It will be convenient in several places in this book to consider thecase where both apply, encapsulated in the following assumption.
Assumption 1. The utility function U( y) exhibits decreasing absolute riskaversion and non-increasing relative risk aversion.
Assumption 1 has received theoretical and empirical support frommany sources (see, e.g., Stiglitz, 1970). In view of the popular beliefthat entrepreneurs are gamblers, it might appear odd that we assume en-trepreneurs at the outset to be risk averse rather than risk lovers. But evi-dence shows that entrepreneurs’ behaviour seems to be better describedby moderate and calculated risk taking than outright gambling (Meredith,Nelson and Neck, 1982).8
It is also helpful to have a precise definition of ‘an increase in risk’. Twouseful and general definitions are second-order stochastic dominance(SOSD) and mean-preserving spread (MPS). Both definitions rank two
46 The Economics of Self-Employment and Entrepreneurship
return distributions, with distribution functions F( y) and G( y). Con-sider the following ranking:∫
U( y) d F( y) ≥∫
U( y) dG( y) , (2.2)
where U(·) does not necessarily have to be (though often is) the utilityfunction defined earlier.
Definition 4 (Second-order stochastic dominance). For any distri-butions F(·) and G(·) with the same mean, F(·) second-order stochasticallydominates (is less risky than) G(·) if, for every non-decreasing function U(·),(2.2) holds.
Definition 5 (Mean preserving spread). Foranydistributions F(·)andG(·) with the same mean, G(·) is a mean preserving spread of (i.e. is in thissense riskier than) F(·) if, for U(·) some concave function, (2.2) holds.
SOSD evidently places less structure on U(·) than MPS, which is inturn a more general measure of ‘increase in risk’ than an increase invariance because it implies (but is not implied by) the latter. Under bothdefinitions, every risk averter prefers F(·) to G(·).Definition 6 (First-order stochastic dominance). The distributionF(·) first-order stochastically dominates G(·) if, for every non-decreasingfunction U(·), (2.2) holds.
Definition 6 implies that every expected utility maximiser who prefersmore to less prefers F(·) to G(·). Equivalently, for any amount of moneyincome y, the probability of getting at least y is higher under F(·) thanunder G(·).
2.2.2 Homogeneous individuals
Static models of risk, risk aversion and the equilibrium numberof entrepreneurs
Several researchers have analysed the effects of uncertainty on the equi-librium number of firms in an industry. As above, we will treat the numberof firms as equivalent to the number of entrepreneurs.
Uncertainty can emanate from various sources. Entrepreneurs maybe unsure about the demand for their good, their ability to produce, orfuture costs of production. On the other hand, employees may be un-certain about whether they will retain their job if the economic outlookfor their firm worsens. Casual observation, together with the evidence ofhighly dispersed self-employment incomes reviewed in chapter 1, sub-section 1.5.2, suggests that entrepreneurs face greater uncertainty than

Theories of entrepreneurship 47
employees do. In this section we initially assume that entrepreneurs facesome form of idiosyncratic risk to their profits, whereas employees allface a certain wage, w. The assumption of perfect certainty in paid-employment may appear extreme, but it is usually possible to relax itwithout changing the essential results. It will also be assumed that en-trepreneurs cannot completely diversify or sell their risk. This appears tobe a reasonable assumption. Markets for private unemployment, accidentand sickness insurance are limited and prone to moral hazard problems;few entrepreneurs have access to stock markets to share risk; and real-world capital markets are imperfect, undermining entrepreneurs’ effortsto smooth consumption in the face of income uncertainty.
It might be thought that, given risk aversion among entrepreneurs,an increase in risk in entrepreneurship would necessarily decrease theequilibrium number of entrepreneurs. In fact, this does not automaticallyfollow, as we now demonstrate.
A pertinent early result was derived by Sheshinski and Dreze (1976),who considered a set of identical firms that face an uncertain demand fortheir products, q = q (�), where � is a random variable, and a convex totalcost function c(q ) (where cq > 0, cqq > 0: subscripts denote derivatives).The decision to operate a firm is made before the outcome of � is known,but individuals who become entrepreneurs can choose their output after� is known. Although Sheshinski and Dreze did not analyse occupationalchoice, this is easily accomplished by positing an outside wage of w > 0.Suppose for the moment that all individuals are risk neutral. Then wehave the following result.
Proposition 1. With demand uncertainty and convex marginal costs, amean-preserving spread in the distribution of � increases the equilibrium numberof entrepreneurs.
Proof. Profit maximisation under competition forces firms to equate priceto marginal cost: P = cq . Hence profit is π(q ) = cq q − c(q ). Differenti-ate this twice to obtain πq (q ) = cqq q > 0 and πqq (q ) = cqqq q + cqq > 0.Therefore if marginal cost cqq is convex in q (i.e. if cqqq > 0), then sois π(q ). Finally, invoking the converse of Definition 5, a MPS in thedistribution of � must increase expected profits Eπ(q ) above its initialequilibrium level of w, prompting entry into entrepreneurship which re-duces P and so restores the occupational equilibrium w = π . �
The prediction that greater uncertainty attracts risk-averse individualsto entrepreneurship is a surprising one, especially since the assumption ofconvex marginal costs seems innocuous. The result also holds if individ-uals are risk averse. However, it is not robust to the case where risk-averse

48 The Economics of Self-Employment and Entrepreneurship
entrepreneurs face price rather than demand uncertainty, i.e. P = P(�),as stated in the following proposition.
Proposition 2 (Appelbaum and Katz, 1986). With risk-averse indi-viduals and price uncertainty, a mean-preserving spread in the distributionof � has ambiguous effects on the equilibrium number of entrepreneurs.
Proof. Entrepreneurs maximise expected utility from profits EU(π) ≡EU[P(�)q − c(q )], where P = P(�), E is the expectations operator, andU(·) is concave. Initial occupational equilibrium occurs with EU(π) =U(w). There are two offsetting effects from a MPS in the distributionof � on entrepreneurs’ expected utilities. (1) By Definition 5, a MPSreduces EU(π). (2) Writing P(�) = µ + γ �, where µ := E(P), E� = 0,and a MPS ⇔ an increase in the positive parameter γ , the occupationalequilibrium condition can be written as
H(q , µ) := E {U[(µ + γ �)q − c(q )]} − U(w) = 0 .
Then
∂µ
∂γ= −Hγ
Hµ
= −E[Uπ�]E[Uπ ]
> 0 .
Hence a MPS causes an increase in industry price which increases E(π).Hence together with (1), the total effect of the MPS on expected prof-its and hence the inducement to enter entrepreneurship is ambiguousa priori.9 �
It is not possible to obtain more definitive results for the case of priceuncertainty even if the additional structure of Assumption 1 is imposedon the problem. However, Assumption 1 does clarify that a higher w def-initely decreases the equilibrium number of entrepreneurs (Appelbaumand Katz, 1986).
The studies considered so far investigated the consequences of greaterrisk in the economy, perhaps caused by more volatile trading conditions.But what if there is a general increase in risk aversion among individuals?This might reflect a change in tastes within an economy; alternatively itcan be thought of as a device to analyse the implications of cross-countrydifferences in risk attitudes.10 Kanbur (1979) studied the effects of greaterrisk aversion on the equilibrium number of entrepreneurs. Suppose thatall individuals have a common index of absolute risk aversion, r A; nor-malise the size of the workforce and the output price to unity without lossof generality. Letting E denote the expectations operator, an individual isindifferent between hiring H workers in entrepreneurship and taking the

Theories of entrepreneurship 49
safe wage w when
V(w; r A) := maxH
EU[q (H, �) − w H; r A] = U(w; r A) , (2.3)
where r A appears explicitly in the utility function as a parameter (not as anargument) to adumbrate later results. As usual, both the utility functionU(·; r A) and the production function q (·, ·) are assumed to be concavein their arguments. Because all employees are hired by entrepreneurs,labour markets clear only when nSH∗ = 1 − nS, where nS is the aggregatenumber of entrepreneurs, and where H∗ = argmax V(w; r A) = H(w; r A).Hence the market-clearing condition can also be written as
nS = nS(w; r A) = 11 + H(w; r A)
. (2.4)
Kanbur showed that the effects of a generic change in r A depend cru-cially on whether entrepreneurs hire employees before or after the outcomeof the random shock � is revealed.
Proposition 3 (Kanbur, 1979). (i) If labour is hired after the realisationof � is known, then an increase in risk aversion r A decreases the equilibriumnumber of entrepreneurs. (ii) If labour is hired before the realisation of � isknown, then even invoking Assumption 1, an increase in risk aversion r A hasan ambiguous effect on the number of entrepreneurs, since expected returns inboth occupations decrease.
Proof. (i) In this case, entrepreneurs face no risk when choosing H tomaximise V(w; r A), so the first-order condition is simply qH(H, �) − w =0, where a subscript again denotes a derivative. Thus a change in r A hasno effect on the H∗ implied by this condition. But for any degree of riskan increase in r A clearly decreases expected utility in the risky occupa-tion, namely entrepreneurship, and thereby nS. Equilibrium is restoredbecause the reduction in aggregate labour demand needed to satisfy (2.4)reduces the equilibrium wage until (2.3) holds again.
(ii) Differentiate both sides of (2.3) to obtain
dw/dr A = (Vr A − Ur A) / (Uw − Vw) ,
where Vr A and Ur A are the marginal indirect utilities in entrepreneur-ship and paid-employment, respectively. Now π is a MPS of w, soVr A − Ur A < 0. Hence as r A increases, there is less incentive to becomean entrepreneur. But differentiation of the LHS of (2.3) yields Vw =−HEUπ < 0, which together with Vr A − Ur A < 0 implies dw/dr A < 0,implying less incentive to become an employee. Since both occupationsare less attractive, the effects of an increase in r A on the equilibrium

50 The Economics of Self-Employment and Entrepreneurship
number of entrepreneurs, employees per firm and returns in entre-preneurship and paid-employment are all ambiguous in general. �
Proposition 3 is of interest partly because of what it says – and does notsay – about cross-country comparisons of entrepreneurship. For example,it is sometime asserted that Europeans are more risk averse than Amer-icans (see chapter 3, subsection 3.2.4). Case (i) of Proposition 3, whereentrepreneurs hire workers only once uncertainty has been resolved, ap-pears to provide some theoretical backing to this view. However, there areat least two reasons to treat this argument with scepticism. First, mostentrepreneurs who hire workers in practice do so continuously and there-fore in the presence of uncertainty, so making case (ii) the relevant one.But as we have seen, it is not possible to establish a clear link betweenrisk aversion and the amount of entrepreneurship in this case. Second,the Kanbur model assumes that every individual is identical, and thatall entrepreneurs hire workers – two unrealistic assumptions. These as-sumptions are relaxed in some of the models discussed below.
Dynamic models of risky entrepreneurship with costly switchingThe models discussed so far and in all other sections apart from this oneassume costless switching between occupations. Thus if entrepreneurshipbecomes attractive relative to paid-employment, workers are assumed tomove immediately into entrepreneurship; the converse also applies. How-ever, in some cases it seems reasonable to suppose that individuals incurcosts of switching occupation. These costs could be economic in natureinvolving, for example, lost sector-specific experience, costs of raisingstart-up capital (if entering entrepreneurship), or re-training costs (if en-tering paid-employment). Or they could be non-pecuniary involving, forexample, the sudden loss of a pleasant compensating differential, disrup-tion to an accustomed lifestyle, or a feeling of rootlessness or failure.
One consequence of assuming costless switching is that it is possibleto analyse occupational choice in a static framework. If individuals canswitch effortlessly in the next period, one need be concerned only withcomparing payoffs in different occupations in the current period. Thisgreatly simplifies the analysis of occupational choice, which is no doubtone reason why zero switching costs are so commonly assumed. Allowingfor switching costs necessitates a more comprehensive forward-looking,dynamic modelling framework. We now explore two models of this type.11
In the first model, Dixit and Rob (1994) assumed the existence of twooccupations, which while not labelled as such by those authors, can bethought of fairly naturally as ‘paid-employment’, E, and ‘entrepreneur-ship’, S. Each entrepreneur in S produces output q whose evolution

Theories of entrepreneurship 51
through time t follows a Geometric Brownian Motion:
dq = αq .dt + σq .dz , (2.5)
where α > 0 is the mean growth rate of output; σq > 0 is the standarddeviation of stochastic shocks to output; and dz is the increment of aWiener process, which can be thought of as a continuous representationof random draws from a standard normal distribution. Equation (2.5) isa representation of a dynamic output process that contains both deter-ministic and stochastic components.
The size of the workforce is normalised to unity. The two goods sellat potentially different output prices: it is possible to use them to definea price index and hence a measure of real income, y. Aggregate outputin S at time t is nS(t)q (t), where nS(t) is the number of individuals whochoose to be entrepreneurs at t. Each employee produces a single unit ofoutput with certainty, so aggregate output in E is 1 − nS(t).
All individuals are risk averse and forward-looking, possessing rationalexpectations about the stochastic process underlying the shocks and theeconomy’s responses to them. The shocks in S represent genuine uncer-tainty, and if especially favourable or unfavourable may create incentivesto switch occupation. However, each switch costs c > 0 in utility, and thefuture gains from switching are uncertain because the output price in S(and hence income) is uncertain. The key point of the Dixit–Rob modelis that uncertainty generates an ‘option value’ to remain in the presentoccupation and to defer a costly switch.
Individuals are infinitely lived. Letting y(t) denote real income at t, δ >
0 the rate at which individuals discount future returns,12 and ti the datesof each switch (i = 1, . . . , n), individuals seek to maximise the objective
E
{∫ ∞
0U[y(t)] e−δt dt −
∑i
ce−δti
}. (2.6)
This objective functional is simply the expected value of total discountedutility net of all switching costs.
The key results from the model are as follows. First, it can be shownthat individuals switch from E to S when output in S – which evolves witha stochastic component by (2.5) – reaches some upper threshold. Con-versely, entrepreneurs switch into E when output in S reaches some lowerthreshold. If output varies between these two thresholds, individuals willremain in their current occupation: the switching cost effectively detersthem from moving. Second, a decrease in risk aversion or an increasein δ (i.e. greater impatience) moves the thresholds closer together, andso makes switching more likely. This is because less risk-averse workers
52 The Economics of Self-Employment and Entrepreneurship
(or those who heavily discount the future) are more willing to bear aswitching cost in order to realise certain current gains despite future un-certainty. Third, the thresholds diverge as the switching cost c increases:individuals will tend to stick with their current occupation, even if it isrelatively unsatisfactory, because the cost of switching to the other morefavourable occupation deters movement.
In short, Dixit and Rob showed that there may be hysteresis in occu-pational choice. Individuals may remain in entrepreneurship even if thereturns there at a given instant are less than those available in an alternativeoccupation. It is rational to remain in the occupation not only because ofthe switching cost, but also because there is an option value to wait andsee if conditions in the currently unfavourable occupation improve. Onlyif output changes such that this option value becomes sufficiently smallwill switching become worthwhile.13
Although Dixit and Rob did not discuss this implication of their work,the hysteresis result is useful because it goes some way to explainingwhy there is relatively little voluntary switching between self- and paid-employment from year to year, despite the apparent income differentialbetween them. US estimates of the proportion switching from E to Sin any given year are only 2–3.5 per cent.14 The figures for switchingout of self-employment into paid-employment are higher: for example,using PSID data on non-agricultural males over 1966–89, Fairlie (1999)reported one-year exit rates of 18.5 per cent for whites and 36.6 per centfor blacks. This primarily reflects the high failure rates of small businesses,especially newly established ones (see chapter 9, section 9.3).
It was seen above that the higher the switching cost, the less switchingtakes place. In the limit, these costs may be so high that no individualever anticipates switching. In this case, and if utility embodies constantrelative risk aversion so that U( y) = y1−r R
/(1 − r R
), for r R ≥ 0 (see
Definition 3), then individuals have an objective that is a special caseof (2.6), namely
E
{∫ ∞
0
[y(t)]1−r R
1 − r Re−δt dt
}, (2.7)
where y(t) is an individual’s total personal income, defined below. Itis worth exploring occupational choice using this simplified model fortwo reasons. First, we can easily investigate the effects of introducinguncertainty into the hitherto safe sector, E, as well as in S. Second, itis possible to allow for mixing of work hours between the occupations,enabling occupational choice to be analysed as a continuous, rather thanjust a discrete, choice.

Theories of entrepreneurship 53
To this end, Parker (1996, 1997a) assumed that incomes in both oc-cupations, yj for j = {S, E}, follow potentially different but uncorrelatedBrownian motions:
dyj = α j yj .dt + σ j yj .dz , (2.8)
where α j are occupation-specific average income growth rates, and σ 2j y2
jare variance terms capturing occupation-specific risk. If individuals canfreely choose the fraction of their time spent working in each occupation,then total income is
y(t) = ξyS(t) + (1 − ξ)yE(t) ,
where ξ ∈ [0, 1] is the proportion of time allocated to S. If an interiorsolution to the problem of maximising (2.7) subject to (2.8) exists, it canbe shown to take the form
ξ ∗ = (yS/y) − (yE/y)r R(σS − σE)2
− σE
σS − σEfor 0 ≤ ξ ∗ ≤ 1 , (2.9)
where y j = dyj
dt is the rate of change of income in occupation j .Suppose, as is commonly believed, that there is greater risk in S than in
E. Treating the variance of innovations to income as a measure of risk, thisimplies that σ 2
S > σ 2E. Then from inspection of (2.9), an interior solution
requires entrepreneurs to be compensated with a higher expected incomegrowth rate, i.e. yS/y > yE/y. If this holds, then the next propositionfollows directly from (2.9).
Proposition 4 (Parker, 1997a). If yS/y > yE/y and if there is no incomeuncertainty in paid-employment (i.e. σ 2
E = 0) then greater income risk inentrepreneurship unambiguously reduces the fraction of chosen time spent inentrepreneurship. But if yS/y > yE/y and if there is uncertainty in paid-employment (i.e. σ 2
E > 0), then greater income risk in entrepreneurship hasambiguous effects on the fraction of chosen time in entrepreneurship.
Proof. Differentiate (2.9) with respect to σS to obtain
dξ ∗
dσS= −2
yS/y − yE/yr R(σS − σE)3
+ σE
(σS − σE)2.
By inspection, this derivative is negative if σE = 0, but takes an ambiguoussign if σE > 0. �
At first sight, it might appear surprising that risk-averse individualscould respond to an increase in risk in entrepreneurship by choosing tospend even more time in it. But the logic is analogous to that applying inthe two-asset portfolio problem in finance, where the risk of the overall

54 The Economics of Self-Employment and Entrepreneurship
portfolio is a convex combination of the risk of each asset. Overall portfoliorisk can sometimes be reduced by increasing the portfolio share of theriskiest asset.15
Parker’s assumption of no switching is a strong one, but can be relaxedin the following way. Parker (1997a) analysed the case where individualscannot mix their time between occupations, and are trapped in an oc-cupation for T > 0 periods, where T may be made arbitrarily small.The optimal solution is that individuals choose the occupation j thatmaximises their risk-adjusted return:
maxj∈{S,E}
{2α j − σ 2
j r R}. (2.10)
That is, higher expected income growth in an occupation increases thelikelihood that an individual chooses to participate in it; but greater riskin the occupation decreases that likelihood to the extent that individualsare risk averse (measured by r R). Notice the property that the optimaloccupational choice given by (2.10) is invariant to the no-switching du-ration, T. The reason is that the same underlying taste and technologyparameters are taken to apply in all periods.
2.2.3 Heterogeneous entrepreneurial ability
In practice, it is likely that entrepreneurs differ from employees andamong themselves in terms of innate ‘entrepreneurial ability’. For now, itis not necessary to elaborate on the nature of ability in entrepreneurship:it might reflect, for example, leadership qualities (Leibenstein, 1968) orjudgement (Casson, 2003). Suppose that entrepreneurial ability can berepresented by a unidimensional variable, x, with support [x, x] and dis-tribution function F(x), with F(x) = 0 and F(x) = 1. It is assumed that xeither enters the entrepreneur’s production function in a positive manner,or his cost function in a negative manner. Ability ultimately determineswhich individuals become entrepreneurs and which become employees.It is also commonly assumed that abilities are fixed and known with cer-tainty by each individual.16
A highly influential paper that analysed the implications of hetero-geneous ability for occupational choice and entrepreneurship is Lucas(1978). We first outline Lucas’ static model of occupational choice, thenexplain and critically assess the dynamic version of that model, beforeconsidering variants and extensions of it.
The static Lucas modelLucas considered a closed economy with a homogeneous capital stockof a given size, and a workforce of a given size that is homogeneous

Theories of entrepreneurship 55
with respect to productivity in paid-employment, but heterogeneous withrespect to managerial ability in entrepreneurship. Price taking risk-neutralindividuals freely choose whether to become a worker in a firm managedby an entrepreneur, earning the wage w, or to set up their own firm asan entrepreneur, employing capital k and labour H. Entrepreneurs usea given constant-returns-to-scale technology to produce output (sold atunit price) of x.q [H.ψ(κ)], where κ := k/H is the capital–labour ratioused by the firm, ψ(·) is an increasing and concave function and q [·]is the production function, also assumed to be increasing and concave.Thus higher ability translates directly into higher output, for any k and H.
Entrepreneurs maximise profits, given by revenue less factor inputcosts:
maxk,H
π(x) = x.q [H.ψ(κ)] − wh − r k , (2.11)
where r is the rental price of capital, i.e. the interest rate. Using subscriptsto denote derivatives, the first-order conditions for this problem, in k andH, respectively, are
xqH.ψ(κ)[H.ψ(κ)]ψκ(κ) − r = 0 for x ≥ x (2.12)
xqH.ψ(κ)[H.ψ(κ)]{ψ(κ) − κψκ(κ)} − w = 0 for x ≥ x , (2.13)
from which we can derive demand functions for labour H(x, w, r ) andcapital k(x, w, r ); where x denotes the marginal entrepreneur, defined im-plicitly by π(x) = w. The marginal entrepreneur is the individual whois indifferent between entrepreneurship and paid-employment. Both de-mand functions are increasing functions of ability x. This implies thatmore able entrepreneurs run larger firms (irrespective of whether sizeis defined in terms of employment or capital assets), even though thecapital–labour ratio is invariant to ability (to see the latter, take theratio of (2.12) and (2.13)). Individuals with ability x ≥ x enter en-trepreneurship and the rest become workers. Hence the proportion ofentrepreneurs is 1 − F(x), implying a mix of workers between the occu-pations if x < x < x. To close the model, the equilibrium factor prices wand r are determined by equating the demands for and supplies of eachfactor.
The dynamic Lucas modelTo place greater structure on the model, and to relate entrepreneurshipto economic growth, Lucas invoked Gibrat’s Law. This ‘Law’ (which isexplained in greater detail in chapter 9, section 9.2) takes firm growthrates to be independent of firm size. In the context of Lucas’ model,the Law not only ensures that there is a uniquely determined marginalentrepreneur x, but also that the following proposition holds.17

56 The Economics of Self-Employment and Entrepreneurship
Proposition 5. If the elasticity of substitution is less than (greater than)(equal to) unity, then increases in per capita capital in the economy decrease(increase) (leave unchanged) the equilibrium number of entrepreneurs, andincrease (decrease) (leave unchanged) the average firm size.
To see the intuition behind Proposition 5, note that extra capital in-creases κ, and hence both the profits of entrepreneurs and the real wage.Members of both occupations gain; but the group that gains the mostdepends on the elasticity of substitution. If the latter is less than unity,then the returns in paid-employment increase by more than the returnsin entrepreneurship, because a low substitution elasticity implies that fac-tor usage does not respond much following the change in their relativeprices. This induces marginal entrepreneurs to become employees, whichincreases x and thereby also the average size of firms.
It is interesting to interpret the result stated in Proposition 5 in terms ofa prediction about future trends in the fraction of the workforce who areentrepreneurs. Empirical estimates consistently point to an elasticity ofsubstitution of less than unity (Hamermesh, 1993, pp. 92–104). Givenalso that capital per head tends to grow over time (Maddison, 1991),Proposition 5 implies that the fraction of entrepreneurs will decline inex-orably over time, while the average firm size and industrial concentrationwill inexorably increase.
How accurate are these predictions? Lucas obtained some evidencethat average firm size is positively related to the per capita capital stock.He regressed employees per firm (as a proxy for average firm size) againstper capita gross national product (as a proxy for the stock of capital perhead). He estimated that a 1 per cent increase in GNP is significantlyassociated with a 1 per cent increase in the number of employees perfirm.
However, Lucas’ other prediction receives somewhat less support –at least if the aggregate self-employment rate is used as a proxy for thesize of the entrepreneurship sector. As chapter 1, section 1.4 showed,while the self-employment rate decreased steadily in the last part of thenineteenth and early part of the twentieth centuries in most developedeconomies, in some economies the trend reversed in the last quarter ofthe twentieth century. This leads one to ask whether something is amissin Lucas’ model, or whether other factors are at work, overwhelming themechanism proposed there.
Consider the limitations of the Lucas model. One objection is theassumption of Gibrat’s Law. Recent studies have cast doubt on the ap-plicability of this Law, finding that firm growth rates are actually notinvariant to firm size (see chapter 9, section 9.2). Another problem is

Theories of entrepreneurship 57
that Lucas’ model is highly aggregated and simplified, glossing over in-dustry composition effects that may be important given the concentrationof self-employed workers in particular sectors (see chapter 3, subsec-tion 3.3.1).18 Among possible omitted factors is technological change,which may be a more important cause of macroeconomic growth thanchanges in the capital stock analysed by Lucas. For example, if technolog-ical change occurs in ways that disproportionately benefit smaller firms,then more rather than less entrepreneurship may result. The growthof the service sector may also be relevant. Rising levels of prosperityoften translate into greater demand for services that entrepreneurs maybe particularly efficient at supplying. Finally, it may be inappropriate totreat entrepreneurial managerial ability as exogenous, especially if en-trepreneurs learn over time (Otani, 1996).
Variants and extensions to the Lucas modelSeveral variants of Lucas’s model have been proposed (e.g. Calvo andWellisz, 1980; Oi, 1983; Blau, 1985; Bond, 1986; Brock and Evans,1986; de Wit and van Winden, 1991). In each of these models, theablest individuals select into entrepreneurship. In the model of Calvoand Wellisz (1980), for example, x describes the ability to learn aboutproductivity-enhancing technological information. An individual’s out-put, q (x), is assumed to grow through time t according to the differen-tial equation q (x, t) = x[q (t) − q (x, t)], where the dot indicates a timederivative and the term in square brackets measures the gap between theindividual’s output and the maximum available given the stock of knowl-edge at time t, i.e. q (t). Thus the greater the individual’s learning abilityx, or the greater the gap to be made up, the faster the individual learnsand the more she produces. Calvo and Wellisz showed that in steady-stateequilibrium, the greater the growth rate in the total stock of knowledgeand therefore potential output q (t), the more able is the marginal en-trepreneur x. Hence, given a fixed distribution of ability, the smaller isthe number of entrepreneurs and the larger the average firm size.19 Thisresult is interesting because it provides another rationale for Lucas’s pre-diction of ever-declining entrepreneurship and an ever-increasing averagefirm size. However, the Calvo–Wellisz model is ad hoc and partial equilib-rium in nature: ideally a general equilibrium analysis of both occupationswith optimising behaviour is needed to fully understand the impact oftechnological change on entrepreneurship.
These models all assume that heterogeneous abilities generate hetero-geneous returns only in entrepreneurship: returns in paid-employmentare assumed to be invariant to ability. A couple of papers have relaxed thisassumption. Suppose each individual possesses a pair of abilities (x, xE)

58 The Economics of Self-Employment and Entrepreneurship
that are productive in both occupations, the former being ability in en-trepreneurship and the latter being ability in paid-employment. Jovanovic(1994) assumed that returns in paid-employment are given by w.xE,where w > 0 is a constant. An individual becomes an entrepreneur if
π(x, w) := maxH
{xq (H) − wh} ≥ wxE , (2.14)
where q (·) is an increasing and concave function of hired labour, H. Ifthe condition in (2.14) is not satisfied for an individual characterised by(x, xE), then that individual becomes an employee. Firms derive theiroptimal labour demand function H∗ = H(x, w), with Hx > 0. By theenvelope theorem, πx = q [H(x, w)] > 0 and πxx = qH[H(x, w)]Hx > 0.Thus entrepreneurs’ returns are a convex function of their ability.
The main contribution of Jovanovic’s paper is to show that those withthe greatest entrepreneurial abilities x do not necessarily become en-trepreneurs. To see this, suppose that x and xE are positively related:xE = ψ(x), where ψ(·) is a strictly increasing function of xE. For exam-ple, more educated individuals might earn more in both occupations – apossibility which receives some support from our discussion of earningsfunctions in chapter 1, subsection 1.5.3. For the marginal entrepre-neur x,
π(x, w) = w.ψ(x) ,
so the ablest (resp., least able) individuals enter paid-employment if
π(x; w) < (resp., >) w.ψ(x) for x > x .
Thus it is possible for individuals with the lowest managerial abilities tobecome entrepreneurs (as illustrated in figure 2.1(a)), depending on theshape of the ψ(x) function.
Another possibility is that x and xE are negatively correlated, i.e. ψ(·)is a decreasing function of xE. This might be, for example, if x mea-sures productive rebelliousness, which pays off in entrepreneurship butis penalised in team-based paid-employment. In this case, figure 2.1(b) isapplicable and, as in Lucas’ model, only the highest-ability types becomeentrepreneurs.
One criticism of Jovanovic’s model is its inconsistent treatment of het-erogeneous employee ability. If employees have heterogeneous xEs, whyis this not reflected in the employer’s production function q (·)? After all,in a competitive economy, workers must be paid different wages to re-ward their different productivities. While it might be possible in principleto circumvent this problem by assuming that no entrepreneur hires anyworkers, it is then unclear how employees’ wages are determined.

Theories of entrepreneurship 59
Expected return in occupation j
Ability x
Ability x
Ability x
(a)
(b)
(c)
j = S
j = E
j = S
j = E
j = S
j = E
0
0
0
~x
~x
x1~ x2
~
Expected return in occupation j
Expected return in occupation j
Figure 2.1 Occupational choice with two occupations, entrepreneur-ship (S ) and paid-employment (E )(a) E attracts the ablest entrepreneurs: x > x enter E(b) S attracts the ablest entrepreneurs: x > x enter S(c) Multiple marginal entrepreneurs, x1, and x2
60 The Economics of Self-Employment and Entrepreneurship
This issue is treated explicitly in a second paper, by the author (Parker,2003d). Individuals are assumed to have heterogeneous abilities whichare private information and cannot be credibly revealed to outside agents.Individuals can choose freely between producing a good using a safe ora risky technology. In the case of the former, an individual with abilityx produces output w(x) with certainty; with the latter, the individualhas a probability p(x) of generating positive output R s , and 1 − p(x) ofproducing zero. Suppose that both w(·) and p(·) are increasing functionsof x, possibly for the reasons explained above. Both technologies requirea single indivisible unit of capital that no individual possesses initially.Two contracts are available. One contract is offered by a competitiveemployer, which supplies the unit of capital, owns the rights to the outputproduced and rewards the individual with a wage. The other is issued bya competitive bank, which lends the required capital, takes an agreeddebt repayment D < R s , and leaves the individual to take the surplusoutput. In general, all individuals, banks and employers have incentivesto perform monitoring to reveal hidden abilities.
Several equilibria are possible in this model. One equilibrium of partic-ular interest has banks optimally monitoring only borrowers who fail, inorder to deter opportunistic defaults, whereas employers optimally mon-itor all employees to reveal their hidden abilities. Employees optimallychoose safe production and are paid a type-specific wage of w(x) − c,where c is the monitoring cost. Banks issue a debt contract that poolsheterogeneous borrowers together, who optimally choose the risky tech-nology. An individual with x chooses the bank contract (‘entrepreneur-ship’) if expected returns there exceed w(x) − c, otherwise they take theemployer (‘paid-employment’) contract. Individual x is indifferent be-tween the two occupations:
p(x)[R s − D] = w(x) − c . (2.15)
This model not only shows how the different occupations can coexist inequilibrium (rather than just assuming that this is so, as was previouslythe case), but also generates a rich variety of potential occupational choiceoutcomes. These include the single crossings of expected returns depictedin figure 2.1(a) and (b), and also multiple crossings (multiple marginalentrepreneurs) as in figure 2.1(c). This model also has some implicationsfor the efficiency of bank financing of entrepreneurial investments – aswe will explain in chapter 5.
A distinct but related contribution by Barzel (1987) identified the resid-ual claimant feature of entrepreneurship stressed by Knight as a meansof resolving imperfect information and hidden action problems, and en-abling mutually beneficial productive collaborations to take place. As an

Theories of entrepreneurship 61
illustrative case, Barzel considered two individuals in separate jobs, oneof which (A, say) makes output that is intrinsically easy to monitor, whilethe other (B) makes a productive contribution that is intrinsically difficultto monitor. For example, A could be the producer of widgets, whereas Bis the coordinator of contracts to supply clients, the keeper of accountsand records and the searcher for new clients and cheaper raw materials.Barzel argued that B would become the entrepreneur, being the residualclaimant and employer of A via a wage contract. The reason is simplythat, by the nature of his job, B finds it easier to shirk. But B has fewerincentives to shirk if he is given residual claimant status rather than a wagecontract, since as a residual claimant he bears directly the costs of his ownforgone effort. Hence this arrangement maximises the joint product fromcollaboration and the individual returns for the two agents.
There are two other interesting implications of Barzel’s model. One isthat the infusion of B ’s capital into production endows the fixed wagecontract with credibility in the eyes of A – capital effectively serves as abond. This implies that capital makes a secondary contribution to output,in addition to its primary role as a factor of production. The second is thatthe identity of the entrepreneur is not fixed, but depends on the relativewages of the two collaborators. In particular, if A’s productivity (andhence wage) increases relative to B ’s, then A could eventually replace Bas the entrepreneur. The reason is that the loss from shirking by A undera fixed wage contract may eventually become so great that it becomesimperative to eliminate it – which is achieved by shifting the residualclaimant status from B to A.
2.2.4 Heterogeneous risk aversion
What if individuals can choose freely between entrepreneurship and paid-employment, as in the models just discussed, but face uncertainty in en-trepreneurship and have heterogeneous aversion to risk rather than heteroge-neous entrepreneurial ability? The economic implications of this scenariohave been analysed by Kihlstrom and Laffont (1979) (henceforth KL79).In Kihlstrom and Laffont’s own words, their model is ‘a formalisation, fora special case, of Knight’s discussion of the entrepreneur’ (1979, p. 745).This is because entrepreneurs exercise control over the production pro-cess, bear the risks associated with production, and freely choose whetherto become entrepreneurs or workers – as in Knight – but in the specialcase where all individuals possess identical managerial abilities.
Below, let θ identify individuals from a continuum defined on theunit interval. Suppose without loss of generality that higher values of θ
indicate greater aversion to risk, as measured by r A(π). Individuals have

62 The Economics of Self-Employment and Entrepreneurship
quasi-concave utility functions U(y; θ), where y is income. All individ-uals start with common exogenous non-labour income I > 0, which issufficiently great to rule out the possibility of bankruptcy. Individuals inpaid-employment all receive the safe wage w, where w > 0 equates aggre-gate labour demand and supply; but entrepreneurs face uncertain profitsbecause of random shocks � to their production function q = q (H, �),where H is the number of hired workers. Unlike the Lucas model there isno explicit treatment of capital. Higher values of � correspond to greateroutput. The value of � is revealed to individuals only after they havemade their occupational choices, labour hiring and production decisions.Let H(w, θ) be θ ’s optimal labour demand, i.e. the H that maximisesEU(I + π ; θ). With a unit output price, entrepreneurs’ stochastic profitsare
π(w, θ) = q (H(w, θ), �) − w H(w, θ) .
In the usual way, individual θ chooses to become an entrepreneur if
EU(I + π(w, θ); θ) ≥ U(I + w; θ) , (2.16)
otherwise he chooses paid-employment; the marginal entrepreneur is de-noted by θ .
After showing that their model possesses a unique equilibrium, KL79established the following results:20
KL79.1 More (resp., less) risk-averse individuals than the marginal en-trepreneur θ become employees (resp., entrepreneurs).
KL79.2 More risk-averse entrepreneurs operate smaller firms, i.e. useless labour than less risk-averse entrepreneurs, provided that the to-tal product q (H, �) and marginal product qH(H, �) are either bothmonotonically increasing or both monotonically decreasing functionsof � (an example of a production technology for which this holds isq (H, �) = �q (H)).
KL79.3 A general increase in individual risk aversion reduces the equilib-rium wage.21 This is because greater risk aversion increases the equi-librium number of employees by result KL79.1, and decreases the de-mand for labour by each entrepreneur by result KL79.2. Both changesreduce the aggregate demand for labour and hence w.
KL79.4 Industry equilibrium would be Pareto efficient (i.e. efficient inthe sense that there exist no allocations that could make one individualbetter off without making another individual worse off ) if all individ-uals were risk neutral; but it is inefficient when some individuals arerisk averse. There are three different manifestations of inefficiency.First, maximisation of aggregate output requires all firms to producethe same output when the production function is concave. However,entrepreneurs with heterogeneous risk aversion operate differently

Theories of entrepreneurship 63
sized firms by result KL79.2. Second, individuals could be made bet-ter off if risks were shared, but there is no mechanism for facilitat-ing this. Third, in general the wrong number of individuals becomeentrepreneurs. On the one hand risk aversion causes too few individu-als to become entrepreneurs (from the standpoint of efficiency), but onthe other hand risk aversion causes too small a demand for labour byresult KL79.2, and hence w is too low, causing too many individualsto choose entrepreneurship. In general, the two effects will offset eachother and the net effect cannot be predicted without further informa-tion about tastes and technology.22
KL79.5 Apart from the problems described in KL79.4 and caused by themaldistribution of risks across individuals, the equilibrium is in otherrespects efficient. One way of achieving full efficiency would be tointroduce a risk-sharing mechanism such as a stock market (Kihlstromand Laffont, 1983a).Perhaps the most widely cited of the above results is the first one,
KL79.1. The prediction that individuals who are relatively less risk averseare more likely to become entrepreneurs is intuitive, and has also moti-vated empirical tests (see chapter 3, subsection 3.2.4). However, KL79’sother results are also thought-provoking, and shed further light on theinteraction between risk and entrepreneurship.
For example, result KL79.3 can be compared with part (ii) of Propo-sition 3 stated earlier, due to Kanbur (1979). Both models predict theemployee wage to decline in response to an increase in risk aversion; butthey generate different predictions about the equilibrium number of en-trepreneurs. This is attributable to differences in the structure of the twomodels, in particular the heterogeneity of risk aversion in KL79 comparedwith homogeneity in Kanbur (1979).
Regarding result KL79.5, others have echoed KL79’s recommendationof introducing risk sharing mechanisms. For example, Grossman (1984)proposed a similar model to Kanbur (1979) in which the absence of mar-kets for risk sharing causes an inefficiently small number of entrepreneurs.Grossman showed how allowing free trade with foreigners who have acomparative advantage in entrepreneurship-rich goods reduces the sup-ply of domestic entrepreneurs even further. Yet he concluded that theprovision of risk sharing mechanisms to stimulate domestic entrepreneur-ship would be a better solution than imposing welfare-reducing tariffs orother trade restrictions. Of course, an obvious problem with the specificsolution of a stock market to share risks is that it is likely to be impracticalfor small firms. The high fixed costs incurred by a stock market listingare known to deter small firms from diversifying their risks in this way(see chapter 6, section 6.2 for more on this).

64 The Economics of Self-Employment and Entrepreneurship
Before we conclude, it is appropriate to pinpoint one important contri-bution made by both the KL79 and the Lucas (1978) models. It relates toa fundamental question about why it is that, when large firms have scaleeconomies in production, small firms exist at all. Both KL79 and Lucaspropose explanations based on exogenous heterogeneous entrepreneurialcharacteristics which, in conjunction with concave production functions,rule out an equilibrium in which one firm produces all the output. Ofcourse, this is not the only reason why small entrepreneurial firms cancoexist with large ones. Small entrepreneurial firms might be able to avoidagency problems, diseconomies of scale and diluted incentives to innovatethat can hinder the economic performance of large firms (Williamson,1985; Reid and Jacobsen, 1988). Also, small entrepreneurial venturesmight be more efficient at supplying small batches of goods or customisedgoods and services than their larger rivals, who might have a comparativeadvantage at producing standardised products in large production runs.Part of the interest of the KL79 and Lucas models is therefore that theycan explain the coexistence of small entrepreneurial and large corporatefirms even in the absence of these special factors.
2.3 Conclusion
This chapter reviewed early and modern economic theories of en-trepreneurship. While the early theories tended to treat issues in a gen-eral and discursive manner, modern economic analysis asks more pre-cisely targeted questions focused on occupational choice. Its approach istherefore narrower, but it arguably obtains sharper results. For example,modern theories predict what types of individuals are likely to becomeentrepreneurs, and why they do so, as well as tracing out the implicationsfor economic efficiency. Being tightly focused, this approach also has theadvantage of generating hypotheses that can be tested and falsified inthe accepted scientific tradition. An example is Kihlstrom and Laffont’s(1979) prediction that the least risk-averse individuals are more likely tobecome entrepreneurs, and run larger firms.
Another strength of the modern theories is that they clarify what can,and cannot, be said about the determinants of entrepreneurship. Forexample, we saw that greater risk in entrepreneurship does not neces-sarily reduce the equilibrium number of entrepreneurs. The reason isthat greater risk in entrepreneurship also affects employees indirectly bydecreasing the equilibrium wage. We also showed why rational individ-uals might not switch between entrepreneurship and paid-employmentdespite apparently being able to make clear-cut gains from doing so; andhow imperfect information enables the entrepreneurial function to be
Theories of entrepreneurship 65
endogenised. Regarding the latter, an especially interesting hypothesisis that, within firms, the individual who becomes the entrepreneur (i.e.the residual claimant) is the one with the greatest freedom to undertakehidden actions such as shirking.
One criticism sometimes made of the modern economic approach bynon-economists is that it adopts an inappropriately narrow perspective ofentrepreneurship. Specifically, it does not define entrepreneurship aboveand beyond the receipt of residual profits and the bearing of financialrisk. Chapter 3 goes some way towards addressing that criticism by fill-ing out our picture of entrepreneurs and entrepreneurship. We do thisby synthesising theoretical and empirical work on specific personal char-acteristics and the broader environmental factors associated with en-trepreneurship.
NOTES
1. See, for example, Hebert and Link (1988), Barreto (1989), Binks and Vale(1990), Chell, Haworth and Brearley (1991) and van Praag (1999). Hebertand Link’s monograph provides a particularly thorough account of the en-trepreneur in the history of economic thought, from ‘the prehistory of en-trepreneurship’ through to the modern era. Van Praag provides an illuminatingcomparison between competing views of entrepreneurship.
2. More recently Gifford (1998) endogenised alertness in a model of limited en-trepreneurial attention. Entrepreneurs endowed with high levels of managerialability optimally spend their time operating numerous projects: they thereforeface a high opportunity cost of perceiving new innovative opportunities, whichrenders them less ‘alert’.
3. Knight viewed profits as a fluctuating residual, not as a return to the en-trepreneurial factor of production. In contrast, Frederick Hawley (1907) re-garded profit as a reward to risk-taking. According to Hawley, what sets theentrepreneur apart is his willingness to be the ultimately responsible agent inthe productive process, liable for ownership of output but also for loss. Thiswillingness entitles him to direct and guide production.
4. One aspect of Knight’s writing that has arguably generated more heat than lightis the distinction between risk and uncertainty – or, more accurately, informedand uninformed uncertainty. Informed uncertainty occurs when an individualdoes not know in advance the (random) outcome of a draw from a given prob-ability distribution, but does know the form and parameters of the underlyingprobability distribution. Then individuals can form expectations of events.In contrast, uninformed uncertainty occurs when individuals are not onlyignorant of the outcomes of the random draw, but also do not know the formof the probability distribution. Some authors have claimed that the latter kindof uncertainty precludes systematic optimising choice. However, quite apartfrom the fact that a careful reading of Knight’s treatise points to his apparentbelief in informed rather than uninformed uncertainty (LeRoy and Singell,1987), the whole distinction between informed and uninformed uncertainty

66 The Economics of Self-Employment and Entrepreneurship
is actually irrelevant from a Bayesian viewpoint. Bayesians characterise (pos-terior) beliefs as the product of initial prior beliefs (‘priors’) and the likelihoodof observed subsequent events having occurred. The case of informed uncer-tainty corresponds to one with sharp priors; uninformed uncertainty merelycorresponds to one with diffuse priors, where there is no concentration ofprobability mass in any particular outcome. In either case, entrepreneurs canform expectations and therefore can make meaningful decisions. In our viewthe distinction between informed and uninformed uncertainty is thereforeempty and is ignored in the remainder of the book.
5. For example, ‘an entrepreneur is someone who specialises in taking judge-mental decisions about the co-ordination of scarce resources’ (Casson, 2003,p. 20).
6. ‘Everyone is an entrepreneur only when he actually carries out new combina-tions and loses that character as soon as he has built up his business, when hesettles down to running it as other people run their business’ (Schumpeter,1934, p. 78). Schumpeter predicted the eventual demise of the entrepreneurbecause of the rise of large monopolistic firms, which have advantages at co-ordinating teams of workers to perform R&D. However, this prediction hasnot come to pass, partly because small firms continue to innovate (see chapter9), and partly because the majority of US basic research is funded not by largefirms but by the Federal government (Schultz, 1980). Findings of a positivecorrelation between the number of businesses and the aggregate number ofpatents issued (Shane, 1996) are also of interest in this light.
7. Individuals with these utility functions would maximise their expected util-ity by avoiding gambles, being indifferent to gambles, and seeking gambles,respectively. See any standard microeconomics text for proofs.
8. ‘They enjoy the excitement of a challenge, but they don’t gamble. En-trepreneurs avoid low-risk situations because there is a lack of challenge andavoid high-risk situations because they want to succeed. They like achievablechallenges’ (Meredith, Nelson and Neck, 1982, p. 25).
9. Appelbaum and Lim (1982) appeared to overlook effect (2), and hence in-correctly concluded that greater price uncertainty unambiguously reduces ex-pected profits and hence decreases the equilibrium number of entrepreneurs.
10. See chapter 3, subsection 3.2.4 for some evidence about cross-country dif-ferences in attitudes to risk.
11. An influential dynamic model by Jovanovic (1982) analyses learning underuncertainty but ignores switching costs. This model is discussed in chapter9, section 9.1.
12. Thus δ > 0 implies that individuals value utility available tomorrow less thanthey value the same level of utility available today. This is commonly taken toreflect ‘impatience’: the greater is δ, the more impatient an individual is.
13. Dixit and Rob (1994) also showed that a socially suboptimal amount ofswitching takes place in equilibrium. Greater labour mobility decreases thevariability of output prices, which benefits the imperfectly insured risk-aversepopulation. There is therefore a role in principle for government to improveon the free-market equilibrium by speeding up the re-allocation of labourbetween occupations.

Theories of entrepreneurship 67
14. The estimates are: circa 2 per cent (Meyer, 1990; van Praag and vanOphem, 1995: National Longitudinal Survey (NLS)); 2.5 per cent (Evansand Leighton, 1989b: CPS); 3 per cent (Boden, 1996: CPS; Dunn and Holtz-Eakin, 2000: NLS); and 3.4 per cent (Fairlie, 1999: PSID). Boden calculatedthat the female switching rate was about 1 per cent lower than that of males.According to Evans and Leighton (1989b), switching into self-employmentby Americans occurs steadily up to age forty and then levels off. See Taylor(2001, p. 546) for British evidence on switching rates.
15. Parker (1996) obtained some time-series evidence suggesting that greater riskin entrepreneurship, proxied by the number of strikes, was significantly asso-ciated with a lower aggregate self-employment rate in the UK in the post-warperiod. However, he did not control for risk in paid-employment. While Fotiand Vivarelli (1994) proposed the number of involuntary job losses as a mea-sure of wage uncertainty, this measure also carries alternative interpretations,and confounds the impact of unemployment on new-firm creation.
16. This assumption has been relaxed in a model by Jovanovic (1982), whereentrepreneurs learn about their x by observing their performance in en-trepreneurship. Discussion of the Jovanovic model is deferred until chapter9, section 9.1.
17. The proof is straightforward but technical: the interested reader is referred toLucas’ (1978) original article.
18. Brock and Evans (1986) went so far as to dismiss the empirical relevance ofthis model, and another by Kihlstrom and Laffont (1979), discussed below,concluding that they ‘were developed primarily to study general equilibriumissues and have limited empirical content’ (1986, n. 39, p. 204).
19. If young entrepreneurs learn fastest then it can be shown that the age of theyoungest entrepreneur and the average firm size are both decreasing functionsof the rate of technological progress. Making ability two-dimensional, so in-dividuals are characterised by youth and ability, Calvo and Wellisz (1980)showed that faster technological progress leads to an equilibrium outcomewhere older, inherently less able entrepreneurs are replaced by younger andinherently more able entrepreneurs. See Gifford (1998) for another two-dimensional model of ability, comprising ‘managerial ability’ (for operatingexisting projects) and ‘entrepreneurial ability’ (for innovating new projects).
20. Proofs are omitted for brevity: the interested reader is referred to the originalKL79 article.
21. Strictly speaking, this result requires either the utility or the production func-tion to be strictly concave.
22. For example, in the special case where all individuals are equally risk averse,it can be shown that there will be too many entrepreneurs in equilibrium.Another special case is constant returns to scale technology, under whichonly one firm is optimal, compared to the greater number that would emergein the competitive equilibrium.

3 Characteristics of entrepreneurs and theenvironment for entrepreneurship
Chapter 2 discussed several theories of entrepreneurship, the role of en-trepreneurs and the factors influencing individuals to participate in en-trepreneurship. The purpose of this chapter is to fill out the picture ofentrepreneurship that has been sketched so far. Complementing the the-oretical analysis of chapter 2, section 2.2, section 3.1 reviews the evidenceabout the impact of financial rewards on entrepreneurial behaviour. It alsoexplores the role of specific aspects of entrepreneurial ability embodiedin human and social capital. Section 3.2 focuses on linkages between en-trepreneurship, family circumstances and personal characteristics. Sec-tion 3.3 summarises theory and evidence about the broader macroeco-nomic factors that affect entrepreneurship, including economic devel-opment, changes in industrial structure, unemployment, regional effectsand government policy variables. Throughout, the self-employed are in-variably used as a working empirical definition of entrepreneurs. Section3.4 briefly summarises the main results of the chapter and concludes.
3.1 Relative earnings, human and social capital
3.1.1 Earnings differentials
The most widely used tool for estimating the effects of earnings differen-tials on participation in entrepreneurship is the structural probit modeldescribed in chapter 1, subsection 1.6.2. Recall from (1.15) that only ifα, the estimated coefficient on the earnings differential term in the pro-bit model, is positive and significant does a relative earnings advantage inentrepreneurship increase the likelihood of participation in entrepreneur-ship.
Taking self-employment to be a working definition of entrepreneurship,(1.15) has been estimated by several British researchers, most of whomhave reported positive α estimates. Estimates include 0.365 (Rees andShah, 1986); 0.036 (Dolton and Makepeace, 1990); 0.09–0.13 (Clarkand Drinkwater, 2000); and 0.597 (Taylor, 1996). The first two estimates
68

Entrepreneurs: characteristics and environment 69
are insignificantly different from zero; the latter two are statistically signif-icant. Parker (2003a) obtained mixed results (α took varying signs) usingseveral British data-sets from different years; the estimate of α was posi-tive but marginally insignificant for switchers between paid-employmentand self-employment. Gill (1988) and Fujii and Hawley (1991) obtainedestimates based on US data. This evidence is also mixed, the formerreporting significant negative and the latter significant positive α esti-mates. For other countries, Bernhardt (1994) estimated α to be positiveand significant for a sample of Canadian white, full-time non-agriculturalmales. De Wit (1993) and de Wit and van Winden (1989, 1990, 1991)reported insignificant positive α estimates using Dutch data; and Earleand Sakova (2000) reported negative α estimates using household datafrom six Eastern European transition economies.1
In short, relative earnings do not play a clear-cut role in explainingcross-section self-employment choice. One might attribute the mixedempirical results to the variety of different data-sets and specificationsused by researchers. However, one could just as easily conclude that thefailure to obtain a clear positive effect from relative earnings despite thevariety of specifications and data-sets indicates non-robustness in the rel-ative earnings motive for self-employment. Several explanations for thisinconclusive result can be proposed. First, it is not clear that previousresearchers have successfully isolated variables that affect earnings in thetwo sectors but not occupational choice itself – as required to identify thestructural probit model (see subsection 1.6.2). Second, the poor quality ofself-employment data may also be partly responsible for the conflictingresults.2 Third, in developing and transition economies market imper-fections might undermine neoclassical occupational choices (Earle andSakova, 2000), although this explanation is less convincing for developedeconomies.
Alternatively, these results may simply be telling us that pecuniary re-wards are not the primary motive for choosing self-employment. For ex-ample, participation in self-employment might be motivated by lifestyleconsiderations, for instance as a means of being one’s own boss. Anotherpossibility is that the self-employed suffer from unrealistic optimism andremain in a low-return occupation because they anticipate high futureprofits. While there might be some truth in these hypotheses, there isso much economic evidence that human beings adjust their behaviour inresponse to changes in relative prices that it would be puzzling if the samecalculus ceased to apply entirely in the realm of occupational choice.
At a more aggregate level, two time-series studies have found that thedifference between average aggregate income in self-employment andpaid-employment is a significant determinant of post-war trends in the

70 The Economics of Self-Employment and Entrepreneurship
UK aggregate self-employment rate (Parker, 1996; Cowling and Mitchell,1997). However, these findings should be treated with caution, for atleast two reasons. First, average occupational incomes are endogenous,depending also on the number of individuals engaged in the occupation.It is known, for example, that the increase in UK self-employment in the1980s was accompanied by a reduction in average self-employment in-comes (Robson, 1997). Second, time-series studies usually define averageself-employment income as aggregate self-employment income dividedby the total number of self-employed, nS. If aggregate self-employmentincome is subject to measurement error, then the presence of nS onboth sides of the regression equation can suggest an apparent relation-ship between the aggregate self-employment rate and average (relative)self-employment income where none really exists.
3.1.2 Human capital
Age and experienceOne might expect older and/or more experienced people to become en-trepreneurs, for the following reasons:1. The human and physical capital requirements of entrepreneurship are
often unavailable to younger workers. Older people are more likely tohave received inheritances and to have accumulated capital which canbe used to set up a business more cheaply, or to overcome borrowingconstraints (see chapter 7). There might also exist a particular type ofhuman capital which is productive both in managing and in working forothers, and which can be acquired most effectively by working initiallyas an employee (Lucas, 1978).
2. Older individuals might choose self-employment to avoid mandatoryretirement provisions sometimes found in paid-employment.
3. Older people have had time to build better networks, and to haveidentified valuable opportunities in entrepreneurship, possibly throughlearning about the business environment (Calvo and Wellisz, 1980).
4. As their own masters, entrepreneurs often possess greater control overthe amount and pace of their work, making it sometimes better suitedto older people who have lost their physical stamina, or to workers inpoor health or with skills that are obsolete in paid-employment.Offsetting these factors, the old may be more risk averse than the
young, and less capable of working the long hours often undertaken byentrepreneurs. Also, Miller’s (1984) ‘job-shopping’ theory predicts thatworkers try riskier occupations (like entrepreneurship) when they areyounger, since these occupations provide the richest information aboutworkers’ personal job-matching opportunities. It is noteworthy that this

Entrepreneurs: characteristics and environment 71
prediction does not rest on ad hoc assumptions such as the young hav-ing an innate taste for risk, or irrational expectations such as youthfulover-optimism.
Descriptive studies tend to find that self-employment is concentratedamong individuals in mid-career, i.e. between thirty-five and forty-fouryears of age (see, e.g., Cowling, 2000 and Reynolds et al., 2002, for in-ternational evidence). Aronson (1991) demonstrated that self-employedAmericans of both sexes were older on average than their employee coun-terparts throughout the entire post-second World War period. Numerousother descriptive studies from a variety of countries confirm these find-ings.
Before we turn to the econometric evidence, we mention two importantcaveats to the use of age as a measure of experience. Age and experienceare not synonymous, yet a common practice (often dictated by data lim-itations) is to measure ‘experience’ as current age minus school-leavingage. This measure is imperfect because it takes no account of breaks fromlabour force participation in individuals’ work histories. This may be aparticularly salient consideration when analysing female entrepreneur-ship. Second, it is important to separate cohort effects from experienceeffects. To see this, consider using a cross-section of data to cross-tabulateself-employment rates by age. Suppose that there has been a secular de-cline in self-employment over time. Then older cohorts will be observedto have higher self-employment rates than younger cohorts, irrespectiveof any experience effects. To separate cohort effects from genuine expe-rience effects, either longitudinal (panel) data or accurate measures ofyears of actual work experience are required. It might also be helpful todistinguish between experience in paid-employment and experience inself-employment, since different types of experience might generate dif-ferent returns and so impact differently on occupational choice. Severalempirical studies make this distinction, as discussed below.
Despite these caveats, most econometric investigations have exploredthe effects of age on self-employment using cross-section data. Most ofthese studies have found a significant positive relationship between thesetwo variables, while a minority report insignificant effects.3
Age may have different effects on the willingness and opportunity tobecome self-employed. For example, using the bivariate probit estima-tion approach described in chapter 1, subsection 1.6.3, van Praag andvan Ophem (1995) found that the opportunity to become self-employedwas significantly higher for older than for younger Americans. However,older workers were significantly less willing to become self-employed thanyounger workers were. These findings receive some support from inter-national survey evidence reported by Blanchflower, Oswald and Stutzer

72 The Economics of Self-Employment and Entrepreneurship
(2001), that individuals’ reported interest in self-employment decreaseswith age, while the actual number choosing self-employment increaseswith age.
As noted above, it is often informative to distinguish between differ-ent types of labour market experience. The results here are scant butinteresting. Evans and Leighton (1989b) estimated that previous self-employment experience had a positive and significant impact on theprobability of white male Americans entering self-employment, whereasprevious employment experience (and age) had no effect (see also Carrolland Mosakowski, 1987; van Praag and van Ophem, 1995; Quadrini,1999; Lin, Picot and Compton, 2000). This result is consistent withJovanovic’s (1982) theory that entrepreneurs learn about their abilitiesover time, which they can do only from having engaged in entrepreneur-ship (see chapter 9, section 9.1). Also, Boden (1996) reported thatemployees of small firms (defined as having fewer than 100 employees)were more likely to switch to self-employment ceteris paribus than employ-ees of large firms – which may be indicative of (indirect) entrepreneuriallearning.
Does self-employment experience have long-term effects on what anindividual can earn if they later switch to paid-employment? Four stud-ies have explored this question, all using US data: Evans and Leighton(1989b), Ferber and Waldfogel (1998), Holtz-Eakin, Rosen and Weathers(2000) and Williams (2000). They all found weak long-term effectsof self-employment experience on future paid-employment incomes,though perhaps unsurprisingly employees who had been self-employedin the past tend to be much less likely to have health benefits or pensionsthan were those who had always been employees (Ferber and Waldfogel,1998).
Using Stanford graduate alumni data, Lazear (2002) estimated thatmore varied labour market experience (measured by the number of dif-ferent work roles in previous jobs) was significantly associated with busi-ness formation. Lazear took this as supportive evidence for his theorythat entrepreneurs are jacks of all trades, unlike employees who invest ina small number of specialist skills.
In summary, it is important to distinguish between age and experiencewhen trying to explain why individuals choose self-employment. Whileboth variables are usually found to be positively associated with self-employment, experience captures most accurately the impact of humancapital.
Finally, the perceptive reader will have noticed that we have not yetdiscussed the topic of entrepreneurship in old age. This is a subject in itsown right, treated separately in chapter 8, subsection 8.2.2.

Entrepreneurs: characteristics and environment 73
EducationAs with age, one can advance arguments to propose either a negative ora positive relationship between entrepreneurship and education. On onehand, more educated workers might select themselves into occupationsin which entrepreneurship is more common, such as managerial occu-pations for professionals (Evans and Leighton, 1989b) and skilled craftjobs for manual workers (Form, 1985). As Keeble, Walker and Rob-son (1993) showed, there are many opportunities for self-employmentin knowledge-based industries. Also, greater levels of education maypromote entrepreneurship because more educated people are better in-formed about business opportunities.
On the other hand, the skills that make good entrepreneurs are un-likely to be the same as those embodied in formal qualifications (Casson,2003). In particular, one hesitates to suggest education as a proxy formanagerial ability in entrepreneurship a la Lucas (1978) (see chapter 2,section 2.2). As noted in chapter 1, subsection 1.5.3, entrepreneurs mayalso have fewer incentives to acquire formal educational qualificationsthan employees if education is an unproductive screening device usedchiefly by employers to sort hidden worker types. Additional grounds fordoubting the impact of education on the decision to be an entrepreneurrests on the result that rates of return to education appear to be greater foremployees than for the self-employed (see chapter 1, subsection 1.5.3).
Most econometric studies of the effects of education on self-employment are cross-sectional. In these studies, educational attainmentis usually measured either as years of education completed, or as a set ofdummy variables registering whether survey respondents hold particularqualifications. As with age, the evidence generally points to a positive re-lationship between educational attainment and the probability of beingor becoming self-employed.4 However, many other studies have foundinsignificant effects of education on self-employment;5 and several havedetected negative effects.6
It is possible that the divergent results in this branch of the literaturecan be attributed to the use of different econometric specifications, inparticular whether controls for financial variables and occupational sta-tus are included (Le, 1999). One might expect an individual’s specificoccupation to be related to education, imparting possible upward biasto education coefficients in earnings functions that omit detailed occu-pational controls. Also, effects of education on self-employment appearto be sensitive to the industry in which self-employment is performed.For example, Bates (1995, 1997) reported positive and significant effectsof education on the probability of entering self-employment in skilledservices; negative and significant effects on the probability of entering

74 The Economics of Self-Employment and Entrepreneurship
self-employment in construction; and insignificant effects on the prob-ability of entering self-employment in manufacturing and wholesaling.Bates concluded that the overall impact of education on self-employmentis obscured by aggregation across dissimilar industries. Another poten-tially important factor is different cultural traditions. Borooah and Hart(1999) presented some British evidence that higher education is associ-ated with a greater probability of self-employment among whites, but alower probability of self-employment among Indians.
3.1.3 Social capital
‘Social capital’ is the name given to social relations that facilitate individ-ual actions. It may exist at the country level, for example in the degreeof trust in government and other institutions; at the community level,such as the quality of connections within communities; and at the indi-vidual level, in the form of confidence or motivation (Glaeser, Laibsonand Sacerdote, 2000). Sanders and Nee (1996) suggested that social re-lations may increase entrepreneurial success by providing instrumentalsupport, such as cheap labour and capital; productive information, suchas knowledge about customers, suppliers, and competitors; and psycho-logical aid, such as helping the entrepreneur to weather emotional stressand to keep their business afloat. In principle, social capital might be usedto compensate for limited financial or human capital.
Gomez and Santor (2001) tested whether social capital affects successin entrepreneurship. They did this by augmenting a self-employed earn-ings function with two proxy variables: whether respondents belongedto any community organisation (‘club’) that meets regularly, and self-reported estimates of the value of one’s own social contacts and how wellone knows one’s neighbours. Using data on borrowers from a Torontomicrofinance organisation from the 1990s, Gomez and Santor found thatself-employed club members earned significantly and substantially morethan self-employed non-members. It is not yet clear, however, whethersocial capital increases entry into self-employment.7
3.2 Personal characteristics and family circumstances
3.2.1 Marital status
One might expect a disproportionate number of married people to beentrepreneurs compared with single people, for the following reasons:1. A spouse can help provide start-up capital.2. Once in business, a spouse can provide labour at below-market rates,
or they can use their income as insurance against risky income in

Entrepreneurs: characteristics and environment 75
entrepreneurship.8 Spouses may also be more trustworthy workers,being less likely to shirk (Borjas, 1986). And spouses can offer valu-able emotional support.
3. Having a spouse may offer tax advantages. These include income shar-ing to exploit personal tax allowances; introducing the spouse as a‘sleeping partner’ and allocating them a share of the enterprise’s prof-its; and, if trading through a limited company, providing them withbenefits (such as a company car or private medical insurance), or mak-ing payments into the spouse’s pension scheme.
4. Entrepreneurs are older on average, and older people are more likelyto be married.On the other hand, married people with children may be unwilling
to take the risks associated with entrepreneurship; and to the extent thatnon-married people are ‘displaced’ or dissatisfied, they are arguably morelikely to be entrepreneurs (see subsection 3.2.3).
Cross-section econometric evidence from probit models tells a consis-tent story: self-employed people are significantly more likely to be, or tohave been, married, with dependent children.9 This finding appears tohold quite generally, with the possible exception of black Americans(Borjas, 1986) and ethnic minority English (Clark and Drinkwater,2000). The evidence on the effects of marital status on the probabil-ity of switching into self-employment is similar, if a little weaker;10 andthe evidence about the effects on entrepreneurship of having a workingspouse is mixed.11
In summary, there is general but not unanimous agreement that self-employment status is positively associated with marital status. Becausemost of the findings reported above control for individuals’ ages, thesefindings are probably capturing some kind of co-operative factor as inpoints 1–3 above rather than indirect effects from age itself. This con-clusion is consistent with direct evidence from Bruderl and Preisendorfer(1998) that emotional support from a spouse improves the survival andprofitability prospects of new German business ventures.
3.2.2 Ill-health and disability
Entrepreneurship is often believed to offer greater flexibility than paid-employment in terms of the individual’s discretion over the length, loca-tion and scheduling of their work time (Quinn, 1980). To the extent thatpeople with poor health or disabilities need such flexibility, it might be ex-pected that, all else equal, they are more likely to be self-employed. In ad-dition, self-employment may offer a route out of employer discriminationagainst the disabled. However, self-employment may be a poor choice for

76 The Economics of Self-Employment and Entrepreneurship
individuals in poor health. Some jobs with high self-employment concen-trations such as construction are intrinsically less suited to those with dis-abilities – not to mention more dangerous, implying that self-employmentcan also cause disability and ill-health. Work hours and stress are alsogreater on average in self-employment (see chapter 8, section 8.2). Andwhereas many employees receive health cover from their employers, theself-employed must provide their own.12
Survey evidence from the UK suggests that self-employed men actu-ally have slightly better (self-reported) health than male employees do,whereas self-employed females are slightly less healthy than their em-ployee counterparts (Curran and Burrows, 1989). In contrast, Fredlandand Little (1981) reported that mature American self-employed work-ers were in significantly poorer health than employees. Probit estimatesreflect mixed effects of ill-health on self-employment status.13
In summary, the association between self-employment and ill-healthand disability is ambiguous. It is unclear at present what underlies thelack of agreement between the various empirical studies; but it wouldseem that there is ample scope for further research on this topic.
3.2.3 Psychological factors
Entrepreneurial traitsA large psychological literature has developed which claims that en-trepreneurs possess special traits that predispose them to entrepreneur-ship. Economists are now catching on to this idea, by including psy-chological variables in cross-section probit models of self-employmentchoice.
In their review of the role of psychological factors in entrepreneurshipresearch, Amit, Glosten and Muller (1993) identified four traits that haveattracted substantial research interest:1. Need for achievement. One of the first systematic attempts to pro-
vide a psychological profile of entrepreneurs was McClelland (1961).McClelland highlighted the constructive role of ‘business heroes’ whopromote the importance of entrepreneurial achievement to subse-quent generations. According to McClelland, the key characteristicof successful entrepreneurs is the ‘need for achievement’ (n-Ach),rather than a desire for money (1961, pp. 233–7). In McClelland’swords: ‘a society with a generally high level of n-Ach will producemore energetic entrepreneurs who, in turn, produce rapid economicdevelopment’ (p. 205). McClelland’s conclusions were drawn fromresults of applying Thematic Apperception Tests (see Brockhaus,1982, for a description and a critique). As well as having n-Ach,

Entrepreneurs: characteristics and environment 77
McClelland also argued that entrepreneurs are proactive and commit-ted to others; like to take personal responsibility for their decisions;prefer decisions involving a moderate amount of risk; desire feedbackon their performance; and dislike repetitive, routine work. A corollaryof McClelland’s thesis is that the achievement motive can be delib-erately inculcated through socialisation and training, although resultsfrom such efforts have drawn a mixed response (Chell, Haworth andBrearley 1991). It is not clear that n-Ach can be ‘coached’, as hasbeen claimed; and it is questionable whether entrepreneurship is theonly vocation in which n-Ach can be expressed (Sexton and Bowman,1985).14
2. Internal locus of control. Another psychological trait is a person’s innatebelief that their performance depends largely on their own actions,rather than external factors. Psychologists call this ‘having a high inter-nal locus of control’. Since self-employment often offers greater scopefor individuals to exercise their own discretion at work than does paid-employment, it follows that those with a high internal locus of controlmight have a greater probability of being self-employed. A psychologi-cal metric known as the Rotter Scale (Rotter, 1982) provides the basisfor empirical tests of this hypothesis. The more a survey respondent be-lieves a range of factors to be under her control, as opposed to outsideher control, the lower her Rotter score in any given test. While Evansand Leighton (1989b) and Schiller and Crewson (1997) obtained evi-dence from probit regressions supporting the locus of control hypoth-esis, van Praag and van Ophem (1995) obtained contrary results. Themixed findings may reflect the fact that having a high locus of con-trol is not unique to entrepreneurs, since it has also been identifiedamong successful business managers (Sexton and Bowman, 1985).
3. Above-average risk taking propensity. As chapter 2, subsection 2.2.4showed, Kihlstrom and Laffont’s (1979) model of entrepreneurshippredicts that entrepreneurs are less risk averse than employees are.Evidence on this issue will be discussed in subsection 3.2.4.
4. A tolerance of ambiguity (Timmons, 1976; Schere, 1982). It is proposedthat entrepreneurs have a greater capacity than employees for dealingwith environments where the overall framework is ill defined.The above list is by no means exhaustive. Others have claimed that
entrepreneurs exhibit ‘Type A’ behaviour, which is characterised by com-petitiveness, aggression, a striving for achievement and impatience (Boyd,1984). Another trait is claimed to be over-optimism (see below). Still oth-ers have argued that entrepreneurs are misfits or displaced persons wholive outside the mainstream of society, and are possibly prone to deviantand criminal behaviour (Shapero, 1975; Kets de Vries, 1977). Kets de

78 The Economics of Self-Employment and Entrepreneurship
Vries argued that childhood disruption makes it harder for individuals toaccept authority or to work closely with others, rendering them insecureand lacking in self-esteem and confidence. Consequently they establishnew enterprises in an act of ‘innovative rebelliousness’ to boost theirself-esteem and to acquire external approbation. This view, which findsechoes in Schumpeter (1934), has received empirical backing. Light andRosenstein (1995) reported that at-risk youth and prisoners demonstratea keen interest in business ownership and evince disdain for available jobsin paid-employment. In an econometric study based on British NationalChild Development Survey (NCDS) data, Burke, Fitz-Roy and Nolan(2000) found that those who were anxious to be accepted by others earlyin life were significantly more likely to be self-employed later in life, per-haps as a means of generating respect. But van Praag and van Ophem(1995) reported that more outgoing American children were significantlymore willing to become self-employed in later life.
If obsessive, inner-directed and non-conformist traits are deep-rooted,and only entrepreneurship can satisfy the individuals who possess them,then we might expect to see these individuals persisting in entrepreneur-ship despite a lack of reward. In this light it is interesting that Shapero(1975) reported that 72 per cent of the entrepreneurs he surveyed wouldstill want to start a new company if their present one failed. In a similarvein, it appears that some individuals are deeply attached to ‘making it’ inentrepreneurship, perhaps for deep personal reasons, drifting from oneentrepreneurial venture to another before hitting success (Copulsky andMcNulty, 1974).
However, this view of the ‘entrepreneur as misfit’ or ‘deviant’ is vul-nerable to the usual charge that occupations other than self-employmentmay also appeal to individuals with the proposed psychological trait. Thehypothesis has also been disputed by Reynolds and White (1997), whoseUS survey data responses indicated that new business founders tend tobe people belonging to the centre rather than the periphery of the econ-omy, with stable work and family circumstances (see also Blanchflowerand Oswald, 1998). This may reflect the fact that many start-ups have aco-operative character, in contrast to the notion implicit in much of theforegoing of the ‘solo entrepreneur’.
Broader objections have also been registered against the whole psycho-logical traits approach. It is still not known whether there is an essentialset of entrepreneurial characteristics, and if so what they are. Partly thisreflects the small sizes and non-comparability of the samples used in previ-ous research, and the conflicting results obtained from them.15 But it alsoseems unlikely that such a diverse group of individuals as entrepreneurs

Entrepreneurs: characteristics and environment 79
are amenable to glib generalisations in terms of their psychological char-acteristics. Traits are unlikely to be unique to entrepreneurs, raising ademarcation problem; and being unobservable ex ante, they are virtu-ally impossible to separate ex post from luck and other extraneous factors(Amit, Glosten and Muller, 1993). There is also, as Kaufmann and Danthave pointed out, ‘a tendency in this literature to personify entrepreneursas embodiments of all that may be desirable in a business person, andalmost deify entrepreneurs in the process’ (1998, pp. 7–8). The conclu-sion reached by several authors, including this one, is that psychologicalfactors are neither necessary nor sufficient conditions for entrepreneursor entrepreneurship.
Love of independence and job satisfactionIt is commonly suggested that an attractive feature of entrepreneurship isindependence in the workplace, something that is variously referred to asa love of autonomy or ‘being one’s own boss’. This idea can be traced backto Knight (1921), and has been emphasised by non-economists (Scaseand Goffee, 1982; Cromie, 1987; Dennis, 1996), as well as by economistsseeking explanations of why individuals remain self-employed despiteapparently earning less than employees do (Aronson, 1991; Hamilton,2000).
This subsection reviews evidence about the love of independence inentrepreneurship, before asking whether it feeds through into greaterhappiness among entrepreneurs relative to employees, in terms of bothjob satisfaction and life–work balance.
Based on an analysis of 466 male self-employed Britons from the1991 wave of the BHPS, Taylor (1996) found that fewer self-employeesthan paid-employees regarded pay and security as important job as-pects. The proportions were 37 and 32 per cent compared with 48 and57 per cent, respectively. However, greater proportions of self-employedworkers felt that initiative (51 per cent) and the enjoyment of work it-self (57 per cent) were important job aspects, compared with 21 and41 per cent of employees, respectively. This bears out the idea that theself-employed enjoy relative freedom from managerial constraints andworking for themselves. These non-pecuniary factors were significantlyassociated with being self-employed, even after controlling for personalcharacteristics (see also Burke, Fitz-Roy and Nolan, 2000; and Hundley,2001b).16
Table 3.1 summarises reasons for being self-employed cited by respon-dents of the UK’s spring 2000 LFS. These responses bear out the im-portance of independence, the single most important reason cited by

80 The Economics of Self-Employment and Entrepreneurship
Table 3.1 Reasons given for becoming self-employed in theUK (per cent)
Reason All Men Women
To be independent 31 33 25Wanted more money 13 15 7Better conditions of work 5 6 3Family commitments 7 2 21Capital, space, equipment
opportunities 12 12 11Saw the demand 8 9 8Joined the family business 6 6 7Nature of occupation 22 21 23No jobs available locally 3 3 2Made redundant 9 11 3Other reasons 15 14 18No reason given 3 4 3No. valid responses (000) a 2,960 2,156 804
Note: Columns do not sum to 100 per cent because respondents cangive up to four reasons.a Imputed percentages based on all those who gave a valid response tothe ‘reasons for becoming self-employed’ questions.Source: LFS (2000).
the LFS respondents. The next most important reason is the nature ofthe occupation, perhaps reflecting the fact that self-employment is thechief or only mode of employment in some locations or occupations (e.g.forestry or construction). Both men and women have similar responses,although women stress independence a little less than men, and familycommitments substantially more (see also Hakim, 1989a).
It should be remembered, however, that not all people enter self-employment in order to gain independence. Nor is it clear that peoplealways obtain much actual independence from being self-employed, espe-cially those who work long hours (see chapter 8, section 8.2) or who workin one the ‘grey areas’ between paid-employment and self-employment.17
Numerous studies show that the self-employed consistently claim toenjoy greater job satisfaction than employees do, even after controllingfor job and personal characteristics such as income gained and hoursworked. For example, using British NCDS data from 1981 and 1991,Blanchflower and Oswald (1998) reported that approximately 46 per centof the self-employed claimed they were ‘very satisfied’ with their job, com-pared with only 29 per cent for employees. Blanchflower and Freeman

Entrepreneurs: characteristics and environment 81
(1994), Blanchflower (2000), Blanchflower, Oswald and Stutzer (2001)and Frey and Benz (2002) have since confirmed these findings for sev-eral OECD countries. Frey and Benz explicitly traced individuals’ greaterjob satisfaction to the use of initiative and actual work itself, and to theweakness of hierarchy in which they worked.
It might be thought that job satisfaction would spill over into overallsatisfaction with life, including work–family balance. Several authors havesuggested that the flexibility of self-employment may make that occupa-tion more conducive to balancing work and family role responsibilities,leading to enhanced psychological wellbeing (Eden, 1975; Cromie, 1987;Loscocco, 1997). Set against this, however, is the fact that self-employedpeople work longer hours on average than employees do, while bear-ing direct responsibility for the success and survival of a business. Thismay result in greater work–family conflict for self-employed individualsthan for employees. This is precisely what Parasuraman and Simmers(2001) found from their survey of 386 American graduate students. Theself-employed respondents in this sample enjoyed greater flexibility andautonomy at work, and reported higher levels of job involvement and jobsatisfaction than their employee counterparts; but they also experiencedhigher levels of work–family conflict and lower levels of family satisfactionthan employees. Longer work hours and greater parental responsibilitiesappear to be chiefly responsible. These drawbacks to self-employmentwere more pronounced for men than for women.
Thus while entrepreneurs may indeed enjoy greater job satisfaction,they may also bear greater stress in relation to their family lives, a sourceof life conflict that might deter some individuals from contemplating en-trepreneurship altogether.
Over-optimismA vast psychological literature has established a systematic tendencyamong human beings to be over-optimistic, especially about events thatare only partially under their control. De Meza and Southey (1996) re-viewed some of this literature, and argued that entrepreneurs are es-pecially vulnerable to systematic over-optimism (see also Camerer andLovallo, 1999).18
Certainly the interview responses obtained by Cooper, Woo andDunkelberg (1988) point to high levels of entrepreneurial optimism – oreven ‘entrepreneurial euphoria’ in the words of those authors. 68 per centof their entrepreneur respondents thought that the odds of their businesssucceeding were better than for others in the same sector while only 5per cent thought that they were worse. However, while interesting, these

82 The Economics of Self-Employment and Entrepreneurship
findings are no more than suggestive. While the interviewees displayedgreater confidence than is merited by statistics about business failurerates, Cooper, Woo and Dunkelberg did not compare their expectationswith outcomes or establish whether entrepreneurs are more optimisticthan non-entrepreneurs. Both tasks were attempted by Arabsheibani et al.(2000). Using BHPS panel data over 1990–6 to compare expectations offuture prosperity with actual outcomes, these authors found that employ-ees and self-employed Britons were both systematically over-optimistic;and that the self-employed were consistently and substantially the mostover-optimistic. For example, 4.6 times as many self-employed peopleforecast an improvement in their prosperity but experienced deteriora-tion as forecast a deterioration but experienced an improvement. Foremployees the ratio was 2.9. This result was robust to the inclusion ofcontrols for other personal characteristics.
An obvious question is how over-optimism, which is inconsistent withrational maximising behaviour, can persist in the market. As Friedman(1953) pointed out, in the long run one might expect sober-minded profitmaximising realists to drive over-optimists out of competitive markets. Infact, one can propose several reasons why over-optimism could persist in,and even come to dominate, a market. First, de Meza and Southey (1996)argued that, if individuals enter entrepreneurship until expected returnsthere are driven down to equality with the paid-employment wage, thenthe optimists (who over-estimate entrepreneurial profits) crowd out re-alists (who correctly estimate profits) from entrepreneurship, the latterchoosing to congregate in paid-employment. Second, Manove (2000)argued that over-optimistic entrepreneurs can hold their own against(and, under some conditions, drive out of the market) realists by work-ing and saving extra hard to compensate for mistakes caused by theirover-optimism. Third, Bernardo and Welch (2001) claimed that over-optimistic entrepreneurs are less likely to imitate their peers and morelikely to explore their environment. This generates valuable informationalbenefits to the entrepreneurial group, which enables that group to thrivein spite of the costs incurred by the individuals who obtain the informa-tion. Fourth, over-optimism might confer an advantage by signalling highability to outsiders, such as customers or financiers.
De Meza and Southey (1996) claimed that unrealistic optimismexplains several well-known features of entrepreneurship. One is en-trepreneurs choosing to remain in entrepreneurship, despite earning lessand bearing greater risk than employees. Another is purely self-financedentrepreneurs facing higher business failure rates than debt-financedentrepreneurs. By over-estimating their prospects of success, optimistsprefer maximum self-finance of their projects – unlike realists, who prefer

Entrepreneurs: characteristics and environment 83
debt finance. But also unlike realists, optimists make negative expectedreturns net of opportunity costs, leading to higher exit rates.
There may also be policy implications. Most of the models cited abovefind that over-optimistic behaviour causes distortions in the economyas a whole. In a practical vein, Cooper, Woo and Dunkelberg (1988)recommended that entrepreneurs be encouraged to form relationshipswith outsiders, such as non-executive board members and professionaladvisors. Outsiders have the objectivity and detachment to counteractunrealistic optimism – hopefully without extinguishing the essential fireof entrepreneurial zeal.
3.2.4 Risk attitudes and risk
Chapter 2, subsections 2.2.2 and 2.2.4 distinguished between risk atti-tudes (e.g. individual risk aversion embodied in the utility function) andthe actual or perceived level of risk itself. Below, we continue with thisdistinction, first summarising empirical work on risk attitudes, followedby empirical work on levels of risk.
There are various ways of measuring risk attitudes. One is to ask peo-ple how they would choose between risky hypothetical situations. Ex-amples include Brockhaus’ (1980) Choice Dilemma Questionnaire, andvan Praag and Cramer’s (2001) interview questions about gambling. Theresults are mixed. Whereas Brockhaus found insignificant differences inresponses between entrepreneurs and non-entrepreneurs, van Praag andCramer claimed that entrepreneurs were significantly more willing togamble than employees were. Van Praag et al. (2002) also claimed thatrisk aversion significantly decreased the probability that given individ-uals would choose to be entrepreneurs – consistent with the theory ofKihlstrom and Laffont (1979) outlined in chapter 2, subsection 2.2.4.But, while Uusitalo (2001) reported similar findings, Tucker (1988) de-tected insignificant effects from risk attitudes on self-employment choiceusing a specially framed survey question from the PSID. And direct evi-dence indicates that self-employed people are less likely to participate inlotteries than employees – at least in Scandinavia (Lindh and Ohlsson,1996; Uusitalo, 2001).
It is also unclear what these findings really tell us. It is all tooeasy to conflate genuine risk attitudes with optimism, since there isevidence that entrepreneurs interpret the same business stimuli morefavourably than non-entrepreneurs do (Palich and Bagby, 1995; Nortonand Moore, 2002). Thus researchers could misconstrue adventurous ac-tions based on over-optimistic expectations of outcomes as evidence ofgreater risk tolerance. There are also likely to be inherent reporting biases

84 The Economics of Self-Employment and Entrepreneurship
in individuals’ responses to hypothetical, as opposed to actual, businessstimuli. The problem is compounded by the ex post nature of the questionsand the possible reverse causality from entrepreneurship to risk attitude.Thus Taylor’s (1996) finding from the 1991 BHPS that self-employedrespondents are significantly less likely than employees to regard job se-curity as an important job aspect could simply reflect self-employees’familiarity with working in uncertain conditions, and/or ex post rationali-sation at their prior choices.
Fairlie (2002) suggested that former drug dealers might be less riskaverse than the average. Therefore his finding that former drug dealersare 11–21 per cent more likely to subsequently choose legitimate self-employment than non-drug dealers, all else equal, might be interpretedas supportive of Kihlstrom and Laffont’s (1979) hypothesis. However, asFairlie pointed out, characteristics other than risk attitudes might also beresponsible, including entrepreneurial ability and a love of autonomy.
Arguably, the gap between theory and empirical application is partic-ularly wide when it comes to measuring the level of risk. If one had paneldata, one could calculate the variance of individuals’ previous incomes:an ex post measure of risk. In time-series applications, several proxies forbusiness risk have been proposed, including the number of strikes, theinflation rate and fixed capital formation as an inverse measure.19 Therationale is that economic uncertainty is greater at times of domesticmacroeconomic turbulence when strike activity and the inflation rate arehigh, while firms presumably invest less under conditions of uncertainty.The UK time-series applications cited in n. 19 all found these measures ofrisk to be significantly and substantially negatively related to the aggregateself-employment rate.
Williams (2001) proposed a cross-section measure of risk: the standarddeviation (or coefficient of variation) of sales within the four-digit industryof the business owner. Williams explored the effect of this measure ofrisk on decisions among respondents of the 1987 CBO survey to becomea franchisee rather than an independent self-employed business owner.Probit estimates indicated that franchisee status was positively associatedwith risk. Williams interpreted this finding as evidence that franchising isa relatively less risky option than independent self-employment. However,a problem with this risk measure is that it might be conflated with industryeffects.
3.2.5 Family background
It has been widely recognised that self-employment tends to run in fam-ilies. There are several reasons why having a self-employed parent mightincrease the probability that a given individual turns to self-employment

Entrepreneurs: characteristics and environment 85
himself. Self-employed parents might offer their offspring informal in-duction in business methods, transfer business experience and provideaccess to capital and equipment, business networks, consultancy andreputation. Also, children may be motivated to become entrepreneursif this eventually entitles them to inherit the family business. This trans-mission process could be especially important in some sectors, such asagriculture, where parents often pass on farms to their children.
In contrast, sociologists have stressed the role of the family as a chan-nel through which cultural values can be passed on to individuals. Hencefamily backgrounds in which entrepreneurship is prominent can be ex-pected to foster similar favourable attitudes in the family’s offspring.The self-employed certainly seem to have more pro-business attitudeson average than employees do20 – though the extent to which this isattributable to the inculcation of family values is questionable. House-holds with self-employed heads might also furnish role models – althoughof course they could also convey some of the less savoury aspects ofself-employment, such as long hours and family stress (see above). Rolemodels are also suggested by findings of a negative relationship betweenthe size of a worker’s employer and the propensity of workers to optfor self-employment (Storey, 1994a): presumably larger firms offer fewerentrepreneurial role models. But this negative relationship might also re-flect more favourable working conditions in larger firms, since it is knownthat larger firms offer wage premiums, which may deter switching intoself-employment.
The direct evidence points clearly to strong intergenerational linksbetween parents and children. In work based on 1979 US NFIB sur-vey data, Lentz and Laband (1990) observed that around half of allUS self-employed proprietors were second-generation business people;while sons of self-employed fathers were three times more likely to be‘occupational followers’ than the average worker (Laband and Lentz,1983). Parental self-employment both increases the fraction of time thatoffspring spend in self-employment and reduces the age at which theyenter it (Dunn and Holtz-Eakin, 2000). Followers also earn higher self-employment incomes than non-followers in self-employment (Lentz andLaband, 1990). These effects are robust to the inclusion of observablecharacteristics in probit models of self-employment choice, which invari-ably identify significant positive and substantial effects from dummy vari-ables representing father’s self-employment status.21 The US evidence ismixed on whether blacks as well as whites have positive self-employmentfatherhood effects (c.f. Fairlie, 1999; Hout and Rosen, 2000). For whiteAmericans, the likelihood of self-employment increases if the father is amanager, and decreases if the father is unskilled (Evans and Leighton,1989b). De Wit and van Winden (1989, 1990) noted that if a father

86 The Economics of Self-Employment and Entrepreneurship
who was previously self-employed stopped being self-employed, father’swork history no longer had a significant impact on the offspring’s self-employment decision. Finally, there is mixed evidence from probit studiesabout the impact of mother’s self-employment status on the probability ofself-employment of her offspring.22 According to Dunn and Holtz-Eakin(2000), while fathers’ self-employment experience had a stronger effecton the probability that sons became self-employed than mothers’ self-employment experience, the latter was more important for daughters.Having two self-employed parents had the greatest overall effect.
It is necessary to dig deeper to find the precise channels through whichthis observed intergenerational transmission process takes place. Dunnand Holtz-Eakin (2000) identified two: parental self-employment expe-rience and business success, where the latter was measured in severalways, including by self-employment income. Effects from parental ex-perience and success proved to be strikingly prominent and significant,almost doubling the probability of a son entering self-employment evenafter controlling for the individual’s and parent’s financial capital andthe individual’s human capital. It suggests that parents primarily transfermanagerial skills to their offspring, rather than merely familiarity with or ataste for self-employment.23 Second, parental business and non-businesswealth also had a large positive effect on the probability that an individ-ual made a transition to self-employment. This might reflect the value offamily finance (see chapter 6, section 6.1).
3.3 Entrepreneurship and macroeconomic factors
3.3.1 Economic development and changing industrial structure
Economic developmentThis section asks how economic development affects the nature and ex-tent of entrepreneurship, from both a theoretical and an empirical per-spective. Economic development can occur in a number of ways, thathave potentially different impacts on entrepreneurship. Leading on fromthe seminal work of Lucas (1978), one form of economic developmentinvolves exogenous increases in the capital stock, capital being one of theinputs to entrepreneurs’ production functions. A second form of develop-ment is technological progress, which can either be exogenous (shiftingentrepreneurs’ production functions) or endogenous (e.g. knowledgegrows as a result of efforts to exploit it). A third form of developmentis driven by endogenous increases in personal wealth stocks, enabling in-dividuals to engage in risky investments that they were unable to affordbefore. All three forms of development can be analysed as special cases

Entrepreneurs: characteristics and environment 87
of the following entrepreneurial production function:
q (t) = A(t).q [k(t), H(t), ϒ(t)] , (3.1)
where q (t) is output; q [·, ·, ·] is a continuous production function that isincreasing in all of its arguments: capital k, hired labour H and techno-logical knowledge, ϒ ; and A is a technology shift variable. All of theseare potentially functions of time, t.
Growth in the capital stock. As we saw in chapter 2, subsection 2.2.3,Lucas (1978) traced out the implications of an increasing capital stockin a model where entrepreneurs have heterogeneous abilities and operatefirms of different sizes. In terms of (3.1), A(t) ≡ A can be interpreted asthe ability of a given entrepreneur and ϒ(t) ≡ 0. As shown in subsection2.2.3, if q [·, ·] is such that the elasticity of substitution between k and H isless than unity, then increases in the capital stock are predicted to increasethe number of workers and decrease the number of entrepreneurs. As dis-cussed in subsection 2.2.3, this prediction has met with mixed empiricalsuccess.
Technological progress. Exogenous technological progress can be repre-sented by growth in the ϒ(t) of (3.1), or by growth in A(t). The formercould occur if technological progress is embodied in knowledge; the lat-ter if, for example, more efficient production techniques become avail-able, or if improvements in infrastructure enable existing techniques tobe deployed more effectively. Naturally, to the extent that entrepreneursoperate small firms, the implications of technological progress for en-trepreneurs depend on whether it impacts on firm sizes neutrally, orwhether there are systematic differences that are related to firm size.Some authors, from at least the time of Schumpeter, have apparentlybelieved that technological progress will be biased in favour of largefirms, making the latter’s economies of scale increasingly dominant overtime, thereby squeezing out smaller producers (and hence, by implica-tion, entrepreneurs). Another mechanism may also be at work in oneparticular sector in which self-employment has been traditionally con-centrated, namely agriculture. Engel curve estimates indicate that thedemand for agricultural produce increases only slowly in response togreater income, whereas the demand for manufactured goods in whicheconomies of scale may be more important increases more rapidly. Thusone can expect the relative derived demand for self-employed labour(especially in agriculture) to decrease as an economy grows. Histori-cal and cross-country evidence has generally been supportive of thisview, finding a negative correlation between the size of the agriculturalself-employment sector and per capita GNP (Kuznets, 1966; Schultz,1990).

88 The Economics of Self-Employment and Entrepreneurship
More recently, however, it has been suggested that technologicalchange has begun to operate the other way, in favour of smaller rather thanlarger businesses. Arguably, the advent of more flexible manufacturingtechniques has begun to make scale economies less important, reducingminimum efficient scale and facilitating competition from smaller firms(Piore and Sabel, 1984; Dosi, 1988; Carlsson, 1989, 1992; Carlsson etal., 1994; Wennekers and Thurik, 1999). These changes might also haveendowed small firms with a comparative advantage in supplying marketswith low or fluctuating levels of demand. The emergence of new tech-nologies, including IT and telecommunications, and the growing demandfor labour-intensive services and ‘niche’ customised products might alsohave favoured smaller firms, by requiring less physical capital and morehuman capital. However, little detailed evidence is available at presentabout the extent to which technological change of this sort has impactedon entrepreneurship.
Calvo and Wellisz (1980) and Schaffner (1993) have proposed eco-nomic models of size neutral exogenous technological progress. As dis-cussed in subsection 2.2.3, Calvo and Wellisz combined the assumptionsof growing technological knowledge ϒ(t) and heterogeneous abilities. ALucas-type result emerged – continually increasing numbers of workers,and decreasing number of entrepreneurs. A similar result follows fromSchaffner’s model, in which there are two modes of production: by firmshiring workers, and by entrepreneurs producing on their own accountwithout any workers. Both types of production are subject to uncertainty.Unlike firms, which can smooth workers’ incomes and diversify risk inthe presence of aggregate productivity shocks, entrepreneurs are unableto smooth their own incomes. To see the implications of this, supposethat technology A(t) increases equally for both types of producer, in-creasing expected returns and risk to both entrepreneurs and firms (interms of (3.1), ϒ is absent). Firms can increase the employee wage byless than the increase in entrepreneurs’ incomes because workers valueincome smoothing. This wage saving makes it profitable for firms withpreviously uneconomic organisational and monitoring costs to set up,drawing individuals out of entrepreneurship and into paid-employment.The implication is again that paid-employment will continually grow asthe economy develops, and entrepreneurship will decline.24
Schmitz (1989) proposed a model of endogenous technologicalprogress and entrepreneurship. Schmitz’s model explains how en-trepreneurs can contribute to practical technological knowledge andthereby change the conditions under which entrepreneurship is at-tractive. Like Say and Schumpeter, Schmitz argued that successful,growth-inducing entrepreneurship is not principally about developing

Entrepreneurs: characteristics and environment 89
new knowledge, but instead involves imitation, transfer and applicationof technologies in the marketplace. In terms of (3.1), there is no man-agerial ability or capital input, and the workforce is normalised to unity.The basic structure of the model consists of the following modificationof (3.1), and three equations describing the structure and evolution oftechnological knowledge:
q (t) = q[
1 − nS(t)nS(t)
, ϒ(t)]
= ϒ(t).ϕ[
1 − nS(t)nS(t)ϒ(t)
](3.2)
dϒ(t)dt
= ϒ0(t).ψ
[ϒ(t)ϒ0(t)
](3.3)
ϒ0(t) = nS(t)ϒ(t) (3.4)
ϒ(t) = γ nS(t)ϒ(t) , (3.5)
where q [·, ·], ψ(·) and ϕ(·) are concave increasing functions that arehomogeneous of degree one. Equation (3.2) modifies (3.1) by ignor-ing exogenous technological change, and writing employee labour input[1 − nS(t)] as a proportion of the number of entrepreneurs, nS(t). Equa-tion (3.3) states that the evolution of the stock of practical knowledge ϒ(t)is an increasing function of both ‘own-industry’ knowledge, denoted byϒ0(t), and a knowledge spillover (to other industries), denoted by ϒ(t).Equation (3.4) states that own-industry knowledge is given by the prod-uct of the total knowledge stock and the number of entrepreneurs usingit. Equation (3.5) states that the spillover effect is modified by imperfectcommunications infrastructure, γ < 1. The greater is γ , the greater thespillover to neighbouring industries and hence the greater the impact ontotal knowledge accumulation.
A competitive equilibrium for this economy is characterised similarlyto Lucas (1978): nS(t) adjusts until all individuals are indifferent betweenthe two occupations. Schmitz compared the competitive equilibrium withthe outcome that would maximise social welfare. The competitive equilib-rium is characterised by a steady-state entrepreneurship and knowledgepair {n∗
S, ϒ∗} that is the steady-state solution of the problem
max∫ ∞
0e−δtU[ζ (t)] dt subject to ζ (t) = nS(t)q (t) and (3.3)
(3.6)
(with ϒ(0) > 0 given), where ζ (t) is aggregate consumption (= output)at time t and δ > 0 is the discount rate. In contradistinction, the socialwelfare optimum is characterised by the steady-state pair {n�
S , ϒ�} thatis the steady state solution of the problem (3.6) subject also to (3.4) and

90 The Economics of Self-Employment and Entrepreneurship
(3.5) – i.e. which unlike the competitive equilibrium takes account of theaggregate knowledge spillover.
Proposition 6 (Schmitz, 1989). The steady-state competitive equilibriumcharacterised by {n∗
S, ϒ∗} does not maximise social welfare; and n∗S < n�
S , im-plying there are too few entrepreneurs in equilibrium relative to the social opti-mum.
The competitive equilibrium is not welfare maximising because atom-istic individuals do not take account of the effects of their own behaviouron the aggregate knowledge spillover. The free-market economy is pre-dicted to generate too little entrepreneurship. More entrepreneurship isdesirable because it increases the aggregate value of the spillover by (3.3)and (3.5). One policy implication is to encourage technology-based en-trepreneurship in order to increase economic growth.
Endogenous growth of personal wealth Banerjee and Newman (1993) pro-posed a model in which banks make only secured loans. The greater theloan size, the greater the temptation for borrowers to ‘take the money andrun’ and forfeit their collateral. Anticipating this, banks limit the scale ofloans (and therefore also the size of investment projects) according to in-dividuals’ wealth. Thus the initial distribution of wealth determines whobecomes an entrepreneur with workers (an ‘employer’), who becomesan entrepreneur without workers (‘self-employed’), and who becomes a‘worker’ in one of the firms run by the employers. Each individual livesfor a single period: they choose how much of their wealth to bequeathto their offspring. This imparts path dependence to capital k(t) and, be-cause of the above capital market imperfection, also to aggregate wealthand the occupational structure of the economy. (In terms of the produc-tion function (3.1), A is fixed and ϒ = 0; and there are two versions ofq [·, ·], one for ‘employers’ and one for the ‘self-employed’.)
Various development paths can arise in Banerjee and Newman’s model;two are of particular interest. In one, an economy ‘F ’ starts with a smallfraction of workers, so wages are relatively high and plenty of individualspossess the collateral to become self-employed. Although some successfulself-employed people in ‘F ’ have sufficient wealth to become employers,they cannot find cheap workers, and so choose to remain self-employed.This becomes a self-perpetuating outcome via the bequest mechanism,and it characterises the economy’s equilibrium. A second case is an econ-omy ‘E ’, say, starting with a large fraction of poor workers, so wages arelow. If individuals choose to bequeath little to their offspring, workers re-main poor and face binding borrowing constraints in all subsequent gen-erations. This economy converges to an equilibrium in which there are

Entrepreneurs: characteristics and environment 91
many employers and workers, and only a small number of self-employedworkers. A key point is that differences between these two hypotheti-cal economies can become entrenched. In a rich economy, subsequentgenerations of ‘poor’ workers are able to rise up the wealth and socialscales, becoming self-employed and employers. This economy becomesincreasingly prosperous and ‘entrepreneurial’. Although a poor economycan switch over to the more favourable state if it does not start too faraway from the rich one, if it starts sufficiently poor it will remain so, andentrepreneurship will never be able to flourish.
On the face of it the Banerjee and Newman model does not receive clearempirical support from cross-country data on self-employment rates out-lined in tables 1.1 and 1.3 in chapter 1. It was seen there that the poorestcountries had the highest self-employment rates and the richest countrieshad the lowest ones. Hence the applicability of Banerjee and Newman’smodel is probably confined to the evolution of developed countries overlong time spans, as those authors themselves implied by their discussionof the different paths taken by England (‘E ’) and France (‘F ’) at the timeof the Industrial Revolution.25
This concludes our outline of theoretical models of entrepreneurshipand economic development. We now turn to evidence on the issue. Ap-plied researchers have proposed several ways of gauging the effects ofeconomic development on entrepreneurship, although it is fair to saythat for the most part the linkages between theory and empirical imple-mentation are rather weak. Empirical studies have either devised proxiesfor technological progress, or they have discussed development in termsof growing national income. With the exception of Lucas’ findings, whichhave already been discussed in chapter 2, section 2.2, we briefly reviewthe evidence below:1. Using published data on total factor productivity (TFP) for ten broad
industry groups in the USA, Blau (1987) calculated indices of weightedsums of TFP for both the self-employed and employees. The ratio ofthe self-employed TFP index to the employee TFP index was pro-posed as a measure of relative self-employment technological advan-tage. Blau’s regression results indicated that changes in the TFP ratiofavouring industries in which self-employment is common was one ofthe causes of rising US self-employment between 1972 and 1982. Hewent on to suggest that the spread of computers might have been thesource of the technological advantage. However, there is a problemwith this explanation, because self-employment rates have declinedsteadily in France and Japan, despite these countries experiencing sim-ilar productivity improvements. Also, personal computers were notwidespread even by 1982, the last year of Blau’s sample. And Devine

92 The Economics of Self-Employment and Entrepreneurship
and Mlakar (1993) found that an index of the price of computingpower over 1975–90 did not explain probabilities of self-employmentacross a range of US industries.26
2. Acs, Audretsch and Evans (1994) suggested that the relationship be-tween aggregate self-employment and exogenous technological changeA(t) is U-shaped. They argued that at early stages of a country’s devel-opment A(t) changes such that output shifts away from agriculture andsmall-scale manufacturing towards large-scale manufacturing, with aconsequent reduction in self-employment. At later stages of develop-ment, A(t) changes such that manufacturing gives way to services, andself-employment recovers. Acs, Audretsch and Evans adduced somesupport for this hypothesis from pooled time-series/cross-section re-gressions in which technological change was proxied by measures ofvalue added in manufacturing and services as a proportion of GNP.However, applying a more appropriate panel cointegration estima-tor and a richer set of explanatory variables to similar data, Parkerand Robson (2000) found that Acs, Audretsch and Evans, ‘valueadded’ variables were generally insignificant as determinants of self-employment rates.
3. Interpreting per capita GNP as a general measure of development,scatter-plots of this variable against aggregate self-employment ratesfor a range of countries at varying stages of development seem to in-dicate a negative relationship. The bulk of evidence from multivariateanalyses appear to confirm this finding (Acs, Audretsch and Evans,1994; Schultz, 1990; Folster, 2002; an exception is Parker and Rob-son, 2000). While this is broadly consistent with the predictions ofLucas, Schaffner, and Calvo and Wellisz that self-employment ratesdecline with economic development, GNP per capita is a crude mea-sure of development and does not distinguish its underlying sources.These empirical findings certainly do not give explicit support to anyof the particular theories outlined above.It is hard to reach any definitive conclusions from this empirical work.
Also, among developed countries there has been, and continues to be,enormous diversity of self-employment rates and trends (see chapter 1,section 1.4). This is despite the fact that technological change has beenpervasive and broadly similar in these countries. It therefore seems un-likely that technological change alone can explain the observed variationsand trends in aggregate self-employment rates.
Changing industrial structureSome jobs lend themselves more naturally to self-employment thanothers. These include labour-intensive ‘one to one’ personal services,

Entrepreneurs: characteristics and environment 93
seasonal jobs and jobs with erratic demand that would be too costly forlarge firms to organise, and which can be filled more cheaply by indepen-dent self-employed workers. Another consideration is the mix of skillsrequired in particular industries. For example, if entrepreneurs are ‘jacksof all trades’ with balanced skills sets, then industries like art (which re-quires disparate skills in artistic talent and business management) areless likely to be populated by entrepreneurs than insurance, say, wherethe required skills are more similar to each other (Lazear, 2002).
Capital requirements in different industries may also play a role. It isunlikely that individuals will opt for self-employment in industries dom-inated by large, capital-intensive firms, since the latter often have a com-parative and absolute advantage in raising capital. The evidence seems tobear this conjecture out. White (1982) found that there were fewer smallUS manufacturing firms in industries with high capital intensities; andAcs and Audretsch (1989) reported that high capital–labour ratios wereassociated with lower rates of US small business entry in 247 manufac-turing industries.
No doubt reflecting the combined effects of these factors, most coun-tries exhibit high concentrations of self-employed workers in particularsectors and industries. The available evidence comprises both simple tab-ulations and results from self-employment probit models that include oc-cupation and industry dummy variables. The latter have the advantagethat industry effects can be separated from other factors, such as skillrequirements, that also bear on occupational choice.27
In North America, male self-employed workers tend to be concentratedin construction, services and retail trades; and in the sales, agriculture,hotels, repairs, craft, managerial and professional occupations. The low-est self-employment rates by sector are observed in manufacturing. Thepredominance of service sector self-employment has a long history. Forexample, Aronson (1991) reported that about three-quarters of pre-firstWorld War non-farm US self-employment was in service-sector indus-tries. The service sector has of course grown relative to manufacturingsince that time, although shifts have also occurred within the service sec-tor especially since the 1950s, towards finance, insurance and personaland business services. The role of self-employment in each of the trans-portation, communications and retail sectors has steadily declined. Sim-ilar patterns of industry and occupation self-employment are observedin the UK, with high concentrations in construction, distribution, hoteland repairs, banking and financial services. According to 1991 LFS data,these sectors accounted for 62 per cent of all UK self-employment.28
The broad sectoral composition of self-employment appears to be fairlysimilar to this in other OECD countries (Loufti, 1992).

94 The Economics of Self-Employment and Entrepreneurship
The professions provide an important core of self-employed people inmany countries, especially law, medicine and architecture. In an histor-ical overview, Aronson (1991) noted little change in the pattern of USself-employment in the professions since the end of the Second WorldWar, except for some declines in the legal and health occupations. Aron-son believed that four factors might explain the trend away from self-employment in these two occupations: (i) changing demographics, sinceolder professionals are more likely to be self-employed; (ii) greater spe-cialisation (especially in health); (iii) economies of scale since, for exam-ple, more expensive medical technologies make larger units cheaper; and(iv) a reduction in occupational licensing that previously protected self-employed incumbents from competition. However, he did not test thesehypotheses.
To discover whether secular shifts in industrial structure explainchanges in aggregate self-employment rates, Steinmetz and Wright(1989) performed a shift-share analysis of US self-employment rates be-tween 1940 and 1980. They claimed that changes in the sectoral distri-bution of the self-employed labour force accounted for 80 per cent of thedecline in the self-employment rate between 1940 and 1950, but only20 per cent in the 1970s. Much of the explanatory power of the shift-share analysis was accounted for by the secular decline in agriculturalself-employment. Steinmetz and Wright also found that the expansionof new ‘post-industrial’ sectors such as banking and personal services,and also increased self-employment within traditional industrial sectors,largely accounted for the resurgence of US self-employment from theearly 1970s onwards. However, the deep factors underlying all of thesesectoral changes remain unexplained. It is certainly incorrect to claim thatthese changing patterns reflect a sudden shift towards the service sector,since the latter pre-dates the increases in self-employment rates in manycountries in the 1970s and 1980s (Aronson, 1991). Furthermore, therehas also been a trend towards larger-scale business organisations in sec-tors in which the self-employed are concentrated–for example, banking,retail, and restaurants–which would have been expected to reduce theaggregate self-employment rate. Clearly, much more research is neededto improve our understanding of the interface between entrepreneurshipand changes in industrial structure.
3.3.2 Unemployment
There is now an extensive literature on the relationship between self-employment and unemployment. One of the motivations for studyingthis topic is the policy interest about promoting self-employment as a

Entrepreneurs: characteristics and environment 95
way of reducing unemployment. There are two channels through whichthis could occur. First, there is the direct effect of removing a newly self-employed individual from the official unemployment register. Second,there is the indirect effect of eventual job creation by entrepreneurs whosucceed in running enterprises that require outside labour.
According to conventional wisdom, unemployment affects self-employment in two ways: via ‘recession-push’ and ‘prosperity-pull’ ef-fects. According to the ‘recession-push’ hypothesis, unemployment re-duces the opportunities of gaining paid-employment and the expectedgains from job search, which ‘pushes’ people into self-employment. Asecondary and complementary effect is that, as firms close down in reces-sions, the availability and affordability of second-hand capital equipmentincreases, reducing barriers to entry (Binks and Jennings, 1986). Botheffects are suggestive of a positive relationship between self-employmentand unemployment.
According to the ‘prosperity-pull’ hypothesis, at times of high unem-ployment the products and services of the self-employed face a lowermarket demand. This reduces self-employment incomes and possiblyalso the availability of capital, while increasing the risk of bankruptcy.Thus individuals are ‘pulled’ out of self-employment. At the same time,self-employment may become riskier because if the venture fails, it isless likely that the self-employed worker can fall back on a job in paid-employment. In contrast to the recession-push hypothesis, these factorssuggest a negative relationship between self-employment and unemploy-ment.
Empirical estimates of the self-employment/unemployment relation-ship invariably confound the above two effects, capturing a ‘net’ effect.Nevertheless, the size and direction of the net effect is still of policy in-terest. It is helpful to sort the large number of results on this topic byempirical method, since the results tend to reflect the method employed.Results obtained using cross-section probit models are reviewed first,followed by results from time-series and panel data models.
Cross-section evidenceMost cross-section econometric studies have found a negative relation-ship between the probability that an individual is self-employed and thelocal unemployment rate.29 Furthermore, a number of British studieshave established that between 20 and 50 per cent of new entrants toself-employment were directly or recently unemployed (Storey, 1982;Hakim, 1988, 1989b; Meager, 1992b), with the majority switching frompaid-employment. A similar pattern also seems to hold in other OECDcountries (Evans and Leighton, 1989b; Blanchflower and Meyer, 1994;

96 The Economics of Self-Employment and Entrepreneurship
Kuhn and Schuetze, 2001). For example, Evans and Leighton (1989b)concluded that between 1968 and 1986 unemployed workers were abouttwice as likely to start businesses as employees were; and almost threetimes as many individuals enter self-employment from outside the labourforce as from unemployment (Dennis, 1996). To put this in perspective,from one year to the next most unemployed people either remain unem-ployed or become employees; only a small minority become self-employed(Cowling and Taylor, 2001). But these results all appear to support the‘prosperity-pull’ hypothesis. The state of the business cycle also seemsto matter. According to Carrasco (1999), unemployed male Spaniardsare more likely to enter self-employment in boom times, i.e. when theunemployment rate is low.
It has also been shown that, of the unemployed, those with more un-stable work histories (including periods of past unemployment) are sig-nificantly more likely to enter self-employment and to be self-employed(Evans and Leighton, 1989b; Carrasco, 1999; Knight and McKay, 2000;Uusitalo, 2001). Evans and Leighton construed this as evidence thatthe self-employed may be ‘misfits’ who are driven into entrepreneur-ship. But, the evidence on this point is not clear-cut. A closer analysisof the data reveals that a history of job changes, rather than unemploy-ment per se, significantly increases the willingness of workers to becomeself-employed (van Praag and van Ophem, 1995). Furthermore, Farber(1999) reported that US employees who had lost their jobs in the previousthree years (‘job-losers’) were significantly less likely to be self-employed(by 3 percentage points) than ‘non-losers’. That remained the case evenafter controlling for other personal characteristics of the survey respon-dents. This evidence suggests that self-employment in the USA is not atransitional process following job loss – unlike temporary and part-timework.30
It may be important to distinguish between men and women whenmeasuring the inflow to self-employment from non-employment states.Kuhn and Schuetze (2001) found that most of the increase in femaleCanadian self-employment in the 1980s and 1990s was attributable to anincrease in retention rates in self-employment, whereas for men, most ofthe increase was attributable to a decrease in stability in paid-employmentand inflows from unemployment (for similar British findings, see Blanch-flower and Freeman, 1994).31 It is also possible that the effects of unem-ployment on self-employment may vary from occupation to occupation.For example, some professional occupations may be protected againstunlicensed new entrants, making the number of self-employed profes-sionals less cyclical than the number of self-employed non-professionals(Meager, 1992a). In principle, interacting local unemployment rates in

Entrepreneurs: characteristics and environment 97
cross-section regressions with occupational dummy variables could allowthis possibility to be tested.
Time-series and panel data evidenceIn contrast to the cross-section studies, the overwhelming majority oftime-series studies report significant positive effects of national unemploy-ment rates on national self-employment and new firm formation rates.This appears to support the ‘recession-push’ hypothesis. Most of thiswork has been conducted using UK and US data.32 Estimation has gen-erally assumed a linear relationship between self-employment and unem-ployment rates, despite the possibility, suggested by Hamilton (1989),of non-linearity.33 Evidence of a positive and significant cointegratingrelationship (see chapter 1, subsection 1.6.4) between aggregate self-employment and unemployment rates is especially well documented forthe UK.34
One channel through which unemployment can feed into self-employment is through job layoffs. Storey and Jones (1987) and Foti andVivarelli (1994) both uncovered significant positive effects from localjob layoffs on new firm formation rates (n. 30 notwithstanding). Also,time-series evidence from Robson (1991) identified a significant positiveimpact on self-employment from redundancy payments.
In view of the differences between empirical results obtained from thecross-section and time-series approaches, it is perhaps unsurprising thatpanel data studies that combine cross-section and time-series elementshave generated mixed results. Two types of panel study can be distin-guished: (a) one utilising a relatively large cross-section dimension and(b) one utilising a relatively large time-series dimension. Recent stud-ies under (a) include Blanchflower (2000) and Schuetze (2000). Poolingindividual-level data from nineteen OECD countries and interacting un-employment variables with country dummies, Blanchflower found thatsome countries exhibited significant negative, some significant positive,and some insignificant relationships between self-employment and un-employment rates.35 In contrast, Schuetze (2000) pooled individual-level data on American and Canadian working-age males over 1983–94,and found strong positive relationships between self-employment andstate/provincial unemployment rates.
Under (b), Acs, Audretsch and Evans (1994) reported a signifi-cant positive correlation between aggregate OECD self-employmentand unemployment rates; but this disappeared when additional vari-ables (including GDP) were controlled for (see also Parker and Robson,2000). One reason for these results might be that controlling for GDPtakes account of prosperity-pull effects and so enables a (weak or

98 The Economics of Self-Employment and Entrepreneurship
non-existent) recession-push effect to be identified. What complicates thestory, however, is findings of positive correlations between aggregate self-employment and GDP growth rates (Audretsch and Acs, 1994; Dennis,1996; Robson, 1996, 1998b; Reynolds et al., 2002). Unemployment ratestend to be highest when GDP growth rates are lowest, complicating anyrelationship between the state of the business cycle and self-employment.Notably there is mixed evidence about how aggregate self-employmentrates vary over the business cycle (c.f. Becker, 1984; OECD, 1986; Evansand Leighton, 1989a; Bogenhold and Staber, 1991).
Conclusion: reconciling the resultsClearly there is considerable disagreement in the literature about how un-employment affects self-employment. Time-series studies tend to find apositive relationship between self-employment and unemployment rates,nS and nU , whereas cross-section studies tend to find a negative relation-ship. While it is possible to propose ad hoc explanations to fit these facts,36
the following argument might be more plausible. Consider again the rea-soning behind the push and pull influences. The former is supposed tocapture a positive effect from higher unemployment, increasing expectedincomes in self-employment relative to those in paid-employment; thelatter is supposed to capture a negative effect from higher unemploy-ment, decreasing self-employment incomes via lower product demand.Arguably, time-series studies have used data that are too aggregated tomeasure accurately local demand conditions, so biasing in an upward di-rection the predicted effect of nU on nS. For their part, the cross-sectionstudies may have failed to measure accurately expected incomes in self-employment relative to paid-employment or unemployment, so biasingdownwards the predicted effect of nU on nS.
In any case, the unemployment rate is only an imperfect proxy for theunderlying factors inducing workers to enter, or leave, self-employment.Undergraduate economics students know that exogenous technologicalchange need not cause unemployment if workers are sufficiently flexi-ble and skilled to switch from contracting sectors into those benefitingfrom technological change. Thus if technological change is the cause oflabour-saving changes to production, unemployment is only the symp-tom of slow adjustments in the labour market. Likewise if costs or tech-nology change so that self-employment becomes a more efficient andattractive form of productive organisation, then we would expect to seetransitions between paid-employment and self-employment without nec-essarily observing much of an impact on unemployment. Therefore thereis really is no economic reason why unemployment and self-employmenthave to be related at all. The extent to which they are may in any case

Entrepreneurs: characteristics and environment 99
Table 3.2 Self-employment rates in the British regions, 1970 and 2000
Region 1970 rate (%) 2000 rate (%) Rank in 1970 Rank in 2000
North 6.02 7.96 8 10Yorkshire & Humberside 6.45 10.42 7 6East Midlands 7.00 10.71 5 5East Anglia 10.11 13.35 3 3South East 7.28 13.47 4 2South West 11.71 14.98 1 1West Midlands 5.74 10.29 9 7North West 6.54 9.87 6 8Wales 10.37 12.43 2 4Scotland 5.68 9.31 10 9
Note: The self-employment rate is defined as the number of self-employed jobs (male plusfemale) in the region divided by the region’s labour force.Source: Abstract of Regional Statistics, 1974 (HMSO, London, table 39) and Regional Trends,2001 (The Stationery Office, London, tables 5.1, 5.5).
vary over time as governments alter the tax-benefit system and theirstance on labour market intervention – and thereby the flexibility of theeconomy.
To conclude, the ‘true’ impact of unemployment on self-employmentprobably lies somewhere between the strong positive and strong negativeestimates recorded in the present literature. Modest positive or negativeeffects look like the safest bet, though on balance, it seems to the au-thor that the cross-section studies are likely to be the least misleading.This is because several of the cross-section studies include some measureof relative incomes, in addition to variables capturing localised demandconditions. In contrast, the problems of omitted variable and aggregationbias are likely to be more pronounced in the time-series studies.
3.3.3 Regional factors
Previous research has identified substantial and persistent regional vari-ations in self-employment and business start-up rates, in a variety ofcountries, including the UK and the US (Georgellis and Wall, 2000). Re-gional variations have been observed within neighbourhoods and cities,and across broader administrative regions. Table 3.2 contains some il-lustrative British data that point to pronounced regional differences inself-employment rates. These differences have been fairly persistent overthe last thirty years. For example, the Spearman correlation coefficientfor table 3.2’s rank orderings in 1970 compared with 2000 is 0.87.

100 The Economics of Self-Employment and Entrepreneurship
Why do regional differences exist and persist? Possible answers includethe following. Regions that suffer from low levels of demand, that havepoorly educated workers, or that have high concentrations of capital-intensive industries that sustain effective barriers to entry, might be lesslikely to witness high rates of entrepreneurial participation. Role modelsmay also be important: regions with strong traditions of entrepreneurshipmay be able to perpetuate them over time and across generations, incontrast to less favoured regions that lack them.
The problem with these stories is that none of them explains why firmsand individuals fail to seize profitable opportunities and equalise out-comes across regions. For example, if factors of production are mobile,why do entrepreneurs not relocate to areas with less competition fromother entrepreneurs – and possibly also lower wages – increasing en-trepreneurial activity in those regions? Also, just because heavy indus-tries have traditionally dominated employment in particular regions inthe past should not prevent new industries from starting up, especially ifprofitable opportunities (such as a low cost base) are there for the taking.
It seems that a more satisfactory story is needed to explain why someregions (e.g. the South West of England) sustain relatively high levelsof entrepreneurship, and why others (e.g. the North of England andScotland) are stuck with persistently low levels of entrepreneurial ac-tivity. One story might go as follows. Adapting Banerjee and Newman’s(1993) model, suppose that some workers in all regions are unable to be-come entrepreneurs owing to borrowing constraints. At the same time,they cannot migrate as workers from ‘poor’ to ‘rich’ regions because(endogenously determined) house prices are too high in the rich regionto make this desirable (or even feasible). And a production externalityor knowledge spillover might induce entrepreneurs to cluster in the richregion where a large number of other entrepreneurs are concentrated, de-spite facing higher wage costs (and therefore higher house prices) there.Taken together, these forces could all entrench different regional livingstandards, house prices, wages and levels of entrepreneurship as equi-librium outcomes. Indeed, in this story regional differences could evengrow over time. Any migration to the rich region might increase houseprices there sufficiently that it becomes even easier for workers in the richregion to muster the required collateral, leading to still higher levels ofentrepreneurship there – while the opposite occurs in the poor region.While this is only the sketch of a story, it seems to possess enough fric-tions to frustrate geographic equalisation of entrepreneurial talent – andit seems broadly consistent with the data.
Furthermore, evidence from Robson (1998a) supports the notion that,in Britain at least, regional house prices are positively related to regional

Entrepreneurs: characteristics and environment 101
rates of entrepreneurship. Robson investigated the determinants of re-gional variations in UK male regional self-employment rates using pooledtime-series cross-section data from the eleven standard regions of the UK(comprising the ten in table 3.2 plus Northern Ireland) over 1973–93.Robson regressed regional male self-employment rates on several regionalexplanatory variables, including net housing wealth, nhw j ; income sharesaccounted for by agriculture, agr ic j , and Construction, Distribution,Hotels and Catering, cdhc j ; GDP per capita; real average earnings; theunemployment–vacancy ratio; the long-term unemployment rate; andproxies for average regional age and education profiles. Strikingly, Rob-son found that, of all these variables, only the first three were statisticallysignificant in a long-run model of the log male self-employment rate, nSj ,where j denotes a region:ln nSj = κ j + 0.031 agr ic j + 0.047 cdhc j + 0.207 ln nhw j , (3.7)
and where the κ j are regional fixed effects. Thus a 10 per cent increasein a region’s real net housing wealth is predicted to increase that region’smale self-employment rate by over 2 per cent. Clearly housing wealth –whose values closely reflect house prices – plays a central role in explainingregional variations self-employment rates, as suggested above. However,taken together the last three variables on the RHS of (3.7) explained only35 per cent of the differential in the self-employment ratio between thehighest- and lowest-ranked regions for male self-employment, namely theNorth and the South-West of England.37 The regional dummies κ j ac-counted for 23 per cent of the North–South self-employment differential.These presumably capture the effects of unobserved variables, perhapshistorical and cultural factors (Reynolds, Storey and Westhead, 1994;Spilling, 1996; Georgellis and Wall, 2000).
Turning from self-employment rates to new-firm creation rates as ameasure of entrepreneurship, we note that there is a large ‘economicgeography’ literature on spatial variations in small-firm formation rates.That literature will not be exhaustively surveyed here: Reynolds, Storeyand Westhead (1994) supply an overview. Using data from six OECDcountries, Reynolds, Storey and Westhead found that firm birth rateswere highest in regions with high proportions of employment in smallfirms, as well as high rates of in-migration, demand growth, employmentspecialisation, and population densities (see also Spilling, 1996). How-ever, many of these explanatory variables are likely to be endogenous.Interestingly, local government expenditures and assistance programmeswere found to have only limited effects on regional firm birth rates.
Another dimension of regional variation is the distinction between ur-ban and rural locations. Arguments can be made both for and against

102 The Economics of Self-Employment and Entrepreneurship
the relative advantages for entrepreneurship in urban relative to rural lo-cations. On one hand, urban markets tend to be larger and enjoy higheraverage disposable incomes. On the other hand, inputs such as rent andlabour can be more expensive in urban areas; and there are often fewerpaid-employment opportunities in rural areas, increasing the relative at-tractiveness of new-firm creation and self-employment there. The evi-dence from self-employment probit regressions with an urban dummyvariable is mixed.38
There might also be systematic variation in entrepreneurial activ-ity within a given urban area. A range of neighbourhood character-istics can potentially affect the returns to self-employment relative topaid-employment. For example, higher average neighbourhood incomes,population densities and commercial concentrations can generate higherlevels of demand for the services of small-scale entrepreneurs. Particularneighbourhoods may also facilitate information exchange and the forma-tion of social capital. Levels of education, home ownership, urban designand community spirit may also vary across neighbourhoods, and in somecases there may be an important ethnic dimension to urban composition(see chapter 4 for more on the latter).
In summary, the economic literature on regional dimensions of en-trepreneurship looks to be ripe for further investigation and extension.This is especially true of the theory side, though our understanding ofthe empirical structure of regional variations in entrepreneurship is alsoincomplete. The available evidence suggests that many hard-to-observeregion-specific and individual-specific factors affect regional levels of en-trepreneurship. To separate individual from regional factors it will al-most certainly be necessary to deploy detailed micro-level cross-sectiondata, rather than aggregate data, which by their nature omit too manyindividual-level variables to distinguish sharply between the different in-fluences.
3.3.4 Government policy variables
Minimum wages and employment protectionMinimum wages and employment protection tend to be directed towardsemployees and employers rather than on own-account self-employedworkers. It is possible that wage rigidities caused by these forms of gov-ernment intervention ration workers out of paid-employment, therebyincreasing the numbers entering own-account self-employment. On theother hand, a binding minimum wage increases labour costs to self-employed employers, and may hit small firms disproportionately hardbecause they tend to be more labour-intensive than large firms are. In a

Entrepreneurs: characteristics and environment 103
time-series study based on aggregate US data over 1948–82, Blau (1987)found little evidence that the minimum wage had any net effect on theaggregate US self-employment rate.
The OECD (1998) asserted that employment protection may be astrong barrier to entrepreneurship in countries where it is prominent,such as Sweden and Spain. As with government regulation more gen-erally, there can also be disincentives for the growth of enterprises ifsmall-firm exemptions are withdrawn once a given size is attained. Thisissue will be explored further in chapter 10, section 10.5.
Government benefitsRetirement benefits may increase the attractiveness to employees ofswitching to self-employment as a form of partial retirement, espe-cially if social security earnings tests penalise full-time paid-work. Blau(1987) and Robson (1998b) found some evidence to support the notionthat higher state retirement benefits promote self-employment. Carrasco(1999) reported that unemployment benefits significantly and substan-tially decrease the probability of transitions from unemployment to self-employment in Spain, with a smaller impact on transitions from unem-ployment to paid-employment.
More generally, the replacement rate is defined as the ratio of averageout-of-work benefits (including unemployment benefits) to average earn-ings. A higher replacement ratio will decrease self-employment if benefitsdiscourage unemployed workers from turning to self-employment – or ifemployees value these benefits which are unavailable to, or restricted for,the self-employed. Parker and Robson (2000) showed that the replace-ment ratio had significant negative effects on aggregate self-employmentrates in an OECD panel over 1972–93.
Even more generally, a larger welfare state may discourage en-trepreneurship by crowding out private savings required to leveragestart-up finance, especially if borrowing constraints exist (Folster, 2002).Public-sector employment might also crowd out self-employment: seeBoyd (1990) for evidence that this may have occurred among Americanblacks.
Interest ratesHigher interest rates increase the cost of financing a business. This in-cludes direct costs (debt repayments) and indirect, or opportunity, costssuch as tying up one’s funds in a firm. Higher interest rates may there-fore be expected to decrease firm births and increase firm deaths, andso have a negative effect on self-employment. However, if banks offerlong-term loans at fixed interest rates, then new-firm starts measured at

104 The Economics of Self-Employment and Entrepreneurship
Table 3.3 Summary of determinants of entrepreneurship
Explanatory variable No. + No. − No. 0 Ref.
1. Income differentiala 6 2 4 d
2. Age 36 1 8 n. 33. Labour market experience 7 1 0 e
4. Educationa 25 11 14 nn. 4–65. Married/working spouse 20 4 3 nn. 9–116. Ill health/disability 4 2 0 n. 137. Risk 0 3 0 n. 198. Self-employed parent 17 2 0 f
9. Technological progress 2 4 2 g
10. UnemploymentCross-section 3 10 6 h
Time-series 21 5 2 i
11. Urban location 5 0 3 n. 3812. Government benefits 2 2 0 j
13. Interest rates 0 7 2 n. 3914. Personal wealthb 18 0 2 k
15. Personal income tax ratesc 10 3 1 l
Note: +, − and 0 denote significantly positive, significantly negative and zero (insignificant)coefficients, respectively. Only multivariate studies (i.e. those including controls for otherexplanatory variables) are included; descriptive studies are excluded. ‘Ref’ gives sourcesof individual studies as footnotes (‘n.’) in chapter 3, or in the following notes, wheresemicolons separate the three groups of outcomes.a Counting all the de Wit and de Wit and van Winden studies as one.b Based on results summarised in chapter 7, section 7.1.c Based on results summarised in chapter 10, section 10.4.d Fujii and Hawley (1991), Bernhardt (1994), Parker (1996), Taylor (1996), Cowling andMitchell (1997), Clark and Drinkwater (2000), Gill (1988), Earle and Sakova (2000),Rees and Shah (1986), Dolton and Makepeace (1990); de Wit and van Winden (various),Parker (2003).e Carroll and Mosakowski (1987), Tucker (1988), Evans and Leighton (1989b), van Praagand van Ophem (1995), Bates (1997), Schiller and Crewson (1997), Quadrini (1999);Tucker (1990: for professionals).f See n.n 21 and 22. Additional positive effects found by Laband and Lentz (1983), Lentzand Laband (1990), Dunn and Holtz-Eakin (2000), Lin, Picot and Compton (2000),Cramer et al. (2002).g Blau (1987), Acs, Audretsch and Evans (1994); Kuznets (1966), Schultz (1990), Acs,Audretsch and Evans (1994), Folster (2002); Devine and Mlakar (1993), Parker andRobson (2000).h Evans and Leighton (1989b), Carrasco (1999), Schuetze (2000); Hamilton (1989),Laferrere and McEntee (1995), van Praag and van Ophem (1995), Lindh and Ohlsson(1996), Taylor (1996), Blanchflower and Oswald (1998), Farber (1999), Clark andDrinkwater (1998, 2000), Bruce (2000); Pickles and O’Farrell (1987), Reynolds, Storeyand Westhead (1994), van Praag and van Ophem (1995), Blanchflower (2000), Lin, Picotand Compton (2000), Moore and Mueller (2002).

Entrepreneurs: characteristics and environment 105
time t might be relatively insensitive to interest rates also measured attime t, depending instead on lagged interest rates. This point ought tobe borne in mind when weighing the evidence, since many studies linkstart-up/self-employment rates with contemporaneous interest rates.
UK and US time-series evidence suggests that interest rates have asignificant negative effect on self-employment rates, although its effectson new-firm formation rates are less clear-cut.39 We discuss furtherthe impact of interest rates on small firm exit behaviour in chapter 9,section 9.3.
The ‘enterprise culture’: a British myth?Some commentators have claimed that reforms to the UK labour marketand welfare system in the 1980s created an ‘entrepreneurial culture’ inwhich self-employment and entrepreneurship were allowed to flourish.In the 1980s, the British government not only deregulated markets andintroduced means-tested welfare benefits, but also initiated loan guar-antee and enterprise allowance schemes; small business advice centres,grants, and training programmes; tax deductions; and higher value addedtax (VAT) (sales tax) registration thresholds, in a concerted attempt toencourage enterprise. At the same time, the UK witnessed a dramaticincrease in the self-employment rate (see chapter 1, subsection 1.4.1),increases in business registrations and deregistrations and strong growthof unlisted securities markets and venture capital activity (Bannock andPeacock, 1989).
More detailed and careful analysis tends to rebut the view that the1980s witnessed a renaissance in the British entrepreneurial spirit. Ac-cording to the British Social Attitudes Survey, the proportion of employeerespondents thinking about becoming self-employed did not change be-tween 1983 and 1989 – a time when the renaissance of an enterprise cul-ture was presumed to have occurred (Blanchflower and Oswald, 1990).
i For positive effects see nn. 32 and 34, plus Storey and Jones (1987), Foti and Vivarelli(1994), Georgellis and Wall (2000); Robson (1996, 1998a, 1998b), Lin, Picot and Comp-ton (2000), Cullen and Gordon (2002); Acs, Audretesch and Evans (1994), Parker andRobson (2000).j Blau (1987), Robson (1998b); Carrasco (1999), Parker and Robson (2000).k For positive effects, see n. 2 of chapter 7. For insignificant effects, see Taylor (2001) andUusitalo (2001).l Long (1982a), Moore (1983a), Blau (1987), Evans and Leighton (1989a), Parker (1996),Robson (1998b), Robson and Wren (1999), Bruce (2000), Parker and Robson (2000),Schuetze (2000); Robson and Wren (1999), Parker and Robson (2000), Folster (2002);Cowling and Mitchell (1997).

106 The Economics of Self-Employment and Entrepreneurship
Instead, Blanchflower and Oswald claimed that a combination ofchanging personal characteristics and favourable developments in themacroeconomic environment were able to explain the rise in the UKself-employment rate, without any need to rely on (unmeasured) fac-tors like ‘entrepreneurial spirit’. Blanchflower and Freeman (1994)were also sceptical about an ‘enterprise culture’ effect, noting that al-though transitions from unemployment and non-labour force status toself-employment increased over the 1980s, transition rates from paid-employment to self-employment did not. Blanchflower and Freeman de-clared that ‘it is hard to believe claims that an ‘enterprise culture’ hasbeen established without some significant increase in this flow’.
3.4 Conclusion
Table 3.3 summarises the balance of evidence relating to the effects onentrepreneurship of most of the explanatory variables discussed in thischapter. In the present context we define ‘entrepreneurship’ broadly,to include both self-employment and new-firm creation. We have omit-ted results on psychological factors (including risk attitudes), since theirdiversity makes them difficult to summarise in this way. We have sum-marised only published research results based on multivariate analysis,excluding studies citing simple bivariate correlations, since these arevulnerable to the most severe form of omitted variable bias. Positive andnegative entries refer to measured effects on entrepreneurship that are sig-nificantly positive or negative; the zero entries refer to effects that are tooimprecisely estimated to reach standard levels of statistical significance(usually 5 per cent).
Table 3.3 shows that a broad consensus has now been reached onthe impact of many – though not all – of these variables. The clearestinfluences on measures of entrepreneurship (usually the likelihood orextent of self-employment) are age, labour market experience, maritalstatus, having a self-employed parent and average rates of income tax(all with positive effects). Greater levels of risk and higher interest ratesgenerally have negative effects, although to date only a handful of studieshave satisfactorily investigated the former. Further research is needed onthese topics specifically, and also more generally on the linkages betweenthe theoretical models of entrepreneurship discussed in chapter 2 andempirical implementations. In many cases, data limitations have forcedresearchers to use proxies in the place of variables suggested by the theory.Better data are needed to consolidate and extend our knowledge aboutthe individual and environmental determinants of entrepreneurship.
Entrepreneurs: characteristics and environment 107
NOTES
1. See also Clark, Drinkwater and Leslie (1998) for British evidence of effectsthat differ across ethnic groups. In contrast, aggregate studies of new businessstarts usually report positive effects from business profits relative to wages(Creedy and Johnson, 1983; Foti and Vivarelli, 1994; Audretsch and Vivarelli,1997; Goedhuys and Sleuwaegen, 2000; Lofstrom, 2002).
2. Income under-reporting is one possibility, although adjustments made by theauthor to cope with this (Parker, 2003a) made little practical difference. Notealso that the exclusion of health insurance benefits from measured incomesappears to have little effect on self-employment participation either (Bruce,Holtz-Eakin and Quinn, 2000).
3. The following studies have reported positive (usually quadratic, i.e. increas-ing with age, but with diminishing returns at higher ages) and significant ef-fects from age on the probability of being or becoming self-employed. Forthe UK: Rees and Shah (1986), Taylor (1996), Clark and Drinkwater (1998,2002), Clark, Drinkwater and Leslie (1998) and Borooah and Hart (1999).For the USA: Moore (1983a), Borjas (1986), Brock and Evans (1986), Borjasand Bronars (1989), Evans and Leighton (1989a), Boyd (1990), Fujii andHawley (1991), Holtz-Eakin, Joulfaian and Rosen (1994a, 1994b), Blanch-flower and Meyer (1994), Robinson and Sexton (1994), Carr (1996), Bates(1995, 1997), Boden (1996), Schiller and Crewson (1997), Schuetze (2000),Flota and Mora (2001), Fairlie (2002) and Lofstrom (2002). For other coun-tries: Maxim (1992), Schuetze (2000) and Moore and Mueller (2002) forCanada; Kidd (1993) and Blanchflower and Meyer (1994) for Australia;Laferrere and McEntee (1995) for France; Goedhuys and Sleuwaegen (2000)for Cote d’Ivoire; Uusitalo (2001) for Finland; and Blanchflower (2000),Cowling (2000) and Blanchflower, Oswald and Stutzes (2001) using inter-national data. Studies finding no significant effects of age on self-employmentinclude Taylor (1996) and Robson (1998a) for the UK; Blau (1987), Gill(1988), Evans and Leighton (1989b), Evans and Jovanovic (1989) and Dunnand Holtz-Eakin (2000) for the USA; and Bernhardt (1994) for Canada.Lin, Picot and Compton (2000) reported significant negative effects forCanada.
4. For the UK: Rees and Shah (1986), Dolton and Makepeace (1990), Taylor(1996), and Clark and Drinkwater (1998). For the USA: Borjas (1986),Gill (1988), Borjas and Bronars (1989), Evans and Leighton (1989a), Boyd(1990: for blacks), Tucker (1990: for non-professionals), Fujii and Hawley(1991), Blanchflower and Meyer (1994), Robinson and Sexton (1994), Carr(1996), Bates (1995, 1997), Boden (1996), Schuetze (2000), Flota and Mora(2001) and Lofstrom (2002). For other countries: Carrasco (1999) for Spain,Blanchflower (2000) for nineteen OECD countries, Goedhuys and Sleuwae-gen (2000) for Cote d’Ivoire, Cramer et al. (2002) for the Netherlands andMoore and Mueller (2002) for Canada.
5. For the UK: Robson (1998a), Taylor (2001) and Clark and Drinkwater (2002).For the USA: Brock and Evans (1986), Evans and Leighon (1989b), Evansand Jovanovic (1989), Boyd (1990: for Asians), van Praag and van Ophem(1995), Schiller and Crewson (1997), and Dunn and Holtz-Eakin (2000).

108 The Economics of Self-Employment and Entrepreneurship
See also Maxim (1992), Lin, Picot and Compton (2000) and Schuetze (2000)for Canada; and de Wit and van Winden (1990, 1991) and de Wit (1993) forthe Netherlands.
6. See, e.g., Clark, Drinkwater and Leslie (1998), Burke, Fitz-Roy and Nolan(2000) and Georgellis and Wall (2000) for the UK; Pickles and O’Farrell(1987) for Ireland; Laferrere and McEntee (1995) for France; Tucker (1988),Bruce (2000) and Fairlie (2002) for the USA; Johansson (2000) and Uusitalo(2001) for Finland; and Blanchflower, Oswald and Stutzer (2001) for evi-dence from a pool of twenty-three countries. Most of these authors studiedswitching into self-employment, rather than being self-employed. Interest-ingly, there is evidence that vocational qualifications and apprenticeshiptraining rather than academic qualifications bear on self-employment choice(Burke, Holz-Eakin and Quinn, 2000; Knight and McKay, 2000; Crameret al., 2002). International evidence on the role of education is mixed(Cowling, 2000), as are results obtained using data on particular educationalqualifications (Meager, 1992b).
7. See also Bruderl and Preisendorfer (1998) for evidence that social networksupport is positively and significantly associated with the survival and prof-itability of new German business ventures.
8. See, e.g., Scase and Goffee (1982) for case studies citing the importance toself-employed males of their wives’ unpaid labour, for example, self-employedtradesmen relying on their wives to take telephone bookings for work whilethey are out on jobs.
9. For UK evidence, see Taylor (1996), Clark and Drinkwater (1998), Clark,Drinkwater and Leslie (1998), Borooah and Hart (1999), and Knight andMcKay (2000). US evidence includes Long (1982a), Borjas and Bronars(1989), Holtz-Eakin, Joulfaian and Rosen (1994a), Robinson and Sexton(1994), Fairlie and Meyer (1996), Schuetze (2000), and Edwards and Field-Hendrey (2002). See also Maxim (1992), Laferrere and McEntee (1995)and Moore and Mueller (2002). Exceptions are Gill (1988), who detectednegative effects, and Brock and Evans (1986), Boyd (1990) and Cowling(2000), who detected no significant effects.
10. While Blanchflower and Meyer (1994), Bates (1995) and Johansson (2000)reported positive effects from marital status on the probability of entry intoself-employment, opposite results were obtained by Laferrere and McEntee(1995) and Carrasco (1999).
11. Positive effects were reported by Bernhardt (1994) and Laferrere andMcEntee (1995), whereas Fujii and Hawley (1991) reported negative effects.Lin, Picot and Compton (2000) reported Canadian evidence that having aself-employed spouse significantly increased the likelihood of the other spousebecoming self-employed.
12. For US evidence that the self-employed are less likely than employees tohave health insurance, see Gruber and Poterba (1994), Hamilton (2000) andWellington (2001).
13. Positive effects were detected by Cowling and Taylor (2001) in the UK andQuinn (1980), Fuchs (1982) and Borjas (1986) in the USA; but negativeeffects were cited by Rees and Shah (1986) and Gill (1988).

Entrepreneurs: characteristics and environment 109
14. But Tucker (1988) offers some evidence from a probit model suggest-ing that achievement motivation significantly affects the choice of self-employment.
15. Brock and Evans (1986) argued that many of the sociologists’ and psychol-ogists’ studies are based on questionable sampling methods: ‘The scientificvalidity of these studies, which are seldom based on random samples and of-ten use ambiguous or overly inclusive definitions of an entrepreneur, is opento question’ (Brock and Evans, 1986, n. 9, p. 190). A salient bias could betowards sampling only successful entrepreneurs, leading to the danger thatobserved traits are confused with entrepreneurial experience (Amit, Glostenand Muller, 1993).
16. KPMG (1999) observed that these ‘lifestyle’ motives for self-employmentwere strongest among founding entrepreneurs and weakest for those operatinggrowing and innovating firms, who were more likely to stress rapid furthergrowth as an objective.
17. See Scase and Goffee (1982) and MacDonald and Coffield (1991), whose(rather unenthusiastic) survey respondents appeared to be more concernedwith making a living (‘getting by’) than with being autonomous. Also, inLee’s (1985) survey of redundant British steelworkers who subsequently be-came self-employed, one-third claimed they did so because they ‘had no otherchoice’. A similar proportion claim to be ‘necessity entrepreneurs’ in the in-ternational GEM study (Reynolds et al., 2002), with higher proportions indeveloping than in developed countries. In the USA, for example, only 8 percent of the self-employed ascribed their mode of employment to a lack of alter-natives (Dennis, 1996). Of course, these responses are all based on declaredrather than revealed preferences, so should be treated with commensuratecaution.
18. C.f. Adam Smith (1937): ‘The chance of gain is by every man more or lessovervalued, and the chance of loss is by most men undervalued.’
19. See Parker (1996), Robson (1996), and Cowling and Mitchell (1997), re-spectively.
20. According to Blanchflower and Oswald (1990), higher proportions of Britishself-employed people than employees believe that welfare benefits should bereduced to increase self-reliance, and that people on unemployment benefitwere ‘on the fiddle’. Also, substantially more self-employed people describedthemselves as Conservative voters, compared to employees; and fewer self-employed people favoured redistribution from the rich to the poor than em-ployees did.
21. For UK evidence see Taylor (1996, 2001), Blanchflower and Oswald (1998),and Burke et al. (2000). For US evidence see Evans and Leighton (1989b),Fairlie (1999) and Hout and Rosen (2000). See also de Wit and van Winden(1989, 1990), Laferrere and McEntee (1995), Lindh and Ohlsson (1996)and Uusitalo (2001) for evidence from the Netherlands, France, Sweden andFinland, respectively.
22. Negative effects were reported by Laferrere and McEntee (1995) and Lindhand Ohlsson (1996); positive effects appear in the North American studies ofBorjas and Bronars (1989) and Bernhardt (1994).

110 The Economics of Self-Employment and Entrepreneurship
23. See also Lentz and Laband (1990), who split ‘followers’ into heirsand non-heirs to identify the role of managerial experience from meregoodwill/network/brand-loyalty effects, since heirs have the latter but non-heirs do not. Lentz and Laband found that the importance of being a fol-lower for relative self-employment earnings was similar for both groups, sug-gesting that the common factor was parental managerial experience. In anycase, only a minority of followers had inherited or purchased their parents’business.
24. See also Iyigun and Owen (1999), who argued that technological progressgenerates greater income but also greater absolute risk in entrepreneurship,such that the net incentive to become an entrepreneur decreases as economiesdevelop. However, this result is not general, since one can imagine many kindsof technological change which in conjunction with particular preferences (e.g.decreasing absolute risk aversion) lead to the opposite result. On a differenttack, Lazear (2002) argued that if entrepreneurs are ‘jacks of all trades’ whohave to deploy a mix of skills in production, then technological progress thatdemands additional skills requirements will decrease the number of suitablyequipped individuals and therefore also the number of entrepreneurs.
25. By relaxing the borrowing constraint in Banerjee and Newman’s (1993)model, financial development might also boost entrepreneurship. It shouldbe borne in mind, however, that economic and financial development oftengo together. So financial development of itself is unlikely to be a practicalpanacea for slow economic development.
26. See Fairlie and Meyer (2000) for further evidence against the ability of TFPto explain trends in US self-employment.
27. Examples of the probit approach with industry and/or occupation dummiesinclude Long (1982a), Moore (1983a), Brock and Evans (1986), Evans andLeighton (1989a) and Schuetze (2000) (all US studies); and Georgellis andWall (2000) for the UK.
28. According to Harvey (1995), self-employment accounted for 45 per cent ofthe workforce in the UK construction industry in 1993; the next highest pro-portion was 14 per cent in Distribution, Hotels and Catering. Curran andBurrows (1991) calculated that the highest self-employment growth rates over1984–9 were in manufacturing rather than in services, especially in construc-tion and engineering, with business and finance being the fastest growingself-employment service sectors.
29. See, e.g., Hamilton (1989), Taylor (1996), Blanchflower and Oswald (1998)and Clark and Drinkwater (1998, 2000) for the UK; van Praag and vanOphem (1995) and Bruce (2000) for the USA; and Lindh and Ohlsson (1996)for Sweden. Simple regional cross-tabulations bear out this finding (Whitting-ton, 1984), though the international cross-section evidence presents a moremixed picture (Reynolds, Storey and Westhead, 1994).
30. For supporting evidence, see Gordus, Jarley and Ferman (1981), Laferrereand McEntee (1995) and Carroll and Mosakowski (1987). Moore andMueller (2002) observed that Canadians collecting unemployment benefitwere less likely to enter self-employment, but that those with longer unem-ployment spells were more likely to enter it. Although layoffs and redundancy

Entrepreneurs: characteristics and environment 111
windfalls appear to significantly and substantially increase the probability oftransitions into self-employment (Taylor, 2001; Moore and Mueller, 2002),typically only a small minority of redundant employees subsequently set uptheir own business (Johnson, 1981). Of those that do, only very limitedamounts of job creation ultimately follow, at least in Britain (Johnson andRodger, 1983).
31. Kuhn and Schuetze claimed that opportunities for women improved in self-employment in terms of increased income and full-time work. In contrast,they asserted that opportunities deteriorated for men both in self-employmentand paid-employment – though it is unclear why.
32. UK examples include Harrison and Hart (1983), Foreman-Peck (1985),Binks and Jennings (1986), Hudson (1987a) and Hamilton (1989). US exam-ples include Highfield and Smiley (1987) (for new business incorporations),Ray (1975) and Steinmetz and Wright (1989) (for US self-employment) andHudson (1989) and Audretsch and Acs (1994) (for new firm start-ups). SeeBogenhold and Staber (1991) and Meager (1994) for evidence from othercountries, and Storey (1991, 1994a) for a partial overview.
33. Hamilton proposed a positive relationship at low levels of unemployment,when there are plentiful opportunities to start a new business. But at higherunemployment rates (in excess of 20 per cent), the supply of new businessopportunities and entrepreneurs to exploit them decline. Supporting evidenceof a concave quadratic relationship appears in Georgellis and Wall (2000).
34. See Robson (1991), Black, de Meza and Jeffreys (1996), Parker (1996) andCowling and Mitchell (1997). Cowling and Mitchell argued that the ‘long-term’ unemployment rate has a positive effect, and the ‘short-term’ unem-ployment rate a negative effect, on the aggregate self-employment rate. This isbecause the short-term unemployed may return to paid-employment rapidlywhereas the long-term unemployed eventually become discouraged by fruit-lessly seeking paid-employment, turning to self-employment as a last resort.
Meager (1992a, 1994) highlights a potential problem with regressing theaggregate self-employment rate, nS, on the unemployment rate. nS is com-monly defined as the number of self-employed people as a proportion of thetotal workforce. The latter includes the number of unemployed people, so im-parting bias to estimates of the self-employment–unemployment rate relation-ship. In principle it is possible to bypass this problem by defining the workforceto exclude the unemployed. This implicitly treats the labour force participa-tion decision separately from occupation choice. However, it does not addressMeager’s other critique, which is that inflow data to self-employment allowmore accurate tests of the push and pull hypotheses than stock data.
35. This is reflected in scatter plots of self-employment and unemployment ratesfor individual countries. As Meager (1992a) observed, no general patternemerges.
36. For example, Hamilton (1989) hypothesised a negatively sloped cross-sectionschedule in (nS, nU) space that shifts upwards north-easterly over time.Clearly, however, it is possible to have north-westerly as well as the north-easterly shifts that Hamilton envisaged, rendering the time-series relationshipambiguous a priori.

112 The Economics of Self-Employment and Entrepreneurship
37. Georgellis and Wall (2000) discovered a greater role for economic variables toexplain regional variations in self-employment rates, especially average levelsof human capital. They also found that the North of Britain is an outlier in thesense that, unlike any other region, unexplained fixed effects explain virtuallyall of the variation in those data.
38. Long (1982a), Brock and Evans (1986), Boyd (1990: for blacks but notAsians), Laferrere and McEntee (1995) and Lindh and Ohlsson (1996) foundsignificant positive effects from urban dummies, but Reynolds, Storey West-head (1994) and Carrasco (1999) did not.
39. For self-employment studies reporting negative effects, see Evans andLeighton (1989a), Black, de Meza and Jeffreys (1996), Parker (1996), Rob-son (1996, 1998b) and Cullen and Gordon (2002). For new-firm foundationstudies, contrast Audretsch and Acs (1994), who found a negative effect, withHighfield and Smiley (1987) and Hudson (1989), who did not.

4 Ethnic minority and femaleentrepreneurship
In many developed countries, ethnic groups comprise a growing minorityof the labour force, and females are no longer a minority of employees.Yet ethnic groups exhibit pronounced differences in their propensities tobe self-employed, while females remain a minority of the self-employedworkforce in all developed economies. Why?
‘Minority entrepreneurship’ – defined here to encompass ethnic mi-norities and females – is attracting growing research interest. One reasonmight be the belief that entrepreneurship offers a route out of povertyand into economic advancement and assimilation for ethnic groups, es-pecially immigrants (Sanders and Nee, 1996). Another is the concernthat minorities may face discrimination that hinders their ability to prac-tice entrepreneurship. And there is growing interest in promoting flexiblelabour markets, enabling females in particular to participate more effec-tively in the workforce.
It might be helpful to commence with several ‘stylised facts’ about eth-nic minority entrepreneurship; females are treated later in the chapter.First, in the UK and the USA, it is pretty well established that blackshave self-employment rates that are substantially and persistently belowaverage.1 For example, Clark and Drinkwater (1998) observed from 1991British Census data that whites had self-employment rates twice that ofblack Caribbeans; according to Fairlie (1999), the white self-employmentrate in the USA was three times that of blacks. According to Fairlie andMeyer (2000), this differential has persisted since at least 1910, suggest-ing that little has changed since Myrdal (1944) bemoaned the dearth ofblack-owned businesses in America.
Second, many non-black ethnic groups have above-average self-employment rates, so much so that some authors have concluded thatmembers of the broad ‘non-white’ group have a higher probability of self-employment in the UK and the USA than ‘whites’ do. For example, Clarkand Drinkwater (1998) reported that Chinese, Pakistanis, Bangladeshisand Indians in Britain had substantially higher self-employment rates(of 26.6, 22.8, 17.8 and 19.6 per cent, respectively) than whites did
113

114 The Economics of Self-Employment and Entrepreneurship
(12.3 per cent). And using 1990 US Census data, Fairlie and Meyer(1996) found that non-rural male self-employment rates varied substan-tially across 60 ethnic and racial groups, both before and after control-ling for age, education, immigrant status and length of time spent in theUSA. For example, only 4.4 per cent of black males worked for them-selves, compared with 27.9 per cent of Korean-American men, whileEuropean-Americans had self-employment rates close to the US average.Members of ethnic groups from the Middle East and neighbouring coun-tries such as Armenia, Israel and Turkey also had high self-employmentrates; but Hispanics (other than Cubans) had low self-employment rates.Fairlie and Meyer (1996) also noted some diversity within the ‘black’ethnic group, with black Africans and Caribbeans having slightly higherself-employment rates than other black Americans (but still below theUS average). This and similar evidence from the UK cautions againsttreating ethnic minorities as a single homogeneous group.
Third, self-employed minority workers tend to earn less on average thantheir white self-employed counterparts. According to Borjas and Bronars(1989), mean self-employment income among black males in 1980 wasabout half that of self-employed white males, while the mean income ofmale Hispanics was nearly 30 per cent less than that of whites (see alsoFlota and Mora, 2001). In contrast, self-employed Asians receive verysimilar returns to whites. Blacks also have lower average business receiptsthan members of other minority groups (Borjas and Bronars, 1989).
Exploring the factors underlying these ‘stylised’ facts is the aim ofsection 4.1, which focuses on ethnic minority entrepreneurship. Boththeoretical models and empirical evidence are discussed. Section 4.2treats female entrepreneurship, and section 4.3 discusses particular is-sues relating to immigration.
4.1 Ethnic minority entrepreneurship
Two hypotheses have been advanced to explain the observed variationsin rates of entrepreneurship between ethnic groups. The first is discrim-ination, perpetrated either by employers in the labour market, banks inthe capital market, or consumers in the product market. The second is apositive set of factors that can help make entrepreneurship attractive tomembers of particular minority groups. In the remainder of the chapter,M and NM will be used to denote ‘minority’ and ‘non-minority’ valuesof the variables to which they are attached. In particular, wM and wNM
denote minority and non-minority wage rates in paid-employment, re-spectively; while πM and πNM denote minority and non-minority profitsin entrepreneurship, respectively.

Ethnic minority and female entrepreneurship 115
4.1.1 Discrimination
Employer discriminationIf employers have an exogenous taste for discriminating against membersof ethnic minorities, M, what are the implications for ethnic entrepreneur-ship, and entrepreneurial profits of minority members? Previous re-searchers have proposed two outcomes from employer discrimination(Sowell, 1981; Moore, 1983b; and Metcalf, Modood and Virdee 1996):1. By preventing members of minorities from obtaining jobs in paid-
employment or by restricting them to relatively low-paid jobs, dis-crimination increases the attractiveness to them of entrepreneurship.In other words, entrepreneurship can act as an ‘escape route’ fromemployer discrimination, implying greater participation in entrepr-eneurship for these individuals.
2. Discrimination reduces the minority employment wage below thatof non-minority members, i.e. it reduces wM/wNM, so the ratio ofminority to non-minority average entrepreneurial profits, πM/πNM,exceeds the ratio of minority to non-minority wages, wM/wNM (Moore,1983b).However, if we equate entrepreneurship with self-employment, point 2
is not borne out by the evidence (see Moore, 1983b; Borjas and Bronars,1989; Fujii and Hawley, 1991; Clark and Drinkwater, 1998). One rea-son is that crowding of Ms into entrepreneurship competes down theiroutput price and hence their profits, πM, until πM/πNM = wM/wNM.Alternatively, even if the distribution of ability within each ethnic groupis identical, there are circumstances under which employer discrimina-tion might indirectly reduce πM relative to πNM. This could occur if en-trepreneurs’ profits are an increasing function of entrepreneurial abilityx: π j = π(xj ) ( j = {M, NM}), with ∂π j /∂x > 0 ∀ j . To see this, let thedistribution function of x, G(x), be the same for each group. Recall thatwNM > wM because of employer discrimination. Denote the marginalentrepreneur in each ethnic group, i.e. who is indifferent between paid-employment and entrepreneurship, by xNM and xM, respectively. Theseindividuals are defined by the equalities
wNM = π(xNM) and wM = π(xM) .
Then it follows that wNM > wM ⇒ π(xNM) > π(xM), i.e. the minoritymarginal entrepreneur is less able, and less well remunerated, than thenon-minority marginal entrepreneur. There are also more M than NMentrepreneurs in equilibrium, since 1 − G(xM) > 1 − G(xNM).
Another problem with the employer discrimination hypothesis is thatpoint 1 above is inconsistent with the facts about American and British

116 The Economics of Self-Employment and Entrepreneurship
blacks, who have lower self-employment rates than whites. Although someethnic minorities (such as Korean-Americans or British Asians) haveabove-average self-employment rates, this is an unsatisfactory defenceof the employer discrimination hypothesis because it fails to explain whyemployers discriminate against some ethnic groups but not others.2
Discrimination in the capital marketsIf lenders discriminate against ethnic minorities, then members of theseminorities may find it harder to borrow and become entrepreneurs. Thestylised facts are stark. Blanchflower and Oswald (1998) reported thatmore than 60 per cent of black Americans are turned down for loans byUS banks, compared with just 30 per cent for whites. Knight and Dorsey(1976), and more recently, Bates (1997), reported that blacks are grantedsmaller loans for start-ups than whites – even after controlling for char-acteristics such as education and financial assets. Similar outcomes havebeen observed in the venture capital market (Bates and Bradford, 1992).An implication is that blacks are both less likely to be able to start busi-nesses and more likely to be under-capitalised and therefore vulnerableto failure than whites. A striking finding from Bates’ (1991) analysis of1982 CBO data is that, controlling for a range of human capital, physicalcapital and demographic traits, blacks’ failure rates would have been nodifferent from those of whites if they had received the same amounts ofexternal finance.
The UK evidence paints a somewhat different picture. There, the mainfinancing difference appears not to be between whites and blacks, butbetween Asians and Afro-Caribbeans. According to Jones McEroy andBarrett (1994), Asians have a higher probability of obtaining a bank loanthan Afro-Caribbeans and whites, and leverage more funds from banks.These facts cast doubt on the proposition that UK banks are guilty ofblanket discrimination, though it does beg the question about why Afro-Caribbeans have greater difficulties in raising bank loans than whites do(Bank of England, 1999).
One possible answer is statistical discrimination. This describes the situ-ation where an ethnic group has different characteristics on average fromothers, which are then used to adversely screen all members of that group.For example, UK minority-owned businesses tend to establish themselvesin sectors such as retailing, transportation and catering, that have above-average failure rates (Bank of England, 1999). Also, blacks tend to havelower wealth levels on average and hence less collateral than whites do.Even if banks do not discriminate on the basis of ethnicity, bank competi-tion may generate bank lending rules that reward high-collateral and safe-sector start-ups with larger loans – resulting in outcomes that resemble

Ethnic minority and female entrepreneurship 117
discrimination, since blacks will be observed to obtain smaller loans onaverage.
Coate and Tennyson (1992) demonstrated how employer discrimina-tion can spill over into statistical discrimination in the credit market.Entrepreneurs must borrow a unit of capital to operate an investmentproject whose return is uncertain. Let pi be the (heterogeneous) proba-bility that individual i ’s enterprise succeeds – which is private informa-tion to the individual. Let R s > 0 (respectively, Rf = 0) be the return ifa project is successful (respectively, unsuccessful); and ri be the interestrate charged to i . With an outside wage of wi = wNM if i belongs to thenon-minority group and wi = wM otherwise, the individual with successprobability pi = pi (wi , ri ) is indifferent between entrepreneurship andpaid-employment:
pi (wi , ri ) = wi/[R s − (1 + ri )] .
Employer discrimination implies that wNM > wM. Hence
pi (wM, rM) < pi (wNM, rNM) ,
i.e. the marginal entrepreneur in M is of lower ability compared with hisNM counterpart. Consequently, statistical discrimination occurs: eth-nicity is an observable characteristic, and in a competitive credit marketevery loan applicant from M must be charged a higher interest rate thantheir NM counterpart to reflect their lower average probability of success.Thus rM > rNM, which for any ability type reduces an M entrepreneur’sexpected profits (net of interest payments) below that of the correspond-ing NM entrepreneur.
As it stands, a higher proportion of Ms than NMs is predicted to en-ter entrepreneurship in this model – which is contradicted by evidenceabout black self-employment rates. Coate and Tennyson (1992) showedthat this prediction can be overturned if entrepreneurial ability is partlydetermined by human capital investment since, facing employer discrim-ination, it is rational for Ms to acquire less human capital than NMs.If this reduced M entrepreneurs’ returns πM by more than it reducedwM, then fewer Ms might choose entrepreneurship than NMs. However,it was seen in chapter 3, section 3.1 that human capital has a greaterimpact on returns in paid-employment than in self-employment. HenceCoate and Tennyson’s model has real difficulties explaining why blackself-employment rates are so relatively low.
If for whatever reason minorities encounter difficulties with raisingbank loans, then they presumably have an incentive to raise capital withintheir own ranks. There is a small but growing literature (see also chapter 6,subsection 6.1.3), on minority-owned banks and Rotating Savings and

118 The Economics of Self-Employment and Entrepreneurship
Credit Associations (Roscas), which have proven especially popularamong Chinese, Japanese and Korean immigrant groups in the USA.Several researchers have suggested that Roscas have enabled impe-cunious immigrants to bootstrap their way to business success (Lightand Bonacich, 1988; Aldrich and Waldinger, 1990; Yoon, 1991). Forexample, in Yoon’s (1991) survey of 199 Korean merchants in minorityneighbourhoods in Chicago, 27.6 per cent used loans from KoreanRoscas, 27.1 per cent used loans from banks, and 34.7 used loans fromkin. However, this coverage does not seem to extend to national datasets such as the CBO, where Rosca lending appears to be of marginalimportance and is associated with smaller and more failure-pronebusinesses (Bates, 1997). Involvement in Roscas in the USA seems tohave been strongest in the early part of the twentieth century, becomingless important over time as ethnic groups gained greater access to formalcredit markets (Besley, 1995).
Another problem with the proposition that minority-owned banks cansolve capital market discrimination problems is that many ethnic groups(including blacks) have not emulated Asian Roscas – which might havebeen expected to occur if they were so effective. Closer inspection re-veals that Roscas’ value is actually rather dubious. Much Rosca financeis short-term and at high interest rates that can exceed 30 per cent perannum – which presumably makes a Rosca a lender of last resort to manyborrowers. It is also pertinent that many Roscas are designed primarilyto encourage savings rather than business investment by members.
Consumer discriminationAnother possibility is that NM consumers dislike buying goods and ser-vices from M entrepreneurs. This can be expected to reduce the latter’sreturns in entrepreneurship, and hence the number of M entrepreneurs.3
Borjas and Bronars (1989) studied a model with this feature, in whichNM consumers are assumed to have a taste for discrimination againstM sellers, while M consumers are indifferent to the race of the seller.4
Thus if M sellers charge price P, NM buyers perceive it as P/(1 − α),where α < 1 measures the strength of the taste for discrimination. Thereis imperfect information about prices of goods and the race of sellers.Therefore all consumers are prepared to search for goods. There arefour reservation prices P( j, j ′), from sellers of race j to buyers of racej ′: j × j ′ = {M, NM } × {M, NM }. These are the highest prices that abuyer is prepared to pay rather than continuing to search. Reservationprices are ordered as follows:
P(NM, NM) ≥ P(NM, M) = P(M, M) > P(M, NM)
= (1 − α)P(NM, NM) . (4.1)

Ethnic minority and female entrepreneurship 119
The strict inequality in (4.1) reflects the possibility that a NM buyerencounters a M seller in the future, which reduces the former’s value ofsearch and raises the reservation price P(NM, NM) above P(M, NM).
Sellers maximise the utility function U = π − (hβ/β), where π is en-trepreneurial profit, h is hours worked, and β > 1 is a parameter. Indi-viduals choose optimal work hours h∗ and the set of buyers that theyare prepared to sell to (‘segregation policy’). To trade, offer prices mustbe below the reservation prices of the targeted buyers. It is assumed thatwithin each ethnic group sellers have heterogeneous abilities at producinggoods, and that the distribution of ability within the two groups is identi-cal. Let � = {b, g} denote the set of different abilities, ‘bad’ (or unskilled)and ‘good’ (skilled) respectively. There are four offer prices indexed byPj,�. In equilibrium, the more able can produce more output and sohave higher opportunity costs of not selling. This reduces their offer pricewithin their racial group. This, together with (4.1), yields the ranking
PNM,b ≥ PNM,g ≥ PM,b ≥ PM,g . (4.2)
Borjas and Bronars’ two key results then follow directly: (i) In equilib-rium the mean income of M sellers will be lower than that of NM sellers.Skilled Ms have greater incentives to enter paid-employment than skilledNMs. (ii) NM sellers have a higher return to ability than M sellers. Thesepredictions contrast with those of the employer discrimination modeland accord with the third ‘stylised fact’ listed in the introduction to thischapter. Using a sample of 1980 US Census data, Borjas and Bronarsfound some support for their predictions, observing significant positiveselection into self-employment among whites, significant negative selec-tion among Hispanics and Asians (see also Flota and Mora, 2001), butzero selection among blacks.
While Borjas and Bronars’ model appears useful for understandingethnic differences in self-employment rates, it seems less suitable forexplaining gender differences. As Aronson (1991) pointed out, womenare commonly employed in sales jobs, which would not be optimal ifprofit maximising firms knew that consumers discriminated against them.Another problem with the consumer discrimination hypothesis is thatblack businesses are relatively common in industries patronised by whitecustomers (Meyer, 1990). One reason could be franchising, since fran-chisors often discourage attempts by franchisees to differentiate theirunits (Kaufmann and Lafontaine, 1994) – so reducing consumers’ abilityto discriminate. Indeed, Williams (2001) found that black entrepreneurswere more likely than any other racial group to become franchisees.Williams also estimated that blacks earned more as franchisees than theywould as independent business owners, a finding that is also consistentwith Borjas and Bronar’ discrimination model. If Williams’ findings are

120 The Economics of Self-Employment and Entrepreneurship
true more generally, they suggest that franchising could be a successfulway of increasing the level of entrepreneurial activity among blacks.
4.1.2 Positive factors
Discrimination can be regarded as a factor that ‘pushes’ members of eth-nic minorities into the escape route of entrepreneurship. Another pos-sibility is that ‘pull’ factors make entrepreneurship positively attractiveto members of minority groups. The following pull factors have beenproposed:1. Positive expected relative returns in entrepreneurship Positive rewards
in entrepreneurship, rather than discrimination in paid-employment,may explain high rates of entrepreneurship among some ethnic groups(Bearse, 1984). For example, using US and British data, respectively,and implementing the structural probit model outlined in chapter 1.subsection 1.6.2, Fairlie and Meyer (1996) and Clark and Drinkwater(2000) found that relative income differences helped explain differ-ences in self-employment rates across ethnic groups.
2. Ethnic enclaves ‘Enclaves’ are geographical clusters of ethnic groupmembers who form self-supporting economic communities. Enclavescan offer information networks, sources of credit, ‘niche’ markets forthe output of ethnic entrepreneurs and a steady supply of workers,possibly drawn from close-knit extended families (Light and Bonacich,1988). For example, ethnic minority entrepreneurs may know moreabout the tastes of ethnic consumers, in such ‘protected markets’as clothing, foodstuffs, religious goods and services (Aldrich et al.,1985). These factors, and the absence of consumer discriminationby co-ethnics, presumably increase the opportunities and ease withwhich minority group members can operate a business. Set againstthis argument, however, is the possibility that the scope for expand-ing operations into broader markets is more difficult for enclaveproducers. Also, enclaves can foster intense competition among eth-nic entrepreneurs, so limiting entrepreneurial opportunities (Aldrichand Waldinger, 1990) and reducing survival prospects (Bates andBradford, 1992). Furthermore, employment incomes may be relativelyhigh in enclaves since ethnic employers presumably do not discrimi-nate against members of their own group. And opportunities for prof-itable entrepreneurship in enclaves may be limited if ethnic disposableincomes and hence consumer demand are low.
The available evidence from a range of countries certainly pointsto a concentration of self-employed immigrants and minorities inparticular industrial sectors. For example, US Census data from 1980revealed that 27 per cent of self-employed immigrants were working

Ethnic minority and female entrepreneurship 121
in the retail sector, compared with 17 per cent of the native-bornself-employed (Borjas, 1986). Becker (1984) reported that white self-employed individuals were concentrated in managerial, technical andprofessional occupations, whereas their black counterparts were con-centrated in manual jobs. Similar evidence comes from the 1991British Census, with 90 per cent of Asian self-employed people workingin services, and only a tiny minority working in the construction sector(Clark and Drinkwater, 1998). Clark and Drinkwater also reportedthat 50 per cent of Indian, Pakistani and Bangladeshi self-employedindividuals worked in retail distribution, restaurants and taxi driving,while 80 per cent of the Chinese self-employed worked in the restau-rant industry.
A direct empirical test of the ethnic enclave hypothesis examineswhether the proportion of an area’s population belonging to one ethnicgroup positively affects that group’s self-employment incidence in thearea. Borjas (1986) pioneered this approach by including as an ex-planatory variable in a logit model of self-employment participationthe proportion of individuals’ local populations who were Hispanic.Borjas estimated that male Hispanics aged 18–64 were significantlyand substantially more likely to be self-employed in areas with a largeHispanic population, whereas no such effect was detectable for whites.Subsequent evidence on the issue has been mixed, with some studiesoffering support (Boyd, 1990: for blacks; Le, 2000; Flota and Mora,2001; Lofstrom, 2002) and others failing to find significant effects(Borjas and Bronars, 1989; Boyd, 1990: for Asians; Yuengert, 1995;Razin and Langlois, 1996; Clark and Drinkwater, 1998, 2000, 2002).
The enclave hypothesis also has problems explaining low black self-employment rates, especially since there is evidence in the USA andthe UK of strong black networks, including a loyal black customerbase and a practice of blacks hiring of other blacks (Aronson, 1991;Jones McEvoy and Barrett 1993). In contrast, members of other self-employed minority groups (especially Asians) often predominantlyhire workers from outside their ethnic group (Aldrich and Waldinger,1990). Nor is the use of family labour confined to ethnic minorities:it appears to be a common practice among all racial groups (JonesMcEvoy and Barrett 1993).
Bates (1997) argued that enclaves are not a route to entrepre-neurial success, and primarily serve as a fallback for marginal ethnicentrepreneurs. Bates demonstrated that successful Asian-Americanentrepreneurs predominantly serve non-minority clients, raise financefrom conventional lenders and employ non-minority employees. Theirsuccess appeared to be attributable not to ethnic resources but toheavy physical and human capital investments.5 in contrast, the least

122 The Economics of Self-Employment and Entrepreneurship
successful Asian-owned firms relied on social support networks in en-claves; and those with a predominantly minority clientele and locatedin areas with large minority populations had significantly lower survivaland profitability rates than the average.
3. Culture Building on Weber’s (1930) ‘Protestant Ethic’ thesis, it is pos-sible that attitudes to entrepreneurship are determined by the religionof particular ethnic groups (Rafiq, 1992). Some prominent figuresin Islam and the Sikh religion were businessmen; and some Hinducastes specialise in business activities. In Britain, Clark and Drinkwater(2000) found that, all else equal, Muslims, Hindus and Sikhs had sig-nificantly higher probabilities of being self-employed than Christiansfrom ethnic minorities were. Related to this, some Asian culturesstress self-sufficiency, thrift and hard work, which may help to explainhigh Britain Asian self-employment rates (Borooah and Hart, 1999).However, most empirical studies have found religion variables to beinsignificant (Pickles and O’Farrell, 1987; O’Farrell and Pickles, 1989;de Wit and Winden, 1989; de Wit, 1993), though there are exceptions(Carroll and Mosakowski, 1987; Clark and Drinkwater, 2000).
Poor command of the host country’s language might increase thelikelihood of ethnic self-employment, by restricting employment op-portunities in the formal employment market without affecting tradingopportunities among members of one’s own language group (Bates,1997). The evidence on the issue derived from probit models is mixed,with some studies finding that poor English-language skills increaseself-employment participation (Boyd, 1990; among Asians but notblacks; Fairlie and Meyer, 1996; Portes and Zhou, 1996; Clark andDrinkwater, 2002), and others finding the opposite (Evans, 1989;Flota and Mora, 2001; Lofstrom, 2002). Flota and Mora (2001)claimed that poor English fluency was associated not only with lowerself-employment propensities, but also with lower self-employment in-comes. Another possibility is that belonging to a minority group maycreate a feeling of insecurity that encourages a drive for entrepreneurialsuccess (Kilby, 1983; Elkan, 1988).6
4. Role models Applying quantile regression techniques to 1984 SIPPdata, Hamilton (2000) found that black self-employment incomes aresimilar to those of whites at the three lower quartiles but are signifi-cantly lower than whites’ incomes at the upper quartile. An absenceof black entrepreneurial ‘superstars’ may contribute to the lower self-employment rates of blacks generally – as well as accounting for theirlower average self-employment incomes. A lack of black role modelswithin and outside the immediate family might also explain why Houtand Rosen (2000) found intergenerational links in self-employment tobe strong for every American ethnic group except blacks.

Ethnic minority and female entrepreneurship 123
4.1.3 Conclusion
The literature has identified both negative and positive factors that im-pinge on ethnic entrepreneurship. Most of the negative factors are basedon some kind of discrimination. As we saw, however, the role of discrim-ination has been questioned on both theoretical and empirical grounds.In the USA, for example, Bates (1997) concluded that the substantial hu-man and physical capital inputs by Asian-American entrepreneurs relativeto blacks help explain the former’s substantially higher self-employmentrates.
Is it different personal characteristics, or is it different returns giventhe same personal characteristics, that account for the observed differ-ences in self-employment rates between ethnic groups? In an attempt toanswer this question, Borjas and Bronars (1989) estimated what averageminority self-employment rates would have been if the coefficients froma self-employment probit regression based on a white subsample (i.e. im-posing the same returns to characteristics) were applied to non-whites.To make this precise, consider the probit regression equation (1.7), and(suppressing the intercept purely for notational clarity) let βNM denotethe estimated coefficients of that equation obtained using a purely non-minority data sample. Then if only M members’ characteristics weredifferent, the predicted probability of M self-employment would be
pM =∑i∈M
�(β ′NMWi )n
, (4.3)
where n is the sample size, �(·) is the cumulative distribution functionof the normal distribution and where the summation takes place over allpersons in the minority group, M. Using this method, Borjas and Bronars(1989) found that blacks and Hispanics would have had the same self-employment rates as whites, and that Asians would have had a higher self-employment rate than whites. This implies that unobserved differences inrates of return, rather than differences in observable characteristics, ac-count for the ethnic variation in self-employment rates.7 Unfortunately,it is unclear whether discrimination, cultural factors, or unobservedcharacteristics are responsible for these different rates of return.
Self-employment rates themselves conflate entry decisions and sur-vival outcomes. Fairlie (1999) demonstrated the importance of separat-ing these effects to identify more precisely the causes of the relatively lowUS black self-employment rate. Using PSID data over 1968–89, Fairliefound that black entry rates into self-employment were about half those ofwhites, while black exit rates were about twice those of whites. Using a de-composition analysis, Fairlie found that although some variables helped

124 The Economics of Self-Employment and Entrepreneurship
explain lower black entry rates (notably lower assets and a lower inci-dence of self-employed fathers), they did not help explain higher blackexit rates.8 According to Fairlie, education was not a significant factorfor either entry or exit. Fairlie concluded that the scope for policy inter-vention to increase black self-employment rates is limited. Even quadru-pling current black asset levels was estimated to reduce the ethnic gapin self-employment entry rates by only 13 per cent. Bates (1984) alsoexpressed doubts about the potential for government policies (such asthe SBA’s Equal Opportunities Loan Programme and US Federal gov-ernment procurement policies) to stimulate business ownership amongethnic minorities.
4.2 Female entrepreneurship
4.2.1 Explaining female self-employment rates
Females are a minority of the self-employed workforce in all developedcountries, and within all ethnic groups (see, e.g. Fairlie and Meyer, 1996).American female self-employment in particular grew especially rapidlyin the 1970s and 1980s, doubling in number while growth in male self-employment was much more modest (Becker, 1984; Evans and Leighton,1989a). Female self-employment grew from about one-quarter of the USnon-agricultural self-employed workforce in 1975 to about one-third by1990 (Devine, 1994a). According to Aronson (1991) this represents acontinuation of a trend increase since at least 1955, when the femaleshare of the US self-employed workforce was about 12 per cent. Femaleself-employment rates in the EU vary considerably, from just over 20per cent in the UK, Ireland and Sweden to 40 per cent in Belgium andPortugal (Cowling, 2000).
Self-employed women in the USA tend to be older than their femaleemployee counterparts, though this difference has narrowed since 1975(Devine, 1994a). Between 1975 and 1990, the increase in US femaleself-employment was accompanied by few changes in occupational orindustrial concentration. Self-employed females remain over-representedin a few sectors like ‘sales’ and ‘other services’ (which include financial,insurance and real estate; professional services; and business services:Bates, 1995). Few self-employed females are found in the constructionindustry, which remains dominated by males. The concentration of self-employed females in service industries is particularly pronounced, beinggreater than that of either female employees or either category of males.But as Aronson (1991) pointed out, the secular growth in services pre-dated the growth in female self-employment and hence cannot explain it.

Ethnic minority and female entrepreneurship 125
According to Devine (1994a, 1994b), self-employed American femalesare more likely than their employee counterparts to be married with aspouse present, to be covered by somebody else’s health insurance andto work either a relatively small or a relatively large number of hours.Being married and having infants or school-age children in the house-hold appear to be strongly associated with female self-employment.9
The cost of child-care may be one reason underlying these results, sinceself-employment often offers greater flexibility for arranging child-carearound a work schedule. It is noteworthy that several authors have ob-served that family variables have little impact on male self-employmentparticipation (Boden, 1996; Carr, 1996).
In line with the flexibility hypothesis, Carr (1996) found from 1980US Census data that 20 per cent of female self-employed individualsworked from home, compared with just 6 per cent of men. Edwards andField-Hendrey (2002) investigated this issue in further detail, findingthat home-based work is an attractive option for women with high fixedcosts of work, associated with such factors as the presence of small chil-dren, disability and rural location. Naturally, home-workers can engagemore easily than on-site workers in joint market and household produc-tion. Edwards and Field-Hendrey also reported that home-based workerswere more likely to choose self-employment (63 per cent) than on-siteworkers were (33 per cent). Apart from joint production, home-basedself-employment enjoys several advantages over on-site employment, in-cluding the absence of employer monitoring and office rental costs. Forthe UK, further evidence in support of the flexibility hypothesis comesfrom Hakim (1989a), who showed that while the desire for independenceand monetary rewards were important for both genders in the UK, fe-males valued the freedom of choosing when to work more than men did.
Until recently, a neglected issue in research on female self-employmentwas the husband’s role in the household. This gap is now being filled.For example, Caputo and Dolinsky (1998) found that the incomes,self-employment experience and child-care provision of husbands allsignificantly increased the probability that an American woman was self-employed. The strongest effects came from simply having a self-employedhusband in the household. Bruce (1999) confirmed this result, findingthat the presence of a self-employed husband doubled the probabilityof an American female switching into self-employment.10 According toDevine (1994a), 40 per cent of all self-employed American women inhusband–wife households had self-employed spouses in 1990. Husbandsmay enable women to overcome capital constraints; provide role mod-els, business skills and valuable advice; and free up the woman’s time toenable her to run her business.

126 The Economics of Self-Employment and Entrepreneurship
The following stylised facts about labour supply patterns emerged fromDevine’s (1994a) study of American self-employed females. First, self-employed females were likelier than female employees or males in ei-ther employment category to be part-time workers.11 Second, part-timefemale self-employment was commonest among those who were mar-ried with a spouse present. Third, work hours of part-time and full-timeself-employed women were more dispersed than female employees’ workhours. Devine concluded that self-employed females faced greater choicethan males did in terms of the hours of work they supplied. That maypartly explain Lee and Rendall’s (2001) finding that white Americanwomen had shorter spells in self-employment on average than men did,despite having worked similar numbers of spells.
Education has also been identified as an important aspect of femaleself-employment. Cowling and Taylor (2001) showed that on averageBritish self-employed females possessed more advanced educational qual-ifications than self-employed own-account (but not employer) males.Advanced education also appears to be associated with female self-employment in the USA.12 This finding might be explained by the con-centration of female employees in clerical and administrative jobs whichrequire less advanced qualifications and that yield work experience thatis ill-suited to switching into self-employment (Boden, 1996).
A drawback of several of the above studies is that they ignore relativeearnings as a determinant of female self-employment. This has been par-tially dealt with by Devine (1994b), who used CPS data over 1975–87to estimate the earnings function (1.1), in order to compare potentialfemale incomes by occupation. The predicted employment earnings ofself-employed females exceeded those of females who were employees.13
Devine also reported that female self-employment participation rates didnot vary systematically by job skill level. This is inconsistent with thehypothesis that skilled women choose self-employment to avoid a ‘glassceiling’ of limited earnings in self-employment; and also with the no-tion that women use employment skills as a launching pad for entry intoself-employment.
To the author’s knowledge there has not yet been an application ofthe structural probit model (described in chapter 1, subsection 1.6.2) tofemale self-employment. Such an exercise would be valuable providedthat a sufficiently large data sample could be obtained.
4.2.2 Female self-employed earnings
It is now well established that self-employed females earn less on averagethan self-employed men or employees of either gender. For example,

Ethnic minority and female entrepreneurship 127
the US SBA (1986) estimated that the ratio of female to male self-employment incomes remained roughly constant at around 0.50 between1974 and 1984, at the same time as the ratio of female to male employ-ment incomes increased from 0.46 to 0.53. These numbers include bothpart-time and full-time workers. Using 1983 SIPP data, Haber, Lamasand Lichtenstein (1987) estimated that the ratio of US median full-timefemale to male self-employment incomes was only 0.30, compared to aratio of 0.60 in paid-employment. Self-employed females also suffer a30 per cent median earnings disadvantage relative to female employees(Becker, 1984; Devine, 1994a). Female self-employed workers do bet-ter on average in some other countries, with female/male earnings ratiosreaching 87 per cent in the case of Australia (OECD, 1986).
Aronson (1991) offered an interesting historical perspective on femalerelative self-employment incomes. He cited evidence that, in the inter-war and early post-war periods, self-employed females earned more thanfemale employees did – although the comprehensiveness of these datais limited. What is clear is that between 1955 and 1984 the relativeearnings position of self-employed females declined steadily relative totheir employee counterparts and also to self-employed males. It is lessclear whether this decline reflects greater part-time participation by self-employed females or a relative worsening of the human capital of femaleschoosing self-employment. While the inclusion of incorporated self-employed workers in sample data tends to close the income gap of maleself-employed relative to male employees, it makes relatively little differ-ence to the female self-employed–employee income gap (Aronson, 1991).That presumably reflects the small number of incorporated self-employedfemales.
For the self-employed generally, it should be borne in mind that self-employment incomes usually omit important additional dimensions ofjob remuneration, such as health care coverage. Female self-employedworkers have relatively scant job-related health care coverage com-pared with female employees, male employees and male self-employees(Devine, 1994a).
Why are female self-employment incomes relatively low? One reason isthat female self-employed workers have fewer years of experience than fe-male employees or males (Aronson, 1991; Lee and Rendall, 2001). Also,female self-employees tend to have more diverse backgrounds than theirmale counterparts: women are more likely than men to set up a businesswithout having a track record of achievement, vocational training, or ex-perience (Watkins and Watkins, 1984). Second, women have greater op-portunities or preferences for potentially less remunerative home working,as noted above. Third, females tend to operate a smaller scale of business,

128 The Economics of Self-Employment and Entrepreneurship
utilising less capital and finance from banks and other lenders than malesdo (Aronson, 1991). This might reflect a preference for smaller enter-prises since these minimise the disruptions to a family that could resultfrom operating a larger enterprise. Of course, a lower capital base canbe expected to reduce future entrepreneurial incomes and increase theprobability of business failure. Carter, Williams and Reynolds (1997)confirmed that female-owned businesses start on a smaller scale thanmale-owned ones, and have higher discontinuance rates – although theystressed that this did not seem to be attributable to females being disad-vantaged with respect to access to credit.14
A study by Hundley (2001a) sought to test these competing expla-nations against each other by applying an Oaxaca decomposition togender-specific earnings functions. To see how this works, write (1.1)of chapter 1, subsection 1.5.3 in the form ln yi j = β ′
j Xi j + ui j , where thej subscript denotes gender: j = f indexes females and j = m indexesmales. Consider a particular explanatory variable Xi jk. Letting an overbardenote sample means and a hat denote a regression estimate, we can write
ln ym − ln y f = β ′m
(Xmk − Xf k
) + (βm − β f
)′Xf k , (4.4)
where y denotes annual earnings. The first term on the RHS of (4.4) isthe part of the average earnings difference attributable to characteristicXi jk. The other term is the part of the earnings difference that is unex-plained by Xi jk.15 Hundley (2001a) found that, in terms of (4.4), themost important explanatory variables were housework, work hours andthe number of young children, which together accounted for between30 per cent and 50 per cent of the American annual self-employmentearnings’ gender differential. This suggests that women earn less thanmen do because they spend less time managing and developing theirbusinesses. The next most important factor found by Hundley (2001a)was industrial sector, which accounted for between 9 and 14 per centof the gender self-employment earnings’ differential. This captures theconcentration of women in the relatively unrewarding personal servicessector, and their under-representation in the more remunerative profes-sional services and construction industries. Physical capital explainedonly between 3 and 7 per cent of the differential, and other variables(including experience) were even less important.
It is not just the case that female self-employees under-perform relativeto males in terms of their income. The same appears to be true of theiroutput, employment and turnover, according to overviews of US and UKevidence conducted by Brusch (1992) and Rosa, Carter and Hamilton(1996). As Du Rietz and Henrekson (2000) show, controlling for otherfactors such as industrial sector attenuates, but does not eliminate, thisfinding.

Ethnic minority and female entrepreneurship 129
Finally, the inequality of female self-employment incomes also appearsto be substantially higher than that of female employees or males ofeither occupation (Meager, Court and Moralee, 1996). This is likelyto reflect, in part, the greater incidence of part-time self-employmentamong females than males. And self-employment appears to be a lessfruitful vehicle for upward earnings mobility for American females thanmales (Holtz-Eakin, Rosen and Weathers, 2000).
4.2.3 Conclusion
Despite its intrinsic interest and importance, the subject of female en-trepreneurship has arguably not commanded the degree of research effortthat it deserves. Little is known about precisely why there is less femalethan male entrepreneurship, why it is growing in popularity and whyself-employed females earn so much less on average than either femalesin paid-employment or males in self- and paid-employment. Aronson(1991) concluded that female self-employed and employed workers havesimilar characteristics, and conjectured that they differ in their attitudesto ‘independence’ and in their taste for leisure relative to income. Thismay partly explain the evidence that being married and having childrenare such important determinants of female self-employment. However,because tastes and attitudes are difficult if not impossible to observe andquantify, it looks as though sharp tests of this conjecture will be hard todevise.
4.3 Immigration and entrepreneurship
It has been suggested that immigrants are likelier than native-born work-ers (‘natives’ henceforth) to be entrepreneurs, for the following reasons.1. On average, immigrants are better educated and motivated than na-
tives.2. Immigrants have access to ‘ethnic resources’ and social capital (Light,
1984), including a tradition of trading, access to low-paid and trustedworkers from the same ethnic group and access to a ready market ofniche products within an ethnic enclave.
3. Some immigrants are ‘sojourners’, who wish to immigrate temporarilyin order to accumulate wealth before returning to their homeland.Entrepreneurship may be the most effective means to this end.
4. Immigrants turn to entrepreneurship because of ‘blocked mobility’ inpaid-employment, owing to language difficulties, discrimination, orpossession of non-validated foreign qualifications.
5. Immigrants are self-selected risk takers by virtue of their willingnessto leave their homeland to make their way in a foreign country.

130 The Economics of Self-Employment and Entrepreneurship
6. Among illegal immigrants, entrepreneurship in the form of self-employment may be a means of escaping detection by the authorities.
7. Immigrants enter industries and occupations that have high rates ofentrepreneurship.Empirical studies, which invariably measure entrepreneurship as
self-employment, have generated diverse findings about the role ofimmigration. Borjas (1986) and Lofstrom (2002) claimed to find higherself-employment rates among immigrants than natives in the USA, whileBrock and Evans (1986) found no such pattern. All of these studies usedUS Census data. Part of the problem may be one of classification: Light(1984) emphasised the diversity of self-employment experience amongimmigrants by ‘home’ country, which he attributed to different traditionsof commerce. This theme was taken up by Yuengert (1995), whose analy-sis of 1980 US Census data indicated that immigrants from countries withrelatively high self-employment rates are likelier to become self-employedin the US.16
The roles of some of the factors listed above have also been challenged.Regarding 2 above, Bates (1997) showed that most immigrant businessowners obtained most of their finance from their personal wealth and frommainstream lenders, rather than from social resources. Immigrant busi-nesses depending on the latter tended to be ‘marginal’ and more prone tofailure. Regarding 3, it does not necessarily follow that entrepreneurshipis a better way of getting rich than paid-employment. While some studieshave claimed that immigrants do better in self-employment than in paid-employment (Borjas, 1986; Lofstrom, 2002), the income experiences ofimmigrants can vary considerably, and sometimes entail disadvantage(Borjas and Bronars, 1989; Portes and Zhou, 1996). An important as-pect to this debate appears to be duration of residence in the host country.Both Brock and Evans (1986) and Lofstrom (2002) found that longer self-employment spells in the host country by immigrants eventually reverseinitial earnings disadvantage relative to natives – in contrast to immi-grant employees whose relative earnings disadvantage tends to persistthroughout their lifetimes.
Another problem for the sojourner theory is that many immigrants ul-timately choose to remain in the host country, whatever their originalintentions were. Fairlie and Meyer (1996) found that immigrants whohad been in the USA for over thirty years had higher self-employmentrates than immigrants who had been in the USA for less than ten yearsand who were presumably more likely to be sojourners (see also Lofstrom,2002). Immigrant self-employment rates that increase with length of res-idence might reflect not only the positive income-duration relationshipmentioned above, but also other factors. These might include (i) greater

Ethnic minority and female entrepreneurship 131
knowledge of labour markets, tastes of ethnic groups and institutionswithin the host country; (ii) accumulation of wealth required for entryinto entrepreneurship; and (iii) greater access to factors of production.
When studying length of residence effects it appears important to dis-tinguish between ‘assimilation effects’, which capture the extent to whichindividuals within a given cohort assimilate into the host country, and‘cohort effects’, which capture the possibility that cohorts differ in qual-ity. To disentangle the two effects, Borjas (1986) suggested the followingdecomposition. Let pt, j denote the predicted probability of entrepreneur-ship for a representative member of cohort j at time t, and let pt, j+10 bethe probability of entrepreneurship at t for a representative member of acohort who arrived ten years later (say) than members of j . Then
pt, j − pt, j+10 = (pt, j − pt−10, j
) + (pt−10, j − pt, j+10
)(4.5)
measures the cross-section difference between members of different co-horts at t. The first term on the RHS of (4.5) measures the ‘within cohortj ’ change in entrepreneurship probability since year t − 10 (‘the assimila-tion effect’). The second term measures the change in entrepreneurshipprobability for immigrants with the same number of years’ experiencesince immigration (the ‘cross-cohort effect’).
Borjas recognised that (4.5) could be biased if changing aggregatelabour market conditions altered the attractiveness of entrepreneurshipfor everyone. To control for secular changes in broader labour marketconditions, Borjas suggested decomposing changes in immigrant en-trepreneurship relative to native-born entrepreneurs, the latter being denotedby subscript j ′:
pt, j − pt, j+10 = [(pt, j − pt−10, j
) − (pt, j ′ − pt−10, j ′
)]+ [(
pt−10, j − pt, j+10) − (
pt−10, j ′ − pt, j ′)]
. (4.6)
The first term in square brackets is a refined measure of the assimila-tion effect. It measures the change in entrepreneurship propensities ofa given cohort net of the change experienced by a similar native-borncohort. Likewise, the second term measures the cross-cohort effect onentrepreneurship propensities net of economy-wide changes experiencedby native-born workers between t − 10 and t.
Using a sample of US Census data on male workers, and selectingt = 1980, Borjas reported substantial variation in the magnitude of thetwo terms of (4.5) and (4.6) across ethnic groups. Yet two common fea-tures held for almost all groups. First, the first term on the RHS of (4.6)indicated a strong assimilation effect, suggesting that the relative attrac-tiveness of self-employment increases the longer the individual has been
132 The Economics of Self-Employment and Entrepreneurship
living in the USA. Second, the cross-cohort effect (the second term) usu-ally indicated a greater propensity for more recent immigrant cohorts tochoose self-employment relative to earlier cohorts. This is reflected inthe higher self-employment rates among more recent immigrants, whichis consistent with the notion that more recent immigrants to the USAhave been of lower average quality, at least in terms of their employmentopportunities in the ‘formal’ labour market.17
An advantage of Borjas’ decomposition technique is that it sepa-rates two important and distinct aspects of immigrant self-employmentpropensities. But it has yet to be widely adopted by researchers in the field.
NOTES
1. Most of the available evidence pertains to these two countries. Evidence is oftwo sorts: tabulations from micro data, and estimations of self-employmentprobit regressions in which ethnicity is represented by dummy variables whileother personal characteristics are controlled for. Examples of the latter includeRees and Shah (1986), Dolton and Makepeace (1990), Taylor (1996) andClark and Drinkwater (1998, 2000) for the UK; Long (1982a), Gill (1988),Tucker (1988) and Hout and Rosen (2000) for the USA; and Blau (1985) andVijverberg (1986) for Malaysia.
2. In contrast, employers do appear to discriminate against individuals of allraces with previous criminal convictions, who are significantly associated withgreater self-employment propensities: see Fairlie (2002) for evidence from theNational Logitudinal Survey of Youth (NLSY).
3. See, e.g., Myrdal (1944) for an account of the proliferation of black personalservice companies that catered specifically for black Americans in response towhite consumer discrimination in the first half of the twentieth century.
4. This second assumption, which can be relaxed, implies that P(NM, M) =P(M, M) in (4.1) below.
5. For example, of Asian-immigrant entrepreneurs operating young firms in1987, 58 per cent were college graduates (compared with 38 per cent ofnon-minority business owners), with an average start-up capital of $53,550compared with just $31,939 for non-minority business owners. Bates (1985)also observed that the most successful minority entrepreneurs were locatedoutside the ‘traditional’ personal service and retail sectors.
6. Cultural factors might deter female ethnic self-employment in particular. Clarkand Drinkwater (2000) found that in Britain, ethnic female self-employmentrates were substantially below those of males, except among Chinese people.
7. See also Fairlie and Meyer (2000), who found that relatively low black self-employment rates in the USA could not be explained by a concentration ofblacks in low self-employment industries. In a similar way, Hout and Rosen(2000) were unable to explain black–white self-employment rate differentials interms of family background. Different decompositions to (4.3) have been sug-gested by Clark and Drinkwater (1998), Clark, Drinkwater and Leslie (1998)and Borooah and Hart (1999), but with similar qualitative findings.

Ethnic minority and female entrepreneurship 133
8. But see Bates (1997), who had greater success in explaining high black busi-ness exit rates, especially in terms of low levels of capital inputs.
9. As well as Devine (1994a, 1994b), see also Robinson and Sexton (1994),Carr (1996) and Cowling and Taylor (2001). Some rare contrary evidencethat marital status is unimportant comes from a study by Caputo and Dolinsky(1998), who controlled for many household level variables – see below. Onthe importance of the presence of children, see Macpherson (1988), Evansand Leighton (1989a), Connelly (1992), Boden (1996), Carr (1996), Caputoand Dolinsky (1998) and Wellington (2001).
10. See also Macpherson (1988), who reported a significant positive effect onthe probability of self-employment among married American women fromhusbands’ incomes.
11. Calculations made from the BHPS data-set by the present author revealedthat females comprise only 16 per cent of the full-time, but 70 per cent of thepart-time self-employed workforce in Britain.
12. See Macpherson (1988), Evans and Leighton (1989a), Devine (1994a), Bates(1995) and Carr (1996).
13. See also Macpherson (1988), who estimated (1.4) and reported negativeselectivity for female employees, implying that their average earnings were lessthan what self-employed females could have obtained in paid-employment.
14. For contrary evidence that gender has an insignificant effect on business sur-vival rates, see Kalleberg and Leicht (1991) and Bruderl and Preisendorfer(1998).
15. Note that we can alternatively write an analogous expression using β ′f in the
first term of the RHS of (4.4). Since the choice is arbitrary, results based onthis decomposition method should be quoted for both calculations.
16. Yuengert estimated that 55 per cent of the immigrant–native self-employmentrate differential was attributable to immigrants having above-average home-country self-employment rates than the USA. However, other researchershave obtained contrary evidence. Evans (1989) found that immigrantAustralian business owners who were employers were significantly more likelyto have obtained labour market experience in the host country, and signifi-cantly less likely to have obtained it their home country. See also Fairlie andMeyer (1996).
17. It has been suggested that shifts in US immigration policy that have prioritisedfamily issues have been responsible for a decline in immigrant ‘quality’, at leastwhen measured in terms of employment earnings.


Part II
Financing entrepreneurial ventures


5 Debt finance for entrepreneurial ventures
Part I treated the factors that bear on the willingness of individuals totry entrepreneurship. In part II, we recognise that sometimes individualshave limited opportunities to become entrepreneurs, because of difficul-ties raising sufficient finance to purchase the working capital, market-ing services, initial living expenses and other miscellaneous requirementsneeded to establish a business.
Most start-up finance in developed countries tends to be personal eq-uity (‘self-finance’), i.e. finance supplied by the entrepreneurs themselves.For example, according to the Bank of England (2001), 60 per cent ofstart-up businesses in Britain use self-finance. The remaining funds areraised from external sources. According to the Bank, about 60 per centof external finance is raised through debt-finance contracts (comprisingoverdrafts and term loans) followed by asset-based finance (e.g. leasing:around 20 per cent). A similar picture applies in the USA, where banksalso issue most debt finance. Also important is family finance, at around10 per cent of external finance on average, whereas venture capital (eq-uity finance) tends to play only a very minor role for most entrepreneurs(between 1 and 3 per cent). This chapter focuses on the implications forentrepreneurship of raising debt finance. Chapter 6 deals with variousother sources of finance.
If lenders and entrepreneurs were both perfectly informed about all as-pects of new entrepreneurial ventures, and if financial markets were flexi-ble and competitive, then all ventures with positive net present value (npv)would be funded. Also, it would not matter if lenders or entrepreneursundertook the ventures. However, this idealised scenario rarely obtainsin practice. Many entrepreneurs complain that they are unable to obtainenough funding, or sometimes any funding at all, for what they believeare viable ventures. (These groups claim to be ‘credit rationed’.) Anotherpossibility is that imperfections in the capital market cause there to betoo few, or too many, entrepreneurs in equilibrium, judged in terms ofefficiency or social welfare.
137

138 The Economics of Self-Employment and Entrepreneurship
The present chapter investigates these issues. Along the way, the roleof collateral, loan sizes, lender–borrower relationships and group lendingwill also be discussed. We will leave aside topics such as what lenders andborrowers think about each other, what induces entrepreneurs to applyfor loans and how entrepreneurs can write business plans to improvetheir chances of successfully obtaining a loan. These issues are coveredin any number of texts within the Business and Management literature.For notational brevity, lenders will be referred to simply as ‘banks’ hence-forth, and any new entrepreneurial investments, whether undertaken byincumbent entrepreneurs or new entrants, will be called ‘ventures’.
This chapter emphasises the importance of asymmetric informationfor the debt finance of new ventures. Information is often asymmet-ric because while entrepreneurs may have accurate information aboutthe quality of their risky proposed ventures and their ability and com-mitment to expedite them, banks often cannot perfectly distinguish thequality of loan applications from each other. Reasons include the lack ofa track record for new ventures and prohibitive costs of acquiring reliableinformation about them. There is no equivalent institution to a creditrating agency for entrepreneurs; banks have to rely on their own imper-fect screening devices. It will be assumed below that although banks canscreen entrepreneurs into groups defined by some observable character-istics, there is invariably also some residual imperfect information thatforces them to pool, at least initially, heterogeneous risk types togetherwithin each group.
There is now an extensive economic literature on the efficiency of debtfinanced ventures in general, and on credit rationing of entrepreneurs inparticular. Credit rationing has also received considerable attention inpolicy circles, at least since the publication of influential reports by theFederal Reserve System (1958) in the USA, and the ‘Bolton’ and ‘Wilson’reports (HMSO 1971, 1979) in the UK. These reports contended thatthere was a general shortage of financial capital to fund new start-upsand expand existing small businesses. The reports prompted the creationof government-backed loan guarantee schemes for small firms, describedand evaluated in chapter 10, subsection 10.1.1. It is hard to assess theextent to which the views of these reports reflected rather old-fashionedconditions in banking and credit prior to the financial de-regulation ofthe 1980s and 1990s. For example, a subsequent UK government report(HMSO, 1991) concluded that ‘small firms in Great Britain currentlyface few difficulties in raising finance for their innovation and investmentproposals in the private sector’ (1991, p. 17). In contrast, the SBA (1996)reiterated its concern that private capital markets still do not provideadequate start-up finance.

Debt finance for entrepreneurial ventures 139
Credit rationing and under-investment are the subjects of section 5.1.We analyse the possible causes of these two phenomena, their effects onefficiency and the equilibrium number of entrepreneurs and the scopefor corrective action by governments. We then present arguments againstthe phenomena, showing how agents can in principle write contractsto reveal the hidden information and so eliminate the market imper-fection. We conclude the section by evaluating the theoretical case forcredit rationing.1 Section 5.2 discusses the possibility of over-investment,and section 5.3 treats the class of general models that generate multiplesources of inefficiency. Section 5.4 concludes.
5.1 Models of credit rationing and under-investment
We commence with definitions of the salient concepts discussed in thischapter.
Definition 7 (Type I credit rationing). Type I credit rationing occurswhen some or all loan applicants receive a smaller loan than they desire atthe quoted interest rate.
Definition 8 (Type II credit rationing). Type II credit rationing occurswhen some randomly selected loan applicants are denied a loan altogether despitebeing observationally identical to applicants who receive one, and despite beingwilling to borrow on precisely the same terms; and when banks have suchrationing as an equilibrium and optimal policy.
Definition 9 (Redlining). Redlining occurs when a bank refuses to lend toa loan applicant because the bank cannot obtain its required return at anyinterest rate.
Definition 10 (Under-investment). Under-investment occurs when somesocially efficient ventures (i.e. ventures whose expected value is no less thanthat obtained from employing its resources in their best alternative use) are notundertaken.
Definition 11 (Over-investment). Over-investment occurs when somesocially inefficient ventures are undertaken.
The credit rationing typology above follows Keeton (1979). In thecase of Type II rationing, a rationed borrower might offer to pay a higherinterest rate in order to obtain funds; but the last clause of the definitionindicates that this cannot break the rationing outcome.2 For both Types,the interesting manifestations analysed below are ‘equilibrium’ rationingoutcomes. In contrast, ‘temporary’ credit rationing is caused by transientimbalances between the demand for and supply of loans. This case is

140 The Economics of Self-Employment and Entrepreneurship
0
LS
Quantity
Debt repayment, D
Supply
Demand
DmDcr
LD
Lm
Figure 5.1 The supply of and demand for loans
of less interest because such imbalances will eventually be eliminated asmarkets adjust towards equilibrium. Neither temporary credit rationing,nor equilibrium credit rationing caused by governments fixing interestrates below market-clearing levels by diktat (e.g. usury laws), will bediscussed below. The latter ‘beg the question of what basic forces lead toobserved loan market institutions’ ( Jaffee and Russell, 1976, p. 651); andthey are also of limited relevance in most deregulated modern economies.
Figure 5.1 illustrates both types of credit rationing. The interest repay-ment Dm would clear the market for credit, but the actual interest rate isstuck at Dcr < Dm, with an excess demand for funds of LD − LS. In thecase of Type I rationing, LS is the offered loan size for an individual: LDis the desired loan size. In the case of Type II rationing, LS is the numberof entrepreneurs who obtain a loan: LD is the number of loan applicants.Reasons why the interest rate may not rise above Dcr to Dm to eliminaterationing are explored for each of the two cases below.
5.1.1 Type I credit rationing
Models of Type I credit rationing have a long pedigree (see Baltensperger,1978, for a survey of the early literature). We briefly summarise andcritique some of the best-known ones:

Debt finance for entrepreneurial ventures 141
1. Banks charge a single interest rate to heterogeneous borrowers ( Jaffeeand Modigliani, 1969). Then entrepreneurs with ventures embodyingabove-average risk must receive smaller loans than they desire (seealso Cukierman, 1978). However, it is unclear what constrains banksto charge only one interest rate. If banks were free to charge any interestrate, then competition would force them to charge different rates fordifferent entrepreneurial types, to reflect their different risk profiles.Even if for some reason they were unable to charge different rates,presumably non-interest loan terms would be a cheap alternative wayof separating heterogeneous borrower types (Baltensperger, 1978).
2. Bankruptcy costs (Barro, 1976; Jaffee and Russell, 1976). In Barro’smodel, entrepreneurs post collateral, which they are willing to forfeitin default states if it is less than the value of their debt repayments.But bankruptcy costs mean that banks can recover only a fraction ofdefaulting entrepreneurs’ collateral. Higher loan sizes increase the in-centive for entrepreneurs to ‘take the money and run’, which eventuallygenerates such high bankruptcy costs that banks have to place a ceilingon loan sizes to break even (see also Keeton, 1979; Koskela, 1983; andGale and Hellwig, 1985).
In Jaffee and Russell’s (1976) model, entrepreneurs do not postcollateral but suffer some fixed personal penalty (guilt, perhaps) ofdefaulting opportunistically. An entrepreneur defaults if the debtrepayment exceeds their default penalty. Because greater loan sizes in-volve greater mandated repayments they are also associated with moredefaults. Competition among banks forces the loan size below en-trepreneurs’ desired levels, since this reduces the interest rate they mustcharge to break even, while reducing the number of defaults. Hencethe competitive equilibrium is characterised by Type I rationing of allborrowers – which, moreover, is sufficiently severe that in equilibriumno-one defaults.3 This no-default outcome appears unrealistic. Also,it is troubling that a stable market equilibrium does not actually existin this model (Besanko and Thakor, 1987a). Furthermore, Milde andRiley (1988) pointed out that the term ‘rationing’ might be a misnomerin the Jaffee–Russell model. Rationing occurs when the demand for aproduct of given quality exceeds supply; that is not the case in Jaffee–Russell, where the risk characteristics of ventures vary with the loansize.4
3. An implicit contract under which risk-neutral banks effectively insurerisk-averse entrepreneurs by replacing an exogenously fluctuating (andhence risky) spot interest rate with a fixed rate that is higher than the av-erage spot rate (Fried and Howitt, 1980). The absence of market clear-ing can result in some entrepreneurs not obtaining their desired loan, a

142 The Economics of Self-Employment and Entrepreneurship
result that is robust to the case where banks as well as entrepreneurs arerisk averse (Olekalns and Sibly, 1992). However, as in other implicitcontract models there is always an incentive for one party to break thecontract, ruling out implicit contracts in competitive equilibrium.
4. Uncertainty (Clemenz, 1986, sec. 5.3). If venture returns are an incre-asing function of loan size then entrepreneurs’ profit is a convex func-tion of loan size, since debt repayments are fixed and entrepreneurs’losses are bounded in bad states of nature. Greater uncertainty increas-es the requested loan size, as entrepreneurs seek to gain from the upsideof managing larger ventures without taking account of the increasein downside risk borne by the banks. Anticipating this, banks limittheir losses by capping loan sizes (see also de Meza and Webb, 1992;Bernhardt, 2000).
5. Type I credit rationing can facilitate efficient contracting underasymmetric information (Besanko and Thakor, 1987b; Milde andRiley, 1988). This idea is explained in subsection 5.1.3.
6. Monitoring costs (Gray and Wu, 1995). The logic here is the same asfor the Barro (1976) model described above.There are several reasons why Type I rationing has received less atten-
tion in the literature and among policy makers than Type II rationing.First, Type I rationing arguably does not capture the sharpest form ofcredit rationing. That is given by Type II rationing, where loans are re-fused altogether. Second, in most models of Type I rationing all borrowersobtain an efficient amount of funds and can still set up in business – soit is not clear that it is in any sense a ‘problem’ to be addressed. Third,the Type I rationing outcome is not robust. It is straightforward to createmodels in which borrowers receive larger loans than they would like – theopposite of Type I rationing. This could occur, for example, if banks’administrative costs depend on the number of loans made rather thanthe size of loans. Then cost minimisation under competitive conditionsobliges banks to make a few large loans rather than many small ones,yielding the required result.
5.1.2 Type II credit rationing and under-investment
Several rather unconvincing reasons have been proposed purporting toexplain why banks might practice Type II credit rationing. First, banksmight be too risk averse to find risky lending worthwhile (Jaffee andStiglitz, 1990). However, this argument is implausible because banks canusually spread their risks over numerous customers, so that risk neutralityis probably a better assumption about banks’ preferences. Second, banksmight ration some loan applicants in order to economise on information

Debt finance for entrepreneurial ventures 143
processing costs that might occur, for example, if applicants can ap-proach more than one bank (Thakor and Calloway, 1983; Thakor, 1996).Third, banks might identify particular loan applicants as inherently dis-honest and almost certain to ‘take the money and run’. Banks wouldthen deny credit outright to these borrowers. Fourth, starry-eyed en-trepreneurs might be over-optimistic about the prospects of their venture(see chapter 3, subsection 3.2.3), and claim to be rationed by objectivebanks that refuse a loan because they would not expect to break even onthese ventures at any interest rate.5 But these last two outcomes resembleredlining more than credit rationing.
More interesting, and arguably more plausible, models of Type II creditrationing are based on asymmetric information about the value of newventures. These models assume that individuals with new investmentventures are heterogeneous in a manner which (a) impacts on banks’ ex-pected returns, and (b) is private information to themselves and hiddenfrom banks. Individuals who are ‘good risks’ from the banks’ viewpointcannot credibly signal their ‘type’ because ‘bad risks’ always possess theincentive to untruthfully emulate them. As stated in the introductionto the chapter, it is assumed below that the imperfect information isresidual in the sense that bank screening has already been performed.It is important to be clear about this point, since its oversight has some-times generated confusion (see, e.g., Stiglitz and Weiss’, 1987, response toRiley, 1987).
It is helpful to set out the assumptions used in most of these models.Exceptions will be noted in the text below as and when they arise.A1. Entrepreneurs are heterogeneous; banks do not observe individual
entrepreneurs’ types but do observe the frequency distribution of types.A2. All banks and entrepreneurs are risk neutral, i.e. each maximises
expected profits.6
A3. All banks are identical and competitive, making zero profits. This is aconvenient simplification because it ensures that there is neither entryinto nor exit from the capital market. Notice that this assumption doesnot necessitate a countable infinity of banks: Bertrand duopolists whocompete on price (i.e. the interest rate) also generate the competitiveoutcome.
A4. Entrepreneurs undertake only one venture, into which they ploughall their wealth B, and which requires a single unit of capital that isborrowed from a bank.
A5. There is a single period and a stochastic venture return R, which cantake one of two outcomes at the end of the period: R s in the successstate, or Rf in the failure state. R s > D > Rf ≥ 0, where D = 1 + r isthe mandated debt repayment, and r is the risky interest rate.

144 The Economics of Self-Employment and Entrepreneurship
A6. Banks obtain funds from depositors, who are rewarded with a safe(and endogenously determined) gross deposit rate, ρ, where 1 < ρ <
D. The supply of deposits (from outside investors) is an increasingfunction of ρ. Banks therefore compete in both the deposit and loansmarkets.
A7. There is a standard debt contract, which specifies a fixed repayment(henceforth called the gross interest rate, or simply the interest rate) ofD in non-bankruptcy states and requires the entrepreneur to declarebankruptcy if this payment cannot be met. Banks seize Rf in its entiretyin the bankruptcy state. Banks observe venture outcomes perfectly ifthey monitor ex post returns. Banks optimally monitor all and onlydefaulters, so there is no incentive for entrepreneurs to default (‘takethe money and run’) unless the outcome is Rf .7
A8. Entrepreneurs get:8
max{R − D, −B} . (5.1)
A9. Individuals can choose between entrepreneurship (in which they ob-tain the uncertain return (5.1)), and safe investment.
A10. All prices are perfectly flexible and all agents optimise.
The Stiglitz–Weiss modelThe most influential model of Type II credit rationing is that of Stiglitzand Weiss (1981) (hereafter, SW). SW considered a set of ventures withthe same expected return, but heterogeneous risk, described by a parame-ter θ . Denote the density and distribution functions of returns by f (R, θ)and F(R, θ), respectively, where a greater θ corresponds to greater riskin the sense that this distribution is a mean-preserving spread of one witha lower θ (see Definition 5 in chapter 2). Each entrepreneur operates aventure with a unique θ , which they know but banks do not. Denote thedensity and distribution functions of θ ∈ � by g(θ) and G(θ), respec-tively, defined on the support [0, ∞), where � is the set of entrepreneur(venture) types. Assume Rf = 0 for simplicity. Banks are unable to sep-arate heterogeneous borrowers into type-specific contracts, so they areobliged to pool them together.
Given some interest rate D, define θ = θ(D) as the marginal venture,in the sense that it makes zero expected profits for entrepreneurs:
π(D, θ) :=∫ ∞
0max{R − D, −B} d F(R, θ) = 0 . (5.2)

Debt finance for entrepreneurial ventures 145
Because entrepreneurs’ expected profits are an increasing and convexfunction of R, high-θ types have a greater chance than low-θ types ofreceiving high returns, while limited liability protects the downside if theyfail. That is, ∂π(D, θ)/∂θ > 0. Hence only those with θ ≥ θ will chooseto undertake ventures; the rest eschew entrepreneurship. Differentiate(5.2) to obtain
d θ
d D=
∫ ∞D−B d F(R, θ)
∂π(D, θ)/∂θ> 0 . (5.3)
Thus as the interest rate is increased, the marginal venture becomesriskier, generating adverse selection. That is, a higher interest rate causesthe entrepreneurial pool to be dominated by risky ventures.9 The ex-pected return to a bank is therefore a decreasing function of θ , since thebank gets Rf = 0 and hence makes a loss on a venture if it fails; and theincidence of failures increases as θ increases. This can be seen by writingbanks’ expected portfolio rate of return from lending at D as
ρ(D) =∫ ∞θ(D) ρ(θ, D) dG(θ)
1 − G(θ), (5.4)
where ρ(θ, D) = D[1 − F(D − B, θ)] < D is the expected rate of returnto a venture characterised by (D, θ) given Rf = 0.10 Write ρ := ρ(θ , D) >
ρ ≡ ρ(D) and differentiate (5.4) to obtain
dρ
d D= − g(θ)
1 − G(θ)(ρ − ρ)
d θ
d D+
∫ ∞θ
[1 − F(D − B, θ)] dG(θ)
1 − G(θ). (5.5)
D has two effects on banks’ expected portfolio rate of return. The sec-ond term of (5.5) is positive, capturing the positive effect of a higherinterest rate on bank expected returns. But the first term is negative (by(5.3)), capturing an adverse selection effect. That is, a greater interest re-payment increases the risk of banks’ portfolios, leading to lower expectedbank returns. If the first term outweighs the second, banks’ expected re-turns ρ may eventually become a decreasing function of the interest rateD, as the pool of entrepreneurial ventures becomes dominated by riskytypes. This is illustrated in figure 5.2(a), where Dcr , termed the ‘bankoptimal’ interest rate, is the rate that maximises bank expected profitsand which therefore holds under competition.11 In this case, by assump-tion A6 the supply of funds also becomes a decreasing function of D.This is illustrated in figure 5.2(b), which shows how credit rationing canoccur if there is a ‘high demand’ for funds, and if Dcr < Dm, where Dm
is the ‘market-clearing’ interest rate. Here banks deny credit to L1 − L∗

146 The Economics of Self-Employment and Entrepreneurship
0
(a)
0
Banks’ expected portfolio rate of return, ρ
D
D
Dcr
(b)
DcrD2
L2
L∗
L1
Supply
Low demand
High demand
Number of loans, L
Dm
-
Figure 5.2 Stiglitz and Weiss’ (1981) credit rationing model(a) Banks’ expected returns(b) The market for returns
randomly chosen borrowers who are observationally indistinguishablefrom those who do receive loans. However, if there is a ‘low demand’ forfunds, the market clears at (L2, D2) and credit rationing cannot occur.
A similar result can be obtained in a different model where all en-trepreneurs are identical but can choose between a set of ventures that

Debt finance for entrepreneurial ventures 147
all offer the same expected return, yet which differ in terms of their risk.Then moral hazard may occur: entrepreneurs respond to an increase inthe interest rate by choosing riskier ventures. Then, as in the adverseselection problem, banks’ expected return function ρ may begin to de-crease in D, yielding a bank-optimal interest rate Dcr < Dm. As before,banks may optimally ration credit rather than increase the interest rate toeliminate an excess demand for loanable funds.
Credit rationing is not the only possible market failure in SW’s model.De Meza and Webb (1987, Proposition 5(A)) also showed that, irre-spective of whether or not credit rationing occurs, there is bound to beunder-investment in entrepreneurial ventures in SW’s model as long asthe supply of deposits is non-decreasing in ρ (as assumed in assumptionA6). Thus there will be too few entrepreneurs for the social good, a prob-lem exacerbated if credit rationing exists.12 A subsidy on interest incomecan be recommended because it would increase both the equilibriumnumber of entrepreneurs and social efficiency.
A second source of possible market failure in SW’s model is redlining.13
To see this, suppose for expositional clarity that banks can distinguishbetween three distinct groups of entrepreneurs. The groups are indexedby θ , where θ can be good (g), bad (b) and ‘OK’ (o). Each group hasan interior bank optimal interest rate, denoted by Dθ , and an expectedreturn function ρθ (D). Let ρ∗ denote the deposit rate, which must beunique in a competitive deposit market. As figure 5.3 shows, group gwill be fully served, and so will some members of the marginal group o;but a group b generating returns of ρb(Db) < ρ∗ cannot make a suffi-cient return to enable banks to compensate depositors at any interest rate.Hence no member of group b will obtain funds, even though these venturesmay have above-average expected social returns. This group is redlined.The only solution to redlining is to somehow induce an outward shiftin the supply of funds schedule, since that reduces ρ∗. One possibil-ity is universal government lending (Ordover and Weiss, 1981). How-ever, it does not necessarily follow that such a policy would be welfare-enhancing.
Although it has had an immense impact on the literature, SW’s modelis not immune from criticism. One problem is that SW assumed, ratherthan derived, debt to be optimal form of finance. Subsequent authors(Cho, 1986; de Meza and Webb, 1987) showed that equity is actually theoptimal form of finance in the SW model. Furthermore, if all ventures arefinanced by equity, SW’s competitive equilibrium is first best, without anycredit rationing; and banks optimally randomise rather than fix interestrates as SW assumed (de Meza, 2002). It is therefore necessary to appealto some factor outside the model that favours debt over equity finance ifSW’s results are to remain relevant in a strict sense. That could entail,

148 The Economics of Self-Employment and Entrepreneurship
D 0
ρθ
ρ∗
ρb(D)
ρo(D)
Do DbDg
ρg(D)
Figure 5.3 Redlining
for example, high costs of writing equity contracts. A second criticismof SW is that banks are assumed not to make use of other instrumentsthat convey information about types. The interest rate does not workefficiently because of its indirect effects on the quality of loans; but otherloan terms exist (such as collateral) that might circumvent the problem.This possibility is explored in subsection 5.1.3.
Other models of Type II credit rationingSeveral other models have also generated Type II credit rationing out-comes by suggesting different ways of obtaining interior ‘bank-optimal’interest rates that are lower than market-clearing ones. We list some in-teresting examples below:1. Costly effort by entrepreneurs creates a ‘hidden action’ moral hazard
problem (Watson, 1984). Entrepreneurs expend effort e on their ven-tures, which is unobserved by banks, at personal cost c(e), where c(·)is a convex and increasing function. Generalise assumption A5 so thatventure returns are now outcomes of a continuous random variable R.The distribution function of returns is F(R, e): higher e implies higher

Debt finance for entrepreneurial ventures 149
returns, so Fe := ∂F/∂e < 0. Entrepreneurs repay D if R > D, other-wise they default and the bank seizes the outcome of R. Bank expectedprofits per loan at interest rate D (given effort e) is
π B(D) = D[1 − F(D, e)] +∫ D
0Rd F(R, e), (5.6)
which is increasing in e. Entrepreneurs choose
e∗ = argmax{π(D, e) =
∫ ∞
DRd F(R, e) − D[1 − F(D, e)] − c(e)
},
from which it can be easily shown that de∗/d D < 0. Thus if the inter-est rate rises sufficiently, borrowers reduce effort. By (5.6), this mayreduce banks’ expected profits such that an interior bank-optimal in-terest rate Dcr < Dm may emerge.
2. Free ex post observation of venture returns by entrepreneurs creates a‘hidden information’ moral hazard problem (Williamson, 1986, 1987).Williamson assumed a continuum of venture return outcomes, R ∈[0, Rmax]. Unlike SW’s model, entrepreneurs are assumed to enjoy noinformation advantage over banks about possible venture outcomesex ante: both agents know only the density and distribution functionsof returns f (R) and F(R). But unlike banks, entrepreneurs enjoy theadvantage of costlessly observing the ex post outcome of R. In the usualway, banks optimally monitor ex post all and only ventures that declaredefault. Monitoring is assumed to cost c > 0 per loan but is perfectlyeffective. Bank expected profits are:
π B(D) =∫ D
0Rd F(R) + D[1 − F(D)] − c F(D) . (5.7)
Differentiate (5.7) to obtain
∂π B(D)∂ D
= 1 − F(D) − c f (D) .
Because f (R) > 0 ∀R ∈ [0, Rmax], it followsthat {∂π B(D)/∂ D}|D=Rmax <
0. But if c < 1/ f (0), this implies that π B(D) reaches a maximum forD < Rmax, which in turn implies a bank-optimal interest rate.14
Interestingly, Hillier and Worrall (1994) showed that in this modelan excessive amount of monitoring is performed in equilibrium; the op-timal policy response is to reduce monitoring by reducing the amountof lending. Hillier and Worrall considered several actual policies thatcould achieve this – including introducing credit rationing! However,Xu (2000) subsequently showed that this result is overturned if mon-itoring costs are endogenously determined.

150 The Economics of Self-Employment and Entrepreneurship
3. In an adaptation of the Jaffee–Russell (1976) model discussed earlier,‘honest’ entrepreneurs who resist the temptation to default oppor-tunistically are the first to quit the loans market when the interest rateincreases (Clemenz, 1986). This adverse selection may decrease thebank’s expected profits such that an interior bank-optimal interest ratemay emerge.
4. Type II credit rationing can facilitate efficient financial contractingunder asymmetric information (Besanko and Thakor, 1987a). Thisidea is explained in subsection 5.1.3.This is not meant to be an exhaustive list of models that generate Type II
credit rationing. In fact, some additional ones, discussed in section 5.3,generate multiple sources of inefficiency, including the possibility of creditrationing. The fact that Type II credit rationing can be generated in a va-riety of ways might be taken as a sign of theoretical robustness. However,it should be stressed that credit rationing outcomes are not bound to oc-cur even in these models. That is, there are plenty of sufficient but nonecessary conditions for credit rationing to exist. For example, if adverseselection or moral hazard effects are very weak, then bank expected re-turn functions will not deviate sufficiently from a monotonic increasingfunction to permit an interior bank optimal interest rate to arise. And,as we saw above, if there is a limited demand for funds, credit rationingmight not occur even if there is a bank-optimal interest rate.
5.1.3 Arguments against the credit rationing hypothesis
The models outlined in the previous subsection are far from the onlyones that treat the relationship between entrepreneurs and banks. It is astraightforward matter to propose plausible alternatives that generate onlymarket-clearing outcomes (e.g. de Meza and Webb, 1987). Also, there aregrounds for questioning how widespread credit rationing can be in prac-tice when sources of finance other than debt contracts (e.g. trade credit,equity finance and leasing) are available. The argument in this subsectionis that the theoretical case for credit rationing is not unassailable.
Below we describe a direct attack on the credit rationing hypothesisbased on the idea that rationing can be eliminated by writing more sophis-ticated financial contracts that reveal the hidden information on whichit depends. The key concept here is that agents have incentives to devisecontracts that break equilibria in which good and bad risks are pooledtogether (‘pooling equilibria’), replacing them with equilibria in whichgood credit risks separate themselves from bad risks and thereby obtain alower interest rate (‘separating equilibria’). For expositional ease, much ofthe discussion will work with just two entrepreneurial types, a good typeg and a bad type b. The precise aspects that make them ‘good’ or ‘bad’

Debt finance for entrepreneurial ventures 151
Debt repayment, D
Another bad, BAD
Jb Jg
Γb
Γg
πb
πg
BADg0
Dg
Db
Figure 5.4 The use of two-term contracts to separate hidden types
are unimportant here; it suffices merely to think of g being less prone todefault than b. The population shares of the two types will be assumedfixed and known; it is the identities of each individual that cannot beobserved by banks.
Consider figure 5.4 for the case of borrowers b and g and two contractterms: the gross interest rate, D, and another ‘bad’ (from borrowers’perspective), denoted BAD. It might help fix ideas to think of collateralposted by entrepreneurs at the bank’s request as an example of BAD.Indifference curves Jb and Jg in (D, BAD) space show how the differ-ent borrowers are prepared to trade off one bad for another. Indifferencecurves closer to the origin are associated with higher borrower utility. Thekey point is that the different borrowers have differently sloped indiffer-ence curves. Good borrower types g have flatter indifference curves thanbad types b because they are more likely to succeed and have to repay

152 The Economics of Self-Employment and Entrepreneurship
the bank D – and hence are more willing to endure more of BAD (e.g.risking more collateral) in return for a lower D. Conversely, bs are lesswilling to incur the cost of more BAD in return for a lower D becausethey are more likely to default and thereby avoid repaying D.15 Crucially,if Jb and Jg cross only once (the so-called ‘single-crossing property’),then contracts �b = (Db, 0) and �g = (Dg , BADg) separate types and areconsistent with banks’ iso-profit lines πb and πg . That is, g would prefera contract (D, BAD), just to the right of �g along πg , in preference to�b; but b would prefer �b to that contract. Hence if banks offer these twocontracts – and under competition they must offer these contracts16 –then each borrower type will self-select into the one that maximises theirutility, so revealing their type. This equilibrium is incentive-compatible:each type does best under the contract that reveals their type. Masquerad-ing as a different type will result in a lower payoff and so will not bechosen.
What this shows is that, in principle a richer contract than one basedon interest rates alone can separate types. Type separation removesall information asymmetries and hence the possibility that asymmetricinformation-induced credit rationing can occur. This analysis readily gen-eralises to more than two types. For example, with three types, threedifferent (D, BAD) contracts can be offered that accomplish separation.However, with two or more dimensions of unobserved borrower het-erogeneity, more than two contract terms are needed to separate types.For example, with two dimensions of heterogeneity (e.g. different en-trepreneurial abilities and different venture risks), contracts might needto specify an interest rate, collateral, and a suboptimal loan size, say. Butthe principle remains essentially unchanged. In the limit, one can imaginebanks enriching the menu of contracts with as many contract terms asit takes to reveal all the hidden information. In practice, of course, theenvironment may be too complicated for banks to effectively sort out theheterogeneous types – or they may run out of effective instruments. If so,some asymmetric information will remain, so the pooling of at least sometypes with the possibility of credit rationing is restored. But clearly, banksand the ablest entrepreneurs have incentives to search for new contractterms to reduce the occurrence of pooling, the former because of thedictates of competition, and the latter out of self-interest.
Several examples of BADs have been suggested in the literature:� Collateral.17 Collateral is an asset belonging to a borrower that can be
seized by a bank if the borrower defaults. Unlike large established firmsthat can pledge company assets (‘inside collateral’), most entrepreneurscan pledge only their own assets (‘outside collateral’), typically theirhouse. Most models of debt finance assume that banks automatically

Debt finance for entrepreneurial ventures 153
capture inside assets in the case of default, so their explicit analyses ofcollateral tend to be of the outside sort.
Collateral is widespread. Berger and Udell (1990) reported thatnearly 70 per cent of all commercial and industrial loans in the USA aremade on a secured basis, while Cressy (1993) found that 95 per cent ofUK business overdrafts in excess of £20,000 were fully collateralised.However, collateral serves several possible purposes, not just as a screen-ing device, as described above. It can also help persuade sceptical banksabout the worth of ventures (Chan and Kanatos, 1985), and can encour-age entrepreneurs to supply optimal effort (Boot, Thakor and Udell,1991) or to operate a safer venture (Stiglitz and Weiss, 1992). In addi-tion, it enables entrepreneurs to make credible promises about repay-ment (Hart and Moore, 1994, 1998; Hart, 1995), and enables banks toprofitably re-negotiate debt when borrowers default (Bester, 1994).18
� Unlimited liability. Chamley (1983) explored a model in which individu-als are risk averse (so relaxing assumption A2) and can choose betweenlimited and unlimited liability debt contracts. Under symmetric infor-mation, risk-averse entrepreneurs would prefer limited liability becauseit provides insurance. But under asymmetric information high-abilityentrepreneurs might be prepared to endure the BAD of unlimited liabil-ity in order to signal their higher ability to banks. These entrepreneursobtain a lower interest rate to reflect their lower-venture risk, and soa partially separating equilibrium like the one in figure 5.4 can arise.If entrepreneurial ability was fairly homogeneous, the interest rate ad-vantage might be insufficiently attractive, and every entrepreneur wouldchoose limited liability. But in principle, a continuum of contracts spec-ifying varying degrees of limited liability could be devised to perfectlyseparate all types and reveal the entire distribution of entrepreneurialabilities to banks.
� A high initial interest rate in a multi-period setting (Webb, 1991; Bootand Thakor, 1994). Webb (1991) proposed a two-period model inwhich higher ability translates into a higher probability of the ven-ture being successful. Webb showed that even a single observationof entrepreneurs’ performances provides information that can helpbanks separate types. Consider the following two contracts, whose ar-guments specify interest rates for the initial and subsequent periods,respectively: �1 = (D0, D0) and �2 = (D1, (D2|s1) or (D0| f1)), where(D2|s1) < D0 < D1, and where D2|s1 and D0| f1, respectively, denote D2
conditional on venture success in period 1 (s1), and D0 conditional onventure failure in period 1 ( f1). Webb showed that this set of contracts issufficient to induce sorting of types, with gs choosing �2 and bs choos-ing �1.19 The logic is that only gs are willing to pay a high first-period

154 The Economics of Self-Employment and Entrepreneurship
interest rate D1. This is because unlike bs, the gs are genuinely confidentabout their chances of succeeding in the next period and so obtainingthe low repayment D2.
� Joint liability under group lending (Ghatak and Guinnane, 1999; Ghatak,2000; Laffont and N’Guessan, 2000). Banks lend to groups of individ-uals who are made jointly liable for repayment. All group members aretreated as being in default if any one member of the group does notrepay their loan: the BAD is the default penalty levied on the group.Types match together in pairs because although both types prefer tomatch with gs, the joint benefits of so doing are greater for gs becausethey are more likely to succeed. Unlike bad types b, good types g arewilling to accept a high BAD in return for low D. Thus joint liability actslike collateral even when borrowers lack ‘formal’ financial collateral.20
� A sub-optimal loan size (Bester, 1985b; Besanko and Thakor, 1987b;Milde and Riley, 1988; Innes, 1991, 1992; Schmidt-Mohr, 1997).Good types are more willing to waste resources by requesting ineffi-ciently large (or small) loan sizes in order to signal their type.
5.1.4 Conclusion: evaluating the theoretical case for credit rationing
Proponents of credit rationing have responded to the objection that fi-nancial contracting can eliminate the pooling equilibria on which creditrationing depends by making the following observations:1. Screening cannot work if extra contract terms are unavailable. For
example, specifying BAD as collateral will be ineffective if borrowershave insufficient collateralisable wealth. Then pooling and credit ra-tioning can emerge again. This may be an important point because itis known, for example that lack of collateral is one of the major reasonsthat banks refer borrowers to the UK’s loan guarantee scheme.21
2. BAD contract terms might not be monotonically related to prefer-ences, violating the single-crossing property underlying figure 5.4.Examples are plentiful. A simple one is if borrowers differ in theirinitial wealth and the richest are the least risk averse, since then boththose with the safest (i.e. the rich) and those with the riskiest (i.e. thepoor) ventures will offer collateral, muddying the signal (Stiglitz andWeiss, 1981; see also Stiglitz and Weiss, 1992, for another example).Collateral cannot effectively separate different types and the possibilityof credit rationing emerges again.
3. If there is imperfect competition on the supply side of the market, bankscan maximise surplus by means of pooling, rather than separating,contracts (Besanko and Thakor, 1987a).
4. If the number of high-risk types b is not too numerous, the benefitsof screening different types might not compensate for the deadweight

Debt finance for entrepreneurial ventures 155
costs of realising collateral. Banks can do better by offering poolingcontracts than separating contracts, and the scope for collateral toserve as a screen disappears again (Mattesini, 1990).
5. Whether separating or pooling equilibria emerge also depends on theassumed nature of the game between entrepreneurs and banks, es-pecially the timing of the moves of the game, and the definition ofcompetitive equilibrium (Hellwig, 1987).Even without running into these problems, it is possible to suggest
credit rationing itself as a BAD that separates types! (Besanko andThakor, 1987a; Smith and Stutzer, 1989; Gale, 1990a). Suppose en-trepreneurs have no collateral, and that BAD is the probability that banksrandomly ration borrowers. Then gs are willing to take the risk of beingrationed in return for a lower interest rate, whereas bs care less abouta lower interest rate and more about receiving a loan. In effect, creditrationing is the price that gs must pay to signal their types. However, thisargument seems unrealistic. At the very least it is counter-intuitive thatgood risks are rationed, while bad risks are fully funded.22
In summary, a rich profusion of theoretical possibilities exists, enablingcredit rationing to emerge in a number of different ways. To some extent,any effort to complicate contracts by opponents of credit rationing canbe countered by the introduction of new dimensions of unobservableborrower heterogeneity by supporters of credit rationing. It would be de-sirable to take data to the various models to narrow the field of theoreticalpossibilities by discarding some models in favour of others. However, lit-tle progress on this front has been made to date. One obstacle is probablythe maintained assumption that borrower and venture types are unob-servable – which requires the researcher to obtain data on characteristicsthat are unobserved to banks. This point is important but is often over-looked. For example, consider the now pretty well-established evidenceof a positive relationship between venture risk and collateral.23 It mightbe thought that this refutes the screening model, which predicts that lessrisky types pledge more collateral than more risky types (recall figure5.4). But that model assumes that screening based on observable char-acteristics has already taken place. In contrast, the above evidence relatesto a pool of ventures with heterogeneous observable characteristics, inwhich the observably riskiest have to post the most collateral. Thereforethis does not rule out the possibility that collateral does vary within ob-servable groups in a manner consistent with the screening models. Toconvincingly reject the screening model, evidence would be needed of apositive correlation between risk and collateral among ventures that wereobservably identical to banks.
Regarding the criticisms of the credit rationing hypothesis based onefficient financial contracting, it is noteworthy that the available evidence

156 The Economics of Self-Employment and Entrepreneurship
suggests that actual lending rates are not explained by loan success (Cressyand Toıvanen, 1997). Also, banks do not appear to charge very differentinterest rates to even observably heterogeneous ventures.24 This mightbe indicative of pooling in credit markets, in contrast to the separationimplied by efficient contracting. Strictly speaking, however, that conclu-sion does not follow unless every loan term, not just the interest rate, isunrelated to loan success.25
It is certainly the case that credit rationing models are sensitive tochanges in their assumptions. Some researchers apparently believe thatthis casts doubt on the relevance of the phenomenon (e.g. Hillier andIbrahimo, 1993). On the other hand, as Clemenz (1986) has argued, it isvery unlikely that necessary conditions for credit rationing can be foundin any model that remains sufficiently general to be interesting. Further-more, the number of possible mechanisms by which credit rationing canarise can perhaps be regarded as a strength not a weakness of the creditrationing hypothesis, because it expands the set of circumstances underwhich such rationing may occur. Elsewhere (Parker, 2002b), we con-cluded that the present state of the literature on credit rationing demon-strates the following points. (1) The possibility of credit rationing cannotbe generally ruled out. (2) Credit rationing can emerge in a wide varietyof lending environments. And (3) credit rationing models can invariablybe generalised to include features that remove it. Further theoretical re-finements of existing models are unlikely to change any of these points.Instead, the need is for empirical research to address directly the questionof whether credit rationing exists, and if so, to what extent. This issue willbe taken up in chapter 7.
5.2 Over-investment
Implicit in the models discussed so far is a presumption that financingproblems are generally associated with too little entrepreneurship. Thismakes the contribution of de Meza and Webb (1987) (hereafter DW)especially interesting, because these authors proposed a model in whichthe opposite occurs: too much entrepreneurship.
DW utilised several similar assumptions to SW, including the poolingof heterogeneous types with a single contract. The main difference is theassumed structure of returns. DW assumed a continuum of entrepreneurswho differ by managerial ability, θ ≡ x, where a greater ability x is asso-ciated with a greater probability that the venture succeeds, p(x).26 Abilityis exogenous and unidimensional, with distribution function G(x). Asin SW, assume that the return in the failure state is Rf = 0. Each en-trepreneur must invest all of their personal wealth B in the project to

Debt finance for entrepreneurial ventures 157
avoid transmitting an adverse signal about their type.27 We can assumethat this still leaves one unit of capital to be borrowed.
Now x chooses entrepreneurship if
p(x)(R s − D) ≥ ρB , (5.8)
i.e. otherwise they invest their assets B safely, ending with ρB. Themarginal entrepreneur, for whom (5.8) holds with equality, is denotedby x. By inspection, a total of 1 − G(x) higher-ability individuals chooseentrepreneurship. Importantly, the marginal entrepreneur x is of low abil-ity relative to other entrepreneurs. Denote the average success probabilityof entrepreneurs by p, so p > p(x) and pD > p(x)D.
Depositors receive a gross return ρ per dollar loaned, given by
ρ = D
1 − G(x)
∫ ∞
xp(x) dG(x) . (5.9)
Social efficiency requires that all and only ventures are undertaken thatsatisfy the condition p(x)R s ≥ ρB.
DW proved the following results:1. A credit market equilibrium must be market clearing: there can be no
credit rationing.28
2. In the competitive equilibrium more ventures are undertaken than issocially efficient.29 This is DW’s ‘over-investment’ result: resourceswould be more efficiently deployed if the least able entrepreneurs can-celled their ventures and became safe investors instead. The reason thisdoes not happen is because under imperfect information the least ableare cross-subsidised by the more able, who consequently find it pri-vately worthwhile to undertake ventures that are socially inefficient.30
DW went on to show that a tax on interest income could restorethe economy to full efficiency. The rationale is that a higher tax in-creases the equilibrium interest rate and hence induces the least ableentrepreneurs to exit. In subsequent papers, this policy was shown tobe robust to the introduction of costly screening (de Meza and Webb,1988); variable venture sizes (de Meza and Webb, 1989); and the ad-dition of ex ante moral hazard a la SW (de Meza and Webb, 1999).
3. All entrepreneurs provide maximum self-finance and (if Rf > 0) debtis the optimal form of finance.31
The policy implications of the DW model are clear-cut. Subsidisingcredit reduces efficiency, a conclusion that is strengthened if there areagency and deadweight costs involved with such subsidies and if poten-tial entrepreneurs are prone to unrealistic optimism (de Meza, 2002).Instead, the appropriate policy is to tax interest income as noted above,

158 The Economics of Self-Employment and Entrepreneurship
or to tax entrepreneurs’ incomes while subsidising non-entrepreneurs.Such policies could even end up increasing the equilibrium number ofentrepreneurs if they improved sufficiently the average quality of the bor-rower pool such that banks could reduce their interest rate and so lend tomore entrepreneurs. However, subsequent work that generalises the basicDW model has challenged the purity of its predictions, finding potentialroles for both credit rationing and under-investment. This work includesde Meza and Webb (1999) and the studies cited in section 5.3. We turnto these now.
5.3 Multiple sources of inefficiency in the credit market
Bernanke and Gertler (1990) added a prior stage to DW’s model inwhich entrepreneurs must engage in costly search activity to locate asuitable venture. The information gathered is private information andgood ventures are pooled with bad ventures at the second stage resultingin over-investment, as in DW. However, the pooling diminishes the re-turn to finding a good venture, which diminishes the incentive to search,and promotes under-investment. Whether the net effect turns out to beunder- or over-investment is ambiguous.
In a different vein, Hillier and Ibrahimo (1992) combined the SW andDW models by allowing individuals to operate ventures with heteroge-neous risks and heterogeneous probabilities of success. These authorsfound that credit rationing, under-investment by some good types, andover-investment by some bad types can all occur individually or simul-taneously. Also, the aggregate level of entrepreneurial investment can begreater than or less than what transpires in the ‘first best’ under symmetricinformation. The possible mixture of these various forms of inefficiencyrules out interest taxes or income subsidies as corrective policies. Instead,Hillier and Ibrahimo (1992) proposed a progressive profit tax with fullloss offset. But this policy can reduce work incentives, and in practicewould require costly monitoring of venture returns by the tax authorities.
De Meza and Webb (2000) proposed another mixture model in whichindividuals have heterogeneous probabilities of success (as in DW, 1987)and can choose riskier ventures in response to an increase in the interestrate (as in SW’s moral hazard problem). Then Type II credit rationing cancoexist with over-investment. An appropriate policy instrument is to sub-sidise non-participation in entrepreneurship. This removes the least ableentrepreneurs from the market and thereby increases banks’ expected rateof return, and the supply of funds. Credit rationing diminishes, and socialwelfare and (paradoxically) aggregate participation by entrepreneurs inthe loans market is increased.

Debt finance for entrepreneurial ventures 159
In these models multiple sources of inefficiency are generated byassuming that venture returns are characterised by two kinds of en-trepreneurial heterogeneity. A different approach allows expected returnsinside and outside entrepreneurship to both be functions of hidden abilityx, with expected return schedules that cross at least twice in (expectedreturn, x) space. (This contrasts with DW’s (5.8), where there is at most asingle crossing.) As we saw in chapter 2, subsection 2.2.3, Parker (2003d)has a model with this property (see figure 2.1(c)). In this model, under-investment by some types, over-investment by other types and Type IIcredit rationing can all occur singly or jointly. The optimal correctivepolicy turns out to be a combination of differential (possibly non-linear)income taxes and an interest rate tax.32 However, as with Hillier andIbrahimo (1992) a practical limitation of this policy is that income taxes,unlike interest taxes, may create disincentives to labour supply that causenew forms of inefficiency to emerge.
5.4 Conclusion
Debt finance for new start-ups has an important bearing on entrepreneur-ship and policy towards it. From an entrepreneur’s perspective, the avail-ability and price of loans, and other contract terms such as collateraland the size of loans, are often of primary importance. The theoreticalliterature reviewed in this chapter showed that when entrepreneurs pos-sess better information about their proposed ventures than banks do, itis possible for efficient contracting between banks and entrepreneurs tobreak down. Either too much or too little finance – and too few or toomany entrepreneurial ventures – can occur from the standpoint of socialefficiency.
The view of this author is that de Meza and Webb’s (1987) model isan especially important contribution to the literature on financing newentrepreneurial ventures. That model challenges the widespread assump-tion that financing problems necessarily lead to too few entrepreneurs.De Meza and Webb showed that it is quite possible for there to be toomany entrepreneurs in equilibrium, and that a suitable government pol-icy for encouraging entrepreneurship might be to deter the least able fromborrowing in the credit market. The importance of this point stems notfrom any claim that this outcome is bound to occur, but instead from itswarning that policy makers should not automatically equate credit marketimperfections with insufficient entrepreneurship, and should not immedi-ately reach for instruments designed to draw marginal individuals into it.
The exposition of the theoretical models in this chapter included dis-cussion of appropriate policy responses where they exist. These responses

160 The Economics of Self-Employment and Entrepreneurship
were diverse, reflecting the diversity of the models. One should certainlynot take the policy recommendations too seriously. Many of the modelsgenerating them are rather fragile, in the sense that altering some of theirassumptions can easily reverse the predicted forms of market failure andhence the policy conclusions. Also, the models are partial equilibriumin nature, and do not take into account broader effects that should beanalysed in a general equilibrium setting (Hillier and Ibrahimo, 1993).However, these caveats have not prevented some policy makers from ea-gerly seizing some of these results, and using them to justify particularforms of intervention such as loan guarantee schemes (see chapter 10,section 10.1).
There would be a better basis for policy recommendations if one couldsort through the various models and identify the ones with the greatestempirical relevance. As noted in subsection 5.1.4, empirical investigationsalong these lines would be valuable but probably fraught with difficulties.Unsurprisingly, therefore, the literature to date has not progressed very farin this direction. Attempting to reject models on the basis of their indirectpredictions is also unlikely to be informative, for the simple reason thatmodels can often be generalised in to better fit the stylised facts whenthey conflict with the original model.33 This problem has also bedevilledefforts to measure the extent of Type I and Type II credit rationing – atopic we explore in chapter 7.
NOTES
1. We do not consider other implications of credit rationing, for example for theperformance of the macro economy (see Blinder, 1989; Jaffee and Stiglitz,1990, sec. 5; and Hillier and Ibrahimo, 1993, sec. 6).
2. As Jaffee and Stiglitz (1990) point out, the inability of individuals to borrowat the interest rate they think is appropriate is not a valid definition of creditrationing. Nor is the situation where borrowers can only obtain a small loanat their desired interest rate, with them having to pay more for a larger loan.Note that Definitions 8 and 9 are distinct because, unlike redlined ventures,rationed ventures are sufficiently productive to be capable of generating highenough returns for banks to at least break even.
3. Allen (1983) endogenised the default penalty by treating it as the present valueof future borrowing opportunities, which are withdrawn from entrepreneurswho default. Type I rationing emerges again. Smith (1983) showed that theoptimal policy in the Jaffee–Russell model is for the government to lend asmuch as is demanded at some appropriate interest rate.
4. For other criticisms of the Jaffee–Russell model, and a reply by its authors, seethe exchange in the November 1984 issue of the Quarterly Journal of Economics.
5. Hillier (1998) clarified the nature of the requisite over-optimism, which is thatentrepreneurs must over-estimate the payoffs in the successful state, ratherthan the probability of success itself.

Debt finance for entrepreneurial ventures 161
6. Risk neutrality permits abstraction from insurance motives for borrowing.This is helpful when evaluating the efficiency of enterprises, though it provesto be informative to relax it below on occasions.
7. In the presence of costly state verification, it is efficient not to monitor non-defaulting ventures. This provides a rationale for debt to be the optimal con-tract. See, e.g., Townsend (1979), Diamond (1984) and Gale and Hellwig(1985).
8. This is sometimes referred to in the literature as the ‘limited liability’ as-sumption. In a legal sense, limited liability means that an entrepreneur whosecompany fails is liable only up to the value of the business assets, i.e. creditorscannot claim their personal wealth. Of course, under assumption A4 individ-uals who fail also lose their personal equity stake, B. Hence ‘limited liability’here means that their losses are bounded at B.
9. Recall Adam Smith: ‘the greater part of the money which was to be lent,would be lent to prodigals and profectors . . . Sober people, who will give forthe use of money no more than a part of what they are likely to make bythe use of it, would not venture into the competition’ (1937). See also Wette(1983), who showed how adverse selection could also occur if banks variedcollateral C while keeping D fixed. Analogous to (5.2), θ is defined as
π(C, θ | D) = −C.F(D − C, θ) +∫ ∞
D−C[R − D] d F(R, θ) = 0 ,
since banks seize collateral C if entrepreneurs default. Total differentiationthen yields
d θ
dC= F(D − C, θ)
∂π(C, θ | D)/∂θ> 0 ,
i.e. an increase in collateral increases the risk of ventures that entrepreneursmust undertake to at least break even.
10. Note that banks’ expected rate of return is equivalent to the deposit rate byassumptions A3 and A6. That is, to attract funds under competition fromrivals, banks must transfer all supernormal profits to depositors.
11. If banks’ expected return function has more than one mode, then SW showedthat credit rationing is still possible if the highest mode occurs for an inter-est rate ≤ Dm, where Dm is the market-clearing rate (see below). The otherpossibility is of two interest rates, where credit at the lower interest rate isrationed, but where all borrowers can obtain funds at the higher interest rate.
12. It is sometimes taken as axiomatic that credit rationing reduces the equilib-rium number of entrepreneurs. But not all models have this property: see,e.g., Boadway et al. (1998) for one that does not.
13. For ‘early’ models of redlining in which the demand for loans was taken tobe exogenous, see Hodgman (1960) and Freimer and Gordon (1965).
14. Hillier and Ibrahimo (1993) point out several advantages of Williamson’smodel over alternative ones, including SW’s. It can explain several ‘real-world’features of financial intermediation, and derives debt as the optimal contract.Also, Williamson’s credit rationing result is robust to even perfect classifica-tion of borrowers into different risk categories.

162 The Economics of Self-Employment and Entrepreneurship
15. For a formal proof in the context of collateral, see Bester (1985a).16. The logic is simple. In a competitive equilibrium, a pooling contract, �p say,
must make zero expected profits. But this involves gs cross-subsidising bs.Hence gs will prefer �g to �p, and any bank not offering �g will lose gs torivals that do. With the departure of gs, the �p contract becomes loss–making,and the only contract that can be offered to bs is �b on which (like �g ) banksbreak even.
17. See Bester (1985a, 1987), Chan and Kanatos (1985), Clemenz (1986) andBesanko and Thakor (1987a). Coco (2000) surveys the literature.
18. On the latter, the value to the bank of bankrupt ventures’ assets may be solow that banks do better re-negotiating debt rather than initiating bankruptcyproceedings. Knowing this, entrepreneurs have an incentive to default evenwhen they are successful. But, crucially, banks can remove this incentive ifthey can seize defaulters’ collateral. Then the benefits of debt re-negotiationcan be realised by both entrepreneurs and banks.
19. In practice, multi-period lending contracts involve bank–borrower relation-ships. Evidence from Petersen and Rajan (1994), Harhoff and Korting (1998)and Berger and Udell (1995) shows that established borrowers benefit fromlower interest rates and lower collateral requirements than new borrowers.This may reflect learning about the entrepreneur by the bank, or could be theoutcome of an effort inducement device (Boot and Thakor, 1994).
However, an issue that is sometimes overlooked in this literature (and whichalso pertains to other finite repeated games) is a dynamic inconsistency prob-lem. Suppose an entrepreneur needs a stream of finance over several periods.If the borrowing relationship has a clear end, borrowers have an incentive todefault in the final period. Anticipating that, banks will not lend in the finalperiod, giving borrowers the incentive to default in the penultimate period.By backward induction, this continues until the mechanism unravels alto-gether – unless there is sufficient uncertainty about the end date, or if thereis well-established progression from one loan tranche to the next.
20. In fact, the result does not depend on assortative matching of types in groups.Armendariz de Aghion and Gollier (2000) showed that group lending stillworks when entrepreneurs are uninformed about each others’ types and pairrandomly.
21. Some 71 per cent of the respondents to a survey by KPMG (1999) cited lackof security as the main reason for using the scheme.
22. In a different vein, Stiglitz and Weiss (1983) proposed a multi-period modelin which banks threaten to ration credit in later periods unless borrowerssucceed in the first period. This induces good behaviour by borrowers andlow default rates. But to be credible, banks must be seen to carry out theirthreat, so some credit must be rationed.
23. See, e.g., Leeth and Scott (1989) and Berger and Udell (1990, 1992, 1995).For example, Berger and Udell (1990) analysed data on a million US commer-cial loans over 1977–88. They measured loan risk in terms of above-averagerisk premia ex ante, and venture risk in terms of poor ex post performance.Both risk measures were positively and significantly associated with greatercollateral. These findings are consistent with the ‘collateral as incentive device’

Debt finance for entrepreneurial ventures 163
model of Boot, Thakor and Udell (1991); with de Meza and Southey’s (1996)model of over-optimistic entrepreneurs; with Coco’s (1999) model where themost risk-averse types choose safe ventures and are less willing to post collat-eral; and with Bester’s (1994) model of debt re-negotiation.
24. According to the Bank of England (1993), 80 (resp., 96) per cent of bankmargins to small firms with turnover of less than £1 million in 1991–2 (resp.,between £1 and 10 million) were between 0 and 4 percentage points (seealso Keasy and Watson, 1995; Cowling, 1998). US evidence points to similarmargins (Berger and Udell, 1992).
25. Black and de Meza (1990) showed that under pooling contracts the moreable entrepreneurs operate safe ventures, depriving the less able in the riskyventure of cross-subsidies and so leaving them potentially inactive. With onlylow-risk ventures funded in equilibrium, limited interest spreads emerge forthis reason rather than because of pooling.
26. More generally, DW’s results hold if entrepreneurs’ returns can be rankedin terms of first-order stochastic dominance, rather than second-order stochasticdominance as in SW (recall Definitions 4 and 6 in chapter 2, subsection 2.2.1).
27. See also Leland and Pyle (1977), who showed that an entrepreneur’s willing-ness to invest in his own venture is a favourable signal of venture quality –although the signal reduces the welfare of risk-averse borrowers who have totake larger stakes in their own firm than they would wish under the ‘first-best’case of perfect information.
28. Proof: If there was an excess demand for funds, all banks could make profitsby increasing D, since from (5.9), bank gross expected returns are unam-biguously increasing in D (noting from (5.8) that the average probability ofsuccess must be an increasing function of D). There is no interior bank-optimal interest rate: increasing D to the market-clearing rate of Dm can al-ways remove any excess demand for funds. Likewise, banks would be forcedby competitive pressures to reduce D to Dm if there was an excess supply offunds.
29. Proof: The marginal entrepreneur x generates an expected loss of [p − p(x)]Dto the bank, i.e. generates expected returns that are less than the opportunitycost of the funds used. This constitutes over-investment.
30. Subsequently, de Meza and Webb (1990) showed that their over-investmentresult is left intact by relaxing assumption A2 to allow entrepreneurs to berisk averse rather than risk neutral, as long as entrepreneurs are not ‘too’ riskaverse. Sufficient risk aversion replaces the over-investment pooling equilib-rium with a separating equilibrium in which the correct amount of invest-ment occurs (but with an inefficient amount of risk-bearing). In contrast,over-investment is replaced by under-investment if assumption A6 is revokedto permit a backward-bending deposit supply curve.
31. Proof: The most able entrepreneurs are the least likely to fail. Therefore theycan supply finance to themselves on better terms than they can obtain in themarket, and prefer paying a fixed-debt repayment to sharing their returnswith equity providers. Less able entrepreneurs must emulate them in theserespects to avoid transmitting adverse signals about their true abilities thatwould separate them into less favourable contracts.

164 The Economics of Self-Employment and Entrepreneurship
32. Another model with heterogeneous outside options is Chan and Thakor(1987). That model does not generate multiple sources of inefficiency, merelypricing out of the market the entrepreneurial types that have exclusive rightsto a valuable outside option.
33. For example, de Meza and Webb’s (1987) model predicts a negative relation-ship between personal wealth and entrepreneurship (see (5.8)) – in conflictwith most evidence on the issue (see, e.g., chapter 7). But a subsequent paperpublished in 1999 by these two authors generalised the model by incorporat-ing moral hazard, with the result that a positive relationship between wealthand entrepreneurship emerges.

6 Other sources of finance
Chapter 5 concentrated on issues relating to debt finance of entrepren-eurial ventures. This broadly reflects the emphasis in the literature. Yetmany start-ups obtain external finance through informal sources, such asloans from family and friends and credit co-operatives. A smaller numberutilise equity finance (venture capital). Part of the interest in studyingalternative sources of finance is that they might be able to fill any gapscreated by credit rationing.
The structure of the chapter is as follows. Section 6.1 explains theeconomics of informal sources of finance, and section 6.2 treats aspectsof equity finance that relate to typical entrepreneurial ventures. We willcite only selectively and sparingly from the extensive corporate financeliterature on risk capital, most of which pertains to large firms. Section6.3 concludes.
6.1 Informal sources of finance
6.1.1 Family finance
In his analysis of the 1992 CBO database, Bates (1997) showed that fami-lies are the most frequently used source of business loans in the USA afterfinancial institutions (mainly banks). Bates reported that 26.8 per centof non-minority-owned businesses used family finance, compared with65.9 per cent who used loans from banks. Among some minority groups,however, family finance was used more extensively than bank finance. Forimmigrant Korean and Chinese business owners, family finance was usedby 41.2 per cent, whereas bank finance was used by 37.4 per cent (seealso Yoon, 1991). For all groups, family loans were of a smaller averagesize than bank loans, although family loans remained an important sourceof funds by value, being worth an average of $35,446 for non-minorityowners compared with $56,784 for bank loans.
UK evidence tells a similar story. According to Curran and Blackburn(1993) and Metcalf, Modood and Virdee (1996), family loans account for
165

166 The Economics of Self-Employment and Entrepreneurship
between 15 and 20 per cent of start-up finance among ethnic-owned busi-nesses in the UK, making it the largest source of funds after bank loans(see also Basu, 1998; Basu and Parker, 2001). Data from other countriestell a broadly similar story. Knight (1985) reported that the followingsources of funds were used by high-tech Canadian firms at the pre-start-up stage: personal savings: 60 per cent, family/ friends: 13 per cent, bankloans: 12 per cent and trade credit: 6 per cent. The importance of familiesand friends for supplying start-up finance appears to be even stronger indeveloping countries.1
What motivates lending within families? Family members may have pri-vate information about borrowers that is unavailable to banks (Casson,2003); and they may able to monitor and exert peer pressure on the bor-rower. For their part, family lenders may be trusted to behave sensitivelyif the entrepreneur encounters difficult borrowing conditions. Familylenders can also serve as loan guarantors to outside lenders (Jones et al.,1994).2 Also, if the borrower stands to inherit the family lender’s estate,then a family loan effectively becomes a mortgage on his own inheri-tance. In contrast, banks are usually unwilling to accept the prospect ofinheritance as security for a loan (Casson, 2003).
Basu and Parker (2001) explored some of the theoretical issues byanalysing a simple two-period model in which there are two familymembers – one borrower and one lender – and an entrepreneurial venturerequiring external finance. Their model recognises some of the ‘stylisedfacts’ that most family loans tend to be interest-free (Light, 1972; Basuand Parker, 2001). Basu and Parker (2001) showed that family membersare generally prepared to supply funds not only if they are altruistic to-wards the entrepreneur, but also if they are selfish. The selfish motive forlending at a zero interest rate arises if the loan entitles the lender to asufficiently valuable option to ‘call in the favour’, and turn entrepreneurthemselves at a later date. Using a sample of relatively affluent Asian im-migrant entrepreneurs, Basu and Parker (2001) claimed to find evidenceof both altruistic and selfish family lending motives. Also, they estimatedthat greater use of family finance was positively associated with an en-trepreneur’s age, the number of hours worked in their business and theemployment of a spouse in the venture. Unsurprisingly, family financewas found to be a gross substitute for bank loans.
Other evidence suggests that family finance is not associated with suc-cessful enterprise, being correlated with low profitability and high failurerates in entrepreneurship (Yoon, 1991; Bates, 1997; Basu, 1998). Thecase for government intervention is in any case not clear-cut. And apartfrom the Dutch government, which offers tax exemptions for family fi-nance, we know of few other policy initiatives in this area.

Other sources of finance 167
6.1.2 Micro-finance schemes
The term ‘micro-finance’ usually refers to small, often non-profit mak-ing, lending schemes, which are targeted at individuals who are un-able to obtain funds from ‘conventional’ banks, usually because theyare too poor to post collateral. Many such schemes are currently inoperation around the world, mainly concentrated in developing coun-tries with under-developed financial sectors. They include the GrameenBank in Bangladesh, BancoSol in Bolivia and Bank Rayat in Indonesia.3
Perhaps the most famous is the Grameen scheme, founded in 1976by Muhammad Yunus, an economics professor. This scheme, whichprovides financing for non-agricultural self-employment activities, hadserved over 2 million borrowers by the end of 1994, of which 94 per centwere women.
Despite their differences, micro-finance schemes tend to share somecommon features, including direct monitoring of borrowers, stipulationof regular repayment schedules and the use of non-refinancing threats togenerate high repayment rates from borrowers who would not otherwisereceive credit (de Aghion and Morduch, 2000). Most of the economicsliterature on the subject has focused on group lending schemes (GLSs)with joint liability, whereby individuals form into groups and are jointlyliable for penalties if one member of the group defaults. The nature ofthe penalty might be the denial of future credit to all group membersif one member defaults (as in the Grameen scheme), or group liabilityfor loans if a member defaults (as in the Bangladesh Rural AdvancementCommittee scheme).
The advantage of joint liability contracts is that they give entrepreneursincentives to exploit local information and exert pressure to disciplinemembers in a manner consistent with the interests of lenders (and, byreleasing funds, thereby also the entrepreneurs). The particular mecha-nisms involved include:1. Mitigation of moral hazard. Group members may be able to monitor
each other in a manner unavailable to banks. For example, membersmay know or live near each other, and share information. Under jointliability each member’s payoff depends on whether other members’ventures succeed, so all members have an incentive to monitor othermembers’ behaviour, and to take remedial action against memberswho misuse their funds (Stiglitz, 1990). For example, group membersmight threaten others with social ostracism if they shirk in a mannerthat invites default, or if they invest in excessively risky ventures.
2. Cheap state verification and repayment enforcement. Group members maybe in a better position than banks to learn about partners’ venture

168 The Economics of Self-Employment and Entrepreneurship
outcomes. Then joint liability can encourage them to exert peer pres-sure to deter partners from defaulting opportunistically in good states.Also, if group members have lower auditing costs than banks, a GLSmay economise on state verification costs. Only if the whole group de-faults will banks incur audit costs, so this arrangement reduces averageauditing costs and enhances efficiency. Indeed, if bank audit costs aretoo high for banks to be able to offer any individual loan contract, aGLS could facilitate lending where none was possible before.
3. Mitigation of adverse selection. Rather than changing borrowers’ be-haviour, as above, joint liability can favourably alter the pool of bor-rowers. The way that this peer selection effect can promote efficientcontracting was briefly discussed in chapter 5, subsection 5.1.3.Some evidence confirms the usefulness of these three mechanisms.
Wydick (1999) found from Guatemalan data that peer monitoring anda group’s willingness to apply pressure on delinquent members were thesalient factors explaining borrowing group performance. And using CostaRican data, Wenner (1995) reported that repayment rates were highestamong groups who actively screened their members via local reputations.
Micro-finance schemes promise several benefits. First, for the reasonsoutlined above, they can lead to improved repayment rates. The availableevidence supports this claim.4 Competitive (or non-profit making) bankscan then recycle the benefit of higher repayment rates to borrowers inthe form of lower interest rates and/or larger loan sizes. This may in turnfurther decrease the severity of asymmetric information problems such asadverse selection, as well as increasing borrower welfare directly. Second,ventures can be undertaken that would otherwise not be undertaken.This can be especially valuable in poor regions, where self-sufficiententrepreneurship promotes development and alleviates poverty – the so-called ‘micro-finance promise’. Third, micro-finance schemes can carryin their train valuable social development programmes such as vocationaltraining, civic information and information sharing to members. Thesehave been found to add substantial value to participants’ venture prof-itability rates (McKernan, 2002).
However, micro-finance schemes can also suffer from drawbacks. First,they can encourage excessive welfare-reducing monitoring by groupmembers (Armehdariz de Aghion, 1999); and the joint liability clausemight encourage excessively cautious investment behaviour. Second,there is no guarantee that a scheme will break even, and subsidies maybecome necessary. Indeed, as Ghatak (2000) warned, joint liability con-tracts might drive out more ‘conventional’ single-liability contracts, un-dermining the viability of conventional loan markets. Third, the transferof risk from banks to borrowers presumably reduces borrower welfare.

Other sources of finance 169
In some theoretical models, it can be shown that the benefits of micro-finance schemes outweigh the costs (e.g. Stiglitz, 1990). But this is nota general property and cannot be assumed to hold universally, notwith-standing some recent evidence of substantial benefits from Bangladeshimicro-finance schemes. On the latter, McKernan (2002) found that par-ticipation in such schemes increased monthly self-employment profits by175 per cent on average. Pitt and Khandker (1998) discovered substan-tial gender differences in Bangladesh, with micro-finance credit havinga significantly greater effect on households in which women rather thanmen were the scheme participants. Pitt and Khandker suggested that thismight be indicative of how access to credit unleashes women’s produc-tive skills that, unlike men’s, are held in check by cultural and religiousrestrictions proscribing formal waged work.
6.1.3 Credit co-operatives, mutual guarantee schemes and trade credit
Credit co-operatives and RoscasCredit co-operatives are voluntary groupings of individuals that obtainfunds from, and allocate credit to, their members. Unlike GLSs, they re-semble banks in that they take deposits from their members as well as ex-tending loans; and the whole co-operative is liable for the debts of a singlemember. While the spread of liability dilutes the incentive to perform peermonitoring relative to GLSs, it does not eliminate it altogether (Banerjee,Besley and Guinnane, 1994).5 Other features of co-operatives are similarto those of GLSs, including the threat of (possibly non-pecuniary) sanc-tions to discourage opportunistic behaviour by their members. However,given their larger group sizes, co-operatives are more vulnerable to co-variant risk, whereby large-scale shocks such as bad weather hit a regionand result in mass default. The problem of size also makes banks waryof dealing with co-operatives that may be prone to collusion among theirmembers who wish to perpetrate a fraud.
Rotating savings and credit associations (Roscas) play a similar roleto credit co-operatives. Rosca members save on a regular basis andperiodically allocate a pot of funds to particular members, either by lotor by bidding. These funds can be used to purchase an indivisible good.This process continues with past winners excluded until everyone haswon the pot once (see Besley, Coate and Loury, 1993). While Roscasexist primarily to facilitate purchases of lumpy consumption goodsby their members, they can also facilitate the accumulation of capitalrequired for business entry.
GLSs, credit co-operatives and Roscas tend to be associated withlow-income communities. Besley (1995) argued that these types of

170 The Economics of Self-Employment and Entrepreneurship
micro-finance schemes decline in importance as economic developmentoccurs, or as the communities involved improve their access to formalcredit markets.
Mutual Guarantee SchemesMutual Guarantee Schemes (MGSs) are private-sector versions ofgovernment-backed loan guarantee schemes (LGSs) (see chapter 10,subsection 10.1.1 for details of LGSs). Like a credit co-operative, a MGSis a voluntary grouping of individuals. But whereas credit co-operativesissue loans directly, a MGS merely guarantees a fraction of any loansmade by banks to its members if the latter default. MGS members pay afee or save in a fund that provides the scheme’s capital. In practice, MGSstake a variety of organisational structures, though they share some fea-tures in common. They tend to be industry-based and located in distinctgeographical areas, potentially enabling peer pressure to be exerted toencourage loan repayments.
MGSs are widespread in Europe, especially in Italy, where over 800exist, with over 1 million member enterprises (Rossi, 1998). The values ofguarantees vary from scheme to scheme, but according to Rossi (1998)the typical guarantee is for between 50 and 100 per cent of members’loans. MGSs are also common in Germany, where they are chartered aslimited liability companies, with capital provided by the banking system,guilds and chambers of trade. Federal and state governments share theresponsibility for guaranteeing up to 70 per cent of loans. The GermanMGSs claim to back loans with lower default rates than conventionalbank loans (OECD, 1998). MGSs started to appear in the UK only inthe 1990s, and their impact has been negligible to date; they are virtuallyunknown in the USA at the present time. It is currently unclear whethertheir existence owes more to underlying informational advantages or tomainly historical factors.
The value to banks of the loan guarantee is recycled in the form of lowerinterest rates charged to MGS members. As with GLSs, MGSs probablyhave an optimal size: small ones are best able to screen loan applicationsand exert peer pressure, but idiosyncratic risks are spread more widely inlarger schemes.6 In practice, MGSs often enhance their effectiveness bypre-screening loan applications, as well as by providing financial adviceand encouraging valuable information sharing among members. A self-selection rationale for MGSs can also be proposed based on the analysisof subsection 5.1.3. The fee paid by members into the scheme can bethought of as a BAD, which ‘safe’ borrower types are more willing to paythan ‘risky’ types in return for a lower interest rate. Thus with a range offees and savings requirements, MGSs can in principle separate types andfacilitate efficient contracting.

Other sources of finance 171
Trade creditAnother potentially valuable source of ‘inside’ local information is tradecredit. Trade credit comprises loans between firms that are used to pur-chase materials and goods in process. According to Acs, Carlsson andKarlsson (1999, table 1.5), the value of trade credit in the USA in 1995was $233 billion, compared with $98 billion for bank loans.
Trade credit might be capable of mitigating credit rationing (Bopaiah,1998). Its use can also convey a favourable signal of creditworthiness tobanks, allowing entrepreneurs to leverage credit that might not otherwisehave been forthcoming (Biais and Gollier, 1997).
6.2 Equity finance
6.2.1 Introduction
Another potential source of funds for some entrepreneurs is equity finance(EF). In contrast to a debt-finance contract, which stipulates in advancea given repayment due to a bank that is invariant to gross returns from theventure, an EF contract entitles a lender to a stake, or share, of a firm’sprofits. Much EF is provided by venture capitalists (VCs), who frequentlymanage several entrepreneurial ventures at any one time, and who areoften actively involved in them to enhance their prospects of success.7
VC profit shares are negotiated on a project-by-project basis, and tend tovary between 20 and 49.9 per cent (Bovaird, 1990). Most professionalventure capital companies attract funds from outside investors, who arelimited partners; VCs themselves are general partners. Outside equityinvestments typically last for between three and seven years. A VC’s aimis usually to sell their stake at the end of this period, through an InitialPublic Offering (IPO) or (more commonly) a trade sale.
There are both ‘formal’ and ‘informal’ private equity providers. Exam-ples of the former include private independent venture funds, corporatesubsidiaries, and special investment schemes. Among informal providersare ‘business angels’, who are high-net-worth individuals willing to investrisk capital in small unquoted companies. Business angels tend to con-centrate on early-stage financing; their role usually declines at later stageswhen more substantial capital funds are needed.
6.2.2 The scale of the equity finance market for entrepreneurs
The USA has the largest formal VC market in the world. In 2001, forexample, over $40 billion of VC funds were invested there, compared withonly $12 billion in Europe (Bottazzi and da Rin, 2002). The US figure was
172 The Economics of Self-Employment and Entrepreneurship
down from its peak of $106 billion in 2000 – a figure that demonstrates thevolatile pro-cyclicality of VC markets. The European market has growndramatically since 1995, and is showing signs of convergence with theUS market. Of particular interest is the growing importance of early-stage VC investments, which are arguably those most closely identifiedwith individual entrepreneurship. Since the early 1990s about one-thirdof US VC investment has been in early-stage projects. In Europe in theearly 1990s the fraction was one-tenth, but by 2001 it had also reachedone-third (Bottazzi and da Rin, 2002).
Evidence on the size of the informal equity sector is less widely avail-able. In the USA and UK it is thought to be about twice that of the formalequity sector, even though the individual deals are on a smaller scale. Ac-cording to Mason and Harrison (2000), the UK’s informal market forstart-up and early-stage venture financing is broadly similar to the sizeof the formal market.8 Wetzel (1987) estimated that there are around250,000 business angels in the USA, of which around 100,000 are ac-tive in any given year. He also estimated that business angels financeover ten times as many ventures as professional VC firms. Wetzel em-phasised a general problem of poor information about investment andinvestment opportunities that can cause poor matches between VCs andentrepreneurs and potentially inefficient investment. Business angels ap-pear to have similar characteristics in the USA and UK, although UKinvestors tend to be less wealthy, investing about half of the sums of theirUS counterparts. UK business angels are also more likely to invest in-dependently rather than in consortia, although similar to the USA eighttimes as many businesses raise finance from business angels than frominstitutional VC funds (Mason and Harrison, 2000).
EF accounts for only a small proportion of external finance for en-trepreneurs in most countries. For example, Bates and Bradford (1992)reported that only 2.8 per cent of US small business start-ups obtainedEF. Its receipt was found to be positively associated with owner educa-tion, age, the amount of self-finance, and a track record in business. Asimilar picture applies in the UK, where EF accounted for 1.3 per centof total start-up finance by the end of the 1990s, down from 3 per centat the start of the decade – despite the strong growth performance of thecompanies that used it (Bank of England, 2001). Indeed, several recentUS studies claim to have detected various beneficial effects from ven-ture capital. VCs’ screening, monitoring and mentoring services lead tofaster professionalisation (Hellmann and Puri, 2002), stronger innovation(Hellmann and Puri, 2000; Kortum and Lerner, 2000), higher growth(Jain and Kini, 1995) and possibly also employment creation (Belke, Fehrand Foster, 2002).

Other sources of finance 173
6.2.3 Factors affecting the availability of equity finance for entrepreneurs
It is natural to ask why EF accounts for such a small proportion of externalfinance for most entrepreneurs. The following reasons can be adduced:1. Financing costs. There are fixed costs of issuing shares and listing on
secondary markets where shares can be traded. Most enterprises nevergrow to a size where these costs are warranted, even for ‘junior’ stockmarkets such as the US NASDAQ, the UK Alternative InvestmentMarket (AIM), or the European EASDAQ. Also, larger deals such asmanagement buy-outs or buy-ins generate greater and more reliablefee income for VCs. Hence simple cost reasons restrict the viability andavailability of EF for many entrepreneurs, especially those operatingthe newest and smallest ventures.
2. Agency costs. The involvement of outside financiers can cause conflictsof interest with entrepreneurs that reduce the latter’s flexibility andimpose costs on all of the contracting agents. This is probably true tosome extent of all financial instruments, but it appears to be especiallypronounced for EF. Entrepreneurs have incentives to take perquisitesthat reduce the outside value of the venture since, unlike debt finance,EF allows entrepreneurs to share the costs with VCs. In response, VCsmonitor the entrepreneur, resulting in both a perceived ‘loss of control’by the entrepreneurs, and agency costs that must be recouped in theform of greater VC equity stakes. If these stakes become sufficientlylarge, entrepreneurs can be discouraged from seeking EF altogether.
3. Information costs. Because entrepreneurs and financiers must co-operate closely once they enter a relationship, each side typically ex-pends a costly search effort. High information-gathering costs canincrease the price of funds beyond the willingness or ability of en-trepreneurs to pay. Also, full disclosure conditions may compromiseconfidential information and encourage competitors to appear whobid away the superior returns of the venture being financed (Campbell,1979). An additional problem occurs if entrepreneurs have more infor-mation about their ventures than lenders do. As was seen in chapter5, if the least able entrepreneurs anticipate limited returns in goodstates, then they will prefer EF to debt finance since they have to shareless with VCs if they succeed while avoiding a certain repayment inbad states. In contrast, abler entrepreneurs prefer debt finance, be-cause they anticipate capturing greater upside returns. Attempting tosell equity therefore conveys a negative signal about an entrepreneur’sability, so entrepreneurs are dissuaded from signalling this by askingfor an EF contract (Ross, 1977; Greenwald, Stiglitz and Weiss, 1984;de Meza and Webb, 1987; Innes, 1993).
174 The Economics of Self-Employment and Entrepreneurship
For these reasons, entrepreneurs operating small firms often prefer toutilise debt finance, for which a cheap, well-established and relativelycost efficient market is available. It might be thought that the problemof costly EF can be circumvented if entrepreneurs approach informal fi-nanciers such as business angels for funds. But the supply of business an-gels may be limited; and imperfect information may frustrate high-qualitymatches between angels and entrepreneurs. Nor does the availabilityof informal EF change the predictions of the ‘pecking-order’ hypothe-sis, according to which entrepreneurs seek funds in an order that min-imises external interference and ownership dilution (Myers and Majluf,1984). This is internal finance followed by debt finance, with EF as a lastresort.
6.2.4 Equity rationing, funding gaps and under-investment
It is sometimes claimed that there is a ‘funding’ or ‘equity’ gap for EF. Theterm ‘equity gap’ should be distinguished from ‘equity rationing’. Theformer is commonly used to refer to a mismatch between entrepreneursand VCs or business angels–for example, because fixed costs make VCsunwilling to supply the relatively small sums required by entrepreneurs.The latter refers to the problem, analogous to credit rationing, wherethere is a persistent excess demand for funds which even competitiveVCs that face low costs are unwilling to satisfy.
It is reasonably straightforward to propose models of equity rationingthat mirror the credit rationing models described in chapter 5. For exam-ple, Hellmann and Stiglitz (2000) modelled debt and equity providerswho compete with each other to finance heterogeneous entrepreneurswho possess private information about both their project risks and re-turns. Hellmann and Stiglitz unified both the Stiglitz–Weiss (SW) andde Meza and Webb (DW) models outlined in chapter 5. Returns in thesuccessful state are given by π = σµ, where the probability of success is(1/σ ), where σ measures risk. Suppose payoffs are zero in the failure state.Then expected returns are (1/σ )π = µ. Entrepreneurs possess heteroge-neous µ and σ values, known only to themselves. It is easy to show thatboth high-µ and high-σ individuals prefer debt finance to EF. Hellmannand Stiglitz (2000) assumed that lenders specialise in either debt financeor EF, and that entrepreneurs cannot use a mixture of both. They thenshowed that credit and equity rationing may occur individually or simul-taneously. The usual culprit of lender return functions that decrease intheir own price (chapter 5) accounts for the possibility of rationing ineach individual market. As in SW, the mechanism is that lenders do not
Other sources of finance 175
increase the price of funds to clear the market because good types mayexit the market such that lenders’ expected profits fall. Hellmann andStiglitz (2000) also obtained the surprising result that competition be-tween the two markets may itself generate the adverse selection that leadsto rationing outcomes. The reason is that if many low-risk entrepreneursswitch between the debt and equity markets, competition induces lendersin one or both markets to reduce the price of funds below market-clearinglevels in order to attract them – so rationing ensues. However, if only EFwas offered, then credit rationing would disappear.
Hellmann and Stiglitz did not endogenise optimal contracts in theirmodel, merely assuming coexistence of banks and VCs. Bracoud andHillier (2000) studied the problem of optimal contracts in a generali-sation of Hellman and Stiglitz’s model, in which expected returns mayvary among entrepreneurs. They showed that a variety of different op-timal contracts is possible, depending on the form of the joint distribu-tion of (µ, σ ). A result of particular interest occurs in a two-type set-up,θ ∈ � = {b, g}, with probabilities of success pg and pb < pg , returns ifsuccessful of Rs
g < Rsb and expected returns Eb(R) > Eg(R). Bracoud and
Hillier (2000) showed that gs will self-select into equity and bs into debtcontracts, and that the equilibrium is first-best efficient. But this resultdisappears if Eb(R) < Eg(R). Then the optimal contract pools the typestogether and whether it is in the form of equity or debt depends on thedeposit rate, ρ.
Greenwald, Stiglitz and Weiss (1984) developed a model in which theleast able entrepreneurs prefer EF and the ablest prefer debt finance (seeabove). Greenwald et al showed that the adverse signal transmitted bychoosing EF can increase the cost of capital sufficiently to deter credit-rationed borrowers from availing themselves of EF altogether. This rein-forces the potential importance of the SW credit rationing result, sinceit rebuts the argument that entrepreneurs who are rationed in the debtmarket can obtain funds elsewhere, e.g., in the form of EF.
Parallel to chapter 5, under-investment is also possible when EF con-tracts are used. There is a special result of interest despite its apparentlylimited applicability to small entrepreneurial ventures. Myers and Majluf(1984) analysed the problem of issuing new equity when a valuable invest-ment opportunity appears. Managers of existing enterprises have moreinformation about both the company’s assets in place and the value ofthe new investment opportunity. Suppose that EF is used to finance thenew investment; that managers act in the interests of their existing share-holders; and that shareholders do not actively rebalance their portfoliosin response to what they learn from the firm’s actions. Then Myers and

176 The Economics of Self-Employment and Entrepreneurship
Majluf showed that a new share issue could reduce the share price by somuch that managers might optimally pass up the new profitable oppor-tunity, causing under-investment. In contrast, the use of internal fundsor risk-free debt finance removes any under-investment, and does not re-duce the share price – so is preferred to EF by managers. However, theseresults are sensitive to the objectives of managers of the enterprise andthe behaviour of shareholders (see also Noe, 1988).
In short, the theoretical literature on equity rationing is inconclusive.On the empirical front, there is little hard evidence of equity rationing.For example, Dixon (1991) reported that 63 per cent of respondents inhis UK VC survey claimed they had more available funds than attractiveprojects in which to invest. This is suggestive of an equity gap rather thanequity rationing.
6.2.5 Policy recommendations
If it was desired to promote EF as a contractual arrangement, then oneobvious policy recommendation would be to reduce new issue costs andsecondary market transaction costs (Stoll, 1984). This might be accom-plished by improving the efficiency of securities markets and by elimi-nating unnecessary regulations. But it is questionable how much scopeexists for this in practice.
It might also be possible to increase the supply of VC funds by re-moving restrictions on the sources of investor finance, as happened inthe case of pension funds in the USA at the end of the 1970s, for exam-ple. Governments might also be able to increase efficiency by subsidisingagencies dedicated to improving information flows and matching betweenentrepreneurs and VCs. However, it is unclear why private sector firmscould not perform this function. Indeed, we are beginning to see theemergence of internet-based matching services in the USA, the UK andother countries.
Governments might also affect the size of the VC industry via tax in-struments. Reflecting the fact that VCs’ rewards are primarily in the formof capital gains, rather than dividends or interest income, one such instru-ment is the capital gains tax (CGT). Poterba (1989a, 1989b) argued thatbecause individuals who are liable to CGT provide relatively little riskcapital, it is unlikely that changes in CGT will have much effect on thesupply side of the market. Also, the impact of CGT on the demand side(i.e. entrepreneurs’ demand for VC) is limited because entrepreneurs candefer their gains and so reduce the effective CGT rate below the statutoryrate. In the light of these considerations, Poterba concluded that CGT isunlikely to have much impact on the size of the VC industry.9 Also CGT

Other sources of finance 177
is a blunt instrument, since the VC industry is just a small part of theCGT tax base. Hence CGT is probably unlikely to offer much potentialfor stimulating the use of EF.
In principle, other taxes might be used to encourage EF. Fuest, Huberand Nielsen (2002) studied the relative roles of corporation tax (CT)and income tax (IT). They argued that reducing CT below IT stimu-lates EF at the expense of debt finance, which is desirable if there isa socially excessive reliance on debt finance. Finally, Keuschnigg andNielsen (2003) and Parker (2003c) studied the effects of taxes on VC fi-nancing behaviour. These authors showed that VCs are liable to providetoo little valuable assistance to entrepreneurs, because by the nature of anEF contract VCs capture only a share of the returns to assistance whilebearing all of the costs. Therefore a subsidy to assistance can be justifiedto restore the level of VC assistance to first-best levels.
6.3 Conclusion
Debt finance is not the only way that capital flows from lenders to en-trepreneurs. Many other sources of finance are also available. We reviewedseveral of them in this chapter, grouped under the headings of informalsources of finance and equity finance.
Our treatment of alternative sources of finance has not been exhaustiveor complete. For example, we did not discuss explicitly the role of creditcards, leasing arrangements or franchising – despite the possibility thatthese might have helped eliminate funding gaps caused by limited bankcredit (Horvitz, 1984). Leasing can be more economical and less riskyfor small firms than debt finance, conferring tax advantages and beingcheaper than buying capital that will not be utilised intensively (Bowlin,1984). Likewise, franchisors have been able to finance expansion by re-quiring franchisees to furnish some or all of the necessary capital (Dant,1995).
What emerges from our discussion of alternative sources of funding isthe wide variety of different financing arrangements that are available tobudding entrepreneurs. Academics and policy makers who express con-cern about credit rationing sometimes appear to overlook this. Even incountries where financial markets are poorly developed, and where aspir-ing entrepreneurs lack even nugatory amounts of collateral, micro-financeschemes have demonstrated the scope to expand financing activities, andto thereby facilitate new-venture creation.
However, it is premature to conclude that the existence of a rich arrayof financing instruments means that all entrepreneurs can and do availthemselves of them in practice. Data are needed to shed light on the

178 The Economics of Self-Employment and Entrepreneurship
extent to which entrepreneurs face borrowing constraints of one kind oranother. That is the subject of chapter 7.
NOTES
1. See, e.g., Bell (1990) and Kochar (1997) for India, and Goedhuys andSleuwaegen (2000) for Cote d’Ivoire.
2. Note that family ownership per se can also confer other advantages, includingimproved access to bank finance (see Bopaiah, 1998).
3. See Huppi and Feder (1990) and Morduch (1999) for reviews of the structure,rationale, costs and effects of various micro-finance schemes. These schemesare also being replicated in poorer rural and inner city areas of developed coun-tries, e.g., Micro-Business International in the USA, the Calmedow Founda-tion in Canada and the ADIE Credit Project for Self-employment in France(Rahman, 1993).
4. According to Morduch (1999, table 3) the overdue rate on Grameen loansaveraged 7.8 per cent over 1985–96, compared with much higher overduerates, some exceeding 50 per cent, for conventional bank loans in comparableregions.
5. See Guinnane (1994) and Ghatak and Guinnane (1999, sec. 3.1) on the originsof credit co-operatives in Germany in the nineteenth century. Key features ofthe German system included screening of members (not all were admitted)and project proposals (not all were financed).
6. According to Hughes (1992), there is also a public good character to MGSs,because the founding firms pay the greatest cost in setting up the loan guaran-tee, which later members can benefit from at lower cost. However, this does notnecessarily provide a case for public support as Hughes suggests, because thereis nothing to prevent incumbents devising ways of forcing future members toshare the costs.
7. VC involvement can take the form of advice and assistance, based on theVC’s own experience and contacts, and access to investment bankers, lawyers,accountants and consultants. Some VCs take a seat on the board of directors,and retain control rights, including the ability to appoint managers and removemembers of the entrepreneurial team.
8. Descriptions of the characteristics and investment practices of business angelsappear in Wetzel (1987) and Gaston (1989) for the USA, and Mason andHarrison (1994, 2000) for the UK.
9. However, subsequent econometric evidence from Gompers and Lerner (1998)detected a significant negative impact on VC commitments from CGT rates,which those authors argued constituted evidence of demand-side effects.

7 Evidence of credit rationing
Chapter 5 set out the theoretical arguments for and against credit ra-tioning, where rationing may be of loan sizes (Type I rationing) or thenumber of loans (Type II rationing). That chapter concluded that the-ory alone cannot determine whether credit rationing exists and howwidespread it might be in practice. Empirical evidence on these issuescomprises the content of the present chapter.
The chapter is divided into three parts. Section 7.1 chronicles tests ofType I credit rationing. After introducing the influential paper by Evansand Jovanovic (1989), we survey the empirical literature. Most of itscontributions are predicated on econometric estimates of a relationshipbetween self-employment participation and personal wealth. Section 7.2provides a critique of this methodology. Section 7.3 treats the empiricalliterature on Type II credit rationing. As in chapter 5, we concentrateon tests of equilibrium credit rationing, not ‘temporary’ or disequilib-rium credit rationing, arising from a temporary excess demand for creditwhile banks adjust their interest rates.1 Reflecting the emphasis in pub-lished research to date, the evidence discussed below focuses on devel-oped economies. The causes and effects of credit rationing in developingcountries tend to be highly country-specific: see, e.g., Levy (1993) andKochar (1997).
At the outset we reiterate a point made in chapter 1: that claims bysurvey respondents should be treated with great caution. In the presentcontext, these are claims that they face credit rationing. For example, ac-cording to Blanchflower and Oswald (1998) and Blanchflower, Oswaldand Stutzer (2001), half of employee survey respondents claiming to haveseriously considered becoming self-employed in the past blamed insuf-ficient capital as the reason for not making the switch. However, thisdoes not necessarily mean that loans were unavailable to these respon-dents. Another survey approach asks business owners whether they regardthemselves as credit rationed (see, e.g., Cosh and Hughes, 1994; Moore,1994; Guiso, 1998). However, this approach is prone to self-serving biaswhereby entrepreneurs might blame banks for inherent shortcomings
179

180 The Economics of Self-Employment and Entrepreneurship
in their loan applications. Asking entrepreneurs what the price of loansshould be is uninformative in any case, since it does not necessarily reflectthe genuine cost of funds.
For these reasons, the empirical tests described below will be based onobserved behaviour rather than subjective beliefs. This introduces its ownproblems, because desired loan sizes (for Type I rationing) and observa-tionally identical ventures from banks’ perspective (for Type II rationing)are difficult or impossible to identify directly in practice. Consequently,actual tests of Type I and Type II credit rationing tend to be indirect innature.
7.1 Tests of Type I rationing
7.1.1 The Evans and Jovanovic (1989) model
An influential paper by Evans and Jovanovic (1989) (hereafter, EJ) stim-ulated a wave of empirical research on Type I credit rationing. EJ as-sumed that entrepreneurs can borrow only up to a multiple γ ≥ 1 oftheir initial assets, B, where γ is common to all individuals. Thereforeentrepreneurs can operate only capital k ∈ (0, γ B). This corresponds tothe case of Type I credit rationing, since banks are willing to extend loansto everyone with some assets, up to some given asset-determined limit,irrespective of the interest rate entrepreneurs are prepared to pay.
EJ assumed that borrowing and production take place in a single pe-riod. Entrepreneurs’ incomes y depend on k via the production functiony = xkα, where x is managerial ability and α ∈ (0, 1) is a parameter. Aconstrained borrower enters entrepreneurship iff their earnings net ofcapital repayments D = (1 + r )γ B (where r > 0 is the nominal interestrate) exceeds their earnings in paid employment, w. This occurs iff
x(γ B)α − (1 + r )γ B > w . (7.1)
If a sample of individuals with given abilities are drawn at random fromthe population, then the probability that they are entrepreneurs is anincreasing function of assets B, as can be verified by differentiating theLHS of (7.1). This is the first of two predictions:1. There is a positive relationship between the probability of entering
entrepreneurship, and assets prior to entering entrepreneurship.2. Wealthier entrepreneurs will operate larger enterprises on average than
poorer ones and so will receive higher incomes.EJ estimated a simple probit model of entry into self-employment con-
ditioned on assets (in levels and squared) – as well as wage experience,education, and assorted personal characteristics. They used NLS data

Evidence of credit rationing 181
on 1,500 white males over 1978–81 who were wage earners in 1976; andreported a positive and significant probit coefficient (p-value = 0.02) oninitial assets. This supports prediction 1. Also, log self-employment in-comes were also found to be significantly and positively related to loginitial assets, supporting prediction 2.
EJ went on to estimate a structural model of occupational choice,borrowing constraints and a managerial ability–assets relationship. Theyestimated γ to be 1.44, and significantly greater than 1; a subsequent es-timate by Xu (1998) based on more accurate data found γ = 2.01. Also,EJ estimated that 94 per cent of individuals likely to start a business facedType I credit rationing. They claimed that this prevented 1.3 per cent ofAmericans from trying entrepreneurship. These are large effects, whichhave encouraged subsequent researchers to explore their robustness.
7.1.2 Effects of assets on becoming or being self-employed
Following EJ, many researchers have used cross-sectional or longitudi-nal data to estimate a probit self-employment equation, including somemeasure of individuals’ assets or asset windfalls among the explanatoryvariables. Others have used time-series data to estimate the effects ofaggregate wealth on the average self-employment rate. Many of thesestudies have detected significant positive effects of personal wealth onself-employment propensities and rates (we will discuss below resultsrelating to asset windfalls),2 while a handful have detected insignificanteffects (e.g., Taylor, 2001; Uusitalo, 2001). Taken at face value, theseresults appear to support EJ’s claims about the importance of Type Icredit rationing.
These results raise a number of questions. First, should researchersstudy the effects of wealth on the probability that individuals are self-employed, or the probability that they become self-employed? Arguably,the most precise effects are obtained by focusing on the latter since es-tablished entrepreneurs could not by definition have faced Type I creditrationing that was severe enough to have prevented their participationin entrepreneurship. Second, studying entry into self-employment avoidsthe charge of reverse causality, whereby the self-employed are wealthybecause of previous success in self-employment. Indeed, it is now widelyaccepted that endogeneity problems render personal wealth variables oflimited value in empirical investigations of Type I credit rationing.
In recognition of this point, several researchers have explored the roleof financial variables that are arguably less prone to endogeneity. Theseinclude asset windfalls of some kind, such as inheritances, gifts, or lot-tery wins, that are presumably exogenous to the self-employment entry

182 The Economics of Self-Employment and Entrepreneurship
decision and that can potentially overcome any Type I credit rationing.Empirical studies have generally found positive, significant and substan-tial effects of windfalls on self-employment status and entry probabili-ties, with diminishing returns from higher windfall values.3 We cite some‘typical’ findings to give a flavour of the results. Blanchflower and Oswald(1998) reported that a Briton who received £5,000 in 1981 prices wastwice as likely to be self-employed in 1981 as an otherwise compara-ble person who had received nothing. Holtz-Eakin, Joulfaiah and Rosen(1994a) reported that a $100,000 inheritance would increase the prob-ability of a transition from paid employment to self-employment in theUSA by 3.3 percentage points. Lindh and Ohlsson (1996) estimated thatthe probability of self-employment in Sweden would increase by 54 percent if lottery winnings were received, and by 27 per cent on receipt ofan average-sized inheritance.
Findings of a positive and significant role for windfalls appear to berobust to some obvious sources of bias. These include self-employedpeople being more willing to gamble on lotteries (the opposite appears tobe the case according to Lindh and Ohlsson, 1996 and Uusitalo, 2001); toinheritances being anticipated or being in the form of family businesses;and to industry differences due to different required capital intensities(Bates, 1995). In fact, true effects from windfalls may be under-statedto the extent that researchers cannot always measure delayed entries intoself-employment following the receipt of a windfall. Entry decisions maytake several years to play out.
7.1.3 Effects of assets on firm survival
As well as facilitating start-ups, personal wealth might also enhance anew venture’s survival prospects. As Holtz-Eakin, Joulfaian and Rosen(1994b) assert: ‘if entrepreneurs cannot borrow to attain their profit-maximising levels of capital, then those entrepreneurs who have sub-stantial personal financial resources will be more successful than thosewho do not’ (1994b, p. 53). Holtz-Eakin, Joulfaian and Rosen arguedthat unexpected increases in wealth (such as inheritance) will make en-trepreneurship more attractive if the alternative is a business operatingwith a suboptimal capital stock. But in the absence of credit rationing,entrepreneurs will presumably operate their optimal capital stocks, so in-heritance may actually make outside options like paid-employment or taxsheltering more attractive, leading to voluntary exit. Hence Holtz-Eakin,Joulfaian and Rosen argued that if inheritance is positively associated withcompany survival this can be taken as relatively strong evidence of TypeI credit rationing.

Evidence of credit rationing 183
Holtz-Eakin (1994b) found that inheritances increase the probabil-ity that self-employed Americans remain in self-employment. Similarresults have been obtained by other researchers using measures of per-sonal wealth rather than windfalls (Bates, 1990; Black, de Meza andJeffreys, 1996; Taylor, 1999; Quadrini, 1999; Bruce, Holz-Eakin andQuinn, 2000), though Taylor (2001) found no effect of inheritances onUK self-employment survival probabilities.
Human capital potentially complicates the argument. On one hand,greater human capital might increase the productivity of physical capi-tal, increasing the desired capital stock and hence the severity of Type Irationing. On the other hand, if education and wealth are correlated,then any rationing constraint might be eased. Cressy (1996) claimed thatfailing to control for human capital endows personal (housing) wealthwith spurious explanatory power in UK business survival regressions.However, US evidence does not support the general contention that fi-nancial inputs are unimportant for explaining survival once human capitalis controlled for.
7.1.4 Effects of assets on investment decisions
Fazzari, Hubbard and Petersen (1988) reported evidence that investmentby large US firms is closely related to cash flow, with greater sensitiv-ity among firms that they considered to be most vulnerable to Type Icredit rationing. Several authors have subsequently replicated these find-ings (see Hubbard, 1998, for a review). However, Kaplan and Zingales(1997) challenged the consensus, arguing that investment–cash flow sen-sitivity does not constitute a useful measure of such rationing.4 Theredoes appear to be a problem with the interpretation of credit rationingin this context. According to Hubbard (1998), firms desire a loan sizeL∗ at the market interest rate r , but because of agency costs arising fromimperfect information, banks are only willing to supply L∗ at a higherinterest rate than r . As Jaffee and Stiglitz (1990, p. 847) emphasise, thisinvolves ‘price rationing’ rather than credit rationing, since firms couldobtain L∗ if they paid a higher interest rate.
7.2 Critique
While some of the evidence outlined in the previous section is consis-tent with Type I credit rationing in principle, other explanations are alsopossible:� Inherently acquisitive individuals both build up assets and prefer en-
trepreneurship to paid-employment, whether or not capital constraints

184 The Economics of Self-Employment and Entrepreneurship
exist. More generally, the wealthy (or those who receive gifts or in-heritances) may for unmeasured reasons be intrinsically more likelyto be entrepreneurs and to remain in entrepreneurship. Alternatively,entrepreneurship allows wealthier individuals to consume leisure moreeasily.
� Inheritances are left to those working hard at developing new businesses.Blanchflower and Oswald (1998) claim that there is little evidence thatbequests more generally are related to recipients’ incomes; but sepa-rate evidence exists of ‘strategic bequest behaviour’, whereby bequestsare contingent on recipients’ behaviour and characteristics (Bernheim,Shleifer and Summers, 1985).
� A positive relationship between the number of entrepreneurs and per-sonal wealth can also be consistent with over-investment, rather thanType I credit rationing (de Meza and Webb, 1999).
� A positive association between start-ups and wealth (or windfalls suchas inheritances and lottery winnings) might simply reflect the ef-fects of decreasing absolute risk aversion (DARA, see Definition 2 ofchapter 2, section 2.2), rather than borrowing constraints. Consideragain the Kihlstrom and Laffont (1979) model outlined in chapter 2,subsection 2.2.4. Under DARA, an increase in the wealth of themarginal risk-averse individual makes them more willing to enter riskyentrepreneurship, so increasing the aggregate rate of entrepreneurship(Cressy, 2000).
� Entrepreneurs prefer self-finance to external finance, perhaps becausethey regard the terms of the latter to be unreasonable. Consequently,these individuals wait until they have saved (or inherited) enough wealthto enter entrepreneurship without borrowing. Yet all the while banksmay have been willing to lend all of the required funds to every loanapplicant.
� On a related point, individuals propose ventures for financing that banksperceive to be unprofitable at the proposed scale of operation. Hencebanks rationally deny as much credit as potential entrepreneurs request.The latter then delay entry until they have sufficient wealth.
� When wealth is plentiful, there is greater entry into entrepreneurshipand the resulting competition discourages those with sufficient wealthyet poor investment projects – implying a higher average survival rate(Black, de Meza and Jeffreys, 1996).
� Distressed firms face higher interest rates and lower credit availability(Harhoff and Korting, 1998). An inheritance or windfall merely relaxesthe entrepreneur’s budget constraint and permits them to survive inbusiness a little longer.There are also reasons to believe that any Type I rationing that does
exist will be limited in scope. According to Meyer (1990), 60 per cent

Evidence of credit rationing 185
of new entrepreneurs have no depreciable capital and so cannot becredit constrained. And entrepreneurs might not be passive victims ofborrowing constraints, having incentives to seek escape routes such assaving (Parker, 2000). To see this, consider the following lifecycle con-sumption model. Entrepreneurs’ incomes y are a concave function of cap-ital k ≥ 0: y = q (k). Let wage income be w, so k = q−1(w) is the minimumcapital needed to attract individuals into entrepreneurship. Financial as-sets B can be costlessly transformed into physical capital k; individualshave heterogeneous asset endowments. The optimal capital stock k∗ is de-fined by the usual marginal productivity condition (∂q/∂k)|k=k∗ = r + α,where r > 0 is the interest rate and α > 0 the rate of depreciation ofcapital.
Suppose that banks constrain borrowing such that individuals withB < k cannot enter entrepreneurship. Individuals with k < B < k∗ dobecome entrepreneurs but cannot attain k∗ immediately. All individualschoose their occupation, physical investment path {dk(t)/dt} and con-sumption path {ζ (t)} to maximise discounted lifetime utility, where δ > 0is the discount rate and U(ζ ) is the (concave) instantaneous utility func-tion. The Lagrangean for this state-space constrained optimal controlproblem is
� = U(ζ )e−δt + (�B + �B)[r B + max{q (k), w} − ζ − dk/dt]
+(�k + �k)[(dk/dt) − αk] , (7.2)
where �B > 0 and �k > 0 are co-state variables; and �B and �k arevariables taking zero values if the credit rationing constraint and the k ≥ 0constraint, respectively, do not bind, and are positive otherwise. From(7.2), the first-order condition for consumption is
∂U∂ζ
= eδt(�B + �B) . (7.3)
Thus a rationed individual (with �B > 0) has higher marginal utilityand hence lower consumption, than an unconstrained entrepreneur (with�B = 0) does. This implies that constrained entrepreneurs optimally in-vest their savings to build up physical capital, allowing them to eitherenter entrepreneurship or to attain k∗ if they are already entrepreneurs.In contrast, unconstrained entrepreneurs have attained k∗ and invest onlyto offset depreciation.
Some supportive evidence for savings as a means of building capitalstocks comes from Quadrini’s (1999) analysis of 1980s PSID data.Quadrini reported that American households with a self-employed headnot only have greater wealth and higher wealth–income ratios on average,but also experience more upward mobility in the distributions of wealthand the wealth–income ratio than employee households do (see also

186 The Economics of Self-Employment and Entrepreneurship
Knight and McKay, 2000, for UK evidence). However, the strategy ofsaving as an escape mechanism has its own limitations. Parker (2000)showed that some individuals will optimally choose to remain creditconstrained forever, if they are so impatient that they prefer consumingwhen young to saving for the future. This implies that, in some cases,borrowing constraints should be regarded as voluntary, rather thaninvoluntary. A second caveat to the escape mechanism is that someemployees may earn too little (i.e. w is too low) to permit them tobuild up sufficient savings to enter self-employment. Also, at very lowlevels of income and consumption, reducing consumption in order toaccumulate assets may not be optimal because it can seriously threatenhealth, production efficiency and longevity (Gersovitz, 1983). While thisproblem might not be widespread in developed economies, it might bemore important in some poor developing countries.
It is now fairly well established that self-employment participation andsurvival rates are both positively related to personal wealth and financialwindfalls. Furthermore, it has been convincingly demonstrated that thesefindings do not merely reflect superior wealth-creating opportunities inself-employment. However, these findings do not of themselves prove theexistence of Type I credit rationing, since several alternative explanationsare also consistent with them. One must conclude that given the presentstate of the literature we have not resolved the vexed question of whetherType I credit rationing exists, and if so, how widespread it is. Sharpertests of the Type I credit rationing hypothesis (possibly based on bankloan application micro-data matched with borrower surveys) are neededbefore any firmer conclusions can be reached.
7.3 Tests of Type II credit rationing
In the absence of Type II credit rationing, interest rates on commercialloans will adjust freely in response to changes in the supply of and de-mand for credit. But if credit rationing exists, that is no longer the case,and commercial loan rates will exhibit ‘stickiness’. This, at least, can beexpected to apply to non-commitment loans, where a commitment loan(CL) is a loan that a bank agrees to allocate to a firm over a specified pe-riod should the latter request it. Contractually, a CL cannot be rationedor withdrawn once it has been granted, so it can be regarded as a hedgeagainst the future hazard of Type II credit rationing.
A problem with interpreting sticky loan rates as evidence of creditrationing is that alternative explanations for this phenomenon also ex-ist. One is Fried and Howitt’s (1980) implicit contract theory, wherebybanks and borrowers agree to fix interest rates for long periods of time

Evidence of credit rationing 187
irrespective of economic conditions. Another is the ‘distressed company’phenomenon, whereby banks prefer not to increase lending rates in linewith base rates if this tips clients into bankruptcy and forces the lenderto incur bankruptcy costs.5
Early studies used aggregate time-series data to test for loan rate stick-iness (e.g. Goldfeld, 1966). More recent work along these lines by Slovinand Sushka (1983) and King (1986) provides mixed evidence on theloan rate stickiness issue. However, the highly aggregated nature of thisresearch is a serious drawback, because it averages over heterogeneousloan types. Micro-data are to be preferred because of their greater de-tail and precision. Berger and Udell (1992), who proposed the followingtests, conducted an especially thorough analysis of the credit rationinghypothesis using micro-data:1. The stickiness test. Consider the following regression:
(r − ρ)i = β1ρi + β2ρ2i + γ ′
1 X1i + γ ′2 X2i + ui , (7.4)
where ρi is the open-market (safe) interest rate for observation i ; ρi isthe equivalent rate defined for the same term as the commercial loanrate ri ; X1i is a vector of loan contract variables; X2i is a vector of bankand macroeconomic variables; and ui is a disturbance term. If thereis loan rate stickiness of r , then a negative net effect from ρi shouldbe observed, since an increase in ρi (and hence ρi ) will reduce theloan premium on the LHS of (7.4) if ri is sticky. The credit rationinghypothesis implies rate stickiness for non-CL cases, but not for CLs.
2. The proportions test. Consider the following regression:
ln(
pc
1 − pc
)i= β1ρi + β2ρ
2i + γ ′
1 X1i + γ ′2 X2i + vi , (7.5)
where pc is the proportion of loans that are CLs. The Type II credit ra-tioning hypothesis predicts that the proportion of CLs is an increasingfunction of ρi (or some other measure of credit market tightness). Thisis because Type II credit rationing reduces the number of non-CLs,while leaving the number of CLs unchanged (since they are contrac-tually insulated from credit rationing) – so increasing pc .6
Based on a sample of a million commercial loans in the USA between1977 and 1988, Berger and Udell (1992) reported the following findings:1. The stickiness test
(a) The elasticity of the premium with respect to ρ was negative andsignificant (–0.19 and –0.34 for nominal and real ρ, respectively),7
implying loan rate stickiness. However, CL rates were also sticky,suggesting that reasons other than Type II credit rationing mustaccount for the observed stickiness.

188 The Economics of Self-Employment and Entrepreneurship
(b) Less stickiness was observed during periods of ‘credit crunch’, con-tradicting the credit rationing hypothesis.
2. The proportions test(a) Doubling the nominal safe interest rate increased the probability
of observing a CL in the sample by 1.7 per cent, supporting theType II credit rationing hypothesis. However, opposite results wereobtained when ρ was measured in real terms, so contradicting it.
(b) In times of credit crunch or low loan-growth rates, the proportionof CLs was observed to decrease. The opposite would be expectedto occur under credit rationing.
On the basis of this evidence, Berger and Udell (1992) concluded that‘information-based equilibrium credit rationing, if it exists, may be rela-tively small and economically insignificant’ (1992, p. 1071). They wenton to suggest that, even if some borrowers are rationed, others take theirplace and receive bank loans.
A direct upper bound estimate of the extent of Type II credit rationingcan be proposed: the number of loans rejected by banks for any reason.If the loan rejection rate is very low, then credit rationing cannot beimportant. Using US data on small-company borrowing over 1987–8,Levenson and Willard (2000) estimated that only 2.14 per cent of smallfirms ultimately failed to obtain the funding they sought. Of course, theactual extent of credit rationing will be lower than this to the extent thatsome of these loans were observably non-creditworthy and so deservedto be rejected.8
In the light of these findings, claims of widespread credit rationingbased on structural models (e.g. Perez, 1998) must surely be treated withscepticism. Other ‘direct’ evidence sheds further light on the Type IIcredit rationing phenomenon. Theories of rationing based on adverse se-lection suggest that bank managers deny credit in preference to raisinginterest rates, even if rationed borrowers are willing to pay higher rates (seechapter 5, section 5.1). National Economic Research Associates (NERA)(1990) obtained direct evidence of reluctance among bank managers toraise interest rates above the bank’s ‘standard’ business rate for observ-ably higher-risk projects. However, NERA found that this reluctance wasmotivated not by concerns about adverse selection or moral hazard, butby anxiety that public relations could be harmed by an image of the bankas a ‘usurer’. It may be noted that the bank managers surveyed had noobvious motive for responding with self-serving bias.
It might be thought that there is an even simpler way to establish theexistence of Type II credit rationing. This is to compare survival ratesof entrepreneurial ventures funded with government-backed loans thatwould not have been granted without the government guarantee, with

Evidence of credit rationing 189
survival rates of ventures that were financed purely privately. If the twosurvival rates are similar, then it might seem possible to argue that thegovernment intervention has alleviated credit rationing. In fact, althoughthere is some evidence that Loan Guarantee Scheme (LGS)-backed start-ups do have similar survival rates as purely privately funded start-ups, thisconclusion does not necessarily follow. The primary role of a LGS is tohelp fund entrepreneurs who lack collateral and/or a track record, and soare observably risky to finance. Banks refusing to finance ventures thatthey expect to be loss making cannot be construed as rationing credit.The whole point of a loan guarantee is to insure banks against most ofthe downside risk, turning some potentially loss making investments intoprofitable lending opportunities. The evidence does suggest that theseare indeed the projects that banks typically put through LGSs (KPMG,1999).
On the other hand, even if Type II credit rationing is empirically unim-portant, the perception of it might discourage potential entrepreneursfrom approaching banks in the first place. Some supporting evidence forthis hypothesis comes from Levenson and Willard (2000), who estimatedthat 4.2 per cent of the individuals in their US sample were ‘discouragedborrowers’. Cowling (1998) provides a similar estimate for the UK.
Overall, the evidence cited above does not provide much support for thenotion that banks engage in Type II credit rationing. However, just as withType I rationing, more research is needed before a clear conclusion can bereached. One interesting empirical avenue that might be worth pursuing isa detailed analysis of the characteristics of rejected loan applications. Thiscould help tighten the upper-bound estimate of Type II credit rationingsuggested by Levenson and Willard (2000), and might even rule out thephenomenon as having any empirical significance whatsoever.
NOTES
1. For empirical investigations of temporary credit rationing and references tothe earlier literature, see e.g., Browne (1987) and Kugler (1987).
2. For cross-section studies, see Evans and Leighton (1989b), Bernhardt (1994),Bates (1995, 1997), Laferrere and McEntee (1995), van Praag and van Ophem(1995), Taylor (1996), Fairlie (1999), Quadrini (1999), Bruce, Holz-Eakinand Quinn (2000), Dunn and Holtz-Eakin (2000), and Johansson (2000).For time-series studies, see Robson (1991, 1996, 1998a, 1998b), Black, deMeza and Jeffreys (1996) and Cowling and Mitchell (1997).
3. See Holtz-Eakin, Joulfaian and Rosen (1994a, 1994b), Lindh and Ohlsson(1996), Blanchflower and Oswald (1998) and Taylor (2001).
4. See also the subsequent exchange between these authors in the May 2000 issueof the Quarterly Journal of Economics.

190 The Economics of Self-Employment and Entrepreneurship
5. Both of these explanations can account for Berger and Udell’s (1992) findingthat up to 7 per cent of US commercial loans over 1977–88 charged interestrates at below the (safe) open-market rate.
6. An exception to this argument, noted by Berger and Udell (1992), could occurin the event of an increase in the demand for non-CLs only. Then creditrationing ensures that there will be no change in pc despite greater creditmarket tightness.
7. Both these and all subsequent estimates quoted below were evaluated at samplemeans. Similar results were obtained using the growth of loan volumes as aninverse measure of credit market tightness.
8. Also, Levenson and Willard (2000) found the probability of loan denial tobe negatively related to firm size, so the extent of credit rationing by valuewas even less than 2 per cent. UK evidence from Cosh and Hughes (1994)tells a similar story to Levenson and Willard (2000). From a sample of firmssurveyed between 1987 and 1989, Cosh and Hughes (1994) reported that only3.2 per cent of firms seeking external finance failed to obtain it.

Part III
Running and terminating an enterprise


8 Labour demand and supply
Considerable policy interest centres on entrepreneurship as a means ofemployment creation. This is one of two labour market-related topics ex-plored in this chapter, the other being labour supply. Section 8.1 brieflyoutlines some evidence on employment by entrepreneurs, the factors thatappear to affect it and the contribution made by small firms to aggregatejob creation. Section 8.2 describes the nature of work performed by en-trepreneurs, their labour supply, their changing participation rates as theyage and their retirement behaviour.
8.1 Entrepreneurs as employers
8.1.1 Evidence about self-employed ‘job creators’
In most countries only a minority of self-employed people hires otherworkers. For example, according to Bregger (1996), only 21 per centof self-employed Americans hired any employees in 1995. Of these, athird had only one employee, and only one-seventh hired six or more. Ofthose who had held second jobs in which they were self-employed, only7 per cent hired employees. Also, Kuhn and Schuetze (2001) found thatonly 32 per cent of male and 22 per cent of female self-employed owners ofestablished Canadian businesses over 1982–98 hired any paid help. Thestory is similar in the UK, where the 1991 BHPS reveals that just over30 per cent of self-employed people hired any other workers. Accordingto Moralee (1998), employment-creating self-employment declined byabout 7 per cent in the UK between 1992 and 1997. Lin, Picot Compton(2000) and Kuhn and Schuetze (2001) noticed a similar trend in Canada.The reasons behind these trends are unclear.
There are many reasons why only a minority of the self-employed em-ploys others. They include the nature of the work (which is sometimesinnately solo rather than team-based); high employee wage rates; govern-ment employment protection; and perhaps also borrowing constraints ifemployment is bundled with investment (Jefferson, 1997). In addition,
193

194 The Economics of Self-Employment and Entrepreneurship
some entrepreneurs seem to be intrinsically uninterested in growing theirbusinesses;1 and as small businesses expand and take on workers, theybecome likelier to incorporate, at which point the owners technically be-come employees of the incorporated firm rather than self-employed.
Curran and Burrows (1989) showed that British self-employed em-ployers tend to have different characteristics to the own-account self-employed, being older, more likely to be full-time married males, bettereducated, from comfortable family backgrounds and working in ‘dis-tribution, hotels, catering and repairs’. In contrast, own-account self-employed males are heavily concentrated in construction. Curran andBurrows also observed that self-employed employers were more likelyto own their home (89.3 per cent of males) than the own-account self-employed (75.6 per cent of males), who in turn were more likely to owntheir home than employees were (68.2 per cent of males). All of theabove findings have received independent support in multivariate anal-yses of individual characteristics (see, e.g., Burke, Fitz-Roy and Nolan2000 and Cowling and Taylor, 2001, for Britain; van Praag and Cramer,2001, for the Netherlands; and Earle and Sakova, 2000, for Eastern Eu-rope). The positive impact of education, parental education and parentalself-employment on employer status also emerges clearly from thesestudies.
Can governments stimulate employment creation? Few of the covari-ates mentioned above are directly amenable to government control, butthere is some evidence that self-employed hiring decisions are sensitive topersonal income tax (IT) rates. Estimates by Carroll et al. (2000a) basedon US IRS data suggest that a 10 per cent reduction in the marginal in-come tax rate increases the probability of the self-employed hiring workersby 12 per cent. The implied elasticity of 1.2 suggests that general incometax reductions might be a powerful way of stimulating employment cre-ation. More research is needed in this area, however, before any firmconclusions can be reached.
8.1.2 Evidence about job creation by small firms
The publication of the influential Birch Report in the USA (Birch, 1979)stimulated a wave of research on the job creation performance of smallfirms. While small firms themselves are not the primary focus of interestin this book, many of them are owned and managed by entrepreneurs,so it seems appropriate to review this literature briefly. Our emphasiswill be on facts about relative job creation performance, rather than onthe determinants of employment growth in small firms, an issue that istreated in chapter 9.

Labour demand and supply 195
Birch (1979) claimed that between 1969 and 1976, small firms employ-ing fewer than twenty workers generated 66 per cent of all new US jobs,and firms with fewer than 100 employees accounted for 82 per cent of netjob gains. The implication is that the small-firm sector is the primary en-gine of job creation. Subsequent researchers have confirmed these find-ings for the USA and other countries.2 Strikingly, Acs and Audretsch(1993) highlighted a distinct and consistent shift away from employmentin large firms and towards small enterprises in the 1980s in every majorwestern economy.
Others have challenged these claims, however. An early rebuff camefrom Armington and Odle (1982), whose study of employment changesover 1978–80 revealed much smaller small-business job creation ratesthan Birch (1979). But as Kirchhoff and Greene (1998) pointed out,Armington and Odle’s findings might have merely reflected the unusu-ally subdued macroeconomic conditions prevailing between 1978 and1980. Weightier criticisms of Birch’s thesis came in the late 1980s andearly 1990s. In particular, Davis and Haltiwanger (1992) and Davis,Haltiwanger and Schuh (1996a, 1996b) argued that ‘conventional wis-dom about the job-creating powers of small businesses rests on statisticalfallacies and misleading interpretations of the data’ (Davis, Haltiwangerand Schuh, 1996a, p. 57). These were said to include:1. The ‘size distribution fallacy’, whereby static size distributions of num-
bers employed by employer size are used to draw inferences aboutdynamic changes in employment shares. Measures such as ‘the netchange in employment by small firms as a proportion of the net changein total employment’ are biased when firms move between size cate-gories. They can also be misleading if the denominator of this ratio isvery small over a particular period, exaggerating the scale of employ-ment growth by small firms.
2. The ‘regression fallacy’, whereby transitory size shocks bias the relation-ship between employment growth and firm size. To see this, let H∗
t betrue employment size at time t, and Ht be observed size: Ht = H∗
t + vt ,where vt is a measurement error with variance σ 2
v . SupposeH∗
t = H∗t−1 + ut , where ut is a transitory shock that is independent of vt .
Then the true average conditional change in employment size is zero:
E(�H∗t |H∗
t−1) = 0 .
However, were the conditional change in employment to be estimatedusing actual data, which are subject to measurement error andtransitory shocks, one would erroneously find
E(�Ht |Ht−1) = − [σ 2
v /(σ 2
H∗ + σ 2v
)]Ht−1 < 0 ,

196 The Economics of Self-Employment and Entrepreneurship
implying a spurious negative relationship between firm growth andsize. This partly accounts for the importance of the next problem:
3. Poor quality US micro-data, distorting the true employment creation–firm size relationship.
4. Confusion between net and gross job creation, since small firms destroymany jobs as well as creating them.
5. Sample selection bias, whereby small firms with poor job creationrecords die and leave the sample, biasing upwards measured smallfirm job creation rates.3
While the researcher can do relatively little about low-quality data, it ispossible to fix most of the other problems listed here. Most researchersnow eschew simplistic static size distribution comparisons, and measurenet, not gross, job creation rates. Many also circumvent the regressionfallacy by measuring a firm’s growth rate relative to a sample periodaverage size rather than relative to initial size. Recognising these points,and using a panel of data on US manufacturing plants over 1972–88,Davis, Haltiwanger and Schuh claimed that, in contrast to Birch, largerplants and firms create (and destroy) most manufacturing jobs. In addi-tion, Davis, Haltiwanger and Schuh found no clear relationship betweenrates of net job creation and employer size. However, despite some cor-roborative evidence from Wagner (1995), many other researchers havemade similar corrections and reasserted a negative cross-section relation-ship between firm size and employment creation (see, e.g., Hall, 1987;Baldwin and Picot, 1995; Konings, 1995; Hart and Oulton, 1996; andDavidsson, Lindmark and Olofsson, 1998). Some of the disagreementmay be attributable to the exclusion by Davis, Haltiwanger and Schuhand Wagner of service sector firms from their samples.
While the precise scale of the contribution by small firms to employ-ment creation is still disputed, the OECD (1998) claimed that there isnow ‘general agreement’ that the share of jobs accounted for by smallfirms has steadily increased since the early 1970s in most developedeconomies. It is also now known that a few firms with spectacular growthrates create a disproportionate number of jobs.4 These firms, often called‘gazelles’, commonly have over 100 employees but tend to be neitheryoung nor small in terms of turnover or assets (OECD, 1998). Of course,there is no logical contradiction between a statement that small firms arethe greatest source of net new jobs, and the statement that a small numberof such firms creates a disproportionate number of jobs.
Finally, an issue that is arguably just as important as the rate of employ-ment growth is the quality of the jobs created by new start-ups. The lowersurvival rates of new start-ups and the greater variance of their growthrates cast some doubt on the stability and durability of the new jobs

Labour demand and supply 197
created (Davis, Haltiwanger and Schuh, 1996a). Small firms also employmore part-time workers, freelancers and home-workers. Furthermore,their employees tend to be less well educated on average, receiving lowerwages, fewer fringe benefits, lower levels of training and working longerhours with a greater risk of major injury5 – while enjoying lower job tenurethan their counterparts in larger firms (Brown, Hamilton and Medoff,1990). Brown, Hamilton and Medoff (1990) in particular reported asubstantial ‘size-wage’ premium, with workers in large companies earn-ing over 30 per cent more on average than their counterparts in smallfirms. This finding appears to hold across industries and countries, too.Of course, small firms might also offer compensating benefits, such asa more flexible and informal working environment, greater employee in-volvement and more tangible commitment by the owners.
8.2 Entrepreneurs as suppliers of labour
8.2.1 Hours of work
Most self-employed Britons, Americans and Canadians work full-timerather than part-time (see, respectively, Casey and Creigh, 1988; Bregger,1996; and Kuhn and Schuetze, 2001). Defining ‘full-time’ to be thirty ormore hours per week, 80–90 per cent of male self-employed people workfull-time, compared with about 50 per cent of their female counterparts.There is mixed evidence about whether the self-employed are more or lesslikely than employees to work part-time (Aronson, 1991; Bregger, 1996).But it is fairly well established that self-employed males work longer perweek on average than employees do (Carrington, McCue and Pierce,1996); and self-employed employers put in the greatest number of weeklyhours of all (Curran and Burrows, 1989).6 Self-employed Americanswork a similar number of weeks per year as employees do, except inrecessions, where the self-employed reduce their weekly work hours whileemployees reduce the number of weeks they work (Carrington, McCueand Pierce, 1996). According to these authors, annual work hours inthe USA are no more cyclical for male self-employed workers than formale employees.
As with employees, average weekly self-employed work hours have beendeclining over time in most OECD countries, and the gap between thetwo groups of workers has also been narrowing in many of them (OECD,1986; Aronson, 1991; Rees and Shah, 1994; Moralee, 1998). One possi-ble reason is the growth in female self-employment, since as noted abovea greater proportion of female than male self-employed work part-time.In the UK, part-time self-employment increased by 22 per cent between

198 The Economics of Self-Employment and Entrepreneurship
1990 and 1997, while full-time self-employment decreased by 12 per cent(Moralee, 1998).
Explaining entrepreneurs’ labour supplyThere is now an extensive literature explaining the labour supply be-haviour of employees (see Blundell and MaCurdy, 1999, for a review).That literature is partly concerned with measuring the impact of wageson hours worked. This has obvious policy relevance because income taxesreduce wages and hence may have important labour disincentive effects.
It is natural to seek to extend this analytical framework to en-trepreneurs. However, only few studies have attempted this to date, takingentrepreneurs to be the self-employed. Part of the reason for the lim-ited analysis of this issue is that sample sizes tend to be smaller for theself-employed than for employees. But there are also intrinsic difficul-ties involved in analysing labour supply for self-employed workers. First,many individuals are only self-employed temporarily, rendering lifecyclemodelling of their behaviour problematic. Second, unlike employees whoface a fixed wage, the self-employed ‘wage’ must be imputed from prof-its and work hours. As explained in chapter 1, section 1.5, measuredwages are prone to under-reporting biases and compounding of returnsto capital and labour; and if consumers’ demand for self-employed labouris less than infinitely elastic, then the wage depends on the labour theysupply – rendering the wage endogenous (Quinn, 1980).7 Third, it canbe difficult to separate labour supply decisions from labour demand con-siderations, if the self-employed hire outside labour. Fourth, there is agreater tendency for the self-employed to do multiple jobs than em-ployees, which further complicates the modelling of their labour supplybehaviour.8
Standard labour supply models decompose work-hour responses towage changes into two components: a substitution effect and an incomeeffect. The former describes how workers increase their work effort toexploit the higher return from working, holding income constant; thelatter describes the effects of greater resources on the work–leisure choice.The former is positive in work–wage space; the latter is ambiguous insign, but is negative if individuals demand more leisure as their incomerises. If the substitution effect dominates, then labour supply is increasingin the wage rate (i.e. upward sloping in wage–hours space). But if theincome effect becomes dominant at higher wage rates, then an individual’slabour supply schedule can bend backwards, implying that work-hourseventually decline as wages rise.
There are two broad categories of labour supply model: static and life-cycle. An example of a static model of self-employed labour supply is

Labour demand and supply 199
Wales (1973). Static models assume that individuals maximise a simpleatemporal utility function U(ζ, h), where ζ is consumption and h is work-hours, subject to an atemporal budget constraint tying consumption toincome, the latter being partly determined by h. Using such a model,Wales (1973) estimated that most self-employed Americans were locatedon a backward-bending segment of their labour supply schedule, imply-ing that they would work less in response to a higher return to their labour.The predicted effects on work-hours of changes in marginal income taxrates were more muted. However, Wales addressed few of the practi-cal problems pertaining to the modelling of self-employed labour supplynoted above.
Static models have also been estimated for specific self-employed occu-pations, notably physicians, dentists and farmers. For example, Thornton(1998) estimated that the typical self-employed male physician was lo-cated on an upward sloping portion of their labour supply curve, althoughtheir labour supply was relatively insensitive to changes in hourly wagerates and non-practice income.9 Thornton (1994) analysed the behaviourof self-employed farmers who can also choose to work off-farm in paid-employment. He reported a substantially greater responsiveness of farmerwork-hours to the off-farm wage than to the on-farm (self-employed)wage (see also Lopez, 1984).
A problem with static labour supply models is that they ignore infor-mation from other time periods that can impact on individuals’ currentbehaviour. For example, if an entrepreneur anticipates a future recessionthat will decrease the demand for his good, then he might work hardernow than otherwise knowing that he can take more leisure later whenit is cheaper. Lifecycle models incorporate information about future in-comes in order to identify this kind of intertemporal substitution. Subjectto the caveat that future incomes are difficult to predict for workers whoare only temporarily self-employed, lifecycle models do at least enablepolicy-relevant labour supply elasticities to be estimated. This is becausetax reforms typically impact on both current and future incomes (Blundelland MaCurdy, 1999, sec. 4.5).
Rees and Shah (1994) analysed the following lifecycle labour sup-ply model. Let w and hE represent the wage rate and hours of work inpaid-employment, respectively. Hours in self-employment are denoted byhS ≡ h, which together with managerial ability x are arguments of the self-employed production function: q = q (hS, x). Assets are given by B andconsumption by ζ ; r and δ are the rates of interest and intertemporaldiscounting, respectively; l denotes hours of leisure; and β is a vector oftaste parameters. The output price is normalised to unity for simplicity.All variables are indexed by time t. The lifecycle problem can be written

200 The Economics of Self-Employment and Entrepreneurship
in discrete notation as:
max{ζt ,hSt ,hEt }
∑t
(1
1 + δ
)t
U(ζt , hEt , hSt ; βt) (8.1)
subject to 1 = hEt + hSt + lt ; hEt , hSt , lt ≥ 0 ∀t (8.2)
and Bt+1 = (1 + rt)Bt + wthEt + q (hSt , x) − ζt . (8.3)
Equation (8.2) allows mixing of work between occupations, subject toavailable time being normalised to unity. Equation (8.3) is the intertem-poral budget constraint describing the evolution of assets. The necessaryconditions for a solution to this problem are:
Uζt = λt =(
1 + rt
1 + δ
)Et(λt+1)
−UhEt = λtwt + ωEt , −UhSt = λt qhSt + ωSt ,
where λt is the marginal utility of wealth, and the two ω j t terms areKuhn–Tucker multipliers required to ensure non-negative labour sup-plies. Assuming a particular separable form for the utility function, itis possible to derive, as an interior solution, a labour supply equationfor each of the two occupations j = {S, E}, which has the semi-logform
h j t = β0t + β1 ln w j t + β2 ln λt , (8.4)
where β1 and β2 are parameters, and β0t is assumed to be related topersonal characteristics.
A complete lifecycle model identifies λt by forecasting future incomeprofiles (Blundell and MaCurdy, 1999, sec. 4.4.4). Rees and Shah (1994)did not in fact do this, but simply estimated a version of (8.4) omittingλt based on pooled cross-sections of UK GHS data from the 1970s and1980s. Separate equations were estimated for employees and the self-employed. Their findings were as follows. First, for both groups, β1 wasinsignificant, implying that neither employees nor the self-employed sig-nificantly vary their hours of work in response to changes in the wagerate. Second, ill health was found not to significantly affect self-employedlabour supply. Third, being married significantly increased self-employedlabour supply (possibly because of having a spouse to help in the busi-ness), but having children under five years old significantly reduced it.Having older children made no difference to self-employed labour supply.Fourth, year dummies were negative and significant in the early 1980s.This probably reflects the limited opportunities for work in recession

Labour demand and supply 201
years, though it is also possible that the ‘new’ self-employed entrants toself-employment in these years may have been less inclined to work longhours. Either way, the negative sign of these dummies confounds theview that the much lauded ‘enterprise culture’ of the period translatedinto greater labour supply by the self-employed.
The omission by Rees and Shah (1994) of information on future in-comes, which is required to estimate a complete lifecycle empirical model,may not be so serious if the results of Camerer et al. (1997) are gener-ally applicable. These authors analysed daily variation in the work-hoursand wages of self-employed taxi cab drivers in New York City. Theyargued that cab drivers find it easier to earn money quickly on somedays than on others, because of exogenous factors like bad weather ortrain strikes. One might expect cab drivers to practise intertemporal sub-stitution, working longer hours on high-wage days and taking time offon slack days. However, estimates from a simple double-log regressionmodel ln hSi = β0 + β1 ln wi + β ′
2 Xi + ui (where X is a vector of exoge-nous variables) yielded exactly the opposite result. Drivers in the Camereret al. sample responded to busier conditions (and hence higher hourlywages) by working fewer rather than longer hours. This is indicative ofa backward-bending labour supply schedule. It is as though cab driverstake one day at a time, having a target income for each day, and stoppingwork as soon as they achieve it.
This behaviour might be explained by workers relying on simple heuris-tic rules in response to uncertainty. Perhaps surprisingly, uncertainty hasnot been extensively analysed in studies of self-employed labour supply.This is despite the possibility that it might help resolve the puzzle, alludedto at the end of chapter 1, subsection 1.5.1, of why the self-employed worklonger hours on average than employees do, despite earning lower averagewages. To see why, suppose that while employees can benefit from wagesmoothing by their employers, receiving a constant wE, the self-employedcannot diversify their risk, which takes the form of a wage shock � whereE� = 0. Suppose that the self-employed indirect utility function is givenby
V∗ = U1(wSh∗ + �) + U2(1 − h∗) + ν , (8.5)
where ν > 0 is a non-pecuniary advantage to self-employment, wS isthe self-employment wage and U1(·) and U2(·) are concave increas-ing and decreasing functions, respectively. Assume also that ν is suf-ficiently great to ensure occupational equilibrium with wE > wS. Thefirst-order condition determining optimal self-employed work-hours h∗
is wSE∂U1/∂h∗ − ∂U2/∂h∗ = 0. Then it is known (Rothschild and Stiglitz,1971) that a mean-preserving spread (MPS) in � will increase or decrease

202 The Economics of Self-Employment and Entrepreneurship
h∗ as
ψ(�) := wS∂U1/∂h∗ − ∂U2/∂h∗
is convex or concave in �. Differentiating twice with respect to � yields
∂2ψ(�)∂�2
= wS∂3U1(·)
∂y3, (8.6)
where y := wS h∗ + �. The RHS of (8.6) is positive if ∂3U1(·)/∂y3 > 0,in which case ψ(�) is convex, and labour supply increases with the de-gree of uncertainty. Since this condition on U1(·) is satisfied by utilityfunctions embodying decreasing absolute risk aversion (see Definition2, chapter 2), this case seems a reasonable one. The self-employed ef-fectively ‘self-insure’ by choosing a greater labour supply and therebymaking the deterministic part of their income larger.
The foregoing provides a possible resolution of the self-employedlabour supply puzzle, because it explains why the self-employed workharder in return for a lower wage than employees. The non-pecuniarybenefit is necessary for anyone to choose self-employment at all, thoughit cannot of itself explain long work-hours in self-employment. However,the above result depends on risk affecting self-employment incomes addi-tively. Were risk to impact on self-employment incomes in a multiplicativemanner instead, then a MPS in � would have ambiguously signed effectson self-employed labour supply. Naturally, other possible resolutions ofthe puzzle could also be proposed, such as unrealistic optimism by theself-employed, for example.
Finally, we note that further work remains to be done on improving ourunderstanding of the labour supply of entrepreneurs. One aspect of thistask might be to develop empirical specifications that are immune to self-employed income under-reporting biases. Another would be to modelmore explicitly non-pecuniary factors, in view of the findings of chapter3, subsection 3.2.3 about their impact on the self-employed, togetherwith Atrostic’s (1982) evidence about their importance for explainingemployees’ labour supply behaviour.
Ageing and entrepreneurs’ labour supplyAt around the time of start-up, entrepreneurs often work very long hoursin order to establish their enterprise. Once established, new enterprisesoften require somewhat less strenuous effort to maintain and manage.The implication is that younger entrepreneurs work harder than olderones do, since a greater proportion of the former implement start-upsthan the latter, who have moved on to consolidate their earlier achieve-ments. Certainly retired self-employed Americans work fewer hours on

Labour demand and supply 203
average than their non-retired counterparts (Fuchs, 1982; Honig andHanoch, 1985). Younger entrepreneurs might also work longer hoursthan older ones because they have greater energy and stamina.
A further reason why entrepreneurs’ labour supply may decline withage is that entrepreneurs’ returns from expending costly effort decreasesover time if effort reveals valuable information about innate ability. To seethis, consider the following model proposed by Frank (1988). Consideran entrepreneur who works for a finite time span T. In each period hemust choose whether to continue in entrepreneurship (zt = 1) or to exit(zt = 0). If zt = 1, then he chooses labour supply, ht ∈ [0, h]. The disu-tility of supplying labour is given by c(ht), where c(·) is an increasing andconvex function. The entrepreneur’s revenue is xht + �t . Here x is ability,which is unknown to the entrepreneur at the time of entry in t = 1; hisprior belief is that it is distributed with mean µ1 and precision (definedas the reciprocal of the variance) v1. Also, �t is a normally distributedrandom influence (e.g. ‘luck’), distributed normally with mean zero andprecision v�. Entrepreneurs perform Bayesian learning about x by ob-serving successive realisations of xht + �t , which at time t is normallydistributed with mean xht . Entrepreneurs’ beliefs in t + 1 are charac-terised by a distribution with mean µt+1 and precision vt+1, where
µt+1 = vtµt + v�ht(xht + �t)
vt + v�h2t
(8.7)
vt+1 = vt + v�h2t . (8.8)
Evidently, if ht = 0 then µt+1 = µt and vt+1 = vt . Thus if the en-trepreneur expends no effort, he obtains no new information about hisentrepreneurial ability.
If zt = 0, the individual takes an outside option (e.g. paid-employment)that yields utility wt . Let Ut be the entrepreneur’s discounted expectedutility given that he entered initially and chooses all future z and h valuesoptimally; Ut ≡ 0 for t > T. Et is the expectations operator conditionedon the information available at time t, and β = 1/(1 + δ) ∈ (0, 1] is thediscount factor. In each time period after entry at t = 1, we have
Ut = maxzt ,ht
{wt(1 − zt) + [Et(xht + �t) − c(ht)]zt + βEtUt+1
}t = 2, 3, . . . , T . (8.9)
Proposition 7 (Frank, 1988). Entrepreneurs optimally supply less labouras they age.
Proof. We solve the model by backwards induction. At T, an entrepreneurremains in the industry (i.e. z∗
T = 1) if wT ≤ µTh∗T − c(h∗
T), where h∗T is

204 The Economics of Self-Employment and Entrepreneurship
optimal terminal effort, which satisfies µT = ch(h∗T). Given this solution,
the period T − 1 problem is
UT−1 = maxzT−1,hT−1
{wT−1(1 − zT−1) + [ET−1(xhT−1 + �T−1)
−c(hT−1)]zT−1 + βwT(1 − zT−1) + βET−1U∗TzT−1
}, (8.10)
where U∗T is the maximal payoff in T conditional on zT−1 = 1, and using
an auxiliary result that entrepreneurs do not re-enter once they exit, sothat zT−1 = 0 ⇒ zT = 0. If the entrepreneur selects zT−1 = 1, then themaximising choice of hT−1, namely h∗
T−1, satisfies the first-order condition
µT−1 − ch(hT−1) + β∂[ET−1U∗
T]∂hT−1
= 0 , (8.11)
where the derivative in this equation is obviously positive. Now for thepresumed pattern of continuation to be optimal, we must have µT−1 ≤µT. So even if µT−1 = µT it must follow that h∗
T−1 > h∗T. �
The logic behind Proposition 7 can be seen by comparing the periodT objective with that for T − 1 (the latter is (8.10) in the proof ). Onlypart of the payoff to supplying effort is the production of current output.Greater effort also generates returns in the form of valuable informationabout the future.10 As the entrepreneur approaches retirement, the valueof information about future returns in entrepreneurship declines to zero.Consequently, this gives the entrepreneur less incentive to supply costlyeffort as he ages.
For the reasons given earlier, a finding that entrepreneurs work fewerhours as they age can be attributed to several factors, not just declininginformation value from work. We now proceed to consider the specificissue of retirement and entrepreneurship in further detail.
8.2.2 Retirement
It is now well established in the UK and USA that among older workers,the self-employed are more likely to participate in the workforce than em-ployees are.11 In both countries, around one-third of the workforce agedover sixty-five is self-employed (Iams, 1987; Moralee, 1998; Bruce, Holz-Eakin and Quinn, 2000). This proportion appears to have been relativelystable over time. Among the very oldest segment of the workforce, self-employment rates are even higher (Fuchs, 1982). Several explanations ofthese phenomena can be proposed:1. Older workers are from cohorts in which self-employment was once
more common than it is now.

Labour demand and supply 205
2. Employees are more likely to retire than the self-employed, perhapsbecause they face a statutory retirement age (as in, e.g., the UK), orearly retirement incentives embodied in occupational pension rights.Neither factor is applicable to the self-employed. There might also bebias by employers against older workers, that encourages such workersto set up on their own if they wish to continue working. Some otherindividuals may work beyond the statutory retirement age because theyhave insufficient pension rights. And an entrepreneur who has devotedtheir life to creating and growing a business might also be unwillingto give it up altogether, perhaps choosing to work fewer hours ratherthan relinquishing control entirely.
3. Some employees switch into self-employment as they approachretirement.12 This might occur because self-employment is an easierway for individuals to partially retire. For example, Quinn (1980) ob-served that the work hours of older self-employed individuals displaymarkedly greater variation than do those of older employees. How-ever, the extent of switching should not be over-stated: most self-employed Americans over sixty-five have been self-employed for manyyears rather than newly arrived from paid employment (Iams, 1987).Despite this early work, there has been relatively little formal modelling
of the self-employment retirement decision. One exception is Parker andRougier (2001), who developed a simple continuous-time lifecycle modelfor this purpose. These authors estimated a two-equation model in whichthe (unobserved) probability of retirement, zr ∗, and log lifetime wealthat age a, ln Ba, are both endogenous variables for each individual i :
ln Bai = γ1 zr ∗i + β ′
1 X1i + ui1 (8.12)
zr ∗i = γ2 ln Bai + β ′
2 X2i + ui2 (8.13)
zri :={
1 if zr ∗i ≥ 0
0 if zr ∗i < 0 ,
(8.14)
where X1 and X2 are non-identical vectors of exogenous variables, both ofwhich include the self-employed wage, business wealth and several otherpersonal characteristics. The model was estimated by full-informationmaximum likelihood using a sample of 197 self-employed individualstaken from the 1994 British Retirement Survey. The significant deter-minants of the probability of self-employed retirement were earned in-come at retirement (with a negative sign) and age. Unlike employees, forwhom the probability of retirement has been found to be a strictly in-creasing function of age, the self-employed exhibited a quadratic pattern,with the probability of retirement increasing until age seventy-three, anddecreasing thereafter. Those who were ‘long-term’ self-employed were

206 The Economics of Self-Employment and Entrepreneurship
significantly less likely to retire than those who had recently switchedinto self-employment. This may suggest that older employees who switchinto self-employment regard self-employment as a transition towards fullretirement. Strikingly, neither lifetime wealth nor poor health were signif-icant determinants of retirement by the self-employed. This was despiteboth the relatively high levels of lifetime wealth and the greater incidenceof poor health among the self-employed Retirement Survey respondents(Parker, 2003b) – and contrasts with previous findings about the im-pact of poor health on retirement among older American employed andself-employed workers (Quinn, 1980; Fuchs, 1982).13
Some commentators have contended that self-employment amongolder workers – so-called ‘third-age entrepreneurship’ – may be an im-portant phenomenon. The institutional backdrop is that governmentpolicies in the USA and elsewhere since the 1980s have made contin-ued work among older people an increasingly attractive option (Bruce,Holz-Eakin and Quinn, 2000). In addition, tax-based savings’ incentivesappear to be eagerly exploited by the self-employed (Power and Rider,2002).14 However, there is little evidence that third-age entrepreneur-ship is widespread. For example, questionnaire responses revealed thatat most only 15 per cent of fifty–seventy-five-year-old Britons expressedany interest in self-employment (Curran and Blackburn, 2001). Whileacknowledging the limitations of survey claims about future anticipatedbehaviour, this figure is likely to be an upper-bound estimate of the truelevel of interest because no respondents have to bear immediately the costsof switching into entrepreneurship. Nor is it obvious that the importanceof self-employment among older people is set to increase dramatically inthe near future.
NOTES
1. For example, Hakim (1989b) reported that even in economically buoyanttimes, less than half of small firms in the UK see employment growth as an ob-jective. Scase and Goffee (1982) claimed that some self-employed individualsdo not hire workers if they suspect this will destroy a personal client-based ser-vice; if they believe that hired labour is unreliable; or if hiring entails spendingone’s time as a ‘businessman’ rather than as a ‘craftsman’.
2. See Leonard (1986), Dunne, Roberts and Sammelson (1989a, 1989b), Brown,Hamilton and Medoff (1990), Acs and Audretsch (1993), OECD (1994a),Birch, Haggerty and Parsons (1997) and SBA (2001). According to SBA(2001), small firms account for about 75 per cent of net new jobs created eachyear in the USA. A similar proportion of new jobs were created in the self-employment sector in Canada in the 1990s (Lin, Picot and Compton, 2000).
3. However, job creation performance by small firms may be under-stated if grow-ing firms undergo changes of ownership that subtract from employment growth

Labour demand and supply 207
attributable to small firms by recording a false death, and adds to employmentgrowth attributable to large firms by recording a false birth (Kirchhoff andGreene, 1998). Also, some small firms subcontract the manufacture and dis-tribution of their products, which can create additional indirect employmentthat goes unrecorded – or is attributed to large firms that gain the manufac-turing and distribution contracts. However, the latter effect is clearly offsetby large firms that subcontract work to small firms.
4. In the context of the small firms literature, Storey (1994a) estimated that5–10 per cent of manufacturing businesses that started in the 1970s provided40–50 per cent of total employment in their cohort ten years later.
5. See Storey (1994a), who cited evidence that the likelihood of major injuriesis 40 per cent higher for workers in firms with fewer than 50 employees thanin larger firms.
6. Some interesting descriptive evidence on the characteristics of British self-employed people working more than eighty hours per week comes from Jones,McEvoy and Barrett (1993). They are concentrated in retailing; have low in-comes and profits; are more reliant than other self-employed people on unpaidlabour; are older; and are less likely to operate branches of their business.
7. In this case, the wage ought to be instrumented to avoid simultaneous equa-tion bias, e.g., using a predicted wage imputed on the basis of exogenouscharacteristics.
8. The extent of multiple job holding is limited, however. For example, us-ing the 1987–8 UK LFS, Hakim (1988) reported that only 5 per cent ofthe self-employed have second jobs, 60 per cent of which were also in self-employment. US evidence also points to a small and static role for multiplejob holding in self-employment (Aronson, 1991).
9. See Thornton (1998) for more references to the physician labour supplyliterature. For studies relating to dentists, see Boulier (1979) and Schefflerand Rossiter (1983).
10. The term β[∂[ET−1U∗T]]/[∂hT−1] in (8.11) can be interpreted as the marginal
information value of an extra unit of effort.11. For UK evidence, see Moralee (1998), and Parker (2003b); US evidence
includes Quinn (1980), Fuchs (1982) and Iams (1987).12. Nearly one-quarter of retired American employees who continue to work
do so by switching into self-employment. Unlike career self-employed indi-viduals, this is generally in different occupations and industries to their pre-retirement work (Iams, 1987). Fuchs (1982) estimated the relevant switchingrate from paid employment to be around 2 per cent per annum for older maleAmerican employees.
13. These two studies found that personal wealth and eligibility for social se-curity retirement benefits increase the probability that older self-employedAmericans retire.
14. Power and Rider (2002) estimated the tax price elasticity of contributions totax-deferred retirement savings plans by the self-employed to be –2.0. Theseincentives also significantly increase the probability that the self-employedcontribute in the first place.

9 Growth, innovation and exit
In this chapter we investigate the growth, innovative performance and sur-vival of new entrepreneurial ventures. Section 9.1 outlines an integratedtheoretical model of firm entry, growth and exit by Jovanovic (1982). Thismodel provides a useful framework for understanding why some smallfirms survive and grow, and why others die. It is also helpful for inter-preting empirical results on these phenomena. Section 9.2 summarisesevidence about the growth of small firms and innovation. Section 9.3presents facts about the survival and exit of new small firms, and theirdeterminants.
It is helpful to clarify at the outset what the chapter does not attemptto do. We do not cover the literature on dynamic industrial organisationthat has developed since Jovanovic (1982) (see, e.g., Ericsson and Pakes,1995). Nor do we analyse market entry by new firms, since many ofthese are not wholly new firms, but existing firms that have diversifiedinto a new market, or that have re-positioned themselves from a differentindustrial sector (Storey, 1991). Nor will we repeat results about factorsaffecting market entry by entrepreneurs covered elsewhere in the book.
9.1 Jovanovic’s (1982) dynamic selection model
In a highly influential paper, Jovanovic (1982) developed a model inwhich entrepreneurs have imperfect information about their innate abil-ities, which they can learn about only by trying entrepreneurship. Themodel shows that the ventures of able and/or lucky entrepreneurs surviveand grow, while those of less able and/or unlucky entrepreneurs shrinkand exit. It derives endogenously the entry and exit behaviour of newsmall-scale start-ups within an optimising framework. As will be seenlater, the predictions of the model turn out to be consistent with a largebody of empirical evidence about small firm dynamics.
The Jovanovic model shares some features in common with othereconomic models of entrepreneurship discussed in chapter 2, section2.2. As in Lucas (1978), individuals have heterogeneous abilities in
208

Growth, innovation and exit 209
entrepreneurship; but unlike Lucas, entrepreneurs do not know theirabilities when they start their ventures. As in the Kihlstrom and Laffont(1979) model, entrepreneurs face uncertainty; but unlike Kihlstrom andLaffont, all individuals are assumed to be risk neutral rather than riskaverse. Finally, like Dixit and Rob (1994) and Parker (1996, 1997a), theJovanovic model is dynamic. But in contrast to those models, there areno switching costs and entrepreneurs learn by doing.
For simplicity, Jovanovic assumed that entrepreneurs sell a homoge-neous product, with a sequence of selling prices {P}∞0 that is deterministicand known. Entrepreneurs are price takers and are too small to interactstrategically with other firms. At time t each entrepreneur faces the costfunction
ct = c(qt)ψ(x + �t) , (9.1)
where q is the entrepreneur’s output, ψ(·) is a continuous and increasingfunction, c(·) is a convex function, x is the entrepreneur’s innate abilityand �t ∼ N(0, σ 2
� ) is a random shock. Here x is an inverse measure ofability, since large x values index high-cost (inefficient) producers. En-trepreneurs know the distribution from which the shocks are drawn, andalso the distribution from which abilities are drawn: x ∼ N(x, σ 2
x ).Individuals all start with the same prior belief about their ability, x.
Hence no entrepreneur has a head start over others, and all enter at thesame scale of operation. Entrepreneurs use a Bayesian updating rule toamend their beliefs about their ability as information comes in. Theydo this by observing the sequence of cost and profit outcomes from allprevious periods in which they operated, and inverting the cost function(9.1) to obtain a new estimate of x.
This model differs in some important ways from the related modelof Frank (1988), that was discussed in chapter 8, section 8.2. In Frank’smodel, entrants possessed heterogeneous beliefs about their own abilities,and entrepreneurs learned at different speeds depending on the effort theyexpended. The Jovanovic model abstracts from effort considerations; allentrepreneurs learn at the same speed.
Given the structure of the cost function in (9.1), low-x types are likelyto receive low-cost outcomes and survive, while high-x types receive high-cost outcomes. However, this is not inevitable because of the presence ofthe stochastic term �. For example, low-x types could receive an unluckysequence of poor draws from �, while high-x types might receive a luckysequence of good draws. But as time goes on, random draws are likely tocancel out, and innate ability is increasingly likely to shine through.
In each period t, entrepreneurs choose output qt to maximise ex-pected profits Ptqt − Ect . Note that ∂q ∗
t /∂Eψt < 0, where we define

210 The Economics of Self-Employment and Entrepreneurship
ψt := ψ(x + �t) for notational brevity. That is, individuals who perceivethemselves to be low (resp., high) cost types increase (resp., decrease)output in the subsequent period: unusually high profits are followed byunusually high growth in the next period.
There is a common outside option (possibly wage-work) with a presentvalue of w. There is also an unlimited number of potential entrepreneurs,who are indifferent between wage-work and entrepreneurship and whoare assumed to choose wage-work. These individuals will enter the indus-try if the output price rises above the initial market equilibrium price P0,and will therefore drive the price back down to P0.1 Hence in no periodcan the output price rise above P0.
Entrepreneurs maximise their expected returns over an infinite hori-zon, with discount rate δ > 0. Let a denote the length of time a firm hassurvived at time t, and define
π(Pt , ψ) := Ptq (Pt |ψ) − c[q (Pt |ψ)]ψ
as expected profits maximised with respect to q , where ψ := Eψt . Thatis, ψ is an entrepreneur’s expectation of his idiosyncratic cost term givenhis history of observing cost and profit outcomes. In order to determinewhether to remain in the industry or to quit, entrepreneurs need to calcu-late the value of remaining. Let V(ψ , a, t; P) denote the expected valueat t of a firm surviving a periods remaining in the industry at t and behav-ing optimally thereafter. This has two components, namely current profitand the discounted value of being able to operate in entrepreneurshipsubsequently:
V(ψ , a, t; P) = π(Pt , ψ) +{
11 + δ∫
max [w, V(z, a + 1, t + 1; P)] p(dz|ψ , a)}
, (9.2)
where p(z|ψ , a) is the probability that Eψt+1 ≤ z given that Eψt = ψ andgiven that the firm has operated for a periods. Using a contraction map-ping theorem, Jovanovic showed that a unique, bounded and continuoussolution for V in (9.2) exists. He also showed that V is strictly decreasingin ψ–i.e. the value of the firm is lower the higher is the entrepreneur’sexpectation about his costs.
Entrepreneurs are indifferent about remaining in business or exiting totake the outside option when
V(ψ , a, t; P) = w . (9.3)
Let ψ∗(a, t; P) be the level of Eψt at which the equality in (9.3)
is satisfied. Because V is a decreasing function of ψ , it follows that

Growth, innovation and exit 211
time, t
Firm output
Survival
FailureBoundary output, q
V ≤ w
V ≥ w
0
~
Figure 9.1 Selection and survival in the Jovanovic (1982) model
ψ∗(a, t; P) must be uniquely defined. Hence firms will exit at output
of less than q := q [Pt |ψ∗(a, t; P)], and will remain in the industry other-
wise. Figure 9.1 illustrates two examples of realisations of firms’ outputs,together with this boundary. Below q (the ‘exit region’) V(ψ , a, t; P) < wand above q (the ‘continuation region’) V(ψ , a, t; P) > w.
Jovanovic’s model has the following implications for entrepreneurialability, venture growth, exit, industry concentration, profits, and output:J.1 Entrepreneurs who run young firms have had less time to accumulate
information about their true abilities. Therefore the level and variabilityof growth rates are largest among younger and smaller firms. Growthrates are lower among mature surviving firms.
J.2 Firms that exit never return because they know that the outputprice cannot rise above the level at which they left; and an exiting en-trepreneur never obtains any more information to change his terminalbelief about his ability.
J.3 Results J.1 and J.2 imply that (cohort) industry concentration in-creases over time, since initially all firms of a given cohort were thesame size, at which industrial concentration was at a minimum.

212 The Economics of Self-Employment and Entrepreneurship
J.4 Entrepreneurs who remain in business indefinitely eventually learntheir true ability, whereas entrepreneurs who exit tend to have relativelyimprecise estimates of their true ability.
J.5 The last clause of J.4 implies that some entrepreneurs who exit mighthave true entrepreneurial abilities that exceed the marginal ability thatwould make entrepreneurship marginally attractive in the presence ofperfect information. These entrepreneurs received unlucky draws fromthe distribution of shocks, and incorrectly (but understandably) inter-preted these draws as evidence of low ability, prompting their with-drawal. The greater is the variance of shocks, σ 2
� , the more of these‘efficient failures’ there will be.
J.6 Surviving firms are larger and older than firms that failed, and theyare also larger than new entrants.
J.7 Price is determined at the margin by smaller and younger firms.Larger, more efficient firms earn profits as a reward for their excep-tional ability. For each cohort of firms, average profits increase as theindustry matures. The distribution of profits resembles the distributionof ability. The more dispersed the latter, the more dispersed are firmsizes and profitability rates.
J.8 Let Qt denote (deterministic) industry output at time t. If Qt is non-decreasing in t, and q (P|ψ) is a strictly concave function of ψ , thenthe equilibrium price sequence is constant, and entry occurs at each t.As will be seen in section 9.2, Jovanovic’s predictions relating to firm
growth rates (J.1) receive strong empirical support. However, at the riskof ending this section on a negative note, we shall conclude by mentioningtwo less satisfactory aspects of the model, and a caveat to the sharpnessof its testable predictions.
It is debatable whether average cohort firm size and industrial concen-tration increase continually over time (in a first-order stochastic sense),as suggested by J.3 and J.6. One can think of many practical reasons,absent from Jovanovic’s model, why firms might face barriers to growth,including regulatory and tax disincentives. Also, entrepreneurs have onlyfinite attention to apportion between maintaining current projects andevaluating and adopting new projects. The opportunity cost of neglect-ing profitable current projects might deter firms from seeking growth andso place bounds on firms’ sizes (Oi, 1983; Gifford, 1998). While some en-trepreneurs might be able to release scarce resources to exploit profitablenew opportunities by closing or transferring viable existing businesses toless able entrepreneurs (Holmes and Schmitz, 1990), this is not alwaysfeasible.
Another questionable result is that entrepreneurs who exit never re-turn and ‘try their luck again’ (J.2). There is some evidence of ‘repeat

Growth, innovation and exit 213
entrepreneurship’, whereby failed entrepreneurs try again with newventures, having learned valuable lessons from their previous failures(MacMillan, 1986). In fact, re-entry of failed entrepreneurs can be sus-tained in a modification of Jovanovic’s model if the assumption of aninexhaustible supply of potential entrepreneurs is replaced with one stip-ulating a limited supply (Brock and Evans, 1986, pp. 60–3).
One caveat is that predictions J.1 through J.8 are not all unique tothe Jovanovic model. For example, Frank (1988) and Segal and Spivak(1989) also predict that smaller firms will have higher and more variablegrowth rates. Frank’s model was discussed in chapter 8, section 8.2; webriefly describe Segal and Spivak’s model here. These authors consid-ered an entrepreneur who chooses how much profit to take out of thefirm and how much to re-invest in it. Re-investment of profits increasesoutput, which is subject to random shocks.2 The firm fails and closes ifoutput reaches zero, perhaps following an unlucky sequence of successiveadverse shocks. In that event, the owner pays an intangible dissolutioncost – perhaps the loss of reputation. Now consider a new firm that en-ters the market with an output that is positive but sufficiently close to thezero boundary to make the prospect of failure a real possibility. Clearly,this firm owner has a stronger incentive to reinvest profits in order todecrease the risk of costly failure than the owner of a larger enterprisewith output that is further from the boundary. It follows that small firmshave higher output growth rates than larger firms, since reinvestment ofprofits promotes growth.
An interesting by-product of Segal and Spivak’s model is the predictionthat large firms have growth firms that converge to a constant. That resultis consistent with Gibrat’s Law, an important concept in the theory of firmgrowth. We discuss this next.
9.2 Growth and innovation
9.2.1 Gibrat’s Law and extensions
Gibrat’s ‘Law of Proportionate Effect’ (Gibrat, 1931) is a well-knownbenchmark model of firm growth. Gibrat’s ‘Law’ states that if there isa fixed number of firms, and if firms’ growth rates are independent offirm size and previous growth rates, then the distribution of firm sizeswill be lognormal with a variance that increases over time. If qit denotesa measure of size (e.g. number of employees, turnover or assets) of firmi at time t, then an econometric specification of Gibrat’s Law is
ln qi t+1 = β + ln qit + ui t+1 , (9.4)

214 The Economics of Self-Employment and Entrepreneurship
where β is the mean firm growth rate, assumed the same for all i ; andwhere ui t+1 is a mean-zero stochastic disturbance term with a distributionthat is identical across firms i . Early studies found some empirical supportfor lognormal firm-size distributions and firm-growth rates being roughlyindependent of firm size (see, e.g., Hart and Prais, 1956; Simon andBonini, 1958).
Three assumptions underlying Gibrat’s Law appear questionable. Oneis that the population of firms is fixed. In practice, of course, firms areborn and die, so this assumption is not tenable. A second is that eachfirm faces a draw from a common distribution of random shocks. Butrecent evidence suggests that the variance of firm growth rates is higherfor smaller firms (see below). Third, Gibrat’s Law assumes that meangrowth rates are the same for all firms. Again, recent evidence reviewedbelow refutes this claim, showing that smaller firms tend to have highergrowth rates.
In the light of these problems several refinements to Gibrat’s Law havebeen proposed (see Ijiri and Simon, 1977). Perhaps the most populargeneralisation allows for heterogeneous growth rates, giving rise to thespecification
ln qi t+1 = βi + γ ln qit + ui t+1 , (9.5)
where βi is the firm i-specific growth rate, and γ < 1 permits Galtonianregression to the mean in firm size: i.e. large firms have lower growth ratesthan small firms do. Clearly Gibrat’s Law emerges as a special case of(9.5) when the βi are the same for all i and when γ = 1.
A third, even more general, specification permits a direct test of theJovanovic model described in chapter 9, section 9.1. This specification,suggested by Brock and Evans (1986, ch. 6), takes the form
ln qi t+1 − ln qit = β + γ1 ln qit + γ2[ln qit]2 + γ3 ln ait + γ4[ln ait]2
+γ5 ln qit ln ait + ui t+1, (9.6)
where ait is firm i ’s age at time t, and where β and the γ s are parameters.The inclusion of both firm age ait as well as firm size qit on the RHS of(9.6) permits tests of prediction J.1 of the Jovanovic model. Of course, itis also possible to include firm- and owner-specific factors as additionalexplanatory variables in growth equations, in order to explore the effectsof a broader range of possible growth determinants. We now turn to theempirical evidence on these issues.

Growth, innovation and exit 215
9.2.2 Evidence on growth rates
Numerous empirical studies have sought to identify the determinants ofsmall firm growth rates. While many disparate results have been pub-lished, one of the most important and widely verified is the following:Firm growth rates are decreasing in firm size among firms of the same age; and
are decreasing in firm age among firms of the same size.Estimates of (9.5) reveal a tendency for smaller firms to grow faster than
larger ones.3 Results are similar if (9.6) is estimated.4 Thus firm-growthrates generally decrease with firm size and age. In addition, the evidenceshows that younger firms have more variable growth rates (Brock andEvans, 1986; Bates, 1990). These results all refute Gibratl’s Law andprovide broad support to Jovanovic’s prediction J.1 – which has sincebeen confirmed in many subsequent studies.5
Several other characteristics have also been associated with the growthof small firms. The contributions to this part of the literature have beennumerous and diverse, so only a cursory overview is possible. In his sur-vey of international studies, Storey (1994a) reported that the followingfactors were positively associated with firm growth: a low unemploymentenvironment; education and previous managerial experience of the owner(Cooper, Gimeno-Gascon and Woo, 1994; Kangasharju and Pekkala,2002); multiple founders;6 rural location; and being a limited company.There is also some evidence that multiple-establishment (Variyam andKraybill, 1992) and high-tech firms with access to multiple sources offinance (Westhead and Cowling, 1995) have higher growth rates thanfirms that do not. According to Storey (1994a), previous entrepreneurialexperience in the same sector or in self-employment had mixed effectson firm growth rates; and family history, sources of finance, training andgender had few discernible effects.7 The age of the owner-manager hasbeen found in some studies to be negatively related to small-firm growthrates (Boswell, 1972; Barkham et al., 1996) – though here again mixedresults have been obtained. There are also mixed findings from studiesthat attempt to relate actual new-venture growth rates to entrepreneurs’declared ambitions to grow (e.g. compare Storey, 1994a, with Barkham,Hart and Hanvey, 1996). Reid (1993) found that growth is negativelyaffected by profitability. Watson (1990) emphasised the distinction be-tween trading profits and retained profits – the difference between themcomprising directors’ remuneration and taxation. Watson reported a weakrelationship between employment growth and trading profits, but a muchstronger relationship with retained profits. This is consistent with the no-tion that retained profits are reinvested for expansion.

216 The Economics of Self-Employment and Entrepreneurship
A common empirical finding is the irrelevance of many firm-specificand environmental factors for explaining small-firm growth rates. For ex-ample, Westhead and Cowling (1995) found that of sixty-seven potentialexplanatory variables (embracing personal and firm-specific character-istics, environmental factors and financial structure, inter alia), only ahandful of them significantly explained firm growth.8 This places obvi-ous limitations on the scope to give policy advice aimed at promotingthe growth of new ventures. One interesting exception relates to taxa-tion. US evidence from Carroll et al. (2000b, 2001) showed that highermarginal income tax rates significantly and substantially decrease small-firm growth rates (measured in terms of business receipts) and investmentexpenditures.
9.2.3 Innovation
A feature of the growth of small firms that has not been mentioned sofar is innovation, deemed by Schumpeter to be a central aspect of en-trepreneurship.
Before turning to the evidence, we note that there are several reasonswhy small firms might possess an advantage over large firms at innovating.They are said to include:� Bureaucratic inertia in large firms, which is not conducive to innovation
(Link and Rees, 1990). Individuals located outside large firms might beable to develop innovative ideas untramelled by conventional corporatethinking (Pavitt, Robson and Townsend, 1987).
� Shorter lines of communication in small firms (Fielden, Davidson andMakin, 2000).
� Greater responsiveness by small firms to changing demand and demog-raphy (Bannock, 1981).
� Greater ease of technology diffusion between small firms, especiallywhen involved in networks and clusters that generate opportunities forcross-organisational learning (Morgan, 1997).
� Diminishing returns to R&D, which affect large firms more than smallfirms (Acs and Audretsch, 1991).
� Larger firms having greater demands on limited entrepreneurial atten-tion for managing existing projects, and so facing a higher opportunitycost from innovating and thereby creating further demands on theirattention (Gifford, 1998).
� Small firms having greater incentives to innovate if that helps them toovercome entry barriers and retaliatory conduct by incumbents (Acsand Audretsch, 1989).

Growth, innovation and exit 217
On the latter point, innovation certainly seems to be associated withbusiness entry, with several authors finding that industries with high ratesof entry by small firms have higher rates of productivity growth and in-novation (Geroski and Pomroy, 1990; Cosh, Hughes and Wood, 1999).Knowledge spillovers also appear to be important. According to SBA(2002b), a university’s R&D expenditure leads to a significant increase inthe number of new-firm formations in surrounding areas, for up to fiveyears after the expenditure is made.
Several US studies lend support to the notion that smaller and youngerfirms have been relatively more innovative than larger and older firms.9
According to Scherer (1991), in the 1980s ‘small’ US firms (i.e. those withfewer than 500 employees) created 322 innovations per million employeescompared with 225 in large firms. Innovations in small firms seem torespond to different technological and environmental factors than thosein large firms (Acs and Audretsch, 1987a, 1987b, 1988), being positivelyand significantly related to the presence of skilled labour. In contrast,large firms have a comparative innovative advantage in capital-intensive,concentrated and highly unionised industries producing differentiatedgoods supported by advertising. According to these authors, there wasno measurable difference in the quality of innovations between small andlarge firms.
The UK evidence about innovation and firm size is more mixed. Pavitt,Robson and Townsend (1987) analysed the size distribution of innovatingfirms in the UK between 1945 and 1984, and concluded that small firmswere more likely to introduce new innovations than large firms were.However, Tether, Smith and Thwaites (1997) challenged these findings,claiming that the largest firms have consistently been a disproportionatelyimportant source of innovation in the manufacturing sector of the UK.Also, Craggs and Jones (1998) reported that large firms were three timesmore likely to be novel innovators than their smaller competitors.
At the level of the individual entrepreneur, most start-ups are in non-innovative trades such as hairdressing and car-related businesses (Storey,1994a). Real innovation appears to be confined to a handful of businessesrun by a few skilled, visionary and determined entrepreneurs.
A problem with this whole strand of research is how to define inno-vation. A narrow definition uses the number of patents registered withnational or international patent offices. However, the limitations of patentcount measures are well known. On the other hand, broader definitionsmight include any method or marketing ploy that helps to create com-petitive advantage. Generally, the broader the definition, the higher theproportion of innovations attributable to small firms.

218 The Economics of Self-Employment and Entrepreneurship
One way of trying to overcome these problems is to take a macro ap-proach, regressing aggregate GDP growth rates (for example) on mea-sures of entrepreneurial activity (Blanchflower, 2000; Reynolds et al.,2001, 2002). However, this approach is almost certainly prone to se-vere problems of omitted variable bias, aggregation bias and endogeneity,while its reduced form nature prevents the interpretation of any of theestimated parameters.
Finally, we might ask whether free-market economies achieve the rightbalance between investment in innovation-generating research and en-trepreneurs who bring innovations to market. Michelacchi (2003) stud-ied this issue using a model with free occupational choice where rentsto research and entrepreneurship are fixed exogenously by Nash bar-gaining. Michelacchi showed that, if rents to entrepreneurship are toolow, then an economy could end up wasting research, with insufficiententrepreneurial skills to exploit the innovations produced by researchers.This might justify government intervention to promote entrepreneurship,though it should be noted that entrepreneurial over-investment is alsopossible. However, it is unclear whether Michelacchi’s results are robustto an extension of his model in which rents are endogenously determinedby the productivity of effort in each sector.
9.3 Exit
As explained above, the Jovanovic (1982) model makes several predic-tions about the types of firms that are likely to fail and leave the market,as well as about those that are likely to grow and prosper. This sectionfocuses on the process of exit and its converse, survival. We first present,in subsection 9.3.1, some stylised facts about the survival rates of newventures, the related issue of quits from self-employment, and the tempo-ral distribution of new-firm failures. It is important to note at the outsetthat the continuation of an individual in self-employment is not neces-sary equivalent to survival of a business because an individual can remainself-employed while opening and closing successive businesses. Subsec-tion 9.3.2 briefly describes two important econometric models of firmsurvival; and subsection 9.3.3 summarises the body of empirical resultson firm-specific, owner-specific, and economy-wide factors associatedwith survival.
9.3.1 Survival rates and their distribution
It is now well known that new firms have low survival rates, and thatmany people who set up in self-employment do not remain self-employed

Growth, innovation and exit 219
for long. The evidence relating to self-employed exit rates points tobroadly similar patterns in the USA and the UK. For example, Evans andLeighton (1989b) reported that a third of entrants to self-employmentin the USA leave within three years. Daly (1991) provides similar figuresfor the UK. There is an intriguing possibility that exit rates have exhib-ited stability over very long time spans, with Nenadic (1990), for exam-ple, reporting that the three-year drop-out rate from self-employment innineteenth-century Edinburgh was around 40 per cent.
Not surprisingly, even higher rates of exit from self-employment areobserved during recessions. For example, using BHPS data over the re-cessionary period of 1991–5, Taylor (1999) reported that 40 per cent ofventures that had started since 1991 did not survive their first year in busi-ness. Interestingly, male respondents in this study claimed that the mainreason for exit from self-employment was not bankruptcy (18 per cent),but a move to another job (48 per cent). Broadly similar reasons for exitwere found for females, who generally had lower business survival ratesthan men (see also chapter 4, section 4.2). These bankruptcy figures maybe downward biased if people wanted to avoid admitting personal failureto the survey interviewer, or if they sought other employment prior to animpending bankruptcy. But the figures are striking enough to debunk thepopular belief that most individuals exit self-employment involuntarily,and also suggest that self-employment may be a transitional state betweenperiods of employment, at least for some workers.10
Phillips and Kirchhoff (1989) disputed the ‘prevailing wisdom’ that‘4 out of 5 new [American] firms fail in the first 5 years’. They foundmore favourable survival rates, with 40 per cent of new American firmssurviving for at least six years. Survival and employment growth rates werehighest among new manufacturing firms and lowest in construction, withfirms in service industries being intermediate on both counts. New firmsurvival rates may be higher than this in other countries. For example,Pfeiffer and Reize (2000) reported one-year survival rates in Germany ofaround 90 per cent in the mid-1990s.11
Perhaps surprisingly, high-tech small firms appear to have higher sur-vival rates than firms in more ‘conventional’ sectors (Cooper, 1986;Westhead and Cowling, 1995). This seems to contradict the popularview that high-tech firms are risky, although such a conclusion is notwarranted without taking into account the extra measures that financierstake to screen these ventures and safeguard their investments.
The distribution of failure times of new start-ups is positively skewedand inverse U-shaped. Because it takes time for a firm to build up debts,and for creditors to perceive that a firm is financially troubled and toinitiate bankruptcy proceedings, there is an initial ‘honeymoon’ period of

220 The Economics of Self-Employment and Entrepreneurship
a year or two in which business failures are relatively infrequent. Failuresthen peak at around two–four years, after which the frequency of fail-ures decreases steadily with the length of time the firm has been trading.Mature businesses have low failure rates.12 According to Cressy (1999),the distribution of failure times is temporally quite stable.
Several reasons might explain the inverse U-shaped skewed distribu-tion of failure times. Frank (1988) proposed a particularly interestingidea. Similar to Jovanovic (1982), Frank developed a model in which en-trepreneurs learn about their abilities over time by trying entrepreneur-ship. Unlike Jovanovic, entrepreneurs in Frank’s model must pay a fixedentry cost that is sunk once they have entered the market. Rational en-trepreneurs will therefore enter only if they expect to be of sufficientlyhigh ability that they can recoup their costs. It follows that there will bean initial period with few exits, because even if some entrepreneurs re-ceive poor outcomes in the marketplace, it takes time to disabuse suchconfident people of their initial beliefs. But after a while, even very confi-dent individuals have to face reality, at which point they leave the market.Eventually, the frequency of exits tapers off, once most of the inefficientfirms have left.13
9.3.2 Two useful econometric models of firm survival
Probit/logit models and hazard models are the most widely used tech-niques for quantifying the effects of individual- and firm-specific charac-teristics on the chances of survival in entrepreneurship.
Probit and logit modelsConsider again the probit and logit models described in chapter 1, sub-section 1.6.1. Those models regressed a binary variable zi on a vectorof explanatory variables, Wi , where i indexes an individual observation.One can define zi as equal to one if individual i starts and remains inself-employment after some time interval has elapsed and zero if i hasleft self-employment by this time. Alternatively, in applications where iindexes a particular firm from a sample of firms, zi can be defined asequal to one if the firm is still in business and zero if the firm has left themarket. In both cases the marginal effects of an explanatory variable onthe probability of survival are calculated using (1.11).
Hazard modelsHazard models provide a direct way of identifying the factors thatdetermine how long (rather than whether) individuals remain in

Growth, innovation and exit 221
self-employment, or how long firms remain in the market. For exposi-tional clarity, consider for the moment the case of an individual remainingin self-employment. At each discrete point in time t there is a probability(or hazard) that individual i , who has been observed in self-employmentfor ai periods up to t, leaves self-employment. The Cox proportionalhazard model is described by
Hi (t) = H0(t). exp[β ′Xi (t)] , (9.7)
where H0(t) is the so-called ‘baseline hazard’ at t; Xi is a vector of charac-teristics for individual i ; and β is a vector of parameters to be estimated.This is called a ‘single-risk’ hazard model, because there is only a singlerisk: that of leaving self-employment.
The single-risk model can be estimated without placing restrictions onthe form of the baseline hazard in (9.7). The probability of an individuali ’s spell being completed by time t + 1 given that i was still self-employedat t is
Li (t) = Pr[ai < t + 1|ai ≥ t] = F[γ (t) + β ′Xi (t)] ,
where F[·] is the cumulative distribution function of the Extreme Valuedistribution; and γ (t) is a set of dummy variables, one for each t, whichcaptures time dependence. To estimate the parameters γ (t) and β, letdi be the observed duration of i in self-employment. This is either timecompleted or time censored (by the end of the sample): define αi = 1 ifthe time is completed and αi = 0 if it is censored. Then the log-likelihoodfunction is
lnL =n∑
i=1
{αi
di −1∑t=1
ln[1 − Li (t)] + αi lnLi (di )
+ (1 − αi )di∑
t=1
ln[1 − Li (t)]
}. (9.8)
Equation (9.8) is maximised with respect to β and the γ s to obtain maxi-mum likelihood estimates. The method is implemented on many standardsoftware packages. Note of course that a similar interpretation applies ifi indexes firms rather than self-employed individuals.
Failure may come from more than one source: for example, in-dividuals may leave self-employment for either paid-employment orunemployment. We might be interested to discover, for example, whetherself-employed individuals who exit into unemployment have different sur-vival characteristics from those who exit into paid-employment. If so, a‘competing-risks’ model is needed. Such a model posits a separate haz-ard function for each of the destinations, whose log-likelihoods are given

222 The Economics of Self-Employment and Entrepreneurship
by (9.8) where αi = 1 now denotes exit into the given destination, andαi = 0 applies for other outcomes. The sum of the log-likelihoods overall possible destinations gives the total log-likelihood to be maximised,though in many applications, each destination hazard is estimated as aseparate single-risk hazard where exit as a completed spell is defined onlywith respect to the given destination.
As an example of the potential practical importance of the distinc-tion between single and competing risk formulations, consider the Britishstudy by Taylor (1999). In his competing-risk model, Taylor distinguishedbetween voluntary exit into paid-employment and involuntary exit in theform of bankruptcy. This distinction turned out to be an important one,because while greater personal wealth was associated with a lower malebankruptcy rate in Britain, it had no effect either on voluntary exit or onexit for any reason.
9.3.3 Determinants of entrepreneurial survival and exit
There is an enormous body of research on the individual- and firm-specific determinants of entrepreneurial survival and exit. Rather thanattempt to provide an exhaustive survey of every study, we summarisebelow the key determinants of survival in self-employment (for individ-uals) and business (for firms) in developed countries.14
� Duration. The evidence from hazard and probit models tells a consis-tent story across different countries. The probability of departures fromself-employment decreases with duration in self-employment (Evansand Leighton, 1989b; Carrasco, 1999; Taylor, 1999; Lin, Picot andCompton, 2000), the age of the business, and the tenure of businessmanagers (Westhead and Cowling, 1995; Holmes and Schmitz, 1996;Cressy, 1999; Taylor, 2001). These findings may reflect learning byself-employed business owners about their abilities and the externalenvironment over time (see section 9.1).
� Human capital of the entrepreneur. The bulk of evidence points to a pos-itive relationship between business survival and an entrepreneur’s hu-man capital.15 In particular, previous experience in self-employmenthas been found to increase the probability of survival in a new spellof self-employment or business ownership (Holmes and Schmitz,1996; Quadrini, 1999; Taylor, 1999). This may be indicative of en-trepreneurial learning. In contrast, experience acquired in a manage-rial capacity prior to owning a business seems to have an insignificantimpact on survival in self-employment (Bates, 1990; Boden and Nucci,2000). Current occupational and business experience has stronger ef-fects, with Taylor (1999) finding that professionals and skilled manual

Growth, innovation and exit 223
workers had the lowest self-employment exit rates. In contrast, formaleducational qualifications appear to have mixed effects on survival rates.For example, evidence from the competing-risks hazard model suggeststhat educational qualifications help predict exit by self-employed indi-viduals to paid-employment, but not exit to bankruptcy (Taylor, 1999;and see also Nafziger and Terrell, 1996). Supporting evidence comesfrom the US study of Quadrini (1999), who found that the educationof the head of household did not explain exit from self-employment.Kangasharju and Pekkala (2002) observed that more highly educatedFinnish entrepreneurs had better survival prospects in recessions, butwere more likely to leave self-employment (for paid-employment) inboom conditions.
Age also affects survival rates, which are higher on average for mid-dle aged than for younger or older entrepreneurs (Bates, 1990; Holtz-Eakin, Joulfaian and Rosen, 1994b).16 Cressy (1996) went so far as toclaim that age rather than financial capital is the genuine determinantof survival, financial capital being merely correlated with human cap-ital because borrowers with more human capital tend to request (andobtain) larger loans. However, several other studies have controlled forboth human and financial capital and have found an important role forboth (see, e.g., Bates, 1990; Reid, 1991).
� Size of the enterprise. Numerous studies have confirmed that the smallestfirms have the highest birth and death rates, and that the youngest firmshave the highest death rates – where birth and death rates are definedas the number of births and deaths within a given firm size class as aproportion of the total number of firms in that class.17 These findingsaccord with prediction J.6 of the Jovanovic (1982) model outlined insection 9.1.18
� Financial variables. Most studies report a positive association betweensurvival in business and access to capital. For example, accordingto Bates (1990, 1997), self-employed American males who startedup firms between 1976 and 1982 with above-average amounts of fi-nance were significantly more likely to survive than otherwise compa-rable American males (see also Cooper, Gimeno-Gascon and Woo,1994). Similarly, Taylor’s (1999) hazard model estimates predictedthat survival was highest among British workers who had quitted theirprevious job and entered self-employment with some initial capital.19
Self-finance appears to be more conducive to survival than debt fi-nance does (Reid, 1991). This might be because self-finance is a posi-tive indicator of venture quality (Repullo and Suarez, 2000) or becauseself-finance carries less risk exposure and lower debt-servicing costs.20
According to Lin, Picot and Compton (2000), family finance is also

224 The Economics of Self-Employment and Entrepreneurship
important: having a self-employed spouse reduced the likelihood of ex-its from self-employment in Canada through the provision of a steadystream of family income.
� Innovation. It might be thought that firms that choose to innovateimprove their survival prospects relative to small firms that do not.However, the current body of evidence on this issue is mixed and incon-clusive (e.g. contrast Audretsch, 1991; Agarwal, 1998, with Audretschand Mahmood, 1995). The ambiguity of these results may be at-tributable to the use of aggregate measures of small-firm innovativeactivity in these studies. It might also be informative to disaggregate in-novations by their type. For example, Cosh, Hughes and Wood (1999)found that in Britain product innovations significantly increased theprobability that a small firm was acquired, while process innovationssignificantly decreased the probability of small-firm failure.
� Marketing. The size of the market in which small firms sell their prod-ucts presumably also has an impact on survival. A limited amountof evidence suggests that the broader the market and product range,the greater the probability that small firms survive. For example, Reid(1991) estimated that that a 1 per cent increase in the product grouprange increased the probability that small Scottish owner-managed en-terprises would stay in business by 0.34 per cent, all else equal. Thisresult is consistent with diversification enhancing survival chances, forinstance by facilitating market re-positioning when changing marketconditions reveal profitable new niches (Holmes and Schmitz, 1990).And in an analysis based on German data, Bruderl, Preisendorfer andZiegler (1992) reported that survival rates were higher for firms thataimed their products at a national rather than a local market.
� Macroeconomic conditions– Unemployment. It is now fairly well established that businesses that
start up in conditions of high unemployment have worse survivalprospects than firms that start up in more favourable economic con-ditions. For example, Audretsch and Mahmood (1995) found that inthe USA new-firm hazard rates increase with the aggregate unemploy-ment rate. And using a competing-risks hazard model estimated withBritish BHPS data, Taylor (1999) found that self-employed individ-uals who started businesses in times of high national unemploymentwere more likely to go bankrupt than otherwise comparable individu-als who started up in more favourable national economic conditions.Corroborative evidence has also been reported using time-series data(Hudson, 1989).At an individual level, experience of unemployment also appearsto worsen the survival prospects of businesses. For example, it has
Growth, innovation and exit 225
been established that Spanish self-employed males who were un-employed prior to entering self-employment had hazard rates threetimes greater than those who previously worked in paid-employment(Carrasco, 1999; and see also Pfeiffer and Reize, 2000, for evidencefrom Germany). Thus although the unemployed are more likely toenter self-employment than others (see chapter 3, subsection 3.3.2),many of them seem to be less suited to it in the long term, havinghigher exit rates. The previously unemployed are more likely to haverusty human capital, lower quality information about business oppor-tunities and possibly also lower motivation.
– Interest rates. Time-series studies have consistently found thathigher (nominal) interest rates increase the aggregate rate ofbankruptcies in the UK.21 The US evidence is less clear-cut (Hudson,1989; Audretsch and Mahmood, 1995).22 One reason for a positiverelationship between bankruptcies and interest rates might be higherdebt-servicing costs causing insolvency. Another is that interest ratestend to be high in inflationary conditions, inflation being associatedwith business uncertainty.
� Industry organisation and ownership. Mata and Portugal (1994) estimateda proportional hazard model with Portuguese data, and reported thatsurvival prospects were higher in firms with multiple plants and in in-dustries with high growth rates, and lower in industries with a greaterincidence of entry. These findings have since been corroborated byAudretsch and Mahmood (1994) and Mata, Portugal and Guimaraes(1995).
Bates (1998) asked whether franchisees were more likely to surviverelative to non-franchisees. Reasons for supposing they are includetheir adoption of a proven business format or product, and benefitsfrom advertising and management training provided by the franchiser.Using US CBO data of new-restaurant starts in 1986 and 1987, Batesfound that franchisees did indeed have higher survival rates than non-franchisees, but lower survival rates if franchises owned by large cor-porations were excluded from the sample. Similar findings for the UKhave been obtained by Stanworth et al. (1998).This completes our overview of the salient factors associated with the
demise of new entrepreneurial ventures and the departure of individualsfrom self-employment. For the most part, the discussion has abstractedfrom factors associated with entry into business. However, on a moreaggregated level, it is of interest to ask whether entry and exit rates arerelated dynamically. We conclude by taking a brief look at this question.
Table 9.1 sets out several possible linkages between the aggregate birthrate of new small firms in a region at time t, denoted FBt , and the

226 The Economics of Self-Employment and Entrepreneurship
Table 9.1 Firm birth and death interactions
Expected sign of each effect
Multiplier Competition Marshall
∂FBt+t∂FBt
+ − n.a.∂FDt+t
∂FDt+ − n.a.
∂FBt+t∂FDt
− + n.a.∂FDt+t
∂FBt− + +
Notes: n.a. = Not applicable.
corresponding death rate, FDt . Depending on the nature of the firms thatenter the market, and the market itself, births at t could either promotemore or less births and deaths at a future time t + t, where t > 0. Thesame ambiguities also apply to the effects of firms dying at t on birthsand deaths at t + t. For example, births could promote future births(and retard future deaths), in the case of a new innovative product thatspawns imitators and spin-offs, and so increases the survival prospects ofexisting firms. This is called a ‘multiplier’ effect in Table 9.1. Alterna-tively, births could decrease the opportunity for future births and causethe eventual demise of rivals because of increased competition. This iscalled a ‘competition’ effect.23 In addition, as Marshall pointed out inhis graphic ‘trees of the forest’ analogy of small firm longevity, ‘sooner orlater age tells on them all’ (1930, p. 263). Since (barring takeover) deathinevitably follows birth, this is termed the ‘Marshall’ effect.
It is possible to estimate the structure of birth–death interdependenceusing the following reduced form econometric model:
FBit =m∑
t=1
α1tFBi,t−t +m∑
t=1
β1tFDi,t−t
+m∑
t=1
γ1tXi,t−t + uit (9.9)
FDit =m∑
t=1
α2tFBi,t−t +m∑
t=1
β2tFDi,t−t
+m∑
t=1
γ2tXi,t−t + v1t , (9.10)
where i denotes a region, t is a time period, m is the number of lagsthrough which birth–death interdependence manifests itself, the αs, βs

Growth, innovation and exit 227
and γ s are parameters to be estimated, the uit and vit are disturbancesand X is a vector of macroeconomic variables that potentially affect birthsand deaths (see, e.g., Highfield and Smiley, 1987; Yamawaki, 1990).Longitudinal data are needed to estimate (9.9) and (9.10).
Johnson and Parker (1994) estimated a version of (9.9) and (9.10)without macroeconomic control variables. Their data came from ten yearsof annual British VAT registration and deregistration data in the retailingindustry between 1980 and 1990. Each year contained information foreach of sixty counties. These authors reported rich interdependenciesbetween births and deaths, with lags of up to five years being statisticallysignificant. Multiplier effects dominated in the case of deaths (i.e. fewerdeaths today are associated with fewer deaths and more births in thefuture) and competition effects dominated in the case of births (i.e. morebirths today cause more deaths and fewer births in the future). While thedeep factors underlying this asymmetry are not explained, these findingsmay suggest that researchers should avoid treating firm entry and exitseparately when using aggregated data.24
9.4 Conclusion
This chapter focused on entrepreneurship in ventures that have passed thestart-up stage and are making their way in the competitive marketplace.At the risk of drawing a caricature, the basic facts can be summarised asfollows. Typically, new firms established by entrepreneurs are small. Theentrepreneurs who own these firms learn rapidly about their abilities tosucceed in business and the majority soon become aware that they areunable to compete as successfully as they had anticipated. Most of theseentrepreneurs leave the market between two and four years after entry.Generally, firms that exit are not just young, but also small. In contrast,surviving new firms tend to have higher and more variable growth rates,with rates of growth that often exceed those experienced by larger enter-prises – especially if they are small, run by an experienced and educatedentrepreneur and formed in a low-unemployment environment. Eventu-ally, surviving firms settle down into maturity. A few of them – and itis only a small proportion – experience protracted rapid growth and afraction of these ultimately become the large enterprises of the future.
The model of Jovanovic (1982) formed the theoretical centrepiece ofthe chapter. Jovanovic emphasised the importance of dynamics, with en-trepreneurs learning about their abilities to compete and survive in themarket post-entry. His model provided a useful platform for organisingthe plethora of empirical results that have emerged from the burgeoningliterature on small-firm growth and survival rates. Instead of recapping

228 The Economics of Self-Employment and Entrepreneurship
or summarising that material here, we shall instead consider some of thebroader implications that follow from them.
It is tempting to seek policy recommendations from the findings out-lined in this chapter. While this is perhaps understandable, a few cau-tionary words are in order. First, as Paul Geroski has pointed out, ‘entryappears to be relatively easy, but survival is not’ (Geroski, 1995, p. 23).Much of the policy debate about encouraging enterprise and small busi-nesses focuses on encouraging entry by, for example, removing or relax-ing borrowing constraints or information-related impediments to start-up(see chapter 10). But in view of high small-firm failure rates, this effortmay be misguided. It might be more productive to investigate whethergovernment can and should intervene to help improve survival rates – oreven whether resources could be allocated more efficiently by discour-aging some start-ups altogether. There are echoes here of some of theproposed cures for ‘over-investment’ suggested in the small-firm financeliterature, and discussed in chapter 5.
However, even here practical policy recommendations tend to bevague. As Holtz-Eakin (2000) points out, the literature currently lacksa notion of what the optimal rate of business failure is, making the roleof government policy towards survival rates unclear. But even if we hadthat knowledge, it still does not follow that government intervention isautomatically justified. As a careful reading of the literature makes clear,academic researchers have achieved only limited success in identifyingthe factors that conduce to business survival and growth. While somegeneral findings are now fairly well established, substantial amounts ofvariation in survival and growth rates remain unexplained. And while it isone thing to use some form of multivariate analysis to identify the char-acteristics of high-growth businesses once growth has been achieved, it isquite another to identify high-growth firms in advance. On a case-by-casebasis, we are evidently still a long way from being able to ‘pick winners’;nor is it obviously a good idea to target support on ‘high-flyers’ that arepresumably best placed to thrive without it. It is anyway asking a lot ofgovernment to acquire the necessary information to implement accuratepolicies, even supposing that it can always be relied upon to always acteffectively when dispensing selective assistance.
Another problem is that government policies designed to promotegrowth and survival may have perverse effects. Even well-intended poli-cies could encourage non-targeted firms to change their behaviour inorder to exploit any assistance on offer, or to dilute their incentive tosucceed in the marketplace on their own merits. An example of thisin the context of exit is changes to English bankruptcy law, which is

Growth, innovation and exit 229
currently being reformed to make it more forgiving of business failure.There is a perception that the law has in the past prevented failed en-trepreneurs from re-entering the market and exploiting the valuable ex-perience they have acquired from failing the first time round (Gladstoneand Lane-Lee, 1995). In fact, English bankruptcy law does not comparetoo unfavourably in this respect with that prevailing in many other OECDcountries (OECD, 2000b). According to Fan and White (2002), a morelenient treatment of bankruptcies does stimulate entrepreneurship andincrease the average level of business experience of active entrepreneurs.But it can also give systematically over-optimistic individuals greater op-portunities to repeatedly waste scarce resources in ultimately unviablebusiness propositions. Unscrupulous operators forming temporary enter-prises designed to cheat the public could also abuse laxer bankruptcy laws.
Perhaps general policies that enhance the stock of human capital, andincrease the incentives to innovate, are more promising ways of promot-ing entrepreneurship and growth. After all, more educated entrepreneurstend to run firms that grow faster (though not ones that necessarily sur-vive for longer). Also, promoting high-tech enterprise might increaseoverall survival rates, to the extent that these firms have better survivalprospects than ‘conventional’ firms. Examples of possible policies includetax breaks for innovative start-ups and R&D; government funding of uni-versity innovation-based research; and investment in basic education andskills. Even if the policies do not ‘work’ directly in generating higher levelsof entrepreneurial activity, they might still be justified in terms of theirpositive impact on the economy’s human capital stock. Of course, manycountries have policies designed to foster innovation and entrepreneur-ship; but a question mark hangs over the true ‘additionality’ of thesepolicies. More research needs to be undertaken on this issue specifically,and on the micro-level relationships between innovation, survival, growthand government policy more generally.
NOTES
1. See Brock and Evans (1986, pp. 60–3) for a relaxation of this assumption.2. Reinvestment of profits may promote growth by enabling small firms to attain
the industry’s minimum efficient scale (Audretsch, 1991) or to circumventborrowing constraints (Parker, 2000).
3. See Hall (1987), Reid (1993) and Hart and Oulton (1996). A very smallnumber of small firms enjoy dramatic growth rates (Reid, 1993; Storey, 1994a;DTI, 1999). For example, the DTI (1999) estimated that only about 1 per centof new business start-ups in the UK eventually achieve a turnover in excess of£1million.

230 The Economics of Self-Employment and Entrepreneurship
4. For example, using data on 8,300 small US firms over 1976–82, measuringfirm size in terms of employment, and controlling for industry and regionalfactors, Brock and Evans (1986) reported the following estimates of (9.6):γ1 = −2.25, γ2 = −0.35, γ3 = −3.02 and γ5 = 0.98. All these estimates weresignificantly different from zero, and were robust to sample-selection biascaused by surviving firms having higher growth rates. However, a caveat isthat there may be a lag before growth occurs. According to Phillips and Kirch-hoff (1989), only 10 per cent of new firms between 1976 and 1986 grew inemployment terms in the first four years, but over half had grown within eightyears.
5. See Evans (1987a, 1987b), Cooper, Woo and Dunkelberg (1989), Dunne,Roberts and Sammelson (1989a), Audretsch (1991), Davis and Haltiwanger(1992), Variyam and Kraybill (1992), Mata (1994), Barkham, Hart andHanvey (1996) and Goedhuys and Sleuwaegen (2000). Geroski (1995) andSutton (1997) review the literature.
6. See Cooper and Bruno (1977), Johnson and Rodger (1983), Roberts (1991),Cooper, Gimeno-Gascon and Woo (1994) and Barkham, Hart and Hanvey(1996). Multiple founders have a broader base of skills and experience andmay give each other psychological support.
7. For US evidence of insignificant effects from gender on gross business earn-ings growth rates, see Kalleberg and Leicht (1991). Cooper, Eimeno-Gasconand Woo (1994) reported positive and significant effects on growth fromstarting capital.
8. These included firm size, the owner’s education and multiple sources of fund-ing.
9. See Scherer (1980, pp. 407–38, 1991), Acs and Audretsch (1988), Audretsch(1991), Cohen and Klepper (1996) and Klepper (1996). These findings re-fute Schumpeter’s prediction of ever-increasing concentration of innovationin large firms.
10. See also Lin, Picot and Compton (2000), who showed that a much higherproportion of Canadians who left self-employment departed the labour forcealtogether, than Canadians who left paid-employment.
11. See also Fuest, Huber and Nielsen (2002), who cited OECD data from thelate 1980s displaying marked cross-country variations in entrants’ businesssurvival rates. According to these data, between 30 and 50 per cent of newentrants survive for seven years. The highest survival rates were observed inFrance and Portugal; the lowest in Finland and the UK.
12. See Altman (1983) and Hudson (1989) for US evidence and Hudson (1987b)and Cressy (1999) for UK evidence.
13. One implication, noted by Frank (1988), is that failing entrepreneurs remainin the market not because they mistakenly believe that they should conditiontheir behaviour on sunk costs, but because of their strongly held prior beliefthat they are intrinsically able (but unlucky). For rational decision makerssunk costs are bygones; and ‘bygones are bygones in love, war and economics.’
14. Applications to developing countries are less common, though seeNziramasanga and Lee (2001). Bates (1999) analysed the duration of self-employment among Asian immigrants into the USA.
Growth, innovation and exit 231
15. See Brock and Evans (1986), Bates (1990, 1997), Bruderl, Preisendorfer andZiegler (1992), Cooper, Gimeno-Gascon and Woo (1994), Cressy (1996,1999), Gimeno et al. (1997), Bruderl and Preisendorfer (1998), Taylor(1999), Boden and Nucci (2000) and Kangasharju and Pekkala (2002). Thisfinding appears to hold for males and females of all ethnic groups, thoughfailure rates tend to be higher for women, blacks and non-founders than fornon-minority male founders (Holmes and Schmitz, 1996).
16. However, the effects of age on survival in self-employment may be unstablethrough time (Holtz-Eakin, Joulfaian and Rosen 1994b; Cressy, 1996; Taylor,1999), reflecting the state of the business cycle.
17. UK studies include Dunne and Hughes (1994), Storey (1994a), Westheadand Cowling (1995) and Hart and Oulton (1996). US studies include Brockand Evans (1986) Evans (1987a, 1987b), Cooper, Woo and Dunkelberg(1989), Dunne, Woo and Dunkelberg (1989a), Audretsch (1991), Audretschand Mahmood (1995) and Gimeno et al. (1997). For evidence on Portugaland Germany, see Mata and Portugal (1994), Bruderl, Preisendorfer andZiegler (1992), and Bruderl and Preisendorfer (1998), respectively.
18. There are limitations to the generality of this result, however. According toAgarwal and Audretsch (2001), this relationship does not hold for maturestages of the product lifecycle, or for technologically intensive products. Also,firm size must be viewed as relative to the minimum efficient scale in theindustry of which the firm is a member. New-firm survival is lower in indus-tries where scale economies are important (Audretsch, 1991; Audretsch andMahmood, 1995).
19. See also Hall (1992), whose survey of reports from the British OfficialReceiver showed that about one-quarter of insolvencies were attributable tounder-capitalisation and the poor management of debt by the former owners.
20. However, exclusively self-financed firms might be expected to have lower prob-abilities of survival, because banks that refuse to lend to the riskiest ventureproposals must therefore depend entirely on self-finance (de Meza and Webb,1988). Also, the most unrealistically over-optimistic entrepreneurs would nat-urally prefer to use their own funds than to borrow at a higher interest ratefrom banks (de Meza and Southey, 1996).
21. See Wadhwani (1986), Reid and Jacobson (1988), Storey et al. (1987) andHudson and Cuthbertson (1993). A dissenting view is found in Simmons(1989), although see Keeble, Walker and Robson (1993) for a critique ofSimmons’ work.
22. Many of these studies may be sensitive to the spurious regression problem out-lined in chapter 1, subsection 1.6.4. Other macroeconomic variables have alsobeen linked with exit in aggregate studies. See, e.g., Audretsch and Mahmood(1995), who found a greater hazard for US manufacturing firms facing higherwages, and Cressy (1999), who found that GDP growth positively impactedon small British firms’ survival probabilities.
23. This concept is related to, but distinct from, that of the ‘seedbed’, accord-ing to which some small firms will go on to grow and become the successfullarge job-creators of the future, displacing older incumbents. Beesley andHamilton (1984) defined ‘seedbed’ industries as those with high birth and

232 The Economics of Self-Employment and Entrepreneurship
death rates. They identified such industries in terms of the degree of ‘tur-bulence’, commonly defined as the ratio of the sum of birth and death ratesto the existing stock of businesses. Reynolds (1999) showed that a variety ofjob and establishment turbulence measures were significantly correlated withannual regional job growth in the USA, which he interpreted as evidence ofcreative destruction.
24. Subsequently Kangasharju and Moisio (1998) broadly replicated these find-ings, using Finnish data and a more efficient instrumental variables estimator.One difference was their finding that deaths had a major impact on futurebirths and deaths in Finland, whereas births made relatively little differenceto the dynamics. However, Johnson and Parker (1996) found that the inclu-sion of macroeconomic variables in (9.9) and (9.10) eliminated some of thelagged birth/death effects – something that Kangasharju and Moisio (1998)did not take account of.

Part IV
Government policy


10 Government policy: issues and evidence
Government interventions in market economies can impact heavily onboth the welfare of entrepreneurs and the size of the entrepreneurshipsector. Government intervention is often motivated by a belief that en-trepreneurs generate important positive social and economic externali-ties, such as new ideas, new products, new employment and enhancedcompetitiveness. If entrepreneurs are unable to appropriate all of thesebenefits themselves, there may be too little private investment for thesocial good, making a case for government intervention.
Many governments also see entrepreneurship as a route out of povertyand dependence on state benefits, and as a means of achieving self-reliance. At the same time, though, governments often evince concernabout the living and working conditions of the poorest and most vul-nerable workers, who are often found in entrepreneurship, either as self-employed business owners or as employees of the self-employed.
In most developed economies, the main channels of government inter-vention are through the credit market, the tax system and expenditureon assistance and advice. Government regulation can also affect the per-formance of entrepreneurial ventures. This chapter provides an overviewof both the theory and evidence relating to government intervention inthese areas.
The chapter is organised as follows. Section 10.1 describes and analy-ses government interventions in the credit market. Sections 10.2 and 10.3develop the theory of taxation and entrepreneurship, with regard to theincome tax system and tax evasion and avoidance. Section 10.4 presentsevidence about the effects of taxation on entrepreneurship, including is-sues related to tax evasion and under-reporting of self-employment in-comes to the tax authorities. Section 10.5 briefly surveys various formsof direct government assistance to entrepreneurs, and the impact of reg-ulations on small firms. Section 10.6 concludes.
235

236 The Economics of Self-Employment and Entrepreneurship
10.1 Credit market interventions
Chapter 5 reviewed the theoretical case for credit rationing and under-investment in entrepreneurial ventures. This case has received substantialattention in policy circles and has motivated various kinds of governmentintervention, especially loan guarantee schemes (LGSs). In this section,we first describe such schemes, before evaluating their appropriatenessin terms of theoretical models of credit rationing. Then evidence on theiractual performance in the UK and USA is reviewed. Finally, we brieflydiscuss other forms of government intervention in credit markets.
10.1.1 Loan Guarantee Schemes
OrganisationLGSs provide a government-backed guarantee to encourage banks andother financial institutions to lend to small firms who are unable to raiseconventional finance because of a lack of security or an established trackrecord. LGSs are widespread, with versions operating in the USA, theUK, France, Germany and Canada and several other countries.
Although the details vary between countries – and within given coun-tries depending on the type of loan1 – the basic principles of a LGS are thesame. A LGS typically guarantees finance for both new start-ups and go-ing concerns. Only borrowers unable to secure a conventional loan froma bank, and in non-proscribed industrial sectors,2 may apply for a loanguarantee. A bank nominates ventures for approval by the governmentand administers the loans. Conditional on approval by the government,the bank takes the usual repayment if the venture succeeds. If it fails, thebank is liable only for a fraction of the loss, with the rest borne by thegovernment. In the USA, the Small Business Administration (SBA) un-derwrites between 75 and 80 per cent of loans; in the UK, the British gov-ernment underwrites between 70 and 85 per cent. Borrowers are chargedan arrangement fee, and pay the usual market rate plus a small premium.Operational costs can be substantial (see table 10.1 for details on this andother aspects of LGSs in several countries).
Theoretical perspectivesCan governments without access to inside information about en-trepreneurs’ ventures use a LGS to improve on the competitive equi-librium under asymmetric information? If financial markets were effi-cient, one would expect all loans involving reasonable degrees of risk andpromising reasonable rates of return on capital to be made by private-sector lenders. Any rejected loan applications would reflect exceptional

Government policy: issues and evidence 237
Table 10.1 Features of LGSs in the UK, the USA, France, Germanyand Canada
Terms UK USA France Germany Canada
Maximum 70–85% 75–80%a 50–65%b 80% 85%guarantee
Arrangement fee 1% of loan 2–3.875% None 0.75% 2% of loanof guarantee of guarantee
Loan premium 1.5% of loan 0.5% of 0.6% of 0.8–1% of 1.25% ofcredit credit credit credit
Loan term 2–10 years 7–25 years 2–15 years 15–23 years 0–10 yearsNumber of 6,942 45,300 5,000 6,850 30,765
guarantees (1996–7) (1997) (1996) (1996) (1997)Net cost of £46million £95million £36million n.a. £42.5m
scheme (1997–8) (1998) (1996) (1997)
Notes: a 70 per cent for start-ups; 85 per cent for firms with at least two years’ tradinghistory.b 65 per cent for start-ups. n.a. = Not available.Source: KPMG (1999, table 4.1).
levels of risk; and any government-backed lending to facilitate such ven-tures would therefore be expected to result in high default rates. However,if the financial market for small-firm lending is inefficient – a possibilityexplored in chapter 5 – then the case for government intervention incredit markets may be stronger. A few studies have addressed this issuedirectly, the most notable being a pair of papers by William Gale.
Using a simple model with two types of agent, one high-risk (b), andone low-risk (g), Gale (1990a) showed how a LGS can actually be self-defeating. In line with the analysis of chapter 5, banks would ideallyprefer to fund gs to bs, but under asymmetric information they cannotobserve these types directly from the pool of loan applicants. All agentsare assumed to have socially efficient ventures, so if there is any creditrationing it entails an efficiency loss. A crucial assumption made by Galeis that it is costly for banks to seize collateral C when ventures fail, soany policy that discourages the use of collateral will increase efficiency inthis respect. There are two possibilities: (a) collateral is plentiful, and (b)collateral is limited.
Consider (a) first. When collateral is available, the analysis of subsec-tion 5.1.3 can be applied. In terms of figure 5.4, C is the BAD, and aseparating equilibrium exists, in which gs choose a low-D, high-C con-tract �g (where D is the interest repayment) to differentiate themselvesfrom bs who choose a high-D, low-C contract, �b. There is no credit ra-tioning. Now the introduction of a LGS targeted only at g-type ventures
238 The Economics of Self-Employment and Entrepreneurship
would make the �g contract more attractive because competitive bankswould have to pass on the benefit of lower default penalties to their cus-tomers. So to restore separation of types under incentive compatibility,gs would have to post greater C than before, reducing efficiency. Here isone example of how a LGS can actually be counter-productive. But ifthe LGS applied to b-type contracts only, or to both contracts simulta-neously, the effect is to decrease the relative attractiveness of �g to bs,so that gs can separate themselves by posting less collateral. Under theassumption of costly collateral realisation, this yields a clear efficiencyand welfare gain.
Case (b), with limited collateral, is more interesting, for two reasons.First, it is the situation that most frequently motivates the use of LGSsin practice (Bates, 1984; KPMG, 1999). Second, the policy implicationsare striking: Gale showed that banks might respond to a LGS by rationingcredit further. To see this, note that because collateral can no longer beused to separate types, some other device must be sought. Following theanalysis of subsection 5.1.3, random rationing of credit in the �g contractwill serve the purpose. Thus we start with a separating equilibrium where,in terms of figure 5.4, BAD is the probability of being credit rationed. Inequilibrium, bs select �1
b =(high-D, ‘zero-credit rationing’) contracts, andgs choose �1
g =(low-D, ‘positive probability of credit rationing’) contracts.A LGS targeted on the rationed gs increases the probability that a rationedborrower obtains a loan under �1
g , i.e., it reduces BAD so that bs may nowcovet �1
g . To preserve separation, banks have to counteract the LGS policyby restricting credit further. Thus the government’s policy is frustratedby the reactions of private-sector agents, and overall welfare decreases.The only way of increasing efficiency and welfare in this scenario is totarget LGS-backed loans on the unrationed high-risk group, i.e., the bs;but because governments usually try to target assistance on rationed loanapplicants, this policy seems somewhat counter-intuitive.3
Although interesting, Gale’s analysis seems of limited relevance forreal-world applications of LGSs. There is no credit rationing in scenario(a) of Gale’s (1990a) model. Everyone obtains a loan; the only rationalefor introducing a LGS is to reduce the use of inefficient collateral. Butthis is contrary to the real-world LGS rationale of increasing the volumeof lending. While this rationale is applicable in scenario (b), where thereis initially credit rationing, it seems unrealistic that the good risks arecredit rationed (see subsection 5.1.3). And in both scenarios, the realismof a model without any pooling of entrepreneurial types seems limited.
Different results are obtained from Gale’s second model (1990b),which is arguably more realistic. Gale started with a set-up based onthe Stiglitz and Weiss (1981) (SW) model, with two identifiable sets of

Government policy: issues and evidence 239
borrowers: general, and targeted. Among the targeted borrowers theremay be multiple observable groups (as in SW and Riley, 1987). Initially,the economy may be characterised by market-clearing, redlining or creditrationing equilibria. Gale derived four key results. First, unsubsidisedgovernment interventions merely substitute publicly provided credit forprivately provided credit, and so are ineffective. A subsidy element isneeded to improve on the competitive equilibrium – which explains whygovernment credit programmes tend to lose money in practice, as shownin table 10.1. Second, if credit rationing exists in the initial equilibrium,a subsidised loan guarantee is more effective than an interest subsidy.Third, with multiple target groups subject to rationing or redlining, a sub-sidy to one group may increase banks’ expected returns by so much thatother, initially non-rationed, groups may become rationed or redlined.4
Fourth, interest subsidies funded by lump-sum taxes can increase socialefficiency by mitigating adverse selection, as in SW.
Innes (1991) analysed an asymmetric information model in whichunder- or over-investment (though not credit rationing) can occur. Het-erogeneous entrepreneurs can choose loan sizes, and there is scope forhigh-ability entrepreneurs to signal their types by asking for loans thatare larger than the socially efficient level. Innes showed that a LGSis an ineffective means of intervention. The reason is instructive. Thegovernment’s absorption of some of the default costs provides a posi-tive incentive for entrepreneurs to make inefficient investment choices.Large maximum guarantee levels simply exacerbate over-investment byentrepreneurs, with the complicity of banks whose downside risks arecovered by the government.
EvaluationIn practice, as table 10.1 shows, the charge to the government of failedguaranteed ventures can be high, so it is important to evaluate the effec-tiveness of these schemes.5 The success of a LGS is limited by severalfactors. One possibility is that some borrowers would have received aloan in the absence of the LGS. That is, the ventures financed under thescheme are not truly ‘additional’, imposing a deadweight cost. A second isthat a LGS encourages self-selection of the riskiest ventures, while reduc-ing the bank’s incentive to evaluate thoroughly the viability of investmentproposals (Rhyne, 1988). The severity of this problem can be expectedto increase in line with the loan guarantee fraction. This requires carefulscreening by bureaucrats; but they may be poorly equipped to make suchjudgements. Third, successful start-ups financed by a LGS may displaceexisting enterprises. This is thought to be a particular problem in retail-ing, catering and motor vehicle maintenance in the UK, for example.6

240 The Economics of Self-Employment and Entrepreneurship
Another limiting factor is that the scale of LGSs is often small in rela-tion to the rest of the market. Guaranteed loans in the UK and the USAcomprise only about 1 per cent of all small and medium-sized enterprise(SME) on-lending by value, making it a marginal source of lending tothe SME sector.7
Bosworth, Carron and Rhyne (1987) conducted a thorough evalua-tion of the SBA’s LGS. Bosworth, Carron and Rhyne started with an‘optimistic’ estimate that around 20 per cent of SBA-backed loans werenon-additional. Applying an empirically-based 23 per cent default ratefor the whole portfolio, this means that only 60 per cent of SBA loanscould generate benefits to offset the costs of the scheme, requiring a netsubsidy of 8.7 per cent. Thus the economic benefits required for thescheme to break even were 14.5 (=8.7/0.6) per cent of the loan amount –over and above the mandated loan repayments.8 Bosworth, Carron andRhyne and Rhyne (1988) doubted whether the economic benefits wouldbe as great as this.
Some detailed evaluation evidence has also been compiled for the UK’sSmall Firm Loan Guarantee Scheme (SFLGS). Survey work by KPMG(1999) estimated that around 70 per cent of SFLGS-supported firmswere ‘finance-additional’ (i.e. would not have been financed without theinvolvement of the LGS), and leveraged £161 million of additional pri-vate finance between 1993 and 1998. However, survey results identifiedhigh displacement rates of between 76 and 86 per cent. This limited theemployment creation contribution of guaranteed ventures to between 0.3and 0.6 jobs per firm in the eighteen months following the loan, amount-ing to under 10,000 net additional jobs in total. The net additional costper job charged to the government was estimated at between £9,500 and£16,600.
Naturally, there might be other supply-side benefits from LGSs that arehard to quantify, such as greater competitiveness caused by the creationof LGS-backed ventures, and the benefit of keeping initially strugglingbusinesses afloat that might develop profitably and grow in the future.Early evidence pointed to high failure rates of LGS-backed businesses(Bosworth, Carron and Rhyne, 1987; Rhyne, 1988); but since then theUK and US LGSs have been made more stringent with lower guaranteefractions. This is reflected in more recent UK evidence that LGS-fundedbusinesses do not have higher failure rates on average than non-LGS-funded businesses (KPMG, 1999). In addition, Cowling and Mitchell(1997) provided some econometric evidence that the SFLGS had a pos-itive if modest effect on the aggregate UK self-employment rate. But allthis evidence is only mildly supportive of LGS programmes. While they

Government policy: issues and evidence 241
do not do much obvious harm, they do not appear to do very much goodeither.
10.1.2 Other interventions
The US Federal government issues direct loans to small businesses,mainly in rural sectors (Gale, 1990b). Total disbursements under theSBA’s Small Business Investment Companies and Minority InvestmentCompanies programmes reached $680 million by 1987. However, thescale of direct US Federal lending has declined over time, with a movetowards guarantees rather than loans.9 State governments, which eitherprovide loans directly or in conjunction with private lenders, have takenup some of the slack. Some states also provide venture capital in the formof equity investments, either directly or indirectly via state-subsidisedventure capital companies (Smith and Stutzer, 1989). In the UK, directgovernment lending is less common than grants from local or regionalagencies, although centrally funded grants and equity investment schemeshave been implemented, including SMART for innovative ventures innew and small firms, the Business Expansion Scheme and the EnterpriseInvestment Scheme (see, e.g., Deakins, 1999, chapter 8, for details).
Using a simple model of credit rationing as a screening device (seesubsection 5.1.3 and the discussion above), Smith and Stutzer (1989)analysed the effects of government loans on the extent of credit rationingand efficiency. The analysis is essentially the same as for Gale’s (1990a)model with limited collateral, discussed above. In response to loans thatreduce credit rationing of g borrowers, banks ration credit further torestore efficient contracting. Thus in this model a policy of using loansto reduce credit rationing is counter-productive because it works againstthe wishes of private-sector agents, who counteract its effects.
Government grants and loans might be expected to have a positiveimpact on employment, unless there is crowding out via displacement.Wren (1998) calculated the effects on employment among English man-ufacturing firms of government capital grants and rent assistance. Wrenreported that grants had greater long-term employment effects on newsmall firms than on their older and larger rivals – despite the lower survivalrates of the former relative to the latter. However, the absolute numbersof jobs created were quite small. For example, even before accounting fordisplacement and opportunity costs of funds, Wren estimated that capitalgrants generated just 0.082 job per £1,000 after five years, with an impliedgross direct cost per job to the exchequer of £12,195 (=1,000/0.082). Thecorresponding figure for large firms was 0.004, which was insignificantly

242 The Economics of Self-Employment and Entrepreneurship
different from zero. Wren conjectured that the (slightly) greater effect forsmall firms reflected their higher marginal cost of external funds, whichmade them more responsive to assistance.
10.2 Taxation, subsidies and entrepreneurship: theory
The material in this section builds on that of chapter 2, section 2.2,which analysed models of occupational choice and participation in en-trepreneurship. Those models did not incorporate government activities,an omission that is rectified below.
One reason why governments might seek to alter occupational choicesrelates to risk. Entrepreneurship is commonly regarded as a risky activity,so with missing or incomplete markets for risk sharing, private risk-averseagents might undertake insufficient risk taking from society’s perspective.Even developed economies tend to lack insurance markets that smoothentrepreneurial incomes over time or between risky and safe occupa-tions. The absence of such markets may be attributable to moral hazardproblems, for instance where entrepreneurs would supply less effort in re-sponse to having income insurance. Also, capital indivisibilities, fixed set-up costs and signalling considerations may prevent entrepreneurs fromdiversifying their risk by operating several ventures concurrently. Whilepartnerships can be used to share some risks in principle, they can rarelydiversify all risk and tend to be used by only a minority of entrepreneursin any case. There might therefore be a case for government interventionto favour risky activities.
Set against this, the elimination of risk can be costly, and govern-ments might not have a cost advantage over the market (Black and deMeza, 1997). And if there is over-investment in entrepreneurial activi-ties, then entrepreneurship should be discouraged, rather than encour-aged (de Meza, 2002). Also, tax-favouring small firms but not large onespresumably involves withdrawing the subsidy as firms grow – which canact as a perverse tax on growth (Holtz-Eakin, 2000).
In principle, the government has at its disposal several policy instru-ments for affecting occupational choice between ‘risky’ and ‘safe’ occupa-tions. The discussion below will focus specifically on the personal incometax (IT) system. We will not consider interest taxes or subsidies, whoseeffects on occupational allocations under asymmetric information havealready been analysed in chapter 5. In addition we will not analyse cor-porate taxes because only a minority of entrepreneurs run incorporatedbusinesses that are liable to them.10
The relationship between income taxation and entrepreneurship iscomplex in all but the very simplest cases, an example of which is afforded

Government policy: issues and evidence 243
by the Lucas (1978) model described in chapter 2, subsection 2.2.3. InLucas’ model, individuals have heterogeneous entrepreneurial abilities x;a cut-off level of ability x separates those who become entrepreneurs (withx ≥ x) from those who become employees (with x < x). The cut-off abil-ity is defined implicitly by the condition π(x) = w, where entrepreneurialprofit π is an increasing function of ability, and where w is the employeewage. A flat-rate (or excess profit) tax τ ∈ (0, 1) on entrepreneurs’ profitschanges the cut-off ability to ˜x, defined by [1 − τ ]π( ˜x) = w. Evidently˜x > x, so entrepreneurs with abilities in the range x ∈ [x, ˜x) close downtheir firms and switch to paid-employment. The extra supply of labourdecreases the employee wage, while the smaller number of firms impliesexcess demand for their goods, so increasing their prices. Thus largerfirms gain from the tax at the expense of smaller ones, and may actuallybecome better off on net. The simple message that follows is summarisedby the following quotation from the UK Employment Department, whenreviewing the impact of UK income tax cuts in the 1980s: ‘A more ben-eficial tax regime has been an important factor in stimulating enterprise’(1989, p. 16).
Part of the reason for the clear-cut policy advice just enunciated is thatit came from a model that abstracted from risk. More complicated andsubtle results emerge from models that recognise the risk-bearing role ofentrepreneurship. A key model that provides a good entry point to thetheoretical literature on risk taking, IT and entrepreneurship is Kanbur(1981). Kanbur’s model has the following features. A single good is pro-duced by entrepreneurs using a strictly concave stochastic productionfunction q (H, �), where H is the number of paid-employees hired byeach entrepreneur, and � is a random variable from which firms receiveindependent draws. Here as in all the other models discussed below, thesize of the workforce is normalised to unity. Employees receive a safecompetitive wage w which adjusts to clear the labour market. Identicalrisk-averse individuals have a concave (risk-averse) utility function U(·)and choose between becoming an entrepreneur entitled to risky residualprofits or a worker earning w with certainty. Labour supply is exogenouslyfixed. Price flexibility ensures full employment.
Consider a policy of differential income taxation, under which a pro-portional subsidy rate ς > 0 is applied to wage income, financed by aproportional tax rate τ > 0 levied on risky entrepreneurial profit income,π := q (H, �) − w H. Individuals are indifferent between the two occupa-tions when
V(τ, w) := maxH
EU [(1 − τ )π] = U [(1 + ς)w] . (10.1)

244 The Economics of Self-Employment and Entrepreneurship
This tax system has three offsetting effects: (1) Taxation reduces post-taxincomes in entrepreneurship, making entrepreneurship less attractive. (2)Taxation smooths entrepreneurs’ incomes over different states, provid-ing insurance that makes entrepreneurship more attractive. And (3) thisbenefit of risk pooling increases the demand for labour, pushing up wagesrelative to profits (Kihlstrom and Laffont, 1983b).
By the normalisation rule, the proportion of the workforce inentrepreneurship is nS = [1 + H(τ, w)]−1, where H(τ, w) := argmaxV(τ, w). The government’s objective is to maximise a utilitarian socialwelfare function, �, defined on post-tax utilities:
� := nSV(τ, w) + [1 − nS]U [(1 + ς)w] . (10.2)
Maximising � with respect to τ , and evaluating the result from a positionof no government intervention gives the result
d�
dτ
∣∣∣∣τ=ς=0
= E(π)E(Uπ ) − E(πUπ )HE(Uπ ) + Uw
.Uw > 0 .
That is, government should tax the risky occupation and subsidise thesafe one. The reason is that the gain made by each employee more thanoffsets the loss incurred by each entrepreneur, whose losses are in anycase mitigated by the income smoothing provided by the tax.
Under assumption 1 of chapter 2, subsection 2.2.1, i.e., decreasingabsolute risk aversion, Kanbur also showed that positive taxation of en-trepreneurs’ profits decreases the equilibrium number of entrepreneursrelative to the no-tax outcome.11 Kanbur interpreted this to mean thatthere are too many entrepreneurs in the market equilibrium relative tothis higher welfare equilibrium.
It should be noted that lump-sum taxes or subsidies alone would beineffective in this model because they would not reduce the varianceof entrepreneurs’ profits. In contrast, a proportional income tax ap-plied to both occupations with a lump-sum component is effective – andhas ambiguous effects on the equilibrium number of entrepreneurs. Letτ := 1 − β be the uniform marginal tax rate and let γ be the lump-sumcomponent of the linear tax system. The case of β = 1 corresponds tothe free-market solution and β = 0 to the case of 100 per cent taxationand redistribution. It is assumed that the tax system raises zero net rev-enue, so γ is determined endogenously by β. Individuals are indifferentbetween the two occupations when
maxH
EU {γ + β[q (H, �) − w H]} = U (γ + βw) . (10.3)

Government policy: issues and evidence 245
As β goes to zero, risk is completely pooled, incomes are equalised, andsocial welfare (10.2) approaches its maximum. However, and in con-trast to the earlier results, the effect on the equilibrium number of en-trepreneurs is ambiguous. Not even assumption 1 of subsection 2.2.1provides enough structure in this general case to sign the overall effect.Even further complications arise if the tax decreases the optimal cap-ital stock of enterprises, since with any given distribution of personalwealth, business entry becomes easier and so the equilibrium number ofentrepreneurs can actually increase (Kihlstrom and Laffont, 1982).
Boadway, Marchand and Pestieau (1991) showed that Kanbur’s socialwelfare result is robust to extensions where abilities and risk attitudes areheterogeneous, but not to non-pecuniary returns that differ between oc-cupations. In the latter case, the optimal β is less than 1, reflecting a trade-off between equity, efficiency and insurance considerations. However, inother models, stronger results can be obtained. Using a two-sector gen-eral equilibrium model, Black and de Meza (1997) showed that a subsidyto the risky sector (entrepreneurship) paid for by taxing the safe sector(paid-employment) can actually benefit all parties, implying a Pareto im-provement. Entrepreneurs gain from income smoothing and the subsidy,leading to net entry into entrepreneurship; but this promotes competitionthat decreases the price of the risky-sector good consumed by employees.That benefit can outweigh the cost of the subsidy that employees provide.
The analysis so far has considered a linear IT system. In contrast,the tax schedules in most countries are non-linear functions of income,usually piecewise linear and progressive. If entrepreneurs’ profits are un-certain, a progressive tax system acts as an income smoothing device,which can be expected to encourage participation in entrepreneurship.12
Kanbur (1982) used this reasoning to refute the popular assertion that‘entrepreneurial’ societies tend to be unequal ones. If individuals are riskaverse and if measured inequality depends in part on the inequality ofentrepreneurs’ incomes, then an increase in entrepreneurs’ income in-equality can increase overall inequality while decreasing the number ofentrepreneurs.
In practice, most IT systems tend to treat entrepreneurs and employ-ees more or less equally. Exceptions to equal treatment include specialtaxes levied on the self-employed (e.g. the self-employment SECA taxin the USA: see Joulfaian and Rider, 1998); lower social security en-titlements for the self-employed reflected in lower mandated social se-curity contributions (as is common in many countries: OECD, 1994b);and greater opportunities for legal tax deductibility and illegal tax eva-sion in self-employment. Examples of legal deductions include business

246 The Economics of Self-Employment and Entrepreneurship
expenses (in most countries), private pension contributions (e.g. Keoghplans in the USA), and capital gains exemptions (as in the USA: see Holtz-Eakin, 2000). There is also a difference in inheritance tax treatment insome countries, where favourable provisions can facilitate intergenera-tional transfers of small businesses (OECD, 1998).
An interesting policy question is whether entrepreneurs ought to facethe same IT schedule as employees. This issue has been analysed byPestieau and Possen (1992) and Parker (1999a). For example, Parkercalibrated a simple model of occupational choice using data from the UKeconomy in the mid-1990s. He solved for the optimal linear differential ITrates that maximised utilitarian and inequality-averse social welfare func-tions. The key finding was that governments should tax entrepreneurs ata lower marginal rate than employees. This policy encourages entry intoentrepreneurship because that occupation has generated higher incomesthan paid-employment on average, despite bearing greater risk (see alsoParker, 2001). One way of implementing a differential tax is to adjust theparameters of counter-evasion policies to tolerate a desired amount oftax evasion by the self-employed (see below for more on this). However,the applicability of Parker’s optimal policy may be limited, because theself-employed appear to be less productive than employees in some othercountries (see chapter 1, subsection 1.5.1). Also, an optimal linear dif-ferential tax might be dominated by non-linear differential taxes – aboutwhich little is known at present.13
To conclude, the theoretical literature does not provide clear-cut pre-dictions about the effects of income taxes on either the equilibriumnumber of entrepreneurs or social welfare. The reason is that when en-trepreneurs are heterogeneous, risk averse and vulnerable to uncertainty,income taxation impacts on the attractiveness of entrepreneurship andsocial welfare in diverse ways. One effect is on efficiency, for example iftaxes are distortionary. A second effect is on equity, because tax systemsredistribute incomes. Another effect is on risk sharing because incometaxes can effectively insure entrepreneurs. These effects may all offseteach other; and even strong restrictions on preferences and technologycannot be guaranteed to simplify matters enough to deliver straightfor-ward predictions. The inescapable conclusion is that theory itself is un-likely to resolve the issue, and that data are needed to identify the salienteffects. That is the subject of section 10.4.
10.3 Tax evasion and avoidance: theory
There are two principal reasons why entrepreneurs might pay differ-ent amounts of tax than employees with the same pre-tax incomes:

Government policy: issues and evidence 247
(1) Allowable cost deductions in self-employment (such as business ex-penses), and the leeway to draw up accounts to practice intertemporaltax-shifting;14 and (2) Differing effectiveness of tax enforcement by in-come source, resulting in different incentives for income under-reportingand tax evasion by the self-employed. Unlike entrepreneurs’ profits, wageand salary incomes usually offer little or no scope for tax evasion, becauseof third-party reporting and tax withholding by employers.
There is a large literature on the economics of tax evasion, but we focusbelow only on the following issues: (1) How the number of entrepreneursis affected by taxation when tax evasion opportunities exist, and (2) Ap-propriate tax-penalty policies when individuals can choose freely betweenentrepreneurship and paid-employment.
Key theoretical studies that address the issue of tax evasion and thenumber of entrepreneurs include Watson (1985) and Jung, Snow andTrandel (1994). For example, Jung, Snow and Trandel analysed a modelof an economy comprising two occupations. Tax evasion is possible in oneoccupation (self-employment, S) but not in the other (paid-employment,E). A proportional tax rate τ = 1 − β is applied to pre-tax income in eachoccupation, yj = yj (nS) ( j = {E, S}), where income in each occupationis a function of nS, the proportion of individuals choosing S. Reflectingdiminishing marginal returns to labour in each occupation, dyS/dnS < 0and dyE/dnS > 0. Each self-employed person chooses how much incomeY to conceal from the tax authorities and which occupation to join; labouris inelastically supplied irrespective of occupation. The probability of be-ing audited by the tax authority is : if an individual is caught, they mustpay a penalty which is a multiple κ > 0 of the evaded tax, τY. With all in-dividuals possessing identical utility functions U(·), the optimal amountof income concealed, Y∗, is
Y∗ = argmax {(1 − )U[ySβ + Y(1 − β)] + .U[ySβ − κY(1 − β)]} .
Labour market equilibrium occurs when individuals are indifferent be-tween E and S:
U(α) = [1 − ].U(ϑ) + .U(γ ) ,
where
α := yE(n∗S)β , ϑ := yS(n∗
S)β + Y∗(1 − β) ,
γ := yS(n∗S)β − κY∗(1 − β) ,
where n∗S is the equilibrium number of individuals choosing self-
employment. It is easily shown that n∗S is decreasing in (see also Watson,
1985).
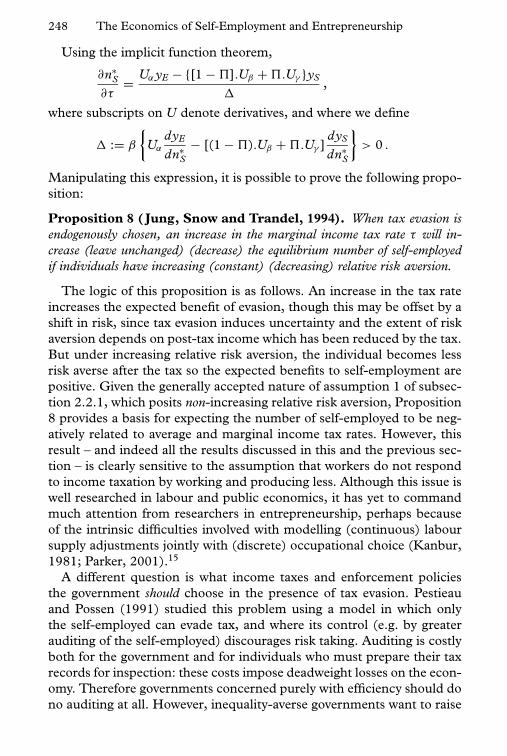
248 The Economics of Self-Employment and Entrepreneurship
Using the implicit function theorem,
∂n∗S
∂τ= Uα yE − {[1 − ].Uβ + .Uγ }yS
�,
where subscripts on U denote derivatives, and where we define
� := β
{Uα
dyE
dn∗S
− [(1 − ).Uβ + .Uγ ]dyS
dn∗S
}> 0 .
Manipulating this expression, it is possible to prove the following propo-sition:
Proposition 8 ( Jung, Snow and Trandel, 1994). When tax evasion isendogenously chosen, an increase in the marginal income tax rate τ will in-crease (leave unchanged) (decrease) the equilibrium number of self-employedif individuals have increasing (constant) (decreasing) relative risk aversion.
The logic of this proposition is as follows. An increase in the tax rateincreases the expected benefit of evasion, though this may be offset by ashift in risk, since tax evasion induces uncertainty and the extent of riskaversion depends on post-tax income which has been reduced by the tax.But under increasing relative risk aversion, the individual becomes lessrisk averse after the tax so the expected benefits to self-employment arepositive. Given the generally accepted nature of assumption 1 of subsec-tion 2.2.1, which posits non-increasing relative risk aversion, Proposition8 provides a basis for expecting the number of self-employed to be neg-atively related to average and marginal income tax rates. However, thisresult – and indeed all the results discussed in this and the previous sec-tion – is clearly sensitive to the assumption that workers do not respondto income taxation by working and producing less. Although this issue iswell researched in labour and public economics, it has yet to commandmuch attention from researchers in entrepreneurship, perhaps becauseof the intrinsic difficulties involved with modelling (continuous) laboursupply adjustments jointly with (discrete) occupational choice (Kanbur,1981; Parker, 2001).15
A different question is what income taxes and enforcement policiesthe government should choose in the presence of tax evasion. Pestieauand Possen (1991) studied this problem using a model in which onlythe self-employed can evade tax, and where its control (e.g. by greaterauditing of the self-employed) discourages risk taking. Auditing is costlyboth for the government and for individuals who must prepare their taxrecords for inspection: these costs impose deadweight losses on the econ-omy. Therefore governments concerned purely with efficiency should dono auditing at all. However, inequality-averse governments want to raise

Government policy: issues and evidence 249
tax to redistribute incomes and must audit in order to protect the taxbase. The government chooses the probability that individuals are au-dited; Pestieau and Possen (1991) further assumed that tax evaders whoare caught are fined an exogenous amount that renders them ex post thepoorest of all individuals. For sufficient degrees of inequality aversion,Pestieau and Possen (1991) showed that the optimal ∗ rises to the pointwhere tax evasion is deterred completely. The reason is that under ex-treme inequality aversion, the welfare of the poorest individuals should bemaximised – but because these are assumed to be detected tax evaders,tax evasion itself should be completely discouraged. With this policy inplace, everyone is encouraged to become self-employed, on the assump-tion that self-employment is the most productive occupation. Clearly,Pestieau and Possen’s (1991) results are very sensitive to their assump-tions. In practice, many governments impose less stringent penalties ondetected tax evaders (Smith, 1986).
10.4 Taxation, tax evasion and entrepreneurship: evidence
As the previous two sections have shown, the theoretical literature doesnot predict a simple or unambiguous relationship between the extent ofentrepreneurship and the structure of the IT system. Therefore the formof that relationship has to be determined empirically. Before turning toeconometric investigations of this issue, we briefly describe in subsection10.4.1 evidence about the extent of income under-reporting and exces-sive business expensing by the self-employed. Subsection 10.4.2 presentseconometric evidence about the effects of IT and tax evasion opportu-nities in self-employment on the occupational choice decision. We arguethat most existing evidence is vitiated by various methodological prob-lems, and conclude by presenting some new results that cast doubt on thethesis that tax and tax evasion opportunities affect occupational choicesfor the majority of self-employed people.
10.4.1 Income under-reporting by the self-employed
Direct evidence about the extent of income under-reporting and tax eva-sion by the self-employed is available from data provided by the USInternal Revenue Service’s (IRS’s) Taxpayer Compliance MeasurementProgram (TCMP). The TCMP data are compiled by teams of auditorswho analyse thoroughly the tax affairs of samples of employee and self-employed taxpayers on a case-by-case basis. These data have been utilisedby numerous researchers to estimate rates of income under-reporting.The TCMP has been running since the 1960s and it tells a reasonably

250 The Economics of Self-Employment and Entrepreneurship
consistent story over time. A typical result, cited by Kesselman (1989) andbased on a 1983 TCMP report, estimated that whereas 97–99 per cent ofemployee income was reported to the IRS, non-farm proprietors reportedon average only 78.7 per cent of their gross incomes.16 A similar estimatewas obtained from 1969 TCMP data reported by Clotfelter (1983). Thesums involved are not trivial either. Carson (1984) estimated that the self-employed are collectively responsible for one-quarter of total unreportedincome in the USA.
Rates of self-employed income under-reporting to the tax authoritiesof around 20 per cent have also been found in the UK, although theseare based on less comprehensive data (Macafee, 1982, p. 155). Smith(1986) proposed a slightly lower self-employed income under-reportingrate of 14 per cent, and suggested that preventative policy actionsin the construction sector in particular have reduced under-reportingrates.
A slightly different question, but one that is directly relevant for empir-ical research, is the extent to which self-employed people under-reportincomes to survey interviewers, despite assurances by the latter to in-terviewees that all data are treated in strict confidence and cannot bedivulged to any government department. Several indirect methods forestimating this kind of under-reporting have been proposed, based oncomparisons between respondents’ reported incomes and expenditures.It is not sufficient to identify as under-reporters households that spendmore than they earn, because some households may genuinely dissave andnot under-report, while others may under-report and not dissave (Dilnotand Morris, 1981). A more reliable approach proposed by Pissarides andWeber (1989) estimates expenditure equations for the self-employed andemployees, and then inverts them to estimate ‘true’ incomes. Three as-sumptions underlie this approach: (i) All occupational groups report ex-penditures correctly to the survey interviewers;17 (ii) employees reportincomes correctly; and (iii) the income elasticity of consumption is thesame for members of all occupations with the same characteristics. Letζi denote the expenditure of household i , Xi a vector of the household’scharacteristics, yi the household’s reported income and zi a dummy vari-able equal to unity if the household is headed by a self-employed person,and zero otherwise. Pissarides and Weber estimated the following regres-sion using data on a sample of n households:
ln ζi = α′Xi + (β1 + β2zi ) ln yi + γ zi + ui i = 1, . . . , n , (10.4)
where ui is a white-noise disturbance term. The γ coefficient is expectedto be positive in the presence of income under-reporting by the self-employed.

Government policy: issues and evidence 251
In the following, an overbar denotes an average value, and a † a truevalue of a variable. (10.4) implies that average consumption for a self-employed household is
ln ζ i = α′Xi + (β1 + β2)ln yi + γ + ui i ∈ S . (10.5)
But assumption (iii) above implies that
ln ζ i = α′Xi + β1ln y†i + ui . (10.6)
Equating (10.5) and (10.6) and re-arranging yields the percentage under-reporting rate of self-employment incomes as:
ln y†i − ln yi = (γ + β2ln yi )/β1 i ∈ S . (10.7)
Using 1982 UK FES data, Pissarides and Weber (1989) calculatedthe RHS of (10.7) and estimated the self-employment income under-reporting rate to be 55 per cent.18 It was estimated that blue-collar work-ers concealed a slightly higher proportion of their income, of between 51and 64 per cent, compared with 28–54 per cent for white-collar work-ers. Subsequent work by Baker (1993), based on the same methodol-ogy, generated slightly lower self-employed income under-reporting ratesof between 20 and 50 per cent based on UK FES data over 1978–91.Under-reporting rates were found to differ across occupational and in-dustry groups, with lower under-reporting rates among blue-collar thanwhite-collar self-employed workers – in contrast to Pissarides and Weber(1989). According to Baker, under-reporting rates have exhibited no dis-cernible patterns over time.
10.4.2 Tax, tax evasion and occupational choice: econometric evidence
Previous researchers have attempted to measure the tax incentive to beingself-employed, by regressing the probability of being self-employed (or theself-employment rate in the case of time-series studies) on tax-related andother explanatory variables. As usual, suppose there are two occupations,self-employment S and paid-employment E, indexed by j : j = {S, E}. Ina cross-section sample of individuals indexed by i , the basic model of theprobability of being self-employed, z∗
i , is
z∗i = α′Xi + βTi + ui , (10.8)
where Xi is a design matrix containing k personal characteristics or envi-ronmental control variables, and Ti is a variable designed to capture thetax incentive effect. Alternatively, in a time-series application, i denotes

252 The Economics of Self-Employment and Entrepreneurship
a time period, and z∗i must be interpreted as the fraction of the workforce
that is self-employed.A number of different variables have been suggested as candidates for
Ti :1. Tax liabilities in E, denoted Ti E (Long, 1982a, 1982b), with the pos-
sible addition of payroll taxes in E (Moore, 1983a). The rationale isthat the costs of evasion in S (e.g. fines or imprisonment) are worthbearing only when taxes are high. Both Long and Moore estimatedβ to be significant and positive using cross-section samples of USdata.19
2. Average and/or marginal tax rates on all incomes liable to tax, denotedby ARTi and/or MRTi . The rationale is similar to that given above; theevidence is mixed.20 Both Blau (1987) and Schuetze (2000) reporteddecomposition results suggesting that tax rate variables explained agreater proportion of changes in North American self-employmentrates than any other macroeconomic or demographic explanatoryvariable.21 Robson and Wren (1999) argued that marginal and averagetax rates capture different effects, the former labour supply incentivesand the latter evasion incentives – so both variables should be includedin (10.8).
3. Average or marginal tax rates in S relative to E, denoted by � j ARTi
or � j MRTi (Bruce, 2000), where
� j ARTi := ˆARTi E − ˆARTi S and � j MRTi := ˆMRTi E − ˆMRTi S ,
where ˆ denotes an actual value if i ∈ j and a predicted value if i �∈ j .This recognises that tax liabilities in both occupations matter. Bruce(2000) obtained mixed evidence in his application based on US data.In short, the evidence obtained to date paints a mixed picture about
the role of tax and tax evasion opportunities for explaining occupationalchoice. However, many of these studies fail to condition on relative in-come, which is surprising given their apparent implicit belief that pecu-niary factors affect occupational choice. It is therefore hard to evaluate thegenuine effect of personal taxes on entrepreneurship from these studies.
It possible to address this problem by extending the structural probitmodel of occupational choice described in chapter 1, subsection 1.6.2. Asin that model, assume that z∗
i is a function of i ’s net earnings differentialyn
i S − yni E (where yn
i j denotes net income), as well as a set of other ex-planatory variables, Xi . Let γ denote a scalar and ω a vector of estimableparameters, and let ui be a stochastic normally distributed disturbanceterm. Then
z∗i = γ
[ln yn
i S − ln yni E
] + ω′Xi + ui , (10.9)

Government policy: issues and evidence 253
where one expects γ > 0. Predicted net incomes received in unobservedoccupations can be obtained by estimating selectivity corrected grossearnings functions (see chapter 1, subsection 1.5.3) and applying the rulesof the IT code. Now suppose individuals avoid a proportion κ ∈ (0, 1] oftheir tax liability in occupation S.22 Then, provided the applicable tax ratefor predicted incomes is the same for individuals in both occupations (astends to be the case when income tax bands are broad), it can be shown(Parker, 2003a) that (10.9) can be re-written as
z∗i = γ
[ln yn
i S + κ.T(yi S; yio , Wi ) − ln yni E
] + ω′Xi + ui , (10.10)
where yni S is predicted net self-employment income in the absence of tax
evasion, and where T(yi S; yio , Wi ) are tax liabilities conditional on pre-tax self-employment income yi S, other pre-tax taxable income yio andtax-relevant personal characteristics Wi .
Equation (10.10) is a non-linear ‘structural probit’ equation. Arguably,κ.T(yi S; yio , Wi ) measures the correct incentive to be self-employed, sinceit captures directly the amount of tax that can be avoided if one becomesself-employed, while taking into account also the earnings differential be-tween the two occupations. Parker (2003a) estimated (10.10) using threeBritish micro-data sets and could find no evidence to reject the hypothe-sis that κ = 0. It is important to be clear about what this result does anddoes not tell us. It does not mean that the self-employed do not evade oravoid tax. Instead, it suggests that these activities do not appear to impactsignificantly on occupational choice behaviour for most self-employedBritons (i.e. this is why κ cannot be identified precisely). Nor could it berobustly established that relative incomes themselves had any clear impacton occupational choice – in line with other findings based on the linearstructural probit model summarised in chapter 3, section 3.1. Thus, it ispossible that no tax incentive effect exists because pecuniary factors generallydo not appear to be significant determinants of the decision to be self-employed.If so, then the policy implications are clear: any efforts to promote en-trepreneurship through the income tax system will be ineffective.
10.5 Direct government assistance and regulation
10.5.1 Entrepreneurship schemes targeted at the unemployed
Governments in several countries have set up schemes to encourage theunemployed to become self-employed. Government objectives as far asthese schemes are concerned include unemployment reduction, job cre-ation and the fostering of enterprise, as well as generation of other ben-efits such as self-sufficiency of participants, economic development of

254 The Economics of Self-Employment and Entrepreneurship
high-unemployment areas and the provision of opportunities for sociallyexcluded groups (OECD, 1998).
The largest schemes have operated in the UK, France, Spain, Germanyand Denmark; to date, they have not been adopted in the USA. Mostschemes share a number of features in common. Rather than attemptto describe them all, I will just briefly describe the UK’s Enterprise Al-lowance Scheme (EAS).23 The EAS was established in 1982, offering in-come support of £40 per week to unemployed people with £1,000 to investin a new business for up to the whole of the first year in self-employment.The idea was to partially compensate individuals for the loss of state ben-efits entailed by becoming self-employed. Individuals were offered adviceon running a small business, but were not screened for eligibility to jointhe scheme. At its peak in 1987–8, 106,000 people were on the EAS,with take-up rates declining continuously thereafter before the schemewas transferred to the Training & Enterprise Councils (TECs) in 1991–92.24 In most years, the number of EAS recipients comprised a smallfraction of the annual unemployment flow, although they accounted forup to 30 per cent of new UK business starts (Bendick and Egan, 1987).Most EAS businesses were concentrated in services, construction andretail commerce. They typically involved limited amounts of investment,and were on a small scale – possibly because of limited market opportuni-ties in areas of high unemployment where many recipients were located.Enterprises endowed with the most physical and human capital tendedto have the highest survival rates.
The cost-effectiveness of EAS-type schemes is a key issue for its govern-ment sponsors. These schemes can be expected to involve a substantialdeadweight cost, since a number of new businesses would probably havestarted even in the absence of the scheme. Also, an EAS may support in-efficient businesses, displace viable competitors and fail to help the long-term unemployed.25 Furthermore, as Bendick and Egan (1987) pointedout, EAS participants are a self-selected group of unemployed people,being disproportionately young, male and having been unemployed forless than six months prior to commencing in the EAS.
The evidence on these issues is stark. According to Bendick and Egan(1987), 50 per cent of UK EAS-sponsored businesses would have startedanyway; 50 per cent of those that did start displaced other businesses;about 50 per cent of the assisted firms survived for less than three years;and those that did start created a fraction of one job in addition to thejob of the proprietor. There is in fact mixed evidence about the qual-ity of EAS-supported businesses, as measured by their survival rates.26
The self-employment incomes of EAS recipients have been estimatedto be similar to the incomes they could have obtained in alternative

Government policy: issues and evidence 255
occupations, although it is possible that the experience of self-employment under the EAS enhanced participants’ future earnings(Bendick and Egan, 1987).
Taking account of deadweight costs, displacement effects and the costof administering the scheme, relative to the benefits generated by the newstart-ups, Storey (1994a) estimated that after taking account of the factthat the government would have paid unemployment benefits anyway,the EAS was essentially cost-effective, even though its effects on job cre-ation and unemployment reduction were slight.27 There is a more generalpoint to be made here about the precise objectives of EAS-type schemes.Schemes targeted at the unemployed face a trade-off between economicobjectives (e.g. high survival rates, profitability and employment creation)and social objectives (e.g. putting to work the hardest to employ). On thispoint Bendick and Egan (1987) concluded: ‘The programmes in thesecountries [France and Britain] have succeeded in turning less than oneper cent of transfer payment recipients into entrepreneurs, and an evensmaller proportion into successful ones. They cannot be said to have con-tributed greatly to solving either social or economic problems, let aloneboth’ (1987, p. 540).28 Storey (1994a) concluded that the EAS probablyhad a greater political than economic effect.
The evidence for countries other than the UK is similar. Pfeiffer andReize (2000) investigated the effects of bridging allowances to unem-ployed Germans on firm survival and employment growth rates. Theyfound that survival rates in West Germany were not significantly differ-ent for those starting up with bridging allowances; but survival rates were6 per cent lower in East Germany for those with bridging allowances.Having a bridging allowance made no discernible difference to employ-ment growth rates, leading Pfeiffer and Reize (2000) to conclude thatGermany’s enterprise allowance scheme does not appear to have had ajob creation impact. Together with the British evidence cited above, oneis led to conclude that, despite favourable publicity, schemes designed topromote enterprise among the unemployed have had only a very limitedimpact in practice.
10.5.2 Information-based support for start-ups
Governments in many countries subsidise or operate agencies that pro-vide support to entrepreneurs, either for new start-ups, existing smallfirms, or both. Private-sector institutions are also involved in this pro-cess. The oft-cited rationale for support to start-ups is straightforward:potential entrepreneurs often lack information about what it is like tostart a business, how to develop a business idea and obtain finance,

256 The Economics of Self-Employment and Entrepreneurship
how to identify customers and how regulations and state benefits affectthem. They might also be naıve, proposing poorly thought-out businessplans that convey an inadvertently negative impression of their busi-ness idea. Even worse, they may be unaware of deficiencies in theirown business skills. These problems may cause inefficiency and exces-sive exit rates of otherwise viable businesses. Hence there is a case, atleast in principle, for government involvement in improving the access toinformation.
Support for start-ups often involves not only the provision of informa-tion, but also mentoring, training and advisory services, via public-sectorproviders and subsidised advisers and consultants. Many programmescombine these types of assistance in packages for target groups. Forbrevity, and to convey the basic ideas, we describe below only a fewfeatures of the UK institutional set-up, which is quite extensive andwell established. Indeed, it is possible to criticise the proliferation ofsmall-business support programmes for engendering confusion amongentrepreneurs. In the UK the public-sector organisations involved in de-livering these programmes include Business Links, Enterprise Agencies(EAs), local authorities, Regional Development Agencies (RDAs), theDepartment for Trade and Industry (DTI), the Department for Educa-tion and Skills (DES), Learning and Skills Councils, non-governmentalorganisations (NGOs) (such as the Princes Trust), business associationsand networks and universities and colleges. Rather than provide an ac-count of what each of these organisations do, we shall describe just acouple of the more prominent ones.
In 1992 the British government established the Business Link (BL)scheme. BL’s purpose is to bring together various sources of supportavailable to entrepreneurs and small firm owners. Via a network of localbusiness advice centres, the (publicly funded) BL scheme aims to pro-vide local information; marketing, training and planning support; advice;and consultancy support for SMEs.29 Initially BL focused its support onSMEs with high-growth potential that employed between 10 and 200staff. A key part of the process was the role of personal business advisors,who conducted free ‘health checks’ on businesses that requested it. Morerecently, however, BL has begun to work with businesses of all sizes, in-cluding start-ups. Their work is complemented by Enterprise Agencies(EAs) (Enterprise Trusts in Scotland) and TECs. TECs are fundholdersof enterprise support and training, on which many EAs are dependent forfunding. The delivery of business services varies from agency to agency,with considerable geographical diversity.
The Princes Trust is a form of support directed towards young people.It provides them with cheap small loans packaged with advice, mentoring

Government policy: issues and evidence 257
and government-provided income support. While it has been creditedwith effective job creation, the mentoring aspect of this programme makesit resource-intensive and therefore necessarily limited in scope.
The effectiveness of government intervention to help start-ups inthe UK has been critically evaluated by Reid and Jacobsen (1988),Casson (1990), Bennett, Wicks and McCoshan (1994), Storey (1994a)and Bennett and Robson (1999), among others. Bennett, Wicks andMcCoshan (1994) concluded that greater empowerment is needed tomake TECs more effective in their relations with small firms. Reid andJacobsen (1988) found that Enterprise Trusts were bracketed with bankmanagers and accountants as among the most valuable sources of adviceto new small entrepreneurial firms. Bennett and Robson (1999) alsohighlighted the importance of accountants and lawyers as sources ofadvice, while noting that 27 per cent of their survey respondents had alsoused BL. This is a higher take-up rate for a public support service thanhas been found by other researchers. Storey (1994a) in particular pointedout the difficulties of linking assistance to improvements in performanceby the recipients. In his words, ‘a substantial “unproven” verdict hangsover the policies in this area.’ (1994a, p. 295). Set against this, Bendickand Egan (1987) cited evidence that French support services weregenerally associated with higher rates of business survival. Also Marshallet al. (1993) reported a positive impact of government-assisted man-agement and training development on the performance of participatingfirms in Britain. However, an area where perhaps more could be done isin raising awareness at the pre-start stage of entrepreneurship. As severalresearchers have noted, both public and private sectors appear to be lessequipped to offer support at the pre-start stage than at or just after thetime of start-up (Smallbone and Lyon, 2001).
10.5.3 Regulation and other interventions
This subsection mentions briefly three other examples of governmentintervention in the small-business sector. They are procurement, so-cial protection and regulation. Procurement and regulation are usuallyframed at the level of the firm, rather than the entrepreneur. Our inter-est will be in their impact on small firms, since these are probably mostclosely identified with entrepreneurs.
Procurement is an important way that government can aid small busi-nesses. For instance, since 1942, the US Federal government has system-atically allocated a share of its purchases to small businesses. Accordingto SBA (2001), small businesses received $69.3 billion in fiscal year 1999in Federal government contracts. This amounted to 35.6 per cent of total

258 The Economics of Self-Employment and Entrepreneurship
federal procurement. The construction sector received most procurementmoney. On top of this, state governments in the USA also provide largesums of procurement money to the small-business sector.
A second channel of government involvement is social protection. Thistends to be less extensive for the self-employed than for employees. For ex-ample, although the self-employed are eligible for social security pensionsin almost all countries, they are usually ineligible for accident, sicknessand unemployment insurance. In contrast, employees are usually eligiblefor all of these benefits. Some commentators contend that the differentialtreatment is an ‘accidental’ feature of early legislation. Originally, manywelfare policies were conceived for full-time workers in regular employ-ment: the self-employed were effectively ‘left out’ (see Aronson, 1991).However, governments are also no doubt aware of the potential moralhazard problems entailed by extending accident, sickness and unemploy-ment insurance to the self-employed. Working for themselves, the self-employed would presumably find it easier to slack and spuriously claimbenefits. On a more positive note, the self-employed in several countriesare eligible for tax relief on some services that they have to purchase pri-vately, e.g., private pensions (via Keogh plans in the USA, for example).In the UK, social security (‘National Insurance’) contributions are nom-inally set at a lower level for the self-employed, reflecting the lower levelof benefit coverage the state offers them.
Finally, governments also regulate businesses, often for health andsafety reasons. They also issue licences and exempt small businesses fromsome regulations and taxes. We shall not attempt to review regulation ex-emptions for small firms: several examples from the USA are describedin Brock and Evans (1986) and Aronson (1991, pp. 104–5).
Brock and Evans (1986) (hereafter, BE) conducted one of the mostthorough investigations into the effects of government regulation on smallfirms. BE commenced by documenting the general increase in govern-ment regulations since the 1970s. They observed that regulations arewidely believed to put small firms at a disadvantage because they im-pose fixed costs (such as administrative compliance costs) that largerfirms are able to spread over greater output, reducing their average im-pact compared with small firms. After an exhaustive analysis of the ex-tant evidence, BE concluded that economies of scale do indeed existfor some forms of regulation. This is especially true of paperwork-basedregulations, e.g., relating to banking and pensions. BE estimated compli-ance costs to be some ten times greater for small firms compared withtheir larger counterparts.30 Also, regulations can harm small firms sim-ply because they are more likely to engage in the proscribed activity (e.g.small mines involve proportionately more accidents than large mines).

Government policy: issues and evidence 259
However, substantial economies of scale were not found to exist withrespect to environmental regulations.
It is instructive to trace out the impact of regulation on small firms in ageneral competitive equilibrium, in which they compete with larger firms.Suppose, for example, that firms’ costs are increasing in output q anddecreasing in heterogeneous ability, x−, e.g. costs are given by c = c(q )/x,where cq > 0. There is an outside wage of w, so entrepreneurs with abilitygreater than or equal to a cut-off ability x become entrepreneurs, with therest becoming employees. Firms hire employees: the most able run thelargest firms, and the least able run the smallest (see chapter 2, subsection2.2.3). Now it is easy to see that the imposition of a regulatory fixed costwill cause x to increase. The smallest firms exit, and their owners becomeworkers, increasing the supply of labour and so driving down w. At thesame time, the smaller number of firms reduces the supply of output,increasing the price level. Surviving (i.e. larger) firms increase output tomop up the excess demand for their goods. The effects on small firms areclearly negative; but, notably, large firms can gain from the regulation ifthe increase in price and decrease in the wage rate outweigh the higherregulatory costs they face. Thus large firms can have an incentive toapply political pressure for greater regulation, which can end up artificiallycapping entrepreneurship (see also Baumol, 1983).
Clearly, then, it is possible for regulation to reduce social welfare. Butthis does not mean that the optimal amount of regulation is zero. For ex-ample, if all firms generate a negative externality, such as pollution, thensome regulation may be socially desirable. The question is how much reg-ulation is optimal, and which firms should be regulated. BE analysed thisissue in the context of the simplified model described above, for the casewhere the regulatory compliance cost faced by firms is non-decreasingin the tax rate and tax burden imposed on firms. Taxation is required toprovide firms with incentives to produce more socially efficient levels ofoutput. The key finding from BE’s theoretical analysis was that the opti-mal regulatory tax schedule consists of a tax rate that is generally positivebut may be zero below some firm-size threshold, together with a licencefee to discourage the formation of inefficient firms.
This solution is interesting, because the zero tax threshold correspondsto the kind of ‘tiering’ of regulations that are observed in many countries.Tiering refers to granting lighter regulatory burdens, or complete ex-emption, to small firms, in recognition of regulations’ potentially adverseeffects on competition discussed above.31 However, there are potentialpitfalls with tiering regulations as well. Tiering may preserve inefficientfirms in the market, and encourage larger, more efficient, firms to becomesmaller in order to qualify for a lighter regulatory touch.
260 The Economics of Self-Employment and Entrepreneurship
Brock and Evans (1986) concluded that there is little evidence that reg-ulation has disproportionately harmed small firms. Of course, this couldsimply reflect the success of tiering in protecting small firms from theworst excesses of government interference in their businesses. In recog-nition of the regulatory damage that governments can inadvertently in-flict on small business, the US legislature passed the Regulatory Flexibil-ity Act. This instrument forces US government agencies to undertake athorough analysis of the economic impact of their proposed regulations,and to consider alternatives that are less likely to harm small firms (SBA,2001).
10.6 Conclusion
This chapter has critically evaluated the existing state of theoretical andempirical knowledge about the impact of government intervention onentrepreneurship in general and the self-employed in particular. We dis-cussed interventions to promote new start-ups by making finance easierto obtain, via loan guarantee schemes and direct assistance to the unem-ployed; the theory of taxation and occupational choice when incomes inentrepreneurship are uncertain; theory and evidence about tax evasionand self-employment; evidence about the effects of the personal incometax system on self-employment and occupational choice; government-sponsored advice and assistance to entrepreneurs; and the effects of reg-ulation. It is no easy matter to draw conclusions from such a diverse bodyof work. But a few general principles and findings stand out.
First, regarding interventions designed to promote new start-ups, gov-ernments in several countries expend substantial resources on LGSs andschemes to encourage the unemployed to become self-employed. Evalu-ation studies have not produced a ringing endorsement of these schemes.While they do not appear to misallocate resources badly, there is little ev-idence that they improve efficiency much either. If governments are to bepersuaded to enlarge the scope and extent of these schemes, researchersshould provide more convincing evidence that small businesses generatesubstantial social and economic benefits that are being impeded by somekind of market failure.
A second general conclusion is that the rich theoretical literature onincome taxation and occupational choice presents an array of conflictingpredictions and policy recommendations. Even the class of models thatrestricts attention to uniform linear income tax systems are unable toanswer unambiguously such basic questions as ‘Will higher income taxrates increase or decrease the equilibrium number of entrepreneurs?’ and‘What are the effects of income tax on the welfare of entrepreneurs, and

Government policy: issues and evidence 261
on social welfare more generally?’ Naturally, generalising these simplemodels to take account of other factors, including tax evasion, differ-ential income taxation, non-linear (progressive) taxation, non-pecuniaryaspects of work and social inequality aversion can be expected to enlargefurther the set of theoretical predictions. To date, the literature has notpaid much attention to the effects of switching costs (economic or psy-chic) on the potency of fiscal interventions. But that could be a usefulingredient in future work if it restricts the set of possible outcomes in arealistic way and so increases the stability of the theoretical results.
Another practical suggestion for increasing the policy relevance of themodels is to embed them in a simulation-based framework. As well as be-ing amenable to numerical sensitivity analysis, simulation methods wouldenable researchers to extend the scope of their theoretical enquiries, andto incorporate several useful ‘real-world’ features of labour markets thathave been relatively neglected in occupational-choice models. These in-clude, but are not confined to, the joint modelling of labour supply andoccupational choice.
A third conclusion from this chapter is unambiguous: as a group, theself-employed systematically and regularly under-report their incomesand over-claim their business expenses to the tax authorities. Evidencefrom the UK and the USA suggests that the self-employed under-reporttheir incomes by between 20 and 50 per cent compared with just 1–3per cent for employees. However, it cannot be established that pecuniaryfactors generally make individuals likelier to choose self-employment, letalone tax evasion opportunities specifically.
Finally, an area where there might be greater potential for effectivegovernment involvement is in the provision of information and adviceto entrepreneurs. There appears to be a case, at least in principle, forgovernments to subsidise improved information flows to help the marketfunction more efficiently; and economies of scale can be achieved in thisarea by concentrating provision in a few well-publicised advisory bodies.In fact, the problem in some countries seems to be not the absence ofthese agencies, but their proliferation and the sparse use made of themby entrepreneurs. Evidence from a survey of new US start-ups bearsthis out. Reynolds and White (1997) concluded that government policiesand programmes have very little direct effect on the start-up process:few ‘nascent’ entrepreneurs were aware of the large number of availableprogrammes, reflected in take-up rates of less than 10 per cent. Heretoo, governments need to spend public money wisely. Assistance directedtowards enhancing general competitiveness and growth is likely to bemore socially productive than trying to give individual firms an advantageover their close rivals. That might accelerate the competitive race without

262 The Economics of Self-Employment and Entrepreneurship
increasing the number of winners; there is little point after all in helpingsome participants to play more cunningly a zero-sum game.
NOTES
1. For example, the US variants of the basic scheme include the Certified LenderProgram (which promises banks a three-day approval time) and the PreferredLender Program (under which loans can be made without prior approval bythe Small Business Administration (SBA), at the price of a smaller guarantee).According to Smith and Stutzer (1989), about one-third of state governmentsin the USA also guarantee loans, with guarantee percentages varying withinand between states. The US SBA LGS dates back to 1953 – (see Rhyne, 1988,for a review of the historical and political context). The UK Small Firms LGS(SFLGS) dates back to 1981: see Cowling and Clay (1995) for a full back-ground to this scheme, operational details, and an econometric model of take-up rates by entrepreneurs. Bates (1984) describes the Economic OpportunityLoan program.
2. These include banking, real estate development and publishing in the USA;and retailing, catering and motor vehicle maintenance in the UK. One reasonfor excluding support in certain sectors is to reduce business displacement (seebelow).
3. See also Smith and Stutzer (1989), who proposed a similar mechanism andoutcome.
4. In terms of figure 5.3, a LGS targeted on group b increases b’s expected rate ofreturn schedule above ρ∗ in that diagram if the scheme is sufficiently generous.But ρ∗ also increases, reflecting the greater overall profitability of private loans– possibly leading to redlining of the non-targeted group o, who were notinitially redlined. These perverse crowding-out effects may serve to generatepressure for further subsidies. In Gale’s words: ‘Credit subsidies create demandfor more credit subsidies’ (1990b, p. 190).
5. If financial markets are characterised by credit rationing, then the quality ofthe rationed ventures should be high, and LGS programmes should not makemuch of a loss. If they do make losses, can this be taken as evidence thatcredit rationing does not exist, and that private lenders were right to rejectthe ventures? Not necessarily: losses could also be caused by high programmeadministrative costs (Rhyne, 1988).
6. The UK’s SFLGS was amended in 1989 and 1996 for precisely this reason,restricting loans to sectors with low displacement rates.
7. The small scale of the UK’s SFLGS has prompted some commentators toargue that the principal role of the scheme was as a temporary ‘demonstrationeffect’: i.e. to demonstrate to banks profitable opportunities for unsecuredlending in the small business sector (Storey, 1994a).
8. Furthermore, Rhyne (1988) estimated that in order to cover programme costs,each successful SBA-backed loan would have had to generate additional bene-fits over the lifetime of the loan of between 17 and 29 per cent above the returnnecessary to stay in business.

Government policy: issues and evidence 263
9. The rationale has been two-fold. First, loan guarantees facilitate bank-borrower relationships, unlike direct Federal loans; and they also reduceundesirable competition between the SBA and banks (Rhyne, 1988). Morerecent data from the SBA (2001) indicate that between 1991 and 2000 theSBA backed a total of $95 billion in loans to small businesses.
10. Corporate taxes tend to be flat-rate taxes, whereas IT tends to be progres-sive, with marginal tax rates that rise with income. This raises the issue ofoptimal incorporation choice by the self-employed, since high-income self-employed individuals have a tax incentive to reclassify their earnings as cor-porate rather than personal (Fuest, Huber and Nielsen, 2002). According toGordon (1998), this tax differential has declined from high levels in the 1950sand 1960s to very low levels at the time of writing. See Gordon (1998) forfurther details and references to the literature.
11. Obviously, entrepreneurship also becomes unambiguously less attractive ifjust entrepreneurs are taxed without a subsidy being given to employees andwith the tax receipts being spent on an ‘outside’ good. Likewise, Kihlstromand Laffont (1983b) showed that a tax on wages only (with receipts spent onan outside good) increases the number of entrepreneurs under assumption 1.
12. See Kanbur (1979), and Yuengert (1995) for affirmative evidence. Gentryand Hubbard (2000) found the opposite result, but that reflects an un-favourable differential tax to self-employment caused by imperfect loss offsets,that outweighs insurance or tax evasion advantages to entrepreneurship (seealso Cullen and Gordon, 2002). That is, profits are subject to a higher taxrate than the rate against which any losses can be deducted, making riskyentrepreneurship less attractive.
13. The only paper we know of in this area is by Moresi (1998), who extendedMirrlees’ classic optimal tax analysis to the realm of entrepreneurship. Moresistudied the general properties of optimal non-linear differential taxes whenentrepreneurs have heterogeneous exogenous abilities and workers receive acommon wage. Few firm predictions emerge from the general form of thismodel.
14. For Canadian evidence on intertemporal tax-shifting by the self-employed,see Sillamaa and Veall (2001).
15. In a simplified model with labour supply choice, Robson and Wren (1999)showed how higher marginal tax rates can decrease the self-employment rateif gross incomes are more sensitive to labour supply in self-employment thanin paid-employment.
16. The corresponding figure for net incomes, which includes both under-statement of receipts and over-statement of expenses, was 50.3 per cent.Kesselman (1989) also reported wide industry variations in under-reportingrates, with taxicab drivers being the most likely to under-report. Accord-ing to Clotfelter (1983), self-employed income under-reporting is positivelyassociated with high net incomes and high marginal tax rates, though subse-quent evidence by Kesselman (1989) cast doubt on these results. Joulfaianand Rider (1996) estimated that income under-reporting is significantly neg-atively associated with the tax audit rate, with an elasticity of approximately−0.70.

264 The Economics of Self-Employment and Entrepreneurship
17. A good example is food expenditure. The self-employed have no incentive tounder-report food expenditure to the survey interviewers, since it raises notax or business deductibility issues.
18. Since the self-employed accounted for around 10 per cent of UK GDP, thisimplies that the size of the ‘black economy’ in the UK was about 5.5 per centof GDP in 1982.
19. In fact, payroll taxes can have complicated effects on occupational choice.They might induce employers to substitute self-employed contract labour forregular employees, implying a positive relationship between employer pay-roll taxes and the incidence of self-employment. But they might also dis-courage employees from choosing self-employment if they expect to becomeemployers.
20. For positive β estimates see Blau (1987), Yuengert (1995), Parker (1996),Robson (1998b) and Schuetze (2000). For a negative β estimate see Folster(2002). Cowling and Mitchell (1997), Robson and Wren (1999), Parkerand Robson (2000) and Bruce (2002) reported insignificant or mixedeffects.
21. For example, Blau (1987) estimated that the reduction in marginal tax rates(MRT) at the bottom of the US income distribution and the rise in MRT atthe top accounted for between about a half and two-thirds of the observedincrease in self-employment between 1973 and 1982. This was despite Blau’spuzzling finding of conflicting impacts on self-employment rates from MRTmeasured at different income levels.
22. In accordance with the evidence cited earlier, there is little or no evasion inE, so there is no need to introduce a corresponding term for E. In (10.10)below, κ is treated as an unknown parameter to be estimated.
23. For a detailed summary of self-employment schemes for the unemployed inGermany, France, the UK and Denmark, see Meager (1993, 1994).
24. The EAS was later renamed as the Business Start Up Scheme and then be-came part of various Single Regeneration Budgets, under more flexible termsthan those stipulated at its inception, and with a greater emphasis on targetedsupport.
25. Meager (1994) suggested that grant-based schemes are superior to allowance-based schemes (such as the UK’s EAS) by enabling new ventures to overcomeentry barriers in some industries, so reducing displacement effects.
26. Storey (1994a) reported that around 14 per cent of EAS entrants failed in thefirst year of operation, during which the EAS subsidy was received. Taylor(1999) cited a UK Department of Employment report that two-thirds ofindividuals completing their first year of the EAS were still in business twoyears later. These are higher survival rates than Taylor found for British self-employed workers overall.
27. In particular, all non-proprietor jobs were created by 20 per cent of survivingfirms (Bendick and Egan, 1987). More than 60 per cent of the jobs createdin surviving firms after three years under the EAS were in 4 per cent of thebusinesses originally created (Storey, 1994a).
28. Consistent with this, time-series econometric evidence from Parker (1996)suggests that the EAS increased UK self-employment rates only modestly

Government policy: issues and evidence 265
and in the short run only. See Meager (1993, 1994) for time-series regressionresults for Germany.
29. BL was reformed during 2000–1 by the UK government to be part of theSmall Business Service, in order to replicate aspects of the US SBA. Chiefly,this involves adding a new role for BL as a ‘voice for SMEs’.
30. See also Sandford (1981), who estimated that compliance costs related tosales taxes were forty times higher as a proportion of turnover for UK firmswith turnover of less than £10,000 than for firms with a turnover of over £1m.
31. More generally, ‘tiering may occur in any of the major aspects of a regulatoryprogram: in the substantive requirements; in reporting and record keeping re-quirements; or in enforcement and monitoring efforts. Tiering may entail lessfrequent inspections, lighter fines for non-compliance, exemptions, waivers,reduced requirements, or simpler reporting requirements for certain types offirms’ (Brock and Evans, 1986, p. 74).

11 Conclusions
11.1 Summary
Self-employment and entrepreneurship are important economic phe-nomena. Self-employment is widespread throughout the world and smallfirms are the principal vehicles for the organisation of production. Farfrom self-employment being an occupation in irrevocable decline, theevidence outlined in chapter 1 showed that numbers of self-employedpeople are holding up strongly in many countries. While it is true that de-clining transportation and communications costs, more capital-intensivemethods of production, and industry consolidation do not favour manysmall-scale enterprises (White, 1984), these changes may be less per-vasive in many service industries. And some of these changes might beamenable to exploitation by entrepreneurs who can discern in them prof-itable opportunities.
Our review of the theories and evidence about entrepreneurship inchapters 2 and 3 revealed that economists regard entrepreneurial abilityand willingness to take risks as key factors determining who becomes anentrepreneur. While more work remains to be done on estimating struc-tural models to identify the empirical importance of these factors, we nowknow a fair amount about the specific characteristics of entrepreneurs.They often come from families with a tradition of self-employment orbusiness ownership; they are on average older, reasonably well educatedand more likely to be married, and are generally over-optimistic abouttheir prospects of success. On the balance of evidence, non-pecuniaryfactors appear to be more important than pecuniary factors in explainingwhy people choose to be entrepreneurs.
Self-employed people in most OECD countries tend to be pre-dominantly white, male and middle aged. This is changing, however.Increasing numbers of females are turning to self-employment, whilemany ethnic minority groups have participation rates in self-employmentthat are both higher and growing more rapidly than those of indigenousgroups. Although it is still unclear why females and members of some
266

Conclusions 267
ethnic groups are under-represented in self-employment, the research re-viewed in chapter 4 found little evidence of discrimination against them,either in the product or the capital markets. An ongoing puzzle is whyblack Britons and Americans have such low self-employment rates, incontrast to Asians in these two countries. There is clearly a need forfurther research on these topics.
In principle, limited access to finance might be one cause of low blackself-employment rates in the UK and the USA, though the evidence hereis not clear-cut. In fact, it is not well established that there is a shortageof debt finance for any new start-ups. Just because banks deny credit tosome loan applicants does not necessarily mean that they ration credit.Even if bank loans are unavailable, other sources of credit often exist, suchas personal and family finance, trade credit, franchising, and sometimeseven equity finance. The scale and potential contribution of these sourcesof finance were reviewed in chapter 6. In the case of equity finance, itseems that the low anticipated returns and high risk of proposed ventures,rather than unavailability of funds, explains the limited use of this sourceof finance in practice.
The theoretical literature reviewed in chapters 5 and 6 is unable toanswer definitively the question about whether finance is rationed, andwhether there is too little or too much investment by entrepreneurs. Con-sequently, governments should probably not take any of the academicpolicy recommendations emanating from this literature too seriously.The most pressing need is for direct evidence about the nature of anyinefficiency in the market for start-up finance. Chapter 7 reviewed theevidence about borrowing constraints, including studies finding a posi-tive relationship between personal wealth and windfalls, and participationand survival in self-employment. We argued that such correlations do notconstitute evidence of borrowing constraints, and concluded that directevidence from bank loan rejections suggest that credit rationing, if it existsat all, can be only very limited in practice. On the other hand, the per-ception of borrowing constraints among entrepreneurs might discouragethem from applying for funds from banks and other lenders. It is unclearhow prevalent this ‘discouraged borrower’ syndrome is.
In the light of these findings, it is therefore interesting that governmentsin several major economies continue to back private bank loans to newventures. The reason is presumably a joint belief in credit rationing andthe importance of entrepreneurship, perhaps because of its job creatingpromise. In fact, as shown in chapter 8, although small firms appear tocreate a disproportionate number of new jobs on net in the OECD, mostself-employed people in most countries do not hire any employees. In-stead, they rely on supplying long work hours of their own. A puzzle is

268 The Economics of Self-Employment and Entrepreneurship
why the self-employed work relatively long hours for relatively low returns.One reason might be greater income variability in self-employment, com-bined with non-pecuniary factors, leading self-employees to ‘self-insure’by working harder. Self-employed jobs can be pleasurable in their ownright, especially if they involve the excitement of successfully establishingand maintaining one’s own enterprise. An unwillingness to see one’s lifework disappear might also account for why so many self-employed peo-ple continue to work well into their seventies and sometimes even theireighties.
Having launched a new enterprise, what happens to it next? Chapter 9showed that most new ventures are small and remain so, if they surviveat all. Survivors tend to have higher and more variable growth rates, andtend to be run by experienced owners located in areas of low unem-ployment. Only very few new enterprises grow sufficiently to eventuallybecome large firms. Models of entrepreneurial learning appear to explainmost of these stylised facts well. We suggest that promotion of sustain-able entrepreneurship might be better served by trying to forestall exit,rather than encouraging entry. But government efforts to ‘pick winners’are unlikely to be successful; and it is unclear what specific governmentpolicies are best suited to boost survival rates. This will no doubt be anongoing topic of interest in future entrepreneurship research.
Several specific forms of government intervention designed to promoteentrepreneurship were analysed in chapter 10. Because of the policy im-portance of this issue, we devote the remainder of this chapter to it.
11.2 Implications for policy-makers
Many economists would argue that government intervention in marketsis usually justified only in order to correct for some kind of market fail-ure. Examples of market failures in the context of this book include theunavailability (or too easy availability) of new venture finance due toasymmetric information problems; positive social externalities from en-trepreneurship; and spillovers from entrepreneurs’ innovations that arenot realised because they cannot be fully captured by the entrepreneursthemselves. One useful way of thinking about these issues is in termsof the supply of and demand for entrepreneurs. In an economy withflexible prices and wages and no market failures there is no reason toexpect any persistent imbalance between the supply of and demand forentrepreneurs. In such an economy there would be no obvious ratio-nale for government involvement in entrepreneurship. Therefore the keyquestion is whether any market failures exist in practice, that inhibit thesupply of or demand for effective entrepreneurship, and cause more or

Conclusions 269
less entrepreneurship than is socially desirable. Note by the way that therecognition of scope for welfare-improving government intervention doesnot automatically justify such intervention. Intervention invariably incursdirect costs, in addition to the opportunity cost of public funds; and bu-reaucrats cannot always be trusted to allocate public money wisely. Ourevaluation in chapter 10 of loan guarantee schemes and income supportschemes targeted at the unemployed concluded that these schemes arerelatively small in scope and generate benefits that do not obviously out-weigh their costs.
It is quite understandable that government policies towards entrepren-eurship err on the side of modesty rather than extravagance. Governmentsinvariably face conflicting aspirations and objectives. They want to targetresources to achieve focus but are unable to pick winners; they want tomake assistance selective to control budgetary costs but wish also to bothremain inclusive and avoid spreading resources too thinly; and they wantpolicies to make a big impact for political reasons while minimising costsand programme deadweight losses. These trade-offs are deep-rooted andprobably inescapable.
We believe that there are several major problems with the way thatgovernments around the world currently conduct policy with regard toentrepreneurship. What follows are personal views based on a distillationof the literature encompassed in this book.
First, it is unclear why governments wish to promote entrepreneurshipin the first place. One is led to suspect that their involvement is motivatedby ideology rather than by a pragmatic evaluation of the costs and bene-fits. Many governments apparently believe that entrepreneurs create jobsand that higher levels of enterprise promote economic growth. There iscertainly no shortage of small-business practitioners and academics thathave vested interests in encouraging these beliefs, despite the limited ev-idence we have found in this book to support them (see in particularchapters 8 and 9). It rarely seems to be acknowledged in these circlesthat entrepreneurial ventures might also possess drawbacks. For exam-ple, small firms do less training and pay lower wages than large firms, soa policy of encouraging small firms at the expense of large ones mightactually damage the national skill base.
Second, there has been an explosion of policy initiatives in many coun-tries, that now resemble ‘a patchwork quilt of complexity and idiosyn-cracy’ (Curran, 2000, p. 36).1 This has generated confusion among theintended beneficiaries, which might help explain why take-up rates forinformation-based support services have been so low, rarely exceeding10 per cent even for programmes like training support that are open toall small firms. Another problem is that a plethora of policy initiatives

270 The Economics of Self-Employment and Entrepreneurship
complicates the task of evaluating specific policies, because policies tendto work jointly rather than in isolation. This problem adds to other diffi-culties of evaluating government policies towards entrepreneurship, thatare chiefly attributable to a paucity of rigorous cost-benefit analyses.
Third, from the viewpoint of many entrepreneurs, governments havean undoubted tendency to regulate too much. Some regulation is nec-essary and welfare-improving (e.g. clean air legislation), and can createentrepreneurial opportunities as well as constraints. But governmentsseem to find it just too tempting to over-regulate. By its very nature,regulation – and the mindset that accompanies it – is the antithesis ofentrepreneurship; and bureaucrats, the handmaidens of regulation, havevested interests in proliferating it. The dangers of regulation are twofold.First, it can make it costly for individuals to set up new businesses(Djankow et al., 2002). Second, and probably more importantly, the needto master, and comply with, complex government statutes crowds outentrepreneurs’ valuable time and resources from more productive activ-ities. As the burden of red tape grows year on year, one is led to wonderwhether governments are merely paying lip service to entrepreneurshiprather than genuinely seeking to promote it.
To conclude, this author believes that governments can improve mat-ters by being clearer about their objectives. Instead of formulating policiesto boost employment creation and growth, they should address only spe-cific and demonstrable market failures. Most importantly they shoulddo less, funding fewer but better publicised initiatives, and regulatingless. One practical suggestion in this regard is for the UK and Europeangovernments to emulate the US Regulatory Flexibility Act, which forcesgovernment agencies to consider the impact of proposed regulations onsmall businesses, and to consider alternatives that are likely to harm smallfirms less. Governments should also be reluctant to use tax policy activelyto promote entrepreneurship, since the theoretical results on this topic areambiguous, and the empirical results are mixed, precluding any clear rec-ommendations. Future research might fruitfully apply micro-simulationmethods to evaluate policies that take account of labour supply and oc-cupational adjustments in the presence of tax evasion, risk aversion, andnon-pecuniary factors.
Finally, governments should set aside their prejudice that there is al-ways too little entrepreneurship, and at least consider the possibility thatthere can be too much of it. This is especially important because policiesdesigned to help entrepreneurs can exacerbate the incidence of any over-investment. For example, consider a policy of giving entrepreneurs a taxadvantage that reduces the pre-tax rate of return they require to launcha new venture. Such a policy risks encouraging investment in inefficient

Conclusions 271
projects, since rational investors might forsake investments with higher(pre-tax) rates of return in favour of the less productive tax-favouredinvestments (Holtz-Eakin, 2000). It is therefore incumbent on policy-makers and supporters of entrepreneurship to take into account private-sector reactions to their policies, and to identify clearly the social benefitsmotivating them. At present there is only limited evidence about thesealleged benefits. As with policies in other areas, too, governments shouldlegislate and intervene only when there is hard evidence that the benefitsof their actions outweigh the costs.
NOTE
1. Curran (2000) cited a report by Gavron et al. (1998) that examined nofewer than 200 UK government entrepreneurship initiatives, whose total costamounted to £632m throughout 1995–6 alone. Fuest, Huber and Nielsen(2002) cited research identifying over 500 programmes to promote entre-preneurial entry in Germany.

References
Acs, Z. J. and D. B. Audretsch (1987a). Innovation in large and small firms,Economics Letters, 23, pp. 109–12
(1987b). Innovation, market structure, and firm size, Review of Economics andStatistics, 49, pp. 567–74
(1988). Innovation in large and small firms: an empirical analysis, AmericanEconomic Review, 78, pp. 678–90
(1989). Small firm entry in manufacturing, Economica, 56, pp. 255–65(1991). R&D, firm size and innovative activity, in Z. J. Acs and D. B. Audretsch
(eds.), Innovation and Technological Change, Ann Arbor, University ofMichigan Press, pp. 39–59
(1993). Small Firms and Entrepreneurship: An East–West Perspective, Cambridge,Cambridge University Press
Acs, Z. J., D. B. Audretsch and D. S. Evans (1994). Why does the self-employmentrate vary across countries and over time?, Discussion Paper, 871, London,CEPR
Acs, Z. J., B. Carlsson and C. Karlsson (1999). The linkages among entrepreneur-ship, SMEs and the macroeconomy, in Z. J. Acs, B. Carlsson and C. Karlsson(eds.), Entrepreneurship, Small and Medium Sized Enterprises and the Macroe-conomy, Cambridge, Cambridge University Press, pp. 3–42
Agarwal, R. (1998). Small firm survival and technological activity, Small BusinessEconomics, 11, pp. 215–24
Agarwal, R. and D. B. Audretsch (2001). Does entry size matter? The impact ofthe life cycle and technology on firm survival, Journal of Industrial Economics,49, pp. 21–43
Aldrich, H., J. Cater, T. Jones, D. McEvoy and P. Velleman (1985). Ethnic resi-dential concentration and the protected market hypothesis, Social Forces, 63,pp. 996–1009
Aldrich, H. and R. Waldinger (1990). Trends in ethnic businesses in the UnitedStates, in R. Waldinger, H. Aldrich and R. Ward (eds.), Ethnic Entrepreneurs,Newbury Park, CA, Sage
Allen, F. (1983). Credit rationing and payment incentives, Review of EconomicStudies, 50, pp. 639–46
Altman, E. (1983). Corporate Financial Distress, New York, Wiley-InterscienceAmit, R., L. Glosten and E. Muller (1993). Challenges to theory development
in entrepreneurship research, Journal of Mathematical Sociology, 30, pp. 815–34
272

References 273
Amit, R., E. Muller and I. Cockburn (1995). Opportunity costs and en-trepreneurial activity, Journal of Business Venturing, 10, pp. 95–106
Appelbaum, E. and E. Katz (1986). Measures of risk aversion and comparativestatics of industry equilibrium, American Economic Review, 76, pp. 524–29
Appelbaum, E. and C. Lim (1982). Long-run industry equilibrium with uncer-tainty, Economics Letters, 9, pp. 139–45
Arabsheibani, G., D. de Meza, J. Maloney and B. Pearson (2000). And a visionappeared unto them of a great profit: evidence of self-deception among theself-employed, Economics Letters, 67, pp. 35–41
Armendariz de Aghion, B. (1999). On the design of a credit agreement with peermonitoring, Journal of Development Economics, 60, pp. 79–104
Armendariz de Aghion, B. and C. Gollier (2000). Peer group formation in anadverse selection model, Economic Journal, 110, pp. 632–43
Armington, C. and M. Odle (1982). Small business: how many jobs?, BrookingsReview, Winter, 14–17
Aronson, R. L. (1991). Self Employment: A Labour Market Perspective, Ithaca, NY,ILR Press
Atrostic, B. K. (1982). The demand for leisure and non-pecuniary job charac-teristics, American Economic Review, 72, pp. 428–40
Audretsch, D. B. (1991). New-firm survival and the technological regime, Reviewof Economics and Statistics, 73, pp. 441–50
Audretsch, D. B. (1995). Innovation and Industry Evolution, MIT Press,Cambridge MA
Audretsch, D. B. and Z. J. Acs (1994). New firm start-ups, technology andmacroeconomic fluctuations, Small Business Economics, 6, pp. 439–49
Audretsch, D. B. and T. Mahmood (1994). The rate of hazard confronting newfirms and plants in US manufacturing, Review of Industrial Organisation, 9,pp. 41–56
(1995). New firm survival: new results using a hazard function, Review of Eco-nomics and Statistics, 77, pp. 97–103
Audretsch, D. B. and M. Vivarelli (1997). Determinants of new firm start-ups inItaly, Empirica, 23, pp. 91–105
Baker, P. (1993). Taxpayer compliance for the self-employed: estimates fromhousehold spending data, Working Paper, W93/14, London, Institute forFiscal Studies
Baldwin, J. and G. Picot (1995). Employment generation by small producersin the Canadian manufacturing sector, Small Business Economics, 7,pp. 317–31
Baltensperger, E. (1978). Credit rationing: issues and questions, Journal of Money,Credit, and Banking, 10, pp. 170–83
Banerjee, A. V., T. Besley and T. W. Guinnane (1994). Thy neighbour’s keeper:the design of a credit co-operative with theory and a test, Quarterly Journalof Economics, 109, pp. 491–515
Banerjee, A. V. and A. F. Newman (1993). Occupational choice and the processof development, Journal of Political Economy, 101, pp. 274–98
Bank of England (1993). Bank Lending to Smaller Businesses, London, Bank ofEngland

274 References
(1999). The Financing of Ethnic Minority Firms in the United Kingdom, London,Bank of England
(2001). Finance for Small Firms: Eighth Report, London, Bank of EnglandBannock, G. (1981). The Economics of Small Firms: Return from the Wilderness,
Oxford, Basil BlackwellBannock, G. and A. Peacock (1989). Government and Small Business, London,
Paul Chapman PublishingBarkham, R., M. Hart and E. Hanvey (1996). Growth in small manufacturing
firms: an empirical analysis, in R. Blackburn and P. Jennings (eds.), SmallFirms’ Contribution to Economic Regeneration, London, Paul Chapman Pub-lishing, pp. 112–25
Barreto, H. (1989). The Entrepreneur in Microeconomic Theory: Disappearance andExplanation, London, Routledge
Barro, R. J. (1976). The loan market, collateral, and rates of interest, Journal ofMoney, Credit, and Banking, 8, pp. 439–56
Barzel, Y. (1987). The entrepreneur’s reward for self-policing, Economic Inquiry,25, pp. 103–16
Basu, A. (1998). An exploration of entrepreneurial activity among Asian smallbusinesses in Britain, Small Business Economics, 10, pp. 313–26
Basu, A. and S. C. Parker (2001). Family finance and new business start-ups,Oxford Bulletin of Economics and Statistics, 63, pp. 333–58
Bates, T. (1984). A review of the Small Business Administration’s major loanprograms, in P. M. Horvitz and R. R. Pettit (eds.), Small Business Finance:Sources of Financing for Small Business, Part B, Greenwich, CT, JAI Press,pp. 211–39
(1985). Entrepreneur human capital endowments and minority business via-bility, Journal of Human Resources, 20, pp. 540–54
(1990). Entrepreneur human capital inputs and small business longevity,Review of Economics and Statistics, 72, pp. 551–9
(1991). Commercial bank finance in white and black owned small businessstart ups, Quarterly Review of Economics and Business, 31, pp. 64–80
(1994). Firms started as franchises have lower survival rates than independentsmall business startups, Discussion Paper, Center for Economic Studies, USCensus Bureau, Washington DC
(1995). Self-employment entry across industry groups, Journal of Business Ven-turing, 10, pp. 143–56
(1997). Race, Self-Employment and Upward Mobility: An Illusive AmericanDream, Baltimore, Johns Hopkins University Press
(1998). Survival patterns among newcomers to franchising, Journal of BusinessVenturing, 13, pp. 113–30
(1999). Exiting self-employment: an analysis of Asian immigrant-owned smallbusinesses, Small Business Economics, 13, pp. 171–83
Bates, T. and W. D. Bradford (1992). Factors affecting new firm success andtheir use in venture capital financing, Journal of Small Business Finance, 2,pp. 23–38
Baumol, W. J. (1968). Entrepreneurship in economic theory, American EconomicReview, Papers and Proceedings, 58, pp. 64–71

References 275
(1983). Toward operational models of entrepreneurship, in J. Ronen (ed.),Entrepreneurship, Lexington, MA, D.C. Heath, pp. 29–48
(1990). Entrepreneurship: productive, unproductive, and destructive, Journalof Political Economy, 98, pp. 893–921
(1993). Entrepreneurship, Management and Structure of Payoffs, Cambridge, MA,MIT Press
Bearse, P. J. (1984). An econometric analysis of black entrepreneurship, Reviewof Black Political Economy, 12, pp. 117–34
Becker, E. (1984). Self-employed workers: an update to 1983, Monthly LaborReview, 107, pp. 14–18
Beesley, M. E. and R. T. Hamilton (1984). Small firms’ seedbed role and theconcept of turbulence, Journal of Industrial Economics, 33, pp. 217–29
Belke, A., R. Fehn and N. Foster (2002). VC investment and labour marketperformance: a panel data analysis, Paper presented to the CESifo Con-ference on Venture Capital, Entrepreneurship, and Public Policy, Munich,November
Bell, C. (1990). Interactions between institutional and informal credit agenciesin rural India, World Bank Economic Review, 4, pp. 297–327
Bendick, M. and M. L. Egan (1987). Transfer payment diversion for small busi-ness development: British and French experience, Industrial and Labor Rela-tions Review, 40, pp. 528–42
Bennett, R. J. and P. J. A. Robson (1999). The use of external business advice bySMEs in Britain, Entrepreneurship and Regional Development, 11, pp. 155–80
Bennett, R. J., P. J. Wicks and A. McCoshan (1994). Local Empowerment andBusiness Services: Britain’s Experiment with TECs, London, UCL Press
Berger, A. N. and G. F. Udell (1990). Collateral, loan quality and bank risk,Journal of Monetary Economics, 25, pp. 21–42
(1992). Some evidence on the empirical significance of credit rationing, Journalof Political Economy, 100, pp. 1047–77
(1995). Relationship lending and lines of credit in small firm finance, Journalof Business, 68, pp. 351–81
Bernanke, B. and M. Gertler (1990). Financial fragility and economic perfor-mance, Quarterly Journal of Economics, 105, pp. 87–114
Bernardo, A. E. and I. Welch (2001). On the evolution of overconfidence andentrepreneurs, Journal of Economics and Management Strategy, 10, pp. 301–30
Bernhardt,D. (2000).Credit rationing?,AmericanEconomicReview, 90, pp. 235–9Bernhardt, I. (1994). Competitive advantage in self-employment and paid work,
Canadian Journal of Economics, 27, pp. 273–89Bernheim, B. D., A. Shleifer and L. H. Summers (1985). The strategic bequest
motive, Journal of Political Economy, 93, pp. 1045–76Bertrand, T. and L. Squire (1980). The relevance of the dual economy model: a
case study of Thailand, Oxford Economic Papers, 32, pp. 480–511Besanko, D. and A. V. Thakor (1987a). Collateral and rationing: sorting equi-
libria in monopolistic and competitive credit markets, International EconomicReview, 28, pp. 671–89
(1987b). Competitive equilibrium in the credit market under asymmetric in-formation, Journal of Economic Theory, 42, pp. 167–82

276 References
Besley, T. (1995). Nonmarket institutions for credit and risk sharing in low-income countries, Journal of Economic Perspectives, 9, pp. 115–27
Besley, T., S. Coate and G. Loury (1993). The economics of rotating savings andcredit associations, American Economic Review, 83, pp. 792–810
Bester, H. (1985a). Screening vs. rationing in credit markets with imperfect in-formation, American Economic Review, 75, pp. 850–55
(1985b). The level of investment in credit markets with imperfect information,Journal of Institutional and Theoretical Economics, 141, pp. 503–15
(1987). The role of collateral in credit markets with imperfect information,European Economic Review, 31, pp. 887–99
(1994). The role of collateral in a model of debt renegotiation, Journal of Money,Credit, and Banking, 26, pp. 72–86
Biais, B. and C. Gollier (1997). Trade credit and credit rationing, Review ofFinancial Studies, 10, pp. 903–37
Binks, M. and A. Jennings (1986). Small firms as a source of economic rejuvena-tion, in J. Curran et al. (eds.), The Survival of the Small Firm, 1, Aldershot,Gower, pp. 19–37
Binks, M. and P. Vale (1990). Entrepreneurship and Economic Change, London,McGraw-Hill
Birch, D. L. (1979). The Job Generation Process, MIT Programme on Neighbour-hood and Regional Change, Cambridge, MA, MIT
Birch, D. L., A. Haggerty and W. Parsons (1997). Who’s Creating Jobs?,Cambridge, MA, Cognetics Inc.,
Black, J. and D. de Meza (1990). On giving credit where it is due, DiscussionPaper, 9008, Department of Economics, University of Exeter
(1997). Everyone may benefit from subsidising entry to risky occupations,Journal of Public Economics, 66, pp. 409–24
Black, J., D. de Meza and D. Jeffreys (1996). House prices, the supply of collateraland the enterprise economy, Economic Journal, 106, pp. 60–75
Blackburn, R. A. (1992). Small firms and subcontracting: what is it and where?,in P. Leighton and A. Felstead (eds.), The New Entrepreneurs: Self-Employmentand Small Business in Europe, London, Kogan Page, pp. 305–21
Blanchflower, D. G. (1997). The attitudinal legacy of communist labour relations,Industrial and Labor Relations Review, 50, pp. 438–59
(2000). Self-employment in OECD countries, Labour Economics, 7, pp. 471–505
Blanchflower, D. G. and R. B. Freeman (1994). Did the Thatcher reforms changeBritish labour market performance?, in R. Barrell (ed.), The UK LabourMarket, Cambridge, Cambridge University Press, pp. 51–92
Blanchflower, D. G. and B. D. Meyer (1994). A longitudinal analysis of the youngself-employed in Australia and the United States, Small Business Economics,6, pp. 1–19
Blanchflower, D. G. and A. Oswald (1990). Self-employment and the enterpriseculture, in R. Jowell, S. Witherspoon and L. Brook (eds.), British SocialAttitudes: The 1990 Report, London, Gower
(1998). What makes an entrepreneur?, Journal of Labour Economics, 16,pp. 26–60

References 277
Blanchflower, D. G., A. Oswald and A. Stutzer (2001). Latent entrepreneurshipacross nations, European Economic Review, 45, pp. 680–91
Bland, R., B. Elliott and F. Bechhofer (1978). Social mobility in the petite bour-geoisie, Acta Sociologica, 21, pp. 229–48
Blau, D. M. (1985). Self-employment and self-selection in developing countrylabour markets, Southern Economic Journal, 52, pp. 351–63
(1986). Self-employment, earnings and mobility in peninsular Malaysia, WorldDevelopment, 14, pp. 839–52
(1987). A time-series analysis of self-employment in the United States, Journalof Political Economy, 95, pp. 445–67
Blinder, A. S. (1989). Macroeconomics Under Debate, Ann Arbor, University ofMichigan Press
Blundell, R. and T. MaCurdy (1999). Labour supply: a review of alternativeapproaches, in O. Ashenfelter and D. Card (eds.), Handbook of Labour Eco-nomics, 3A, Amsterdam, Elsevier, pp. 1559–1695
Boadway, R., M. Marchand and P. Pestieau (1991). Optimal linear income tax-ation in models with occupational choice, Journal of Public Economics, 46,pp. 133–62
Boadway, R. N. Marceau, M. Marchand and M. Vigneault (1998). Entrepreneur-ship, asymmetric information and unemployment, International Tax and Pub-lic Finance, 5, pp. 307–27
Boden, R. J. (1996). Gender and self-employment selection: an empirical assess-ment, Journal of Socioeconomics, 25, pp. 671–82
Boden, R. J. and A. R. Nucci (1997). Counting the self-employed using householdand business sample data, Small Business Economics, 9, pp. 427–36
(2000). On the survival prospects of men’s and women’s new business ventures,Journal of Business Venturing, 15, pp. 347–62
Bogenhold, D. and U. Staber (1991). The decline and rise of self-employment,Work Employment and Society, 5, pp. 223–39
Bond, E. W. (1986). Entrepreneurial ability, income distribution and interna-tional trade, Journal of International Economics, 20, pp. 343–56
Boot, A. W. A. and A. V. Thakor (1994). Moral hazard and secured lending inan infinitely repeated credit market game, International Economic Review, 35,pp. 899–920
Boot, A. W. A., A. V. Thakor and G. F. Udell (1991). Secured lending and defaultrisk: equilibrium analysis, policy implications and empirical results, EconomicJournal, 101, pp. 458–72
Bopaiah, C. (1998). Availability of credit to family businesses, Small BusinessEconomics, 11, pp. 75–86
Borjas, G. J. (1986). The self-employment experience of immigrants, Journal ofHuman Resources, 21, pp. 485–506
Borjas, G. J. and S. G. Bronars (1989). Consumer discrimination and self-employment, Journal of Political Economy, 97, pp. 581–605
Borooah, V. K. and M. Hart (1999). Factors affecting self-employment amongIndian and black Caribbean men in Britain, Small Business Economics, 13,pp. 111–29
Boswell, J. (1972). The Rise and Decline of Small Firms, London, Allen & Unwin
278 References
Bosworth, B. P., A. S. Carron and E. Rhyne (1987). The Economics of GovernmentCredit, Washington, DC, Brookings Institution
Bottazzi, L. and M. da Rin (2002). Financing entrepreneurial firms in Europe:facts, issues, and research agenda, Paper presented to the CESifo Con-ference on Venture Capital, Entrepreneurship, and Public Policy, Munich,November
Boulier, B. L. (1979). Supply decisions of self-employed professionals: the caseof dentists, Southern Economic Journal, 45, pp. 892–902
Bovaird, C. (1990). Introduction to Venture Capital Finance, London, PitmanBowlin, O. D. (1984). Lease financing: an attractive method of financing for small
firms, in P. M. Horvitz and R. R. Pettit (eds.), Small Business Finance: Sourcesof Financing for Small Business, Part B, Greenwich, CT, JAI Press, pp. 155–62
Boyd, D. P. (1984). Type A behaviour, financial performance and organisa-tional growth in small business firms, Journal of Occupational Psyschology,57, pp. 137–40
Boyd, R. L. (1990). Black and Asian self-employment in large metropolitan areas:a comparative analysis, Social Problems, 37, pp. 258–69
Bracoud, F. and B. Hillier (2000). Equity or debt? Contracts in markets withasymmetric information, Manchester School, 68, pp. 1–23
Bregger, J. E. (1996). Measuring self-employment in the United States, MonthlyLabor Review, 119, pp. 3–9
Brock, W. A., and D. S. Evans (1986). The Economics of Small Businesses: TheirRole and Regulation in the US Economy, New York, Holmes & Meier
Brockhaus, R. H. (1980). Risk taking propensity of entrepreneurs, Academy ofManagement Journal, 23, pp. 509–20
(1982). The psychology of the entrepreneur, in C. Kent, D. Sexton andK. Vesper (eds.), The Encyclopaedia of Entrepreneurship, Englewood Cliffs,NJ, Prentice-Hall
Brown, C., J. Hamilton and J. Medoff (1990). Employers Large and Small,Cambridge, MA, Harvard University Press
Brown, S. and J. G. Sessions (1998). Education, employment status and earn-ings: a comparative test of the strong screening hypothesis, Scottish Journalof Political Economy, 45, pp. 586–91
(1999). Education and employment status: a test of the strong screening hy-pothesis in Italy, Economics of Education Review, 18, pp. 397–404
Browne, F. X. (1987). Sluggish quantity adjustment in a non-clearing market – adisequilibrium application to the loan market, Journal of Applied Econometrics,2, pp. 335–49
Bruce, D. (1999). Do husbands matter? Married women entering self-employment, Small Business Economics, 13, pp. 317–29
(2000). Effects of the United States tax system on transitions intoself-employment, Labour Economics, 7, pp. 545–74
(2002). Taxes and entrepreneurial endurance: evidence from the self-employed, National Tax Journal, 55, pp. 5–24
Bruce, D., D. Holtz-Eakin and J. Quinn (2000). Self-employment and labourmarket transitions at older ages, Working Paper, CRR WP 2000–13, BostonCollege

References 279
Bruderl, J. and P. Preisendorfer (1998). Network support and the success of newlyfounded businesses, Small Business Economics, 10, pp. 213–25
Bruderl, J., P. Preisendorfer and R. Ziegler (1992). Survival chances of newlyfounded business organisations, American Sociological Review, 57, pp. 227–42
Brusch, C. G. (1992). Research on women business owners: past trends, a newperspective and future directions, Entrepreneurship Theory and Practice, 4,pp. 5–30
Bruyat, C. A. and P. A. Julien (2001). Defining the field of research in en-trepreneurship, Journal of Business Venturing, 16, pp. 165–80
Burke, A. E., F. R. Fitz-Roy and M. A. Nolan (2000). When less is more: distin-guishing between entrepreneurial choice and performance, Oxford Bulletin ofEconomics and Statistics, 62, pp. 565–87
Calvo, G. and S. Wellisz (1980). Technology, entrepreneurs, and firm size, Quar-terly Journal of Economics, 95, pp. 663–77
Camerer, C. and Lovallo, D. (1999). Overconfidence and excess entry: an exper-imental approach, American Economic Review, 89, pp. 306–18
Camerer, C., L. Babcock, G. Loewenstein and R. Thaler (1997). Labour supplyof New York City cabdrivers: one day at a time, Quarterly Journal of Economics,112, pp. 407–41
Campbell, M. and M. Daly (1992). Self-employment: into the 1990s, EmploymentGazette, 100, pp. 269–92
Campbell, T. S. (1979). Optimal investment financing decisions and the value ofconfidentiality, Journal of Financial and Quantitative Analysis, 14, pp. 913–24
Cantillon, R. (1755). Essai Sur la Nature du Commerce en General, 1931 edn., ed.and tran. by H. Higgs, London, Macmillan
Caputo, R. K. and A. Dolinsky (1998). Women’s choice to pursue self-employment: the role of financial and human capital of household members,Journal of Small Business Management, 36, pp. 8–17
Carlsson, B. (1989). Flexibility and the theory of the firm, International Journalof Industrial Organization, 7, pp. 179–203
(1992). Management of flexible manufacturing – an international comparison,Omega, 20, 11–22
Carlsson, B., D. B. Andretsch and Z. J. Acs (1994). Flexible technology andplant size – United States manufacturing and metalworking industries, In-ternational Journal of Industrial Organization, 12, pp. 359–72
Carr, D. (1996). Two paths to self-employment? Women’s and men’s self-employment in the United States, 1980, Work and Occupations, 23, 26–53
Carrasco, R. (1999). Transitions to and from self-employment in Spain: an em-pirical analysis, Oxford Bulletin of Economics and Statistics, 61, pp. 315–41
Carrington, W. J., K. McCue and B. Pierce (1996). The role of em-ployer/employee interactions in labour market cycles: evidence from the self-employed, Journal of Labour Economics, 14, pp. 571–602
Carroll, G. R. and E. Mosakowski (1987). The career dynamics of self-employment, Administrative Sciences Quarterly, 32, pp. 570–89
Carroll, R., D. Holtz-Eakin, M. Rider and H. S. Rosen (2000a). Income taxes andentrepreneurs’ use of labour, Journal of Labour Economics, 18, pp. 324–51

280 References
(2000b). Entrepreneurs, income taxes and investment, in J. B. Slemrod (ed.),Does Atlas Shrug? The Economic Consequences of Taxing the Rich, New York,Russell Sage pp. 427–55
(2001). Personal income taxes and the growth of small firms, in J. Poterba (ed.),Tax Policy and the Economy, 15, Cambridge, MA, MIT Press, pp. 121–47
Carson, C. S. (1984). The underground economy: an introduction, Survey ofCurrent Business, 64, pp. 21–37
Carter, N. M., M. Williams and P. D. Reynolds (1997). Discontinuance amongnew firms in retail: the influence of initial resources, strategy and gender,Journal of Business Venturing, 12, pp. 125–45
Carter, S. and T. Cannon (1992). Women as Entrepreneurs, London, Harcourt-Brace Jovanovich
Casey, B. and S. Creigh (1988). Self-employment in Great Britain: its definitionin the LFS, in tax and social security law and in labour law, Work Employmentand Society, 2, pp. 381–91
Casson, M. (ed.) (1990). Entrepreneurship, London, Edward Elgar(1999). Entrepreneurship and the theory of the firm, in Z. J. Acs, B. Carlsson
and C. Karlsson (eds.), Entrepreneurship, Small and Medium Sized Enterprisesand the Macroeconomy, Cambridge, Cambridge University Press, pp. 45–781
(2003). The Entrepreneur: An Economic Theory, 2nd edn. Cheltenham, EdwardElgar
Chamley, C. (1983). Entrepreneurial abilities and liabilities in a model of self-selection, Bell Journal of Economics, 14, pp. 70–80
Chan, Y.-S. and G. Kanatos (1985). Asymmetric valuations and the role of collat-eral in loan agreements, Journal of Money, Credit, and Banking, 17, pp. 84–95
Chan, Y.-S. and A. V. Thakor (1987). Collateral and competitive equilibria withmoral hazard and private information, Journal of Finance, 42, pp. 345–63
Chell, E., C. Haworth and S. Brearley (1991). The Entrepreneurial Personality:Concepts, Cases and Categories, London, Routledge
Chiswick, B. R. (1978). The effect of Americanisation on the earnings of foreign-born men, Journal of Political Economy, 86, pp. 897–921
Chiswick, C. U. (1976). On estimating earnings functions for LDCs, Journal ofDevelopment Economics, 3, pp. 67–78
Cho, Y. (1986). Inefficiencies from financial liberalisation in the absence ofwell-functioning equity markets, Journal of Money, Credit, and Banking, 18,pp. 191–9
Christiansen, L. R. (1971). Entrepreneurial income: how does it measure up?,American Economic Review, 71, pp. 575–85
Clark, K. and S. Drinkwater (1998). Ethnicity and self-employment in Britain,Oxford Bulletin of Economics and Statistics, 60, pp. 383–407
(2000). Pushed out or pulled in? Self-employment among ethnic minorities inEngland and Wales, Labour Economics, 7, pp. 603–28
(2002). Enclaves, neighbourhood effects and employment outcomes: ethnicminorities in England and Wales, Journal of Population Economics, 15, pp. 5–29
Clark, K., S. Drinkwater and D. Leslie (1998). Ethnicity and self-employmentearnings in Britain 1973–95, Applied Economics Letters, 5, pp. 631–34

References 281
Clemenz, G. (1986). Credit Markets with Asymmetric Information, Lecture Notesin Economics and Mathematical Systems, 272, Berlin, Springer-Verlag
Clotfelter, C. T. (1983). Tax evasion and tax rates: an analysis of individualreturns, Review of Economics and Statistics, 65, pp. 363–73
Coate, S. and S. Tennyson (1992). Labour market discrimination, imperfectinformation and self-employment, Oxford Economic Papers, 44, pp. 272–88
Coco, G. (1999). Collateral, heterogeneity in risk attitude and the credit marketequilibrium, European Economic Review, 43, pp. 559–74
(2000). On the use of collateral, Journal of Economic Surveys, 14, pp. 191–214Cohen, W. M. and S. Klepper (1996). A reprise of size and R&D, Economic
Journal, 106, pp. 925–51Connelly, R. (1992). Self-employment and providing child care, Demography, 29,
pp. 17–29Cooper, A. C. (1986). Entrepreneurship and high tech, in D. Sexton and
R. Smilor (eds.), The Art and Science of Entrepreneurship, Cambridge, MA,Ballinger, pp. 153–68
Cooper, A. C. and A. V. Bruno (1977). Success among high-technology firms,Business Horizons, 2, pp. 16–22
Cooper, A. C., F. J. Gimeno-Gascon and C. Y. Woo (1994). Initial human andfinancial capital as predictors of new venture performance, Journal of BusinessVenturing, 9, pp. 371–95
Cooper, A. C., C. Y. Woo and W. C. Dunkelberg (1988). Entrepreneurs’ per-ceived chances for success, Journal of Business Venturing, 3, pp. 97–108
(1989). Entrepreneurship and the initial size of firms, Journal of Business Ven-turing, 4, pp. 317–22
Copulsky, W. and H. McNulty (1974). Entrepreneurship and the Corporation, NewYork, AMACOM
Cosh, A. D. and A. Hughes (1994). Size, financial structure and profitability:UK companies in the 1980s, in A. Hughes and D. Storey (eds.), Finance andthe Small Firm, London, Routledge, pp. 18–63
Cosh, A. D., A. Hughes and E. Wood (1999). Innovation in UK SMEs: causes andconsequences for firm failure and acquisition, in Z. J. Acs and B. Carlsson(eds.), Entrepreneurship, Small and Medium Sized Enterprises and the MacroEconomy, Cambridge, Cambridge University Press
Covick, O. (1983). Self-employment growth in Australia, in R. Blandy andO. Covick (eds.), Understanding Labour Markets in Australia, Sydney, Allen& Unwin, pp. 84–110
Cowling, M. (1998). Regional determinants of small firm loans under the UKLoan Guarantee Scheme, Small Business Economics, 11, pp. 155–67
(2000). Are entrepreneurs different across countries?, Applied Economics Letters,7, pp. 785–89
Cowling, M. and N. Clay (1995). Factors influencing take-up rates on the LoanGuarantee Scheme, Small Business Economics, 7, pp. 141–52
Cowling, M. and P. Mitchell (1997). The evolution of UK self-employment: astudy of government policy and the role of the macroeconomy, ManchesterSchool, 65, pp. 427–42

282 References
Cowling, M. and M. Taylor (2001). Entrepreneurial women and men: two dif-ferent species?, Small Business Economics, 16, pp. 167–75
Craggs, P. and P. Jones (1998). UK results from the Community InnovationSurvey, Economic Trends, 539, London, HMSO
Cramer, J. S., J. Hartog, N. Jonker and C. M. van Praag (2002). Low risk aversionencourages the choice for entrepreneurship: an empirical test of a truism,Journal of Economic Behaviour and Organization, 48, pp. 29–36
Creedy, J. and P. S. Johnson (1983). Firm formation in manufacturing industry,Applied Economics, 15, pp. 177–85
Cressy, R. C. (1993). The Startup Tracking Exercise: Third Year Report, NationalWestminster Bank of Great Britain, November
(1996). Are business start-ups debt-rationed?, Economic Journal, 106,pp. 1253–70
(1999). Small business failure: failure to fund or failure to learn?, in Z. J. Acs,B. Carlsson and C. Karlsson (eds.), Entrepreneurship, Small and Medium SizedEnterprises and the Macroeconomy, Cambridge, Cambridge University Press,pp. 161–85
(2000). Credit rationing or entrepreneurial risk aversion? An alternative expla-nation for the Evans and Jovanovic finding, Economics Letters, 66, pp. 235–40
Cressy, R. C. and O. Toıvanen (1997). Is there adverse selection in the creditmarket? Warwick Business School, mimeo
Cromie, S. (1987). Motivations of aspiring male and female entrepreneurs, Jour-nal of Occupational Behaviour, 8, pp. 251–61
Cukierman, A. (1978). The horizontal integration of the banking firm: creditrationing and monetary policy, Review of Economic Studies, 45, pp. 165–78
Cullen, J. B. and R. H. Gordon (2002). Taxes and entrepreneurial activity: theoryand evidence for the US, NBER Working Paper, 9015, National Bureau ofEconomic Research
Curran, J. (2000). What is small business policy in the UK for? Evaluationand assessing small business policy, International Small Business Journal, 18,pp. 36–50
Curran, J., and R. A. Blackburn (1993). Ethnic Enterprise and the High StreetBank, Kingston University (UK), Small Business Research Centre
(2001). Older people and the enterprise society: age and self-employmentpropensities, Work Employment and Society, 15, pp. 889–902
Curran, J. and R. Burrows (1989). National profiles of the self-employed, Em-ployment Gazette, 97, pp. 376–85
(eds.) (1991). Paths of Enterprise, London, RoutledgeCurran, J., R. Burrows and M. Evandrou (1987). Small Business Owners and
the Self-Employed in Britain: An Analysis of the GHS Data, London, SmallBusiness Research Trust
Daly, M. (1991). The 1980s – a decade of growth in enterprise, EmploymentGazette, 99, pp. 109–34
et al. (1991). Job creation 1987–1989: the contributions of large and smallfirms, Employment Gazette, 99, pp. 109–34

References 283
Dant, R. P. (1995). Motivation for franchising: rhetoric versus reality, Interna-tional Small Business Journal, 14, pp. 10–32
Davidsson, P., L. Lindmark and C. Olofsson (1998). The extent of over-estimation of small firm job creation – an empirical examination of theregression bias, Small Business Economics, 11, pp. 87–100
Davis, S. J. and J. C. Haltiwanger (1992). Gross job creation, gross job destructionand employment reallocation, Quarterly Journal of Economics, 107, pp. 819–63
Davis, S. J., J. C. Haltiwanger and S. Schuh (1996a). Job Creation and Destruction,Cambridge, MA, MIT Press
(1996b). Small business and job creation: dissecting the myth and reassessingthe facts, Small Business Economics, 8, pp. 297–315
de Aghion, B. A. and J. Morduch (2000). Microfinance beyond group lending,Economics of Transition, 8, pp. 401–20
de Meza, D. (2002). Overlending? Economic Journal, 112, pp. F17–F31de Meza, D. and C. Southey (1996). The borrower’s curse: optimism, finance
and entrepreneurship, Economic Journal, 106, pp. 375–86de Meza, D. and D. C. Webb (1987). Too much investment: a problem of asym-
metric information, Quarterly Journal of Economics, 102, pp. 281–92(1988). Credit market efficiency and tax policy in the presence of screening
costs, Journal of Public Economics, 36, pp. 1–22(1989). The role of interest rate taxes in credit markets with divisible projects
and asymmetric information, Journal of Public Economics, 39, pp. 33–44(1990). Risk, adverse selection and capital market failure, Economic Journal,
100, pp. 206–14(1992). Efficient credit rationing, European Economic Review, 36, pp. 1277–90(1999). Wealth, enterprise and credit policy, Economic Journal, 109, pp. 153–
63(2000). Does credit rationing imply insufficient lending?, Journal of Public Eco-
nomics, 78, pp. 215–34Deakins, D. (1999). Entrepreneurship and Small Firms, 2nd edn., London,
McGraw-HillDenison, E. F. (1967). Why Growth Rates Differ: Postwar Experience in Nine Western
Countries, Washington, DC, Broowings InstitutionDennis, W. J. (1996). Self-employment: when nothing else is available?, Journal
of Labour Research, 17, pp. 645–61(DTI) (1999). The Small Business Service: A Public Consultation Document,
London, Department of Trade and IndustryDevine, T. J. (1994a). Characteristics of self-employed women in the United
States, Monthly Labor Review, 117, pp. 20–34(1994b). Changes in wage-and-salary returns to skill and the recent rise in
female self-employment, American Economic Review, Papers and Proceedings,84, pp. 108–113
(1995). CPS earnings data for the self-employed: words of caution for use andinterpretation, Journal of Economic and Social Measurement, 21, pp. 213–51
Devine, T. J. and T. Mlakar (1993). Inter-industry variations in the determinantsof self-employment, Pennsylvania State University, mimeo

284 References
Diamond, D. (1984). Financial intermediation and delegated monitoring, Reviewof Economic Studies, 51, pp. 393–414
Dilnot, A. W. and C. N. Morris (1981). What do we know about the blackeconomy?, Fiscal Studies, 2, pp. 58–73
Dixit, A. and R. Rob (1994). Switching costs and sectoral adjustments in generalequilibrium with uninsured risk, Journal of Economic Theory, 62, pp. 48–69
Dixon, R. (1991). Venture capital and the appraisal of investments, Omega, 19,pp. 333–44
Djankow, S., R. La Porta, F. Lopez-de-Silanes and A. Shleifer (2002). The reg-ulation of entry, Quarterly Journal of Economics, 117, pp. 1–37
Dolton, P. J. and G. H. Makepeace (1990). Self-employment among graduates,Bulletin of Economic Research, 42, pp. 35–53
Dosi, G. (1988). Sources, procedures, and microeconomic effects of innovation,Journal of Economic Literature, 26, pp. 1120–71
Du Rietz, A. and M. Henrekson (2000). Testing the female underperformancehypothesis, Small Business Economics, 14, pp. 1–10
Dunn, T. and D. Holtz-Eakin (2000). Financial capital, human capital and thetransition to self-employment: evidence from intergenerational links, Journalof Labour Economics, 18, pp. 282–305
Dunne, P. and A. Hughes (1994). Age, size, growth and survival – UK companiesin the 1980s, Journal of Industrial Economics, 42, pp. 115–40
Dunne, T, M. Roberts and L. Sammelson (1989a). The growth and failureof US manufacturing plants, Quarterly Journal of Economics, 104, pp. 495–515
(1989b). Plant turnover and gross employment flows in the US manufacturingsector, Journal of Labour Economics, 7, pp. 48–71
Dutz, M. A., J. A. Ordover and R. D. Willig (2000). Entrepreneurship, ac-cess policy and economic development: lessons from industrial organisation,European Economic Review, 44, pp. 739–47
Earle, J. S. and Z. Sakova (2000). Business start-ups or disguised unemployment?Evidence on the character of self-employment from transition economies,Labour Economics, 7, pp. 575–601
Eden, D. (1975). Organisational membership versus self-employment: anotherblow to the American Dream, Organisational Behaviour and Human Perfor-mance, 13, pp. 79–94
Edwards, L. N. and E. Field-Hendrey (2002). Home-based work and women’slabour force decisions, Journal of Labour Economics, 20, pp. 170–200
Elkan, W. (1988). Entrepreneurs and entrepreneurship in Africa, World BankResearch Observer, 3, 171–85
Employment Department (1989). Small Firms in Britain, London, HMSOEricsson, R. and A. Pakes (1995). Markov perfect industry dynamics: a frame-
work for empirical work, Review of Economic Studies, 62, pp. 53–82Evans, D. S. (1987a). The relationship between firm growth, size and age: esti-
mates for 100 manufacturing industries, Journal of Industrial Economics, 35,pp. 567–81
(1987b). Tests of alternative theories of firm growth, Journal of Political Econ-omy, 95, pp. 657–74

References 285
Evans, D. S. and B. Jovanovic (1989). An estimated model of entrepreneurialchoice under liquidity constraints, Journal of Political Economy, 97, pp. 808–27
Evans, D. S. and L. S. Leighton (1989a). The determinants of changes in USself-employment, 1968–1987, Small Business Economics, 1, pp. 111–19
(1989b). Some empirical aspects of entrepreneurship, American Economic Re-view, 79, pp. 519–35
Evans, M. D. R. (1989). Immigrant entrepreneurship: effects of ethnic marketsize and isolated labour pool, American Sociological Review, 54, pp. 950–62
Fain, T. S. (1980). Self-employed Americans: their number has increased,Monthly Labor Review, 103, pp. 3–8
Fairlie, R. W. (1999). The absence of the African-American owned business: ananalysis of the dynamics of self-employment, Journal of Labour Economics,17, pp. 80–108
(2002). Drug dealing and legitimate self-employment, Journal of Labor Eco-nomics, 20, 538–67
Fairlie, R. W. and B. D. Meyer (1996). Ethnic and racial self-employment: differ-ences and possible explanations, Journal of Human Resources, 31, pp. 757–93
(2000). Trends in self-employment among white and black men during thetwentieth century, Journal of Human Resources, 35, pp. 643–69
Fan, W. and M. J. White (2002). Personal bankruptcy and the level of en-trepreneurial activity, NBER Working Paper, 9340, National Bureau of Eco-nomic Research
Farber, H. S. (1999). Alternative and part-time employment arrangements as aresponse to job loss, Journal of Labour Economics, 17, pp. S142–S169
Fazzari, S., R. Hubbard and B. Petersen (1988). Financing constraints and cor-porate investment, Brookings Papers on Economic Activity, 2, pp. 141–95
Federal Reserve System (1958). Financing Small Business. Report to the Committeesfor Banking and Currency and the Select Committees on Small Business, USCongress, Washington, DC, US Government Printing Office
Felstead, A. (1992). Franchising, self-employment and the ‘enterprise culture’: aUK perspective, in P. Leighton and A. Felstead (eds.), The New Entrepreneurs:Self-Employment and Small Business in Europe, London, Kogan Page, pp. 237–65
Ferber, M. A. and J. Waldfogel (1998). The long-term consequences of nontra-ditional employment, Monthly Labor Review, 121, pp. 3–12
Fielden, S. L., M. J. Davidson and P. J. Makin (2000). Barriers encounteredduring micro and small business start-up in North West England, Journal ofSmall Business and Enterprise Development, 7, pp. 295–304
Flota, C. and M. T. Mora (2001). The earnings of self-employed Mexican-Americans along the US–Mexico border, Annals of Regional Science, 35,483–99
Folster, S. (2002). Do lower taxes stimulate self-employment?, Small BusinessEconomics, 19, pp. 135–45
Foreman-Peck, J. (1985). Seedcorn or chaff? New firm formation and theperformance of the inter-war economy, Economic History Review, 38, pp. 402–22

286 References
Form, W. H. (1985). Divided We Stand: Working Class Stratification in America,Urbana, IL, University of Illinois Press
Foti, A. and M. Vivarelli (1994). An econometric test of the self-employmentmodel: the case of Italy, Small Business Economics, 6, pp. 81–93
Frank, M. Z. (1988). An intertemporal model of industrial exit, Quarterly Journalof Economics, 103, pp. 333–44
Fredland, J. E. and R. D. Little (1981). Self-employed workers: returns to edu-cation and training, Economics of Education Review, 1, pp. 315–37
Freimer, M. and M. J. Gordon (1965). Why bankers ration credit, QuarterlyJournal of Economics, 79, pp. 397–416
Frey, B. S. and M. Benz (2002). Being independent is a great thing: subjec-tive evaluations of self-employment and hierarchy, Institute for EmpiricalResearch in Economics, Working Paper, 135, University of Zurich
Fried, J. and P. Howitt (1980). Credit rationing and implicit contract theory,Journal of Money, Credit, and Banking, 12, pp. 471–87
Friedman, M. (1953). The Methodology of Positive Economics, Chicago, Universityof Chicago Press
Fuchs, V. R. (1982). Self-employment and labour-force participation of oldermales, Journal of Human Resources, 17, pp. 339–57
Fuest, C., B. Huber and S. B. Nielsen (2002). Why is the corporation tax lowerthan the personal tax rate? The role of small firms, Journal of Public Economics,87, pp. 157–74
Fujii, E. T. and C. B. Hawley (1991). Empirical aspects of self-employment,Economics Letters, 36, pp. 323–9
Gale, D. and M. Hellwig (1985). Incentive-compatible debt contracts: the one-period problem, Review of Economic Studies, 52, pp. 647–63
Gale, W. G. (1990a). Collateral, rationing, and government intervention in creditmarkets, in R. Glenn Hubbard (eds.), Asymmetric Information, Corporate Fi-nance, and Investment Chicago, University of Chicago Press, pp. 43–61
(1990b). Federal lending and the market for credit, Journal of Public Economics,42, pp. 177–93
Gaston, R. J. (1989). The scale of informal capital markets, Small Business Eco-nomics, 1, pp. 223–30
Gavron, R., M. Cowling, G. Holtham and A. Westall (1998). The EntrepreneurialSociety, London, IPPR
Gentry, W. M. and R. G. Hubbard (2000). Tax policy and entrepreneurial entry,American Economic Review, 90, pp. 283–87
(2001). Entrepreneurship and household saving, NBER Working Paper, 7894,National Bureau of Economic Research
Georgellis, Y. and H. J. Wall (2000). What makes a region entrepreneurial?Evidence from Britain, Annals of Regional Science, 34, pp. 385–403
Geroski, P. A. (1995). What do we know about entry?, International Journal ofIndustrial Organization, 13, pp. 450–56
Geroski, P. A. and R. Pomroy (1990). Innovation and the evolution of marketstructure, Journal of Industrial Economics, 38, pp. 299–314
Gersovitz, M. (1983). Savings and nutrition at low incomes, Journal of PoliticalEconomy, 91, pp. 841–55
References 287
Ghatak, M. (2000). Screening by the company you keep: joint liability lendingand the peer selection effect, Economic Journal, 110, pp. 601–31
Ghatak, M. and T. W. Guinnane (1999). The economics of lending with jointliability: theory and practice, Journal of Development Economics, 60, pp. 195–228
Gibrat, R. (1931). Les Inegalites Economique, Paris, SileyGifford, S. (1998). The Allocation of Limited Entrepreneurial Attention, Boston,
MA, KluwerGill, A. M. (1988). Choice of employment status and the wages of employees and
the self-employed: some further evidence, Journal of Applied Econometrics, 3,pp. 229–34
Gimeno, J., T. B. Folta, A. C. Cooper and C. Y. Woo (1997). Survival of thefittest? Entrepreneurial human capital and the persistence of underperform-ing firms, Administrative Science Quarterly, 42, pp. 750–83
Gladstone, R. and J. Lane-Lee (1995). The operation of the insolvency system inthe UK. Some implications for entrepreneurialism, Small Business Economics,7, pp. 55–67
Glaeser, E. L., D. Laibson and B. Sacerdote (2000). The economic approach tosocial capital?, NBER Working Paper, 7728, National Bureau of EconomicResearch
Goedhuys, M. and L. Sleuwaegen (2000). Entrepreneurship and growth ofentrepreneurial firms in Cote d’Ivoire, Journal of Development Studies, 36,pp. 122–45
Goldfeld, S. M. (1966). Commercial Bank Behaviour and Economic Activity: AStructural Study of Monetary Policy in the Post War United States, AmsterdamNorth-Holland
Gomez, R. and E. Santor (2001). Membership has its privileges: the effect ofsocial capital and neighbourhood characteristics on the earnings of microfi-nance borrowers, Canadian Journal of Economics, 34, pp. 943–66
Gompers, P. A. and J. Lerner (1998). What drives venture capital fundraising?,Brookings Papers on Economic Activity, pp. 149–92
Goodman, A. and S. Webb (1994). For richer, for poorer: the changing distribu-tion of income in the UK, 1961–91, Fiscal Studies, 15, pp. 29–62
Gordon, R. H. (1998). Can high personal tax rates encourage entrepreneurialactivity?, IMF Staff Papers, 45, pp. 49–80
Gordus, J. P., P. Jarley and L. A. Ferman (1981). Plant Closings and Economic Dis-location, Kalamazoo, MI, W. E. Upjohn Institute for Employment Research
Gray, J. A. and Y. Wu (1995). On equilibrium credit rationing and interest rates,Journal of Macroeconomics, 17, pp. 405–20
Greenwald, B., J. E. Stiglitz and A. Weiss (1984). Informational imperfectionsin the capital market and macroeconomic fluctuations, American EconomicReview, 74, pp. 194–9
Gromb, D. and D. Scharfstein (2002). Entrepreneurship in equilibrium, NBERWorking Paper, 9001, National Bureau of Economic Research
Grossman, G. M. (1984). International trade, foreign investment, and theformation of the entrepreneurial class, American Economic Review, 74,pp. 605–14

288 References
Gruber, J. and J. Poterba (1994). Tax incentives and the decision to purchasehealth insurance: evidence from the self-employed, Quarterly Journal of Eco-nomics, 109, pp. 701–33
Guinnane, T. (1994). A failed institutional transplant: Raiffeisen’s credit co-operatives in Ireland, 1894–1914, Explorations in Economic History, 31,pp. 38–61
Guiso, L. (1998). High-tech firms and credit rationing, Journal of Economic Be-haviour and Organization, 35, pp. 39–59
Haber, S. E., E. J. Lamas and J. Lichtenstein (1987). On their own: the self-employed and others in private business, Monthly Labor Review, 110, pp. 17–23
Hakim, C. (1988). Self-employment in Britain: recent trends and current issues,Work, Employment and Society, 2, pp. 421–50
(1989a). New recruits to self-employment in the 1980s, Employment Gazette,97, pp. 286–97
(1989b). Workforce restructuring, social insurance coverage and the blackeconomy, Journal of Social Policy, 18, pp. 471–503
Hall, B. H. (1987). The relationship between firm size and firm growth in theUS manufacturing sector, Journal of Industrial Economics, 35, pp. 583–606
Hall, G. (1992). Reasons for insolvency amongst small firms – a review and freshevidence, Small Business Economics, 4, pp. 237–50
Hamermesh, D. S. (1993). Labour Demand, Princeton, Princeton UniversityPress
Hamilton, B. H. (2000). Does entrepreneurship pay? An empirical analysis of thereturns to self-employment, Journal of Political Economy, 108, pp. 604–31
Hamilton, R. T. (1989). Unemployment and business formation rates: reconcil-ing time series and cross-section evidence, Environment and Planning C, 21,pp. 249–55
Harhoff, D. and T. Korting (1998). Lending relationships in Germany – empiricalevidence from survey data, Journal of Banking and Finance, 22, pp. 1317–53
Harper, D. A. (1996). Entrepreneurship and the Market Process: An Enquiry into theGrowth of Knowledge, London, Routledge
Harris, J. R. and M. P. Todaro (1970). Migration, unemployment and develop-ment: a two-sector analysis, American Economic Review, 60, pp. 126–42
Harris, R. I. D. and R. Sollis (2003). Applied Time-Series Modelling and Forecasting,Chichester, John Wiley
Harrison, R. T. and M. Hart (1983). Factors influencing new business formation:a case study of Northern Ireland, Environment and Planning, 15, pp. 1395–1412
Hart, O. (1995). Firms, Contracts and Financial Structure, Oxford, ClarendonPress
Hart, O. and J. Moore (1994). A theory of debt based on inalienability of humancapital, Quarterly Journal of Economics, 109, pp. 841–79
(1998). Default and renegotiation: a dynamic model of debt, Quarterly Journalof Economics, 113, pp. 1–26
Hart, P. E. and N. Oulton (1996). Growth and size of firms, Economic Journal,106, pp. 1242–52

References 289
Hart, P. E. and P. E. Prais (1956). The analysis of business concentration: astatistical approach, Journal of the Royal Statistical Society, 119, pp. 150–91
Harvey, M. (1995). Towards the insecurity society: the tax trap of self-employment, London, The Institute of Employment Rights
Hawley, F. B. (1907). Enterprise and the Productive Process, New York, PutnamHeaden, A. E. (1990). Wage returns to ownership, and fee responses to physician
supply, Review of Economics and Statistics, 72, pp. 30–7Hebert, R. F. and A. N. Link (1988). The Entrepreneur – Mainstream Views and
Radical Critiques, 2nd edn., New York, PraegerHeckman, J. J. (1979). Sample selection bias as a specification error, Econometrica,
47, pp. 475–92Hellmann, T. and M. Puri (2000). The interaction between product market and
financing strategy: the role of venture capital, Review of Financial Studies, 13,pp. 959–84
(2002). Venture capital and the professionalisation of start-ups: empirical evi-dence, Journal of Finance, 57, pp. 169–97
Hellmann, T. and J. Stiglitz (2000). Credit and equity rationing in markets withadverse selection, European Economic Review, 44, pp. 281–304
Hellwig, M. (1987). Some recent developments in the theory of competitivemarkets with adverse selection, European Economic Review, 31, pp. 319–25
Highfield, R. and R. Smiley (1987). New business starts and economic activity:an empirical investigation, International Journal of Industrial Organization, 5,pp. 51–66
Hillier, B. (1998). The borrower’s curse: comment, Economic Journal, 108,pp. 1772–74
Hillier, B. and M. V. Ibrahimo (1992). The performance of credit markets un-der asymmetric information about projects means and variances, Journal ofEconomic Studies, 19, pp. 3–17
(1993). Asymmetric information and models of credit rationing, Bulletin ofEconomic Research, 45, pp. 271–304
Hillier, B. and T. Worrall (1994). The welfare implications of costly monitoringin the credit market, Economic Journal, 104, pp. 350–62
HMSO (1971). Report on the Committee of Inquiry on Small Firms (Bolton Report),Cmnd 4811, London, HMSO
(1979). Interim Report on the Financing of Small Firms (Wilson Report), Cmnd7503, London, HMSO
(1991). Constraints on the Growth of Small Firms, London, HMSOHodgman, D. (1960). Credit risk and credit rationing, Quarterly Journal of Eco-
nomics, 74, pp. 258–78Holmes, T. J. and J. A. Schmitz (1990). A theory of entrepreneurship and its
application to the study of business transfers, Journal of Political Economy,98, pp. 265–94
(1996). Managerial tenure, business age, and small business turnover, Journalof Labour Economics, 14, pp. 79–99
Holtz-Eakin, D. (2000). Public policy toward entrepreneurship, Small BusinessEconomics, 15, pp. 283–91

290 References
Holtz-Eakin, D., D. Joulfaian and H. S. Rosen (1994a). Entrepreneurial decisionsand liquidity constraints, Rand Journal of Economics, 25, pp. 334–47
(1994b). Sticking it out: entrepreneurial survival and liquidity constraints, Jour-nal of Political Economy, 102, pp. 53–75
Holtz-Eakin, D., J. Penrod and H. S. Rosen (1996). Health insurance and thesupply of entrepreneurs, Journal of Public Economics, 62, pp. 209–35
Holtz-Eakin, D., H. S. Rosen and R. Weathers (2000). Horatio Alger meets themobility tables, Small Business Economics, 14, pp. 243–74
Honig, M. and G. Hanoch (1985). Partial retirement as a separate mode ofretirement behaviour, Journal of Human Resources, 20, pp. 21–46
Horvitz, P. M. (1984). Problems in the financing of small business: introductionand summary, in P. M. Horvitz and R. R. Pettit (eds.), Small Business Finance:Sources of Financing for Small Business, Part B Greenwich, CT, JAI Press,pp. 3–18
House, W. J., G. K. Ikiara and D. McCormick (1993). Urban self-employmentin Kenya: panacea or viable strategy?, World Development, 21, pp. 1205–23
Hout, M. and H. S. Rosen (2000). Self-employment, family background, andrace, Journal of Human Resources, 35, pp. 670–92
Hubbard, R. G. (1998). Capital-market imperfections and investment, Journalof Economic Literature, 36, pp. 193–225
Hudson, J. (1987a). Company births in Great Britain and the institutional envi-ronment, International Small Business Journal, 6, pp. 57–69
(1987b). The age, regional and industrial structure of company liquidations,Journal of Banking, Finance and Accounting, 14, pp. 199–213
(1989). The birth and death of firms, Quarterly Review of Economics and Busi-ness, 29, pp. 68–86
Hudson, J. and K. Cuthbertson (1993). The determinants of bankruptcies in theUK: 1971–1988, Manchester School, 61, pp. 65–81
Hughes, A. (1992). The problems of finance for smaller businesses, inN. Dimsdale and M. Prevezer (eds.), Capital Markets and Company Success,Oxford, Oxford University Press
Hundley, G. (2001a). Why women earn less than men in self-employment, Jour-nal of Labour Research, 22, pp. 817–29
(2001b). Why and when are the self-employed more satisfied with their work?,Industrial Relations, 40, pp. 293–317
Huppi, M. and G. Feder (1990). The role of groups and credit co-operatives inrural lending, The World Bank Research Observer, 5, pp. 187–204
Iams, H. M. (1987). Jobs of persons working after receiving retired worker ben-efits, Social Security Bulletin, 50, pp. 4–19
Ijiri, Y. and H. A. Simon (1977). Skew Distributions and the Sizes of Business Firms,Amsterdam, North-Holland
Innes, R. (1991). Investment and government intervention in credit markets whenthere is asymmetric information, Journal of Public Economics, 46, pp. 347–81
(1992). Adverse selection, investment, and profit taxation, European EconomicReview, 36, pp. 1427–52
(1993). Financial contracting under risk neutrality, limited liability and ex anteasymmetric information, Economica, 60, pp. 27–40

References 291
Iyigun, M. F. and A. L. Owen (1999). Entrepreneurs, professionals and growth,Journal of Economic Growth, 4, pp. 213–32
Jaffee, D. and F. Modigliani (1969). A theory and test of credit rationing, AmericanEconomic Review, 59, pp. 850–72
Jaffee, D. and T. Russell (1976). Imperfect information, uncertainty, and creditrationing, Quarterly Journal of Economics, 90, pp. 651–66
Jaffee, D. and J. E. Stiglitz (1990). Credit rationing, in B. M. Friedman andF. H. Hahn (eds.), The Handbook of Monetary Economics, II, Amsterdam,North-Holland, pp. 838–88
Jain, B. and O. Kini (1995). Venture capital participation and the post-issueoperating performance of IPO firms, Managerial and Decision Economics, 16,pp. 593–606
Jefferson, P. N.(1997). Unemployment and financial constraints faced by smallfirms, Economic Inquiry, 35, pp. 108–19
Jenkins, S. P. (1995). Accounting for income inequality trends: decompositionanalyses for the UK, 1971–1986, Economica, 62, pp. 29–63
Johansson, E. (2000). Self-employment and liquidity constraints: evidence fromFinland, Scandinavian Journal of Economics, 102, pp. 123–34
Johnson, D. G. (1954). The functional distribution of income in the UnitedStates, 1950–1952, Review of Economics and Statistics, 36, pp. 175–82
Johnson, P. (1981). Unemployment and self-employment: a survey, IndustrialRelations Journal, 12, pp. 5–15
Johnson, P. and S. Parker (1994). The interrelationships between births anddeaths, Small Business Economics, 6, pp. 283–90
(1996). Spatial variations in the determinants and effects of firm births anddeaths, Regional Studies, 30, pp. 679–88
Johnson, P. and J. Rodger (1983). From redundancy to self-employment, Em-ployment Gazette, 91, pp. 260–64
Jones, T., D. McEvoy and G. Barrett (1993). Labour intensive practices in theethnic minority firm, in J. Atkinson and D. Storey (eds.), Employment, TheSmall Firm and the Labour Market, London, Routledge, pp. 172–205
(1994). Raising capital for the ethnic minority small firm, in A. Hughesand D. Storey (eds.), Finance and the Small Firm, Routledge, London,pp. 145–81
Joulfaian, D. and M. Rider (1996). Tax evasion in the presence of negative incometax rates, National Tax Journal, 49, pp. 553–70
(1998). Differential taxation and tax evasion by small business, National TaxJournal, 51, pp. 675–87
Jovanovic, B. (1982). Selection and the evolution of industry, Econometrica, 50,pp. 649–70
(1994). Firm formation with heterogeneous management and labour skills,Small Business Economics, 6, pp. 185–91
Jung, Y. H., A. Snow and G. A. Trandel (1994). Tax evasion and the size of theunderground economy, Journal of Public Economics, 54, pp. 391–402
Kalleberg, A. L. and K. T. Leicht (1991). Gender and organisational perfor-mance: determinants of small business survival and success, Academy ofManagement Journal, 34, pp. 136–61

292 References
Kanbur, S. M. (1979). Of risk taking and the personal distribution of income,Journal of Political Economy, 87, pp. 769–97
(1980). A note on risk taking, entrepreneurship, and Schumpeter, History ofPolitical Economy, 12, pp. 489–98
(1981). Risk taking and taxation: an alternative perspective, Journal of PublicEconomics, 15, pp. 163–84
(1982). Entrepreneurial risk taking, inequality and public policy: an applicationof inequality decomposition analysis to the general equilibrium effects ofprogressive taxation, Journal of Political Economy, 90, pp. 1–21
Kangasharju, A. and A. Moisio (1998). Births–deaths nexus of firms: estimatingVAR with panel data, Small Business Economics, 11, pp. 303–13
Kangasharju, A. and S. Pekkala (2002). The role of education in self-employmentsuccess in Finland, Growth and Change, 33, pp. 216–37
Kaplan, S. N. and L. Zingales (1997). Do investment–cash flow sensitivities pro-vide useful measures of financing constraints?, Quarterly Journal of Economics,112, pp. 169–215
Katz, J. A. (1990). Longitudinal analysis of self-employment follow-through, En-trepreneurship and Regional Development, 2, pp. 15–25
Kaufmann, P. J. and R. P. Dant (1998). Franchising and the domain of en-trepreneurship research, Journal of Business Venturing, 14, pp. 5–16
Kaufmann, P. J. and F. Lafontaine (1994). Costs of control: the source of eco-nomic rents for McDonald’s franchisees, Journal of Law and Economics, 37,pp. 417–53
Kawaguchi, D. (2003). Human capital accumulation of salaried and self-employed workers, Labour Economics, 10, pp. 55–71
Keasy, K. and R. Watson (1995). The pricing of small firm bank finance: evidencefrom the UK, Applied Economics Letters, 2, pp. 208–10
Keeble, D., S. Walker and M. Robson (1993). New Firm Formation andSmall Business Growth: Spatial and Temporal Variations and Determinants inthe United Kingdom, Employment Department Research Series, 15, London,HMSO
Keeton, W. R. (1979). Equilibrium Credit Rationing, New York, Garland Publish-ing
Kent, C. A. and F. W. Rushing (1999). Coverage of entrepreneurship in princi-ples of economics textbooks: an update, Journal of Economic Education, 30,pp. 184–8
Kesselman, J. R. (1989). Income tax evasion: an inter-sectoral analysis, Journalof Public Economics, 38, pp. 137–82
Kets de Vries, M. F. R. (1977). The entrepreneurial personality: a person at thecrossroads, Journal of Mathematical Sociology, 14, pp. 34–57
Keuschnigg, C. and S. B. Nielsen (2003). Tax policy, venture capital and en-trepreneurship, Journal of Public Economics, 87, pp. 175–203
Kidd, M. P. (1993). Immigrant wage differentials and the role of self-employmentin Australia, Australian Economic Papers, 32, pp. 92–115
Kihlstrom, R. E. and J. J. Laffont (1979). A general equilibrium entrepreneurialtheory of firm formation based on risk aversion, Journal of Political Economy,87, pp. 719–49

References 293
(1982). A competitive entrepreneurial model of the stock market, in J. McCall(ed.), The Economics of Information and Uncertainty, Chicago, University ofChicago Press
(1983a). Implicit labour contracts and free entry, Quarterly Journal of EconomicsSupplement, 98, pp. 55–105
(1983b). Taxation and risk taking in general equilibrium models with free entry,Journal of Public Economics, 21, pp. 159–81
Kilby, P. (1983). An entrepreneurial problem, American Economic Review, Papersand Proceedings, 73, pp. 107–11
King, R. G. and R. Levine (1993). Finance, entrepreneurship and growth, Journalof Monetary Economics, 32, pp. 513–42
King, S. R. (1986). Monetary transmission: through bank loans or bank liabili-ties?, Journal of Money, Credit, and Banking, 18, pp. 290–303
Kirchhoff, B. A. (1991). Entrepreneurship’s contribution to economics, En-trepreneurship Theory and Practice, 16, pp. 93–112
Kirchhoff, B. A. and P. G. Greene (1998). Understanding the theoretical andempirical content of critiques of US job creation research, Small BusinessEconomics, 10, pp. 153–69
Kirzner, I. (1973). Competition and Entrepreneurship, Chicago, University ofChicago Press
(1985). Discovery and the Capitalist Process, Chicago, University of ChicagoPress
Klepper, S. (1996). Entry, exit, growth and innovation over the product life cycle,American Economic Review, 86, pp. 562–83
Knight, F. H. (1921). Risk, Uncertainty and Profit, New York, Houghton-MifflinKnight, G. and S. McKay (2000). Lifetime experiences of self-employment,
Labour Market Trends, 108, pp. 470–72Knight, K. E. and T. Dorsey (1976). Capital problems in minority business devel-
opment: a critical analysis, American Economic Review, Papers and Proceedings,66, pp. 328–31
Knight, R. M. (1985). The financing of small high-technology firms in Canada,Journal of Small Business and Entrepreneurship, 3, pp. 5–17
Kochar, A. (1997). An empirical investigation of rationing constraints in ru-ral credit markets in India, Journal of Development Economics, 53, pp. 339–71
Konings, J. (1995). Gross job flows and the evolution of size in UK establish-ments, Small Business Economics, 7, pp. 213–20
Kortum, S. and J. Lerner (2000). Assessing the contribution of venture capitalto innovation, Rand Journal of Economics, 31, pp. 674–92
Koskela, E. (1983). Credit rationing and non-price loan terms: a re-examination,Journal of Banking and Finance, 7, pp. 405–16
KPMG (1999). An Evaluation of the Small Firms Loan Guarantee Scheme, London,HMSO
Kravis, I. B. (1959). Relative income shares in fact and theory, American EconomicReview, 49, pp. 917–49
Kugler, P. (1987). Credit rationing and the adjustment of the loan rate: an em-pirical investigation, Journal of Macroeconomics, 9, pp. 505–25

294 References
Kuhn, P. J. and H. J. Schuetze (2001). Self-employment dynamics and self-employment trends: a study of Canadian men and women, 1982–1998,Canadian Journal of Economics, 34, pp. 760–84
Kuznets, S. (1966). Modern Economic Growth: Rate Structure and Spread, NewHaven, CT, Yale University Press
Laband, D. N. and B. F. Lentz (1983). Like father, like son: toward an economictheory of occupational following, Southern Economic Journal, 50, pp. 474–93
Laferrere, A. and P. McEntee (1995). Self-employment and intergenerationaltransfers of physical and human capital: an empirical analysis of Frenchdata, Economic and Social Review, 27, pp. 43–54
Laffont, J.-J. and T. N’Guessan (2000). Group lending with adverse selection,European Economic Review, 44, pp. 773–84
Lazear, E. P. (2002). Entrepreneurship, NBER Working Paper, 9109, NationalBureau of Economic Research
Lazear, E. P. and R. L. Moore (1984). Incentives, productivity, and labour con-tracts, Quarterly Journal of Economics, 99, pp. 275–96
Le, A. T. (1999). Empirical studies of self-employment, Journal of Economic Sur-veys, 13, pp. 381–416
(2000). The determinants of immigrant self-employment in Australia, Interna-tional Migration Review, 34, pp. 183–214
Lebergott, S. (1964). Factor shares in the long term: some theoretical and sta-tistical aspects, in The behaviour of income shares: selected theoretical andempirical issues, NBER Studies in Income and Wealth, 27, Princeton
Lee, M. A. and M. S. Rendall (2001). Self-employment disadvantage in theworking lives of blacks and females, Population Research and Policy Review,20, pp. 291–320
Lee, R. M. (1985). The entry to self-employment of redundant steelworkers,Industrial Relations Journal, 16, pp. 42–9
Leeth, J. D. and J. A. Scott (1989). The incidence of secured debt – evidencefrom the small business community, Journal of Financial and QuantitativeAnalysis, 24, pp. 379–94
Leff, N. H. (1979). Entrepreneurship and economic development: the problemrevisited, Journal of Economic Literature, 17, pp. 46–64
Leibenstein, H. (1968). Entrepreneurship and development, American EconomicReview, 58, pp. 72–83
Leighton, P. (1982). Employment contracts: a choice of relationships, EmploymentGazette, 90, pp. 433–39
(1983). Employment and self-employment: some problems of law and practice,Employment Gazette, 91, pp. 197–203
Leland, H. E. and D. H. Pyle (1977). Informational asymmetries, financial struc-ture and financial intermediation, Journal of Finance, 32, pp. 371–87
Lentz, B. F. and D. N. Laband (1990). Entrepreneurial success and occupationalinheritance among proprietors, Canadian Journal of Economics, 23, pp. 563–79
Leonard, J. S. (1986). On the size distribution of employment and establishments,NBER Working Paper, 1951, National Bureau of Economic Research
References 295
LeRoy, S. F. and L. D. Singell (1987). Knight on risk and uncertainty, Journal ofPolitical Economy, 95, pp. 394–406
Levenson, A. R. and K. L. Willard (2000). Do firms get the financing they want?Measuring credit rationing experienced by small businesses in the US, SmallBusiness Economics, 14, pp. 83–94
Levy, B. (1993). Obstacles to developing indigenous small and medium enter-prises: an empirical assessment, World Bank Economic Review, 7, pp. 65–83
Lewis, W. A. (1955). The Theory of Economic Growth, London, Allen & UnwinLight, I. (1972). Ethnic Entrepreneurs in America, Berkeley, CA, University of
California Press(1984). Immigrant and ethnic enterprise in North America, Ethnic and Racial
Studies, 7, pp. 195–216Light, I. and E. Bonacich (1988). Immigrant Entrepreneurs: Koreans in Los Angeles
1965–1982, Berkeley, CA, University of California PressLight, I. and C. Rosenstein (1995). Race, Ethnicity and Entrepreneurship in Urban
America, New York, Aldine de GruyterLin, Z., G. Picot and J. Compton (2000). The entry and exit dynamics of self-
employment in Canada, Small Business Economics, 15, pp. 105–25Lindh, T. and H. Ohlsson (1996). Self-employment and windfall gains: evidence
from the Swedish lottery, Economic Journal, 106, pp. 1515–26Link, A. N. and C. Rees (1990). Firm size, university research and the returns
to R&D, Small Business Economics, 2, pp. 25–33Lofstrom, M. (2002). Labour market assimilation and the self-employment deci-
sion of immigrant entrepreneurs, Journal of Population Economics, 15, pp. 83–114
Long, J. E. (1982a). The income tax and self-employment, National Tax Journal,35, pp. 31–42
(1982b). Income taxation and the allocation of market labour, Journal of LabourResearch, 3, pp. 259–76
Lopez, R. (1984). Estimating labour supply and production decisions of self-employed farm producers, European Economic Review, 24, pp. 61–82
Loscocco, K. A. (1997). Work–family linkages among self-employed women andmen, Journal of Vocational Behaviour, 50, pp. 204–26
Loufti, M. F. (1992). An overview of self-employment in Europe: nature, trendsand policy issues, in P. Leighton and A. Felstead (eds.), The New En-trepreneurs: Self-Employment and Small Business in Europe, London, KoganPage, pp. 41–68
Lucas, R. E. (1978). On the size distribution of business firms, Bell Journal ofEconomics, 9, pp. 508–23
Luthans, F., A. Stajkovic and E. Ibrayeva (2000). Environmental and psychologi-cal challenges facing entrepreneurial development in transitional economies,Journal of World Business, 35, pp. 95–100
Macafee, K. (1982). A glimpse of the hidden economy in the national accountsof the United Kingdom, in V. Tanzi, (ed.), The Underground Economy inthe United States and Abroad, Lexington, MA, Lexington Books, pp. 147–61

296 References
MacDonald R. and F. Coffield (1991). Risky Business? Youth and the EnterpriseCulture, London, Falmer Press
MacMillan, I. C. (1986). To really learn about entrepreneurship, let’s study ha-bitual entrepreneurs, Journal of Business Venturing, 1, pp. 241–3
Macpherson, D. A. (1988). Self-employment and married women, EconomicsLetters, 28, pp. 281–4
Maddala, G. S. (1983). Limited-Dependent and Qualitative Variables in Economet-rics, Cambridge, Cambridge University Press
Maddison, A. (1991). Dynamic Forces in Capital Development, Oxford, OxfordUniversity Press
Manove, M. (2000). Entrepreneurs, optimism and the competitive edge, BostonUniversity, Mimeo
Manser, M. E. and G. Picot (2000). The role of self-employment in US andCanadian job growth, Monthly Labor Review, 123, pp. 10–25
Marsh, A., P. Heady and J. Matheson (1981). Labour Mobility in the ConstructionIndustry, London, HMSO
Marshall, A. (1930). Principles of Economics, London, MacmillanMarshall, J. N., N. Alderman, C. Wong and A. Thwaites (1993). The impact
of government-assisted management training and development on smalland medium-sized enterprises in Britain, Environment and Planning C, 11,pp. 331–48
Mason, C. M. and R. T. Harrison (1994). Informal venture capital in the UK,in A. Hughes and D. J. Storey (eds.), Finance and the Small Firm, London,Routledge, pp. 64–111
(2000). The size of the informal venture capital market in the United Kingdom,Small Business Economics, 15, pp. 137–48
Mata, J. (1994). Firm growth during infancy, Small Business Economics, 6, pp. 27–39
Mata, J. and P. Portugal (1994). Life duration of new firms, Journal of IndustrialEconomics, 42, pp. 227–45
Mata, J., P. Portugal and P. Guimaraes (1995). The survival of new plants: start-up conditions and post-entry evolution, International Journal of IndustrialOrganization, 13, pp. 459–81
Mattesini, F. (1990). Screening in the credit market, European Journal of PoliticalEconomy, 6, pp. 1–22
Maxim, P. S. (1992). Immigrants, visible minorities, and self-employment,Demography 29, pp. 181–98
Mayer, A. (1975). The lower middle class as historical problem, Journal of ModernHistory, 47, pp. 409–36
Mazumdar, D. (1981). The Urban Labour Market and Income Distribution – AStudy of Malaysia, New York, Oxford University Press
McClelland, D. C. (1961). The Achieving Society, Princeton, Van NostrandMcKernan, S. M. (2002). The impact of microcredit programs on self-
employment profits: do noncredit program aspects matter?, Review of Eco-nomics and Statistics, 84, pp. 93–115
Meager, N. (1992a). Does unemployment lead to self-employment?, Small Busi-ness Economics, 4, pp. 87–103
References 297
(1992b). The characteristics of the self-employed: some Anglo-German com-parisons, in P. Leighton and A. Felstead (eds.), The New Entrepreneurs:Self-employment and Small Business in Europe, London, Kogan Page, pp. 69–99
(1993). From unemployment to self-employment in the European Commu-nity, in F. Chittenden, et al. (eds.), Small Firms: Recession and Recovery,London, Paul Chapman Publishing, pp. 27–53
(1994). Self-employment schemes for the unemployed in the European Com-munity, in G. Schmid (ed.), Labour Market Institutions in Europe, New York,M. E. Sharpe, pp. 183–242
Meager, N., G. Court and J. Moralee (1994). Self-Employment and the Distributionof Income, Brighton, The Institute for Manpower Studies
(1996). Self-employment and the distribution of income, in J. Hills (ed.), NewInequalities, Cambridge, Cambridge University Press
Meredith, G. G., R. E. Nelson and P. A. Neck (1982). The Practice of Entrepreneur-ship, Geneva, ILO
Metcalf, H., T. Modood and S. Virdee (1996). Asian Self-Employment: The Inter-action of Culture and Economics, London, Policy Studies Institute
Meyer, B. (1990). Why are there so few black entrepreneurs?, NBER WorkingPaper, 3537, National Bureau of Economic Research
Michelacchi, C. (2003). Low returns in R&D due to the lack of entrepreneurialskills, Economic Journal, 113, pp. 207–25
Milde, H. and J. G. Riley (1988). Signaling in credit markets, Quarterly Journalof Economics, 103, pp. 101–29
Miller, R. A. (1984). Job matching and occupational choice, Journal of PoliticalEconomy, 92, pp. 1086–1120
Moore, B. (1994). Financial constraints to the growth and development of smallhigh technology firms, in A. Hughes and D. Storey (eds.), Finance and theSmall Firm, London, Routledge, pp. 112–44
Moore, C. S. and R. E. Mueller (2002). The transition from paid to self-employment in Canada: the importance of push factors, Applied Economics,34, pp. 791–801
Moore, R. L. (1983a). Self-employment and the incidence of the payroll tax,National Tax Journal, 36, pp. 491–501
(1983b). Employer discrimination: evidence from self-employed workers, Re-view of Economics and Statistics, 65, pp. 496–501
Moralee, L. (1998). Self-employment in the 1990s, Labour Market Trends, 106,pp. 121–30
Morduch, J. (1999). The microfinance promise, Journal of Economic Literature,37, pp. 1569–1614
Moresi, S. (1998). Optimal taxation and firm formation: a model of asymmetricinformation, European Economic Review, 42, pp. 1525–51
Morgan, K. (1997). The learning region: institutions, innovation and regionalrenewal, Regional Studies, 31, pp. 491–503
Moskowitz, T. J. and A. Vissing-Jørgensen (2002). The returns to entrepreneurialinvestment: a private equity premium puzzle?, American Economic Review, 92,pp. 745–78

298 References
Myers, S. C. and N. S. Majluf (1984). Corporate financing and investment de-cisions when firms have information that investors do not have, Journal ofFinancial Economics, 13, pp. 187–221
Myrdal, G. (1944). An American Dilemna: The Negro Problem and Modern Democ-racy, New York, Harper
Nafziger, E. W. and D. Terrell (1996). Entrepreneurial human capital andthe long run survival of firms in India, World Development, 24, pp. 689–96
National Economic Research Associates (NERA) (1990). An Evaluation of theLoan Guarantee Scheme, Department of Employment Research Paper, 74,London, HMSO
Nenadic, S. (1990). The life cycle of firms in nineteenth century Britain, inP. Jobert and M. Mors (eds.), The Birth and Death of Companies: An HistoricalPerspective, Lancaster, Parthenon
Nisjen, A. (1988). Self-employment in the Netherlands, International Small Busi-ness Journal, 7, pp. 52–60
Noe, T. H. (1988). Capital structure and signalling game equilibria, Review ofFinancial Studies, 1, pp. 331–55
Norton, W. I. and W. T. Moore (2002). Entrepreneurial risk: have we been askingthe wrong question?, Small Business Economics, 18, pp. 281–7
Nziramasanga, M. and M. Lee (2001). Duration of self-employment in develop-ing countries: evidence from small enterprises in Zimbabwe, Small BusinessEconomics, 17, pp. 239–53
OECD (1986, 1994a). Employment Outlook, Paris, OECD Publications(1994b). Taxation and Small Businesses, Paris, OECD Publications(1998). Fostering Entrepreneurship, Paris, OECD Publications(2000a). The partial renaissance of self-employment, in Employment Outlook,
Paris, OECD Publications(2000b). OECD SME Outlook, Paris, OECD Publications
O’Farrell, P. N. and A. R. Pickles (1989). Entrepreneurial behaviour withinmale work histories: a sector-specific analysis, Environment and Planning,21, pp. 311–31
Oi, W. Y. (1983). Heterogeneous firms and the organisation of production, Eco-nomic Inquiry, 21, pp. 147–71
Olekalns, N. and H. Sibly (1992). Credit rationing, implicit contracts, risk aver-sion and the variability of interest rates, Journal of Macroeconomics, 14,pp. 337–47
Ordover, J. and A. Weiss (1981). Information and the law: evaluating legal re-strictions on competitive contracts, American Economic Review, Papers andProceedings, 71, pp. 399–404
Otani, K. (1996). A human capital approach to entrepreneurial capacity, Eco-nomica, 63, pp. 273–89
Palich, L. E. and D. R. Bagby (1995). Using cognitive theory to explain en-trepreneurial risk-taking: challenging conventional wisdom, Journal of Busi-ness Venturing, 10, pp. 425–38
Parasuraman, S. and C. A. Simmers (2001). Type of employment, work–familyconflict and well-being: a comparative study, Journal of Occupational Be-haviour, 22, pp. 551–68

References 299
Parker, S. C. (1996). A time series model of self-employment under uncertainty,Economica, 63, pp. 459–75
(1997a). The effects of risk on self-employment, Small Business Economics, 9,pp. 515–22
(1997b). The distribution of self-employment income in the United Kingdom,1976–1991, Economic Journal, 107, pp. 455–66
(1999a). The optimal linear taxation of employment and self-employment in-comes, Journal of Public Economics, 73, pp. 107–23
(1999b). The inequality of employment and self-employment incomes: a de-composition analysis for the UK, Review of Income and Wealth, 45, pp. 263–74
(2000). Saving to overcome borrowing constraints: implications for small busi-ness entry and exit, Small Business Economics, 15, pp. 223–32
(2001). Risk, self-employment and differential income taxation, ManchesterSchool, 69, pp. 1–15
(2002a). On the dimensionality and composition of entrepreneurship, BarclaysCentre for Entrepreneurship Discussion Paper, 1, Durham Business School;forthcoming, Academy of Entrepreneurship Journal
(2002b). Do banks ration credit to new enterprises? And should governmentsintervene?, Scottish Journal of Political Economy, 49, pp. 162–95
(2003a). Does tax evasion affect occupational choice?, Oxford Bulletin of Eco-nomics and Statistics, 65, 379–94
(2003b). The distribution of wealth among older self-employed Britons, FiscalStudies, 24, pp. 23–43
(2003c). ‘There’s something about sharing’: using public policy to promoteefficient venture capital investment, Paper presented to the 59th Congressof the International Institute of Public Finance, Prague
(2003d). Asymmetric information, occupational choice and government pol-icy, Economic Journal, forthcoming
Parker, S. C. and M. T. Robson (2000). Explaining international variations inself-employment: evidence from a panel of OECD countries, Working Paper,No. 2008, Department of Economics and Finance, University of Durham
Parker, S. C. and J. Rougier (2001). An econometric analysis of the retirementbehaviour of the self-employed, Paper presented to the 2001 EconometricSociety European Meetings, University of Lausanne
Pavitt, K., M. Robson and J. Townsend (1987). Technological accumulation,diversification and organisation in UK companies, 1945–1983, ManchesterSchool, 35, pp. 81–99
Perez, S. J. (1998). Testing for credit rationing: an application of disequilibriumeconometrics, Journal of Macroeconomics, 20, pp. 721–39
Pestieau, P. and U. M. Possen (1991). Tax evasion and occupational choice,Journal of Public Economics, 45, pp. 107–25
(1992). How do taxes affect occupational choice?, Public Finance, 47, pp. 108–19
Petersen, M. A. and R. G. Rajan (1994). The benefits of lending relationships:evidence from small firm business data, Journal of Finance, 49, pp. 3–37
Pfeiffer, F. and F. Reize (2000). Business start-ups by the unemployed – an econo-metric analysis based on firm data, Labour Economics, 7, pp. 629–63

300 References
Phillips, B. D. and B. A. Kirchhoff (1989). Formation, growth and survival: smallfirm dynamics in the US economy, Small Business Economics, 1, pp. 65–74
Phillips, J. D. (1962). The Self-employed in the United States, Urbana, IL, Universityof Illinois Press
Phillips, P. C. B. (1986). Understanding spurious regressions in econometrics,Journal of Econometrics, 33, pp. 311–40
Pickles, A. R. and P. N. O’Farrell (1987). An analysis of entrepreneurial behaviourfrom male work histories, Regional Studies, 21, pp. 425–44
Piore, M. J. and C. F. Sabel (1984). The Second Industrial Divide: Possibilities forProsperity, New York, Basic Books
Pissarides, C. A. and G. Weber (1989). An expenditure-based estimate of Britain’sblack economy, Journal of Public Economics, 39, pp. 17–32
Pitt, M. M. and S. R. Khandker (1998). The impact of group-based credit pro-grams on poor households in Bangladesh: does the gender of participantsmatter?, Journal of Political Economy, 98, pp. 106, 958–96
Pollert, A. (1988). The ‘flexible firm’: fixation or fact?, Work, Employment andSociety, 2, pp. 281–316
Portes, A. and M. Zhou (1996). Self-employment and the earnings of immigrants,American Sociological Review, 61, pp. 219–30
Poterba, J. M. (1989a). Venture capital and capital gains taxation, in L. H. Sum-mers (ed.), Tax Policy and the Economy, Cambridge, MA, MIT Press, pp. 47–67
(1989b). Capital gains tax policy towards entrepreneurship, National Tax Jour-nal, 42, pp. 375–89
Power, L. and M. Rider (2002). The effect of tax-based savings incentives on theself-employed, Journal of Public Economics, 85, pp. 33–52
Praag, C. M. van (1999). Some classic views on entrepreneurship, De Economist,147, pp. 311–35
Praag, C. M. van and J. S. Cramer (2001). The roots of entrepreneurship andlabor demand: individual ability and low risk aversion, Economica, 68, pp. 45–62
Praag, C. M. van, J. S. Cramer and J. Hartog (2002). Low risk aversion encour-ages the choice for entrepreneurship: an empirical test of a truism, Journalof Economic Behavior and Organization, 48, pp. 29–36
Praag, C. M. van and H. van Ophem (1995). Determinants of willingness andopportunity to start as an entrepreneur, Kyklos, 48, pp. 513–40
Quadrini, V. (1999). The importance of entrepreneurship for wealth concentra-tion and mobility, Review of Income and Wealth, 45, pp. 1–19
Quinn, J. F. (1980). Labour-force participation patterns of older self-employedworkers, Social Security Bulletin, 43, pp. 17–28
Rafiq, M. (1992). Ethnicity and enterprise: a comparison of Muslim and non-Muslim owned Asian businesses in Britain, New Community, 19, pp. 43–60
Rahman, A. (1993). The general replicability of the Grameen Bank model, inA. N. M. Wahid (ed.), The Grameen Bank: Poverty Relief in Bangladesh,Boulder, CO, Westview Press, pp. 209–22
Ray, R. N. (1975). Self-employed Americans in 1973, Monthly Labor Review, 98,pp. 49–54

References 301
Razin, E. and A. Langlois (1996). Metropolitan characteristics and entrepreneur-ship among immigrants and ethnic groups in Canada, International MigrationReview, 30, pp. 703–27
Rees, H. and A. Shah (1986). An empirical analysis of self-employment in theUK, Journal of Applied Econometrics, 1, pp. 95–108
(1994). The characteristics of the self-employed: the supply of labour, inJ. Atkinson and D. J. Storey (eds.), Employment, the Small Firm and the LabourMarket, London, Routledge, pp. 317–27
Reid, G. C. (1991). Staying in business, International Journal of Industrial Orga-nization, 9, pp. 545–56
(1993). Small Business Enterprise: An Economic Analysis, London, Routledge(1999). Capital structure at inception and the short-run performance of micro-
firms, in Z. J. Acs, B. Carlsson and C. Karlsson (eds.), Entrepreneurship, Smalland Medium Sized Enterprises and the Macroeconomy, Cambridge, CambridgeUniversity Press, pp. 186–205
Reid, G. C. and L. R. Jacobsen (1988). The Small Entrepreneurial Firm, DavidHume Institute, Aberdeen, Aberdeen University Press
Repullo, R. and J. Suarez (2000). Entrepreneurial moral hazard and bank mon-itoring: a model of the credit channel, European Economic Review, 44,pp. 1931–50
Reynolds, P. D. (1999). Creative destruction: source or symptom of economicgrowth?, in Z. J. Acs, B. Carlsson and C. Karlsson (eds.), Entrepreneur-ship, Small and Medium Sized Enterprises and the Macroeconomy, Cambridge,Cambridge University Press, 97–136
Reynolds, P. D., D. J. Storey, and P. Westhead (1994). Cross-national com-parisons of the variation in new firm formation rates, Regional Studies, 28,pp. 443–56
Reynolds, P. D. and S. B. White (1997). The Entrepreneurial Process: EconomicGrowth, Men, Women and Minorities, Westport, CT, Quorum Books
Reynolds, P. D. et al. (2001, 2002). Global Entrepreneurship Monitor ExecutiveReports, www.gemconsortium.com
Rhyne, E. H. (1988). Small Business, Banks and SBA Loan Guarantees, New York,Quorum Books
Riley, J. (1979). Testing the educational screening hypothesis, Journal of PoliticalEconomy, 87, pp. S227–S252
(1987). Credit rationing: a further remark, American Economic Review, 77,pp. 224–27
Roberts, E. B. (1991). Entrepreneurs in High Technology, Oxford, Oxford Univer-sity Press
Robinson, P. B. and E. A. Sexton (1994). The effect of education and experienceon self-employment success, Journal of Business Venturing, 9, pp. 141–56
Robson, M. T. (1991). Self-employment and new firm formation, Scottish Journalof Political Economy, 38, pp. 352–68
(1996). Macroeconomic factors in the birth and death of UK firms: evidencefrom quarterly VAT registrations, Manchester School, 64, pp. 170–88
(1997). The relative earnings from self and paid employment: a time seriesanalysis for the UK, Scottish Journal of Political Economy, 44, pp. 502–18

302 References
(1998a). Self-employment in the UK regions, Applied Economics, 30, pp. 313–22
(1998b). The rise in self-employment amongst UK males, Small Business Eco-nomics, 10, pp. 199–212
Robson, M. T. and C. Wren (1999). Marginal and average tax rates and theincentive for self-employment, Southern Economic Journal, 65, pp. 757–73
Rosa, P., S. Carter and D. Hamilton (1996). Gender as a determinant of smallbusiness performance: insights from a British study, Small Business Economics,8, pp. 463–78
Rosen, S. (1981). The economics of superstars, American Economic Review, 71,pp. 845–58
(1997). Austrian and neoclassical economics: any gains from trade?, Journal ofEconomic Perspectives, 11(4), pp. 139–52
Ross, S. A. (1977). The determination of financial structure: the incentive-signalling approach, Bell Journal of Economics, 8, pp. 23–40
Rossi, S. E. (1998). Credit guarantee schemes: the case of Italy, in D. J. Storey(ed.), Small Business: Critical Perspectives of Business and Management, I–IV,London, Routledge, 2000, pp. 693–710
Rothschild, M. and J. E. Stiglitz (1971). Increasing risk: II. Its consequences,Journal of Economic Theory, 3, pp. 66–84
Rotter, J. B. (1982). The Development and Applications of Social Learning Theory:Selected Papers, Praeger, New York
Rubery, J., J. Earnshaw and B. Burchell (1993). New Forms and Patterns of Em-ployment: The Role of Self-Employment in Britain, Baden-Baden, Nomos Ver-lagsgesellschaft
Sanders, J. M. and V. Nee (1996). Immigrant self-employment: the family associal capital and the value of human capital, American Sociological Review,61, pp. 231–49
Sandford, C. (1981). Costs and Benefits of VAT, London, HeinemannSay, J. B. (1828). Cours Complet d’Economie Politique Practique, ParisScase, R. and R. Goffee (1982). The Entrepreneurial Middle Class, London, Croom
HelmSchaffner, J. A. (1993). Rising incomes and the shift from self-employment to
firm-based production, Economics Letters, 41, pp. 435–40Scheffler, R. M. and L. F. Rossiter (1983). Compensation schemes and the
labour supply of dentists, Quarterly Review of Economics and Business, 23,pp. 29–43
Schere, J. C. (1982). Tolerance of ambiguity as a discriminating variable betweenentrepreneurs and managers, Academy of Management Proceedings, pp. 404–8
Scherer, F. M. (1980). Industrial Market Structure and Economic Performance,Chicago, Rand McNally College Publishing
(1991). Changing perspectives on the firm size problem, in Z. J. Acs andD. B. Audretsch (eds.), Innovation and Technological Change, Ann Arbor,University of Michigan Press, pp. 24–38
Scheutze, H. J. (2000). Taxes, economic conditions and recent trends in maleself-employment: a Canada–US comparison, Labour Economics, 7, pp. 507–44

References 303
Schiller, B. R. and P. E. Crewson (1997). Entrepreneurial origins: a longitudinalinquiry, Economic Inquiry, 35, pp. 523–31
Schmidt-Mohr, U. (1997). Rationing versus collateralisation in competitive andmonopolistic credit markets with asymmetric information, European Eco-nomic Review, 41, pp. 1321–42
Schmitz, J. A. (1989). Imitation, entrepreneurship and long-run growth, Journalof Political Economy, 97, pp. 721–39
Schultz, T. P. (1990). Women’s changing participation in the labour force: a worldperspective, Economic Development and Cultural Change, 38, pp. 457–88
Schultz, T. W. (1980). Investment in entrepreneurial ability, Scandinavian Journalof Economics, 82, pp. 437–48
Schumpeter, J. A. (1934). The Theory of Economic Development, Cambridge, MA,Harvard University Press
(1939). Business Cycles, New York, McGraw-Hill(1947). The creative response in economic history, Journal of Economic History,
7, pp. 149–59Segal, U. and A. Spivak (1989). Firm size and optimal growth rates, European
Economic Review, 33, pp. 159–67Selden, J. (1999), Small and medium enterprises: their role in the economy,
Labour Market Trends, 107, pp. 543–50Sexton, D. L. and N. Bowman (1985). The entrepreneur: a capable executive
and more, Journal of Business Venturing, 1, pp. 29–40Shane, S. (1996). Explaining variation in rates of entrepreneurship in the United
States: 1899–1988, Journal of Management, 22, pp. 747–81Shapero, A. (1975). The displaced uncomfortable entrepreneur, Psychology To-
day, pp. 83–8Sheshinski, E. and J. Dreze (1976). Demand fluctuations, capacity utilisation,
and costs, American Economic Review, 66, pp. 731–42Shorrocks, A. F. (1988). Wealth holdings and entrepreneurial activity, in
D. Kessler and A. Masson (eds.), Modelling the Accumulation and Distributionof Wealth, Oxford, Clarendon Press, pp. 241–56
Sillamaa, M.-A. and M. R. Veall (2001). The effect of marginal tax rates ontaxable income: a panel study of the 1988 tax flattening in Canada, Journalof Public Economics, 80, pp. 341–56
Simmons, P. (1989). Bad luck and fixed costs in bankruptcy, Economic Journal,99, pp. 92–107
Simon, H. A. and C. P. Bonini (1958). The size distribution of business firms,American Economic Review, 48, pp. 607–17
Slovin, M B. and M. E. Sushka (1983). A model of the commercial loan rate,Journal of Finance, 38, pp. 1583–96
van der Sluis, J., C. M. van Praag and W. Vijverberg (2003). Entrepreneurshipselection and performance: a meta-analysis of the impact of education inindustrialised countries, University of Amsterdam, Mimeo
Small Business Administration (SBA) (1986, 2001). The State of Small Business,Washington, DC, Office of Advocacy
(1996). White Paper on the Financing of Small Business, Washington, DC, Officeof Advocacy

304 References
(2002a). Small business’s share of economic growth, Research Summary, 211,Washington, DC
(2002b). The influence of R&D expenditures on new firm formation and eco-nomic growth, Research Summary, 222, Washington, DC
Smallbone, D. and F. Lyon (2001). Policy support for new business start-ups: areview, Middlesex University, Mimeo
Smallbone, D. and F. Welter (2001). The distinctiveness of entrepreneurship intransition economies, Small Business Economics, 16, pp. 249–62
Smith, A. (1937). The Wealth of Nations, New York, Random HouseSmith, B. (1983). Limited information, credit rationing, and optimal government
lending policy, American Economic Review, 73, pp. 305–18Smith, B. D. and M. J. Stutzer (1989). Credit rationing and government loan
programs: a welfare analysis, AREUEA Journal, 17, pp. 177–93Smith, S. (1986). Britain’s Shadow Economy, Oxford, Clarendon PressSowell, T. (1981). Markets and Minorities, New York, Basic BooksSpear, R. (1992). The co-operative spirit: some UK evidence, in P. Leighton
and A. Felstead (eds.), The New Entrepreneurs: Self-Employment and SmallBusiness in Europe, London, Kogan Page, pp. 325–41
Spilling, O. R. (1996). Regional variation of new firm formation: the Norwegiancase, Entrepreneurship and Regional Development, 8, pp. 217–43
Staber, U. and D. Bogenhold (1993). Self-employment: a study of seventeenOECD countries, Industrial Relations Journal, 24, pp. 126–37
Stanworth, J., D. Purdy, S. Price and N. Zafiris (1998). Franchise versus conven-tional small business failure rates in the US and UK: more similarities thandifferences, International Small Business Journal, 16, pp. 56–69
Steinmetz, G. and E. O. Wright (1989). The fall and rise of the petty bourgeoisie:changing patterns of self-employment in the postwar United States, AmericanJournal of Sociology, 94, pp. 973–1018
Stiglitz, J. (1970). The effects of income, wealth and capital gains taxation on risktaking, Quarterly Journal of Economics, 83, pp. 263–83
(1990). Peer monitoring and credit markets, World Bank Economic Review, 4,pp. 351–66
Stiglitz, J. and A. Weiss (1981). Credit rationing in markets with imperfect infor-mation, American Economic Review, 71, pp. 393–410
(1983). Incentive effects of terminations: applications to the credit and labormarkets, American Economic Review, 73, pp. 912–27
(1987). Credit rationing: reply, American Economic Review, 77, pp. 228–31(1992). Asymmetric information in credit markets and its implications for
macro-economics, Oxford Economic Papers, 44, pp. 694–724Stoll, H. R. (1984). Small firms’ access to public equity financing, in P. M.
Horvitz and R. R. Pettit (eds.), Small Business Finance: Sources of Financingfor Small Business, Part A Greenwich, CT, JAI Press, pp. 177–238
Storey, D. J. (1982). Entrepreneurship and the New Firm, London, Croom Helm(1991). The birth of new firms – does unemployment matter? A review of the
evidence, Small Business Economics, 3, pp. 167–78(1994a). Understanding the Small Business Sector, London, Routledge(1994b). The role of legal status in influencing bank financing and new firm
growth, Applied Economics, 26, pp. 129–36
References 305
(ed.) (2000). Small Business: Critical Perspectives on Business and Management,I–IV, London, Routledge
Storey, D. J. and A. M. Jones (1987). New firm formation – a labour marketapproach to industrial entry, Scottish Journal of Political Economy, 34, pp. 37–51
Storey, D. J., K. Keasey, R. Watson and P. Wynarczyk (1987). The Performance ofSmall Firms, London, Croom Helm
Sumner, D. A. (1981). Wage functions and occupational selection in a rural lessdeveloped country setting, Review of Economics and Statistics, 63, pp. 513–19
Sutton, J. (1997). Gibrat’s legacy, Journal of Economic Literature, 35, pp. 40–59Tassel, E. van (1999). Group lending under asymmetric information, Journal of
Development Economics, 60, pp. 3–25Taylor, M. P. (1996). Earnings, independence or unemployment: why become
self-employed?, Oxford Bulletin of Economics and Statistics, 58, pp. 253–66(1999). Survival of the fittest? An analysis of self-employment duration in
Britain, Economic Journal, 109, pp. C140–C155(2001). Self-employment and windfall gains in Britain: evidence from panel
data, Economica, 68, pp. 539–65Teilhet-Waldorf, S. and W. H. Waldorf (1983). Earnings of self-employed in an
informal sector: a case study of Bangkok, Economic Development and CulturalChange, 31, pp. 587–607
Tether, B. S., I. J. Smith and A. T. Thwaites (1997). Smaller enterprises andinnovation in the UK: the SPRU Innovations Database revisited, ResearchPolicy 2, pp. 19–32
Thakor, A. (1996). Capital requirements, monetary policy, and aggregate banklending: theory and empirical evidence, Journal of Finance, 51, pp. 279–324
Thakor, A. and R. Calloway (1983). Costly information production equilibriain the bank credit market with applications to credit rationing, Journal ofFinancial and Quantitative Analysis, 18, pp. 229–56
Thornton, J. (1994). Estimating the choice behaviour of self-employed businessproprietors: an application to dairy farmers, Southern Economic Journal, 60,pp. 579–95
(1998). The labour supply behaviour of self-employed solo practice physicians,Applied Economics, 30, pp. 85–94
Timmons, J. A. (1976). Characteristics and role demands of entrepreneurship,American Journal of Small Business, 3, pp. 5–17
Townsend, R. (1979). Optimal contracts and competitive markets with costlystate verification, Journal of Economic Theory, 21, pp. 417–25
Tucker, I. B. (1988). Entrepreneurs and public-sector employees: the role ofachievement motivation and risk in occupational choice, Journal of EconomicEducation, 19, pp. 259–68
(1990). Employer seniority discrimination: evidence from entrepreneurial oc-cupational choice, Economics Letters, 32, pp. 85–89
Tyson, L. d’Andrea, T. Petrin and H. Rogers (1994). Promoting entrepreneurshipin Eastern Europe, Small Business Economics, 6, pp. 165–84
Uusitalo, R. (2001). Homo entreprenaurus?, Applied Economics, 33, pp. 1631–38Variyam, J. N. and D. S. Kraybill (1992). Empirical evidence on determinants of
firm growth, Economics Letters, 38, pp. 31–6

306 References
Vijverberg, W. P. M. (1986). Consistent estimates of the wage equation when indi-viduals choose among income-earning activities, Southern Economic Journal,52, pp. 1028–42
Wadhwani, S. B. (1986). Inflation, bankruptcy, default premia and the stockmarket, Economic Journal, 96, pp. 120–38
Wagner, J. (1995). Firm size and job creation in Germany, Small Business Eco-nomics, 7, pp. 469–74
Wales, T. J. (1973). Estimation of a labour supply curve for self-employed businessproprietors, International Economic Review, 14, pp. 69–80
Watkins, J. M. and D. S. Watkins (1984). The female entrepreneur: her back-ground and determinants of business choice – some British data, Frontiers ofEntrepreneurship Research, Wellesley, MA, Babson College
Watson, H. (1984). Credit markets and borrower effort, Southern Economic Jour-nal, 50, pp. 802–13
(1985). Tax evasion and labour markets, Journal of Public Economics, 27,pp. 231–46
Watson, R. (1990). Employment change, profits and directors’ remuneration insmall and closely-held UK companies, Scottish Journal of Political Economy,37, pp. 259–74
Webb, D. C. (1991). Long-term financial contracts can mitigate the adverseselection problem in project financing, International Economic Review, 32,pp. 305–20
Weber, M. (1930). The Protestant Ethic and the Spirit of Capitalism, New York,Scribner
Wellington, A. J. (2001). Health insurance coverage and entrepreneurship, Con-temporary Economic Policy, 19, pp. 465–78
Wennekers, S. and R. Thurik (1999). Linking entrepreneurship and economicgrowth, Small Business Economics, 13, pp. 27–55
Wenner, M. D. (1995). Group credit: a means to improve information trans-fer and loan repayment performance, Journal of Development Studies, 32,pp. 263–81
Westhead, P. and M. Cowling (1995). Employment change in independentowner-managed high-technology firms in Great Britain, Small Business Eco-nomics, 7, pp. 111–40
Wette, H. (1983). Collateral in credit rationing in markets with imperfect infor-mation: note, American Economic Review, 73, pp. 442–5
Wetzel, W. E. (1987). The informal venture capital market: aspects of scale andmarket efficiency, Journal of Business Venturing, 2, pp. 299–313
White, L. J. (1982). The determinants of the relative importance of small busi-ness, Review of Economics and Statistics, 64, pp. 42–9
(1984). The role of small business in the US economy, in P. M. Horvitz andR. R. Pettit (eds.), Small Business Finance: Sources of Financing for SmallBusiness, Part A, Greenwich, CT, JAI Press, pp. 19–49
Whittington, R. C. (1984). Regional bias in new firm formation in the UK,Regional Studies, 18, pp. 253–56
Williams, D. L. (2001). Why do entrepreneurs become franchisees? An empiricalanalysis of organisational choice, Journal of Business Venturing, 14, pp. 103–24
References 307
Williams, D. R. (2000). Consequences of self-employment for women and menin the United States, Labour Economics, 7, pp. 665–87
Williamson, O. E. (1985). The Economic Institutions of Capitalism, New York, FreePress
Williamson, S. D. (1986). Costly monitoring, financial intermediation and equi-librium credit rationing, Journal of Monetary Economics, 18, pp. 159–79
(1987). Costly monitoring, loan contracts and equilibrium credit rationing,Quarterly Journal of Economics, 102, pp. 135–45
Wit, G. de (1993). Models of self-employment in a competitive market, Journalof Economic Surveys, 7, pp. 367–97
Wit, G. de and van Winden, F. (1989). An empirical analysis of self-employmentin the Netherlands, Small Business Economics, 1, pp. 263–72
(1990). An empirical analysis of self-employment in the Netherlands, EconomicsLetters, 32, pp. 97–100
(1991). An M-sector, N-group behavioural model of self-employment, SmallBusiness Economics, 3, pp. 49–66
Wolpin, K. I. (1977). Education and screening, American Economic Review, 67,pp. 949–58
Wren, C. (1998). Subsidies for job creation: is small best?, Small Business Eco-nomics, 10, pp. 273–81
Wydick, B. (1999). Can social cohesion be harnessed to repair market failures?Evidence from group lending in Guatemala, Economic Journal, 109, pp. 463–75
Xu, B. (1998). A re-estimation of the Evans–Jovanovic entrepreneurial choicemodel, Economics Letters, 58, pp. 91–5
(2000). The welfare implications of costly monitoring in the credit market: anote, Economic Journal, 110, pp. 576–80
Yamawaki, H. (1990). The effects of business conditions on net entry: evidencefrom Japan, in P. A. Geroski and J. Schwalbach (eds.), Entry and MarketContestability: An International Comparison, Oxford, Basil Blackwell
Yoon, I. J. (1991). The changing significance of ethnic and class resources inimmigrant business, International Migration Review, 25, pp. 303–31
Yuengert, A. M. (1995). Testing hypotheses of immigrant self-employment, Jour-nal of Human Resources, 30, pp. 194–204

Author index
Acs, Z. J. 92–93, 97–98, 104–105,111–112, 171, 186, 189, 195, 206,208, 216–217, 230
Agarwal, R. 224, 231Aldrich, H. 118, 120, 121Allen, F. 160Altman, E. 230Amit, R. 21, 76, 79, 109Appelbaum, E. 222, 230Arabsheibani, G. 263Armehdariz de Aghion, B. 162, 168Armington, C. 195Aronson, R. L. 17, 32, 71, 79, 93–94, 119,
121, 124, 127–129, 195–197, 207,208, 258
Atrostic, B. K. 202Audretsch, D. B. 33, 92–93, 97–98,
104–105, 107, 111–112, 195, 206,209, 216–217, 224–225, 229, 230,231
Bagby, D. R. 264Baker, P. 251Baldwin, J. 196Baltensperger, E. 140–141Banerjee, A. V. 90–91, 100, 110, 169, 194Bank of England 116, 137, 163, 172Bannock, G. 105, 216Barkham, R. 215, 230Barreto, H. 42, 65, 230,Barrett, G. 116, 121, 207Barro, R. J. 141, 142Barzel, Y. 225Basu, A. 166Bates, T. 104, 107–108, 116, 118,
120–124, 130, 132–133, 165–166,172, 182–183, 189, 207, 215,222–223, 225, 230, 238, 245, 262
Baumol, W. J. 12, 42–43, 259, 263Bearse, P. J. 120Bechhofer, F. 194Becker, E. 98, 121, 124, 127, 209
Beesley, M. E. 231–232Belke, A. 172Bell, C. 178Bendick, M. 254–255, 257, 264Bennett, R. J. 257Benz, M. 261Berger, A. N. 153, 162–163, 187–188, 190Bernanke, B. 158Bernardo, A. E. 263Bernhardt, D. 142Bernhardt, I. 104, 107–109, 189,
198–199, 237–239Bernhardt, T. 214Bernheim, B. D. 184Bertrand, T. 208Besanko, D. 141–142, 150, 154–155, 162Besley, T. 118, 169Bester, H. 153–154, 162–163Biais, B. 171Binks, M. 95, 111, 228–229Birch, D.L. 194–196, 206Black, J. 111–112, 163, 183–184, 189,
242, 245Blackburn, R. A. 165, 206, 254Blanchflower, D. G. 32, 71, 78, 80, 95–97,
104–110, 116, 179, 182, 184, 189,212, 216, 218–219
Bland, R. 20Blau, D. M. 22, 30, 91, 103–105, 107,
132, 201, 207–208, 214, 224, 252,264
Blinder, A. S. 160Blundell, R. 198–200Boadway, R. N. 161, 245Boden, R. J. 67, 72, 107, 125–126, 133,
222, 231, 252Bogenhold, D. 98, 111Bolton Report 138Bonacich, E. 118, 120Bond, E. W. 224Bonini, C. P. 214Boot, A. W. A. 153, 162–163
308

Author index 309
Bopaiah, C. 171, 178Borjas, G. J. 75, 107–109, 114–115,
118–119, 209, 214, 121, 123, 130,131–132
Borooah, V. I. 107, 108, 122, 132, 245Boswell, J. 215Bosworth, B. P. 240Bottazzi, L. 171–172Boulier, B. L. 207Bovaird, C. 171Bowlin, O. D. 177Bowman, N. 250Boyd, D. P. 254–255Boyd, R. L. 103, 107, 108, 112, 121, 122Bracoud, F. 175Bradford, W. D. 116, 120, 172Brearley, S. 228–229, 250Bregger, J. E. 31, 32, 193, 197, 255Brock, W. A. 34–35, 57, 67, 107–110,
112, 130, 213–215, 219, 229, 230,231, 258–260, 265
Brockhaus, R. H. 76, 83Bronars, S. G. 107–109, 114–115,
118–119, 121, 123, 130, 209, 214Brown, C. 197, 206Brown, S. 20Browne, F. X. 189Bruce, D. 104, 107–108, 110, 125, 183,
189, 204, 252, 264Bruderl, J. 75, 108, 133, 224, 231Bruno, A. V. 230Brusch, C. G. 128Bruyat, C. A. 141Burchell, B. 212Burke, A. E. 108–109, 194, 214, 256,
260Burrows, R. 110, 194, 197, 212,
248–249
Calloway, R. 143Calvo, G. 88, 92, 224–225, 231, 239Camerer, C. 201, 262Campbell, M. 219Campbell, T. S. 173Cantillon, R. 215Caputo, R. K. 125, 133Carlsson, B. 88, 171Carr, D. 107, 125, 133Carrasco, R. 96, 103–105, 107–108, 112,
222, 225Carrington, W. J. 17, 33Carroll, G. R. 72, 104, 110, 257Carroll, R. 194, 216Carron, A. S. 240Carson, C. S. 250
Carter, N. M. 128Carter, S. 128Casey, B. H. 142, 197, 206Casson, M. 166, 216, 229, 257Chamley, C. 153Chan, Y.-S. 153, 162, 164Chell, E. 228–229, 250Chiswick, C.U. 33Cho, Y. 147Christiansen, L.R. 209Clark, K. 17, 34, 68, 75, 104,
107–108, 110, 113, 115, 120, 121,122, 132
Clay, N. 262Clemenz, G. 142, 150, 156, 162Clotfelter, C. T. 250, 263Coate, S. 117, 169Cockburn, I. 195–197Coco, G. 162–163Coffield, F. 109Cohen, W.M. 230Compton, J. 32, 72, 104–105, 107–108,
193, 206, 222–223, 230Connelly, R. 133Cooper, A. C. 215, 219, 223, 230–231,
263Copulsky, W. 256–257Cosh, A. D. 179, 190, 217, 224Court, G. 17, 33–34, 129, 242Covick, O. 188Cowling, M. 96, 104–105, 107–109,
111, 124, 126, 133, 163, 189, 194,215, 216, 219, 222, 231, 238–240,262, 264
Craggs, P. 217Cramer, J. S. 104, 107–108, 194, 264Creedy, J. 107Creigh, S. 108, 197, 206Cressy, R. C. 153, 156, 184, 220,
222–223, 230, 231Crewson, P. E. 104, 107, 252Cromie, S. 258–260, 262Cukierman, A. 141Cullen, J. B. 105, 112, 263Curran, J. 33, 76, 110, 165, 194, 197,
206, 269, 271Cuthbertson, K. 231
da Rin, M. 171–172Daly, M. 181–182, 219Dant, R. P. 177, 257Davidson, M. J. 216Davidsson, P. 196Davis, S. J. 195–197, 230de Aghion, B. A. 167

310 Author index
De Meza, D. 111–112, 142, 147, 150,156–159, 163–164, 173–174,183–184, 189, 231, 242, 245,262–263
Deakins, D. 241Denison, E. F. 33Dennis, W. J. 35, 79, 96, 98, 109Devine, T. J. 91, 104, 118, 124–127, 133,
208–209Diamond, D. 161Dilnot, A. W. 250Dixit, A, 50–52, 66, 209Dixon, R. 176Djankow, S. 270Dolinsky, A. 125, 133Dolton, P. J. 104, 107, 132, 213–214, 236Dorsey, T. 116Dosi, G. 88Dreze, J. 221–222Drinkwater, S. 17, 34, 68, 75, 104,
107–108, 110, 113, 115, 120,121–122, 132
Du Rietz, A. 128Dunkelberg, W. C. 230, 231, 263Dunn, T. 67, 85–86, 104, 107, 189Dunne, P. 231Dunne, T. 206, 230Dutz, M. A. 240
Earle, J. S. 17, 28, 34, 69, 104, 194,261–262
Earnshaw, J. 212Eden, D. 262Edwards, L. N. 108, 125Egan, M. L. 254–255, 257, 264Elkan, W. 122Elliott, B. 194Ericsson, R. 208Evandrou, M. 212Evans, D. S. 26, 31, 33–35, 57, 67, 72–73,
77, 85, 92, 95–98, 104–105, 107–110,112, 122, 124, 130, 133, 173–174,183–184, 189, 226, 228, 231, 239,258–260, 265
Fain, T. S. 33Fairlie, R. W. 34, 52, 67, 84–85, 107–110,
113, 120, 122–124, 130, 132–133,189
Fan, W. 229Farber, H. S. 96, 104Fazzari, S. 183Feder, G. 178Federal Reserve System 138Fehr, R. 172
Felstead, A. 178Ferber, M. A. 209, 241Ferman, L. A. 110Fielden, S. L. 216Field-Hendrey, E. 108, 125Fitz-Roy, F. R. 108, 194, 214, 256, 260Flota, C. 107, 114, 119, 121–122Folster, S. 92, 103–105, 264Foreman-Peck, J. 111Form, W. H. 209, 242–246Foster, N. 172Foti, A. 105, 107, 231Frank, M. Z. 209, 213, 220, 230Fredland, J. E. 22, 34, 76Freeman, R. B. 80, 96, 106Freimer, M. 161Frey, B. S. 261Fried, J. 141, 186Friedman, M. 263Fuchs, V. R. 108, 203–204, 206–207Fuest, C. 177, 215, 230, 263, 271Fujii, E. T. 34, 69, 104, 107–108, 115
Gale, D. 141, 161, 237–239, 241, 262Gale, W. G. 155Gaston, R. J. 178Gavron, R. 271Gentry, W. M. 18, 263Georgellis, Y. 99, 101, 105, 108, 110–112Geroski, P. A. 217, 228, 230Gersovitz, M. 186Gertler, M. 158Ghatak, M. 154, 168, 178Gibrat, R. 213–214Gifford, S. 212, 216, 228–229,Gill, A. M. 34, 69, 104, 107–108, 132Gimeno-Gascon, F. J. 215, 223, 230, 231Gladstone, R. 229Glaeser, E. L. 245Glosten, L. 109, 249–250, 257–258Goedhuys, M. 107, 230Goffee, R. 108–109, 206, 258Goldfeld, S. M. 187Gollier, C. 162, 171Gomez, R. 246Gompers, P. A. 178Goodman, A. 212Gordeon, M. J. 161Gordon, R. H. 105, 112, 263Gordus, J. P. 110Gray, J. A. 142Greene, P. G. 195, 207Greenwald, B. 173, 175Gromb, D. 206Grossman, G. M. 227

Author index 311
Gruber, J. 108Guimaraes, P. 225Guinnane, T. W. 154, 169, 178
Haber, S. E. 127, 188, 209Haggerty, A. 206Hakim, C. 31, 33, 80, 95, 125, 206–207,
216, 218–220Hall, B. H. 196, 230Hall, G. 231Haltiwanger, J. C. 195–197, 230Hamermesh, D. S. 56Hamilton, B. H. 72, 97, 104, 108,
110–111, 122, 186, 209, 214,258–260
Hamilton, D. 128Hamilton, J. 197, 206Hamilton, R. T. 231–232Hanoch, G. 203Hanvey, E. 215, 230Harhoff, D. 162, 184Harper, D. A. 185Harris, J. E. 205Harris, R. I. D. 215Harrison, R. T. 111, 172, 178Hart, M. 107, 108, 111, 122, 132, 215,
230, 245Hart, O. 153Hart, P. E. 196, 214, 230, 231Harvey, M. 31, 110, 251, 253Hawley, C. B. 104, 107–108, 115, 214,
237Haworth, C. 228–229, 427Headen, A. E. 15–16, 35Heady, P. 206Hebert, R. F. 216, 228–229Heckman, J. J. 21–22Hellmann, T. 172, 174–175Hellwig, M. 141, 161, 155Henrekson, M. 128Highfield, R. 111–112, 227Hillier, B. 149, 156, 158–161, 175Hodgman, D. 161Holmes, T. J. 212, 222, 224, 231Holtz-Eakin, D. 19, 67, 72, 85–86, 104,
107–108, 129, 182–183, 189, 204,250, 264 223, 228, 231, 242, 246,271
Honig, M. 203Horvitz, P. M. 177House, W. J. 208Hout, M. 109, 122, 132, 267–268Howitt, P. 141, 186Hubbard, R. G. 183, 189Huber, B. 177, 193, 230, 263, 271
Hudson, J. 111–112, 224–225, 230–231Hughes, A. 178–179, 190, 217, 224, 231Hundley, G. 128, 260Huppi, M. 178
Iams, H. M. 204–205, 207Ibrahimo, M. V. 156, 158–161Ibrayeva, E. 208–215Idiara, G. K. 208Ijiri, Y. 214Innes, R. 154, 173, 239Iyigun, M. F. 110
Jacobsen, L. R. 228, 231, 257Jaffee, D. 140–142, 150, 160, 183Jain, B. 172Jarley, P. 110Jefferson, P. N. 193Jeffreys, D. 111–112, 183–184, 189Jenkins, S. P. 193, 213Jennings, A. 95, 111Johansson, E. 108, 189Johnson, D. G. 209Johnson, P. S. 107, 110–111, 227, 230,
232Jones, A. M. 97, 105Jones, P. 217Jones, T. 116, 121, 166, 207Joulfaian, D. 107–108, 182, 189, 223, 231,
245, 263Jovanovic, B. 21, 31, 33–34, 58, 66–67,
72, 107, 179, 180–181, 208–215, 218,220, 223, 227
Julien, P. A. 248–249Jung, Y. H. 247–248
Kalleberg, A. L. 133, 230Kanatos, G. 153, 162Kanbur, S. M. 216, 219, 222, 227–229,
243–245, 248, 263Kangasharju, A. 215, 223, 231, 232Kaplan, S. N. 183Karlsson, C. 171Katz, E. 222Katz, J. A. 31, 228Kaufmann, P. J. 79, 119Kawaguchi, D. 214Keasy, K. 163Keeble, D. 243, 231Keeton, W. R. 139, 141Kent, C. A. 142Kesselman, J. R. 250, 263Kets de Vries, M. F. R. 77–78Keuschnigg, C. 177Khandker, S. R. 169

312 Author index
Kidd, M. P. 107, 188–189, 214Kihlstrom, R. E. 184, 209, 226, 231–232,
244–245, 253, 263, 264–265Kilby, P. 122King, R. G. 218King, S. R. 187Kini, O. 172Kirchhoff, B. A. 173, 195, 207, 218, 219,
230Kirzner, I. 40, 42Klepper, S. 230Knight, F. 40, 42, 60–61, 65–66, 231Knight, G. 79, 96, 108, 185Knight, K. E. 116Knight, R. M. 166Kochar, A. 178–179Konings, J. 196Korting, T. 162, 184Kortum, S. 172Koskela, E. 141Kravis, I. B. 209Kraybill, D. S. 215, 230Kugler, P. 189Kuhn, P. J. 96, 111, 193, 197, 207Kuznets, S. 104, 199, 207, 271
Laband, D. N. 104, 110, 197, 267Labour Force Survey (LFS) 123–124, 260Laferrere, A. 104, 107, 108–110, 112, 189Laffont, J. J. 184, 209, 226, 231–232,
244–245, 253, 263, 264–265Lafontaine, F. 119Laibson, D. 245Lamas, E. J. 33, 127, 246Langlois, A. 121Lazear, E. P. 93, 110, 193, 195, 197, 242Le, A. T. 121, 127, 208, 244–245Lebergott, S. 209Lee, M. A. 126, 230Lee, R. M. 109Leeth, J. D. 162Leff, N. H. 169–170Leibenstein, H. 171, 217Leicht, K. T. 133, 230Leighton, L. S. 26, 35, 67, 72–73, 77, 85,
95–96, 98, 104–105, 107, 109–110,112, 124, 133, 189, 219, 222
Leighton, P. 31, 230Leland, H. E. 163Lentz, B. F. 104, 110, 197, 267Leonard, J. S. 206Lerner, J. 172, 178LeRoy, S. F. 229Leslie, D. 107–108, 132Levenson, A. R. 188–190
Levine, R. 218Levy, B. 179Lewis, W. A. 183–184Lichtenstein, J. 127, 188, 209Light, I. 118, 120, 129–130, 166, 255Lim, C. 230Lin, Z. 32, 72, 104–105, 107–108, 193,
206, 222–223, 230Lindh, T. 104, 109–110, 112, 182, 189,
264Lindmark, L. 196Link, A. N. 216Little, R. D. 22, 34Lofstrom, M. 107, 121–122, 130Long, J. E. 105, 108, 110, 112, 132,
252Lopez, R. 199Loscocco, K. A. 262Loufti, M. F. 93Loury, G. 169Lovalolo, D. 262Lucas, R. E. 54–58, 62, 64, 67, 70, 73,
86–87, 89, 91–92, 208–209, 243Luthans, F. 32Lyon, F. 257
Macafee, K. 250MacDonald, R. 109MacMillan, I. C. 213Macpherson, D. A. 133MaCurdy, T. 198–200Maddala, G. S. 25Maddison, A. 56Mahmood, T. 224–225, 231Majluf, N. S. 175–176Makepeace, G. H. 104, 107, 132,
213–214, 236Makin, P. J. 216Manove, M. 263Manser, M. E. 32Marchand, M. 245Marsh, A. 31Marshall, A. 42, 226Marshall, J. N. 257Mason, C. M. 172, 178Mata, J. 225, 230, 231Matheson, J. 31Mattesini, F. 155Maxim, P. S. 107–108, 214Mayer, A. 194Mazumdar, D. 208McClelland, D. C. 250McCormick, D. 33McCosham, A. 257McCue, K. 17, 33, 197

Author index 313
McEntee, P. 104, 107–110, 112, 189McEvoy, D. 116, 121, 207McKay, S. 96, 108, 186McKernan, S. M. 168–169McNulty, H. 256–257Meager, N. 17, 33–34, 95–96, 108, 111,
129, 264–265Medoff, J. 197, 206Meredith, G. G. 219, 230Metcalf, H. 115, 165Meyer, B. D. 95, 107–108, 110, 113–114,
119–120, 122, 124, 130, 132–133,184, 214, 230
Michelacchi, C. 218Milde, H. 141–142, 154Miller, R. A. 240Mitchell, P. 70, 104–105, 109, 111, 240,
264Mlakar, T. 92, 104Modigliani, F. 141Modood, T. 115, 165Moisio, A. 232Moore, C. S. 32Moore, J. 153Moore, R. L. 104–105, 107–108,
110–111, 115, 195, 197, 252Moore, W. T. 264Mora, M.T. 107, 114, 119, 121–122Moralee, J. 128–129, 133, 188, 190, 193,
197–198, 204, 206–207, 212–213Morduch, J. 167, 178Moresi, S. 263Morgan, K. 216Morris, C.N. 250Mosakowski, E. 72, 104, 110, 257Moskowitz, T. J. 190Mueller, R. E. 104, 107–108, 110–111,
207Muller, E. 94, 109, 195–197, 249–250Myers, S. C. 175–176Myrdal, G. 113, 132
Nafziger, E. W. 223Neck, P. A. 45, 66Nee, V. 74, 113Nelson, R. E. 219, 230Nenadic, S. 219Newman, A. F. 90–91, 100, 110, 133Nielsen, S. B. 122, 177, 230, 263, 271Nisjen, A. 34Noe, T. H. 176Nolan, M. A. 108, 194, 214, 256, 260Norton, W. I. 264Nucci, A. R. 6, 222, 231Nziramasanga, M. 230
O’Farrell, P. N. 104, 108, 257Odle, M. 195OECD 103, 127, 170–171, 197, 205–207,
229, 245–246, 254Ohlsson, H. 104, 109–110, 112, 182, 189,
264Oi, W. Y. 212, 224Olekalns, N. 142Olofsson, C. 196Ophem, H. van 96, 104, 107, 110, 189,
230, 241, 252, 256Ordover, J. A. 147, 201–202Oswald, A. 104, 105–110, 116, 179, 182,
184, 189, 207, 240, 257, 260–261Otani, K. 224–225Oulton, N. 196, 230Owen, A. L. 110
Pakes, A. 208Palich, L. E. 264Parasuraman, S. 81Parker, S. C. 88, 92, 97, 103–105, 107,
109, 111–112, 156, 159, 166, 177,185–186, 193–194, 196, 199,202–207, 209, 213–214, 217–218,223, 225, 227, 229, 231–232, 235,237, 238–239, 253, 264
Parsons, W. 206Pavitt, K. 216–217Pekkala, S. 215, 223, 231Penrod, J. 243Perez, S. J. 188Pestieau, P. 245, 248–249Petersen, B. 183Petersen, M. A. 162Petrin, T. 207Pfeiffer, F. 219, 225, 255Phillips, B. D. 219, 230Phillips, J. D. 32Phillips, P. C. B. 202Pickles, A. R. 104, 108, 257Picot, G. 104–105, 107–108, 193, 196,
206–207, 222–223, 230, 241Pierce, B. 17, 33, 193, 196, 206, 222–223,
230Piore, M. J. 88Pissarides, C. A. 213, 250–251Pitt, M. M. 169Pollert, A. 177Pomroy, R. 217Portes, A. 122, 130Portugal, P. 225, 231Posssen, U. M. 231, 248–249Poterba, J. 108, 176Power, L. 206–207

314 Author index
Praag, C. M. van 22, 34, 65, 67, 71–72,77–78, 83, 96, 104, 107, 110, 189,194
Prais, S. J. 214Preisendorfer, P. 108, 133, 224, 231, 247Puri, M. 172Pyle, D. H. 163
Quadrini, V. 104, 183, 185, 189, 209, 222,241
Quinn, J. F. 107, 108, 189, 198, 204, 205,206, 207, 248
Rafiq, M. 122Rahman, A. 178Rajan, R. G. 162Ray, R. N. 111Razin, E. 121Rees, H. 104, 107–108, 132, 197,
199–201, 213–214, 216, 236Reid, G. C. 215, 223–224, 228, 230–231,
257Reize, F. 219, 225, 255Rendall, M. S. 126–127Repullo, R. 223Reynolds, P. D. 98, 101, 104, 109, 110,
112, 128, 218, 225–227, 231–232,240, 256–257, 261
Rhyne E. H. 239–240, 262–263Rider, M. 206–207, 245, 263Riley, J. G. 21, 141–143, 154, 239Rob, R. 50–52, 66, 209Roberts, E. B. 230Roberts, M. 206Robinson, P. B. 107–108, 133Robson, M. T. 92, 97–98, 100–101,
103–105, 107, 109, 111–112,187–189, 203, 205, 212, 216, 217,231, 239, 243, 252, 263, 264
Robson, P. J. A. 257Rodger, J. 110–111, 230Rogers, H. 32Rosa, P. 128Rosen, H. S. 107–109, 129, 132, 137,
182, 189, 193, 223, 231, 241,267–268
Rosen, S. 42, 231Rosenstein, C. 78Ross, S. A. 173Rossi, S. E. 170Rossiter, L. F. 207Rothschild, M. 201Rotter, J. B. 251–253Rougier, J. 205Rubery, J. 212
Rushing, F. W. 214Russell, T. 140, 141, 150, 160
Sabel, C. F. 88Sacerdote, R. 245Sakova, Z. 17, 28, 34, 69, 104, 194,
261–262Sammelson, L. 206, 230Sanders, J. M. 113, 246Sandford, C. 265Santor, E. 74Say, J-B. 88, 216–217Scase, R. 108–109, 206, 258Schaffner, J. A. 88, 92Scharfstein, D. 206Scheffler, R. M. 207Scherer, F. M. 217, 230Schiller, B. R. 104, 107, 252Schmidt-Mohr, U. 154Schmitz, J. A. 88–90, 212, 222, 224, 231Schuetze, H. J. 32, 96–97, 104–105,
107–108, 110–111, 193, 197, 252,264
Schuh, S. 195–197Schultz, T. P. 92, 104, 203, 271Schultz, T. W. 216–217, 230Schumpeter, J. 41, 66, 78, 87–88, 216,
230, 231Scott, J. A. 162Segal, U. 213Selden, J. 226Sessions, J. G. 20Sexton, D. L. 77, 133Sexton, E. A. 107–108Shah, A. 104, 107–108, 132, 197,
199–201, 213–214, 236Shane, S. 230Shapero, A. 254, 256Sheshinski, E. 47Shleifer, A. 184Shorrocks, A. F. 194Sibly, H. 142Sillamaa, M.-A. 263Simmers, C. A. 81Simmons, P. 231Simon, H. A. 214Singell, L. D. 229Sleuwaegen, L. 107, 230Slovin, M. B. 187Sluis, J. van der 196, 214Smallbone, D. 32, 257Smiley, R. 111–112, 227Smith, A. 109, 161Smith, B. D. 155, 160, 241, 262Smith, I. J. 217

Author index 315
Smith, S. 249–250Snow, A. 247–248Sollis, R. 35Southey, C. 81–82, 163, 231Sowell, T. 115Spear, R. 125Spilling, O. R. 101Spivak, A. 213Squire, L. 33Staber, U. 98, 111Stajkovic, A. 208–215Stanworth, J. 225Steinmetz, G. 29, 32, 94, 111, 247,
257–258Stiglitz, J. 143–148, 153–154, 156–158,
160–163, 167, 169, 173–175, 183,201, 219, 238–239
Stoll, H.R. 176Storey, D. J. 95, 97, 101, 104–105,
110–112, 193, 199, 207–208, 212,215, 217, 230–231, 255, 257, 262,264, 266–267
Stutzer, M. J. 155, 179, 241, 262Stutzes, A. 32, 71, 81, 107–108Suarez, J. 223Summers, L. H. 184Sumner, D. A. 197Sushka, M. E. 187Sutton, J. 230
Taylor, M. P. 34, 67–68, 79, 84, 96,104–105, 107–111, 126, 132–133,181, 183, 189, 194, 219, 222–224,231, 264
Teilhet-Waldorf, S. 33Tennyson, S. 117Terrell, D. 223Tether, B. S. 217Thakor, A. V. 141–143, 150, 153–155,
162, 164Thornton, J. 199, 207Thurik, R. 88Thwaites, A. T. 217Timmons, J. A. 253–255Todaro, M. P. 263Toıvanen, O. 156Townsend, J. 216–217Townsend, R. 161Trandel, G. A. 247–248Tucker, I. B. 104–105, 107–109, 132, 264Tyson, L. d’Andrea 207
Udell, G. F. 153, 162–163, 187–188, 190Uusitalo, R. 96, 105, 107–109, 181–182,
264
Vale, P. 228–229Variyam, J. N. 215, 230Veall, M. R. 263Vijverberg, W. P. M. 22–23, 29, 34–35,
132Virdee, S. 115, 165Vissing-Jørgensen, A. 190Vivarelli, M. 105, 107, 231
Wadhwani, S. B. 231Wagner, J. 196Waldfogel, J. 209, 241Waldinger, R. 118, 120–121Waldorf, W. H. 208Wales, T. J. 199Walker, S. 243, 231Wall, H. J. 99, 101, 105, 108,
110–112Watkins, D. S. 127Watkins, J. M. 127Watson, H. 148, 247Watson, R. 163, 215Weathers, R. 19, 72, 129Webb, D. G. 142, 147, 150, 153,
156–159, 163–164, 173–174, 184,231
Webb, S. 33Weber, G. 34, 250–251Weber, M. 257Weiss, A. 143–148, 147, 153–154,
156–158, 161–163, 173–175,238–239
Welch, I. 263Wellington, A. J. 26, 108, 133, 264Wellisz, S. 88, 92, 224–225, 231, 239Welter, F. 207Wennekers, S. 88Wenner, M. D. 168Westhead, D. 101, 104, 110, 112Westhead, P. 215–216, 219, 222, 231Wette, H. 161Wetzel, W. E. 172, 178White, L. J. 182, 266White, M. J. 229White, S. B. 93, 247–248, 256–257,
261Whittington, R. C. 110Wicks, P. J. 257Willard, K. L. 188–190Williams, D. L. 119, 207, 265Williams, D. R. 207, 241–242Williams, M. 128Williams, S. L. 197Williamson, O. E. 228Williamson, S. D. 149

316 Author index
Willig, R. D. 153–154Winden, F. van 104, 108–109, 214, 224,
237–239, 257, 269Wit, G. de 104, 108–109, 214, 219, 224,
228, 237–239, 257, 269Wolpin, K. I. 22Woo, C. Y. 81–83, 215, 223, 230, 231Wood, E. 217, 224Worrall, T. 149Wren, C. 105, 205, 241–242, 252,
263–264Wright, E. O. 9, 11, 29, 32, 94, 111,
270
Wu, Y. 142Wydick, B. 168
Xu, B. 149, 181
Yamawaki, H. 227Yoon, I. J. 118, 165–166Yuengert, A. M. 121, 130, 133, 264Yunus, M. (Grameen Scheme) 167
Zhou, M. 122, 130Ziegler, R. 224, 231Zingales, L. 183

Subject index
ability, and occupational choice 225achievement, need for 250ADIE Credit Project for Self-Employment
178adverse selection
credit rationing models 145, 150, 161,239
group lending 239age
and experience 70–72and labour supply 202–204and survival rates 223, 231see also retirement
agency costs, and equity finance 173agricultural workers 179, 184, 271alertness 65Alternative Investment Market (AIM) 173ambiguity, tolerance of 253–255arbitrage 39–40asset windfalls 181–182, 184asset-based finance 137assets
after entering self-employment 181–182and firm survival 182–183prior to self-employment 180–181
asymmetric informationand debt finance 138Type I credit rationing 142Type II credit rationing 143
BancoSol 167Bangladesh Rural Advancement
Committee Scheme 167Bank Rayat 167bankruptcy
costs of 141, 162law 228–229
bankspublic relations 188response to loan guarantee schemes 238,
239risk neutrality 142–150
screening for risk 138see also credit rationing
Birch Report 194bivariate probit model 199black economy, size of 264bridging allowances 255British Household Panel Survey (BHPS)
264British National Child Development
Survey (NCDS) 78British Social Attitudes Survey 105business angels 171, 172, 174, 178business cycle 96, 98business displacement 239, 254Business Expansion Scheme 241Business Link Scheme 256–257, 265Business Start Up Scheme 264
Calmedow Foundation 178Canada, self-employment rates 180–181,
207capital, requirements of industry 93capital gains exemptions 246capital gains tax, and venture capital
176–177, 178capital stock growth 270capitalists, risk-bearing 41Certified Lender Program 262child-care costs 125Choice Dilemma Questionnaire 263Characteristics of Business Owners
(CBO) 6collateral 152–153, 154
and credit rationing 237–239and venture risk 155, 161
commitment loans 186–188competing-risks hazard model 221–222competition effect, on firm births and
deaths 226construction industry 230, 32contract types 151–152contracting-out 164
317

318 Subject index
co-operatives 166co-ordination, of factors of production 216corporation tax, and venture capital 177creative destruction 216credit cards 177credit co-operatives 169–170, 178credit rationing 137, 138, 262
effect of government loans 241and equity rationing 174evaluation of 154–156, 267loan guarantee scheme 237redlining 139, 143, 147, 148, 161, 239,
262temporary 179, 189Type I 139, 140–142, 180, 181–182,
183, 184–185, 186Type II 139, 142–150, 186–189see also Evans–Jovanovic model,
Stiglitz–Weiss modelcriminal behaviour 254–255cultural traditions 74
debt financeand equity finance 173–174, 175, 267survival rates 223see also credit rationing
debt repayment 150–154decreasing absolute risk aversion (DARA)
184Department for Education and Skills 256Department for Trade and Industry (DTI)
230, 256developing countries
credit rationing 179, 186duration of self-employment 230entrepreneurship 240family finance 166incomes 208micro-finance schemes 167–168,
168–169occupational choice 238self-employment rates 256–257, 82 in
Asia 262differential income tax 246discrimination against ethnic minorities
in capital markets 116–117,by consumers 118–120by employers 115–116, 117
disequilibrium process 217distressed company phenomenon 187double-limit tobit maximum likelihood 201drug-dealers, and risk aversion 265
earnings functions 20–23in structural probit model 26
earnings mobility 193earnings–age profile 195, 196–197, 214EASDAQ 173economic growth 183Economic Opportunity Loan Program 262education
and entrepreneurial success 20, 22relationship with entrepreneurship
73–74, 194of self-employed females 126and survival rates 223
emotional support, of spouse 247employment creation, and grants 241
of Loan Guarantee Scheme 240see also Enterprise Allowance Scheme
employment protection 102–103Enterprise Agencies 256Enterprise Allowance Scheme 254–255,
264survival rates 264,
enterprise culture 105–106Enterprise Investment Scheme 241entrepreneurial ability 54, 227
in dynamic Lucas model 55–57in Jovanovic model 208–213plus ability in paid employment 225and residual claimant status 225and risk aversion 226in static Lucas model 54–55and technological information 57–61
entrepreneurial euphoria 81entrepreneurs
age of 231and capitalists 41characteristics 216, 266–267decline in numbers 56jacks of all trades 72prior assets 180–181too many 180–181
entrepreneurshipcross-country comparisons 222definition 227discrimination in paid employment 120in Eastern Europe 207economics of 208–215, 266interest in 270, 3modern economic theory 42–43multidimensional concept 217–218preference for 183risk-bearing role 243
equity finance 147, 171–172availability of 173–174policy recommendations 176see also business angels, venture
capitalism

Subject index 319
equity gap 174, 176equity rationing 174–176ethnic enclaves 120, 121–122ethnic groups, and self-employment 107,
113, 266–267earnings 114industrial concentration 120non-black 113–114role models 122see also discrimination
Evans–Jovanovic model of credit rationing180–181
experienceand age 240different types 241effect on earnings 241survival 222–223
failure rates 116, 228see also survival rates
family background 266, 110, 194family finance 137, 165–166, 178, 267
and survival rates 223family workers 231female self-employment 266–267
earnings 126–129move out of unemployment 96, 111rates 124–126working hours 197
female workers 212–213financial markets, development 223financing costs, and equity finance 173firm entry and exit
model 208–213, 227relationship between 225–227, 232
firm growth, see Gibrat’s Lawfirm size
and capital stock 56definition of self-employment 64growth rates 214impact of technology 270loan denial 190see also Gibrat’s Law
firm survival, effect of assets 182–183first-order stochastic dominance 220–222fixed-effects model 30flexibility 125formal qualifications 243France, self-employment rates 257franchising
finance 177, 267risk 84self-employment 93, 197, 207,
119–120survival rates 225
fringe benefits 242–246income measurement 16
funding gap, see equity gap
gambling 83gazelles 196Germany, self-employment schemes 264Gibrat’s Law 55, 56, 213–214
refinements to 214government policy
attitude to entrepreneurship 235employment creation 194, 260information and advice provision
261–262involvement in entrepreneurship
268–271survival rates 228–229see also credit rationing, loan guarantee
schemes, procurement, socialprotection
government regulationexcess 246impact on small firms 258–260intervention in credit markets 236–239
Grameen Bank 167, 178grants to small businesses 241, 264group lending 162, 167
advantages of 167–168
hazard models, of firm survival 220–222health
flexibility of self-employment 248–249insurance 108, 127
hidden information, in financial contracts150
high-tech firms, survival rates 219home-workers 32house prices, and regional
self-employment 100–101human capital 239
and credit rationing 183husband’s role in household 125
immigrantscohort effects 131–132duration of residence 130–131likelihood of becoming entrepreneurs
129implicit contract theory 186income effect, in labour supply models 198income risk, and occupational choice 223income tax 260
and job creation 194small firm growth rates 216and venture capital 177

320 Subject index
income taxand corporation tax 263and entrepreneurship 242–246see also tax evasion
incomes, from self-employmentin Australia 17average aggregate differences 69in Europe 188inequality 190measurement 205–206in paid employment 209in transition economies 17in UK 187under-reporting 199in US 16–17, 18
incorporation of business 19, 31and incomes of owners 54–58,
208–213independence, preference for 258industrial structure, and self-employment
92–94information costs, and equity finance
173information flows 176inheritance tax 246impatience 66inheritance
and firm survival 182–183loan security 166and start-ups 181–182
Initial Public Offering 171injury 207innovation 216, 217–218
small firms’ advantage 216–217interest rates
and bankruptcy 225business finance 103–105high initial rate 153–154
intertemporal tax-shifting 247intrapreneurship 31investment information, and venture
capital 172investment, and cash flow 183
job change 96job creation
Enterprise Allowance Scheme 254by entrepreneurs 193–194quality 196–197small firms 194–196, 206–207,
job layoffs 97job satisfaction 260job-shopping theory 70joint liability 154
see also group lending schemes
Keogh plans 246, 258knowledge spillovers, and firm entry 217KPMG 109, 162, 189, 238, 240
labour supplyof entrepreneurs 198lifecycle models 199–202static models 198–199
labour, of spouse 246language skills 122leadership 217Learning and Skills Councils 256leasing 177lifestyle choice 238, 109limited liability assumption 161linear probability model, occupational
choice 198loan guarantee schemes 154, 160, 170,
236, 260, 262counter productive 238effectiveness of 239–241, 269operational costs 237survival rates 188–189
loan guarantors, within family 166loan size 240local authorities, support for start-ups
256locus of control, and probability of
self-employment 77lotteries 182low income communities, micro-finance
schemes 169–170
marginal entrepreneurs 223, 225marital status 247, 108,market equilibrium, and entrepreneurs
217market liberalisation, and entrepreneurial
vigour 220–222Marshall effect, firm births and deaths
226matching, efficiency 176mean preserving spread (MPS) 220, 222Micro-Business International 178micro-finance schemes 167–168, 177
benefits 168–169see also business angels, equity finance,
venture capitalismminimum wages 102–103minority-owned banks 117misfits 254–255modelling, relevance of 260–261monitoring costs 142Monthly Household Labour Force Survey
207

Subject index 321
moral hazardhidden action 148–149hidden information 149joint liability schemes 167Stiglitz–Weiss model 147
motivation 217multinomal logit model 28multi-period lending contracts 162,multiple job-holding 207multiplier effect, firm births and deaths
226Mutual Guarantee Scheme 170, 178
n-Ach, see achievement, need forNASDAQ 173National Economic Research Associates
(NERA) 188National Insurance contributions 258National Longitudinal Survey of Youth 132negative income 137networking 239–241non-governmental organisations (NGOs)
256–257non-increasing relative risk aversion 45
and decreasing absolute risk aversion 45
occupational choice 45costs of switching 50–52employee ability 58–60government intervention 242Lucas model 55–57tax incentives 251–253theories 43time-series approach to modelling 175
cointegration methods 203panel data 203
over-investment 139, 218, 228and Loan Guarantee Scheme 239in de Meza and Webb model 156–158,
163, 184over-optimism 254
attitude to risk 264own-account workers 6, 194
parental managerial experience 197–198part-time workers 212–213, 126, 133payroll taxes, and occupational choice 264personal wealth, endogenous growth in
90–91Poland, self-employment rate 206, 207pooled regression model 30pooling contracts 154–155, 156, 162, 163pooling equilibria 150Preferred Lender Program 262price rationing 183
Princes Trust 256–257private information
and equity provision 174and family finance 166
private pension contributions 246, 258probit/logit models
of firm survival 220of occupational choice 24–26
procurement, aid to small businesses257–258
product markets 43–44professions, and self-employment 94, 96profit and loss, responsibility for 229progressive profit tax 158prosperity-pull hypothesis 95, 96Protestant Ethic 257psychological factors, in self-employment
choice 76–79public-sector employment 103
random-effects model 205, 206recession-push hypothesis 95, 97recessions, and firm exit 219redlining, see credit rationingredundancy payments 97, 109, 110–111Regional Development Agencies 256regional variations, in self-employment
rates 99–102, 112regression fallacy 195–196Regulatory Flexibility Act 260, 270religion, and entrepreneurship 122, 257repeat entrepreneurship 212–213research and development 216, 217, 230retirement 205, 206, 207
avoidance of 239retirement benefit 103Retirement Survey 205–206returns to capital 207risk adjustment 216risk aversion
definitions 219increase in 222–223likelihood of becoming entrepreneur
264in marriage 75in old age 239see also entrepreneurial ability
riskcross-country attitudes 66definitions 220distinct from uncertainty 229government intervention 242levels 265neutrality 161see also over-optimism, uncertainty

322 Subject index
risk-taking propensity 252Rotating Savings and Credit Associations
(Roscas) 117–118, 169Rotter Scale 251
screening hypothesis 20, 22, 34SECA tax 245second-order stochastic dominance
(SOSD) 46seedbed industries 231–232selection bias 21self-employment
concentration in mid-career 71definition 76–79economic importance 86–87,
266effects of education 73and entrepreneurship 75ethic variation in rates 123international rates 126relative earnings as motive 235in service sector 93voluntary switching 223
self-finance 137, 184, 185–186survival rates 223, 231
separating contracts 150, 154–155single crossing property 152, 154single risk hazard model 221size distribution fallacy 195size–wage premium 197skill mix, and industrial structure 93Small Business Administration (SBA)
96, 127, 138, 206, 208–213, 217,257, 260, 263
Small Business Administration 262,263
loan guarantee schemes 236, 240Small Business Investment Companies
and Minority Investment Companiesprogams 241
Small Firm Loan Guarantee Scheme(SFLGS) 240, 262,
small firmsfailure rates 52growth rates 215–216importance of 219and large corporations 228
SMART 241social capital 245social mobility 19social protection 258start-up capital 138
and discrimination 116–117and spouse 246and welfare state 103
start-up rates 101start-ups, support for
access to information 255–257effectiveness of government intervention
257state verification, and group lending
167–168statistical discrimination 116, 117sticky loan rates 186–188Stiglitz–Weiss model of credit rationing
144–148, 174stock markets, and risk-sharing 227strategic bequest behaviour 184structural probit model 199, 232sub-contracting, see contracting-outsub-optimal loan size 154substitution effect, in labour supply
models 198intertemporal 199, 201
Survey of Incomes and ProgramParticipation 16
survivalaccess to capital 223duration 222Enterprise Allowance Schemes 254firm size 223human capital 222–223industry organisation 225innovation 224macroeconomic conditions 224–225marketing 224rates 218–220, 227see also entrepreneurial ability in
Jovanovic modelswitching costs 50–52, 67
tax advantage, of marriage 75tax deductability 245tax evasion 245
auditing 248–249and number of entrepreneurs 247–248,
263tax exemption, for family finance 166Taxpayer Compliance Measurement
Program (TCMP) 249–250tax-penalty policies 247technological information 57–61technological progress 91–92, 110, 224,
270teleworkers 206–207temporary credit rationing 139–140Thematic Apperception Tests 250third-age entrepreneurship 206top-coding 206trade credit 171

Subject index 323
Training and Enterprise Councils (TECs)254, 257
transition economiesentrepreneurial development 32occupational choice 69self-employment rates 95, 96
Type A behaviour 254
UK, self-employment rates 258uncertainty 40, 46
capped loans 142increase in risk 221and information 229labour supply 201–202risk aversion 222
under-investment 139, 158credit rationing 147and equity finance 175–176in Stiglitz–Weiss model of
under-reporting, of income 184, 199,249–251, 261, 263
see also tax evasion
unemployment, and firm survival 224–225unemployment benefit 103, 110unemployment reduction, and
self-employment 95–99, 253–255, 260United States, self-employment rates 9unlimited liability 153urban/rural advantages for
entrepreneurship 101–102
venture capitalism 171–172, 176–177,178
early state investment 172US state funding 241
wages, of ethnic minorities 115wealth distribution 194wealth–income ratio 185Wilson Report 138work mixing 197, 200work time, control over 239, 247–248work–family balance 262working hours 197–198


![AC/DC Geared Motor and Gearhead - RAVEO s.r.o ...katalog]_DKM...- S.C. Induction Motor - S.C. Reversible Motor - S.C. E.M. Brake Motor - S.C. Clutch & Brake Motor AC MOTORS Lead Wire](https://img.pdfslide.us/doc/110x75/5b0a4a0b7f8b9aba628bec71/acdc-geared-motor-and-gearhead-raveo-sro-katalogdkm-sc-induction.jpg)