Embed Size (px)
Citation preview

Presented by: Don Washkewicz Chairman, CEO & President
Parker Hannifin CorporationAnnual Shareholders Meeting
October 22, 2008
2
Forward-Looking Statements:Forward-looking statements contained in this and other written and oral reports are made based on known events and circumstances at the time of release, and as such, are subject in the future to unforeseen uncertainties and risks. All statements regarding future performance, earnings projections, events or developments are forward-looking statements. It is possible that the future performance and earnings projections of the company and individual segments may differ materially from current expectations, depending on economic conditions within its mobile, industrial and aerospace markets, and the company's ability to maintain and achieve anticipated benefits associated with announced realignment activities, strategic initiatives to improve operating margins, and growth, innovation and global diversification initiatives. A change in economic conditions in individual markets may have a particularly volatile effect on segment results. Among the other factors which may affect future performance are: changes in business relationships with and purchases by or from major customers or suppliers, including delays or cancellations in shipments or significant changes in financial condition; uncertainties surrounding timing, successful completion or integration of acquisitions; threats associated with and efforts to combat terrorism; uncertainties surrounding the ultimate resolution of outstanding litigation; competitive market conditions and resulting effects on sales and pricing; increases in raw material costs that cannot be recovered in product pricing; the company’s ability to manage costs related to employee retirement and health care benefits and insurance; and global economic factors, including manufacturing activity, air travel trends, currency exchange rates, difficulties entering new markets and general economic conditions such as inflation, interest rates and credit availability. The company makes these statements as of the date of this disclosure, and undertakes no obligation to update them.

3
FY2008 Review
Win Strategy Update
1st Quarter Results – FY2009
Outlook for FY2009
Presentation Agenda

4
FY2008 Results
5
Another Another OutstandingOutstanding
Year!Year!
FY08 Results
6
5th Record Yearin a row !
FY08 Results

7
$12 Billion +
FY08 Record Results - - -
8
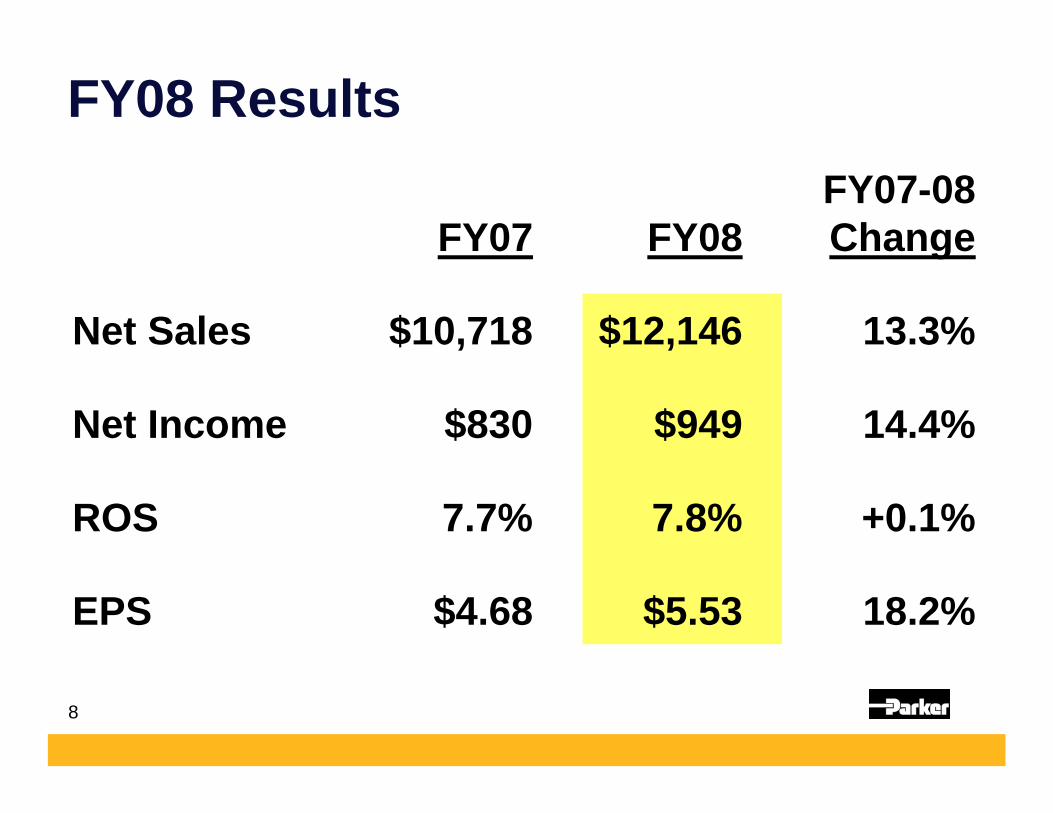
FY07-08FY07 FY08 Change
Net Sales $10,718 $12,146 13.3%
Net Income $830 $949 14.4%
ROS 7.7% 7.8% +0.1%
EPS $4.68 $5.53 18.2%
FY08 Results

9
2008 Revenue Growth
2008 Revenue Growth
$10,718
$12,146$511
$373
$544
$10,000
$10,500
$11,000
$11,500
$12,000
$12,500
FY07 Organic StrategicAcquisitions
Currency FY08
$MM
+5%+3%
+5% +13%
10
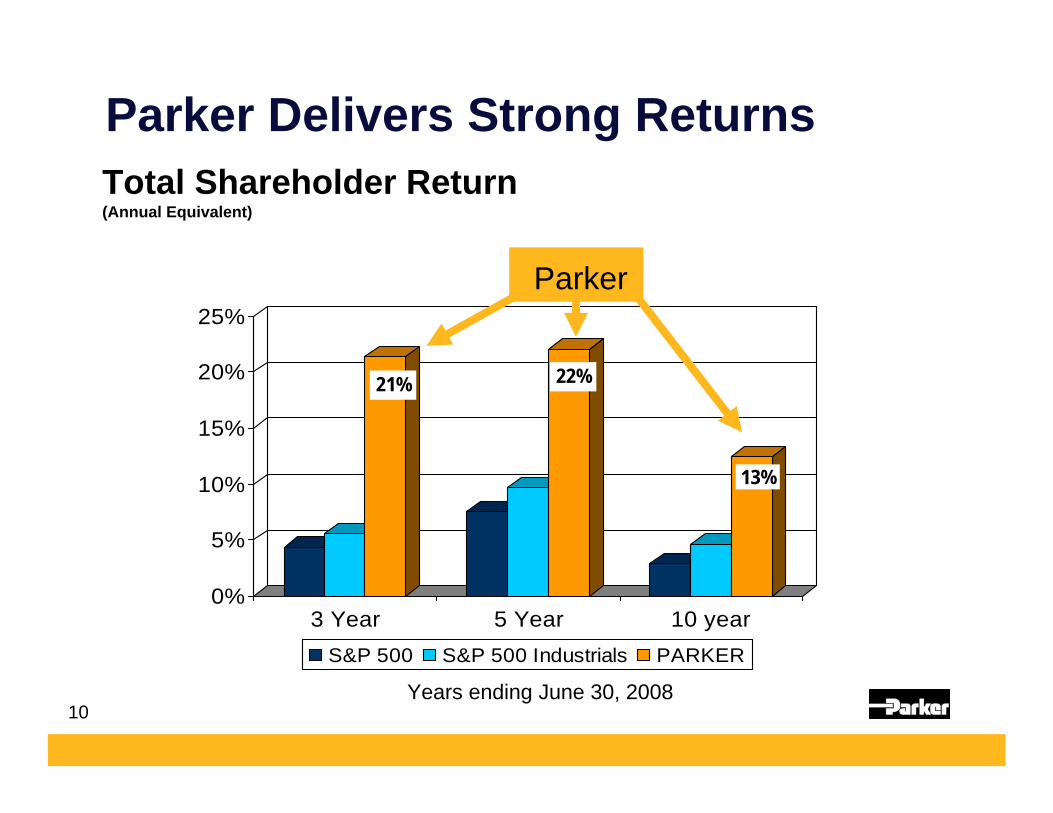
Total Shareholder Return(Annual Equivalent)
Parker Delivers Strong Returns
0%
5%
10%
15%
20%
25%
3 Year 5 Year 10 yearS&P 500 S&P 500 Industrials PARKER
21% 22%
13%
Parker
Years ending June 30, 2008

11
*Among the top 5 longest-running dividendincrease records in the S&P 500 index.
$.00
$.10
$.20
$.30
$.40
$.50
$.60
$.70
$.80
$.90
$1.00
$1.10
57 59 61 63 65 67 69 71 73 75 77 79 81 83 85 87 89 91 93 95 97 99 01 03 05 07 09
97% Increase in Four Years
52 Consecutive Years of Increased Dividends
12
Records Achieved in FY08
FY08 Results
13
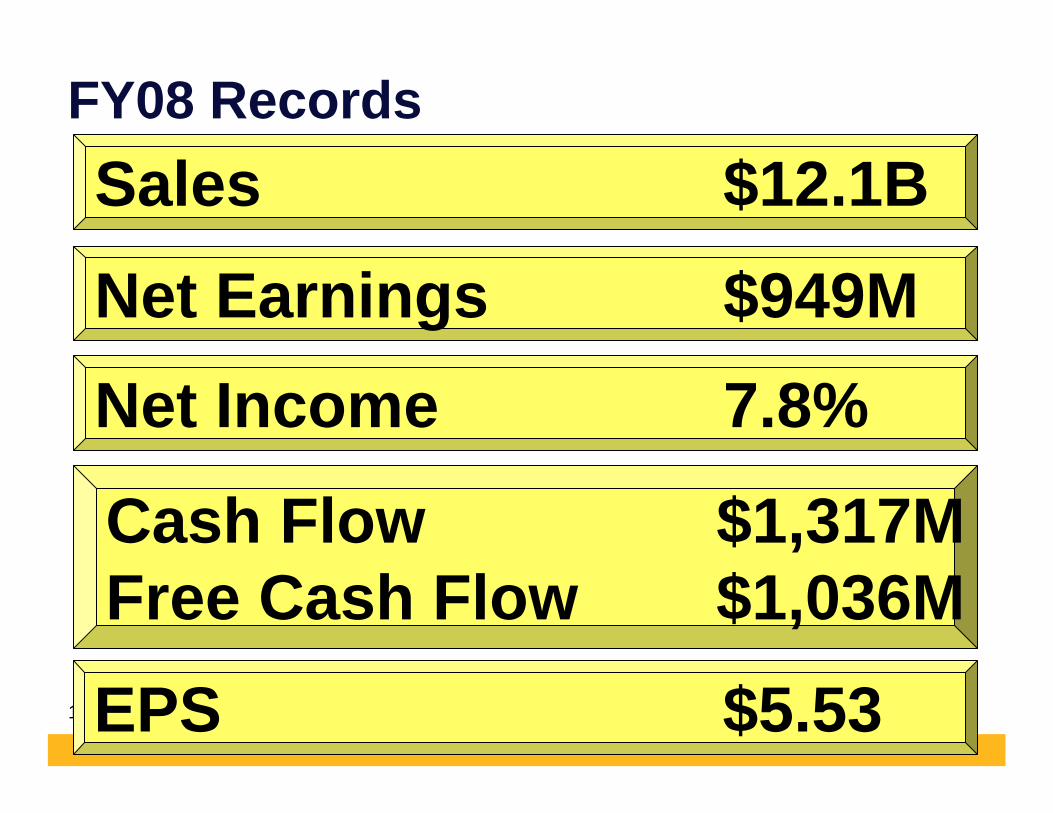
FY08 RecordsSales $12.1B
Net Earnings $949MNet Income 7.8%
Cash Flow $1,317MFree Cash Flow $1,036M
EPS $5.53

14
FY08 Records
Operating Margin 14.1%
Ind’l Euro Oper. Margin $15.6%
Productivity $204K
Ind’l Operating Margin 15.1%
Ind’l Int’l Oper. Margin 15.8%
15
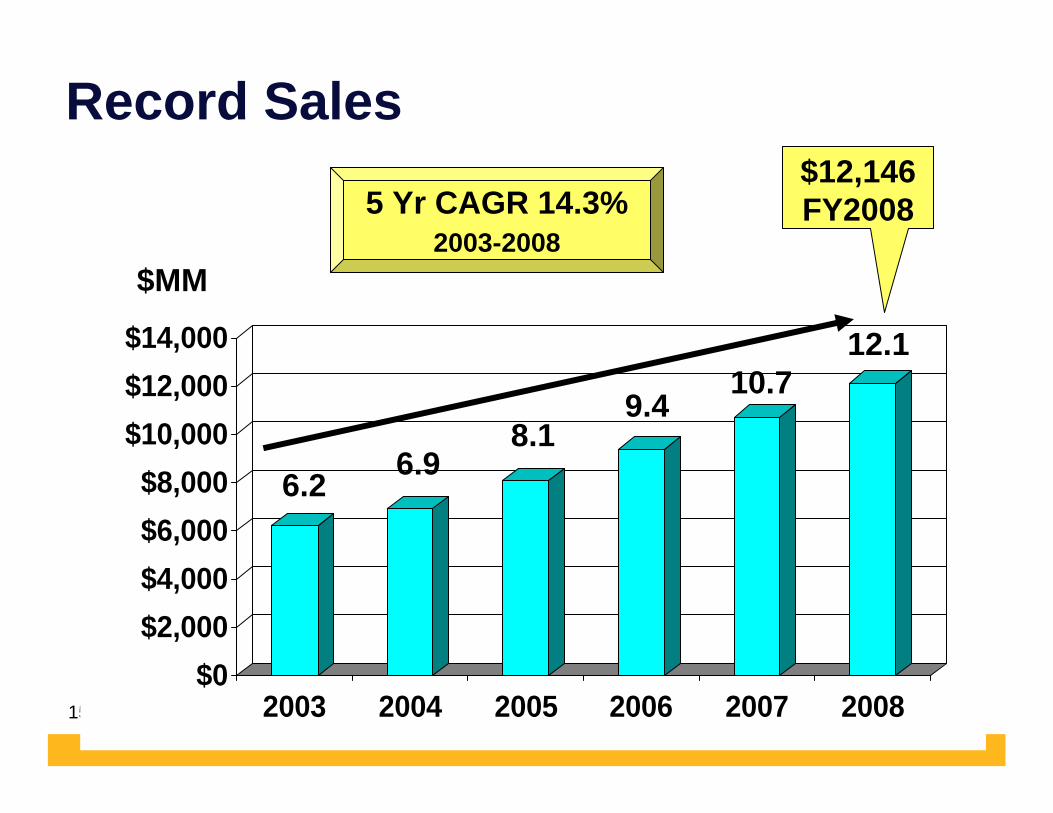
Record Sales
$0$2,000$4,000$6,000$8,000
$10,000$12,000$14,000
2003 2004 2005 2006 2007 2008
5 Yr CAGR 14.3%2003-2008
$12,146FY2008
6.2 6.98.1
$MM
9.410.7
12.1
16
FY08 Long Term Growth
35 Year CAGR Sales = 10.9%

17
FY08 Records
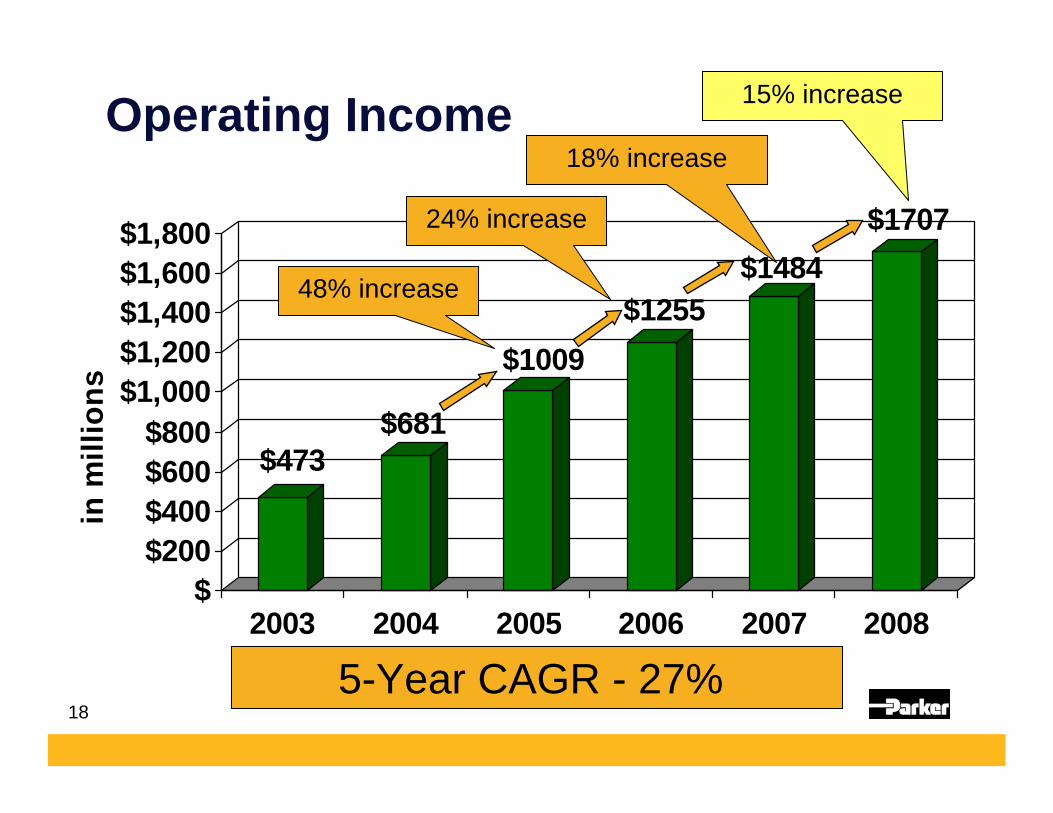
Operating Income
18
Operating Income
$473$681
$1009$1255
$1484$1707
$$200$400$600$800
$1,000$1,200$1,400$1,600$1,800
in m
illio
ns
2003 2004 2005 2006 2007 2008Fiscal Year
24% increase
18% increase
48% increase
5-Year CAGR - 27%
15% increase
19
FY08 Records
Operating Margin … 14.1%

20
Operating Margin Trend
7.3 7.6
9.9
12.513.4 13.8 14.1
7
9
11
13
15
%
2002 2003 2004 2005 2006 2007 2008
Record
Goal 15%
21
FY08 Records
Cash Flow
22
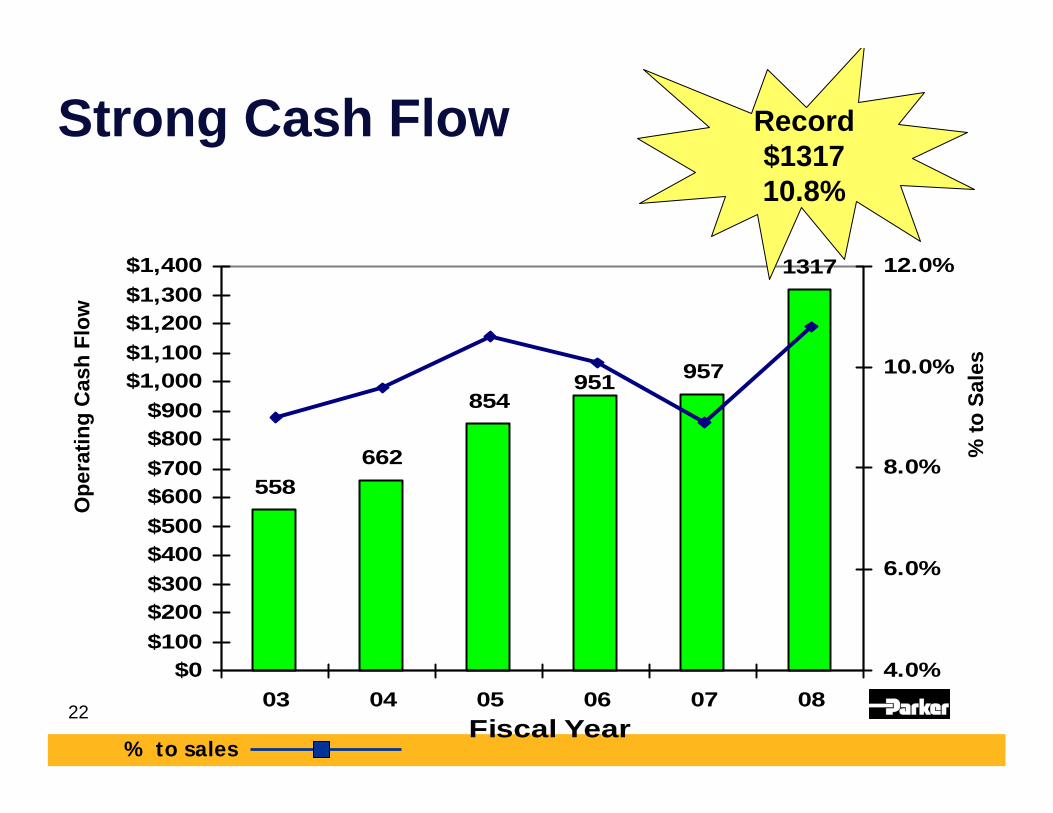
Strong Cash Flow
558662
854957
1317
951
$0$100$200$300$400$500$600$700$800$900
$1,000$1,100$1,200$1,300$1,400
03 04 05 06 07 08Fiscal Year
4.0%
6.0%
8.0%
10.0%
12.0%
% to sales
Ope
ratin
g C
ash
Flow
% to
Sal
es
Record$131710.8%
23
FY08 Records
EPS +18%

24
EPS
$0.75 $1.08$1.86
$2.95 $3.52$4.68
$5.53
0.001.002.003.004.005.006.007.008.00
2002 2003 2004 2005 2006 2007 2008Fiscal Year
$5.53+18%$/Share
40% - 6 Year CAGR

25
Other FY08Accomplishments

26
FY08 Acquisitions
10 Acquisitions$546M

27
FY08 Accomplishments
Strong Balance Sheet

28
Maintained Strong Balance Sheet
Q1 Q2 Q3 Q4
27.2% 29.7% 26.1% 28.3%
2008 Debt to Total Cap
Target 37% Max.
29
FY08 Accomplishments
Entire Company executing Winovation
30
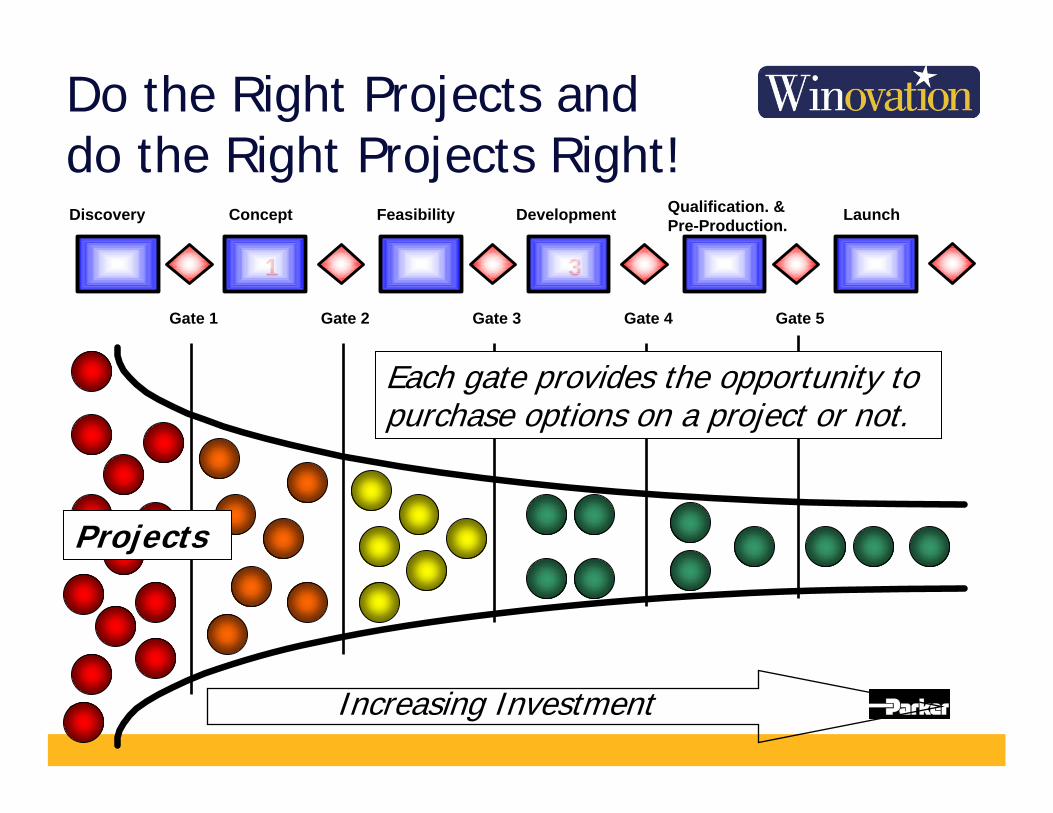
Do the Right Projects and do the Right Projects Right!
1 3
Gate 1 Gate 2 Gate 3 Gate 4 Gate 5
Concept Development LaunchFeasibilityDiscovery Qualification. & Pre-Production.
Increasing Investment
Each gate provides the opportunity to purchase options on a project or not.
Projects
31
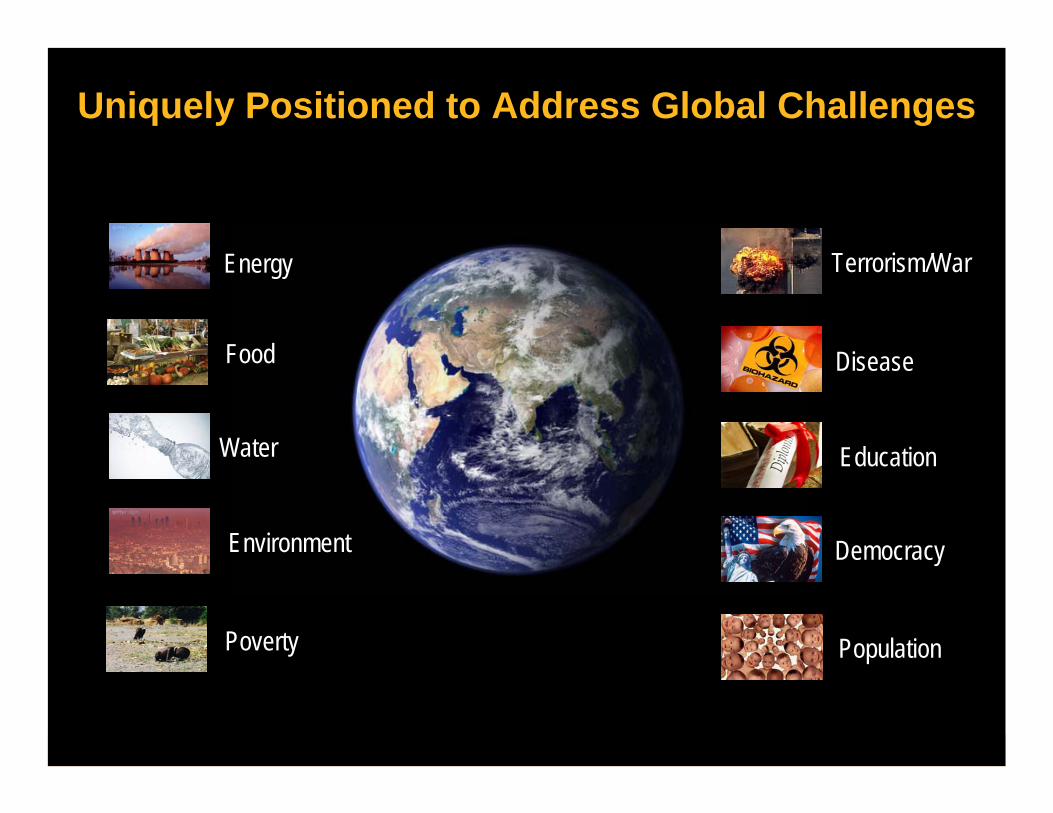
Uniquely Positioned to Address Global Challenges
Energy
Water
Disease
Education
Democracy
PopulationPoverty
Food
Environment
Terrorism/War
32
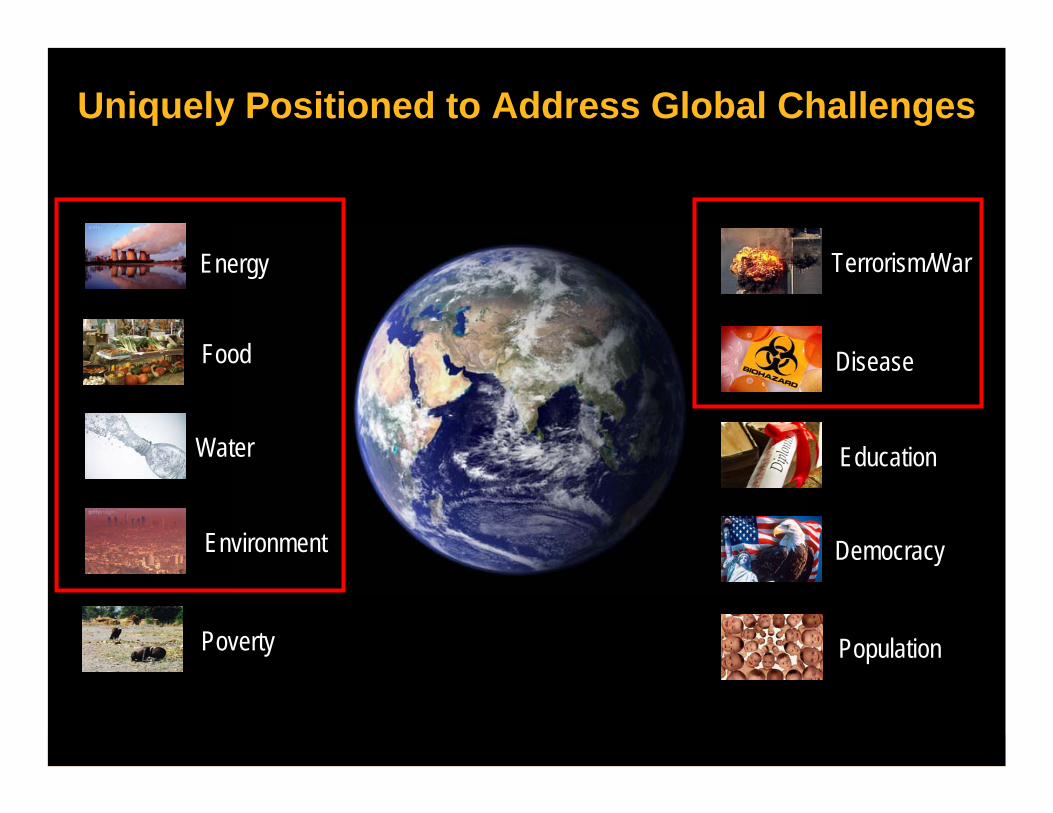
Uniquely Positioned to Address Global Challenges
Energy
Water
Disease
Education
Democracy
PopulationPoverty
Food
Environment
Terrorism/War
33
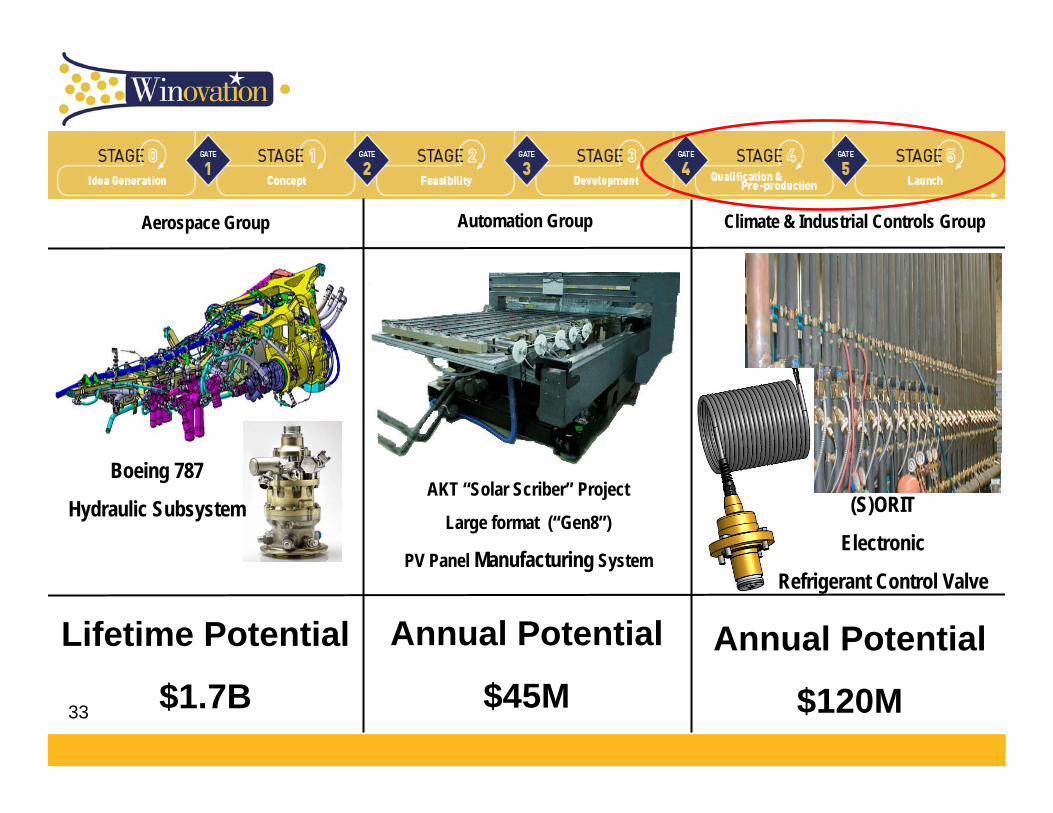
AKT “Solar Scriber” Project
Large format (“Gen8”)
PV Panel Manufacturing System
FWDBoeing 787
Hydraulic Subsystem
Aerospace Group Automation Group Climate & Industrial Controls Group
Lifetime Potential
$1.7B
Annual Potential
$45M
(S)ORIT
Electronic
Refrigerant Control Valve
Annual Potential
$120M
34
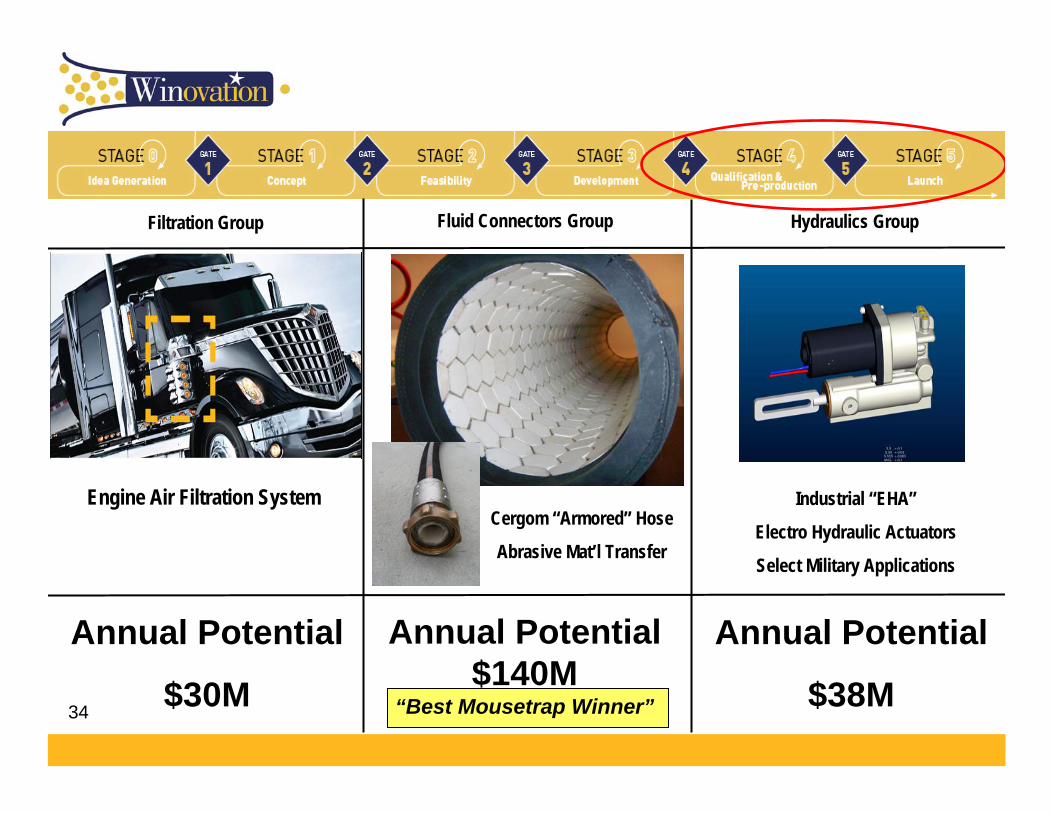
Cergom “Armored” Hose
Abrasive Mat’l Transfer
Engine Air Filtration System
Filtration Group Fluid Connectors Group Hydraulics Group
Industrial “EHA”
Electro Hydraulic Actuators
Select Military Applications
Annual Potential
$30M
Annual Potential
$38M
Annual Potential$140M
“Best Mousetrap Winner”

35
3M CFC Free
Metered Dose InhalerFugitive Emissions Valves
Engine Air Filtration System
Instrumentation Group Seal Group
Annual Potential
$5M/year
Annual Potential
$9M

36
Financial Goals
FY2008
37
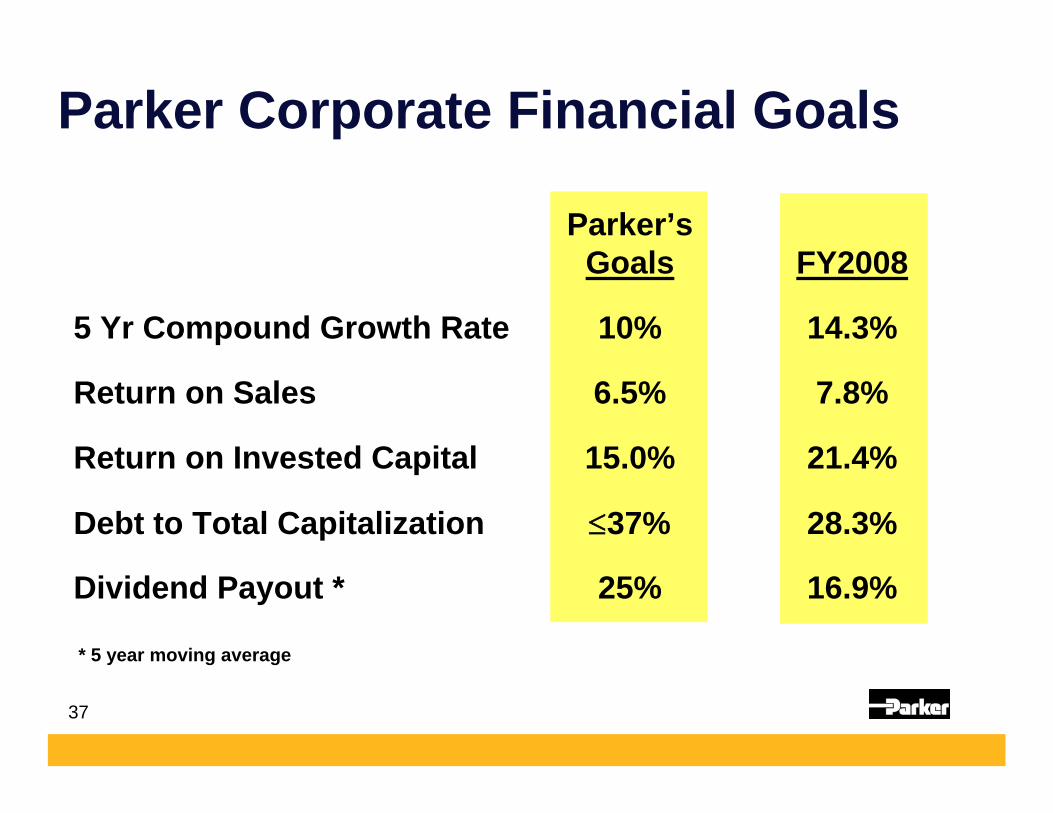
Parker Corporate Financial Goals
Parker’sGoals FY2008
5 Yr Compound Growth Rate 10% 14.3%
Return on Sales 6.5% 7.8%
Return on Invested Capital 15.0% 21.4%
Debt to Total Capitalization ≤37% 28.3%
Dividend Payout * 25% 16.9%
* 5 year moving average

38
FY2008
WIN Strategy

39
Parker’s Win Strategy
Goals #1 PremierCustomer Service
FinancialPerformance
ProfitableGrowth
STRATEGIES
Internal
Acquisitions Globalization♦Delivery of Quality Parts
on Time
♦Value Added Services
♦Best Systems-PHconnect
♦ Suppliers ⇒ STRATEGICPROCUREMENT
♦Operation ⇒ LEAN
♦ Customers ⇒ STRATEGICPRICING
♦ European Initiatives
♦
♦ Innovative Products
♦ Systems Solutions
♦ Strong Distribution
Vision The #1 Motion & Control Company
Empowered Employees
40
What is the “Win Strategy”?
Operational Excellence&
Growth
41
“It’s How We Add Value”
What is the “Win Strategy”?

42
Goals #1 PremierCustomer Service
FinancialPerformance
ProfitableGrowth
STRATEGIES
Internal
Acquisitions Globalization♦Delivery of Quality Parts
on Time
♦Value Added Services
♦Best Systems-PHconnect
♦ Suppliers ⇒ StrategicProcurement
♦Operation ⇒ Lean
♦ Customers ⇒ StrategicPricing
♦ European Initiatives
♦
♦ Innovative Products
♦ Systems Solutions
♦ Strong Distribution
Vision The #1 Motion & Control Company
Empowered Employees
Still our #1 Goal

43
Parker’s Culture
The Customer is #1
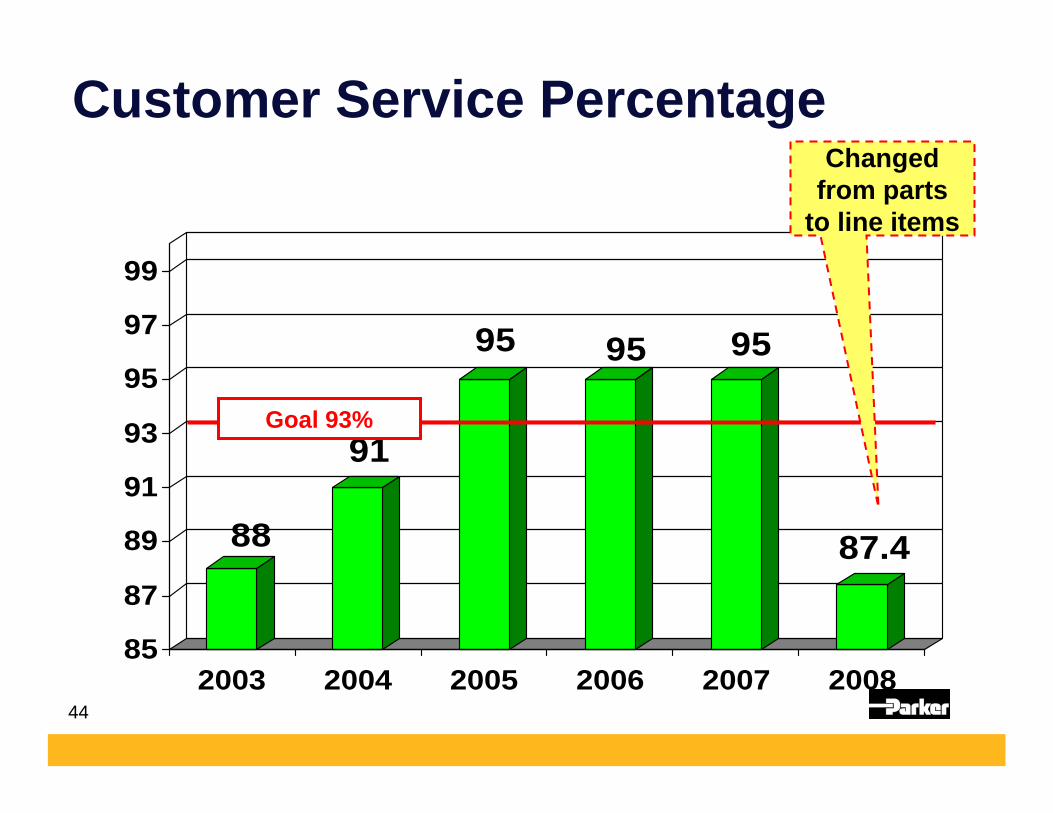
44
88
91
95 95 95
87.4
85
87
89
91
93
95
97
99
2003 2004 2005 2006 2007 2008
Goal 93%
Customer Service PercentageChanged
from parts to line items
45
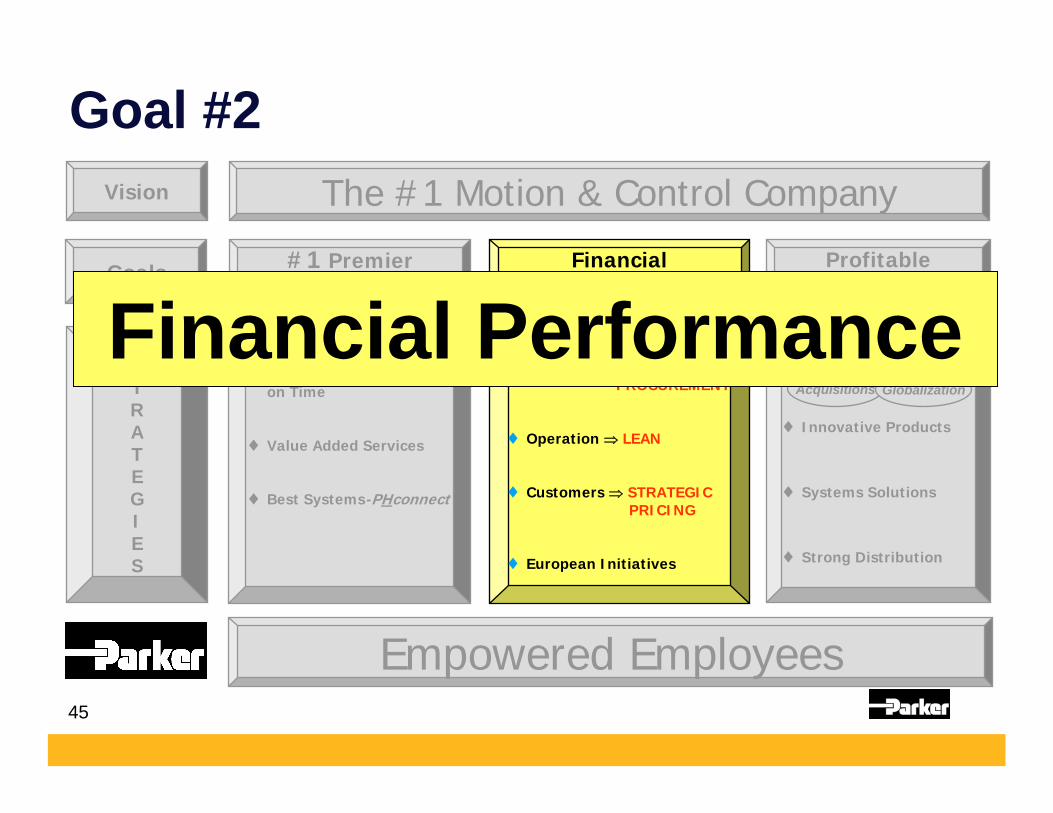
Goals #1 PremierCustomer Service
FinancialPerformance
ProfitableGrowth
STRATEGIES
Internal
Acquisitions Globalization♦Delivery of Quality Parts
on Time
♦Value Added Services
♦Best Systems-PHconnect
♦ Suppliers ⇒ STRATEGICPROCUREMENT
♦Operation ⇒ LEAN
♦ Customers ⇒ STRATEGICPRICING
♦ European Initiatives
♦
♦ Innovative Products
♦ Systems Solutions
♦ Strong Distribution
Vision The #1 Motion & Control Company
Empowered Employees
Goal #2
Financial Performance
46
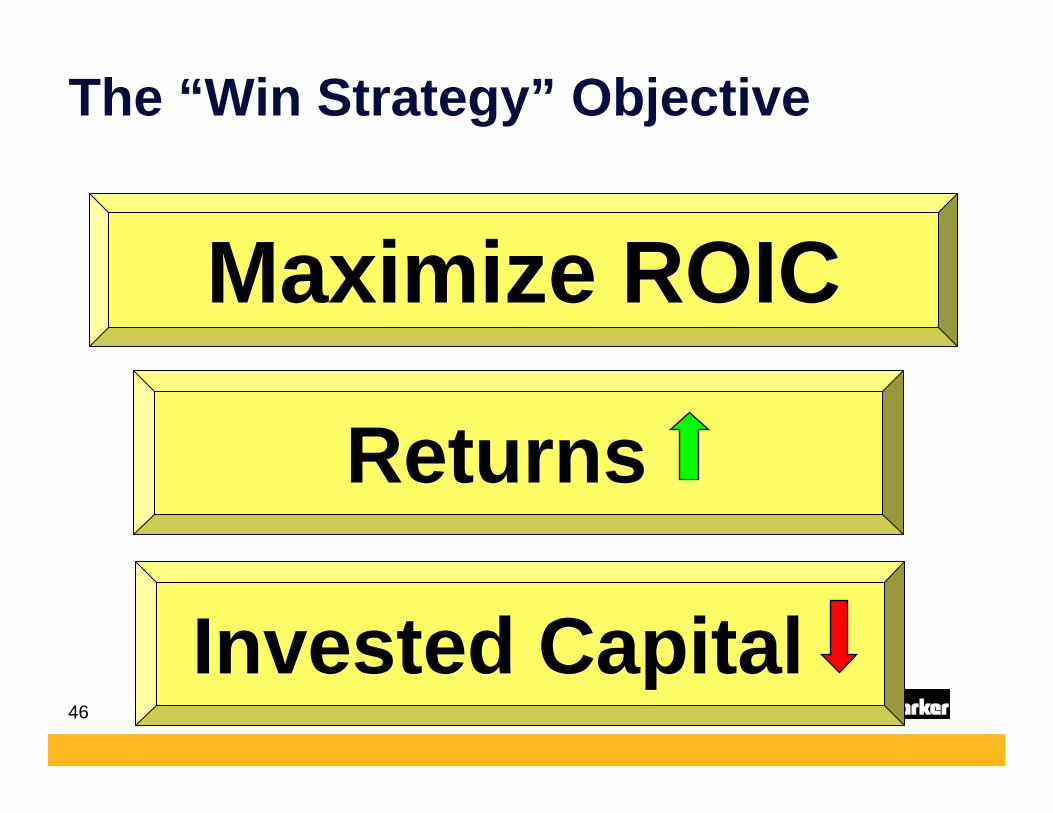
The “Win Strategy” Objective
Maximize ROIC
Returns
Invested Capital
47
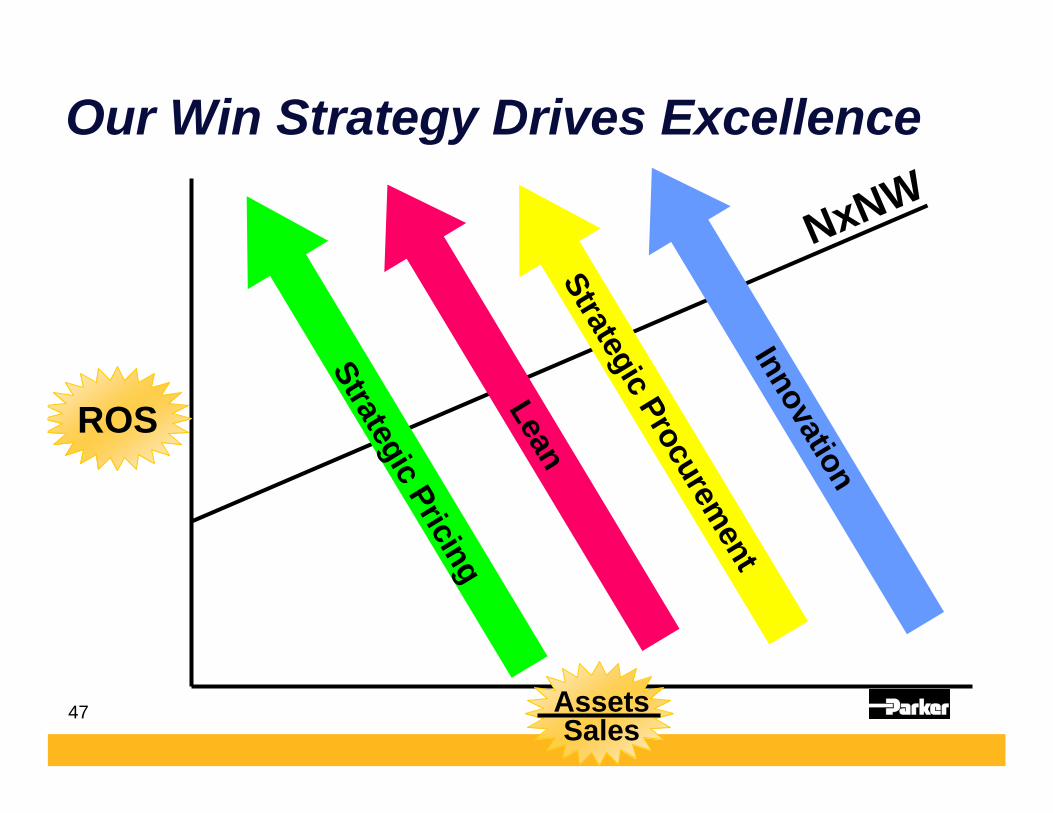
Our Win Strategy Drives Excellence
NxNW
Strategic PricingLean
Strategic Procurement
ROS
InnovationInnovation
SalesAssets

48
ROIC History
7%10%
14%
21% 21% 22% 21.4%
0.0
5.0
10.0
15.0
20.0
25.0
%
FY02 FY03 FY04 FY05 FY06 FY07 FY08
Parker Internal Calculation

49
12.8%13.6%
14.0%14.7%14.8%
15.5%16.0%
16.5%16.8%
17.7%17.8%17.9%18.0%
20.9%21.4%
23.1%23.9%24.0%24.3%24.5%
27.0%30.7%
31.9%
0.0% 5.0% 10.0% 15.0% 20.0% 25.0% 30.0% 35.0% 40.0%
Peer JPeer QPeer RPeer PPeer APeer MPeer H
35th PercentilePeer KPeer GPeer I
50th PercentilePeer OPeer L
PARKERPeer EPeer F
75th PercentilePeer CPeer NPeer DPeer BPeer A
Return on Invested Capital %
2008 ROIC versus Peers
21.4%
Parker
50
Lean Metrics
FY2008

51
12.3%13.0%
12.1%12.3%
12.7%13.2%
12.2%
11.8%
12.6%
12.6%13.5%
12.6%
17.7%
17.3%
18.0%
16.9%
19.1%
17.9%
17.1%
16.5%
17.1%16.2%
15.7%
14.0%14.5%
13.5%12.6%
13.4%
15.8%16.8%
15.7% 14.5%
10.0%
12.0%
14.0%
16.0%
18.0%
20.0%
FY01 FY02 FY03 FY04 FY05 FY06 FY07 FY08
Inventory % to Sales
Goal = 10¢

52
125 130 132 135
154168
174189
204
100
120
140
160
180
200
FY00 FY02 FY04 FY06 FY08
ProductivitySales/Employee
000’s
With annualized acquisition volume
Record+8%
53
European Profitability

54
Record
3.1 3.3
7.910.1
11.113.4
15.6
0
2
4
6
8
10
12
14
16
02 03 04 05 06 07 08Fiscal Year
Goal 15%
Ind’l European Operating Margin%
RO
S

55
Goal #3
Goals #1 PremierCustomer Service
FinancialPerformance
ProfitableGrowth
STRATEGIES
Internal
Acquisitions Globalization♦Delivery of Quality Parts
on Time
♦Value Added Services
♦Best Systems-PHconnect
♦ Suppliers ⇒ STRATEGICPROCUREMENT
♦Operation ⇒ LEAN
♦ Customers ⇒ STRATEGICPRICING
♦ European Initiatives
♦
♦ Innovative Products
♦ Systems Solutions
♦ Strong Distribution
Vision The #1 Motion & Control Company
Empowered Employees
Profitable Growth

56
Parker FY08 Global Growth
USA+2%
Germany+17%
Canada-0.6%
United Kingdom+4%
Italy12%
Brazil15%
Sweden+17%
France15%
South Korea+31%
China+34%
57
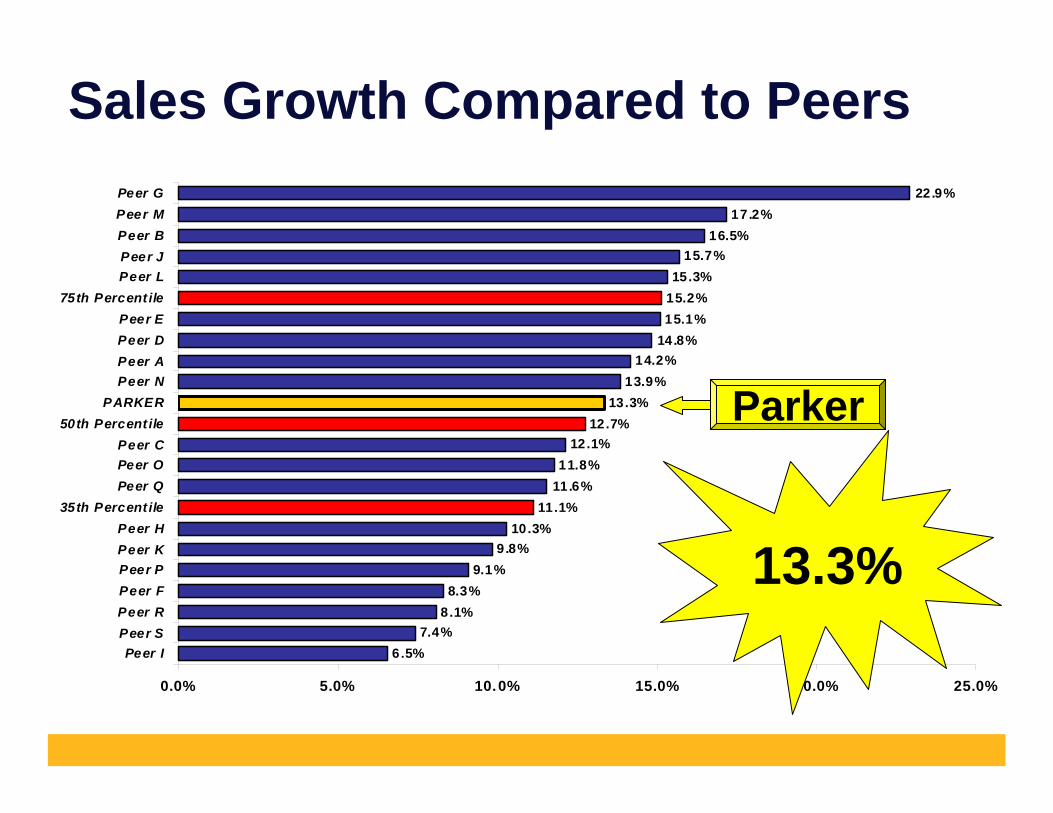
6.5%7.4%
8.1%8.3%
9.1%9.8%
10.3%11.1%
11.6%11.8%
12.1%12.7%
13.3%13.9%
14.2%14.8%15.1%15.2%15.3%
15.7%16.5%
17.2%22.9%
0.0% 5.0% 10.0% 15.0% 20.0% 25.0%
Peer IPeer SPeer RPeer FPeer PPeer KPeer H
35th Percent ilePeer QPeer OPeer C
50th Percent ilePARKER
Peer NPeer APeer DPeer E
75th Percent ilePeer LPeer JPeer BPeer MPeer G
Sales Growth Compared to Peers
Parker
13.3%

58
#1 Market Position
Profitable Growth
59
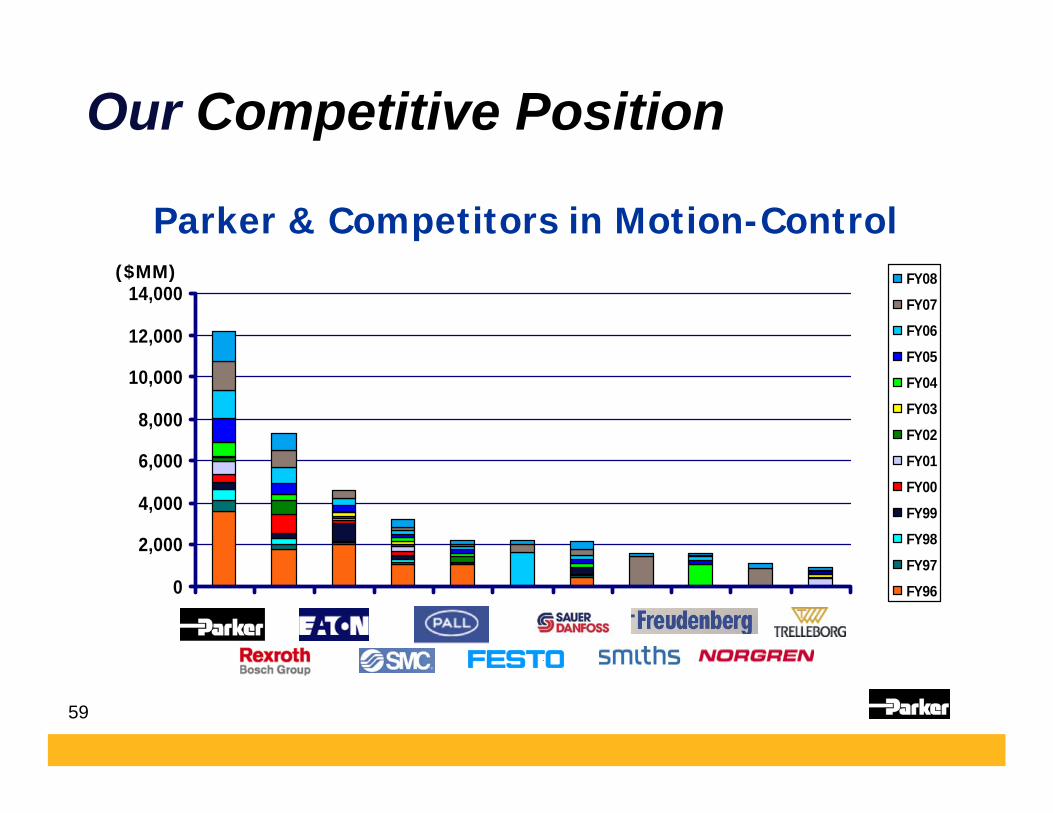
0
2,000
4,000
6,000
8,000
10,000
12,000
14,000FY08FY07FY06FY05FY04FY03FY02FY01FY00FY99FY98FY97FY96
Parker & Competitors in Motion-Control($MM)
Our Competitive Position
60
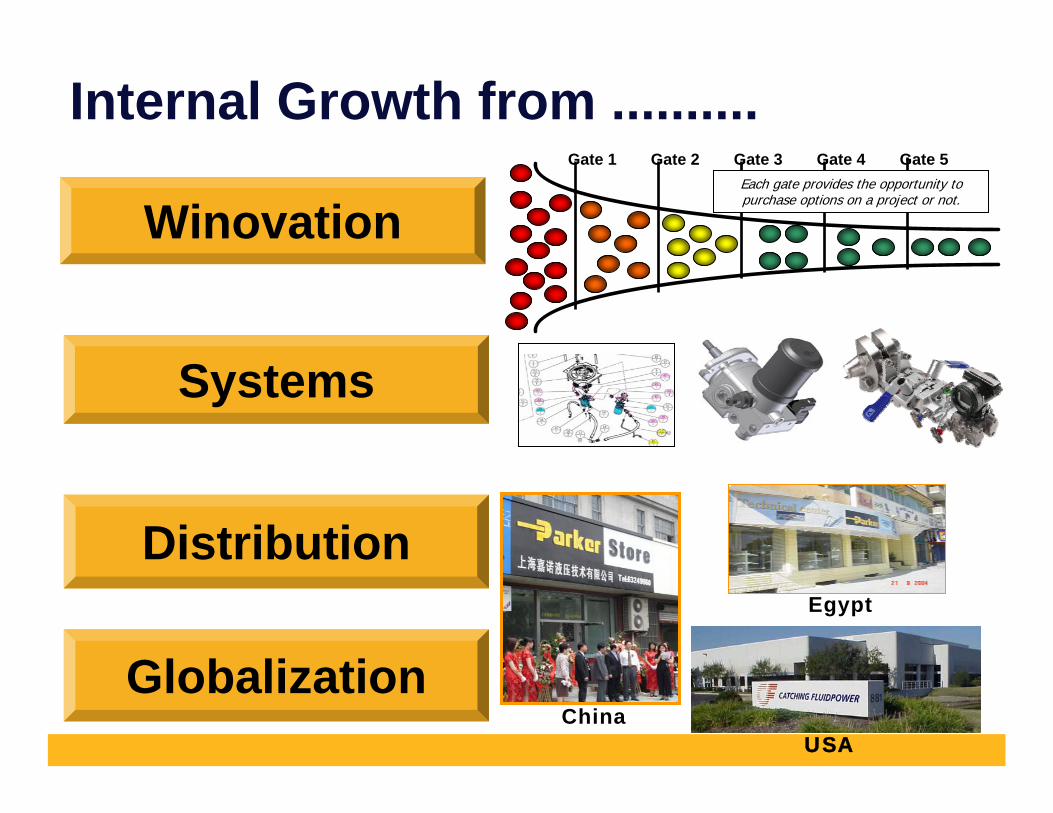
Internal Growth from ..........
Winovation
Systems
Distribution
Gate 1 Gate 2 Gate 3 Gate 4 Gate 5Each gate provides the opportunity to purchase options on a project or not.
ChinaUSA
Egypt
Globalization

61
Globalization
Growth through:
62
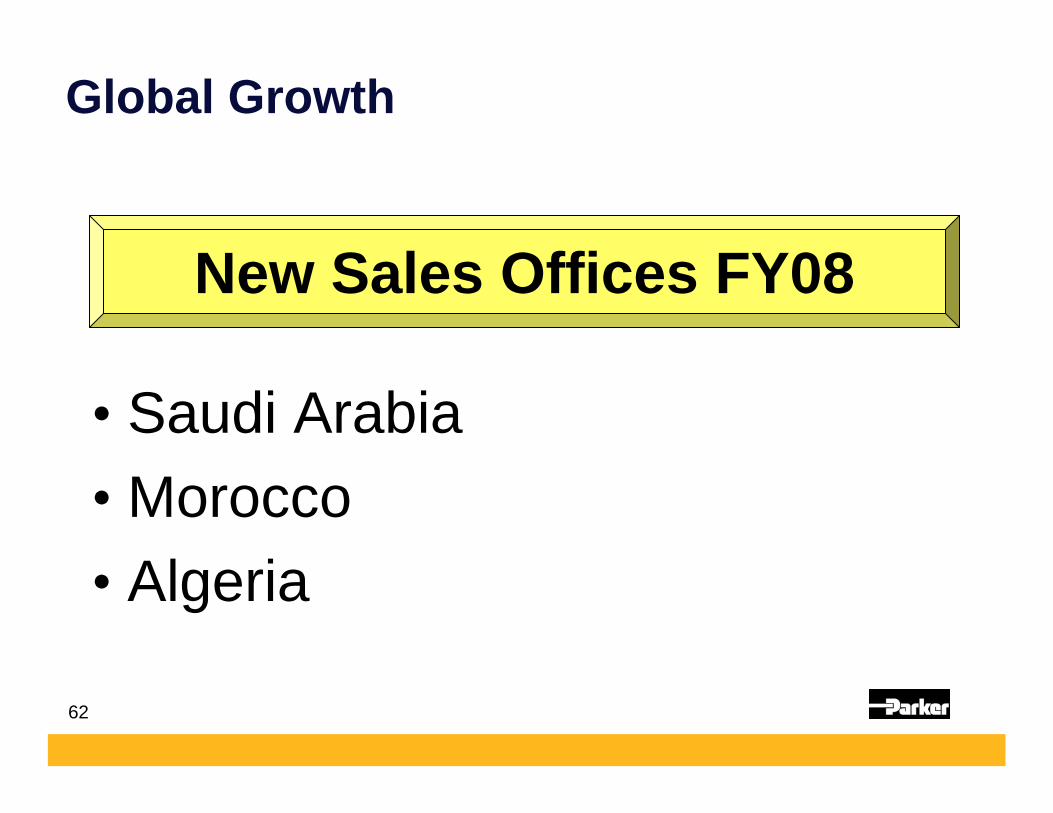
Global Growth
• Saudi Arabia• Morocco• Algeria
New Sales Offices FY08

63
Global GrowthEurope-Middle East-Africa
• Russia• Turkey• Dubai• Switzerland
New Sales Companies FY08
64
Asia
Global Growth
65
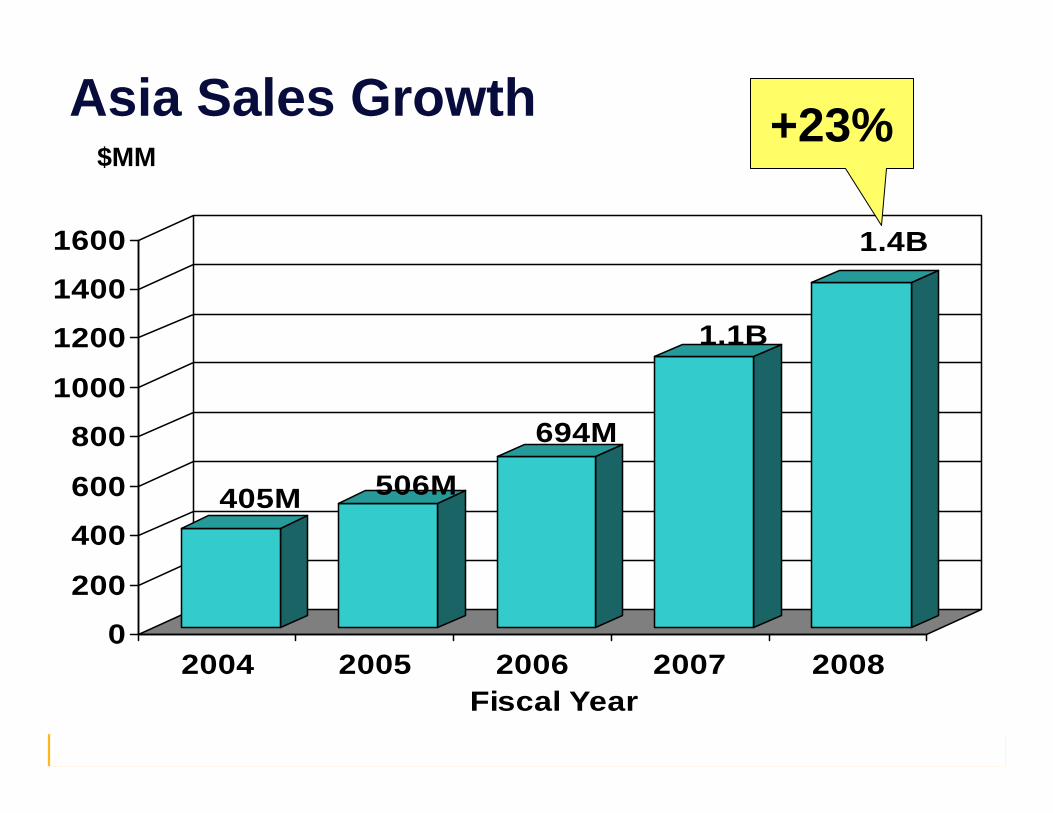
Asia Sales Growth
405M 506M
694M
1.1B
1.4B
0
200
400
600
800
1000
1200
1400
1600
2004 2005 2006 2007 2008Fiscal Year
$MM+23%
66
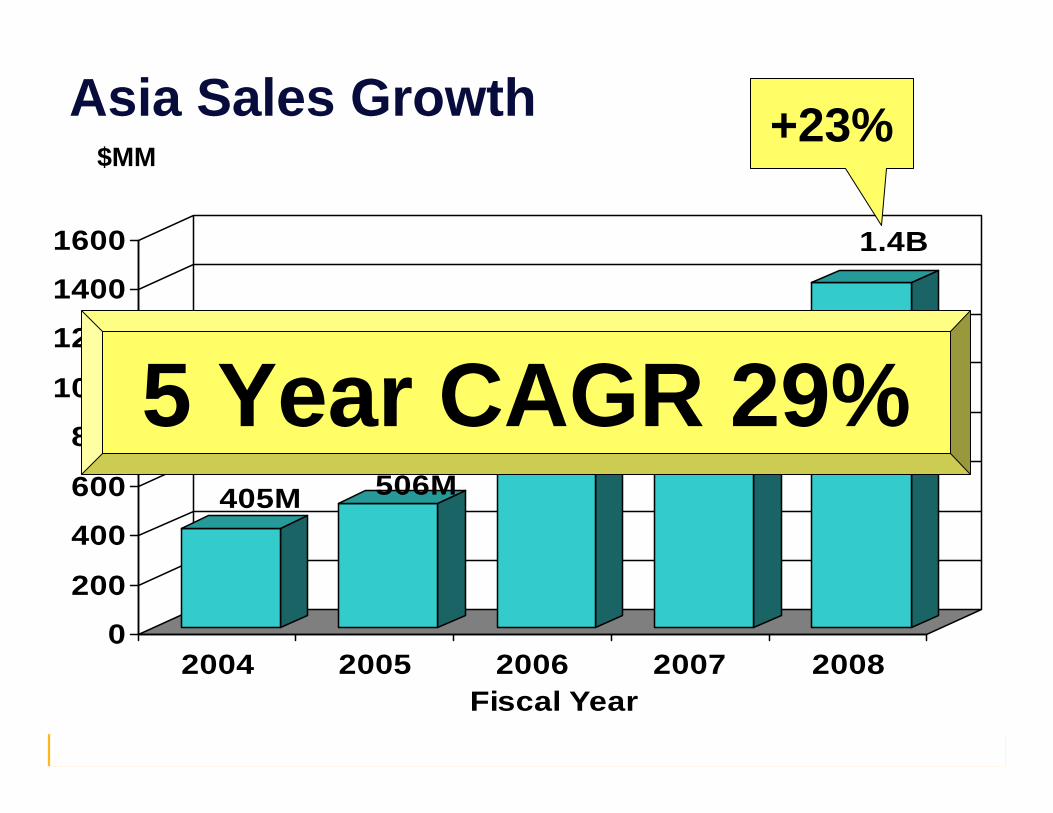
Asia Sales Growth
405M 506M
694M
1.1B
1.4B
0
200
400
600
800
1000
1200
1400
1600
2004 2005 2006 2007 2008Fiscal Year
$MM+23%
5 Year CAGR 29%
67
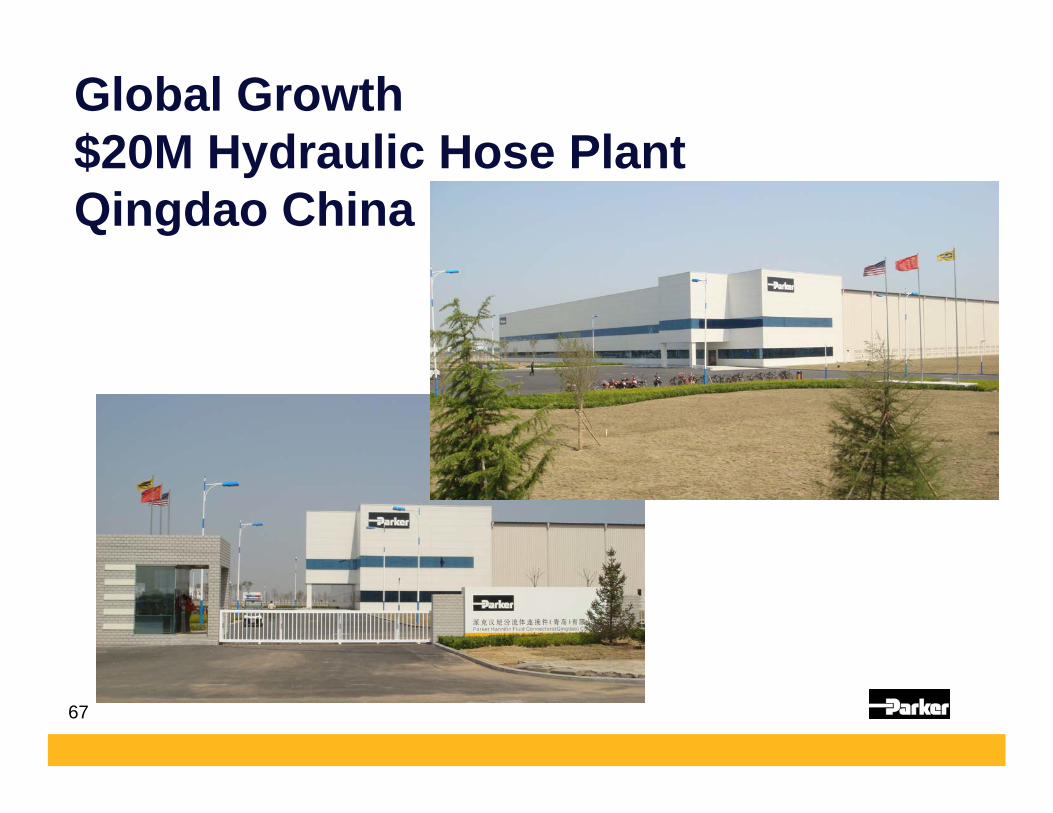
A rendering a year ago!
Global Growth$20M Hydraulic Hose PlantQingdao China

68
Global GrowthFY08 Major AccomplishmentsQingdao China Greenfield Hydraulic Hose Plant

69
Global GrowthShanghai China Filtration
• New leased factory)• 130,000 sq. ft.• Move in: Nov 08• Revenue: $15M in FY09
70
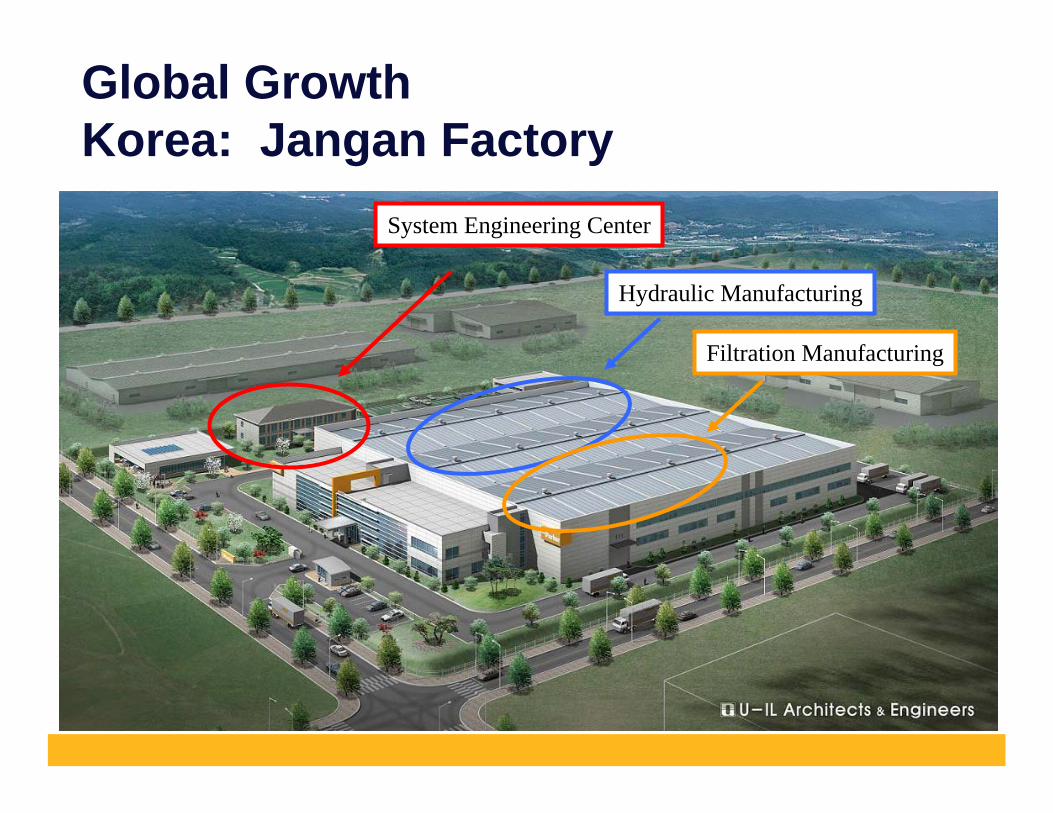
System Engineering Center
Hydraulic Manufacturing
Filtration Manufacturing
Global GrowthKorea: Jangan Factory
71
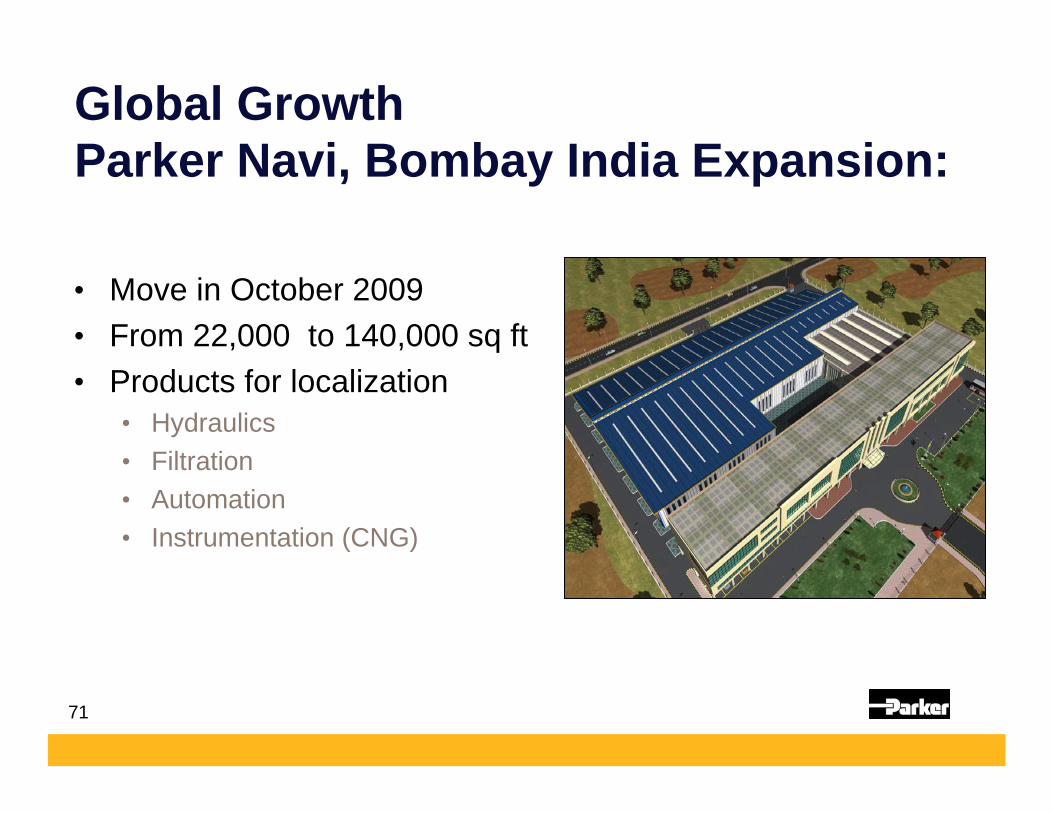
Global GrowthParker Navi, Bombay India Expansion:
• Move in October 2009• From 22,000 to 140,000 sq ft• Products for localization
• Hydraulics• Filtration• Automation• Instrumentation (CNG)
72
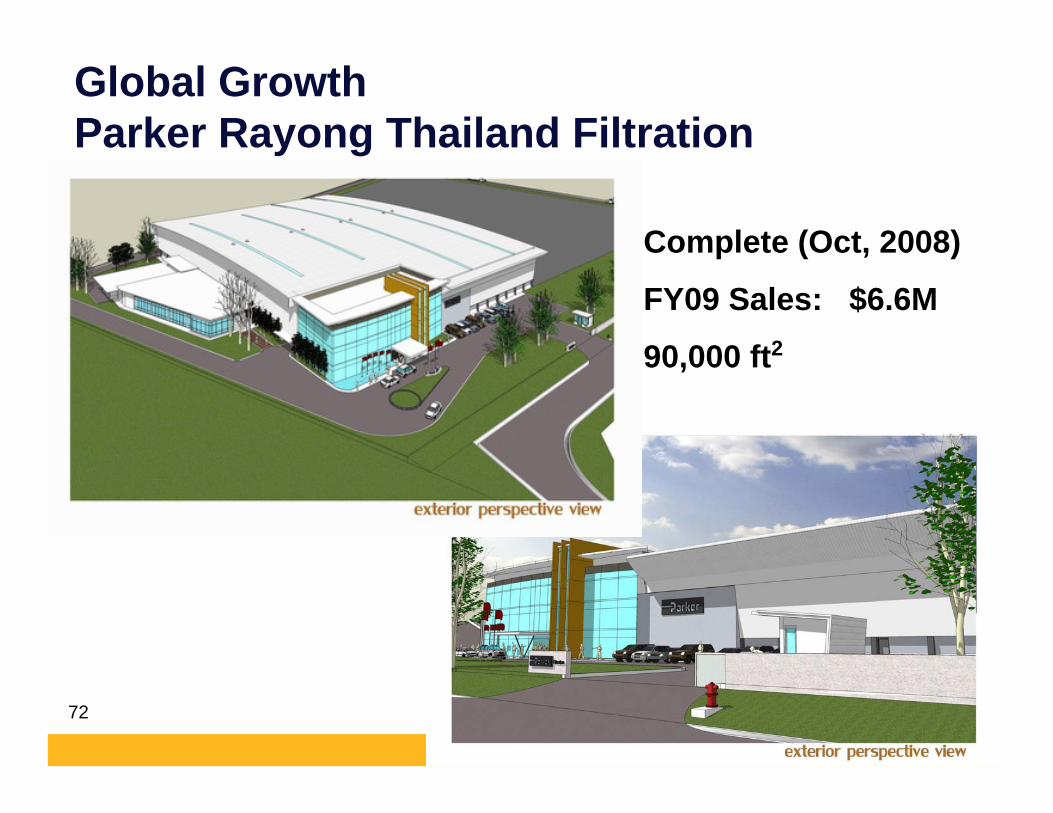
Global GrowthParker Rayong Thailand Filtration
Complete (Oct, 2008)
FY09 Sales: $6.6M
90,000 ft2

73
Incubator Update -Low Cost Country
Production
Growth throughStrong Distribution
Profitable Growth
74
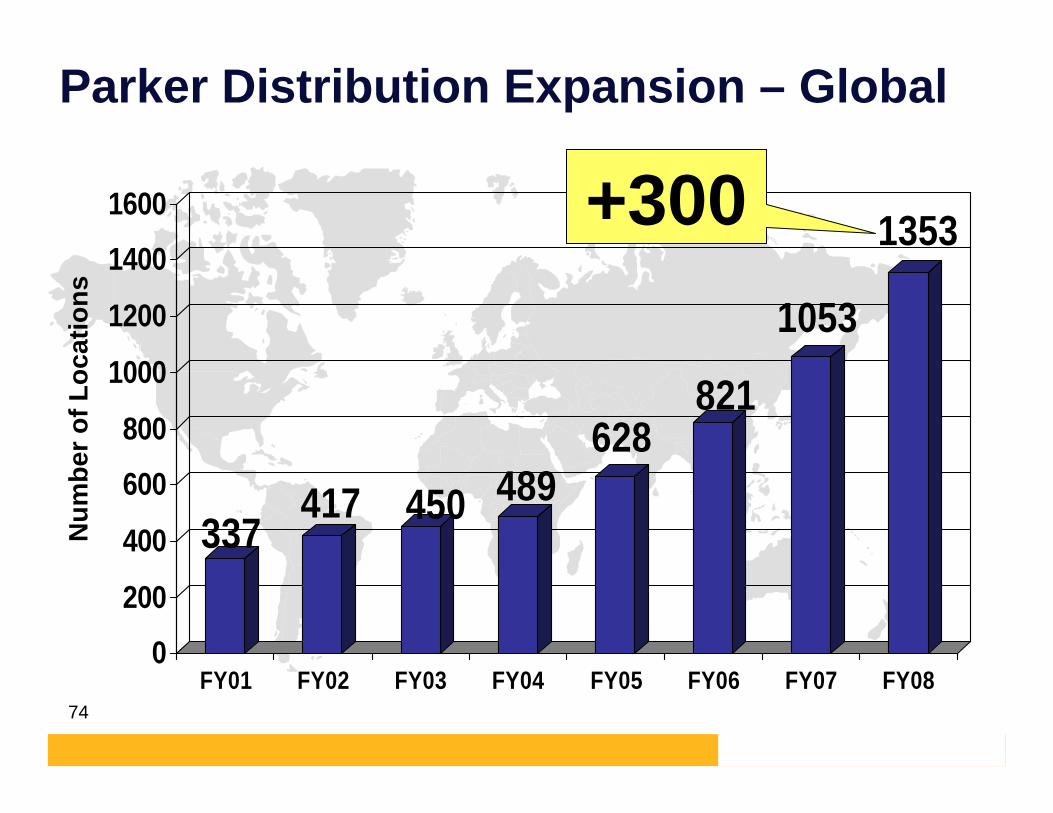
Parker Distribution Expansion – Global
8040
138
212
251
337417 450 489
628821
1053
1353
0
200
400
600
800
1000
1200
1400
1600
FY01 FY02 FY03 FY04 FY05 FY06 FY07 FY08
+300
Num
ber o
f Loc
atio
ns
75
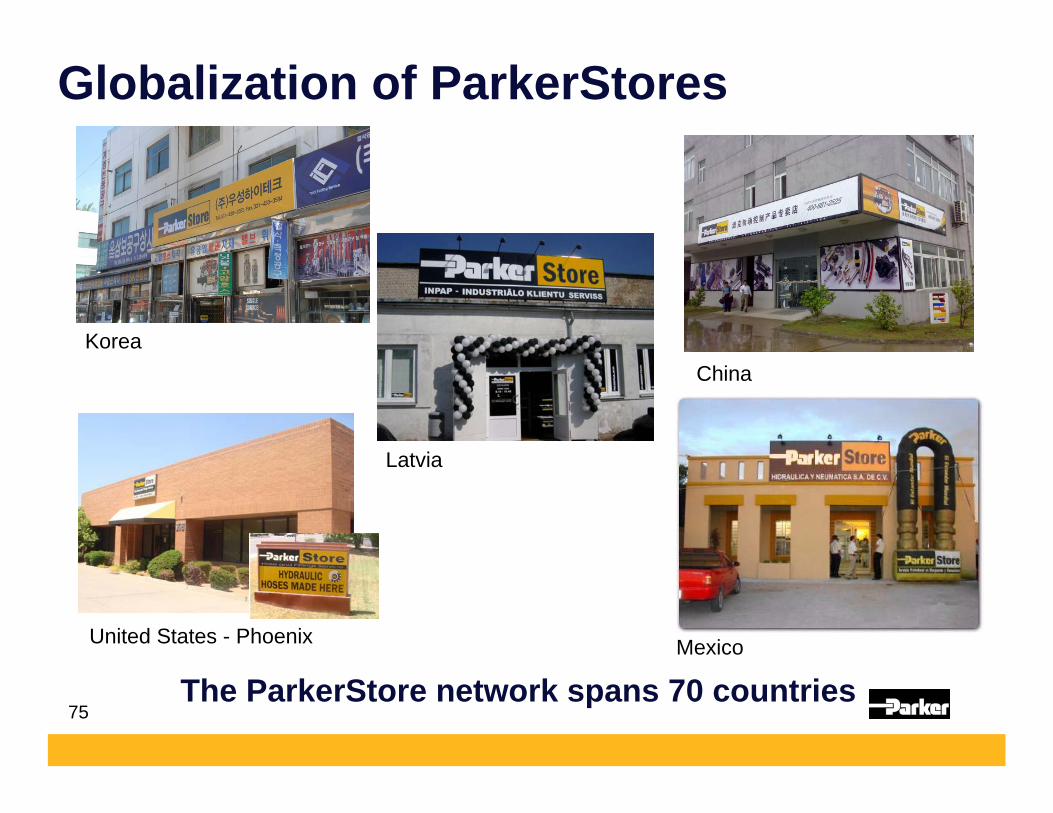
Globalization of ParkerStores
KoreaChina
United States - Phoenix
Latvia
The ParkerStore network spans 70 countriesMexico

76
FY20091st Quarter Results
Fiscal Year 2009

77
Record Quarter !!
FY09 1st Quarter
78
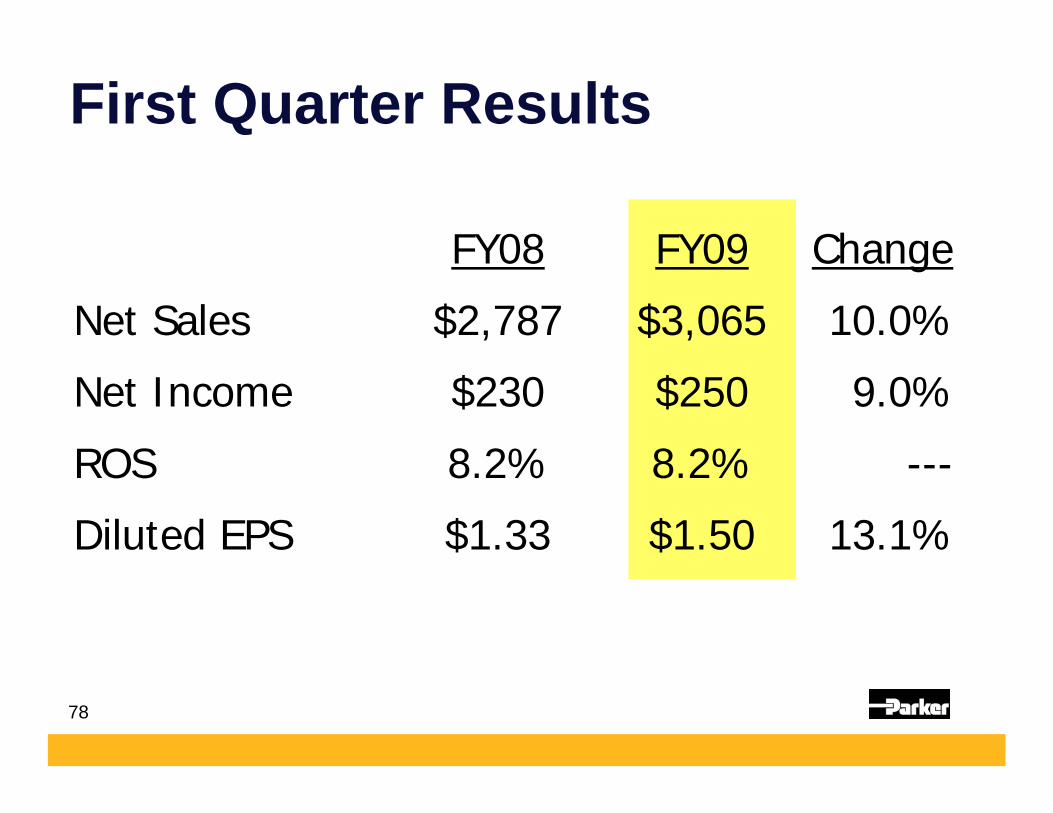
First Quarter Results
FY08 FY09 Change
Net Sales $2,787 $3,065 10.0%
Net Income $230 $250 9.0%
ROS 8.2% 8.2% ---
Diluted EPS $1.33 $1.50 13.1%

79
FY2009 Outlook

80
Parker’s New Order Rates1st Quarter FY09
Aerospace 9%Industrial North America 2%Industrial International -4%Climate & Industrial Control 5%
Total 1%

81
PMI Last 12 Months
50.049.6
48.6
50.2
43.5
48.3
50.0
48.4
50.7
48.6
50.4 49.9
42
43
44
45
46
47
48
49
50
51
52
53
54
55
Oct Nov Dec Jan '08 Feb Mar Apr May Jun Jul Aug Sep
ISM Index SummaryPrevious Month Comparison

82
0
1
2
3
4
5
6
Federal Reserve Discount Rates
Fed cuts key rateRecession Zone
1.5%
2003 2004 2005 2006 2007 2008
83
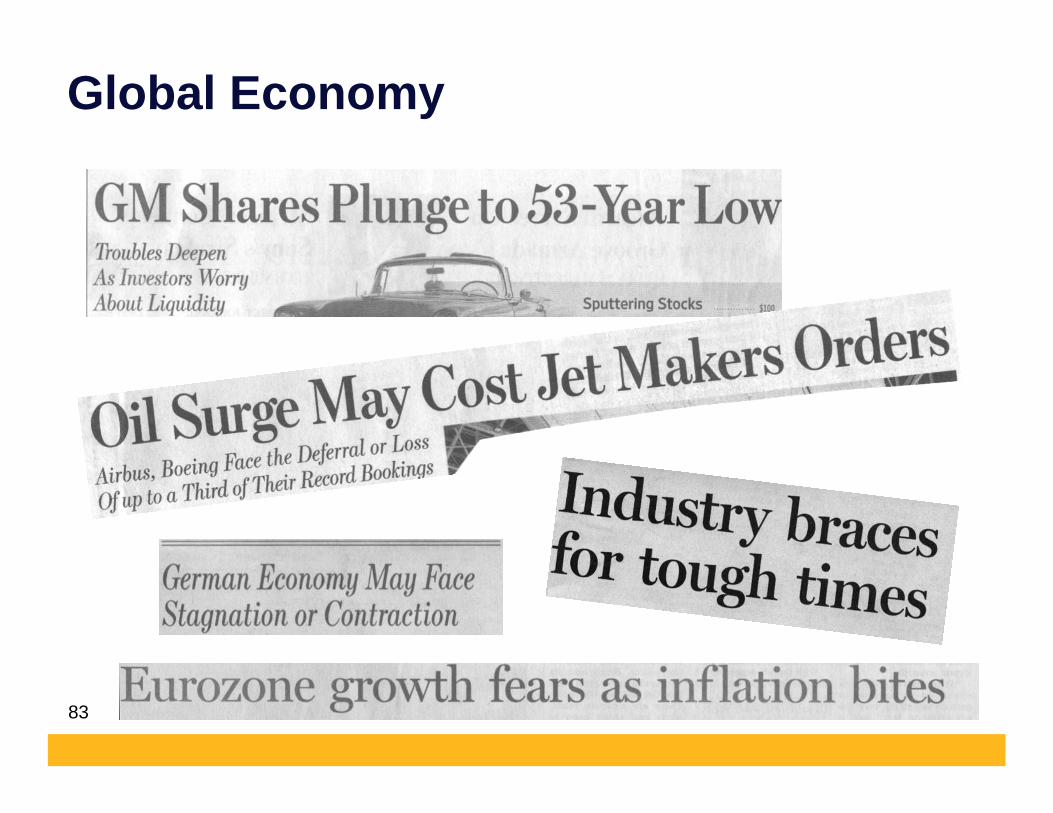
Global Economy
84
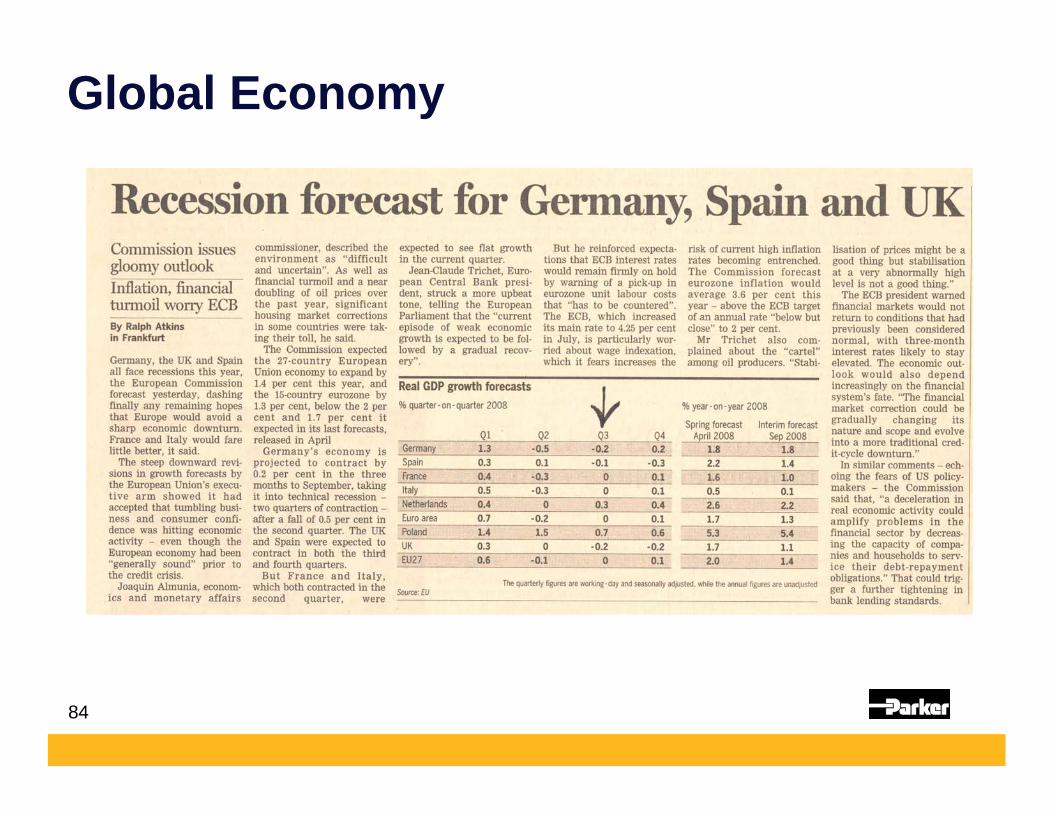
Global Economy

85
Global Economy
Real GDP growth forecasts
Spring forecast Interim forecastQ1 Q2 Q3 Q4 Apr-08 Sep-08
Germany 1.3 -0.5 -0.2 0.2 1.8 1.8Spain 0.3 0.1 -0.1 -0.3 2.2 1.4France 0.4 -0.3 0.0 0.1 1.6 1.0Italy 0.5 -0.3 0.0 0.1 0.5 0.1Netherlands 0.4 0.0 0.3 0.4 2.6 2.2Euro area 0.7 -0.2 0.0 0.1 1.7 1.3Poland 1.4 1.5 0.7 0.6 5.3 5.4UK 0.3 0.0 -0.2 -0.2 1.7 1.1EU27 0.6 -0.1 0.0 0.1 2.0 1.4
Source: EUThe quarterly figures are working - day and seasonally adjusted, while the annual figures are unadjusted
% year - on - year 2008% quarter - on - quarter 2008
86
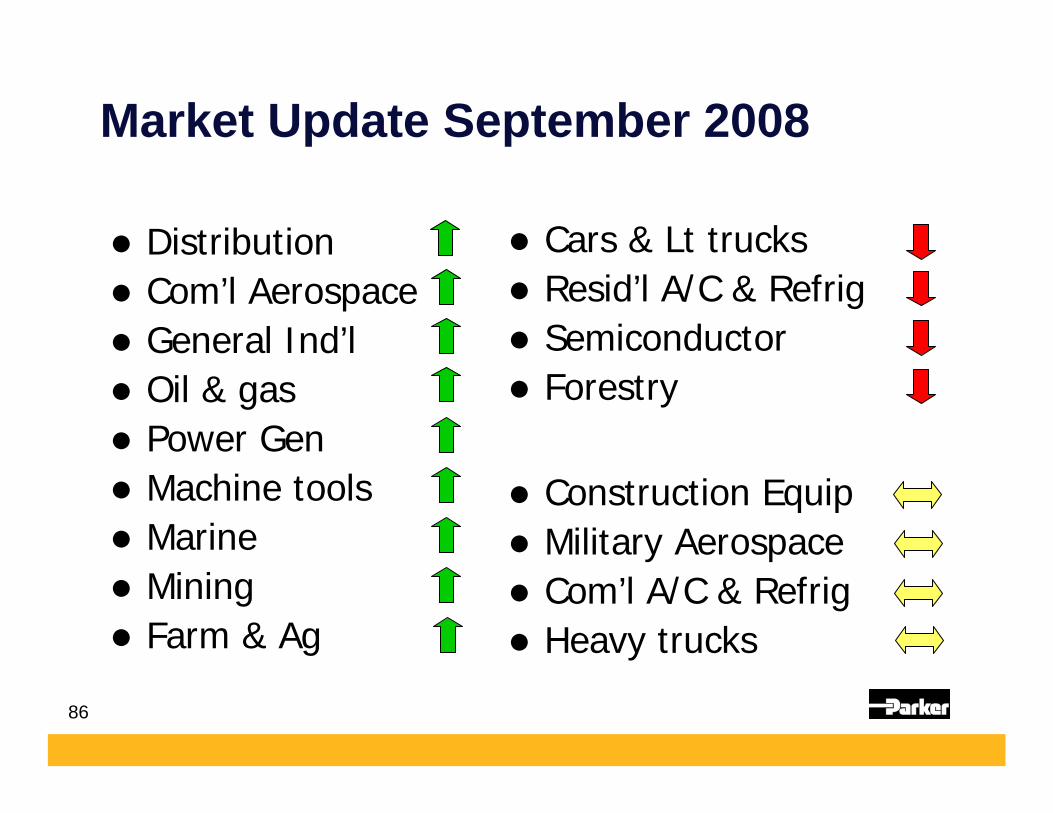
DistributionCom’l AerospaceGeneral Ind’l Oil & gasPower GenMachine toolsMarineMiningFarm & Ag
Cars & Lt trucksResid’l A/C & RefrigSemiconductorForestry
Construction EquipMilitary AerospaceCom’l A/C & RefrigHeavy trucks
Market Update September 2008

87
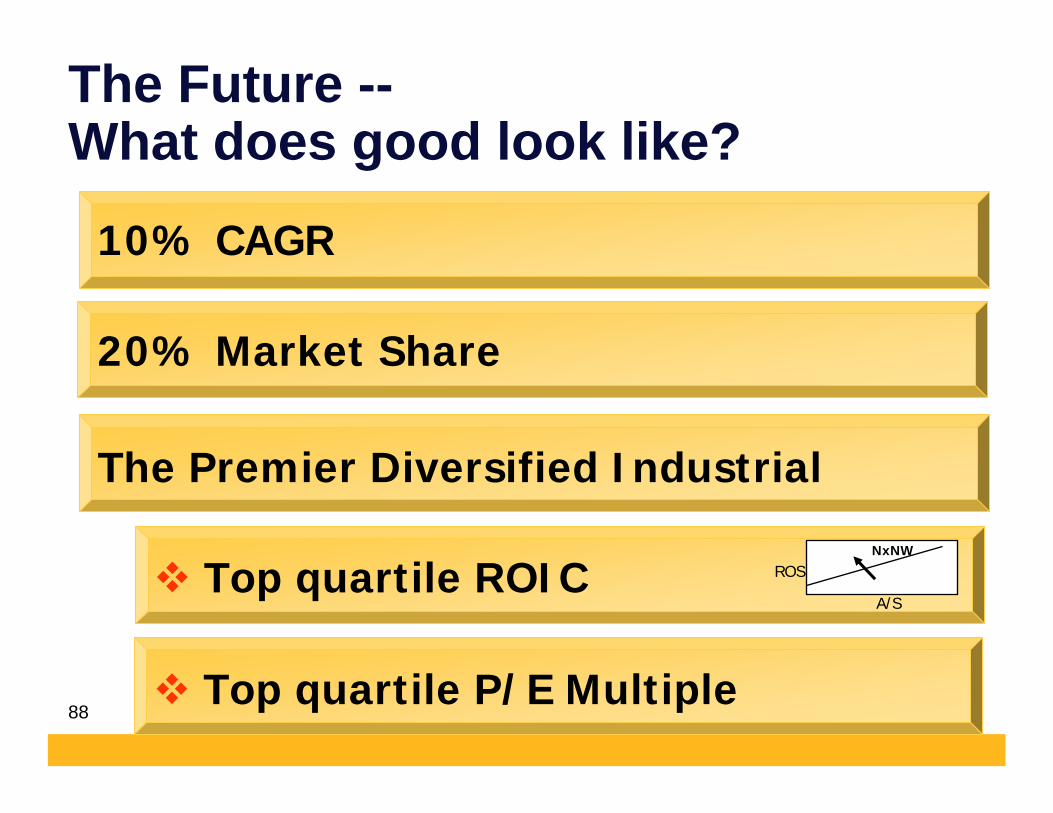
What Does GoodLook Like ?
The Future
88
20% Market Share
Top quartile ROIC
The Premier Diversified Industrial
A/S
ROSNxNW
Top quartile P/E Multiple
10% CAGR
The Future --What does good look like?

89