Embed Size (px)
Citation preview

The Role of Public Parks and Recreation in Urban Area Homeland Security Strategies
Disaster Reduction Planning for Recreation Areas via Cascading Models
Emergency Managemant Capacity Building: Park and Recreation Professionals as Volunteer Managers in Cross-systems Collaboration
Continuity of Operations Plans: Maintaining Essential Agency Functions When Disaster Strikes
Effect of Staged Practices and Motivational Climate on Goal Orientation and Sportsmanship in Community Youth Sport Experiences
Assessing Recreation Impacts to Cliffs in Shenandoah National Park: Integrating Visitor Observation with Trail and Recreation Site Measurements
Working with Diverse Youth: Guidelines for Achieving Youth Cultural Competency in Recreation Services
Processes and Outcomes of an After-School Program for Adolescent Girls
Volume 25 • Number 1 • Spring 2007
of PARK and RECREATIONADMINISTRATIONA publication of the American Academy for Park and Recreation AdministrationJO
URNA
L

THE JOURNAL
The Journal of Park and Recreation Administration is the official publication of the American Acad-emy for Park and Recreation Administration. The Journal was established by the Academy to bridge the gap between research and practice for administrators, educators, consultants, and researchers.
The Journal provides a forum for the analysis of management and organization of the delivery of park, recreation, and leisure services. The Journal will publish distinguished original manuscripts that will do the following:
• move theoretical management concepts forward in the field of park and recreation administration; and• provide clear implications of theory and research for problem solving and action in park and recreation organizations.
Subscription inquiries: Manuscript inquiries: Journal of Park and Dr. James A. Busser Recreation Administration Professor, Associate Dean for Academic Affairs Subscriber Services University of Nevada, Las Vegas Sagamore Publishing Department of Recreation and Sport Management 804 N. Neil St. 4505 Maryland Parkway Box 6013 Champaign, IL 61820 Las Vegas, NV 89154-6013 (800) 327-5557 Phone: (702) 895-0942 www.sagamorepub.com Email: [email protected]
THE ACADEMY
The American Academy for Park and Recreation Administration is an organization of distinguished practitioners and scholars committed to the advancement of park and recreation administration. Elec-tion to the Academy is based on recognized distinction as a professional park and recreation adminis-trator or scholar and an active commitment to the objectives of the Academy. Through the Journal of Park and Recreation Administration and other projects, the Academy encourages scholarly efforts by both practitioners and educators to develop and to enhance the practice of administration in the park, recreation, and leisure service fields.
The Journal of Park and Recreation Administration (ISSN 0735-1968) is published by the Ameri-can Academy for Park and Recreation Administration (www.rpts.tamu.edu), Sagamore Publishing, 804 N. Neil St., Champaign, IL 61820. Third-class postage is paid at Champaign, Illinois.
UNIVERSITY OF NEVADA, LAS VEGAS
UNLV is located in the vibrant and dynamic city of Las Vegas and surrounded by the Mojave Desert. Serving 28,000 students, UNLV is emerging as a premier urban university. Located within the world renowned College of Hotel Administration, the Department of Recreation and Sport Management is comprised of eight faculty members with a student body of 200 undergraduates majoring in Recreation Management and 35 graduate students pursuing a master’s degree in Sport and Leisure Service Man-agement. The academic programs are integrated with opportunities in the greater Las Vegas Valley for research and professional experiences in all sectors of the recreation and sport industry. The college and department furnish space, clerical assistance, and the editor’s support for publishing the Journal.
ix
JOURNAL OF PARK AND RECREATION ADMINISTRATIONVOLUME 25, NUMBER 1, WINTER 2007
Contents
Regular Articles Off the Beaten Track: Messages as a Means of Reducing Social Trail Use at St. Lawrence Islands National Park ........................................................................... 1 Lori E. A. Bradford, Norman McIntyre
Intercultural Communication Competence and Conflict Negotiation Strategies: Perceptions of Park Staff and Diverse Park Users .......................................................22 Carla Almeida Santos, Samantha Rozier
Measuring the Costs of Employee Turnover in Illinois Public Park and Recreation Agencies: An Exploratory Study ................................................................50 William R. McKinney, Kenneth R. Bartlett, Michael A. Mulvaney
Factors Affecting the Upward Mobility of African Americans in the Young Men’s Christian Association Movement ....................................................................... 75 Corliss Wilson Outley, Willie Dean
Promoting Sportsmanship in Youth Basketball Players: The Effect of Referee’s Prosocial Behavior Techniques ....................................................................................96 Skye G. Arthur-Banning, Karen Paisley, Mary Sara Wells
Special Articles A City’s Strategy to Fund a Golf Course by Developing Homes on Proximate Property ................................................................................................... 115 William J.Boswell, John L. Crompton
An Assessment of GPS and GIS in Recreational Tracking .......................................... 128 P. C. Lai, C. L. Li, K. W. Chan, K. H. Kwong
Resource Reviews Recreation and Youth Development, Edited by Peter A. Witt and Linda L. Caldwell .... 140 Karen Paisley
Wildland Recreation Policy: An Introduction (2nd Edition), by J. Douglas Wellman and Dennis B. Propst .................................................................................. 142 Harry C. Zinn
Guidelines for Authors ............................................................................................... 145
Journal of Park and Recreation Administration Volume 25, Number 1Spring 2007 pp. 128-139
An Assessment of GPS and GIS in Recreational Tracking
P.C. LaiC.L. LiK.W. ChanK.H. Kwong
EXECUTIVE SUMMARY: This paper presents an assessment of the effective-ness of using Personal Data Assistants (PDA) equipped with Geographic Information System (GIS) and Global Positioning System (GPS) in field data collection of tourist movement. On-site questionnaire survey and GPS tracking of the leisurely walk of selective groups of park visitors were conducted between August 2005 and January 2006 at various entry points to the Pokfulam Country Park in Hong Kong. The results were exam-ined by means of mapping, 3D visualization, and statistical analyses. Our results indicated that the time of survey and spatial locations influenced the reception of GPS signals. Environmental factors such as terrain, built structures, and tree canopies played an important role in the positioning accuracy. We managed to illustrate a workable methodology for tracking the flow of tourists and made recommendations on possible uses of such a practice in tourism planning and management.
KEYWORDS: Geographic Information System (GIS); Global Positioning System (GPS); GPS Tracking; Understanding Tourist Flows
AUTHORS: The authors are with the Department of Geography, The Uni-versity of Hong Kong, Pokfulam Road, Hong Kong. Lai is an Associate Professor, Phone: (852) 2859-2830, Email: [email protected].
ACKNOWLEDGEMENT: We are indebted to the Hui-Oi-Chow Trust Fund for their support in this pilot survey/study to fine tune the methodological approach. We also thank students of the Y2005/06 course on “Introduc-tion to GIS” for data collection and processing.
129
Introduction
GPS and GIS in Tracking Analysis Country parks offer a range of activities (leisure walking, hiking, fitness ex-
ercises, barbecuing, mountain biking, family picnics, and camping) for the enjoy-ment of visitors. Of the 15 million visitors to Hong Kong in 2003, 12.1 million representing approximately 81 percent visited at least one of 23 country parks dur-ing their stay (Hong Kong Agriculture, Fisheries and Conservation Department, 2004). Where is the best location to set up a new recreation facility? Which types of recreation facilities are in demand? Who are the people living nearby and who may come out to use it? Recreation and park administrators have so many questions and uncertainties to be answered in the process of making such a decision.
Understanding the mechanism of individual behavior in a country park is es-sential for park planning and policy (Crompton, et.al., 1991; Nicholls and Sha-fer, 2001). Geographic Information System (GIS) and Global Positioning System (GPS) are very effective tools for automated detection of the location of a target (e.g. a tourist on the move) to collect location-based information (Nedovic-Budic, 1999; Lee and Graefe, 2004; Meritxell, 2005). This form of innovative technology provides ambient intelligence to personalize and localize tourists’ leisure activities. The path of track travel and visitation to points of interest to an individual can be mapped. Location awareness can lead to the discovery of service inefficiencies, re-sulting in opportunities to restructure some and discontinue others, in the hope of providing sufficient and equitable park and recreation services.
GIS application in parks and recreation is not new, but, coupled with the pow-ers of related computer technologies such as the GPS, the use of GIS is stepping into a new era. Wicks, Backman, Allen and Blaricom (1993) were the first to thoroughly discuss trends of GIS applications in the field of park and recreation management. In the early 90s, it was noted that “extremely little has been done in urban recreation analysis in applications of GIS except straightforward applications for displaying location of facilities and plotting general respondents to a survey,” (Devine and Kuo, 1991). Later, integrating GIS with spatial statistics such as the kriging method enables users to quantify the quality of surfaces (McCoy and Johnston, 2001). More recently, Knox (2004) investigated terrain visualization and virtual fly-through in tourism conservation using GIS.
GIS has great potential to play an important role in managing, planning, mar-keting and evaluating park and recreation services. However, useful technology does not necessarily mean useable technology. This paper explores how GIS can assist in understanding the flows of tourists, both individually and as an aggregate. A series of maps were produced showing the results of the tracking survey and the distribution of various visitor groups. This paper provides illustrations of how indi-vidual and aggregate flows can be visualized and queried to give significant extra knowledge on tourist behavior.
Field GIS devices have proved themselves to be accurate and convenient data collectors while increasing productivity, and ensuring data integrity. However, Hong Kong is known for its rugged terrain and high rises. In the Pokfulam Country Park
130
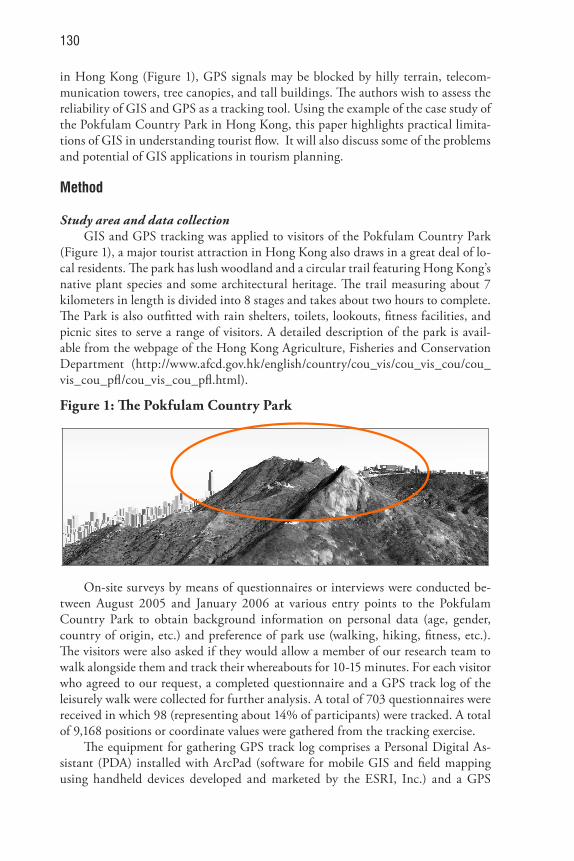
in Hong Kong (Figure 1), GPS signals may be blocked by hilly terrain, telecom-munication towers, tree canopies, and tall buildings. The authors wish to assess the reliability of GIS and GPS as a tracking tool. Using the example of the case study of the Pokfulam Country Park in Hong Kong, this paper highlights practical limita-tions of GIS in understanding tourist flow. It will also discuss some of the problems and potential of GIS applications in tourism planning.
Method
Study area and data collectionGIS and GPS tracking was applied to visitors of the Pokfulam Country Park
(Figure 1), a major tourist attraction in Hong Kong also draws in a great deal of lo-cal residents. The park has lush woodland and a circular trail featuring Hong Kong’s native plant species and some architectural heritage. The trail measuring about 7 kilometers in length is divided into 8 stages and takes about two hours to complete. The Park is also outfitted with rain shelters, toilets, lookouts, fitness facilities, and picnic sites to serve a range of visitors. A detailed description of the park is avail-able from the webpage of the Hong Kong Agriculture, Fisheries and Conservation Department (http://www.afcd.gov.hk/english/country/cou_vis/cou_vis_cou/cou_vis_cou_pfl/cou_vis_cou_pfl.html).
On-site surveys by means of questionnaires or interviews were conducted be-tween August 2005 and January 2006 at various entry points to the Pokfulam Country Park to obtain background information on personal data (age, gender, country of origin, etc.) and preference of park use (walking, hiking, fitness, etc.). The visitors were also asked if they would allow a member of our research team to walk alongside them and track their whereabouts for 10-15 minutes. For each visitor who agreed to our request, a completed questionnaire and a GPS track log of the leisurely walk were collected for further analysis. A total of 703 questionnaires were received in which 98 (representing about 14% of participants) were tracked. A total of 9,168 positions or coordinate values were gathered from the tracking exercise.
The equipment for gathering GPS track log comprises a Personal Digital As-sistant (PDA) installed with ArcPad (software for mobile GIS and field mapping using handheld devices developed and marketed by the ESRI, Inc.) and a GPS
Page 14
Figure 1. The Pokfulam Country Park
Figure 2. Countries of origin of sampled visitors to the Pokfulam Country Park.
Figure 1: The Pokfulam Country Park
131
receiver. ArcPad provides mapping, GIS, and GPS data collection for field users. Position coordinates (with readings in longitude, latitude, and altitude) are captured in real time and recorded as a track log containing points referred to as waypoints or polylines with positions fixed at four-to-six second time interval. In addition, each positional reading has an associated accuracy value known as Positional/Percent Dilution of Precision (PDOP). PDOP is a measure of the geometrical strength of the GPS satellite configuration. PDOP less than four gives the best accuracy (i.e. under one meter positional displacement). PDOP of between four and eight signals acceptable accuracy while greater than eight indicates poor accuracy.
Mapping and statistical analysesTwo kinds of visualization were attempted in this study: 2D plain maps and 3D
VRML (Virtual Reality Modeling Language) models. The maps and the VRML model were created with GIS. The VRML model is an interactive display which supports zooming, panning, and rotating to facilitate close-up examination of the walking/hiking activities. The questionnaires were analyzed and a map drawn to indicate the places of origin of the subjects being interviewed. The track log data were subdivided by cultural groups (Asian, Mainland, Local, and Western) to re-veal possible spatial behavioral patterns. The Asian subgroup (excluding Mainland China and Hong Kong) included visitors from Taiwan, Singapore, South Korea, Japan, and the Philippines. These patterns must be interpreted against measures of positional data accuracy as indicated by PDOP values.
PDOP measures of signal strengths and reliability will be examined statistically for possible differences according to two specifications: (1) by times of the day when positional data were recorded, and (2) by the spatial distribution of captured loca-tions within eight partitions (N, NE, E, SE, S, SW, W, and NW) of the study area. The null hypothesis for specification one presupposes that there is no difference in PDOP values at different times of the day. The null hypothesis for specification 2 assumes no difference in the PDOP values by spatial variation.
Through mobility of selected park visitors, we wish to identify by means of mapping and spatial analyses whether there exists differences in spatial behaviors of different cultural groups. At the same time, we wish to ascertain the utility of the GPS tracking for real time field data collection. Our mapped results will comple-ment our statistical findings in examining our hypotheses. Our research will also provide recommendations for acceptable practices of using GPS in field data collec-tion in Hong Kong. Results and Discussion
From the 703 survey records, we were able to map visitors to the Pokfulam Country Park by countries of origin (Figure 2). While China and local residents comprised the majority of the visitors, there were altogether 24 countries represent-ed in the samples collected. The sampled visitors were reclassed into four cultural groups (Asian, Mainland, Local, and Western) for more detailed analyses.

132
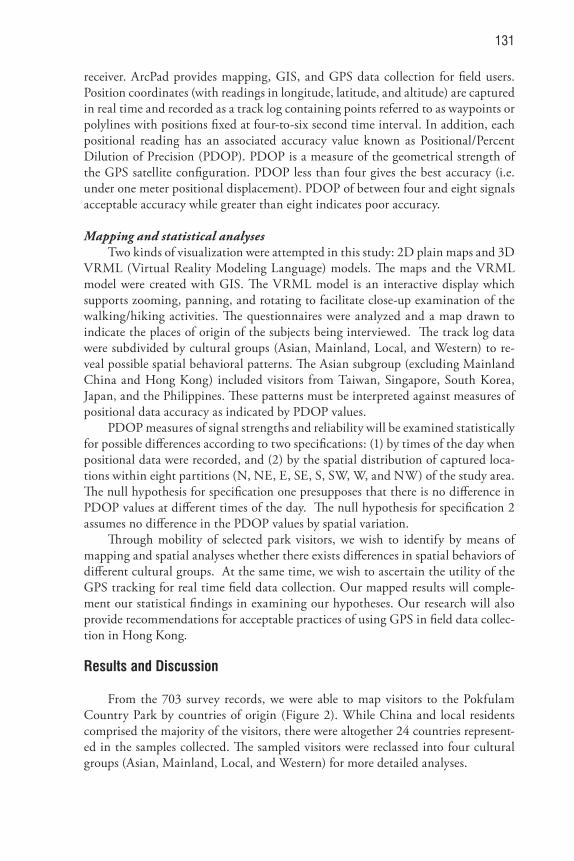
Table 1 shows the summary statistics of the GIS tracking. We were not able to place 15 percent of the 98 track logs into the four cultural groups because the visitors had multiple or did not indicate places of origin. GPS track logs for the four cultural groups were plotted on a VRML model and separately on four plain maps (Figure 3). As can be seen from the VRML model, the Pokfulam Country Park has a circuit trail with two branches to guide visitors in their walks. The visitors rarely (during the time interval of GPS tracking) ventured beyond the designated trails.
The tracking was done between GMT 0430 and 1330 (i.e. 1230 to 2130 Hong Kong time) with 76 percent of the tracking done during 1430-1900 Hong Kong time. 7,143 out of 9,168 PDOP values were less than eight, indicating an accuracy rate of 78 percent. The visual presentation of the track logs of the four cultural groups in Figure 3 revealed some variations in the trails taken. However, given the time limit of 10-15 minute tracking, the results would not be conclusive or meaningful.
Table 1: Summary Statistics of GPS Tracking.
Groups Number of track logs
Average distance (m)
Average time of tracking
Min SecLocal 30 251.393 5 37Mainland 21 344.119 8 49Westerners 21 289.384 6 49Asian 11 262.897 4 55MissingValue 15 378.772 8 29
98
Page 14
Figure 1. The Pokfulam Country Park
Figure 2. Countries of origin of sampled visitors to the Pokfulam Country Park.
Figure 2: Countries of origin of sampled visitors to the Pokfulam Country Park
133
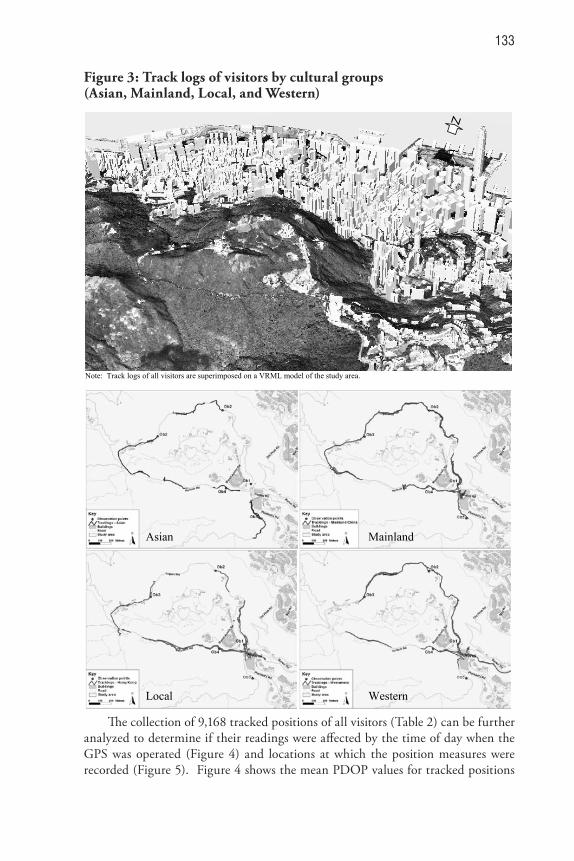
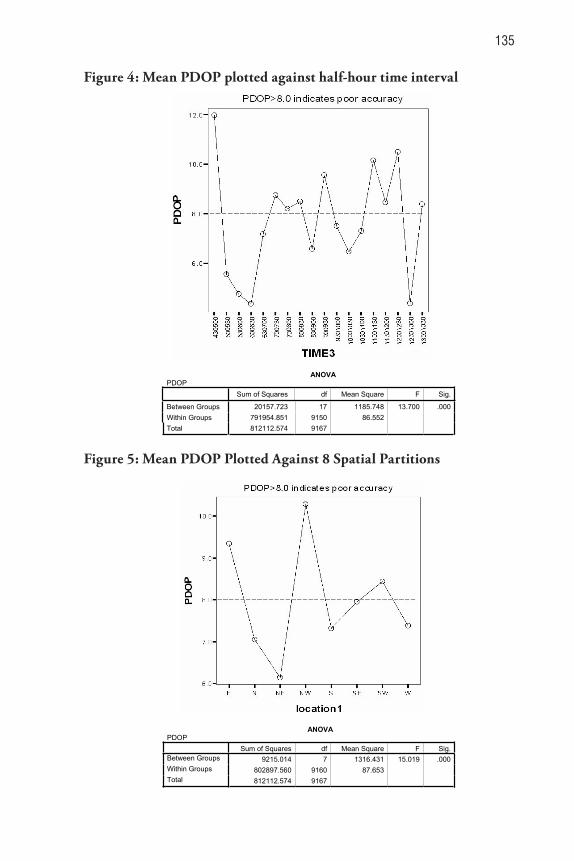
The collection of 9,168 tracked positions of all visitors (Table 2) can be further analyzed to determine if their readings were affected by the time of day when the GPS was operated (Figure 4) and locations at which the position measures were recorded (Figure 5). Figure 4 shows the mean PDOP values for tracked positions
Page 15
Note: Track logs of all visitors are superimposed on a VRML model of the study area.
Figure 3. Track logs of visitors by cultural groups (Asian, Mainland, Local, and
Western)
Asian Mainland
Local Western
Figure 3: Track logs of visitors by cultural groups (Asian, Mainland, Local, and Western)
134
within 18 half-hour time intervals. The statistical test clearly indicates significant between group differences of the mean PDOP values and the time of survey. In other words, the time to commence GPS tracking has a significant influence on the accuracy of the surveyed positions. An astounding 45 percent of the tracked posi-tions were reportedly within the time intervals with mean PDOP values exceeding 8 suggesting large positional displacements.
Table 2: GPS Tracked Positions by Time of Survey and Spatial Variations.
Row subtotal
% row subtotalHK Time GMT N NE E SE S SW W NW
1230-1300 430-500 80 64 144 1.6
1300-1330 500-530 238 238 2.6
1330-1400 530-600 174 174 1.9
1400-1430 600-630 62 175 237 2.6
1430-1500 630-700 735 13 124 53 925 10.1
1500-1530 700-730 48 344 47 439 4.8
1530-1600 730-800 428 113 541 5.9
1600-1630 800-830 85 729 1 38 51 8 912 9.9
1630-1700 830-900 268 219 146 628 1261 13.8
1700-1730 900-930 91 127 443 13 87 8 70 839 9.2
1730-1800 930-1000 209 313 76 235 58 93 150 217 1351 14.7
1800-1830 1000-1030 21 41 98 101 288 549 6.0
1830-1900 1030-1100 81 102 4 187 2.0
1900-1930 1100-1130 96 193 40 329 3.6
1930-2000 1130-1200 186 117 38 131 106 578 6.3
2000-2030 1200-1230 68 134 115 317 3.5
2030-2100 1230-1300 86 86 0.9
2100-2130 1300-1330 61 61 0.7
Cultural Groups N NE E SE S SW W NW
Local 87 204 1623 300 200 300 40 2754 30.0
Mainland 351 1056 318 973 20 146 370 197 3431 37.4
Asian 193 325 43 109 184 8 862 9.4
Western 262 237 195 1105 18 84 24 196 2121 23.1
Column subtotal = 806 1380 717 4026 381 539 878 441
% column subtotal = 8.8 15.1 7.8 43.9 4.2 5.9 9.6 4.8
Note: indicates time slots of poor reception (i.e. mean PDOP > 8.0) indicates cardinal directions of poor reception (i.e. mean PDOP > 8.0) indicates extreme poor reception under the adverse conditions of time of survey
and directional variations; the total amounted to about 10 percent of all 9,168 tracked positions
135
Page 16
ANOVA PDOP
Sum of Squares df Mean Square F Sig.
Between Groups 20157.723 17 1185.748 13.700 .000 Within Groups 791954.851 9150 86.552Total 812112.574 9167
Figure 4. Mean PDOP plotted against half-hour time interval.
Figure 4: Mean PDOP plotted against half-hour time interval
Page 17
ANOVA PDOP
Sum of Squares df Mean Square F Sig. Between Groups 9215.014 7 1316.431 15.019 .000 Within Groups 802897.560 9160 87.653Total 812112.574 9167
Figure 5. Mean PDOP Plotted Against 8 Spatial Partitions.
Figure 5: Mean PDOP Plotted Against 8 Spatial Partitions
136
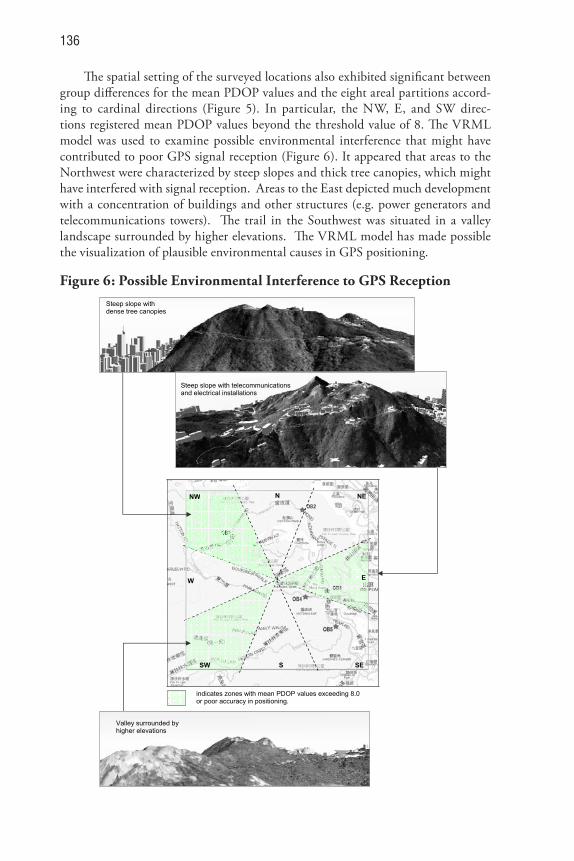
The spatial setting of the surveyed locations also exhibited significant between group differences for the mean PDOP values and the eight areal partitions accord-ing to cardinal directions (Figure 5). In particular, the NW, E, and SW direc-tions registered mean PDOP values beyond the threshold value of 8. The VRML model was used to examine possible environmental interference that might have contributed to poor GPS signal reception (Figure 6). It appeared that areas to the Northwest were characterized by steep slopes and thick tree canopies, which might have interfered with signal reception. Areas to the East depicted much development with a concentration of buildings and other structures (e.g. power generators and telecommunications towers). The trail in the Southwest was situated in a valley landscape surrounded by higher elevations. The VRML model has made possible the visualization of plausible environmental causes in GPS positioning.
Page 18
Figure 6. Possible Environmental Interference to GPS Reception
indicates zones with mean PDOP values exceeding 8.0 or poor accuracy in positioning.
NW
W
SW S SE
E
NEN
Steep slope with dense tree canopies
Steep slope with telecommunications and electrical installations
Valley surrounded by higher elevations
Figure 6: Possible Environmental Interference to GPS Reception
137
Further analyses were done to examine the impacts of time of survey and spa-tial variations had on our tracking results by cultural groups (Table 2). It was esti-mated that 45 percent of all surveyed positions were affected by time of survey and 18.5 percent by spatial variations. Consider both factors, about 10 percent of total tracked positions registered extremely poor accuracy. This result draws caution in the use of GPS positioning in Hong Kong. Our study area is not exemplified by tall high rises but the park trails are amidst trees and undulating terrain. Our results indicated that these environmental factors, in addition to the number of satellites in view, played an important role in the positioning accuracy.
Among the various cultural groups, the westerner’s track seemed to be most inaccurate with 22 percent of its 2,121 sampled positions located in the areas of poor GPS reception. Indeed, Figure 3 showed a branch trail visited only by the western-ers. The trail was nature-based with diverse ecology preferred by western visitors.
Conclusion
Personal Digital Assistants (PDAs) are currently the hardware of choice for field work; however, they were not originally designed with field work in mind. There are so many PDAs and types of GIS field software on the market today that it is extremely important to conduct initial research to ensure the combination is appro-priately suited for the activity. Besides, GPS uses high frequency radio waves which are subject to environmental interferences so steps must be taken to minimize the impacts on data quality (Office of Environmental Information, 2003). In general, GIS field software and GPS operation can be learnt and easy to customize, making them an essential tool for field based data collection.
Besides technical limitations, such as storage capability, operating system, and output file formats, there are currently operational deficiencies that may restrict field GIS/GPS capabilities. For example, the equipment must be operated by trained staffs who accompany visitors in their trips. Such an arrangement may not appeal to some visitors resulting in a high rejection rate. Given manpower constraints, it is important to balance tracking time against sample size. Also of significance is the time of day of the survey as certain time slots are prone to poor reception of GPS signals. Environmental factors have been indicated in this study to affect signal reception. The representative of samples by cultural groups is difficult to obtain in recreational tracking. We found that western visitors were more cooperative in survey participation while mainland visitors were less cooperative mainly because of brevity of their visits.
3D VRML tools are useful in visualizing environmental considerations for spa-tial analysis. The plotting of tracked positions on the 3D VRML model enables a better understanding of visitor movement and tourist behavior. While our sampled data may not warrant meaningful results to be drawn of park activities, our meth-odology does illustrate the effectiveness of GIS and GPS in recreational tracking. Specifically, the maps and VRML model are effective in pinpointing aspects of park management needing further investigation. For example, our case study showed that visitors did not side track from the designated trails which indicates some degrees of
138
success in controlled trampling of the park areas. Our observation of visitors from western countries regarding their preference for nature trails was useful informa-tion for park development, given the relatively large number of tourists from these regions. With more representative data gathered from recreational tracking, new opportunities can be determined that will enable increasing numbers of tourists to visit particular nature-based tourism destinations. A better understanding of tourist behavior will enable development of tourism spots without actively degrading the environment for which the tourists are coming to see, and without degrading the tourist experience through effectively redistributing social carrying capacities.
Appendix A.Abbreviations and Terms
GIS Geographic Information System is capable of storing and utilizing maps, displaying the results of data queries and conducting spatial analysis.
GMT Greenwich Mean Time sets current time or official time around the globe.
GPS Global Positioning System provides precise location which is based on data transmitted from a constellation of 24 satellites.
PDA Personal Digital Assistant is a digital and portable device which can include the functionality of a computer, a cellphone, a music player and a camera.
PDOP Positional/Percent Dilution of Precision is a measure of the geometrical strength of the GPS satellite configuration. PDOP less than 4 gives the best accuracy (under 1 meter). Between 4 and 8 gives acceptable accuracy. Greater than 8 gives poor accuracy. From GPS Glossary http://www.cgrer.uiowa.edu/cgrer_lab/gps/gpsdefs.html (Accessed on 18 April 2006).
Track The direction of movement relative to a ground position.
VRML Virtual Reality Modeling Language is a standard file format for representing 3-dimensional (3D) interactive vector graphics designed for the World Wide Web.
139
References
Crompton, J.L., MacKay, K.J., & Fesenmaier, D.R. (1991). Identifying dimensions of service quality in public recreation. Journal of Park and Recreation Administration, 9(3), 15-27.
Devine, H. and Kuo, J. (1991). Geographic information systems Applications to urban recreation research and management. Proceeding of the 1991 Leisure Re-search Symposium. Baltimore, MD: NRPA.
Hong Kong Agriculture, Fisheries & Conservation Department. (2004). Available: http://parks.afcd.gov.hk/newparks/eng/statistics/index.htm. [Accessed on 20 December 2004].
Knox, D. (2004). 3D Terrain Visualisation and Virtual Fly-Through for Tourism Conservation Using Geographic Information Systems (GIS). BA Dissertation, Univer-sity of Southern Queensland.
McCoy, J. and Johnston, K. (2001). Using ArcGIS: Spatial Analyst. Redland. CA: ESRI.
Meritxell, G.L. (2005). Study of spatial patterns of visitors using mechanical counters, GPS and GIS technology in the Slough Creek subregion of Yellowstone National Park, MSc Thesis, The University of Montana. Available: http://www.forestry.umt.edu/departments/socn/socontheses/gracia-longaresmeritxell.pdf [Assessed on 30 March 2006].
Nedovic-Budic, Z., Knaap, G. & Scheidecker, B. (1999). Advancing the use of geographic information system for park and recreation management. Journal of Park and Recreation Administration, 17(4), 73-101.
Nicholls, S. and Shafer, C. S. (2001). Measuring Accessibility and equity in a local park system: The Utility of geospatial technologies to park and recreation pro-fessionals Journal of Park and recreation Administration, 19(4), 102-124.
Office of Environmental Information. (2003). Global Positioning System – Technical Implementation Guidance, EPA/250/R-03/001, September 2003, US Environmental Protection Agency.
Wicks, B.E., Backman, K.F., Allen, J., & Van Blaricom, D. (1993). Geographic information systems (GIS): A tool for marketing, managing, and planning municipal park systems. Journal of Park and Recreation Administration, 11(1), 9-23.


![! Caffeoyl-CoA 3- -methyl- transferase #$%&’()*#$+, -./012for.nchu.edu.tw/up_book/9886.pdf · ’324’ YZ Caffeoyl-CoA 3-O-methyltransferase Be;]^lGCBeÀ¤*+,‹› ÌAbstract˝Lignin](https://img.pdfslide.us/doc/110x75/5dd0fe11d6be591ccb63b23f/-caffeoyl-coa-3-methyl-transferase-a-a324a-yz-caffeoyl-coa.jpg)