Embed Size (px)
Citation preview
PARETO OPTIMIZATION AND TRADEOFF ANALYSIS APPLIED TO META-LEARNING OFMULTIPLE SIMULATION CRITERIA
Ofer M. Shir, Shahar Chen, David Amid, David Boaz and Ateret Anaby-Tavor
IBM ResearchHaifa University Campus, Mt. Carmel, 31905, ISRAEL
Dmitry Moor
IBM Systems and Technology GroupScience and Technology Center, Moscow, RUSSIA
ABSTRACT
Simulation performance may be evaluated according to multiple quality measures that are in competitionand their simultaneous consideration poses a conflict. In the current study we propose a practical frameworkfor investigating such simulation performance criteria, exploring the inherent conflicts amongst them andidentifying the best available tradeoffs, based upon multiobjective Pareto optimization. This approachnecessitates the rigorous derivation of performance criteria to serve as objective functions and undergovector optimization. We demonstrate the effectiveness of our proposed approach by applying it to a specificArtificial Neural Networks (ANN) simulation, with multiple stochastic quality measures. We formulateperformance criteria of this use-case, pose an optimization problem, and solve it by means of a simulation-based Pareto approach. Upon attainment of the underlying Pareto Frontier, we analyze it and prescribepreference-dependent configurations for the optimal simulation training.
1 INTRODUCTION
Many simulations pose challenging computational tasks, but furthermore, simulations of an open-endednature do not possess a known final solution. That is, the target of the learning/training is known, but itsoptimal or ultimate form is generally unknown. A common case is the family of ANN-based simulations.Generally speaking, the scope of the current study is simulations that perform learning tasks, and particularlyANN simulations that perform open-ended learning. From the Operational Research (OR) perspective,explicit objective functions for these simulations cannot be derived, but rather, quality measures may serveas reinforcement feedback. It is often the case that open-ended simulations possess more than a singlequality attribute, as the evaluation of the learning success-rate may be subject to different perspectives.In these scenarios, these quality measures are often conflicting – i.e., making some progress in a givendirection may be concordant with some quality measures and at the same time discordant with others.The current study is primarily targeted at treating the meta-learning of simulations with competing qualitymeasures by proposing the Pareto multiobjective optimization framework for conflict exploration andtradeoff analysis. Practically speaking, the obtained Pareto Frontier (a rigorous definition will follow)relates to the best attainable parameter configurations for the learning outcome of the highest quality. Ourproposed approach to treat such quality measures/attributes accounts for white- and black-box scenarios,and utilizes accordingly simulation-based optimization. In order to demonstrate our approach we consider,as a case-study, an ANN-simulation-based visualization technique, whose primary learning problem is
Shir, Moor, Chen, Amid, Boaz and Anaby-Tavor
mapping high-dimensional datasets onto 2-dimensional projections. Explicitly, we investigate the qualitymeasures of Self-Organizing Maps for Multi-Objective Pareto Frontiers (SOMMOS (Chen, Amid, Shir,Boaz, Schreck, Limonad, and Anaby-Tavor 2013)), a semantically- and algorithmically-enhanced variantof the Self-Organizing Map (SOM) algorithm (Kohonen 2001).
The issue of identifying and analyzing performance criteria of computational tasks is raised in severalpapers. (Caruana and Niculescu-Mizil 2004) described several criteria that can be used to evaluate theperformance of supervised learning and introduced a new metric that combined several existing metricsinto a single one. There are also multiple approaches used in the literature that aim at automated algorithmstuning, i.e., selection of some defining parameters that would yield the best-performing algorithm for solvinga particular problem with respect to any performance criterion. For instance, investigating performance ofEvolutionary Algorithms for solving OR problems is presented in (Oltean 2005). Moreover, (Kadioglu,Malitsky, Sellmann, and Tierney 2010) and (Hutter, Hoos, Leyton-Brown, and Sttzle 2009) describe somemethods for automated algorithm configuration. In another study (Polzlbauer 2004), some existing qualitymeasures for Self-Organizing Maps are described. More quality measures for SOM may be found in(Kaski and Lagus 1996). In contrast to these works, our approach is aimed not only at identifying theset of parameters that would yield the best-performing algorithm with respect to any single criterion (e.g.,computation time) but rather at obtaining the set of the most-preferred solutions with respect to multiplecriteria. This added perspective would enable to further investigate the nature of the derived performancecriteria of our use-case and only then to select the final solution.
The contribution of the current study lies in the following:
• We propose a novel OR perspective on open-ended simulation challenges, which typically do notpossess an objective function to undergo traditional optimization.
• We explicitly derive analytical performance criteria for a specific use-case from the domain ofneural simulations, and illustrate the effectiveness of our proposed framework.
• We demonstrate how analyzing multiobjective optimization results has the potential to cater a betterunderstanding of the simulation challenge, and at the same time to achieve fine-tuning of the primarysimulation parameters.
2 META-LEARNING OF MULTIPLE SIMULATION CRITERIA
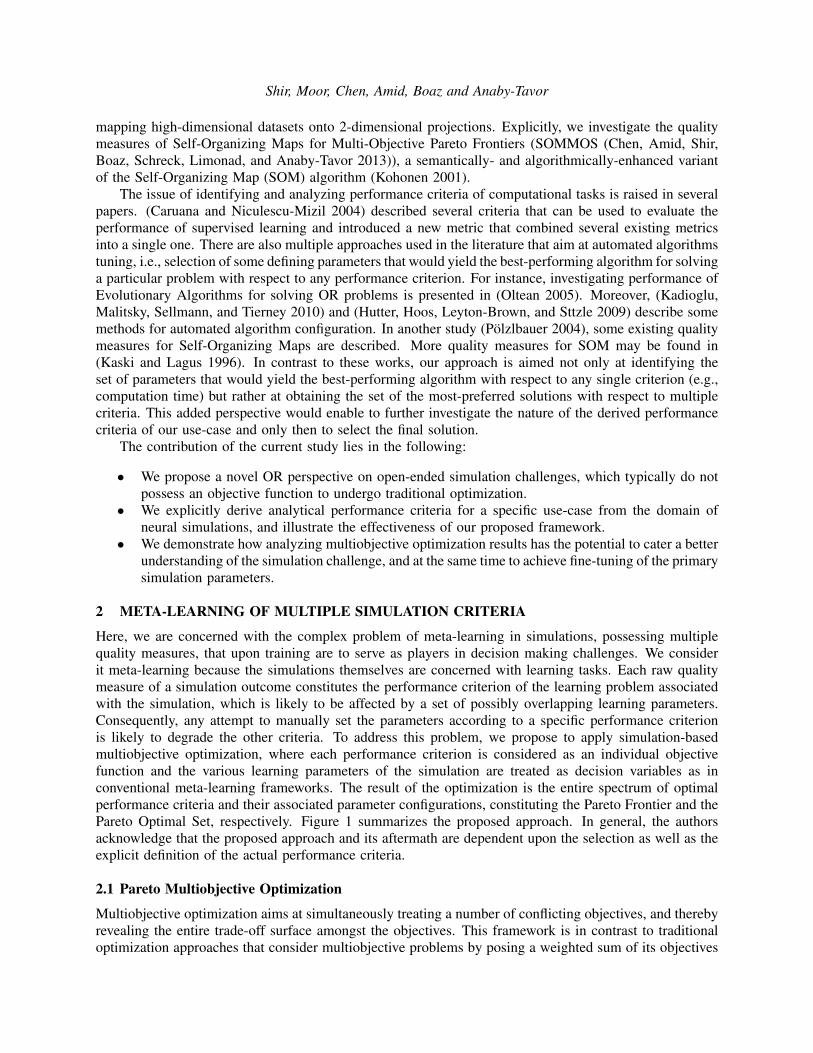
Here, we are concerned with the complex problem of meta-learning in simulations, possessing multiplequality measures, that upon training are to serve as players in decision making challenges. We considerit meta-learning because the simulations themselves are concerned with learning tasks. Each raw qualitymeasure of a simulation outcome constitutes the performance criterion of the learning problem associatedwith the simulation, which is likely to be affected by a set of possibly overlapping learning parameters.Consequently, any attempt to manually set the parameters according to a specific performance criterionis likely to degrade the other criteria. To address this problem, we propose to apply simulation-basedmultiobjective optimization, where each performance criterion is considered as an individual objectivefunction and the various learning parameters of the simulation are treated as decision variables as inconventional meta-learning frameworks. The result of the optimization is the entire spectrum of optimalperformance criteria and their associated parameter configurations, constituting the Pareto Frontier and thePareto Optimal Set, respectively. Figure 1 summarizes the proposed approach. In general, the authorsacknowledge that the proposed approach and its aftermath are dependent upon the selection as well as theexplicit definition of the actual performance criteria.
2.1 Pareto Multiobjective Optimization
Multiobjective optimization aims at simultaneously treating a number of conflicting objectives, and therebyrevealing the entire trade-off surface amongst the objectives. This framework is in contrast to traditionaloptimization approaches that consider multiobjective problems by posing a weighted sum of its objectives
Shir, Moor, Chen, Amid, Boaz and Anaby-Tavor
Simulation( )Input: Parameter Configuration
Black-Box Objectives
Multiobjective Optimization
Pareto Analysis for Tradeoff Exploration
SOMMOSANN-Based Visualization
use-case
Pareto Spectrum of Optimal Configurations
Objective Functions (Performance Criteria)
Raw Quality Measures
Winning Strategies Representing Different Tradeoffs
Figure 1: Five layers of the meta-learning framework, subject to a pipeline flow, and the targeted use-case.
and employ singleobjective solvers to obtain an individual solution point. These traditional methods donot provide a complete view of the conflict amongst the objectives (they do not reveal the Pareto Frontier),and moreover, necessitate a priori prescription of the objectives weighing. Other mathematical limitationsare described in (Das and Dennis 1997).Let a vector of objective functions in Rm, ~f (~x) = ( f1 (~x) , . . . , fm (~x))T , be subject to minimization, and let apartial order be defined in the following manner: given any ~f (1) ∈Rm and ~f (2) ∈Rm, we state that ~f (1) strictlyPareto dominates ~f (2), denoted ~f (1) ≺ ~f (2), if and only if ∀i ∈ {1, . . .m} : f (1)i ≤ f (2)i ∧ ∃i ∈ {1, . . . ,m} :f (1)i < f (2)i . In addition to the strict domination ≺, we define ~f (1) � ~f (2) ⇐⇒ ~f (1) ≺ ~f (2) ∨ ~f (1) = ~f (2).The individual Pareto-ranking of a given candidate solution is defined as the number of other solutionsdominating it. The crucial claim is that for any compact subset of Rm, there exists a non-empty set ofminimal elements with respect to the partial order � (see, e.g., (Ehrgott 2005)). Non-dominated pointsare then defined as the set of minimal elements with respect to the partial order �, and by definitiontheir Pareto-ranking is zero. The goal of Pareto optimization is thus to obtain the non-dominated setand its pre-image in the design space, the so-called Pareto optimal set, also referred to as the efficientset. Finally, the Pareto Frontier is defined as the set of all points in the objective space that correspondto the solutions in the Pareto-optimal set. The computational problem of attaining the Pareto Frontierof a multiobjective optimization problem (Papadimitriou and Yannakakis 2000) can be either treated bymeans of algorithms utilizing mathematical programming solvers (for instance, the so-called DiversityMaximization Approach (Masin and Bukchin 2008) employing, e.g., (CPLEX 2009)), or approximated bypopulation-based heuristics (see, e.g., (Beume, Naujoks, and Emmerich 2007)).
2.2 Simulation-Based and Black-Box Optimization
Unlike traditional Operational Research modeling, which targets the explicit analytical forms of the objectivefunctions and their associated constraints, modern treatment of real-world models may consider them aswhite- or black-boxes. Moreover, the advent of existing heuristics allows efficient optimization of suchblack-box models. In essence, simulations may also be treated as black-boxes and optimized accordingly,i.e., their characteristic parameters may be effectively tuned to yield the optimal behavior. Here, dueto the nature of the simulated performance criteria, we choose to realize this option with EvolutionaryMultiobjective Algorithms, as will be specified.
Shir, Moor, Chen, Amid, Boaz and Anaby-Tavor
2.3 Pareto Analysis and Tradeoff Exploration
The optimization process outputs the Pareto Frontier and the Pareto Set, representing the optimal parameterconfigurations for the simulation. The solution points on the Pareto Frontier are mathematically indifferentwith respect to each other, and thus the selection phase, entitled multi-criterion decision making (MCDM,(Koksalan, Wallenius, and Zionts 2011)), is subjectively driven by the human decision maker. This processinvolves exploration of the Frontier, and eventually, the challenge in selecting a solution is to account forgains and losses while adhering to personal preferences. Various supporting methodologies do exist (e.g.,consider AHP (Saaty 1980) or ELECTRE (Roy 1991)), yet, in the current study we shall demonstrate theeffectiveness of manual exploration and selection from the attained Frontier.
3 SOMMOS AS A SIMULATOR
We choose to specifically address an ANN simulation problem from the realm of visualization, namely, thegeneration of mappings from high-dimensional datasets onto 2-dimensional projections, which relies onunsupervised neural competitive learning. The defining parameters of the neural learning are to constitutethe decision variables of the optimization process, whose objective functions are to be derived from thevisualization quality measures of accuracy, semantic orientation, etc. The ultimate goal would be toselect specific configurations from the attained Pareto Frontier of the meta-learning problem in order tosimulate/generate high-quality maps. In practice, the meta-learning problem we investigate is regarding thequality measures of Self-Organizing Maps for Multi-Objective Pareto Frontiers (SOMMOS (Chen, Amid,Shir, Boaz, Schreck, Limonad, and Anaby-Tavor 2013)), a semantically- and algorithmically-enhancedvariant of the Self-Organizing Map (SOM) algorithm (Kohonen 2001). These specific maps visualizePareto Frontiers of given MCDM problems, and thus, they are to play a role in supporting the humandecision making process. The careful reader should distinguish between the 2 different utilizations of ParetoFrontiers at 2 layers of the current work: one, as input to SOMMOS, representing an external decisionproblem, and the other, output of the general proposed framework. The current problem is especiallyimportant to the OR community since it describes a novel visualization for the display of Pareto Frontiers.The means to solve this problem, as will be shown here, is simulation-based multiobjective optimization.
3.1 SOMMOS: Technique’s Description
The SOM algorithm constitutes a popular method for visualization of large high-dimensional datasets. Bymeans of unsupervised competitive learning, a network of prototype vectors is formed, and upon employinga 2-dimensional regular rectangular or hexagonal network model, visualization is directly attained as dataitems can be mapped according to the simulated spatial structure (Vesanto 1999). The actual trainingphase constitutes the percolation of dataset values to the neural network based upon its topology. Due toapproximate topology-preserving properties of this method, the resulting visual displays can be intuitivelyinterpreted by the user. From its origin, SOM inventors concluded that the learning process is open in natureand cannot be validated. Optimization-wise, SOM has been practically addressed as a learning problemwith a primary objective of minimizing its quantization error (Kohonen 2001).
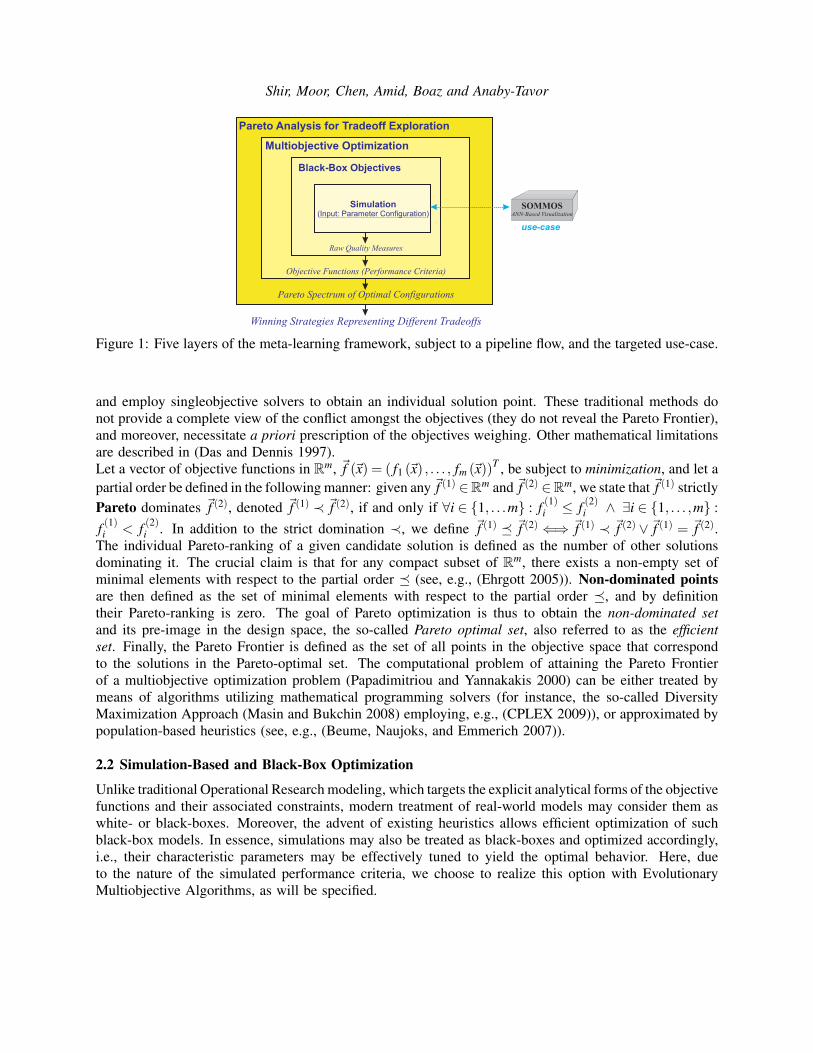
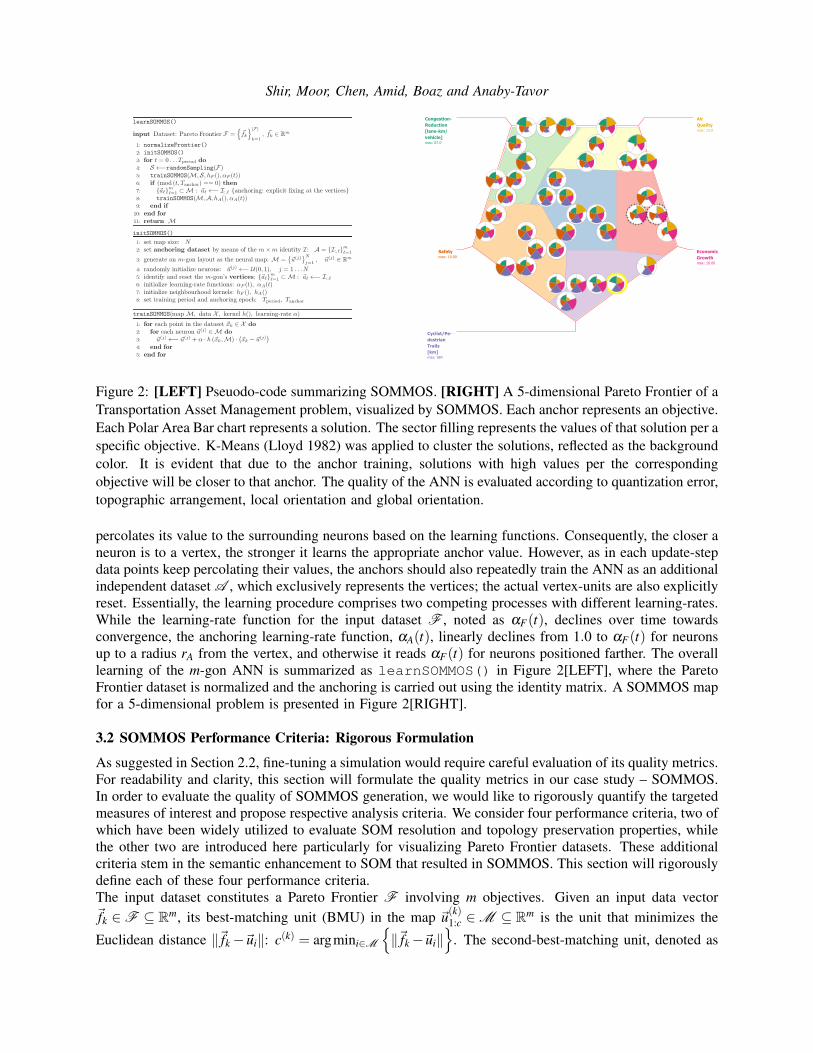
In this paper, we examine a special form of SOM, namely Self-Organizing Maps for Multi-ObjectivePareto Frontiers (Chen, Amid, Shir, Boaz, Schreck, Limonad, and Anaby-Tavor 2013). This is an enhancedSOM variant that was especially designed for visualizing Pareto Frontiers to facilitate effective multi-criterion decision making. Given an m-dimensional Pareto Frontier, SOMMOS generates a symmetricm-gon whose vertices represent the optima of the m objective functions and participate in the training phaseof the dataset. The anchoring of these extreme solution points necessitated algorithmic enhancement to theoriginal SOM, as outlined in what follows with reference to the pseudo-code presented in Figure 2[LEFT].Data is first to be normalized within [0,1]m by considering minimally- and maximally-attainable objectivevalues (the invoked routine is entitled normalizeFrontier()). Let the map be denoted by M . Duringthe training phase, every so-called anchoring-epoch, Tanchor, a given vertex-neuron, ~a` ∈ {~a`}m
`=1 ⊂M ,
Shir, Moor, Chen, Amid, Boaz and Anaby-Tavor
Congestion-
Reduction
[lane-km/
vehicle]max: 67.0
Safetymax: 10.00
Cyclist/Pe-
destrian
Trails
[km]max: 984
Economic
Growthmax: 10.00
Air
Qualitymax: 15.0
Figure 2: [LEFT] Pseuodo-code summarizing SOMMOS. [RIGHT] A 5-dimensional Pareto Frontier of aTransportation Asset Management problem, visualized by SOMMOS. Each anchor represents an objective.Each Polar Area Bar chart represents a solution. The sector filling represents the values of that solution per aspecific objective. K-Means (Lloyd 1982) was applied to cluster the solutions, reflected as the backgroundcolor. It is evident that due to the anchor training, solutions with high values per the correspondingobjective will be closer to that anchor. The quality of the ANN is evaluated according to quantization error,topographic arrangement, local orientation and global orientation.
percolates its value to the surrounding neurons based on the learning functions. Consequently, the closer aneuron is to a vertex, the stronger it learns the appropriate anchor value. However, as in each update-stepdata points keep percolating their values, the anchors should also repeatedly train the ANN as an additionalindependent dataset A , which exclusively represents the vertices; the actual vertex-units are also explicitlyreset. Essentially, the learning procedure comprises two competing processes with different learning-rates.While the learning-rate function for the input dataset F , noted as αF(t), declines over time towardsconvergence, the anchoring learning-rate function, αA(t), linearly declines from 1.0 to αF(t) for neuronsup to a radius rA from the vertex, and otherwise it reads αF(t) for neurons positioned farther. The overalllearning of the m-gon ANN is summarized as learnSOMMOS() in Figure 2[LEFT], where the ParetoFrontier dataset is normalized and the anchoring is carried out using the identity matrix. A SOMMOS mapfor a 5-dimensional problem is presented in Figure 2[RIGHT].
3.2 SOMMOS Performance Criteria: Rigorous Formulation
As suggested in Section 2.2, fine-tuning a simulation would require careful evaluation of its quality metrics.For readability and clarity, this section will formulate the quality metrics in our case study – SOMMOS.In order to evaluate the quality of SOMMOS generation, we would like to rigorously quantify the targetedmeasures of interest and propose respective analysis criteria. We consider four performance criteria, two ofwhich have been widely utilized to evaluate SOM resolution and topology preservation properties, whilethe other two are introduced here particularly for visualizing Pareto Frontier datasets. These additionalcriteria stem in the semantic enhancement to SOM that resulted in SOMMOS. This section will rigorouslydefine each of these four performance criteria.The input dataset constitutes a Pareto Frontier F involving m objectives. Given an input data vector~fk ∈F ⊆ Rm, its best-matching unit (BMU) in the map ~u(k)1:c ∈M ⊆ Rm is the unit that minimizes the
Euclidean distance ‖~fk−~ui‖: c(k) = argmini∈M
{‖~fk−~ui‖
}. The second-best-matching unit, denoted as

Shir, Moor, Chen, Amid, Boaz and Anaby-Tavor
Figure 3: Illustration of the local orientation errorcomputation, representing the `th objective valuesby a gray-scale subject to maximization. The er-ror measure for the neurons
⟨~ui,~u j1
⟩is larger than
the error measure of the neurons⟨~ui,~u j2
⟩because
of their different relative positions with respectto ~a`. Let d(i)
`,max denote the maximally attainabledistance within the ANN boundaries from the `th
anchor in the direction of the vector~ui−~a`, and letθ(`)i, j1 denote the angle between ~ui and ~u j1. Given⟨~ui,~u j1
⟩, we calculate θ
(i)`,max as the maximal an-
gle between ~ui and all the neurons ~u℘ that satisfy(d(~u℘,~a`)> d(~ui,~a`))∧ (d(~u℘,~ui)≤ d(~ui,~u j1)).
al
u
u
~u(k)2:c, is defined respectively. We then consider the so-called mean quantization error, representing thelearning quality of the attained ANN, which is defined as the mean over ‖~fk−~u
(k)1:c‖ (Kohonen, Hynninen,
Kangas, and Laaksonen 1996):QE = E j∈F
[‖~f j−~u( j)
1:c‖]
(1)
Let δ ()denote the adjacency indicator of the ANN, i.e., δ (~ui,~u j)=
{1 if ~ui,~u j are adjacent ANN units0 otherwise
.
Next, we consider the topographic error, defined as the proportion of the input data vectors whose first-bestand second-best matching units are not adjacent within the ANN:
T E =
∑j∈F
[1−δ
(~u( j)
1:c,~u( j)2:c
)]|F |
(2)
We now define the so-called measure of local orientation error, which considers each of the anchor units andaccounts for ranked-based ordering violations with respect to it. In other words, local orientation violationwith regard to the `th vertex (anchor) unit,~a` ∈M , occurs if a unit~ui is placed closer to~a` than~u j, but its `th
objective function is inferior. By constructing this measure, we would also like to apply larger error values tounits that are closer to the anchor, since these neurons are the foremost interesting when concentrating on thecorresponding objective function during the decision making process. Generally speaking, by minimizingthis error measure we would like to enable exploration phases as typically encountered in human decisionmaking: following an examination of a certain solution point on the Frontier, the decision maker may beinterested in rovering around its neighborhood, under the assumption that the local orientation is concordantwith the objective functions. This implies that the local orientation error should read larger values forviolations occurring between neighboring neurons in comparison to violations between neurons that arelocated far from each other. Moreover, when considering the relative positions of these two neurons, careshould be given not only to the distance between them, but rather also to their orientation with respect tothe anchor. See Figure 3 for illustration. The local orientation error is then defined as the summation over
Shir, Moor, Chen, Amid, Boaz and Anaby-Tavor
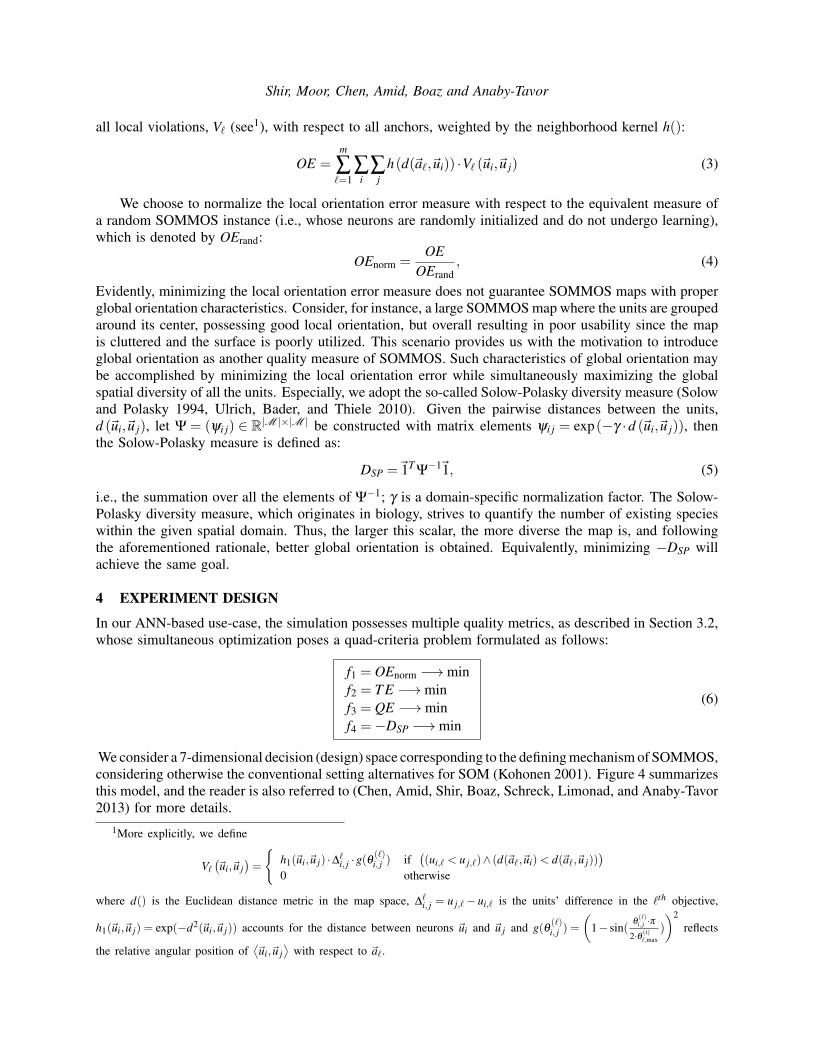
all local violations, V` (see1), with respect to all anchors, weighted by the neighborhood kernel h():
OE =m
∑`=1
∑i
∑j
h(d(~a`,~ui)) ·V` (~ui,~u j) (3)
We choose to normalize the local orientation error measure with respect to the equivalent measure ofa random SOMMOS instance (i.e., whose neurons are randomly initialized and do not undergo learning),which is denoted by OErand:
OEnorm =OE
OErand, (4)
Evidently, minimizing the local orientation error measure does not guarantee SOMMOS maps with properglobal orientation characteristics. Consider, for instance, a large SOMMOS map where the units are groupedaround its center, possessing good local orientation, but overall resulting in poor usability since the mapis cluttered and the surface is poorly utilized. This scenario provides us with the motivation to introduceglobal orientation as another quality measure of SOMMOS. Such characteristics of global orientation maybe accomplished by minimizing the local orientation error while simultaneously maximizing the globalspatial diversity of all the units. Especially, we adopt the so-called Solow-Polasky diversity measure (Solowand Polasky 1994, Ulrich, Bader, and Thiele 2010). Given the pairwise distances between the units,d (~ui,~u j), let Ψ = (ψi j) ∈ R|M |×|M | be constructed with matrix elements ψi j = exp(−γ ·d (~ui,~u j)), thenthe Solow-Polasky measure is defined as:
DSP =~1TΨ−1~1, (5)
i.e., the summation over all the elements of Ψ−1; γ is a domain-specific normalization factor. The Solow-Polasky diversity measure, which originates in biology, strives to quantify the number of existing specieswithin the given spatial domain. Thus, the larger this scalar, the more diverse the map is, and followingthe aforementioned rationale, better global orientation is obtained. Equivalently, minimizing −DSP willachieve the same goal.
4 EXPERIMENT DESIGN
In our ANN-based use-case, the simulation possesses multiple quality metrics, as described in Section 3.2,whose simultaneous optimization poses a quad-criteria problem formulated as follows:
f1 = OEnorm −→minf2 = T E −→minf3 = QE −→minf4 =−DSP −→min
(6)
We consider a 7-dimensional decision (design) space corresponding to the defining mechanism of SOMMOS,considering otherwise the conventional setting alternatives for SOM (Kohonen 2001). Figure 4 summarizesthis model, and the reader is also referred to (Chen, Amid, Shir, Boaz, Schreck, Limonad, and Anaby-Tavor2013) for more details.
1More explicitly, we define
V`
(~ui,~u j
)=
{h1(~ui,~u j) ·∆`
i, j ·g(θ(`)i, j ) if
((ui,` < u j,`)∧ (d(~a`,~ui)< d(~a`,~u j))
)0 otherwise
where d() is the Euclidean distance metric in the map space, ∆`i, j = u j,`− ui,` is the units’ difference in the `th objective,
h1(~ui,~u j) = exp(−d2(~ui,~u j)) accounts for the distance between neurons ~ui and ~u j and g(θ (`)i, j ) =
(1− sin(
θ(`)i, j ·π
2·θ (i)`,max
)
)2reflects
the relative angular position of⟨~ui,~u j
⟩with respect to ~a`.
Shir, Moor, Chen, Amid, Boaz and Anaby-Tavor
SOMMOS
Objective Functions( )Performance Criteria
ANN-Based SimulationDecision Variables( )Parameter Config.
OE
TEQE-D
normal
SP
evalu
ated
by
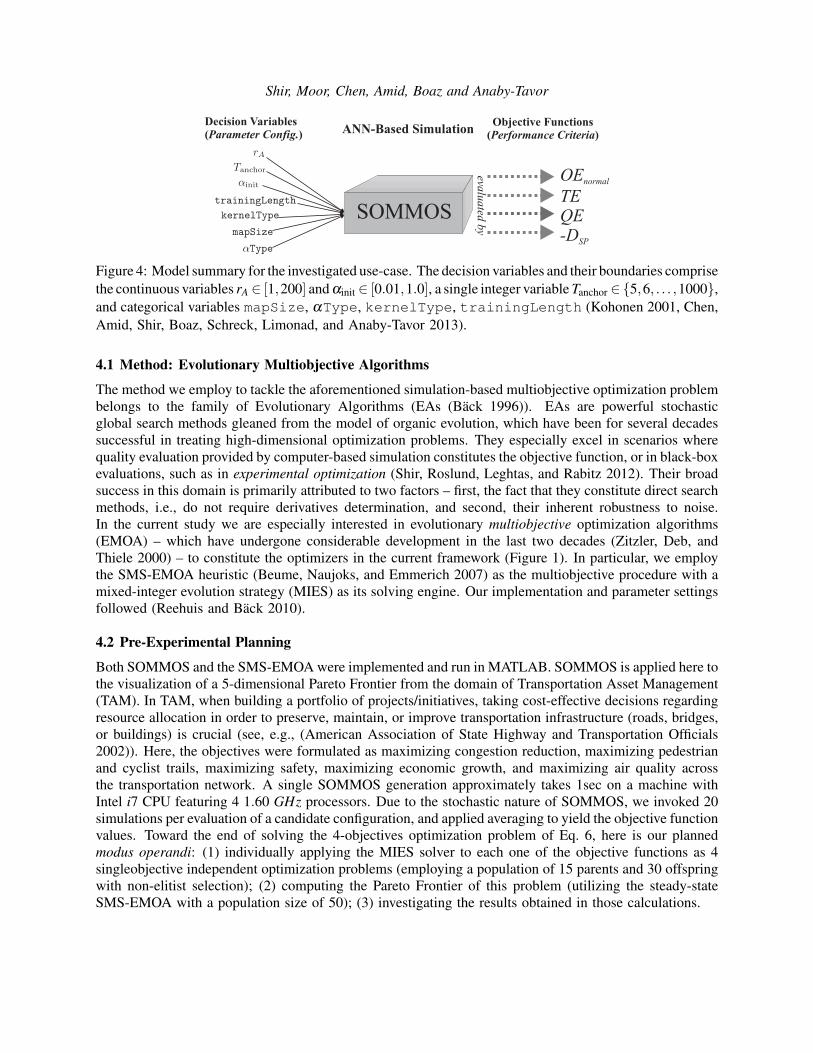
Figure 4: Model summary for the investigated use-case. The decision variables and their boundaries comprisethe continuous variables rA ∈ [1,200] and αinit ∈ [0.01,1.0], a single integer variable Tanchor ∈{5,6, . . . ,1000},and categorical variables mapSize, αType, kernelType, trainingLength (Kohonen 2001, Chen,Amid, Shir, Boaz, Schreck, Limonad, and Anaby-Tavor 2013).
4.1 Method: Evolutionary Multiobjective Algorithms
The method we employ to tackle the aforementioned simulation-based multiobjective optimization problembelongs to the family of Evolutionary Algorithms (EAs (Back 1996)). EAs are powerful stochasticglobal search methods gleaned from the model of organic evolution, which have been for several decadessuccessful in treating high-dimensional optimization problems. They especially excel in scenarios wherequality evaluation provided by computer-based simulation constitutes the objective function, or in black-boxevaluations, such as in experimental optimization (Shir, Roslund, Leghtas, and Rabitz 2012). Their broadsuccess in this domain is primarily attributed to two factors – first, the fact that they constitute direct searchmethods, i.e., do not require derivatives determination, and second, their inherent robustness to noise.In the current study we are especially interested in evolutionary multiobjective optimization algorithms(EMOA) – which have undergone considerable development in the last two decades (Zitzler, Deb, andThiele 2000) – to constitute the optimizers in the current framework (Figure 1). In particular, we employthe SMS-EMOA heuristic (Beume, Naujoks, and Emmerich 2007) as the multiobjective procedure with amixed-integer evolution strategy (MIES) as its solving engine. Our implementation and parameter settingsfollowed (Reehuis and Back 2010).
4.2 Pre-Experimental Planning
Both SOMMOS and the SMS-EMOA were implemented and run in MATLAB. SOMMOS is applied here tothe visualization of a 5-dimensional Pareto Frontier from the domain of Transportation Asset Management(TAM). In TAM, when building a portfolio of projects/initiatives, taking cost-effective decisions regardingresource allocation in order to preserve, maintain, or improve transportation infrastructure (roads, bridges,or buildings) is crucial (see, e.g., (American Association of State Highway and Transportation Officials2002)). Here, the objectives were formulated as maximizing congestion reduction, maximizing pedestrianand cyclist trails, maximizing safety, maximizing economic growth, and maximizing air quality acrossthe transportation network. A single SOMMOS generation approximately takes 1sec on a machine withIntel i7 CPU featuring 4 1.60 GHz processors. Due to the stochastic nature of SOMMOS, we invoked 20simulations per evaluation of a candidate configuration, and applied averaging to yield the objective functionvalues. Toward the end of solving the 4-objectives optimization problem of Eq. 6, here is our plannedmodus operandi: (1) individually applying the MIES solver to each one of the objective functions as 4singleobjective independent optimization problems (employing a population of 15 parents and 30 offspringwith non-elitist selection); (2) computing the Pareto Frontier of this problem (utilizing the steady-stateSMS-EMOA with a population size of 50); (3) investigating the results obtained in those calculations.

Shir, Moor, Chen, Amid, Boaz and Anaby-Tavor
5 EXPERIMENTATION AND RESULTS
We describe here our practical observations of the optimization methodology applied to Eq. 6.
5.1 Preliminary: Optimization Aftermath
We first consider the individual treatment of the 4 objective functions. By doing so we aim at understandingthe nature of each particular objective function and at identifying some conflicts in the early stages of theanalysis. It is evident that all four minimizers dramatically differ. For instance, we briefly compare theminimizers of OE and QE: in order to obtain small OE values, training neurons with values that boostthe orientation quality of the ANN (i.e., anchoring) should be carried out more frequently (small Tanchorvalues). At the same time, such effective training may be achieved also when it is propagated to neuronslocated farther from the proximity of the anchor unit, e.g., by setting large rA values and strengthening theanchor’s impact on the ANN. QE, on the other hand, is concerned with the degree to which the dataset fitsthe trained neurons. Therefore, a frequent anchoring operation may compromise the desired degree of fit,due to the fact that the anchors constitute inorganic elements with respect to the dataset; minimizing QEshould be intuitively associated with suppressing the anchoring operation.
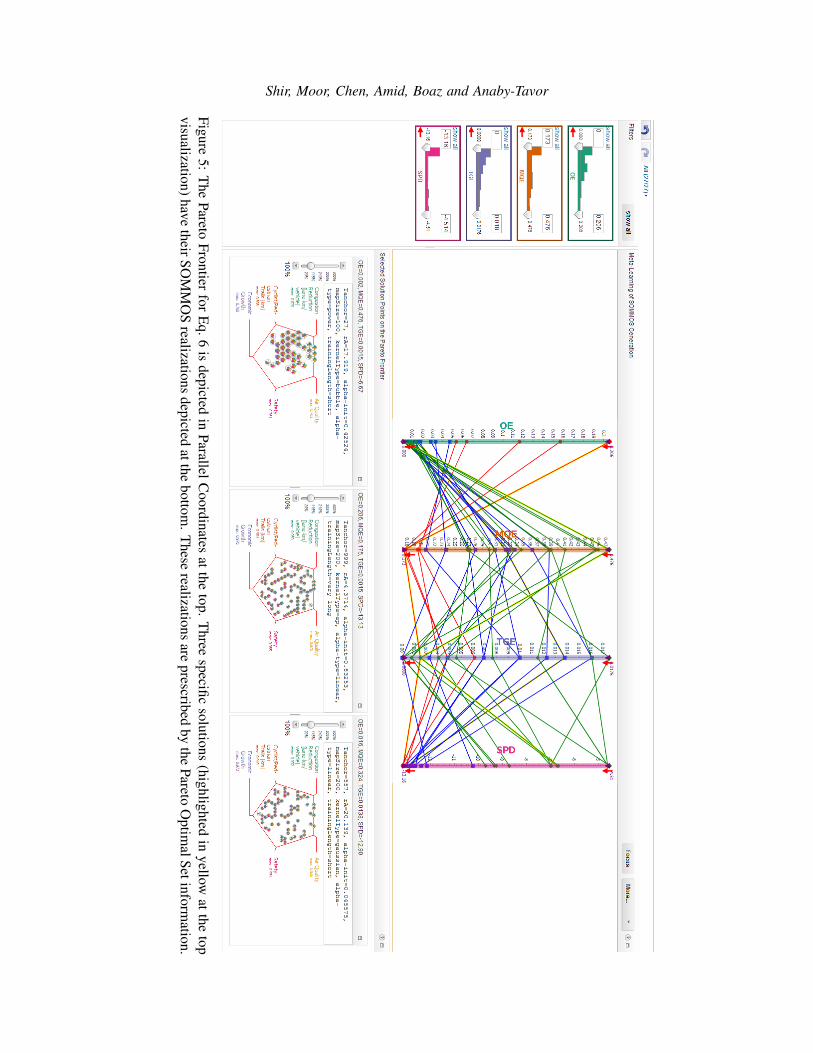
We begin by investigating the depicted Frontier, as shown in the Parallel Coordinates visualization atthe top of Figure 5. Each axis denotes a performance criterion and each line denotes an optimal solution forall four performance criteria. K-Means clustering (Lloyd 1982) was applied to this Frontier, and 3 clustersare colored accordingly. A birds-eye view at the frontier reveals that OE is in a hard conflict with all other3 objectives, which are in a soft conflict amongst themselves. This is mainly due to the fact that the trainingon the objectives’ maximal values (i.e., the anchors) interferes with the training of the data itself. Thisinterference is so severe that the known SOM conflict between QE and TE (Polzlbauer 2004) appears asa soft conflict when compared to the conflict between OE and these regular SOM quality measurements.This view also contains 3 actual SOMMOS maps, each corresponding to a solution within one of theclusters on the Frontier; these were generated by means of the Pareto set attained in the optimization, thatis, by prescribing the optimal decision variables provided by the optimization process into the SOMMOSalgorithm. The cluster colored in green corresponds to a subset of maps with low OE but low diversity andhigh QE (its representative SOMMOS map is depicted in the left). When analyzing the generated maps, wefound that the high QE values reflect a misrepresentation of the data. Also, having a low diversity hindersthe decision maker’s ability to spot an area of particular interest. On the positive side, it is very easy for auser to explore the space since there is a clear sense of direction, i.e., it is easy to associate the solutionswith a direction towards an objective. The next cluster is colored in red (its representative SOMMOS mapis depicted in the middle). Unlike the green cluster, the current subset of maps is characterized by verysmall values of QE, highly diverse maps, somewhat low TE but high values of OE. These are maps thataccurately represent the data and are well-diverse. However, the high values of OE are reflected in theinability to practically rover from one solution to another when exploring the Frontier. The last cluster,colored in blue, represents solutions of ”meeting-in-the-middle” in terms of OE, QE as well as diversity(its representative SOMMOS map is depicted in the right). Evidently, maps in this cluster possess highdiversity and fine OE values. However, some of the solutions in this cluster, specifically those with highQE, constitute problematic representations of the data.
5.2 Analysis and Discussion
In what follows, we shall demonstrate the final step in the proposed framework – how analyzing multiobjectiveoptimization results may cater a better understanding of the learning challenge, and at the same time achievefine-tuning of the primary simulation parameters. While the tradeoff analysis contributes to our understandingof the learning performance criteria, the end goal is to determine which solutions on the Frontier constitutepreferable balance joints amongst these performance criteria. This final selection phase is subjective, and
Shir, Moor, Chen, Amid, Boaz and Anaby-Tavor
Figure5:
The
ParetoFrontier
forE
q.6is
depictedin
ParallelCoordinates
atthetop.
Three
specificsolutions
(highlightedin
yellowatthe
topvisualization)have
theirSOM
MO
Srealizations
depictedatthe
bottom.
These
realizationsare
prescribedby
thePareto
Optim
alSetinformation.

Shir, Moor, Chen, Amid, Boaz and Anaby-Tavor
in what follows we demonstrate a decision-making flow that adheres to a certain set of arguments regardingthe aforementioned SOMMOS example. The following preferences are considered in this example. First,a SOMMOS map should possess local orientation error as small as possible. This prerequisite is essentialfor any user that utilizes the map, since maps possessing high local orientation error may hinder theexploration process. However, taking into account only this first argument will potentially lead to mapswith the maximally attainable quantization error within the cluster (due to the inherent conflict) – whichis impractical to utilize, since each neuron is likely to be mapped onto many data points on the Frontier.Therefore, we decide to compare maps generated with parameters that correspond to low orientation errorand medium-to-low quantization error. It was apparent that solutions within the green cluster are inadequate,leading to an interesting deduction that the diversity criterion does not play a significant role in this selectionprocess as all maps in the blue and red clusters contain high diversity. Upon filtering out all the solutionsfrom the green cluster, it becomes evident that the low orientation error is represented by the blue clusterand the low quantization error is represented by the red cluster. We further narrow down our focus onthe solutions that are in the joint between those clusters. Here, given two solutions with similar degreesof quantization error and local orientation error, we would like to account for both the topographic errorand the diversity measure – and advise to select the solution point with better values in the latter pair ofcriteria.Overall, following the insights gained from the tradeoff analysis, and given subjective preferences of thedecision maker that we prescribed for this example, a procedure to select an optimal parameter configurationhas been described. It should be noted that an additional subjective criterion upon which the decision makeris likely to select a solution from the Frontier would be the visual aesthetic aspect of the SOMMOS map,an aspect which is left for future work.
6 CONCLUSIONS
In this paper we proposed the employment of simulation-based multiobjective optimization as a computationalframework to address conflicts amongst multiple performance criteria of simulations (Figure 1). In order toillustrate the effectiveness of this framework, we analyzed a specific ANN-simulation-based visualizationtechnique with multiple competing performance criteria, that does not possess a known best outcome. Weformulated a quad-criteria optimization problem and employed multiobjective solvers to attain its ParetoFrontier. We further showed how to explore the available tradeoffs amongst the prescribed performancecriteria and how to gain insights concerning the inherent conflicts. Evidently, this approach also allowedus to locate desirable areas within the Pareto Frontier that are more likely to meet expectations regardingthe simulation task. Altogether, our mechanism for analyzing multiobjective optimization results led to abetter understanding of the simulation challenge and fine-tuned the primary simulation parameters.
REFERENCES
American Association of State Highway and Transportation Officials 2002. “Transportation Asset Man-agement Guide”. http://downloads.transportation.org/AMGuide.pdf.
Back, T. 1996. Evolutionary Algorithms in Theory and Practice. New York, NY, USA: Oxford UniversityPress.
Beume, N., B. Naujoks, and M. Emmerich. 2007. “SMS-EMOA: Multiobjective Selection based onDominated Hypervolume”. European Journal of Operational Research 181 (3): 1653–1669.
Caruana, R., and A. Niculescu-Mizil. 2004. “Data mining in metric space: an empirical analysis of supervisedlearning performance criteria”. In Proceedings of the tenth ACM SIGKDD international conference onKnowledge discovery and data mining, KDD ’04, 69–78. New York, NY, USA: ACM.
Chen, S., D. Amid, O. M. Shir, D. Boaz, T. Schreck, L. Limonad, and A. Anaby-Tavor. 2013. “Self-Organizing Maps for Multi-Objective Pareto Frontiers”. In Proceedings of IEEE Pacific Visualization:IEEE Press.

Shir, Moor, Chen, Amid, Boaz and Anaby-Tavor
CPLEX 2009. “IBM-ILOG”. www.ibm.com/software/integration/optimization/cplex-optimizer/.Das, I., and J. Dennis. 1997. “A closer look at drawbacks of minimizing weighted sums of objectives for
Pareto set generation in multucriteria optimization problems”. Structural Optimization 14:63–69.Ehrgott, M. 2005. Multicriteria Optimization. second ed. Berlin: Springer.Hutter, F., H. H. Hoos, K. Leyton-Brown, and T. Sttzle. 2009. “ParamILS: An Automatic Algorithm
Configuration Framework.”. J. Artif. Intell. Res. (JAIR) 36:267–306.Kadioglu, S., Y. Malitsky, M. Sellmann, and K. Tierney. 2010. “ISAC - Instance-Specific Algorithm
Configuration.”. In ECAI, edited by H. Coelho, R. Studer, and M. Wooldridge, Volume 215 of Frontiersin Artificial Intelligence and Applications, 751–756: IOS Press.
Kaski, S., and K. Lagus. 1996. “Comparing Self-Organizing Maps”. In Proceedings of the Sixth InternationalConference on Artificial Neural Networks: ICANN-96, edited by C. von der Malsburg, W. von Seelen,J. C. Vorbruggen, and B. Sendhoff, Lecture Notes in Computer Science 1112, 806–814. Berlin; NewYork: Springer-Verlag.
Kohonen, T. 2001. Self-Organizing Maps. 3rd ed. Springer.Kohonen, T., J. Hynninen, J. Kangas, and J. Laaksonen. 1996. “SOM PAK: The Self-Organizing Map
Program Package”. Technical Report A31, Helsinki University of Technology.Koksalan, M., J. Wallenius, and S. Zionts. 2011. Multiple Criteria Decision Making: From Early History
to the 21st Century. World Scientific.Lloyd, S. 1982, mar. “Least squares quantization in PCM”. Information Theory, IEEE Transactions on 28
(2): 129 – 137.Masin, M., and Y. Bukchin. 2008. “Diversity maximization approach for multiobjective optimization”.
Operations Research 56 (2): 411–424.Oltean, M. 2005, Fall. “Evolving Evolutionary Algorithms Using Linear Genetic Programming”. Evolu-
tionary Computation 13 (3): 387–410.Papadimitriou, C. H., and M. Yannakakis. 2000. “On the Approximability of Trade-offs and Optimal Access
of Web Sources”. In FOCS, 86–92.Polzlbauer, G. 2004, June 24–27. “Survey and Comparison of Quality Measures for Self-Organizing Maps”.
In Proceedings of the Fifth Workshop on Data Analysis (WDA’04), edited by J. Paralic, G. Polzlbauer,and A. Rauber, 67–82. Sliezsky dom, Vysoke Tatry, Slovakia: Elfa Academic Press.
Polzlbauer, G. 2004. “Survey and comparison of quality measures for self-organizing maps”. In FifthWorkshop on Data Analysis (WDA 2004), 67–82.
Reehuis, E., and T. Back. 2010. “Mixed-integer evolution strategy using multiobjective selection appliedto warehouse design optimization”. In Proceedings of the 12th annual conference on Genetic andevolutionary computation, GECCO ’10, 1187–1194. New York, NY, USA: ACM.
Roy, B. 1991. “The Outranking Approach and the Foundations of ELECTRE Methods”. Theory andDecision 31:49–73.
Saaty, T. L. 1980. The Analytic Hierarchy Process: Planning, Priority Setting, Resource Allocation.McGraw-Hill.
Shir, O., J. Roslund, Z. Leghtas, and H. Rabitz. 2012. “Quantum control experiments as a testbed forevolutionary multi-objective algorithms”. Genetic Programming and Evolvable Machines 13:445–491.
Solow, A., and S. Polasky. 1994. “Measuring biological diversity”. Environmental and Ecological Statis-tics 1:95–103.
Ulrich, T., J. Bader, and L. Thiele. 2010. “Defining and Optimizing Indicator-Based Diversity Measuresin Multiobjective Search”. In PPSN-XI, 707–717.
Vesanto, J. 1999. “SOM-based data visualization methods”. Intelligent Data Analysis 3 (2): 111–126.Zitzler, E., K. Deb, and L. Thiele. 2000. “Comparison of Multiobjective Evolutionary Algorithms: Empirical
Results”. Evolutionary Computation 8 (2): 173–195.


![An Evolutionary Many-Objective Optimization Algorithm ...The Pareto-based EMO approach (see [16], [17], [21]), whose basic idea is to compare solutions according to Pareto dominance](https://img.pdfslide.us/doc/110x75/5fc1162b6e4b283a676ae063/an-evolutionary-many-objective-optimization-algorithm-the-pareto-based-emo-approach.jpg)