Embed Size (px)
Citation preview
Pareto Conference – Seadrill Per Wullf, Seadrill Chief Executive Officer
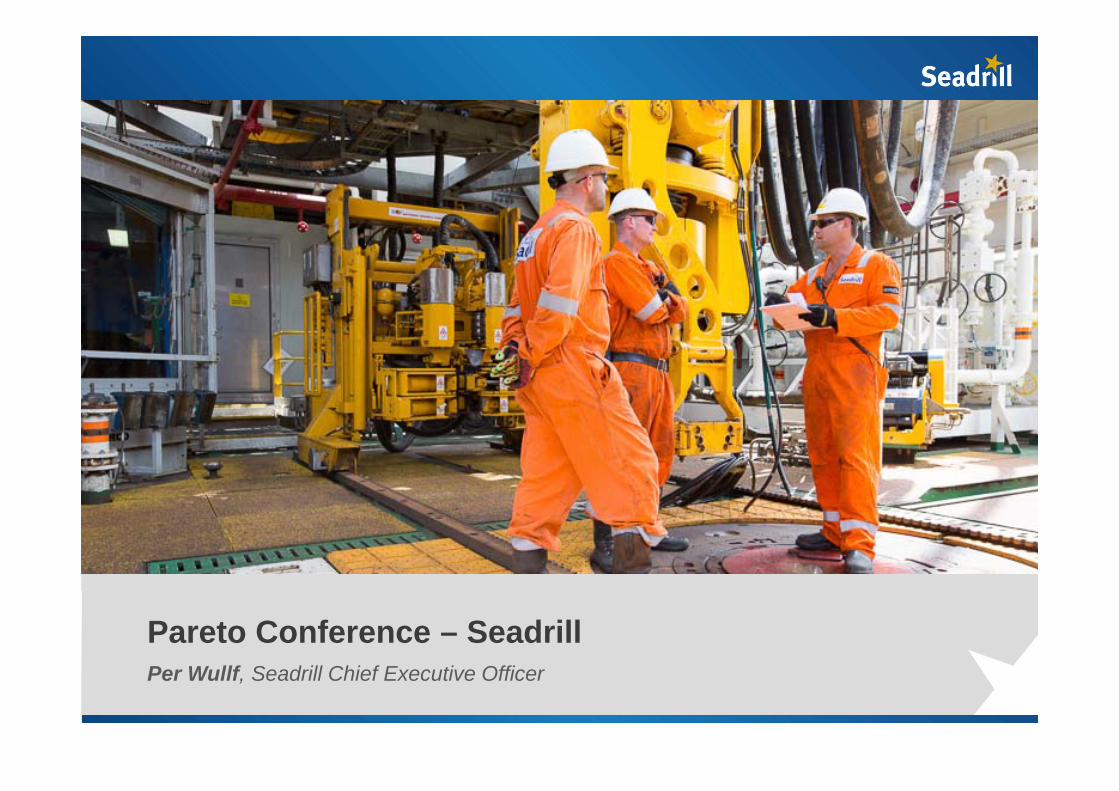
Seadrill is ten this year
• Listed in Oslo in 2005
• Acquired Smedvig in early
2006 - 4 rigs in North Sea; 7
tender rigs in SE Asia
• 2005 Seadrill Rev: $27mn
(part year)
2
2005 / 2006
• Receives US$ 4.1bn
commitment for 3 x 6 years
contracts with Petrobras
2008
• Seadrill Limited listed on The
New York Stock Exchange
2010
• Seadrill
Partners LLC
listed on
NYSE
2012
• Receives US$4 bn
commitment for 19 rig
years with BP
• 69 rigs, over 8,000
employees; recognized
industry leader
• 2014 Seadrill consolidated
(inc. NADL and Sevan) plus
Seadrill Partners revenue:
$6.3bn
Today
• Delivery of
UDW drillships
– Polaris,
Capella
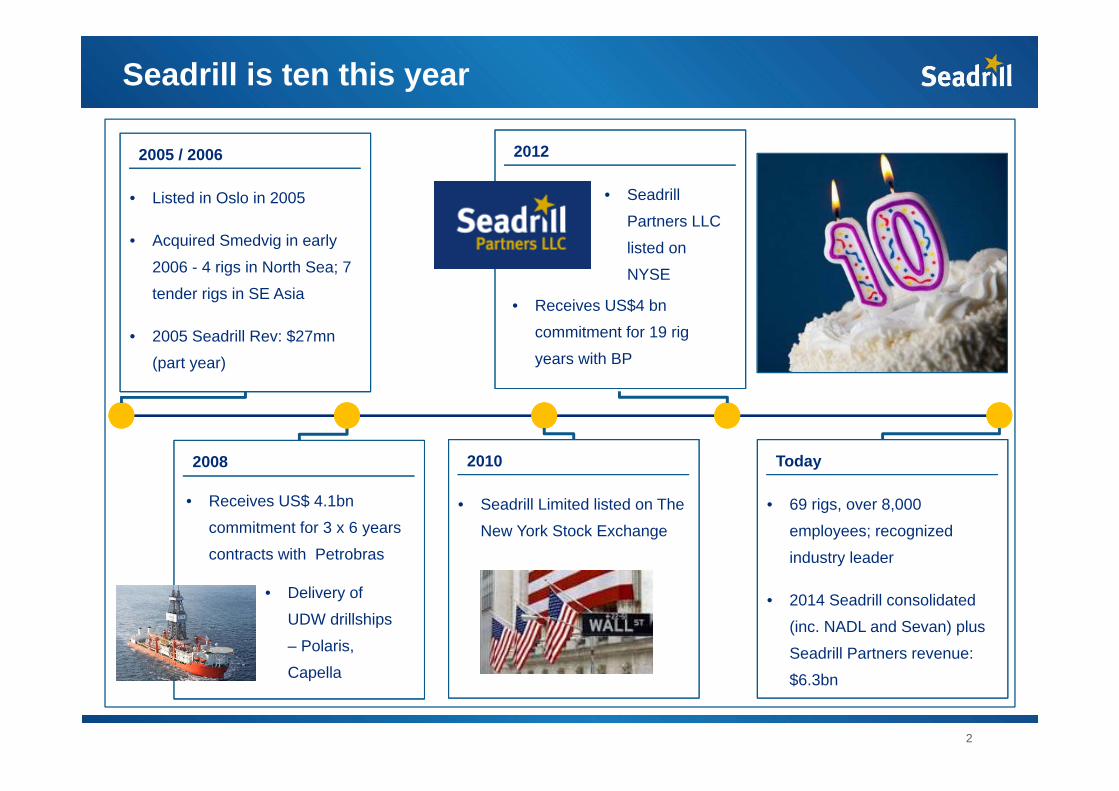
We’ve delivered on all five focus areas
3
Shipyards2 Funding3
Customers4Safe operations1
Cash savings5
Continued focus on safe, efficient operations
4
Safe operations1
Utilization across the fleet has been high…
…and HSE performance solid
• Improved trend in HSE focus areas (YTD Aug versus same period last year)– Hurts - 47%– Dropped Objects - 31%
• Continual improvement of the QHSE management system– Global alignment of HSE Directives– Systematic compliance process (Corporate Audit, Regional and Rig Verification)
• Technical utilization high at 95% YTD August (equal to results same period last year)
• 13 class projects executed YTD all on time and budget
• Four drill ships put in service since August 2014 (West Saturn, West Neptune, West
Jupiter and West Carina); all operating with technical utilization above 96%
* Under Water Survey In Lieu of Drydocking
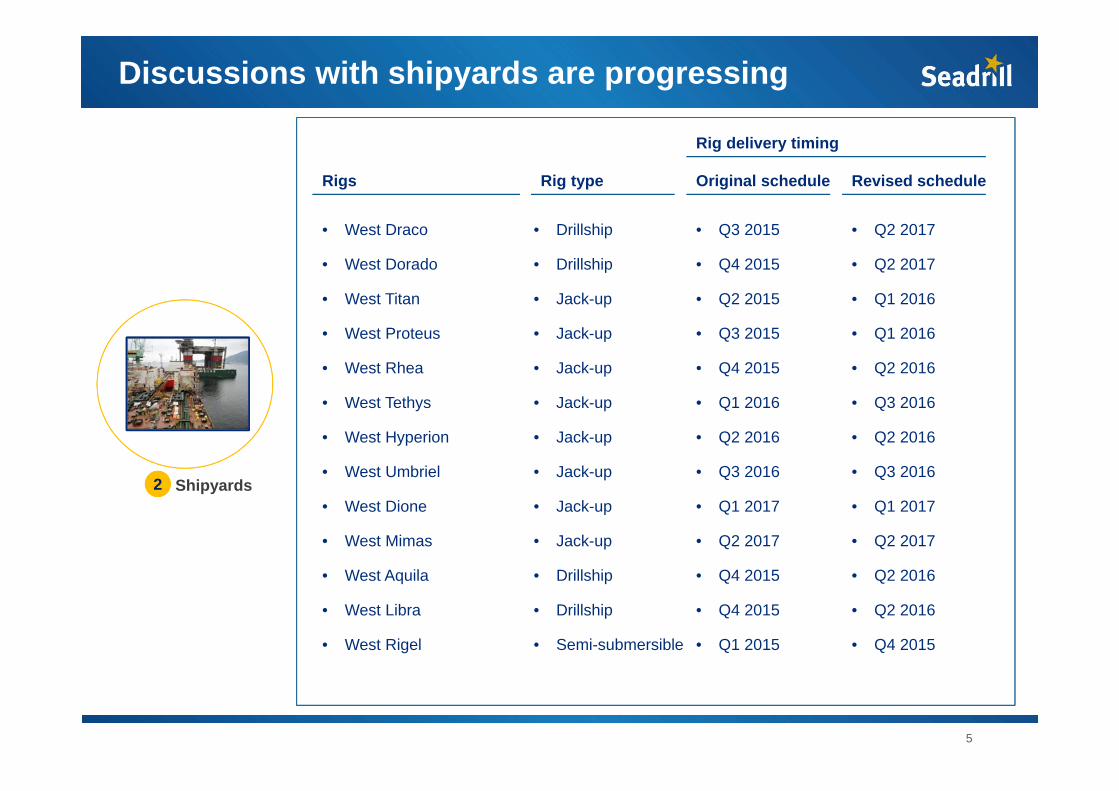
Discussions with shipyards are progressing
5
Shipyards2
Rigs
• West Draco
• West Dorado
• West Titan
• West Proteus
• West Rhea
• West Tethys
• West Hyperion
• West Umbriel
• West Dione
• West Mimas
• West Aquila
• West Libra
• West Rigel
Original schedule
• Q3 2015
• Q4 2015
• Q2 2015
• Q3 2015
• Q4 2015
• Q1 2016
• Q2 2016
• Q3 2016
• Q1 2017
• Q2 2017
• Q4 2015
• Q4 2015
• Q1 2015
Revised schedule
• Q2 2017
• Q2 2017
• Q1 2016
• Q1 2016
• Q2 2016
• Q3 2016
• Q2 2016
• Q3 2016
• Q1 2017
• Q2 2017
• Q2 2016
• Q2 2016
• Q4 2015
Rig delivery timing
Rig type
• Drillship
• Drillship
• Jack-up
• Jack-up
• Jack-up
• Jack-up
• Jack-up
• Jack-up
• Jack-up
• Jack-up
• Drillship
• Drillship
• Semi-submersible
Continuing to deliver on funding requirements
6
Look back since last year
• Over the last year…
– Instalments paid on loan facilities– Secured loan facilities refinanced– New debt - newbuilds, jack-up facility, others req.– Added cash to the balance sheet
• Agreed to a revised Leverage Ratio with our banking group
Funding3
Going forward
• For the rest of 2015 we have the following funding requirements
– West Mira facility – Bond maturing October, likely repaid with excess cash
• For 2016 we have two facilities maturing
– West Eminence facility in June, balloon payment– 4 jack-ups facility maturing October, balloon payment
• xx
US$1.1bn US$1.8bn US$4.25bn US$760mn
• xx
US$450mn US$350mn
• xx
US$337.5mn US$200mn
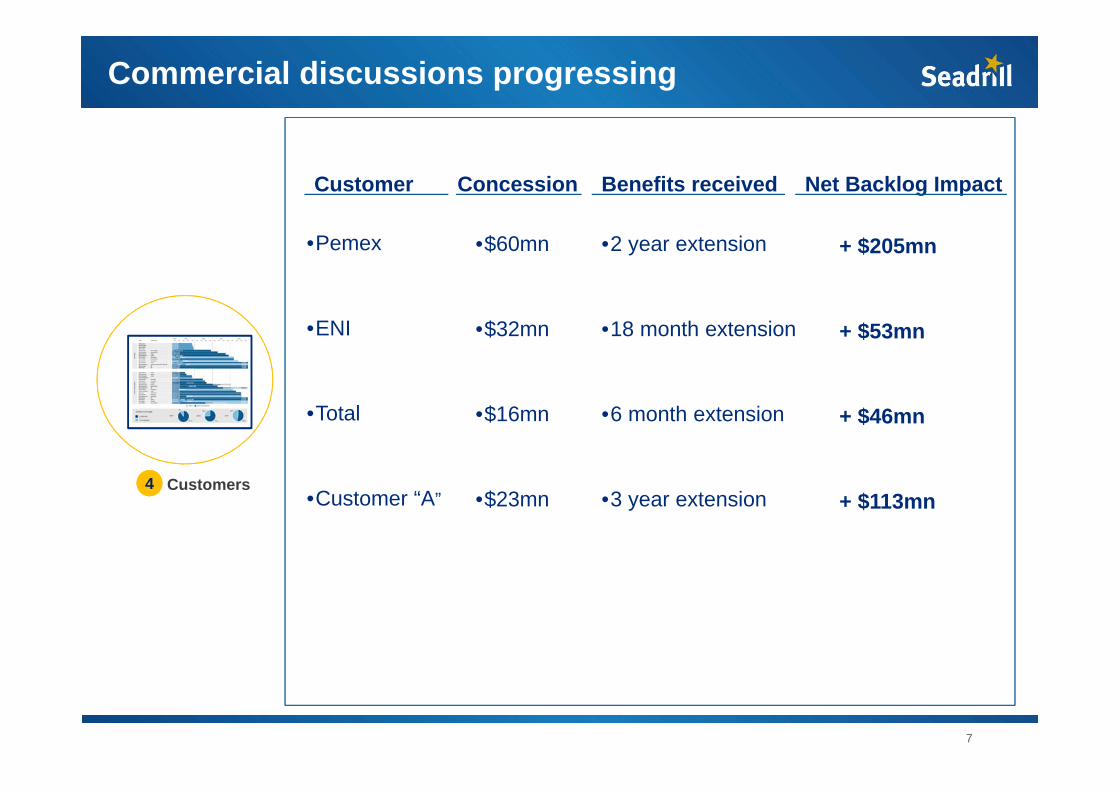
Commercial discussions progressing
7
Customer
•Pemex
•ENI
•Total
•Customer “A”
Concession
•$60mn
•$32mn
•$16mn
•$23mn
Benefits received
•2 year extension
•18 month extension
•6 month extension
•3 year extension
Net Backlog Impact
+ $205mn
+ $53mn
+ $46mn
+ $113mnCustomers4
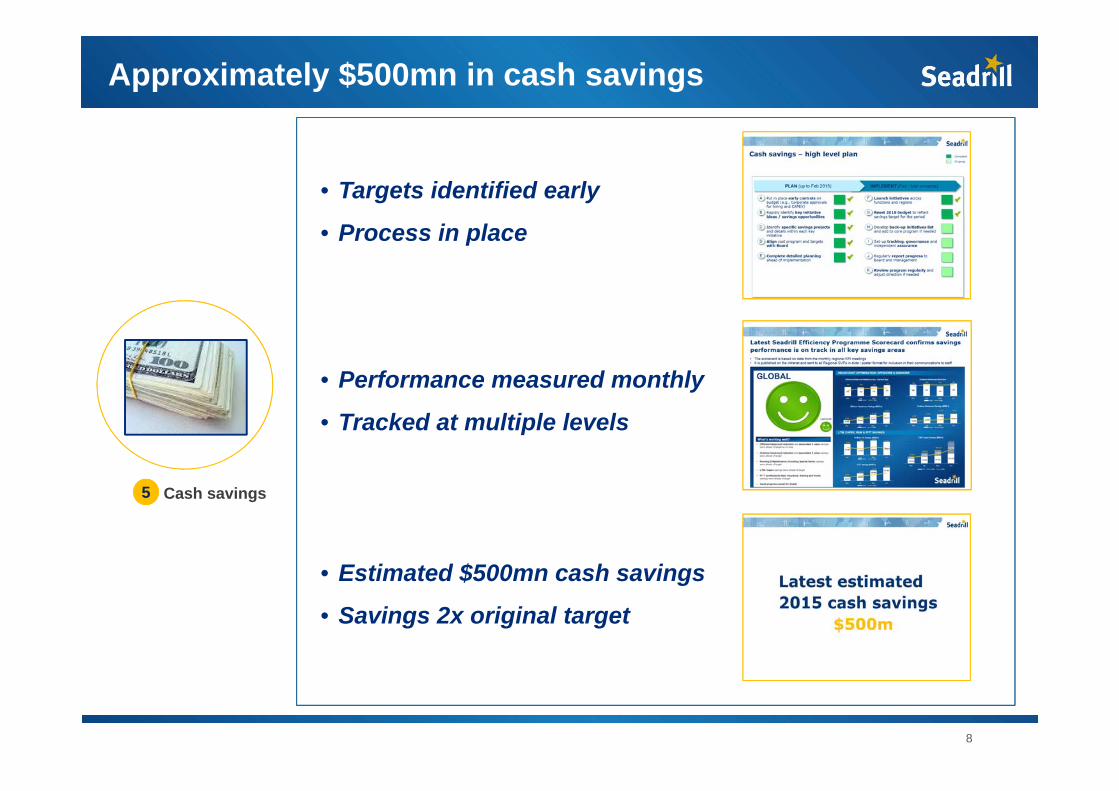
Approximately $500mn in cash savings
8
• Targets identified early
• Process in place
Cash savings5
• Performance measured monthly
• Tracked at multiple levels
• Estimated $500mn cash savings
• Savings 2x original target
9
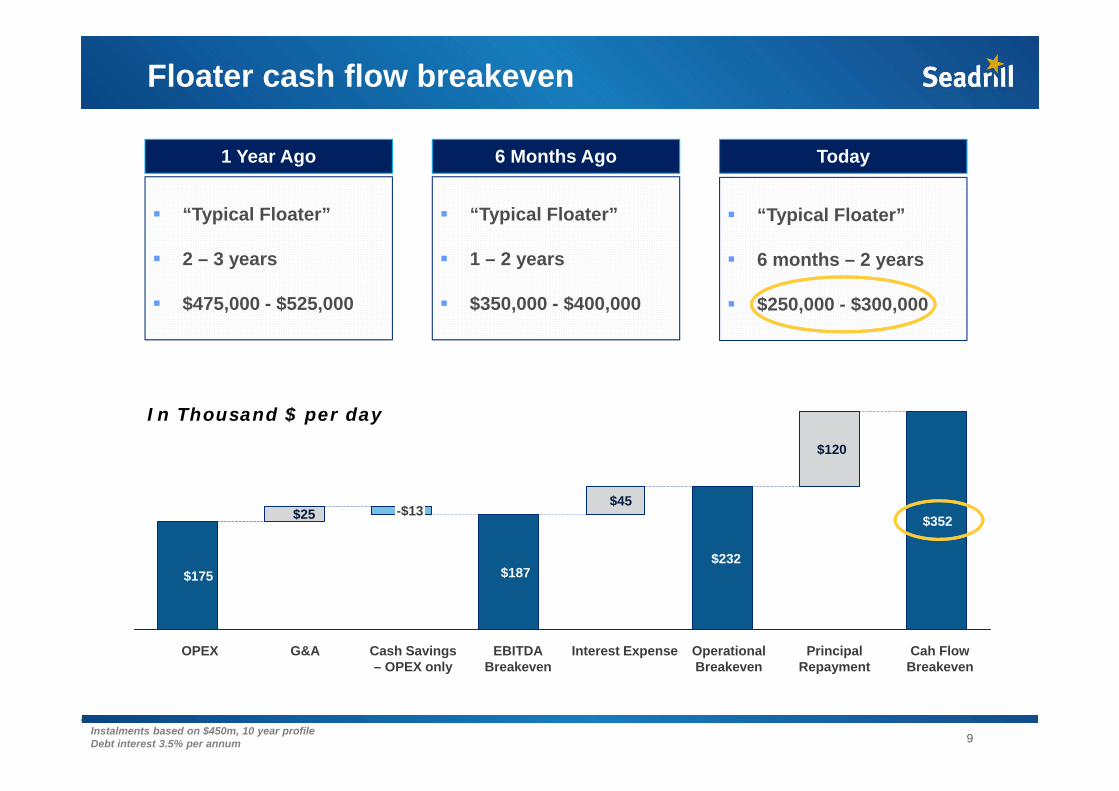
Floater cash flow breakeven
6 Months Ago
“Typical Floater”
1 – 2 years
$350,000 - $400,000
Today
“Typical Floater”
6 months – 2 years
$250,000 - $300,000
1 Year Ago
“Typical Floater”
2 – 3 years
$475,000 - $525,000
Instalments based on $450m, 10 year profileDebt interest 3.5% per annum
$45
Interest Expense
$232
Operational Breakeven
EBITDA Breakeven
$187
Cash Savings – OPEX only
G&A
$25
OPEX
$175
Cah Flow Breakeven
$352
Principal Repayment
$120
-$13
In Thousand $ per day
10
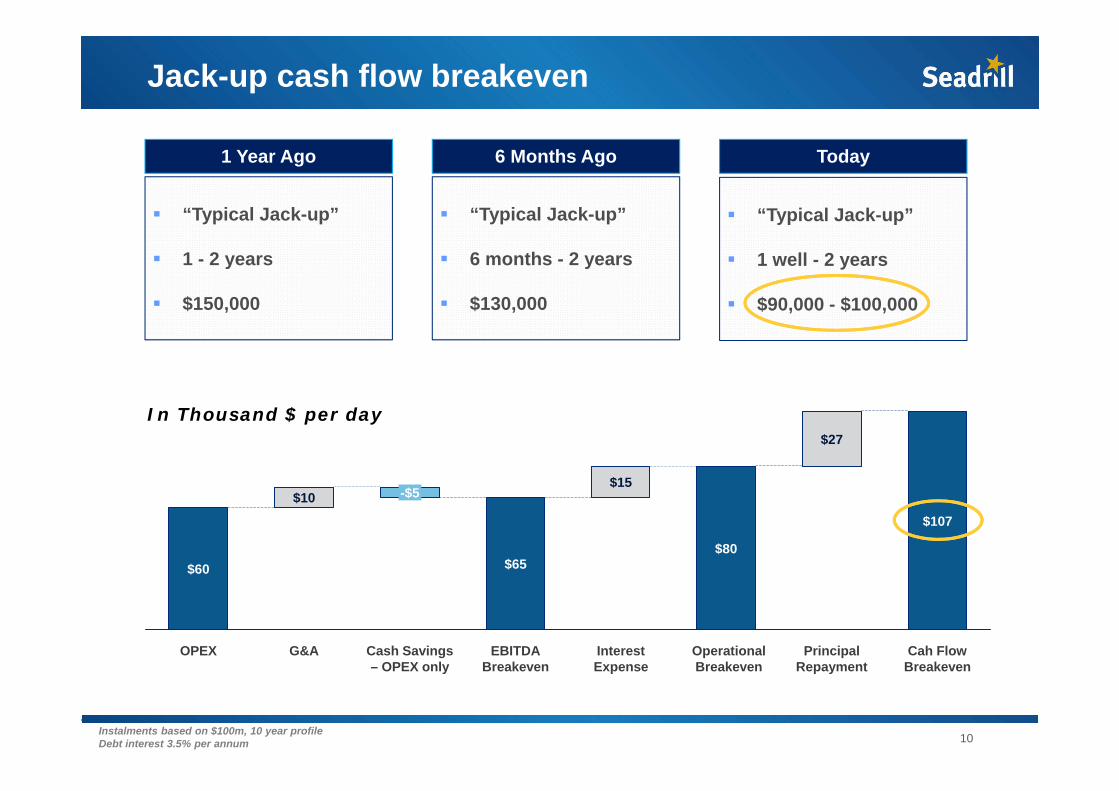
Jack-up cash flow breakeven
6 Months Ago
“Typical Jack-up”
6 months - 2 years
$130,000
“Typical Jack-up”
1 well - 2 years
$90,000 - $100,000
1 Year Ago
“Typical Jack-up”
1 - 2 years
$150,000
Today
Instalments based on $100m, 10 year profileDebt interest 3.5% per annum
In Thousand $ per day
OPEX Principal Repayment
Cah Flow Breakeven
G&A Cash Savings – OPEX only
$60
$10
$65
$15
$80
$107
EBITDA Breakeven
Interest Expense
-$5
$27
Operational Breakeven
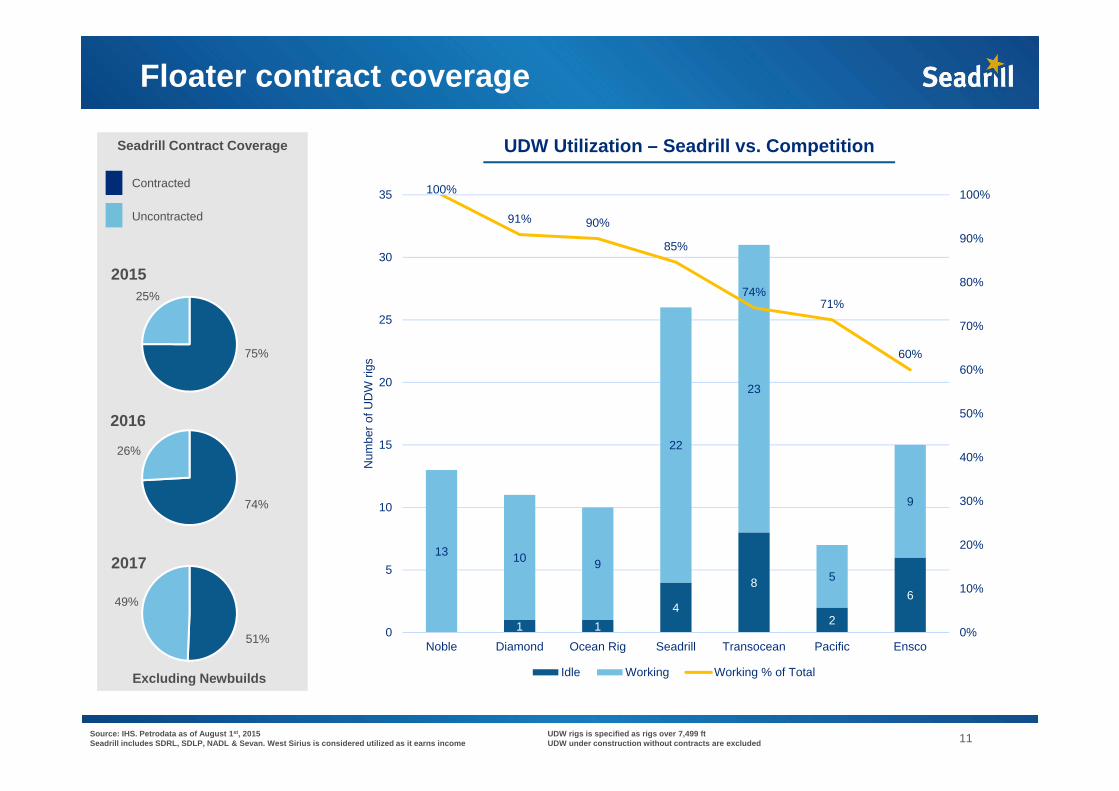
Source: IHS. Petrodata as of August 1st, 2015Seadrill includes SDRL, SDLP, NADL & Sevan. West Sirius is considered utilized as it earns income
UDW rigs is specified as rigs over 7,499 ftUDW under construction without contracts are excluded
We’re having very difficult conversationsFloater contract coverage
44%65%
84%
Seadrill Contract Coverage
Contracted
Uncontracted
2015
2016
2017
75%
25%
74%
26%
51%
49%
UDW Utilization – Seadrill vs. Competition
1 14
8
2
6
13 10 9
22
23
5
9
100%
91% 90%
85%
74%71%
60%
0%
10%
20%
30%
40%
50%
60%
70%
80%
90%
100%
0
5
10
15
20
25
30
35
Noble Diamond Ocean Rig Seadrill Transocean Pacific Ensco
Num
ber o
f UD
W ri
gs
Idle Working Working % of TotalExcluding Newbuilds
11
12
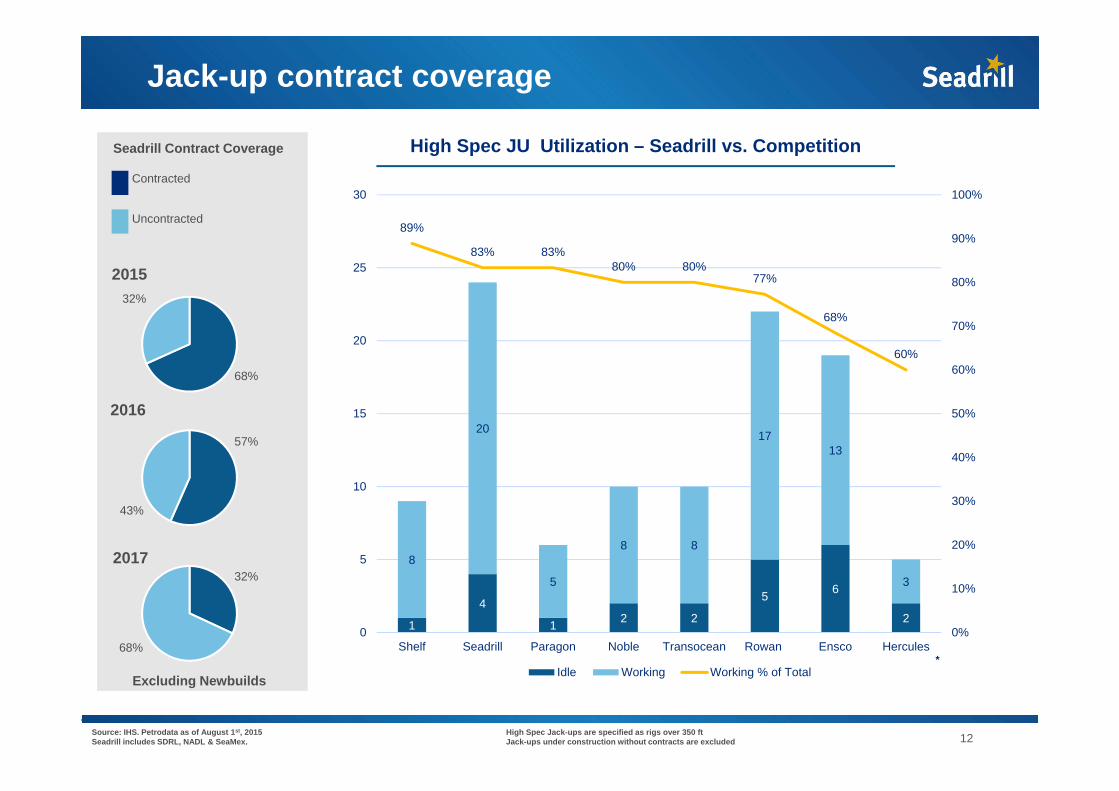
Jack-up contract coverage
44%65%
84%
Seadrill Contract Coverage
Contracted
Uncontracted
2015
2016
2017
High Spec JU Utilization – Seadrill vs. Competition
68%
32%
43%
57%
32%
68%*
1
4
1 2 2
5 6
2
8
20
5
8 8
1713
3
89%
83% 83%80% 80%
77%
68%
60%
0%
10%
20%
30%
40%
50%
60%
70%
80%
90%
100%
0
5
10
15
20
25
30
Shelf Seadrill Paragon Noble Transocean Rowan Ensco Hercules
Idle Working Working % of Total
Source: IHS. Petrodata as of August 1st, 2015Seadrill includes SDRL, NADL & SeaMex.
High Spec Jack-ups are specified as rigs over 350 ftJack-ups under construction without contracts are excluded
Excluding Newbuilds
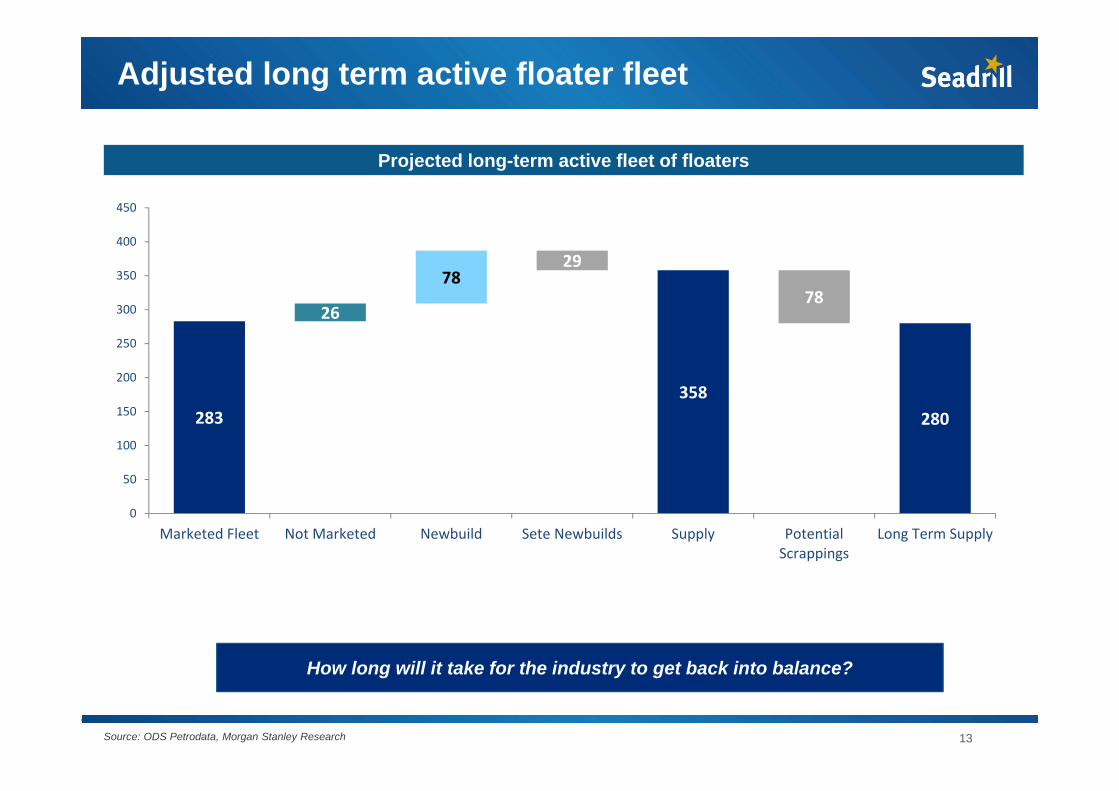
Projected long-term active fleet of floaters
Source: ODS Petrodata, Morgan Stanley Research
Adjusted long term active floater fleet
283 283 280
26
358
7878
29
0
50
100
150
200
250
300
350
400
450
Marketed Fleet Not Marketed Newbuild Sete Newbuilds Supply PotentialScrappings
Long Term Supply
How long will it take for the industry to get back into balance?
13
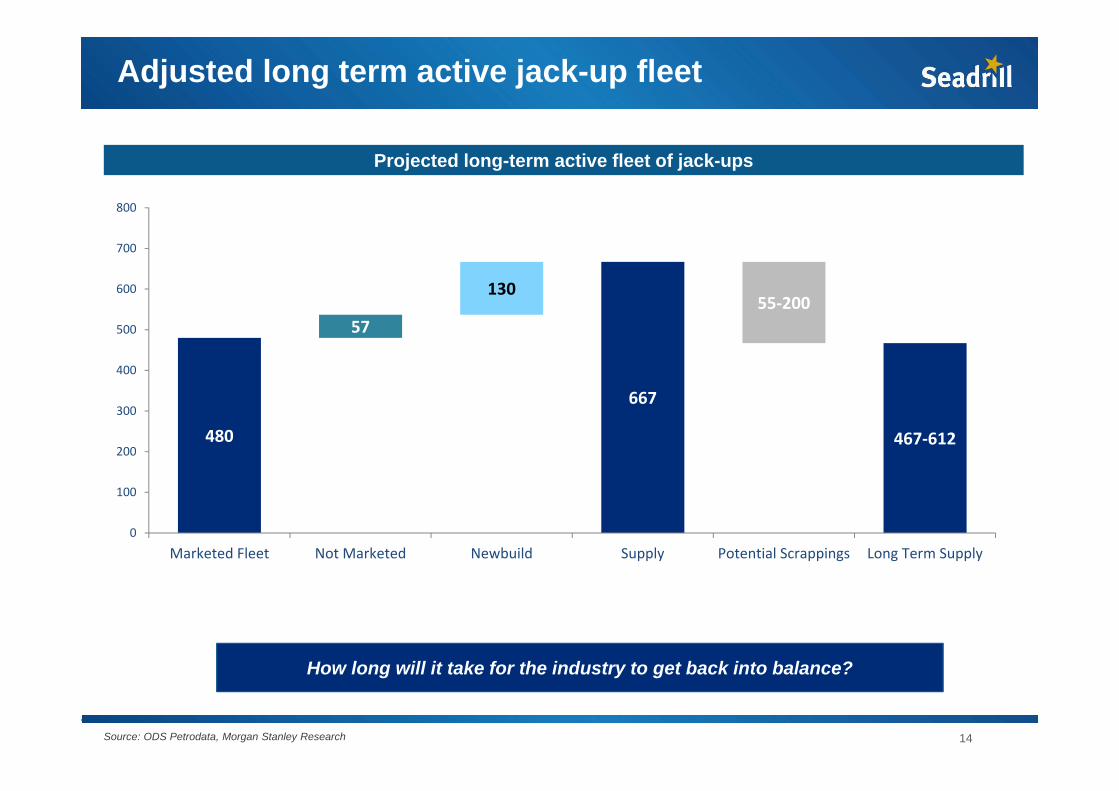
Projected long-term active fleet of jack-ups
Source: ODS Petrodata, Morgan Stanley Research
Adjusted long term active jack-up fleet
480 537467‐612
57
667
55‐200130
0
100
200
300
400
500
600
700
800
Marketed Fleet Not Marketed Newbuild Supply Potential Scrappings Long Term Supply
How long will it take for the industry to get back into balance?
14
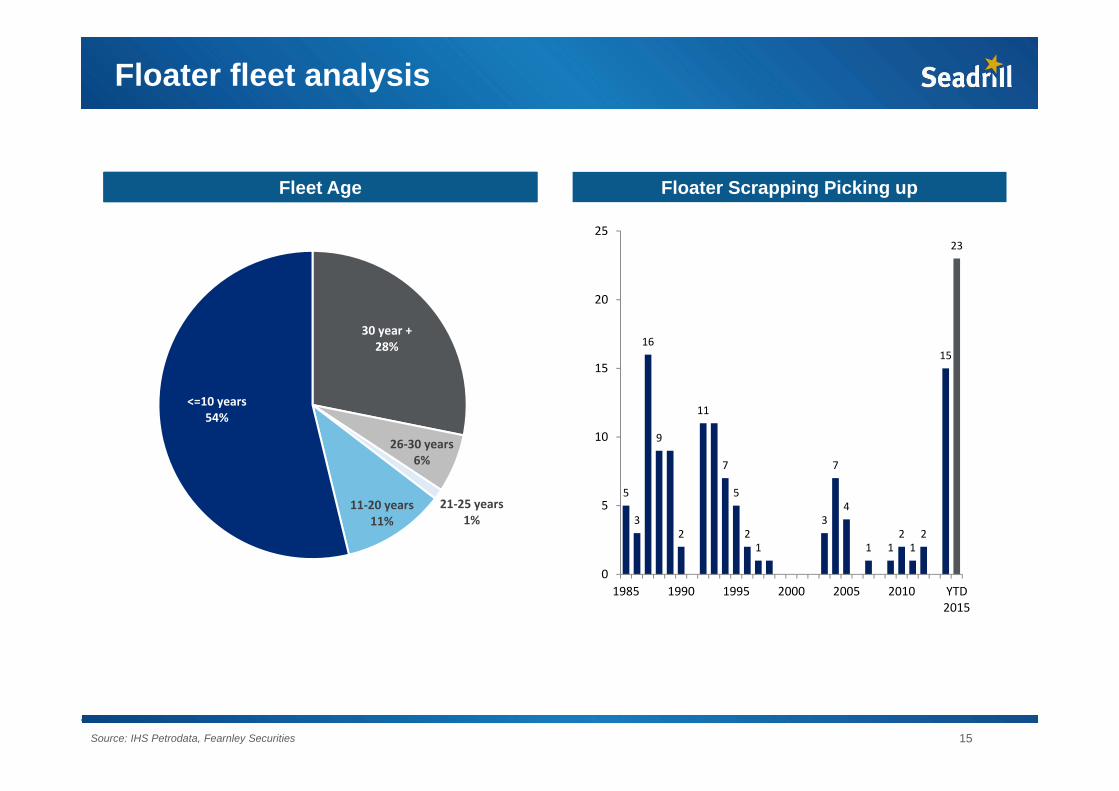
30 year +28%
26‐30 years6%
21‐25 years1%
11‐20 years11%
<=10 years54%
Average floater age today: 17 years
15
Average floater age today: 17 years
Floater fleet analysis
Source: IHS Petrodata, Fearnley Securities
Fleet Age Floater Scrapping Picking up
5
3
16
9
2
11
7
5
21
3
7
4
1 1212
15
23
0
5
10
15
20
25
1985 1990 1995 2000 2005 2010 YTD2015
Average floater age today: 17 years
16
Average floater age today: 17 years
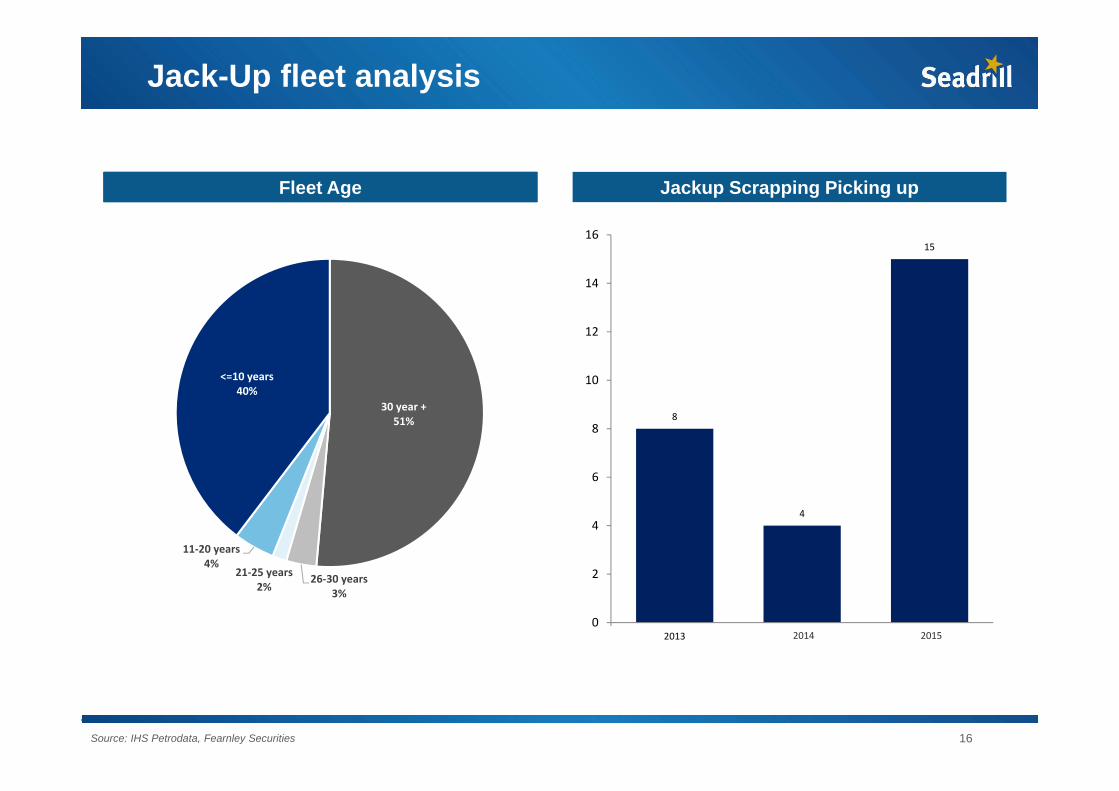
Jack-Up fleet analysis
Source: IHS Petrodata, Fearnley Securities
Fleet Age Jackup Scrapping Picking up
8
4
15
0
2
4
6
8
10
12
14
16
2013 2014 2015
30 year +51%
26‐30 years3%
21‐25 years2%
11‐20 years4%
<=10 years40%
Delivered on the most important actions this year
Conclusion
17
Strengthened the balance sheet
Reset operating costs and saved cash
Negotiated effectively with customers, shipyards, and banks
Consolidation will happen and we will be sitting in the driver’s seat when the industry returns to growth