Embed Size (px)
Citation preview
Measuring
College and
Career
Readiness
PARCC RESULTS:
SPRING 2015 AND
SPRING 2016
ADMINISTRATIONS
BELLEVILLE PUBLIC SCHOOLS
OCTOBER 17, 2016
RICARDO L. ACOSTA, ED.S.
DIRECTOR OF PLANNING, RESEARCH, AND
EVALUATION/DISTRICT TESTING COORDINATOR
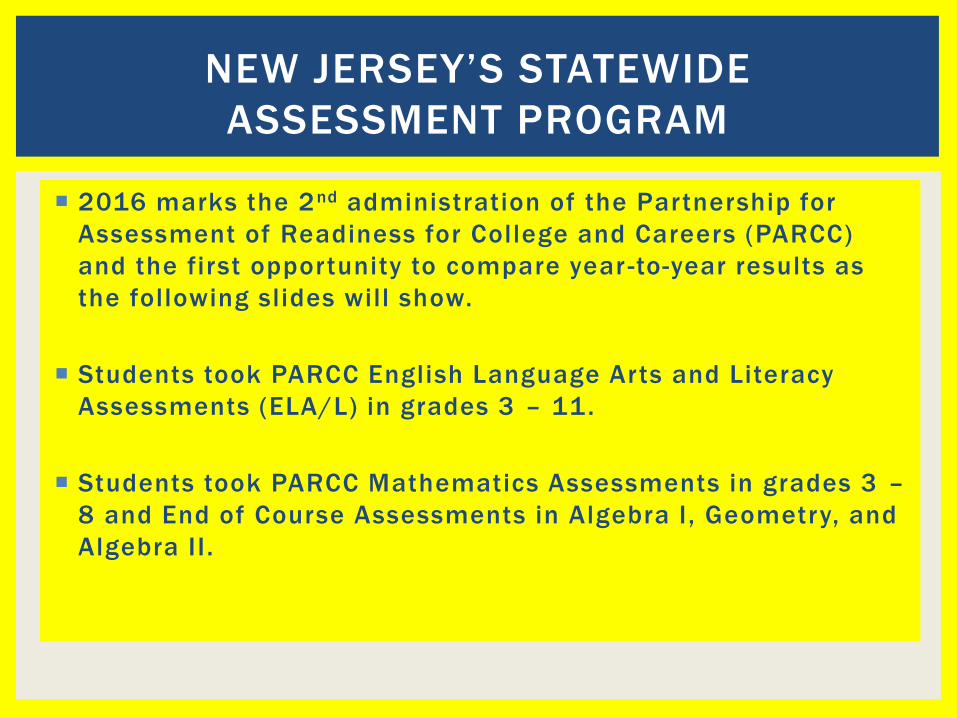
2016 marks the 2nd administration of the Partnership for
Assessment of Readiness for College and Careers (PARCC)
and the first opportunity to compare year -to-year results as
the following slides will show.
Students took PARCC English Language Arts and Literacy
Assessments (ELA/L) in grades 3 – 11.
Students took PARCC Mathematics Assessments in grades 3 –
8 and End of Course Assessments in Algebra I, Geometry, and
Algebra II.
NEW JERSEY’S STATEWIDE
ASSESSMENT PROGRAM
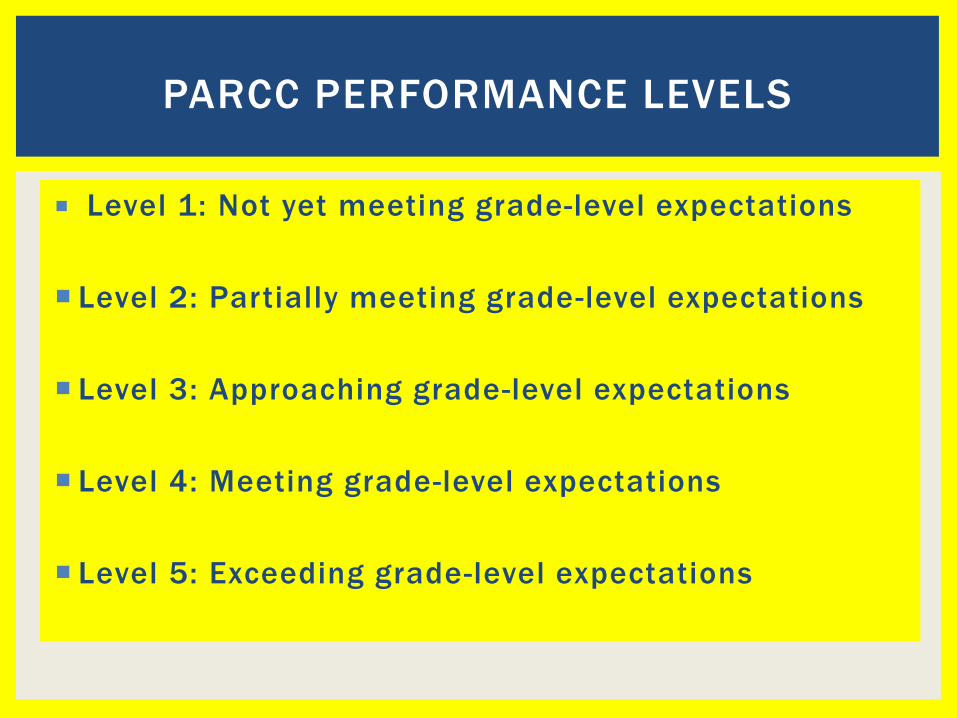
Level 1: Not yet meeting grade-level expectations
Level 2: Partially meeting grade-level expectations
Level 3: Approaching grade-level expectations
Level 4: Meeting grade-level expectations
Level 5: Exceeding grade-level expectations
PARCC PERFORMANCE LEVELS
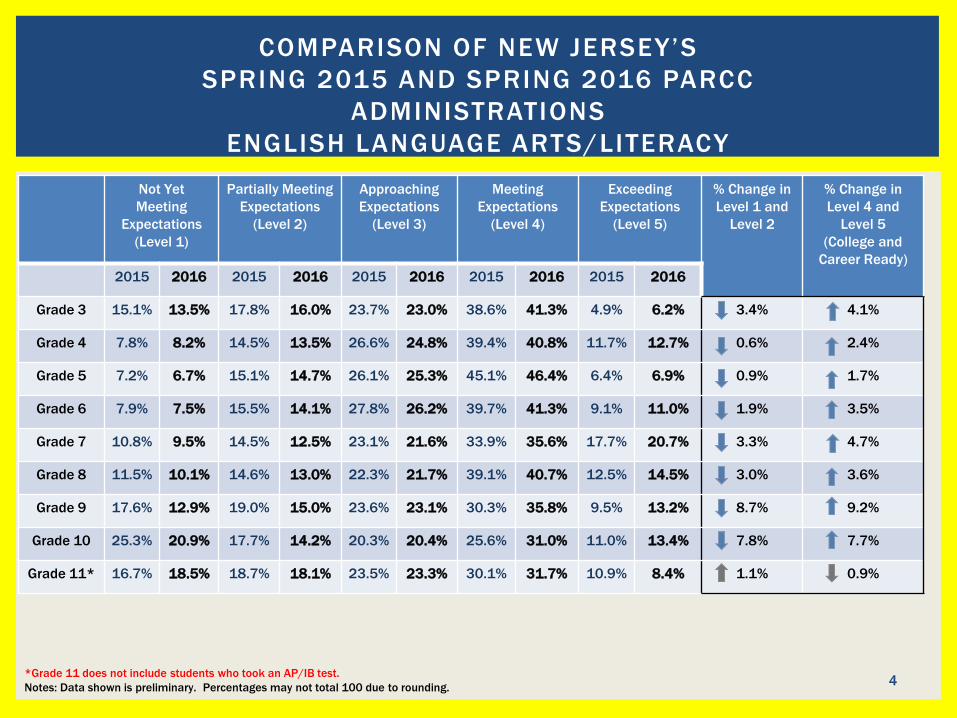
COMPARISON OF NEW JERSEY’S
SPRING 2015 AND SPRING 2016 PARCC
ADMINISTRATIONS
ENGLISH LANGUAGE ARTS/LITERACY
Not Yet
Meeting
Expectations
(Level 1)
Partially Meeting
Expectations
(Level 2)
Approaching
Expectations
(Level 3)
Meeting
Expectations
(Level 4)
Exceeding
Expectations
(Level 5)
% Change in
Level 1 and
Level 2
% Change in
Level 4 and
Level 5
(College and
Career Ready)
2015 2016 2015 2016 2015 2016 2015 2016 2015 2016
Grade 3 15.1% 13.5% 17.8% 16.0% 23.7% 23.0% 38.6% 41.3% 4.9% 6.2% 3.4% 4.1%
Grade 4 7.8% 8.2% 14.5% 13.5% 26.6% 24.8% 39.4% 40.8% 11.7% 12.7% 0.6% 2.4%
Grade 5 7.2% 6.7% 15.1% 14.7% 26.1% 25.3% 45.1% 46.4% 6.4% 6.9% 0.9% 1.7%
Grade 6 7.9% 7.5% 15.5% 14.1% 27.8% 26.2% 39.7% 41.3% 9.1% 11.0% 1.9% 3.5%
Grade 7 10.8% 9.5% 14.5% 12.5% 23.1% 21.6% 33.9% 35.6% 17.7% 20.7% 3.3% 4.7%
Grade 8 11.5% 10.1% 14.6% 13.0% 22.3% 21.7% 39.1% 40.7% 12.5% 14.5% 3.0% 3.6%
Grade 9 17.6% 12.9% 19.0% 15.0% 23.6% 23.1% 30.3% 35.8% 9.5% 13.2% 8.7% 9.2%
Grade 10 25.3% 20.9% 17.7% 14.2% 20.3% 20.4% 25.6% 31.0% 11.0% 13.4% 7.8% 7.7%
Grade 11* 16.7% 18.5% 18.7% 18.1% 23.5% 23.3% 30.1% 31.7% 10.9% 8.4% 1.1% 0.9%
*Grade 11 does not include students who took an AP/IB test.
Notes: Data shown is preliminary. Percentages may not total 100 due to rounding.4
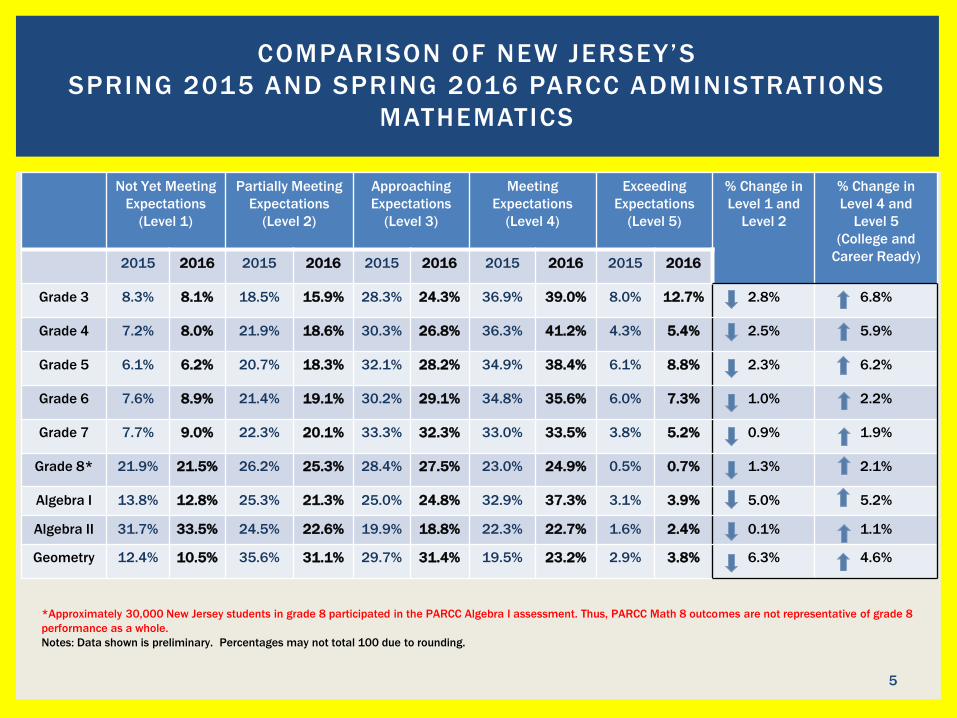
COMPARISON OF NEW JERSEY’S
SPRING 2015 AND SPRING 2016 PARCC ADMINISTRATIONS
MATHEMATICS
Not Yet Meeting
Expectations
(Level 1)
Partially Meeting
Expectations
(Level 2)
Approaching
Expectations
(Level 3)
Meeting
Expectations
(Level 4)
Exceeding
Expectations
(Level 5)
% Change in
Level 1 and
Level 2
% Change in
Level 4 and
Level 5
(College and
Career Ready)2015 2016 2015 2016 2015 2016 2015 2016 2015 2016
Grade 3 8.3% 8.1% 18.5% 15.9% 28.3% 24.3% 36.9% 39.0% 8.0% 12.7% 2.8% 6.8%
Grade 4 7.2% 8.0% 21.9% 18.6% 30.3% 26.8% 36.3% 41.2% 4.3% 5.4% 2.5% 5.9%
Grade 5 6.1% 6.2% 20.7% 18.3% 32.1% 28.2% 34.9% 38.4% 6.1% 8.8% 2.3% 6.2%
Grade 6 7.6% 8.9% 21.4% 19.1% 30.2% 29.1% 34.8% 35.6% 6.0% 7.3% 1.0% 2.2%
Grade 7 7.7% 9.0% 22.3% 20.1% 33.3% 32.3% 33.0% 33.5% 3.8% 5.2% 0.9% 1.9%
Grade 8* 21.9% 21.5% 26.2% 25.3% 28.4% 27.5% 23.0% 24.9% 0.5% 0.7% 1.3% 2.1%
Algebra I 13.8% 12.8% 25.3% 21.3% 25.0% 24.8% 32.9% 37.3% 3.1% 3.9% 5.0% 5.2%
Algebra II 31.7% 33.5% 24.5% 22.6% 19.9% 18.8% 22.3% 22.7% 1.6% 2.4% 0.1% 1.1%
Geometry 12.4% 10.5% 35.6% 31.1% 29.7% 31.4% 19.5% 23.2% 2.9% 3.8% 6.3% 4.6%
5
*Approximately 30,000 New Jersey students in grade 8 participated in the PARCC Algebra I assessment. Thus, PARCC Math 8 outcomes are not representative of grade 8
performance as a whole.
Notes: Data shown is preliminary. Percentages may not total 100 due to rounding.
Students Tested
Year to Year Increase
2016 2015
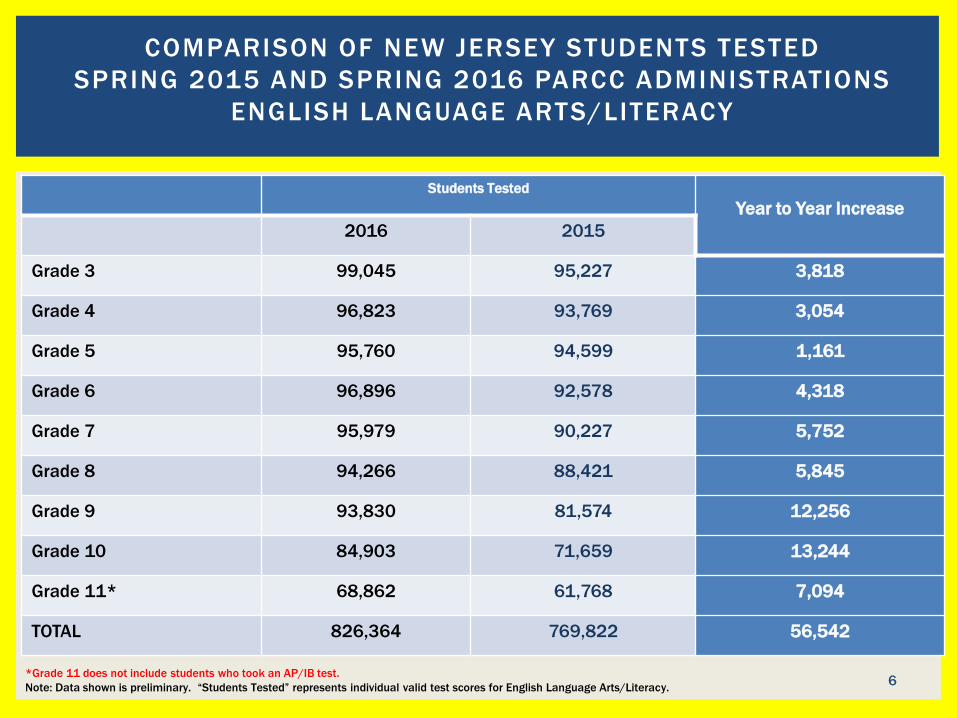
Grade 3 99,045 95,227 3,818
Grade 4 96,823 93,769 3,054
Grade 5 95,760 94,599 1,161
Grade 6 96,896 92,578 4,318
Grade 7 95,979 90,227 5,752
Grade 8 94,266 88,421 5,845
Grade 9 93,830 81,574 12,256
Grade 10 84,903 71,659 13,244
Grade 11* 68,862 61,768 7,094
TOTAL 826,364 769,822 56,542
COMPARISON OF NEW JERSEY STUDENTS TESTED
SPRING 2015 AND SPRING 2016 PARCC ADMINISTRATIONS
ENGLISH LANGUAGE ARTS/LITERACY
*Grade 11 does not include students who took an AP/IB test.
Note: Data shown is preliminary. “Students Tested” represents individual valid test scores for English Language Arts/Literacy.6
Students Tested
Year to Year Increase
2016 2015
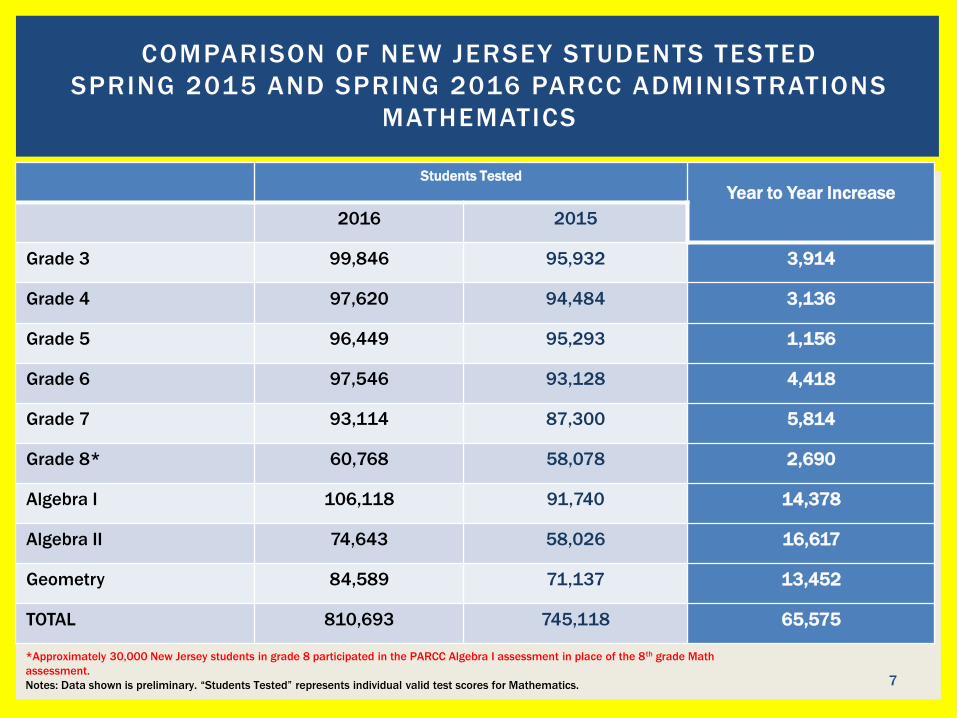
Grade 3 99,846 95,932 3,914
Grade 4 97,620 94,484 3,136
Grade 5 96,449 95,293 1,156
Grade 6 97,546 93,128 4,418
Grade 7 93,114 87,300 5,814
Grade 8* 60,768 58,078 2,690
Algebra I 106,118 91,740 14,378
Algebra II 74,643 58,026 16,617
Geometry 84,589 71,137 13,452
TOTAL 810,693 745,118 65,575
COMPARISON OF NEW JERSEY STUDENTS TESTED
SPRING 2015 AND SPRING 2016 PARCC ADMINISTRATIONS
MATHEMATICS
*Approximately 30,000 New Jersey students in grade 8 participated in the PARCC Algebra I assessment in place of the 8th grade Math
assessment.
Notes: Data shown is preliminary. “Students Tested” represents individual valid test scores for Mathematics. 7
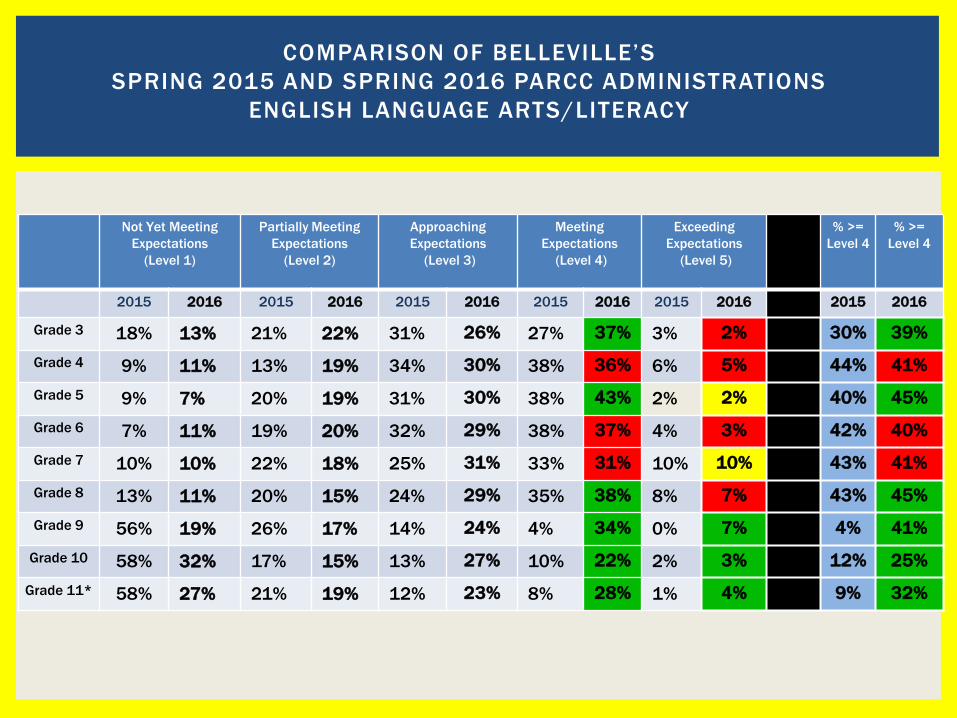
COMPARISON OF BELLEVILLE’S
SPRING 2015 AND SPRING 2016 PARCC ADMINISTRATIONS
ENGLISH LANGUAGE ARTS/LITERACY
Not Yet Meeting
Expectations
(Level 1)
Partially Meeting
Expectations
(Level 2)
Approaching
Expectations
(Level 3)
Meeting
Expectations
(Level 4)
Exceeding
Expectations
(Level 5)
% >=
Level 4
% >=
Level 4
2015 2016 2015 2016 2015 2016 2015 2016 2015 2016 2015 2016
Grade 3 18% 13% 21% 22% 31% 26% 27% 37% 3% 2% 30% 39%
Grade 4 9% 11% 13% 19% 34% 30% 38% 36% 6% 5% 44% 41%
Grade 5 9% 7% 20% 19% 31% 30% 38% 43% 2% 2% 40% 45%
Grade 6 7% 11% 19% 20% 32% 29% 38% 37% 4% 3% 42% 40%
Grade 7 10% 10% 22% 18% 25% 31% 33% 31% 10% 10% 43% 41%
Grade 8 13% 11% 20% 15% 24% 29% 35% 38% 8% 7% 43% 45%
Grade 9 56% 19% 26% 17% 14% 24% 4% 34% 0% 7% 4% 41%
Grade 10 58% 32% 17% 15% 13% 27% 10% 22% 2% 3% 12% 25%
Grade 11* 58% 27% 21% 19% 12% 23% 8% 28% 1% 4% 9% 32%
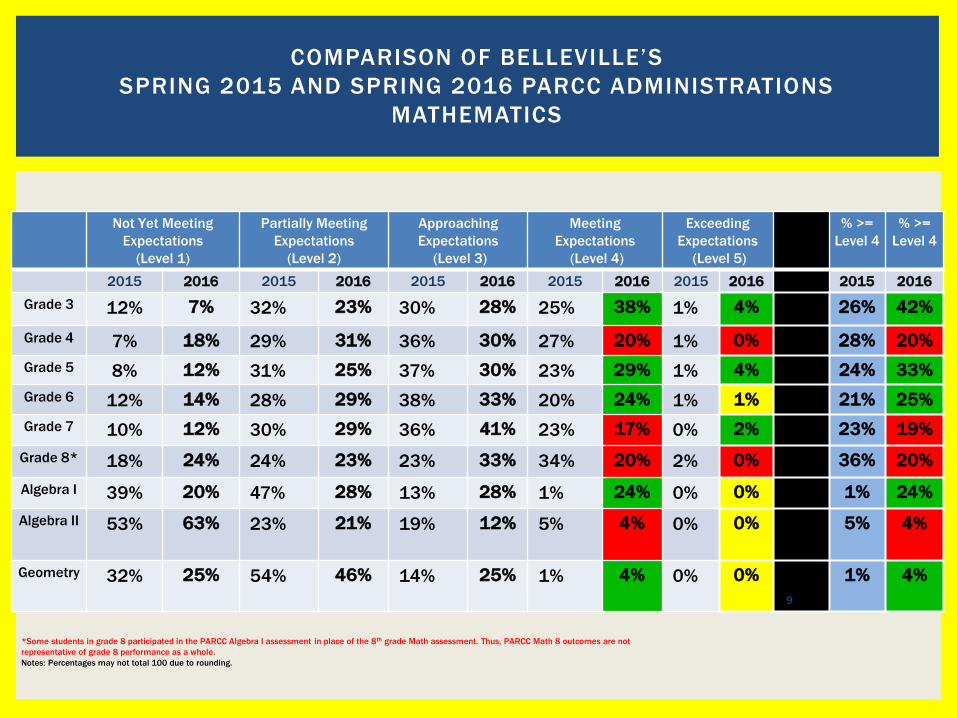
COMPARISON OF BELLEVILLE’S
SPRING 2015 AND SPRING 2016 PARCC ADMINISTRATIONS
MATHEMATICS
Not Yet Meeting
Expectations
(Level 1)
Partially Meeting
Expectations
(Level 2)
Approaching
Expectations
(Level 3)
Meeting
Expectations
(Level 4)
Exceeding
Expectations
(Level 5)
% >=
Level 4
% >=
Level 4
2015 2016 2015 2016 2015 2016 2015 2016 2015 2016 2015 2016
Grade 3 12% 7% 32% 23% 30% 28% 25% 38% 1% 4% 26% 42%
Grade 4 7% 18% 29% 31% 36% 30% 27% 20% 1% 0% 28% 20%
Grade 5 8% 12% 31% 25% 37% 30% 23% 29% 1% 4% 24% 33%
Grade 6 12% 14% 28% 29% 38% 33% 20% 24% 1% 1% 21% 25%
Grade 7 10% 12% 30% 29% 36% 41% 23% 17% 0% 2% 23% 19%
Grade 8* 18% 24% 24% 23% 23% 33% 34% 20% 2% 0% 36% 20%
Algebra I 39% 20% 47% 28% 13% 28% 1% 24% 0% 0% 1% 24%
Algebra II 53% 63% 23% 21% 19% 12% 5% 4% 0% 0% 5% 4%
Geometry 32% 25% 54% 46% 14% 25% 1% 4% 0% 0% 1% 4%
*Some students in grade 8 participated in the PARCC Algebra I assessment in place of the 8th grade Math assessment. Thus, PARCC Math 8 outcomes are not
representative of grade 8 performance as a whole.
Notes: Percentages may not total 100 due to rounding.
9
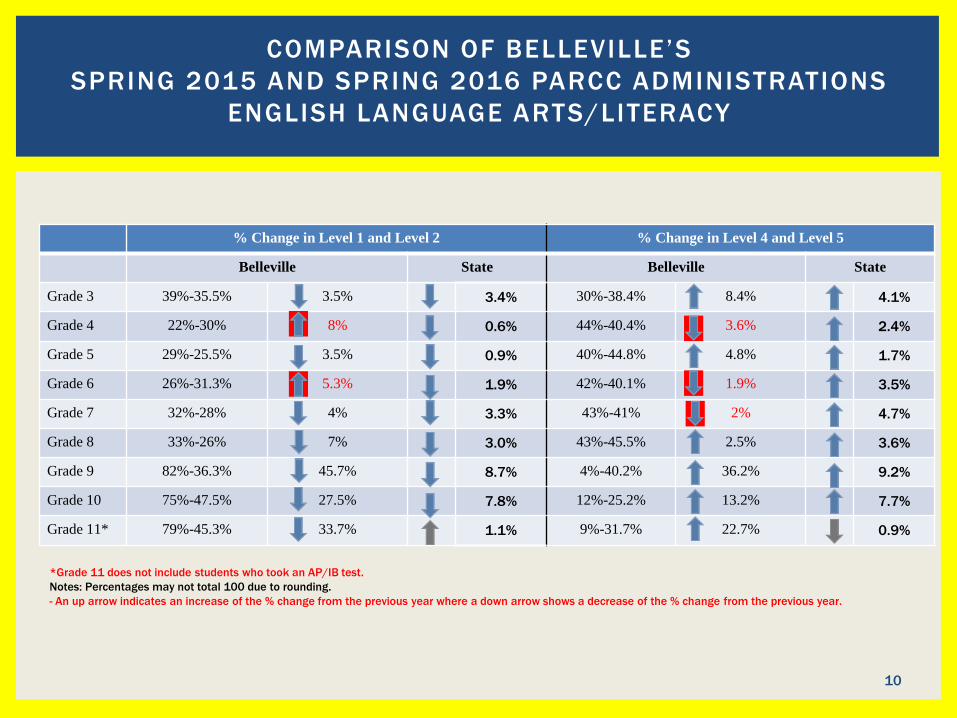
% Change in Level 1 and Level 2 % Change in Level 4 and Level 5
Belleville State Belleville State
Grade 3 39%-35.5% 3.5% 3.4% 30%-38.4% 8.4% 4.1%
Grade 4 22%-30% 8% 0.6% 44%-40.4% 3.6% 2.4%
Grade 5 29%-25.5% 3.5% 0.9% 40%-44.8% 4.8% 1.7%
Grade 6 26%-31.3% 5.3% 1.9% 42%-40.1% 1.9% 3.5%
Grade 7 32%-28% 4% 3.3% 43%-41% 2% 4.7%
Grade 8 33%-26% 7% 3.0% 43%-45.5% 2.5% 3.6%
Grade 9 82%-36.3% 45.7% 8.7% 4%-40.2% 36.2% 9.2%
Grade 10 75%-47.5% 27.5% 7.8% 12%-25.2% 13.2% 7.7%
Grade 11* 79%-45.3% 33.7% 1.1% 9%-31.7% 22.7% 0.9%
*Grade 11 does not include students who took an AP/IB test.
Notes: Percentages may not total 100 due to rounding.
- An up arrow indicates an increase of the % change from the previous year where a down arrow shows a decrease of the % change from the previous year.
10
COMPARISON OF BELLEVILLE’S
SPRING 2015 AND SPRING 2016 PARCC ADMINISTRATIONS
ENGLISH LANGUAGE ARTS/LITERACY
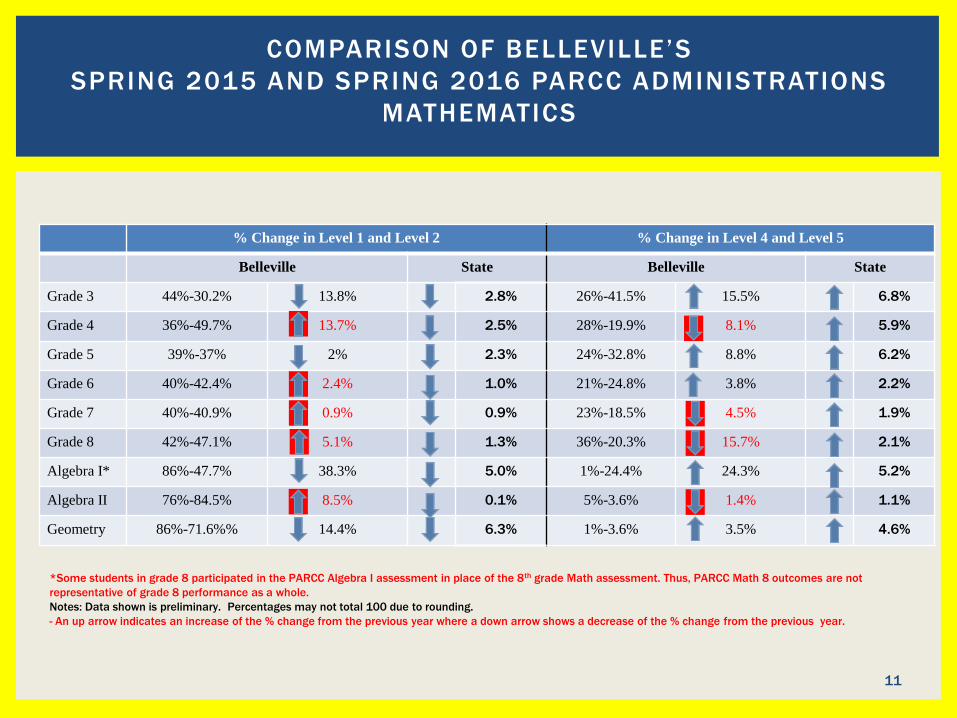
% Change in Level 1 and Level 2 % Change in Level 4 and Level 5
Belleville State Belleville State
Grade 3 44%-30.2% 13.8% 2.8% 26%-41.5% 15.5% 6.8%
Grade 4 36%-49.7% 13.7% 2.5% 28%-19.9% 8.1% 5.9%
Grade 5 39%-37% 2% 2.3% 24%-32.8% 8.8% 6.2%
Grade 6 40%-42.4% 2.4% 1.0% 21%-24.8% 3.8% 2.2%
Grade 7 40%-40.9% 0.9% 0.9% 23%-18.5% 4.5% 1.9%
Grade 8 42%-47.1% 5.1% 1.3% 36%-20.3% 15.7% 2.1%
Algebra I* 86%-47.7% 38.3% 5.0% 1%-24.4% 24.3% 5.2%
Algebra II 76%-84.5% 8.5% 0.1% 5%-3.6% 1.4% 1.1%
Geometry 86%-71.6%% 14.4% 6.3% 1%-3.6% 3.5% 4.6%
11
COMPARISON OF BELLEVILLE’S
SPRING 2015 AND SPRING 2016 PARCC ADMINISTRATIONS
MATHEMATICS
*Some students in grade 8 participated in the PARCC Algebra I assessment in place of the 8th grade Math assessment. Thus, PARCC Math 8 outcomes are not
representative of grade 8 performance as a whole.
Notes: Data shown is preliminary. Percentages may not total 100 due to rounding.
- An up arrow indicates an increase of the % change from the previous year where a down arrow shows a decrease of the % change from the previous year.
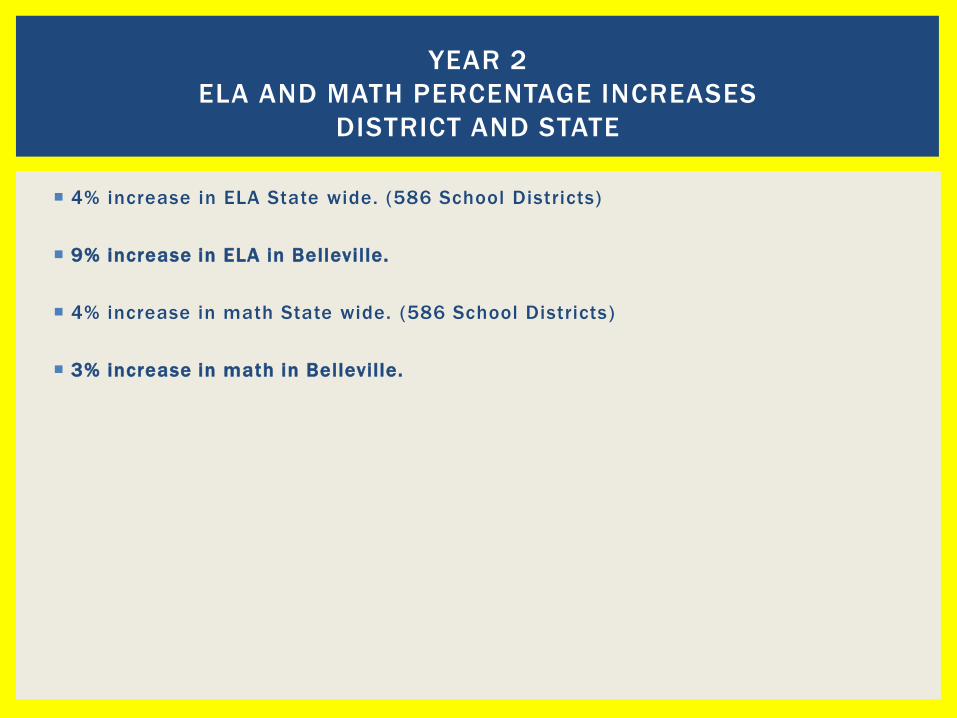
4% increase in ELA State wide. (586 School Districts)
9% increase in ELA in Belleville.
4% increase in math State wide. (586 School Districts)
3% increase in math in Belleville.
YEAR 2
ELA AND MATH PERCENTAGE INCREASES
DISTRICT AND STATE
Grade
3 %
>=
Level 4
Grade 4
% >=
Level 4
Grade 5
% >=
Level 4
Grade 6
% >=
Level 4
Grade 7
% >=
Level 4
Grade 8
% >=
Level 4
Grade 9
% >=
Level 4
Grade 10
% >=
Level 4
Grade 11
% >=
Level 4
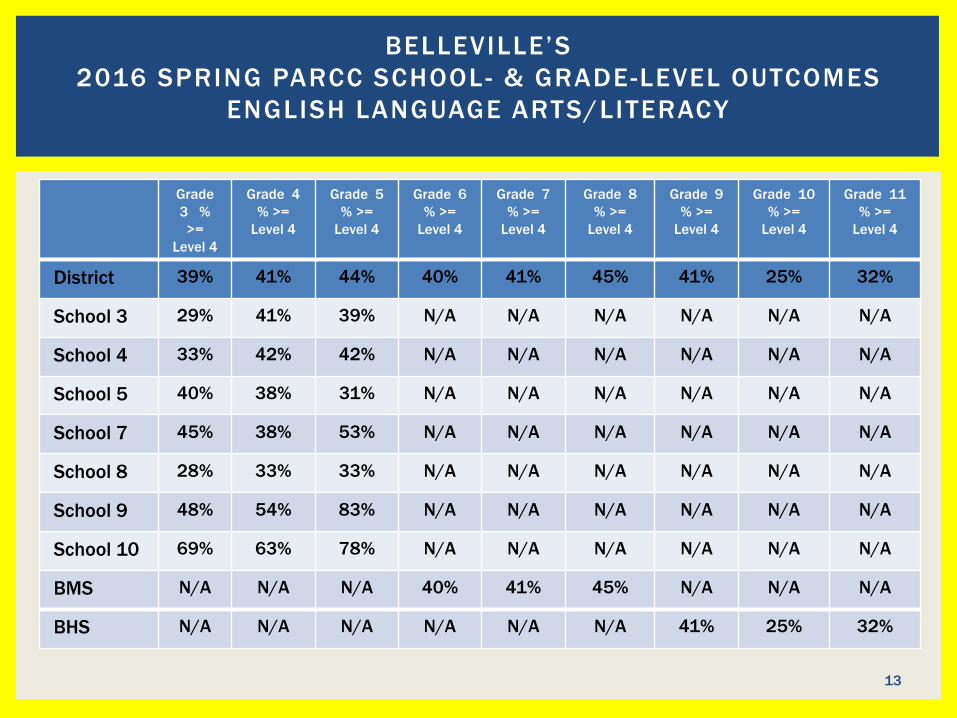
District 39% 41% 44% 40% 41% 45% 41% 25% 32%
School 3 29% 41% 39% N/A N/A N/A N/A N/A N/A
School 4 33% 42% 42% N/A N/A N/A N/A N/A N/A
School 5 40% 38% 31% N/A N/A N/A N/A N/A N/A
School 7 45% 38% 53% N/A N/A N/A N/A N/A N/A
School 8 28% 33% 33% N/A N/A N/A N/A N/A N/A
School 9 48% 54% 83% N/A N/A N/A N/A N/A N/A
School 10 69% 63% 78% N/A N/A N/A N/A N/A N/A
BMS N/A N/A N/A 40% 41% 45% N/A N/A N/A
BHS N/A N/A N/A N/A N/A N/A 41% 25% 32%
BELLEVILLE’S
2016 SPRING PARCC SCHOOL- & GRADE-LEVEL OUTCOMES
ENGLISH LANGUAGE ARTS/LITERACY
13
Class of 2024
% >= Level 4
2015
Class of 2024
% >= Level 4
2016
Class of 2023
% >= Level 4
2015
Class of 2023
% >= Level 4
2016
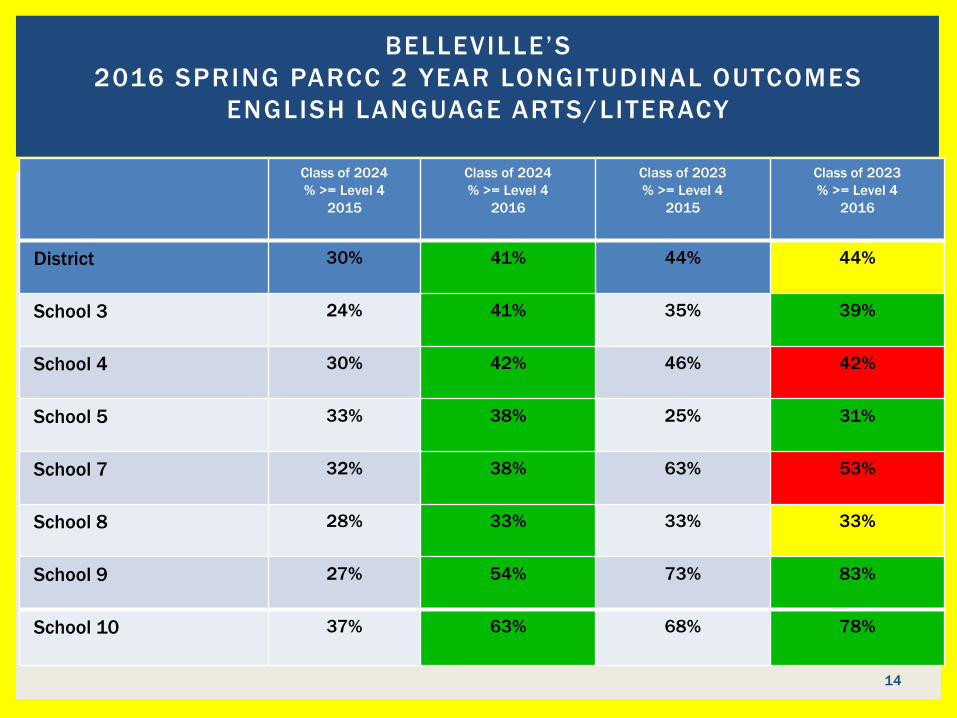
District 30% 41% 44% 44%
School 3 24% 41% 35% 39%
School 4 30% 42% 46% 42%
School 5 33% 38% 25% 31%
School 7 32% 38% 63% 53%
School 8 28% 33% 33% 33%
School 9 27% 54% 73% 83%
School 10 37% 63% 68% 78%
BELLEVILLE’S
2016 SPRING PARCC 2 YEAR LONGITUDINAL OUTCOMES
ENGLISH LANGUAGE ARTS/LITERACY
14
Class of 2022
% >= Level 4
2015
Class of 2022
% >= Level 4
2016
Class of 2021
% >= Level 4
2015
Class of 2021
% >= Level 4
2016
Class of 2020
% >= Level 4
2015
Class of 2020
% >= Level 4
2016
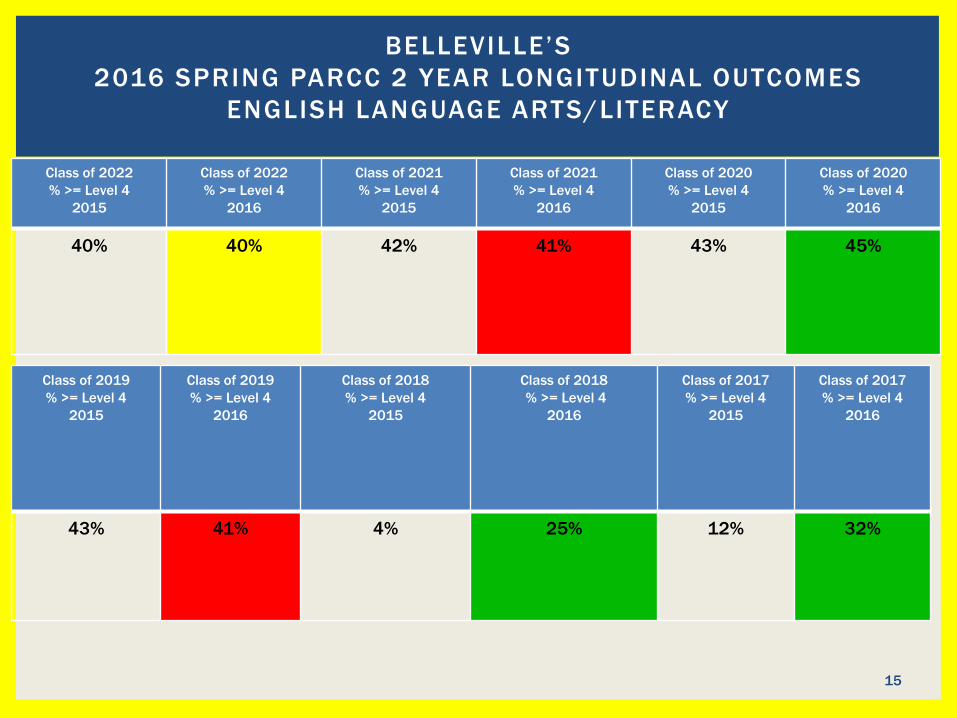
40% 40% 42% 41% 43% 45%
BELLEVILLE’S
2016 SPRING PARCC 2 YEAR LONGITUDINAL OUTCOMES
ENGLISH LANGUAGE ARTS/LITERACY
15
Class of 2019
% >= Level 4
2015
Class of 2019
% >= Level 4
2016
Class of 2018
% >= Level 4
2015
Class of 2018
% >= Level 4
2016
Class of 2017
% >= Level 4
2015
Class of 2017
% >= Level 4
2016
43% 41% 4% 25% 12% 32%
Class of 2024
% >= Level 4
2015
Class of 2024
% >= Level 4
2016
Class of 2023
% >= Level 4
2015
Class of 2023
% >= Level 4
2016
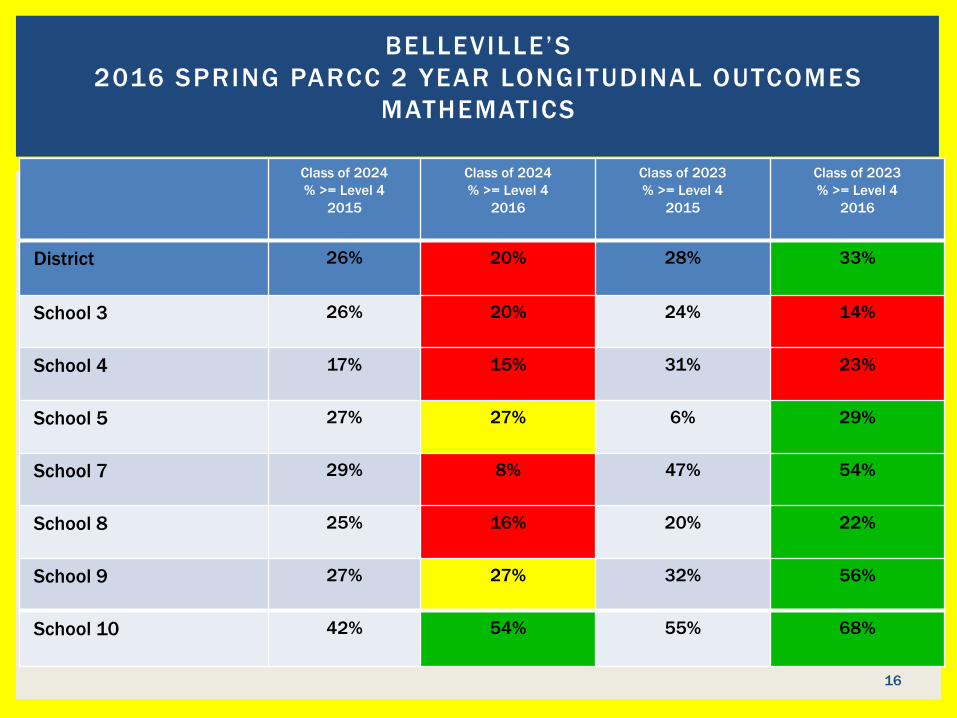
District 26% 20% 28% 33%
School 3 26% 20% 24% 14%
School 4 17% 15% 31% 23%
School 5 27% 27% 6% 29%
School 7 29% 8% 47% 54%
School 8 25% 16% 20% 22%
School 9 27% 27% 32% 56%
School 10 42% 54% 55% 68%
BELLEVILLE’S
2016 SPRING PARCC 2 YEAR LONGITUDINAL OUTCOMES
MATHEMATICS
16
Class of 2022
% >= Level 4
2015
Class of 2022
% >= Level 4
2016
Class of 2021
% >= Level 4
2015
Class of 2021
% >= Level 4
2016
Class of 2020
% >= Level 4
2015
Class of 2020
% >= Level 4
2016
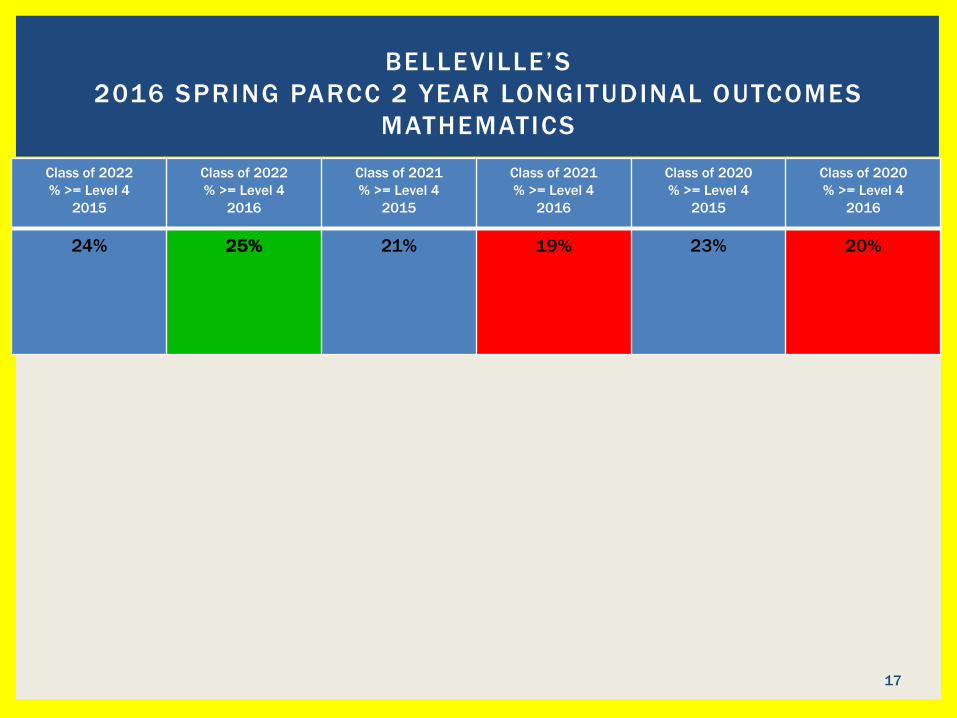
24% 25% 21% 19% 23% 20%
BELLEVILLE’S
2016 SPRING PARCC 2 YEAR LONGITUDINAL OUTCOMES
MATHEMATICS
17
Grade
3 %
>=
Level 4
Grade 4
% >=
Level 4
Grade 5
% >=
Level 4
Grade 6
% >=
Level 4
Grade 7
% >=
Level 4
Grade 8
% >=
Level 4
Algebra I
% >=
Level 4
Algebra II
% >=
Level 4
Geometry
% >=
Level 4
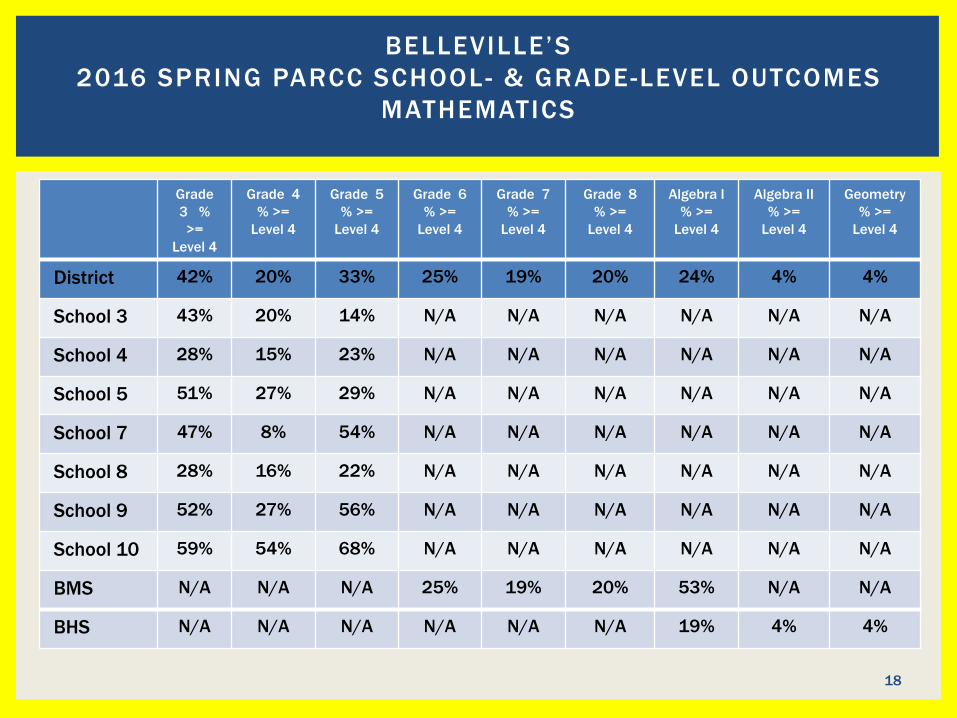
District 42% 20% 33% 25% 19% 20% 24% 4% 4%
School 3 43% 20% 14% N/A N/A N/A N/A N/A N/A
School 4 28% 15% 23% N/A N/A N/A N/A N/A N/A
School 5 51% 27% 29% N/A N/A N/A N/A N/A N/A
School 7 47% 8% 54% N/A N/A N/A N/A N/A N/A
School 8 28% 16% 22% N/A N/A N/A N/A N/A N/A
School 9 52% 27% 56% N/A N/A N/A N/A N/A N/A
School 10 59% 54% 68% N/A N/A N/A N/A N/A N/A
BMS N/A N/A N/A 25% 19% 20% 53% N/A N/A
BHS N/A N/A N/A N/A N/A N/A 19% 4% 4%
BELLEVILLE’S
2016 SPRING PARCC SCHOOL- & GRADE-LEVEL OUTCOMES
MATHEMATICS
18
Students Tested
Difference2016 2015
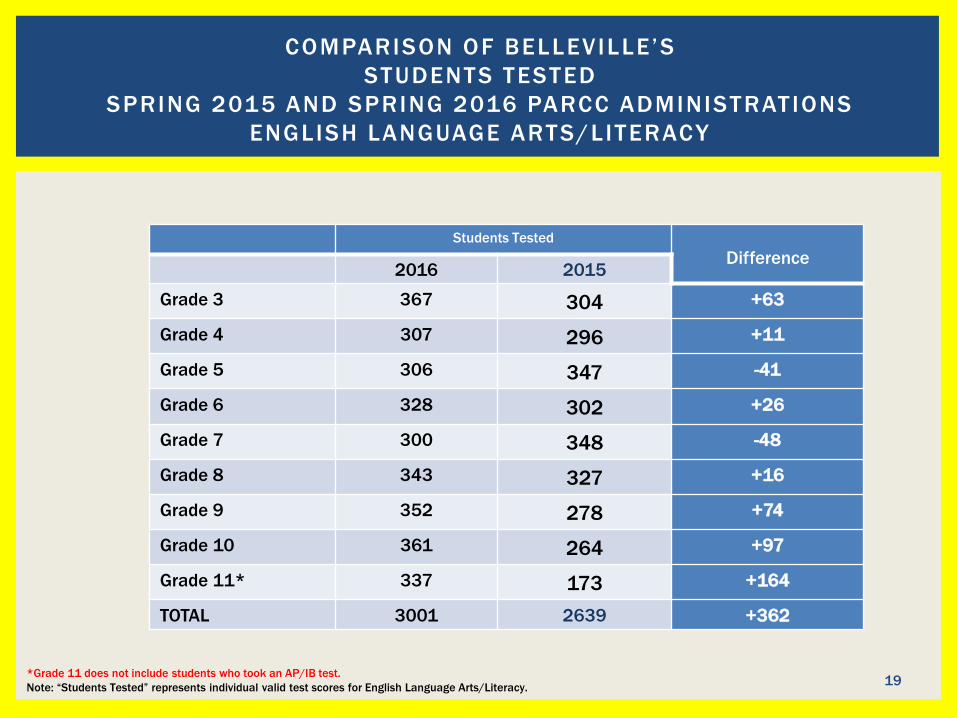
Grade 3 367 304 +63
Grade 4 307 296 +11
Grade 5 306 347 -41
Grade 6 328 302 +26
Grade 7 300 348 -48
Grade 8 343 327 +16
Grade 9 352 278 +74
Grade 10 361 264 +97
Grade 11* 337 173 +164
TOTAL 3001 2639 +362
COMPARISON OF BELLEVILLE’S
STUDENTS TESTED
SPRING 2015 AND SPRING 2016 PARCC ADMINISTRATIONS
ENGLISH LANGUAGE ARTS/LITERACY
*Grade 11 does not include students who took an AP/IB test.
Note: “Students Tested” represents individual valid test scores for English Language Arts/Literacy.19
Students Tested
Year to Year Increase
2016 2015
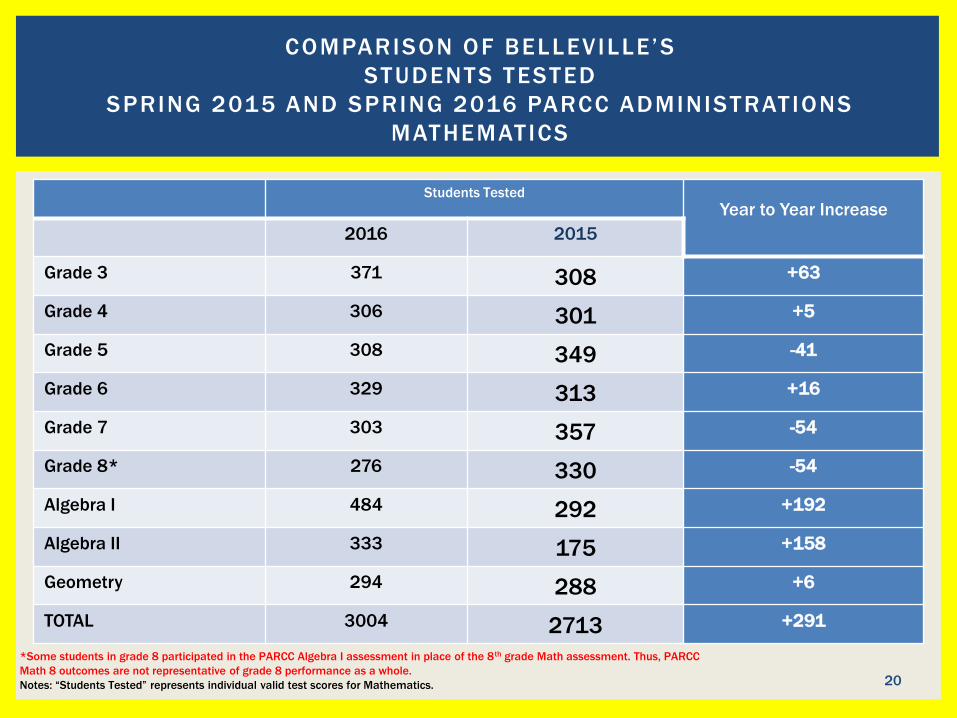
Grade 3 371 308 +63
Grade 4 306 301 +5
Grade 5 308 349 -41
Grade 6 329 313 +16
Grade 7 303 357 -54
Grade 8* 276 330 -54
Algebra I 484 292 +192
Algebra II 333 175 +158
Geometry 294 288 +6
TOTAL 3004 2713 +291
*Some students in grade 8 participated in the PARCC Algebra I assessment in place of the 8th grade Math assessment. Thus, PARCC
Math 8 outcomes are not representative of grade 8 performance as a whole.
Notes: “Students Tested” represents individual valid test scores for Mathematics. 20
COMPARISON OF BELLEVILLE’S
STUDENTS TESTED
SPRING 2015 AND SPRING 2016 PARCC ADMINISTRATIONS
MATHEMATICS
Count of
Valid
Test
Scores
Not Yet
Meeting
(Level 1)
Partially
Meeting
(Level 2)
Approaching
Expectations
(Level 3)
Meeting
Expectations
(Level 4)
Exceeding
Expectation
(Level 5)
District %
>= Level
4
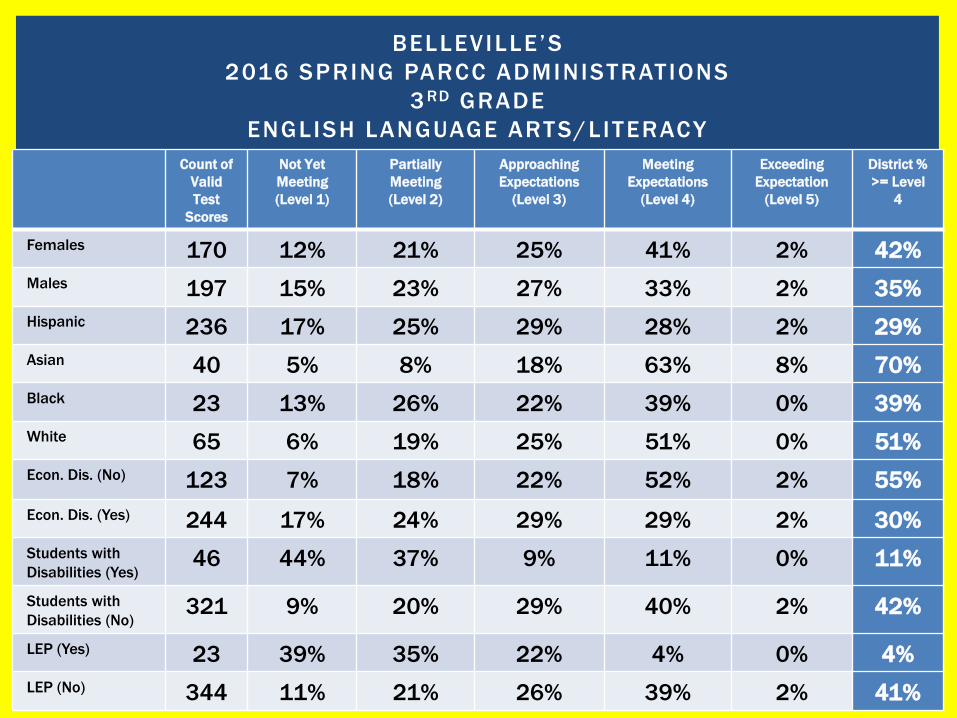
Females 170 12% 21% 25% 41% 2% 42%
Males 197 15% 23% 27% 33% 2% 35%
Hispanic 236 17% 25% 29% 28% 2% 29%
Asian 40 5% 8% 18% 63% 8% 70%
Black 23 13% 26% 22% 39% 0% 39%
White 65 6% 19% 25% 51% 0% 51%
Econ. Dis. (No) 123 7% 18% 22% 52% 2% 55%
Econ. Dis. (Yes) 244 17% 24% 29% 29% 2% 30%
Students with
Disabilities (Yes)46 44% 37% 9% 11% 0% 11%
Students with
Disabilities (No)321 9% 20% 29% 40% 2% 42%
LEP (Yes) 23 39% 35% 22% 4% 0% 4%
LEP (No) 344 11% 21% 26% 39% 2% 41%
BELLEVILLE’S
2016 SPRING PARCC ADMINISTRATIONS
3 RD GRADE
ENGLISH LANGUAGE ARTS/LITERACY
Count of
Valid
Test
Scores
Not Yet
Meeting
(Level 1)
Partially
Meeting
(Level 2)
Approaching
Expectations
(Level 3)
Meeting
Expectations
(Level 4)
Exceeding
Expectation
(Level 5)
District %
>= Level
4
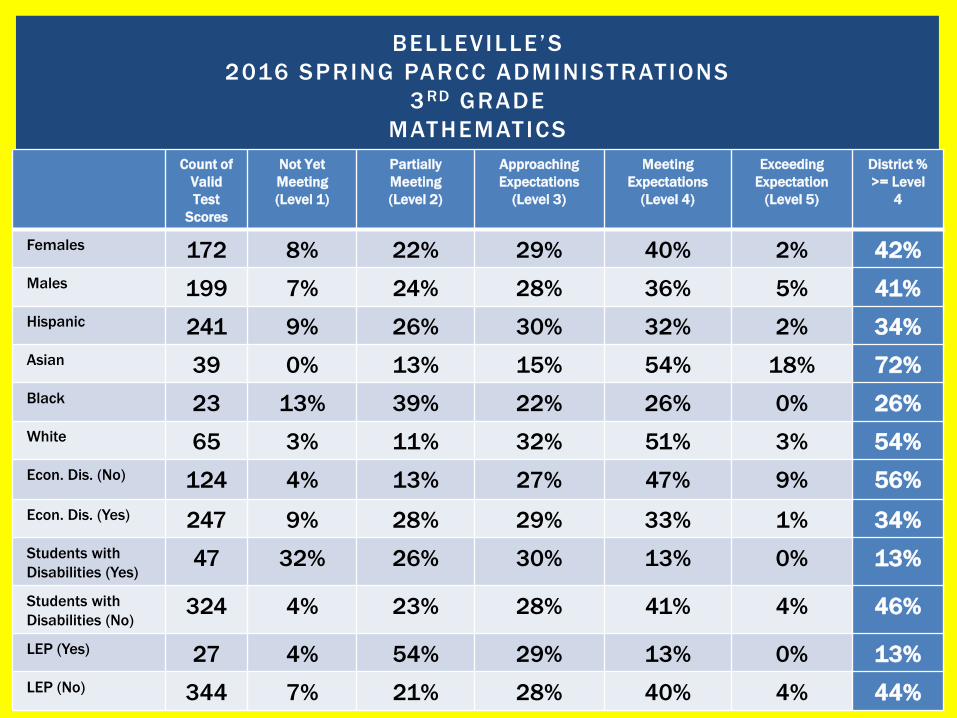
Females 172 8% 22% 29% 40% 2% 42%
Males 199 7% 24% 28% 36% 5% 41%
Hispanic 241 9% 26% 30% 32% 2% 34%
Asian 39 0% 13% 15% 54% 18% 72%
Black 23 13% 39% 22% 26% 0% 26%
White 65 3% 11% 32% 51% 3% 54%
Econ. Dis. (No) 124 4% 13% 27% 47% 9% 56%
Econ. Dis. (Yes) 247 9% 28% 29% 33% 1% 34%
Students with
Disabilities (Yes)47 32% 26% 30% 13% 0% 13%
Students with
Disabilities (No)324 4% 23% 28% 41% 4% 46%
LEP (Yes) 27 4% 54% 29% 13% 0% 13%
LEP (No) 344 7% 21% 28% 40% 4% 44%
BELLEVILLE’S
2016 SPRING PARCC ADMINISTRATIONS
3 RD GRADE
MATHEMATICS
Count of
Valid
Test
Scores
Not Yet
Meeting
(Level 1)
Partially
Meeting
(Level 2)
Approaching
Expectations
(Level 3)
Meeting
Expectations
(Level 4)
Exceeding
Expectation
(Level 5)
District %
>= Level
4
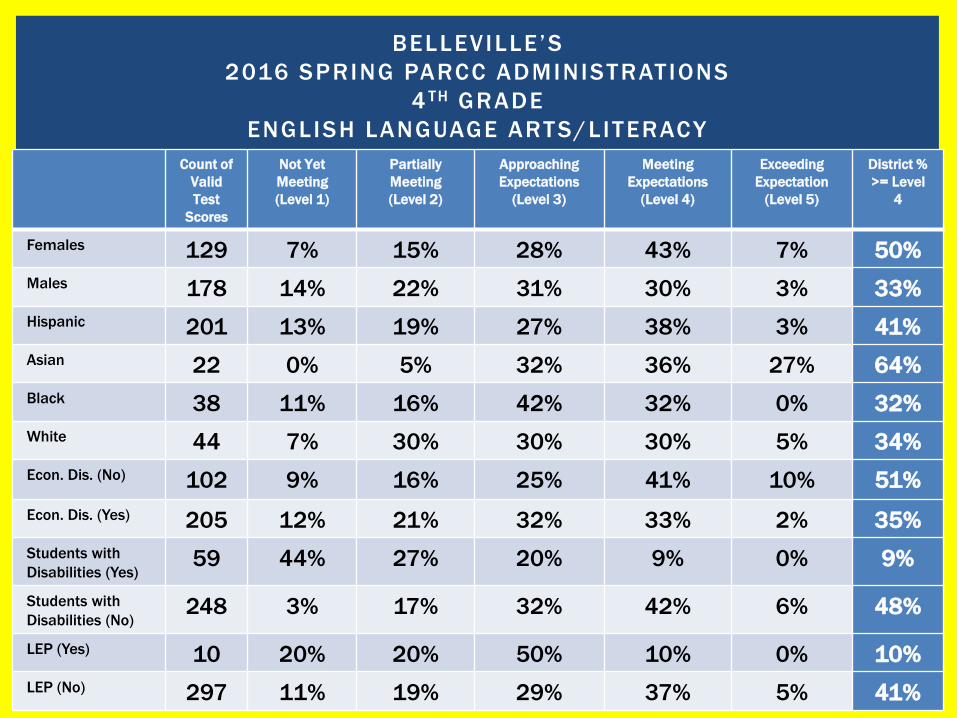
Females 129 7% 15% 28% 43% 7% 50%
Males 178 14% 22% 31% 30% 3% 33%
Hispanic 201 13% 19% 27% 38% 3% 41%
Asian 22 0% 5% 32% 36% 27% 64%
Black 38 11% 16% 42% 32% 0% 32%
White 44 7% 30% 30% 30% 5% 34%
Econ. Dis. (No) 102 9% 16% 25% 41% 10% 51%
Econ. Dis. (Yes) 205 12% 21% 32% 33% 2% 35%
Students with
Disabilities (Yes)59 44% 27% 20% 9% 0% 9%
Students with
Disabilities (No)248 3% 17% 32% 42% 6% 48%
LEP (Yes) 10 20% 20% 50% 10% 0% 10%
LEP (No) 297 11% 19% 29% 37% 5% 41%
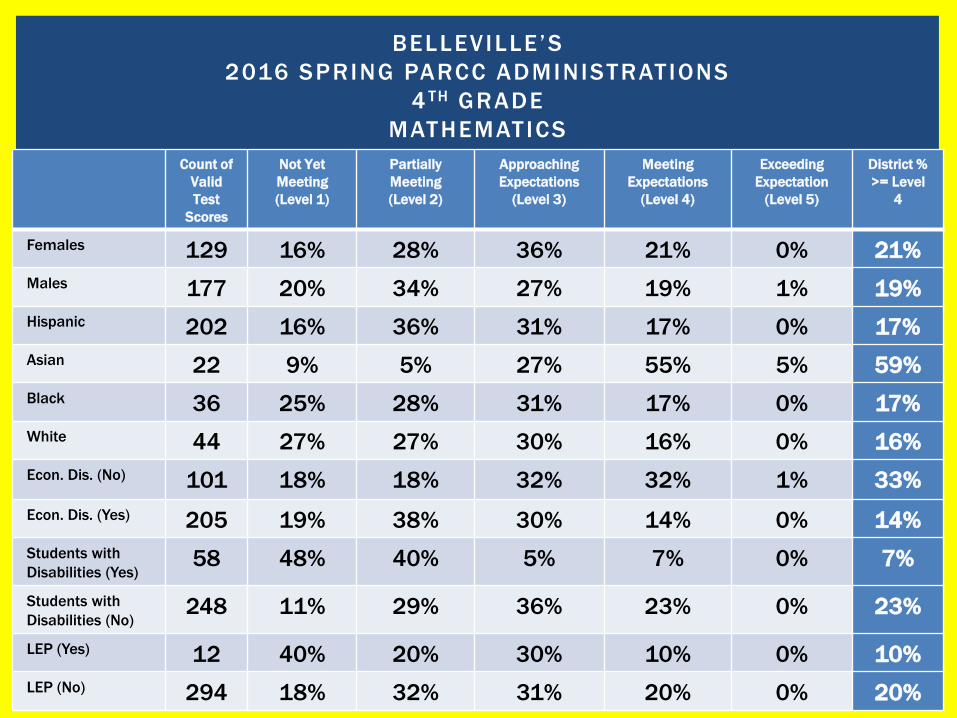
BELLEVILLE’S
2016 SPRING PARCC ADMINISTRATIONS
4 TH GRADE
ENGLISH LANGUAGE ARTS/LITERACY
Count of
Valid
Test
Scores
Not Yet
Meeting
(Level 1)
Partially
Meeting
(Level 2)
Approaching
Expectations
(Level 3)
Meeting
Expectations
(Level 4)
Exceeding
Expectation
(Level 5)
District %
>= Level
4
Females 129 16% 28% 36% 21% 0% 21%
Males 177 20% 34% 27% 19% 1% 19%
Hispanic 202 16% 36% 31% 17% 0% 17%
Asian 22 9% 5% 27% 55% 5% 59%
Black 36 25% 28% 31% 17% 0% 17%
White 44 27% 27% 30% 16% 0% 16%
Econ. Dis. (No) 101 18% 18% 32% 32% 1% 33%
Econ. Dis. (Yes) 205 19% 38% 30% 14% 0% 14%
Students with
Disabilities (Yes)58 48% 40% 5% 7% 0% 7%
Students with
Disabilities (No)248 11% 29% 36% 23% 0% 23%
LEP (Yes) 12 40% 20% 30% 10% 0% 10%
LEP (No) 294 18% 32% 31% 20% 0% 20%
BELLEVILLE’S
2016 SPRING PARCC ADMINISTRATIONS
4 TH GRADE
MATHEMATICS
Count of
Valid
Test
Scores
Not Yet
Meeting
(Level 1)
Partially
Meeting
(Level 2)
Approaching
Expectations
(Level 3)
Meeting
Expectations
(Level 4)
Exceeding
Expectation
(Level 5)
District %
>= Level
4
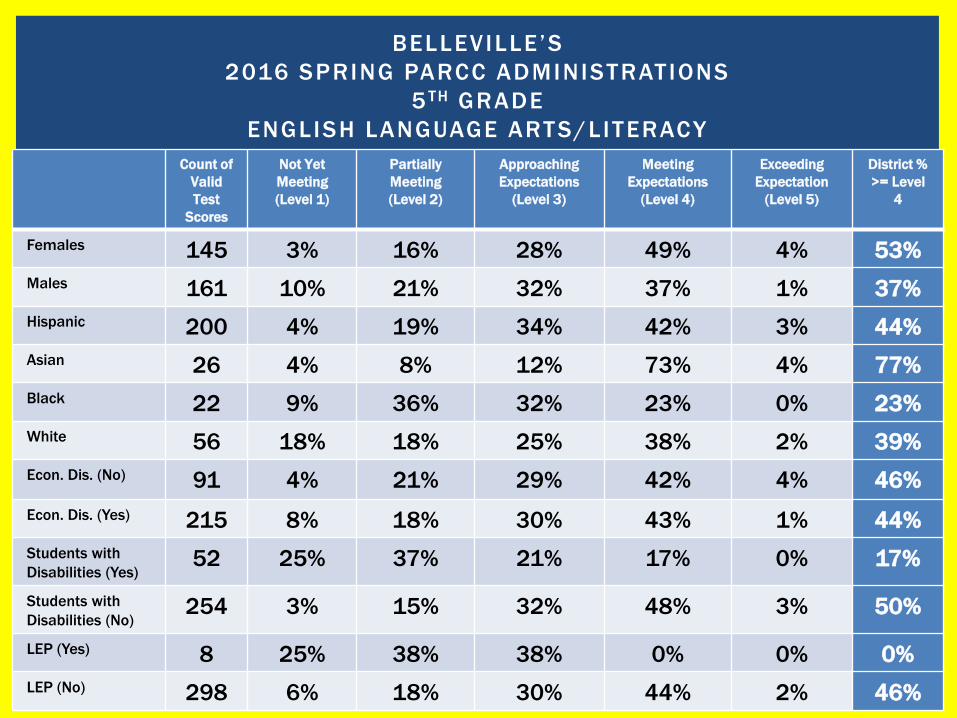
Females 145 3% 16% 28% 49% 4% 53%
Males 161 10% 21% 32% 37% 1% 37%
Hispanic 200 4% 19% 34% 42% 3% 44%
Asian 26 4% 8% 12% 73% 4% 77%
Black 22 9% 36% 32% 23% 0% 23%
White 56 18% 18% 25% 38% 2% 39%
Econ. Dis. (No) 91 4% 21% 29% 42% 4% 46%
Econ. Dis. (Yes) 215 8% 18% 30% 43% 1% 44%
Students with
Disabilities (Yes)52 25% 37% 21% 17% 0% 17%
Students with
Disabilities (No)254 3% 15% 32% 48% 3% 50%
LEP (Yes) 8 25% 38% 38% 0% 0% 0%
LEP (No) 298 6% 18% 30% 44% 2% 46%
BELLEVILLE’S
2016 SPRING PARCC ADMINISTRATIONS
5 TH GRADE
ENGLISH LANGUAGE ARTS/LITERACY
Count of
Valid
Test
Scores
Not Yet
Meeting
(Level 1)
Partially
Meeting
(Level 2)
Approaching
Expectations
(Level 3)
Meeting
Expectations
(Level 4)
Exceeding
Expectation
(Level 5)
District %
>= Level
4
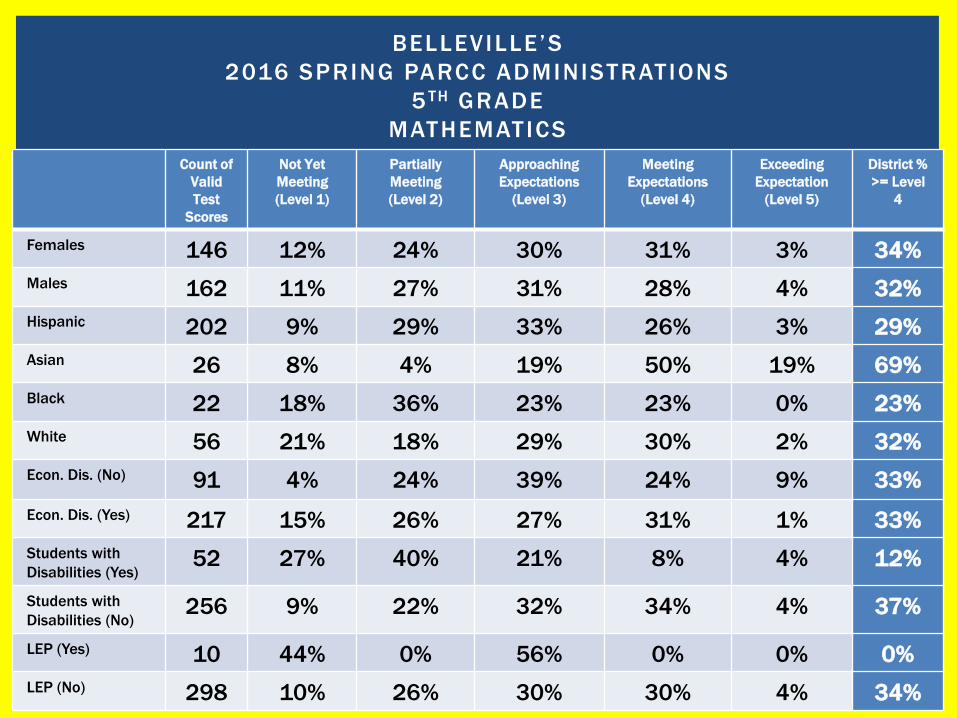
Females 146 12% 24% 30% 31% 3% 34%
Males 162 11% 27% 31% 28% 4% 32%
Hispanic 202 9% 29% 33% 26% 3% 29%
Asian 26 8% 4% 19% 50% 19% 69%
Black 22 18% 36% 23% 23% 0% 23%
White 56 21% 18% 29% 30% 2% 32%
Econ. Dis. (No) 91 4% 24% 39% 24% 9% 33%
Econ. Dis. (Yes) 217 15% 26% 27% 31% 1% 33%
Students with
Disabilities (Yes)52 27% 40% 21% 8% 4% 12%
Students with
Disabilities (No)256 9% 22% 32% 34% 4% 37%
LEP (Yes) 10 44% 0% 56% 0% 0% 0%
LEP (No) 298 10% 26% 30% 30% 4% 34%
BELLEVILLE’S
2016 SPRING PARCC ADMINISTRATIONS
5 TH GRADE
MATHEMATICS

Count of
Valid
Test
Scores
Not Yet
Meeting
(Level 1)
Partially
Meeting
(Level 2)
Approaching
Expectations
(Level 3)
Meeting
Expectations
(Level 4)
Exceeding
Expectation
(Level 5)
District %
>= Level
4
Females 144 6% 15% 25% 50% 4% 54%
Males 185 16% 24% 31% 27% 3% 29%
Hispanic 216 10% 21% 32% 36% 2% 38%
Asian 25 8% 8% 16% 48% 20% 68%
Black 39 31% 21% 23% 26% 0% 26%
White 46 4% 20% 28% 46% 2% 48%
Econ. Dis. (No) 106 9% 19% 26% 42% 5% 46%
Econ. Dis. (Yes) 223 13% 21% 30% 35% 3% 37%
Students with
Disabilities (Yes)47 49% 43% 6% 2% 0% 2%
Students with
Disabilities (No)282 5% 16% 32% 43% 4% 47%
LEP (Yes) 12 33% 58% 0% 8% 0% 8%
LEP (No) 317 10% 19% 30% 38% 3% 41%
BELLEVILLE’S
2016 SPRING PARCC ADMINISTRATIONS
6 TH GRADE
ENGLISH LANGUAGE ARTS/LITERACY
Count of
Valid
Test
Scores
Not Yet
Meeting
(Level 1)
Partially
Meeting
(Level 2)
Approaching
Expectations
(Level 3)
Meeting
Expectations
(Level 4)
Exceeding
Expectation
(Level 5)
District %
>= Level
4
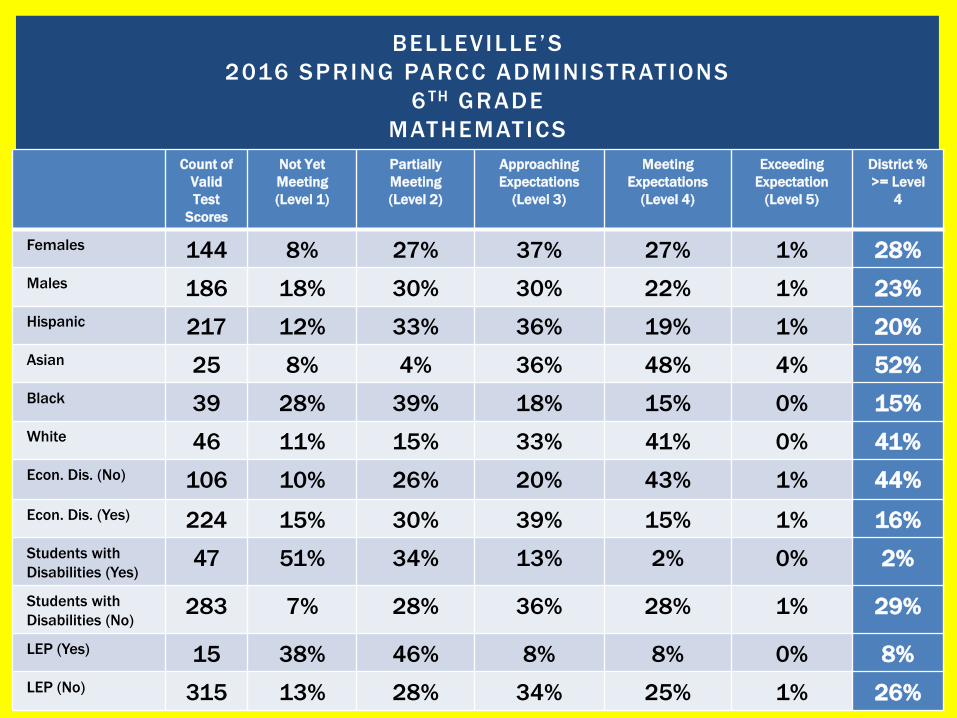
Females 144 8% 27% 37% 27% 1% 28%
Males 186 18% 30% 30% 22% 1% 23%
Hispanic 217 12% 33% 36% 19% 1% 20%
Asian 25 8% 4% 36% 48% 4% 52%
Black 39 28% 39% 18% 15% 0% 15%
White 46 11% 15% 33% 41% 0% 41%
Econ. Dis. (No) 106 10% 26% 20% 43% 1% 44%
Econ. Dis. (Yes) 224 15% 30% 39% 15% 1% 16%
Students with
Disabilities (Yes)47 51% 34% 13% 2% 0% 2%
Students with
Disabilities (No)283 7% 28% 36% 28% 1% 29%
LEP (Yes) 15 38% 46% 8% 8% 0% 8%
LEP (No) 315 13% 28% 34% 25% 1% 26%
BELLEVILLE’S
2016 SPRING PARCC ADMINISTRATIONS
6 TH GRADE
MATHEMATICS

Count of
Valid
Test
Scores
Not Yet
Meeting
(Level 1)
Partially
Meeting
(Level 2)
Approaching
Expectations
(Level 3)
Meeting
Expectations
(Level 4)
Exceeding
Expectation
(Level 5)
District %
>= Level
4
Females 138 6% 12% 26% 43% 13% 56%
Males 162 14% 23% 35% 21% 7% 28%
Hispanic 192 9% 18% 34% 32% 8% 40%
Asian 21 0% 5% 29% 33% 33% 67%
Black 34 9% 27% 32% 24% 9% 32%
White 51 20% 18% 22% 33% 8% 41%
Econ. Dis. (No) 107 8% 15% 33% 29% 16% 45%
Econ. Dis. (Yes) 193 11% 20% 30% 32% 7% 39%
Students with
Disabilities (Yes)49 43% 29% 20% 8% 0% 8%
Students with
Disabilities (No)251 4% 16% 33% 36% 12% 47%
LEP (Yes) 7 29% 0% 57% 14% 0% 14%
LEP (No) 293 10% 18% 30% 31% 10% 41%
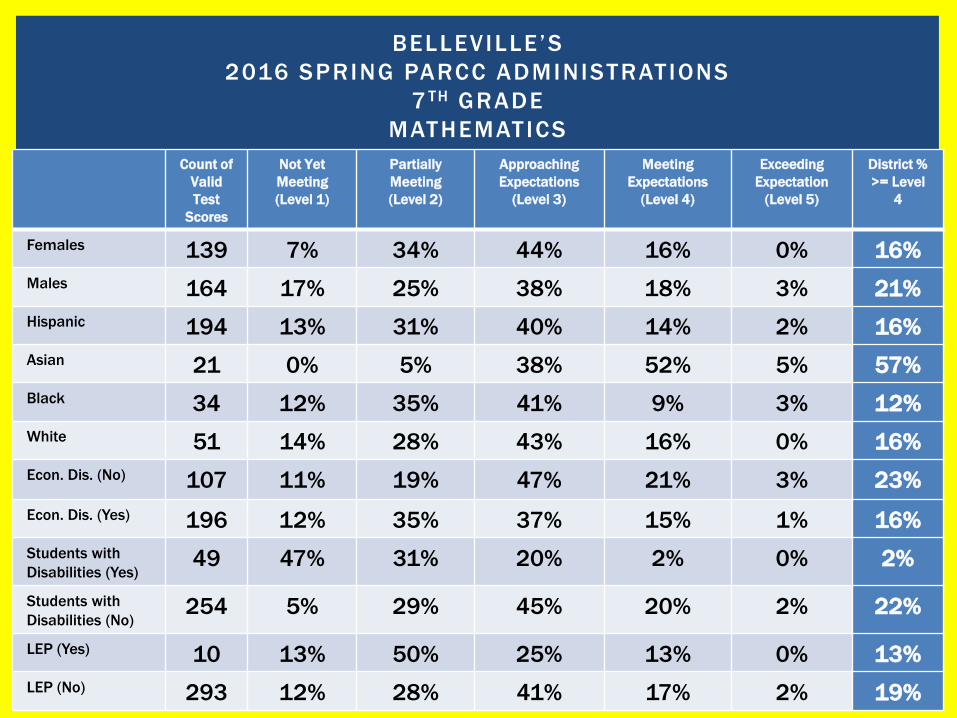
BELLEVILLE’S
2016 SPRING PARCC ADMINISTRATIONS
7 TH GRADE
ENGLISH LANGUAGE ARTS/LITERACY
Count of
Valid
Test
Scores
Not Yet
Meeting
(Level 1)
Partially
Meeting
(Level 2)
Approaching
Expectations
(Level 3)
Meeting
Expectations
(Level 4)
Exceeding
Expectation
(Level 5)
District %
>= Level
4
Females 139 7% 34% 44% 16% 0% 16%
Males 164 17% 25% 38% 18% 3% 21%
Hispanic 194 13% 31% 40% 14% 2% 16%
Asian 21 0% 5% 38% 52% 5% 57%
Black 34 12% 35% 41% 9% 3% 12%
White 51 14% 28% 43% 16% 0% 16%
Econ. Dis. (No) 107 11% 19% 47% 21% 3% 23%
Econ. Dis. (Yes) 196 12% 35% 37% 15% 1% 16%
Students with
Disabilities (Yes)49 47% 31% 20% 2% 0% 2%
Students with
Disabilities (No)254 5% 29% 45% 20% 2% 22%
LEP (Yes) 10 13% 50% 25% 13% 0% 13%
LEP (No) 293 12% 28% 41% 17% 2% 19%
BELLEVILLE’S
2016 SPRING PARCC ADMINISTRATIONS
7 TH GRADE
MATHEMATICS
Count of
Valid
Test
Scores
Not Yet
Meeting
(Level 1)
Partially
Meeting
(Level 2)
Approaching
Expectations
(Level 3)
Meeting
Expectations
(Level 4)
Exceeding
Expectation
(Level 5)
District %
>= Level
4
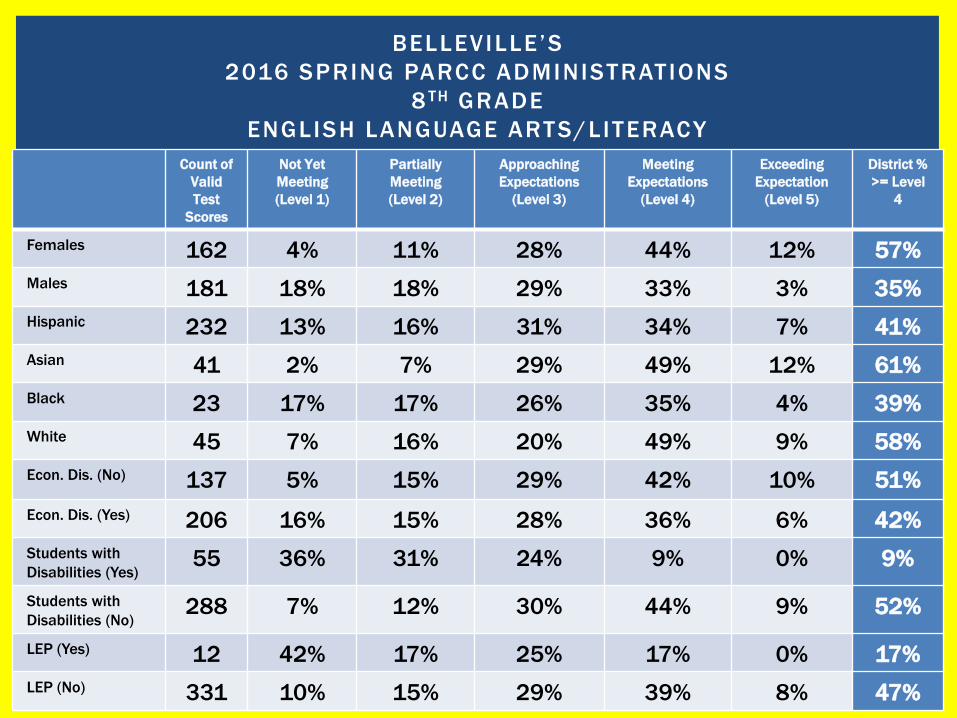
Females 162 4% 11% 28% 44% 12% 57%
Males 181 18% 18% 29% 33% 3% 35%
Hispanic 232 13% 16% 31% 34% 7% 41%
Asian 41 2% 7% 29% 49% 12% 61%
Black 23 17% 17% 26% 35% 4% 39%
White 45 7% 16% 20% 49% 9% 58%
Econ. Dis. (No) 137 5% 15% 29% 42% 10% 51%
Econ. Dis. (Yes) 206 16% 15% 28% 36% 6% 42%
Students with
Disabilities (Yes)55 36% 31% 24% 9% 0% 9%
Students with
Disabilities (No)288 7% 12% 30% 44% 9% 52%
LEP (Yes) 12 42% 17% 25% 17% 0% 17%
LEP (No) 331 10% 15% 29% 39% 8% 47%
BELLEVILLE’S
2016 SPRING PARCC ADMINISTRATIONS
8 TH GRADE
ENGLISH LANGUAGE ARTS/LITERACY

Count of
Valid
Test
Scores
Not Yet
Meeting
(Level 1)
Partially
Meeting
(Level 2)
Approaching
Expectations
(Level 3)
Meeting
Expectations
(Level 4)
Exceeding
Expectation
(Level 5)
District %
>= Level
4
Females 125 18% 26% 32% 24% 0% 24%
Males 151 29% 21% 33% 17% 0% 17%
Hispanic 195 25% 23% 35% 17% 0% 17%
Asian 29 7% 38% 24% 31% 0% 31%
Black 21 38% 14% 29% 19% 0% 19%
White 29 24% 21% 28% 28% 0% 28%
Econ. Dis. (No) 99 17% 29% 31% 22% 0% 22%
Econ. Dis. (Yes) 177 28% 20% 33% 19% 0% 19%
Students with
Disabilities (Yes)52 60% 25% 12% 4% 0% 4%
Students with
Disabilities (No)224 16% 23% 38% 24% 0% 24%
LEP (Yes) 16 47% 13% 20% 20% 0% 20%
LEP (No) 260 23% 23% 33% 20% 0% 20%
BELLEVILLE’S
2016 SPRING PARCC ADMINISTRATIONS
8 TH GRADE
MATHEMATICS

Count of
Valid
Test
Scores
Not Yet
Meeting
(Level 1)
Partially
Meeting
(Level 2)
Approaching
Expectations
(Level 3)
Meeting
Expectations
(Level 4)
Exceeding
Expectation
(Level 5)
District %
>= Level
4
Females 156 12% 15% 23% 41% 10% 51%
Males 197 25% 19% 24% 28% 4% 32%
Hispanic 222 22% 18% 25% 34% 2% 36%
Asian 39 10% 8% 13% 41% 28% 69%
Black 30 17% 13% 37% 23% 10% 33%
White 56 18% 21% 20% 32% 9% 41%
Econ. Dis. (No) 157 13% 17% 22% 36% 12% 48%
Econ. Dis. (Yes) 196 24% 17% 25% 32% 3% 34%
Students with
Disabilities (Yes)62 44% 34% 18% 5% 0% 5%
Students with
Disabilities (No)291 14% 14% 25% 40% 8% 48%
LEP (Yes) 24 70% 13% 13% 4% 0% 4%
LEP (No) 329 15% 18% 24% 36% 7% 43%
BELLEVILLE’S
2016 SPRING PARCC ADMINISTRATIONS
9 TH GRADE
ENGLISH LANGUAGE ARTS/LITERACY
Count of
Valid
Test
Scores
Not Yet
Meeting
(Level 1)
Partially
Meeting
(Level 2)
Approaching
Expectations
(Level 3)
Meeting
Expectations
(Level 4)
Exceeding
Expectation
(Level 5)
District %
>= Level
4
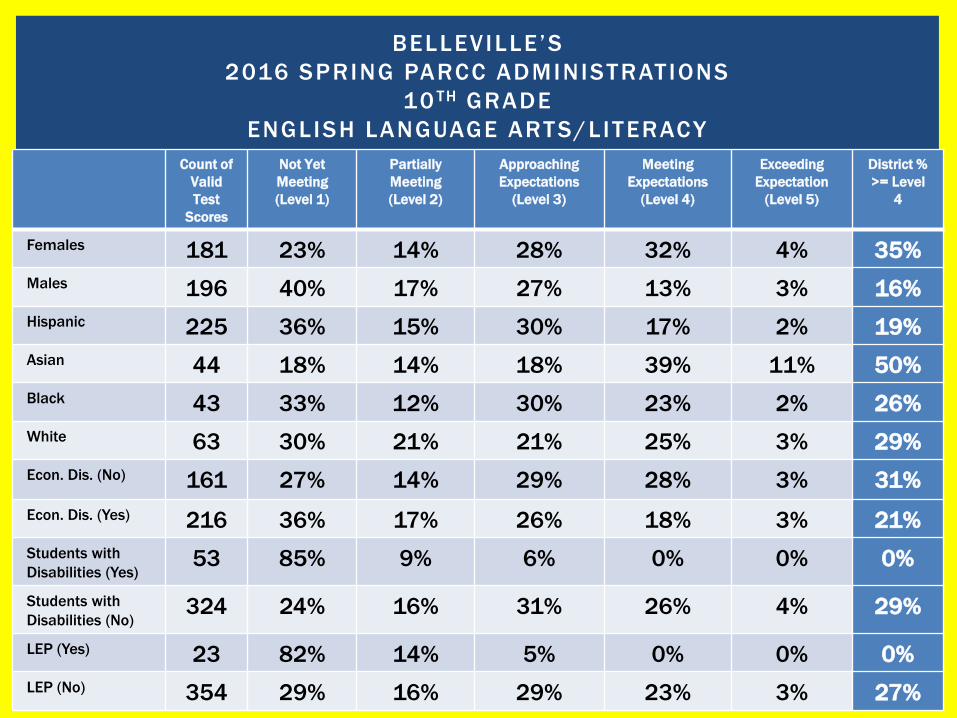
Females 181 23% 14% 28% 32% 4% 35%
Males 196 40% 17% 27% 13% 3% 16%
Hispanic 225 36% 15% 30% 17% 2% 19%
Asian 44 18% 14% 18% 39% 11% 50%
Black 43 33% 12% 30% 23% 2% 26%
White 63 30% 21% 21% 25% 3% 29%
Econ. Dis. (No) 161 27% 14% 29% 28% 3% 31%
Econ. Dis. (Yes) 216 36% 17% 26% 18% 3% 21%
Students with
Disabilities (Yes)53 85% 9% 6% 0% 0% 0%
Students with
Disabilities (No)324 24% 16% 31% 26% 4% 29%
LEP (Yes) 23 82% 14% 5% 0% 0% 0%
LEP (No) 354 29% 16% 29% 23% 3% 27%
BELLEVILLE’S
2016 SPRING PARCC ADMINISTRATIONS
10 TH GRADE
ENGLISH LANGUAGE ARTS/LITERACY

Count of
Valid
Test
Scores
Not Yet
Meeting
(Level 1)
Partially
Meeting
(Level 2)
Approaching
Expectations
(Level 3)
Meeting
Expectations
(Level 4)
Exceeding
Expectation
(Level 5)
District %
>= Level
4
Females 155 23% 14% 19% 39% 6% 45%
Males 185 30% 22% 27% 20% 2% 21%
Hispanic 207 30% 20% 21% 26% 2% 28%
Asian 41 7% 7% 29% 46% 10% 56%
Black 26 27% 23% 23% 23% 4% 27%
White 63 29% 18% 24% 27% 3% 30%
Econ. Dis. (No) 145 19% 21% 25% 32% 3% 36%
Econ. Dis. (Yes) 195 33% 17% 22% 25% 4% 29%
Students with
Disabilities (Yes)54 70% 19% 7% 4% 0% 4%
Students with
Disabilities (No)286 19% 19% 26% 33% 4% 37%
LEP (Yes) 22 74% 11% 5% 11% 0% 11%
LEP (No) 318 24% 19% 23% 30% 4% 33%
BELLEVILLE’S
2016 SPRING PARCC ADMINISTRATIONS
11 TH GRADE
ENGLISH LANGUAGE ARTS/LITERACY
Count of
Valid
Test
Scores
Not Yet
Meeting
(Level 1)
Partially
Meeting
(Level 2)
Approaching
Expectations
(Level 3)
Meeting
Expectations
(Level 4)
Exceeding
Expectation
(Level 5)
District %
>= Level
4
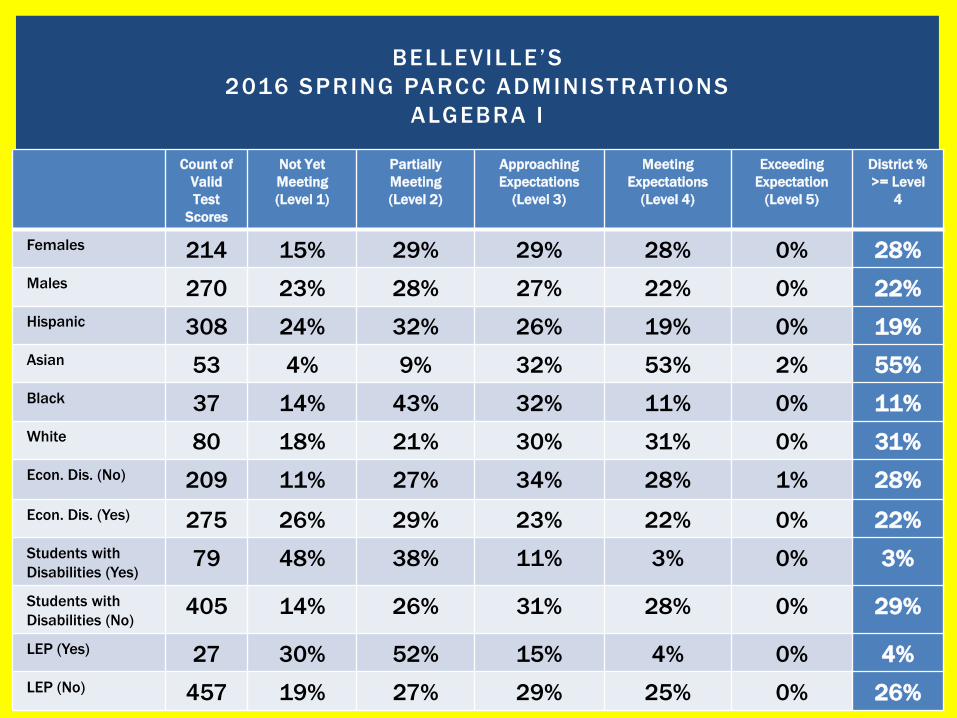
Females 214 15% 29% 29% 28% 0% 28%
Males 270 23% 28% 27% 22% 0% 22%
Hispanic 308 24% 32% 26% 19% 0% 19%
Asian 53 4% 9% 32% 53% 2% 55%
Black 37 14% 43% 32% 11% 0% 11%
White 80 18% 21% 30% 31% 0% 31%
Econ. Dis. (No) 209 11% 27% 34% 28% 1% 28%
Econ. Dis. (Yes) 275 26% 29% 23% 22% 0% 22%
Students with
Disabilities (Yes)79 48% 38% 11% 3% 0% 3%
Students with
Disabilities (No)405 14% 26% 31% 28% 0% 29%
LEP (Yes) 27 30% 52% 15% 4% 0% 4%
LEP (No) 457 19% 27% 29% 25% 0% 26%
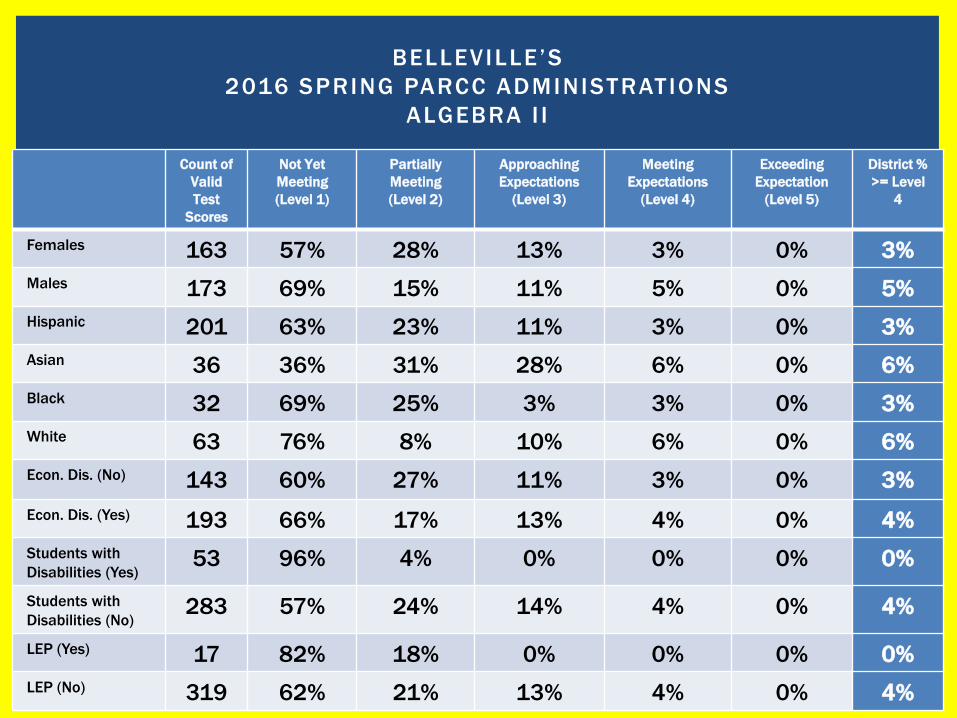
BELLEVILLE’S
2016 SPRING PARCC ADMINISTRATIONS
ALGEBRA I
Count of
Valid
Test
Scores
Not Yet
Meeting
(Level 1)
Partially
Meeting
(Level 2)
Approaching
Expectations
(Level 3)
Meeting
Expectations
(Level 4)
Exceeding
Expectation
(Level 5)
District %
>= Level
4
Females 163 57% 28% 13% 3% 0% 3%
Males 173 69% 15% 11% 5% 0% 5%
Hispanic 201 63% 23% 11% 3% 0% 3%
Asian 36 36% 31% 28% 6% 0% 6%
Black 32 69% 25% 3% 3% 0% 3%
White 63 76% 8% 10% 6% 0% 6%
Econ. Dis. (No) 143 60% 27% 11% 3% 0% 3%
Econ. Dis. (Yes) 193 66% 17% 13% 4% 0% 4%
Students with
Disabilities (Yes)53 96% 4% 0% 0% 0% 0%
Students with
Disabilities (No)283 57% 24% 14% 4% 0% 4%
LEP (Yes) 17 82% 18% 0% 0% 0% 0%
LEP (No) 319 62% 21% 13% 4% 0% 4%
BELLEVILLE’S
2016 SPRING PARCC ADMINISTRATIONS
ALGEBRA I I
Count of
Valid
Test
Scores
Not Yet
Meeting
(Level 1)
Partially
Meeting
(Level 2)
Approaching
Expectations
(Level 3)
Meeting
Expectations
(Level 4)
Exceeding
Expectation
(Level 5)
District %
>= Level
4
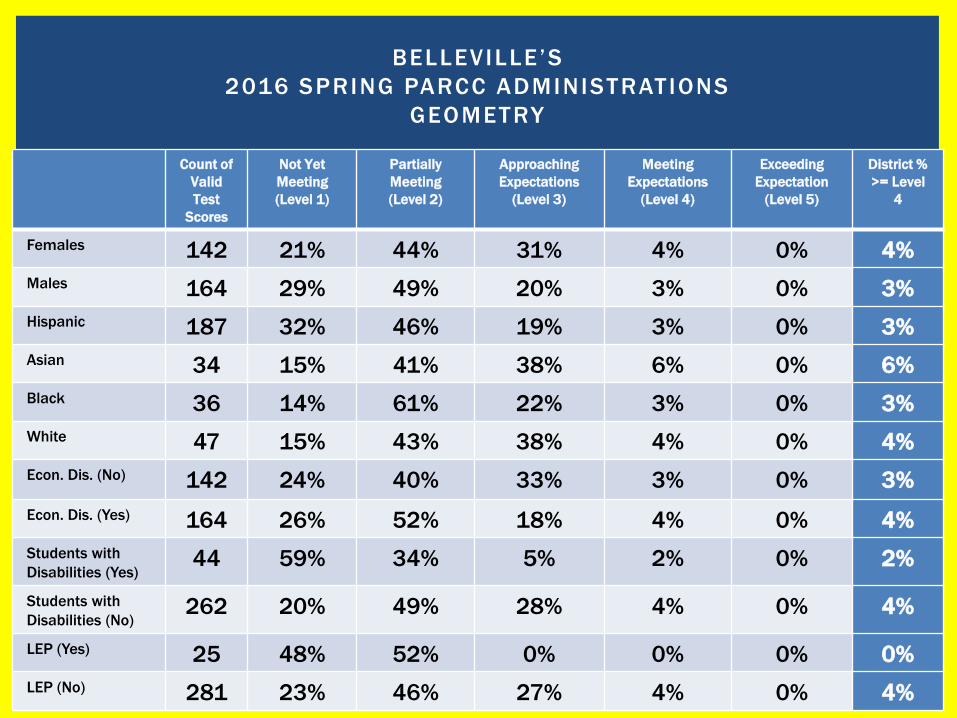
Females 142 21% 44% 31% 4% 0% 4%
Males 164 29% 49% 20% 3% 0% 3%
Hispanic 187 32% 46% 19% 3% 0% 3%
Asian 34 15% 41% 38% 6% 0% 6%
Black 36 14% 61% 22% 3% 0% 3%
White 47 15% 43% 38% 4% 0% 4%
Econ. Dis. (No) 142 24% 40% 33% 3% 0% 3%
Econ. Dis. (Yes) 164 26% 52% 18% 4% 0% 4%
Students with
Disabilities (Yes)44 59% 34% 5% 2% 0% 2%
Students with
Disabilities (No)262 20% 49% 28% 4% 0% 4%
LEP (Yes) 25 48% 52% 0% 0% 0% 0%
LEP (No) 281 23% 46% 27% 4% 0% 4%
BELLEVILLE’S
2016 SPRING PARCC ADMINISTRATIONS
GEOMETRY

Count of
Valid
Test
Scores
Not Yet
Meeting
(Level 1)
Partially
Meeting
(Level 2)
Approaching
Expectations
(Level 3)
Meeting
Expectations
(Level 4)
Exceeding
Expectation
(Level 5)
District %
>= Level 4
District 170 12% 21% 25% 41% 2% 42%
School #3 29 10% 24% 38% 28% 0% 28%
School #4 25 20% 28% 20% 32% 0% 32%
School #5 30 13% 30% 10% 47% 0% 47%
School #7 30 10% 17% 33% 40% 0% 40%
School #8 34 9% 18% 29% 44% 0% 44%
School #9 9 11% 11% 22% 44% 11% 56%
School #10 13 8% 0% 15% 62% 15% 77%
BELLEVILLE’S
2016 SPRING PARCC ADMINISTRATIONS
3 RD GRADE
ENGLISH LANGUAGE ARTS/LITERACY
FEMALES

Count of
Valid
Test
Scores
Not Yet
Meeting
(Level 1)
Partially
Meeting
(Level 2)
Approaching
Expectations
(Level 3)
Meeting
Expectations
(Level 4)
Exceeding
Expectation
(Level 5)
District %
>= Level 4
District 197 15% 23% 27% 33% 2% 35%
School #3 26 12% 23% 35% 31% 0% 31%
School #4 29 24% 17% 24% 31% 3% 35%
School #5 38 11% 26% 29% 34% 0% 34%
School #7 26 8% 23% 19% 50% 0% 50%
School #8 44 21% 21% 43% 16% 0% 16%
School #9 18 22% 22% 11% 39% 6% 44%
School #10 16 0% 38% 0% 50% 13% 63%
BELLEVILLE’S
2016 SPRING PARCC ADMINISTRATIONS
3 RD GRADE
ENGLISH LANGUAGE ARTS/LITERACY
MALES

Count of
Valid
Test
Scores
Not Yet
Meeting
(Level 1)
Partially
Meeting
(Level 2)
Approaching
Expectations
(Level 3)
Meeting
Expectations
(Level 4)
Exceeding
Expectation
(Level 5)
District %
>= Level 4
District 236 17% 25% 29% 28% 2% 29%
School #3 37 11% 24% 35% 30% 0% 30%
School #4 38 26% 21% 26% 24% 3% 26%
School #5 43 16% 33% 28% 23% 0% 23%
School #7 23 9% 26% 30% 35% 0% 35%
School #8 61 20% 21% 36% 23% 0% 23%
School #9 20 20% 20% 15% 35% 10% 45%
School #10 14 7% 36% 7% 43% 7% 50%
BELLEVILLE’S
2016 SPRING PARCC ADMINISTRATIONS
3 RD GRADE
ENGLISH LANGUAGE ARTS/LITERACY
HISPANIC
Count of
Valid
Test
Scores
Not Yet
Meeting
(Level 1)
Partially
Meeting
(Level 2)
Approaching
Expectations
(Level 3)
Meeting
Expectations
(Level 4)
Exceeding
Expectation
(Level 5)
District %
>= Level 4
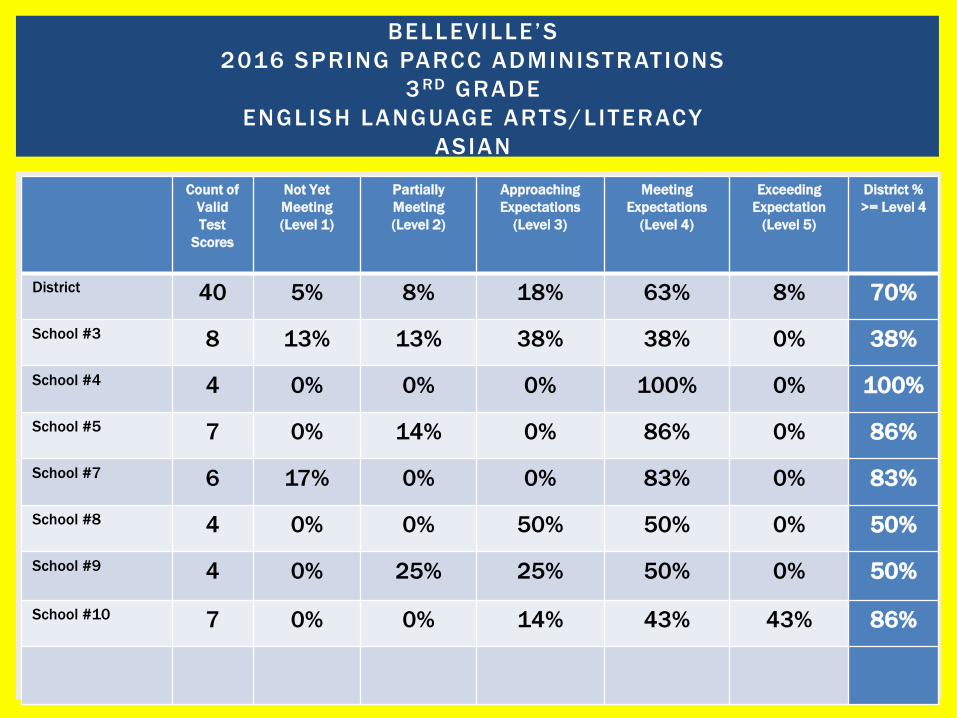
District 40 5% 8% 18% 63% 8% 70%
School #3 8 13% 13% 38% 38% 0% 38%
School #4 4 0% 0% 0% 100% 0% 100%
School #5 7 0% 14% 0% 86% 0% 86%
School #7 6 17% 0% 0% 83% 0% 83%
School #8 4 0% 0% 50% 50% 0% 50%
School #9 4 0% 25% 25% 50% 0% 50%
School #10 7 0% 0% 14% 43% 43% 86%
BELLEVILLE’S
2016 SPRING PARCC ADMINISTRATIONS
3 RD GRADE
ENGLISH LANGUAGE ARTS/LITERACY
ASIAN

Count of
Valid
Test
Scores
Not Yet
Meeting
(Level 1)
Partially
Meeting
(Level 2)
Approaching
Expectations
(Level 3)
Meeting
Expectations
(Level 4)
Exceeding
Expectation
(Level 5)
District %
>= Level 4
District 23 13% 26% 22% 39% 0% 39%
School #3 3 0% 67% 33% 0% 0% 0%
School #4 4 50% 25% 25% 0% 0% 0%
School #5 4 0% 25% 0% 75% 0% 75%
School #7 4 0% 25% 25% 50% 0% 50%
School #8 6 0% 17% 33% 50% 0% 50%
School #9 1 100% 0% 0% 0% 0% 0%
School #10 1 0% 0% 0% 100% 0% 100%
BELLEVILLE’S
2016 SPRING PARCC ADMINISTRATIONS
3 RD GRADE
ENGLISH LANGUAGE ARTS/LITERACY
BLACK
Count of
Valid
Test
Scores
Not Yet
Meeting
(Level 1)
Partially
Meeting
(Level 2)
Approaching
Expectations
(Level 3)
Meeting
Expectations
(Level 4)
Exceeding
Expectation
(Level 5)
District %
>= Level 4
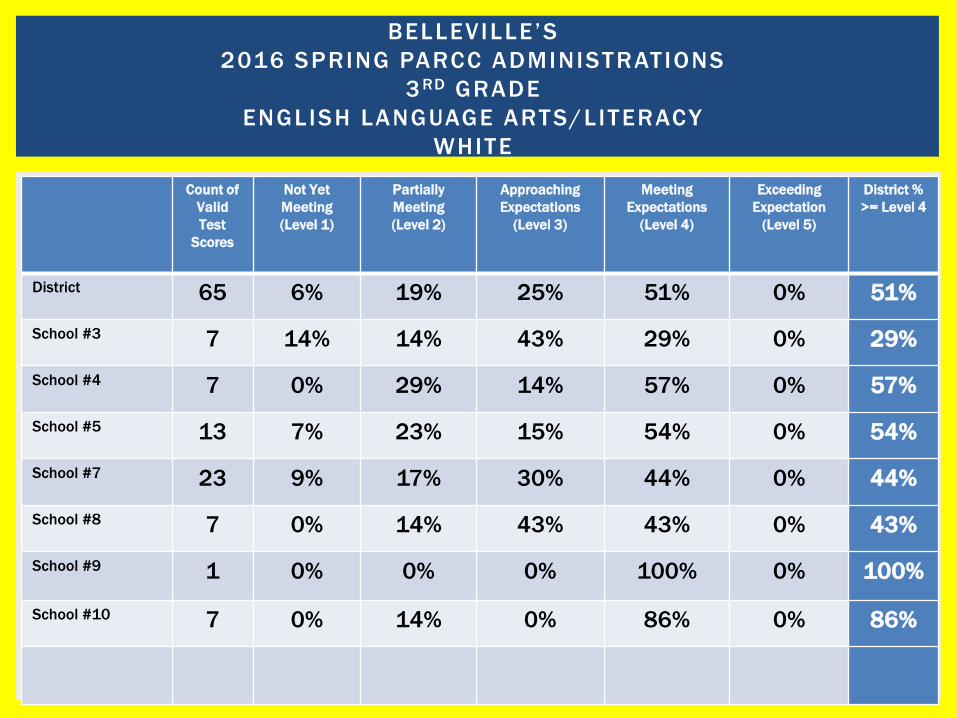
District 65 6% 19% 25% 51% 0% 51%
School #3 7 14% 14% 43% 29% 0% 29%
School #4 7 0% 29% 14% 57% 0% 57%
School #5 13 7% 23% 15% 54% 0% 54%
School #7 23 9% 17% 30% 44% 0% 44%
School #8 7 0% 14% 43% 43% 0% 43%
School #9 1 0% 0% 0% 100% 0% 100%
School #10 7 0% 14% 0% 86% 0% 86%
BELLEVILLE’S
2016 SPRING PARCC ADMINISTRATIONS
3 RD GRADE
ENGLISH LANGUAGE ARTS/LITERACY
WHITE
Count of
Valid
Test
Scores
Not Yet
Meeting
(Level 1)
Partially
Meeting
(Level 2)
Approaching
Expectations
(Level 3)
Meeting
Expectations
(Level 4)
Exceeding
Expectation
(Level 5)
District %
>= Level 4
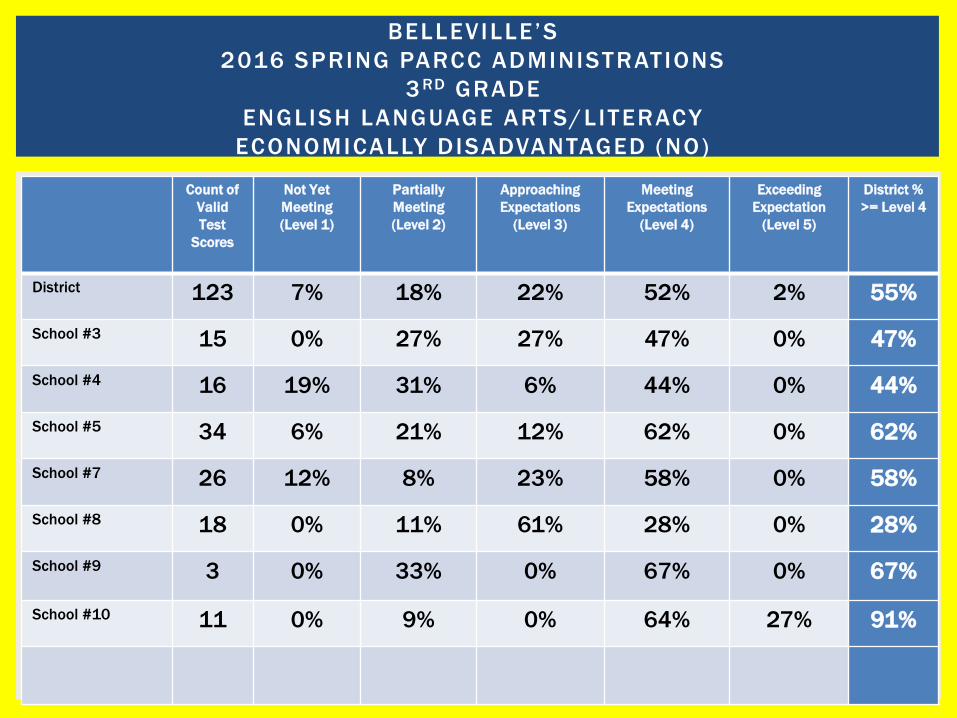
District 123 7% 18% 22% 52% 2% 55%
School #3 15 0% 27% 27% 47% 0% 47%
School #4 16 19% 31% 6% 44% 0% 44%
School #5 34 6% 21% 12% 62% 0% 62%
School #7 26 12% 8% 23% 58% 0% 58%
School #8 18 0% 11% 61% 28% 0% 28%
School #9 3 0% 33% 0% 67% 0% 67%
School #10 11 0% 9% 0% 64% 27% 91%
BELLEVILLE’S
2016 SPRING PARCC ADMINISTRATIONS
3 RD GRADE
ENGLISH LANGUAGE ARTS/LITERACY
ECONOMICALLY DISADVANTAGED (NO)
Count of
Valid
Test
Scores
Not Yet
Meeting
(Level 1)
Partially
Meeting
(Level 2)
Approaching
Expectations
(Level 3)
Meeting
Expectations
(Level 4)
Exceeding
Expectation
(Level 5)
District %
>= Level 4
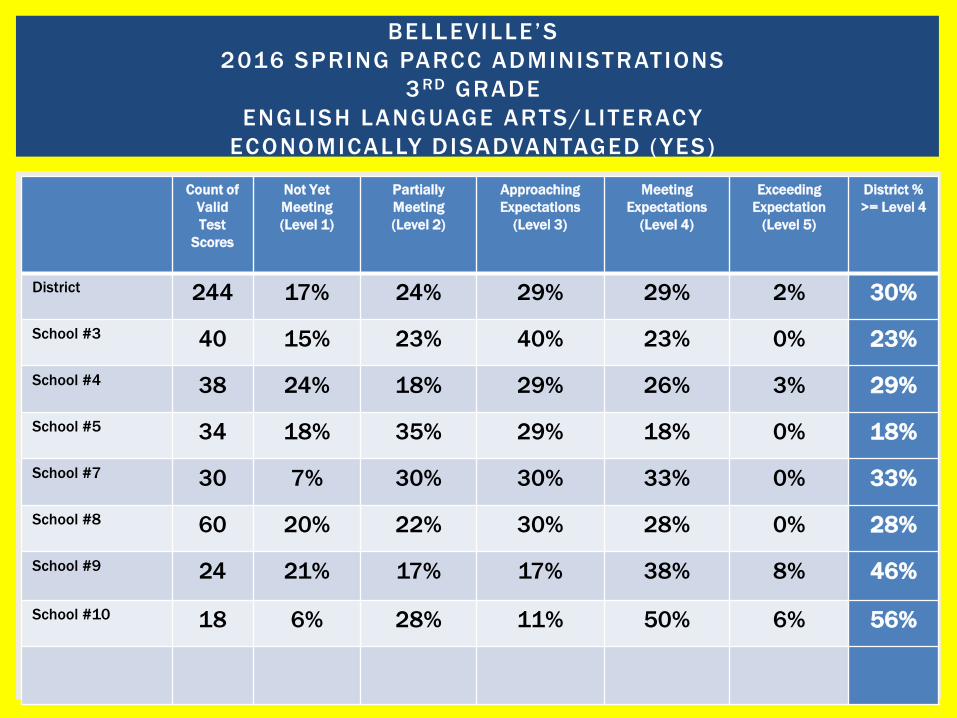
District 244 17% 24% 29% 29% 2% 30%
School #3 40 15% 23% 40% 23% 0% 23%
School #4 38 24% 18% 29% 26% 3% 29%
School #5 34 18% 35% 29% 18% 0% 18%
School #7 30 7% 30% 30% 33% 0% 33%
School #8 60 20% 22% 30% 28% 0% 28%
School #9 24 21% 17% 17% 38% 8% 46%
School #10 18 6% 28% 11% 50% 6% 56%
BELLEVILLE’S
2016 SPRING PARCC ADMINISTRATIONS
3 RD GRADE
ENGLISH LANGUAGE ARTS/LITERACY
ECONOMICALLY DISADVANTAGED (YES)
Count of
Valid
Test
Scores
Not Yet
Meeting
(Level 1)
Partially
Meeting
(Level 2)
Approaching
Expectations
(Level 3)
Meeting
Expectations
(Level 4)
Exceeding
Expectation
(Level 5)
District %
>= Level 4
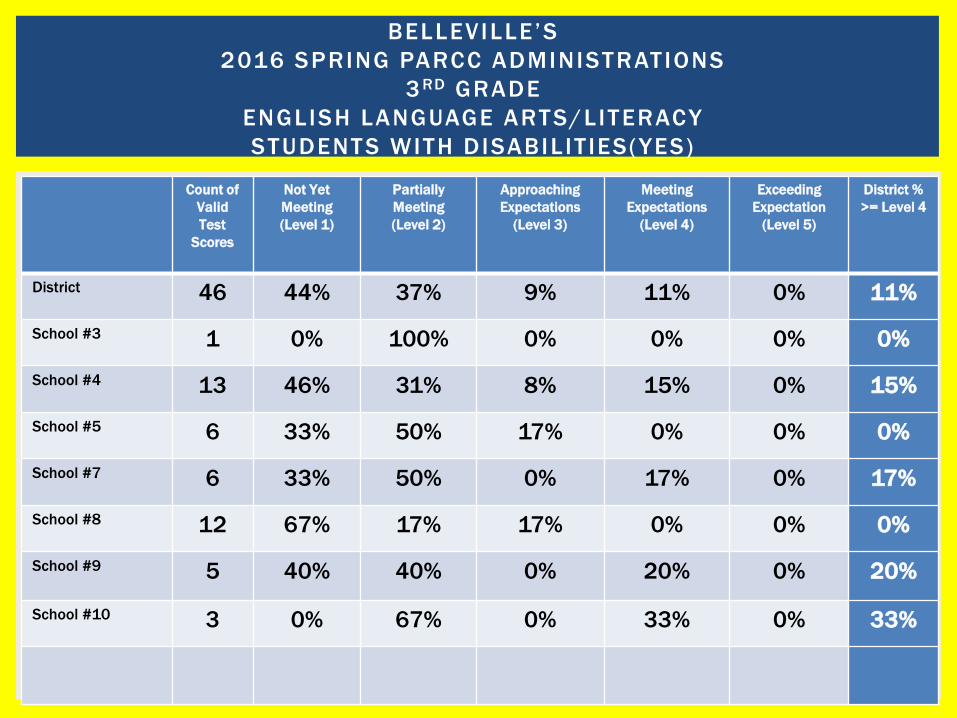
District 46 44% 37% 9% 11% 0% 11%
School #3 1 0% 100% 0% 0% 0% 0%
School #4 13 46% 31% 8% 15% 0% 15%
School #5 6 33% 50% 17% 0% 0% 0%
School #7 6 33% 50% 0% 17% 0% 17%
School #8 12 67% 17% 17% 0% 0% 0%
School #9 5 40% 40% 0% 20% 0% 20%
School #10 3 0% 67% 0% 33% 0% 33%
BELLEVILLE’S
2016 SPRING PARCC ADMINISTRATIONS
3 RD GRADE
ENGLISH LANGUAGE ARTS/LITERACY
STUDENTS WITH DISABIL IT IES(YES)
Count of
Valid
Test
Scores
Not Yet
Meeting
(Level 1)
Partially
Meeting
(Level 2)
Approaching
Expectations
(Level 3)
Meeting
Expectations
(Level 4)
Exceeding
Expectation
(Level 5)
District %
>= Level 4
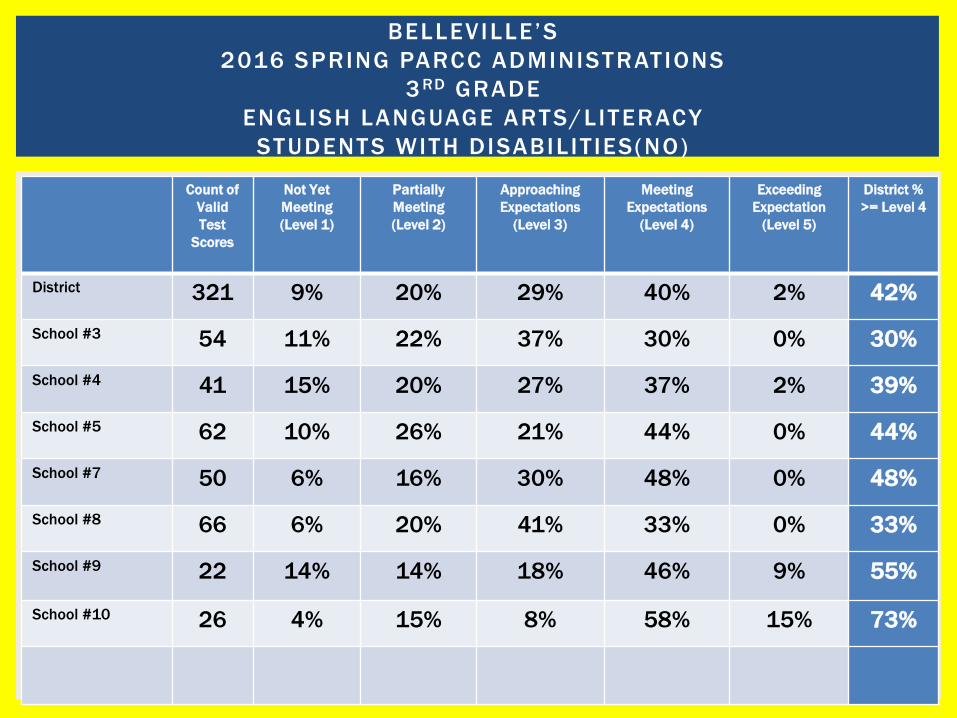
District 321 9% 20% 29% 40% 2% 42%
School #3 54 11% 22% 37% 30% 0% 30%
School #4 41 15% 20% 27% 37% 2% 39%
School #5 62 10% 26% 21% 44% 0% 44%
School #7 50 6% 16% 30% 48% 0% 48%
School #8 66 6% 20% 41% 33% 0% 33%
School #9 22 14% 14% 18% 46% 9% 55%
School #10 26 4% 15% 8% 58% 15% 73%
BELLEVILLE’S
2016 SPRING PARCC ADMINISTRATIONS
3 RD GRADE
ENGLISH LANGUAGE ARTS/LITERACY
STUDENTS WITH DISABIL IT IES(NO)

Count of
Valid
Test
Scores
Not Yet
Meeting
(Level 1)
Partially
Meeting
(Level 2)
Approaching
Expectations
(Level 3)
Meeting
Expectations
(Level 4)
Exceeding
Expectation
(Level 5)
District %
>= Level 4
District 23 39% 35% 22% 4% 0% 4%
School #3 6 33% 33% 33% 0% 0% 0%
School #4 3 67% 33% 0% 0% 0% 0%
School #5 4 75% 25% 0% 0% 0% 0%
School #7 2 0% 50% 50% 0% 0% 0%
School #8 7 14% 43% 29% 14% 0% 14%
School #9 0 0% 0% 0% 0% 0% 0%
School #10 1 100% 0% 0% 0% 0% 0%
BELLEVILLE’S
2016 SPRING PARCC ADMINISTRATIONS
3 RD GRADE
ENGLISH LANGUAGE ARTS/LITERACY
LEP (YES)
Count of
Valid
Test
Scores
Not Yet
Meeting
(Level 1)
Partially
Meeting
(Level 2)
Approaching
Expectations
(Level 3)
Meeting
Expectations
(Level 4)
Exceeding
Expectation
(Level 5)
District %
>= Level 4
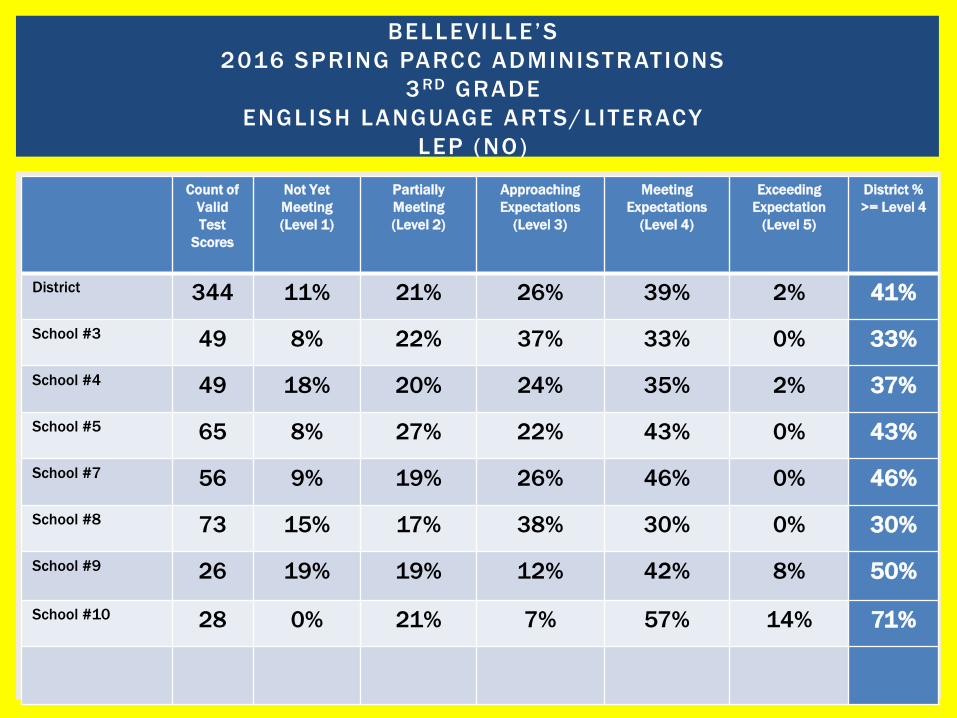
District 344 11% 21% 26% 39% 2% 41%
School #3 49 8% 22% 37% 33% 0% 33%
School #4 49 18% 20% 24% 35% 2% 37%
School #5 65 8% 27% 22% 43% 0% 43%
School #7 56 9% 19% 26% 46% 0% 46%
School #8 73 15% 17% 38% 30% 0% 30%
School #9 26 19% 19% 12% 42% 8% 50%
School #10 28 0% 21% 7% 57% 14% 71%
BELLEVILLE’S
2016 SPRING PARCC ADMINISTRATIONS
3 RD GRADE
ENGLISH LANGUAGE ARTS/LITERACY
LEP (NO)

Count of
Valid
Test
Scores
Not Yet
Meeting
(Level 1)
Partially
Meeting
(Level 2)
Approaching
Expectations
(Level 3)
Meeting
Expectations
(Level 4)
Exceeding
Expectation
(Level 5)
District %
>= Level 4
District 129 7% 15% 28% 43% 7% 50%
School #3 17 12% 0% 29% 41% 18% 59%
School #4 18 0% 17% 28% 50% 6% 56%
School #5 17 18% 18% 29% 29% 6% 35%
School #7 26 8% 23% 27% 35% 8% 42%
School #8 30 7% 17% 30% 47% 0% 47%
School #9 10 0% 20% 20% 50% 10% 60%
School #10 11 0% 0% 27% 64% 9% 73%
BELLEVILLE’S
2016 SPRING PARCC ADMINISTRATIONS
4 TH GRADE
ENGLISH LANGUAGE ARTS/LITERACY
FEMALES

Count of
Valid
Test
Scores
Not Yet
Meeting
(Level 1)
Partially
Meeting
(Level 2)
Approaching
Expectations
(Level 3)
Meeting
Expectations
(Level 4)
Exceeding
Expectation
(Level 5)
District %
>= Level 4
District 178 14% 22% 31% 30% 3% 33%
School #3 27 23% 22% 22% 26% 4% 30%
School #4 35 9% 20% 37% 31% 3% 34%
School #5 25 12% 28% 20% 40% 0% 40%
School #7 27 11% 22% 33% 33% 0% 33%
School #8 45 9% 24% 42% 22% 2% 24%
School #9 5 60% 0% 0% 40% 0% 40%
School #10 13 15% 15% 15% 39% 15% 54%
BELLEVILLE’S
2016 SPRING PARCC ADMINISTRATIONS
4 TH GRADE
ENGLISH LANGUAGE ARTS/LITERACY
MALES

Count of
Valid
Test
Scores
Not Yet
Meeting
(Level 1)
Partially
Meeting
(Level 2)
Approaching
Expectations
(Level 3)
Meeting
Expectations
(Level 4)
Exceeding
Expectation
(Level 5)
District %
>= Level 4
District 201 13% 19% 27% 38% 3% 41%
School #3 30 27% 17% 20% 30% 7% 37%
School #4 37 5% 14% 35% 43% 3% 46%
School #5 28 14% 14% 29% 43% 0% 43%
School #7 29 14% 28% 24% 31% 3% 35%
School #8 58 10% 24% 28% 36% 2% 38%
School #9 7 14% 14% 14% 43% 14% 57%
School #10 11 18% 9% 18% 55% 0% 55%
BELLEVILLE’S
2016 SPRING PARCC ADMINISTRATIONS
4 TH GRADE
ENGLISH LANGUAGE ARTS/LITERACY
HISPANIC
Count of
Valid
Test
Scores
Not Yet
Meeting
(Level 1)
Partially
Meeting
(Level 2)
Approaching
Expectations
(Level 3)
Meeting
Expectations
(Level 4)
Exceeding
Expectation
(Level 5)
District %
>= Level 4
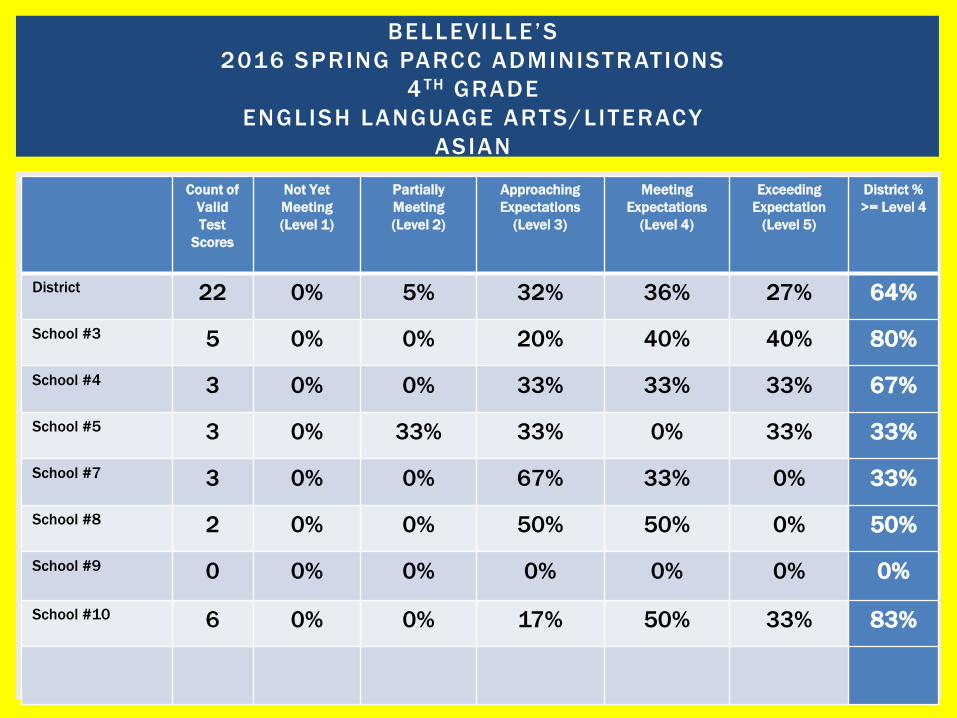
District 22 0% 5% 32% 36% 27% 64%
School #3 5 0% 0% 20% 40% 40% 80%
School #4 3 0% 0% 33% 33% 33% 67%
School #5 3 0% 33% 33% 0% 33% 33%
School #7 3 0% 0% 67% 33% 0% 33%
School #8 2 0% 0% 50% 50% 0% 50%
School #9 0 0% 0% 0% 0% 0% 0%
School #10 6 0% 0% 17% 50% 33% 83%
BELLEVILLE’S
2016 SPRING PARCC ADMINISTRATIONS
4 TH GRADE
ENGLISH LANGUAGE ARTS/LITERACY
ASIAN
Count of
Valid
Test
Scores
Not Yet
Meeting
(Level 1)
Partially
Meeting
(Level 2)
Approaching
Expectations
(Level 3)
Meeting
Expectations
(Level 4)
Exceeding
Expectation
(Level 5)
District %
>= Level 4
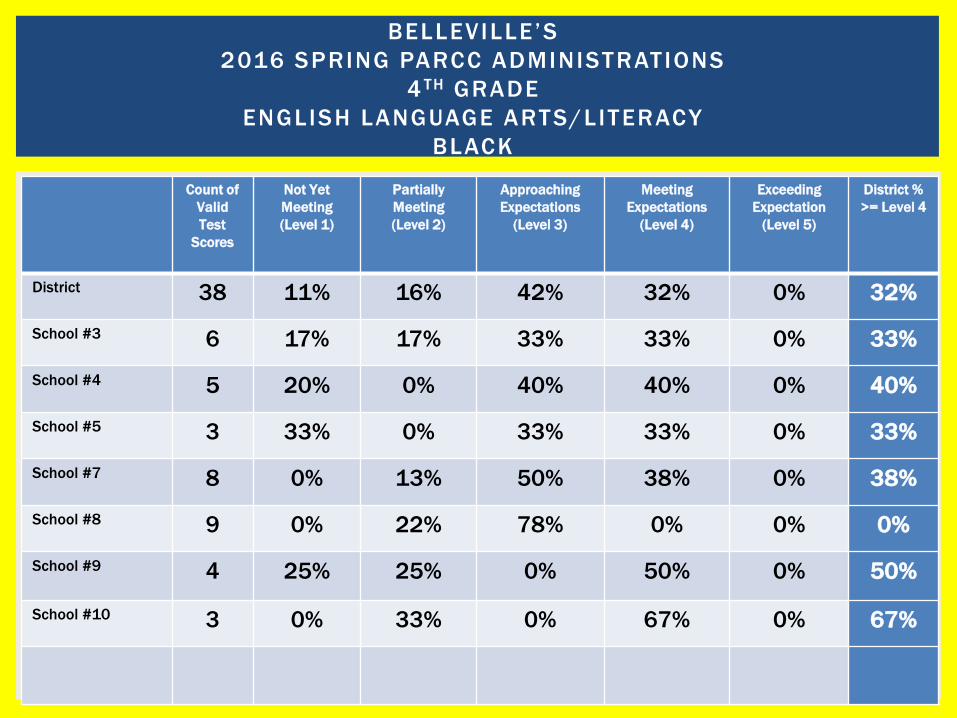
District 38 11% 16% 42% 32% 0% 32%
School #3 6 17% 17% 33% 33% 0% 33%
School #4 5 20% 0% 40% 40% 0% 40%
School #5 3 33% 0% 33% 33% 0% 33%
School #7 8 0% 13% 50% 38% 0% 38%
School #8 9 0% 22% 78% 0% 0% 0%
School #9 4 25% 25% 0% 50% 0% 50%
School #10 3 0% 33% 0% 67% 0% 67%
BELLEVILLE’S
2016 SPRING PARCC ADMINISTRATIONS
4 TH GRADE
ENGLISH LANGUAGE ARTS/LITERACY
BLACK
Count of
Valid
Test
Scores
Not Yet
Meeting
(Level 1)
Partially
Meeting
(Level 2)
Approaching
Expectations
(Level 3)
Meeting
Expectations
(Level 4)
Exceeding
Expectation
(Level 5)
District %
>= Level 4
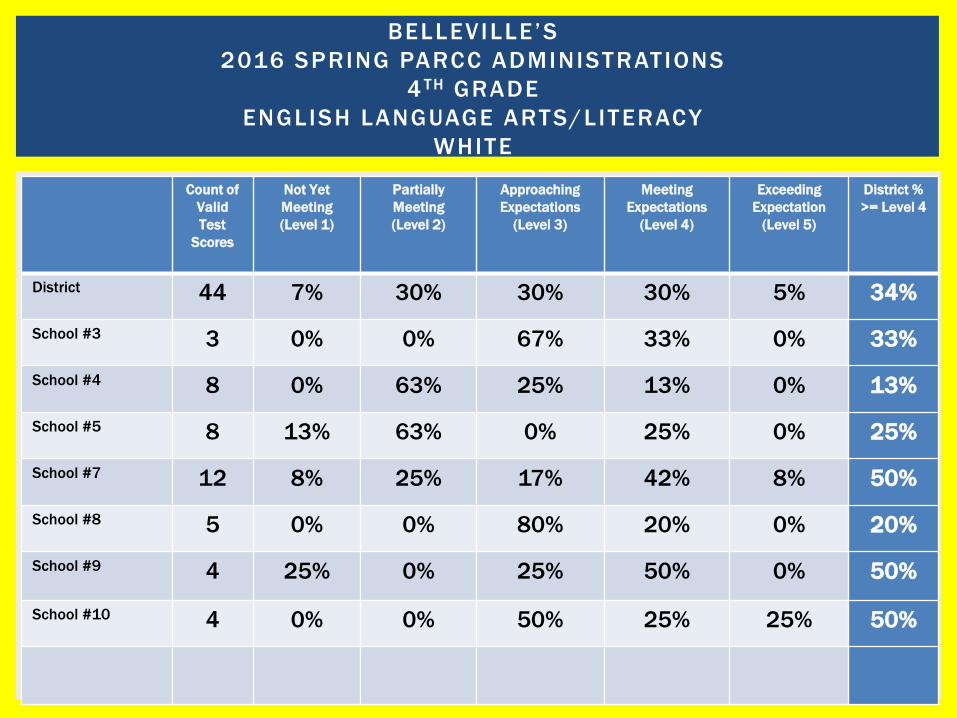
District 44 7% 30% 30% 30% 5% 34%
School #3 3 0% 0% 67% 33% 0% 33%
School #4 8 0% 63% 25% 13% 0% 13%
School #5 8 13% 63% 0% 25% 0% 25%
School #7 12 8% 25% 17% 42% 8% 50%
School #8 5 0% 0% 80% 20% 0% 20%
School #9 4 25% 0% 25% 50% 0% 50%
School #10 4 0% 0% 50% 25% 25% 50%
BELLEVILLE’S
2016 SPRING PARCC ADMINISTRATIONS
4 TH GRADE
ENGLISH LANGUAGE ARTS/LITERACY
WHITE
Count of
Valid
Test
Scores
Not Yet
Meeting
(Level 1)
Partially
Meeting
(Level 2)
Approaching
Expectations
(Level 3)
Meeting
Expectations
(Level 4)
Exceeding
Expectation
(Level 5)
District %
>= Level 4
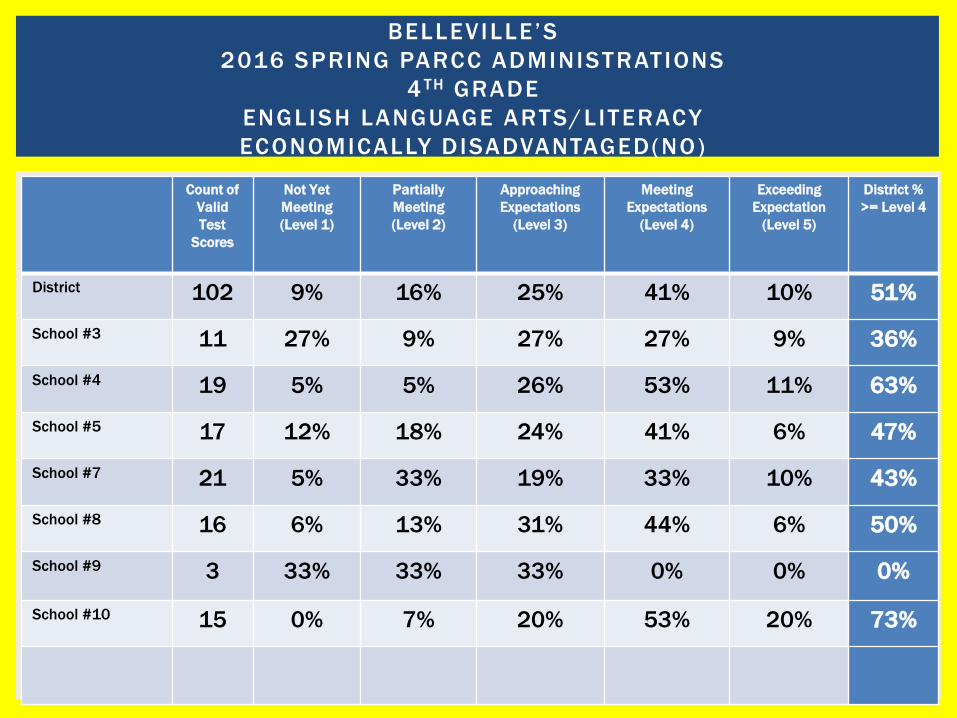
District 102 9% 16% 25% 41% 10% 51%
School #3 11 27% 9% 27% 27% 9% 36%
School #4 19 5% 5% 26% 53% 11% 63%
School #5 17 12% 18% 24% 41% 6% 47%
School #7 21 5% 33% 19% 33% 10% 43%
School #8 16 6% 13% 31% 44% 6% 50%
School #9 3 33% 33% 33% 0% 0% 0%
School #10 15 0% 7% 20% 53% 20% 73%
BELLEVILLE’S
2016 SPRING PARCC ADMINISTRATIONS
4 TH GRADE
ENGLISH LANGUAGE ARTS/LITERACY
ECONOMICALLY DISADVANTAGED(NO)

Count of
Valid
Test
Scores
Not Yet
Meeting
(Level 1)
Partially
Meeting
(Level 2)
Approaching
Expectations
(Level 3)
Meeting
Expectations
(Level 4)
Exceeding
Expectation
(Level 5)
District %
>= Level 4
District 205 12% 21% 32% 33% 2% 35%
School #3 33 18% 15% 24% 33% 9% 42%
School #4 34 6% 27% 38% 29% 0% 29%
School #5 25 16% 28% 24% 32% 0% 32%
School #7 32 13% 16% 38% 34% 0% 34%
School #8 59 9% 24% 39% 29% 0% 29%
School #9 12 17% 8% 8% 58% 8% 67%
School #10 9 22% 11% 22% 44% 0% 44%
BELLEVILLE’S
2016 SPRING PARCC ADMINISTRATIONS
4 TH GRADE
ENGLISH LANGUAGE ARTS/LITERACY
ECONOMICALLY DISADVANTAGED(YES)
Count of
Valid
Test
Scores
Not Yet
Meeting
(Level 1)
Partially
Meeting
(Level 2)
Approaching
Expectations
(Level 3)
Meeting
Expectations
(Level 4)
Exceeding
Expectation
(Level 5)
District %
>= Level 4
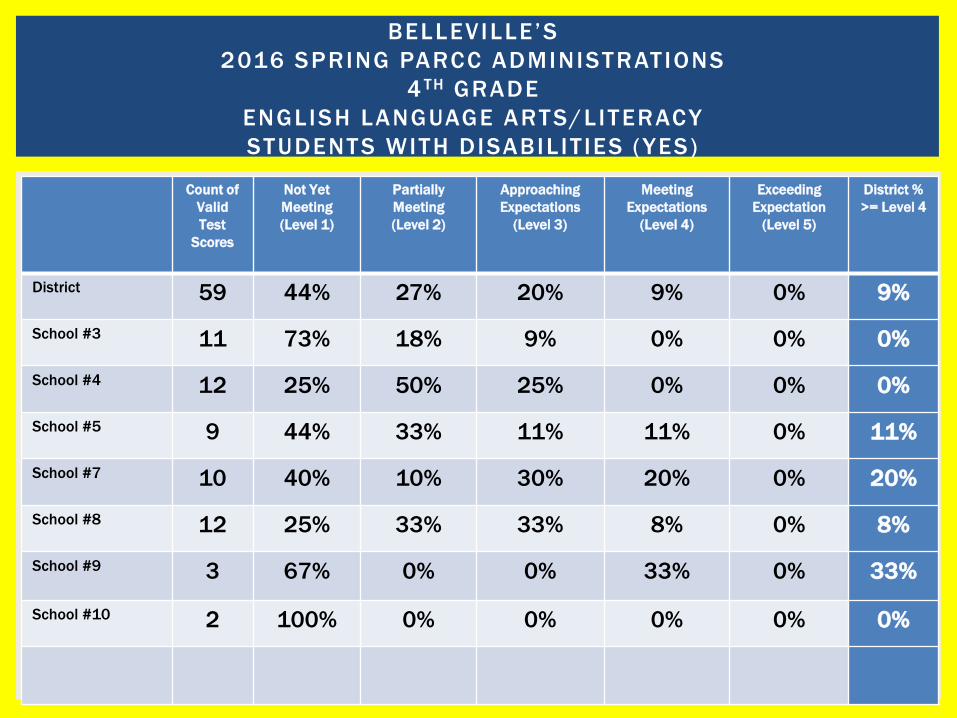
District 59 44% 27% 20% 9% 0% 9%
School #3 11 73% 18% 9% 0% 0% 0%
School #4 12 25% 50% 25% 0% 0% 0%
School #5 9 44% 33% 11% 11% 0% 11%
School #7 10 40% 10% 30% 20% 0% 20%
School #8 12 25% 33% 33% 8% 0% 8%
School #9 3 67% 0% 0% 33% 0% 33%
School #10 2 100% 0% 0% 0% 0% 0%
BELLEVILLE’S
2016 SPRING PARCC ADMINISTRATIONS
4 TH GRADE
ENGLISH LANGUAGE ARTS/LITERACY
STUDENTS WITH DISABIL IT IES (YES)

Count of
Valid
Test
Scores
Not Yet
Meeting
(Level 1)
Partially
Meeting
(Level 2)
Approaching
Expectations
(Level 3)
Meeting
Expectations
(Level 4)
Exceeding
Expectation
(Level 5)
District %
>= Level 4
District 248 3% 17% 32% 42% 6% 48%
School #3 33 3% 12% 30% 42% 12% 55%
School #4 41 0% 10% 37% 49% 5% 54%
School #5 33 6% 21% 27% 42% 3% 46%
School #7 43 2% 26% 30% 37% 5% 42%
School #8 63 5% 19% 38% 37% 2% 38%
School #9 12 8% 17% 17% 50% 8% 58%
School #10 22 0% 9% 23% 55% 14% 68%
BELLEVILLE’S
2016 SPRING PARCC ADMINISTRATIONS
4 TH GRADE
ENGLISH LANGUAGE ARTS/LITERACY
STUDENTS WITH DISABIL IT IES (NO)
Count of
Valid
Test
Scores
Not Yet
Meeting
(Level 1)
Partially
Meeting
(Level 2)
Approaching
Expectations
(Level 3)
Meeting
Expectations
(Level 4)
Exceeding
Expectation
(Level 5)
District %
>= Level 4
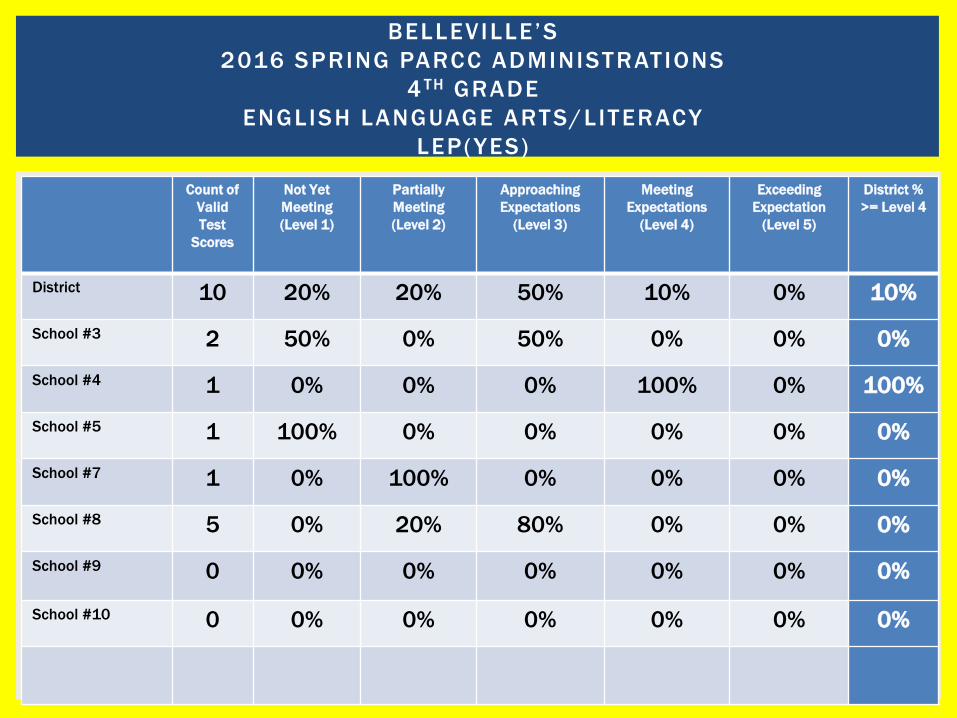
District 10 20% 20% 50% 10% 0% 10%
School #3 2 50% 0% 50% 0% 0% 0%
School #4 1 0% 0% 0% 100% 0% 100%
School #5 1 100% 0% 0% 0% 0% 0%
School #7 1 0% 100% 0% 0% 0% 0%
School #8 5 0% 20% 80% 0% 0% 0%
School #9 0 0% 0% 0% 0% 0% 0%
School #10 0 0% 0% 0% 0% 0% 0%
BELLEVILLE’S
2016 SPRING PARCC ADMINISTRATIONS
4 TH GRADE
ENGLISH LANGUAGE ARTS/LITERACY
LEP(YES)

Count of
Valid
Test
Scores
Not Yet
Meeting
(Level 1)
Partially
Meeting
(Level 2)
Approaching
Expectations
(Level 3)
Meeting
Expectations
(Level 4)
Exceeding
Expectation
(Level 5)
District %
>= Level 4
District 297 11% 19% 29% 37% 5% 41%
School #3 42 0% 14% 24% 33% 10% 43%
School #4 52 0% 19% 35% 37% 4% 41%
School #5 41 0% 24% 24% 37% 2% 39%
School #7 52 10% 21% 31% 35% 4% 39%
School #8 70 9% 21% 34% 34% 1% 35%
School #9 15 20% 13% 13% 47% 7% 54%
School #10 24 8% 8% 21% 50% 13% 63%
BELLEVILLE’S
2016 SPRING PARCC ADMINISTRATIONS
4 TH GRADE
ENGLISH LANGUAGE ARTS/LITERACY
LEP(NO)
Count of
Valid
Test
Scores
Not Yet
Meeting
(Level 1)
Partially
Meeting
(Level 2)
Approaching
Expectations
(Level 3)
Meeting
Expectations
(Level 4)
Exceeding
Expectation
(Level 5)
District %
>= Level 4
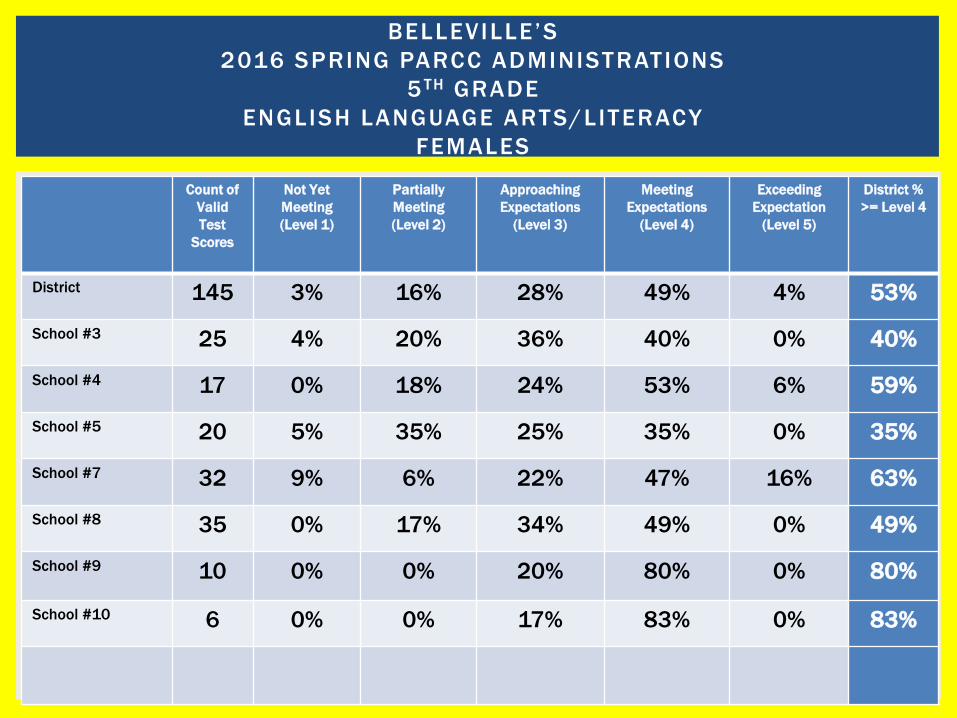
District 145 3% 16% 28% 49% 4% 53%
School #3 25 4% 20% 36% 40% 0% 40%
School #4 17 0% 18% 24% 53% 6% 59%
School #5 20 5% 35% 25% 35% 0% 35%
School #7 32 9% 6% 22% 47% 16% 63%
School #8 35 0% 17% 34% 49% 0% 49%
School #9 10 0% 0% 20% 80% 0% 80%
School #10 6 0% 0% 17% 83% 0% 83%
BELLEVILLE’S
2016 SPRING PARCC ADMINISTRATIONS
5 TH GRADE
ENGLISH LANGUAGE ARTS/LITERACY
FEMALES
Count of
Valid
Test
Scores
Not Yet
Meeting
(Level 1)
Partially
Meeting
(Level 2)
Approaching
Expectations
(Level 3)
Meeting
Expectations
(Level 4)
Exceeding
Expectation
(Level 5)
District %
>= Level 4
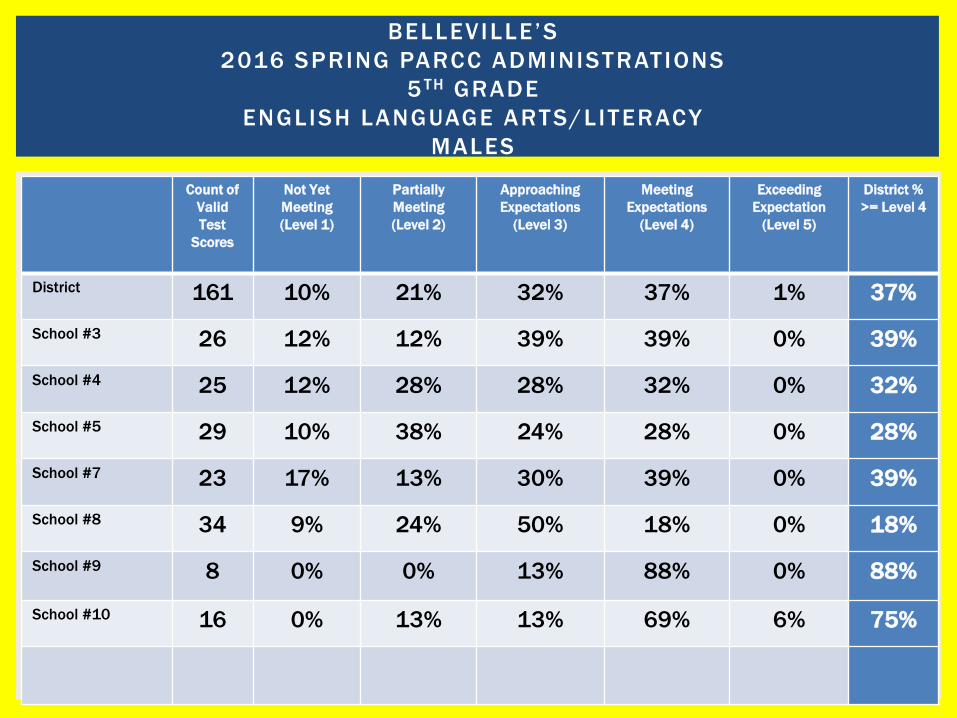
District 161 10% 21% 32% 37% 1% 37%
School #3 26 12% 12% 39% 39% 0% 39%
School #4 25 12% 28% 28% 32% 0% 32%
School #5 29 10% 38% 24% 28% 0% 28%
School #7 23 17% 13% 30% 39% 0% 39%
School #8 34 9% 24% 50% 18% 0% 18%
School #9 8 0% 0% 13% 88% 0% 88%
School #10 16 0% 13% 13% 69% 6% 75%
BELLEVILLE’S
2016 SPRING PARCC ADMINISTRATIONS
5 TH GRADE
ENGLISH LANGUAGE ARTS/LITERACY
MALES

Count of
Valid
Test
Scores
Not Yet
Meeting
(Level 1)
Partially
Meeting
(Level 2)
Approaching
Expectations
(Level 3)
Meeting
Expectations
(Level 4)
Exceeding
Expectation
(Level 5)
District %
>= Level 4
District 200 4% 19% 34% 42% 3% 44%
School #3 30 3% 10% 47% 40% 0% 40%
School #4 25 4% 20% 24% 48% 4% 52%
School #5 28 7% 36% 32% 25% 0% 25%
School #7 28 7% 14% 32% 32% 14% 46%
School #8 58 3% 24% 43% 29% 0% 29%
School #9 16 0% 0% 19% 81% 0% 81%
School #10 15 0% 6% 6% 87% 0% 87%
BELLEVILLE’S
2016 SPRING PARCC ADMINISTRATIONS
5 TH GRADE
ENGLISH LANGUAGE ARTS/LITERACY
HISPANIC

Count of
Valid
Test
Scores
Not Yet
Meeting
(Level 1)
Partially
Meeting
(Level 2)
Approaching
Expectations
(Level 3)
Meeting
Expectations
(Level 4)
Exceeding
Expectation
(Level 5)
District %
>= Level 4
District 26 4% 8% 12% 73% 4% 77%
School #3 7 0% 0% 14% 86% 0% 86%
School #4 3 33% 0% 0% 67% 0% 67%
School #5 5 0% 40% 20% 40% 0% 40%
School #7 5 0% 0% 0% 100% 0% 100%
School #8 0 0% 0% 0% 0% 0% 0%
School #9 1 0% 0% 0% 100% 0% 100%
School #10 5 0% 0% 20% 60% 20% 80%
BELLEVILLE’S
2016 SPRING PARCC ADMINISTRATIONS
5 TH GRADE
ENGLISH LANGUAGE ARTS/LITERACY
ASIAN
Count of
Valid
Test
Scores
Not Yet
Meeting
(Level 1)
Partially
Meeting
(Level 2)
Approaching
Expectations
(Level 3)
Meeting
Expectations
(Level 4)
Exceeding
Expectation
(Level 5)
District %
>= Level 4
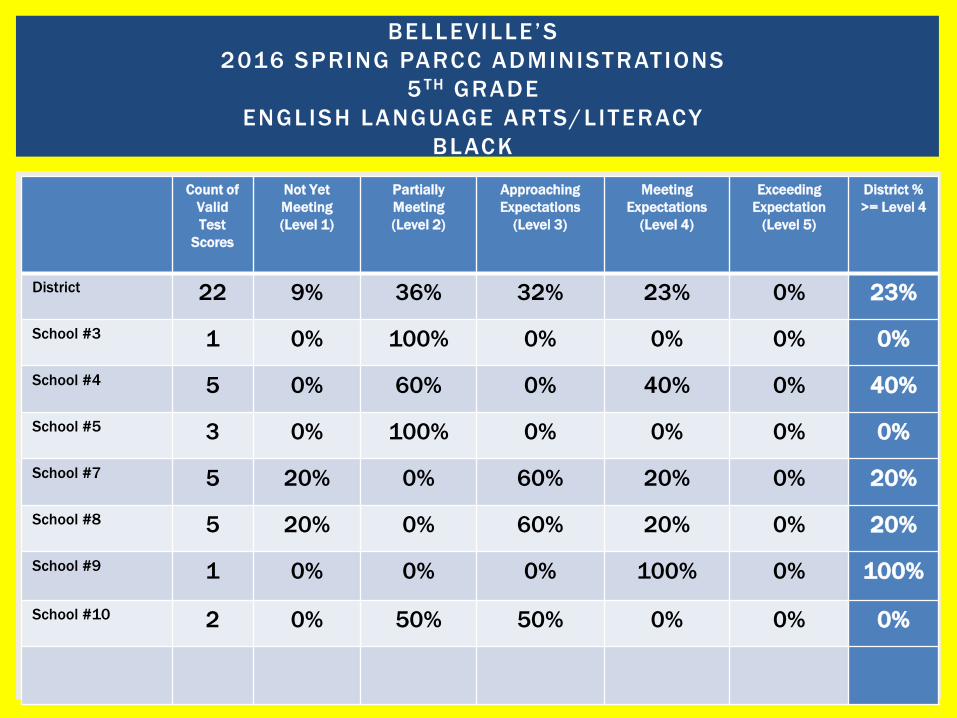
District 22 9% 36% 32% 23% 0% 23%
School #3 1 0% 100% 0% 0% 0% 0%
School #4 5 0% 60% 0% 40% 0% 40%
School #5 3 0% 100% 0% 0% 0% 0%
School #7 5 20% 0% 60% 20% 0% 20%
School #8 5 20% 0% 60% 20% 0% 20%
School #9 1 0% 0% 0% 100% 0% 100%
School #10 2 0% 50% 50% 0% 0% 0%
BELLEVILLE’S
2016 SPRING PARCC ADMINISTRATIONS
5 TH GRADE
ENGLISH LANGUAGE ARTS/LITERACY
BLACK

Count of
Valid
Test
Scores
Not Yet
Meeting
(Level 1)
Partially
Meeting
(Level 2)
Approaching
Expectations
(Level 3)
Meeting
Expectations
(Level 4)
Exceeding
Expectation
(Level 5)
District %
>= Level 4
District 56 18% 18% 25% 38% 2% 39%
School #3 13 23% 31% 31% 15% 0% 15%
School #4 9 11% 22% 56% 11% 0% 11%
School #5 13 15% 23% 15% 46% 0% 46%
School #7 16 25% 6% 13% 50% 6% 56%
School #8 5 0% 0% 20% 80% 0% 80%
School #9 0 0% 0% 0% 0% 0% 0%
School #10 0 0% 0% 0% 0% 0% 0%
BELLEVILLE’S
2016 SPRING PARCC ADMINISTRATIONS
5 TH GRADE
ENGLISH LANGUAGE ARTS/LITERACY
WHITE
Count of
Valid
Test
Scores
Not Yet
Meeting
(Level 1)
Partially
Meeting
(Level 2)
Approaching
Expectations
(Level 3)
Meeting
Expectations
(Level 4)
Exceeding
Expectation
(Level 5)
District %
>= Level 4
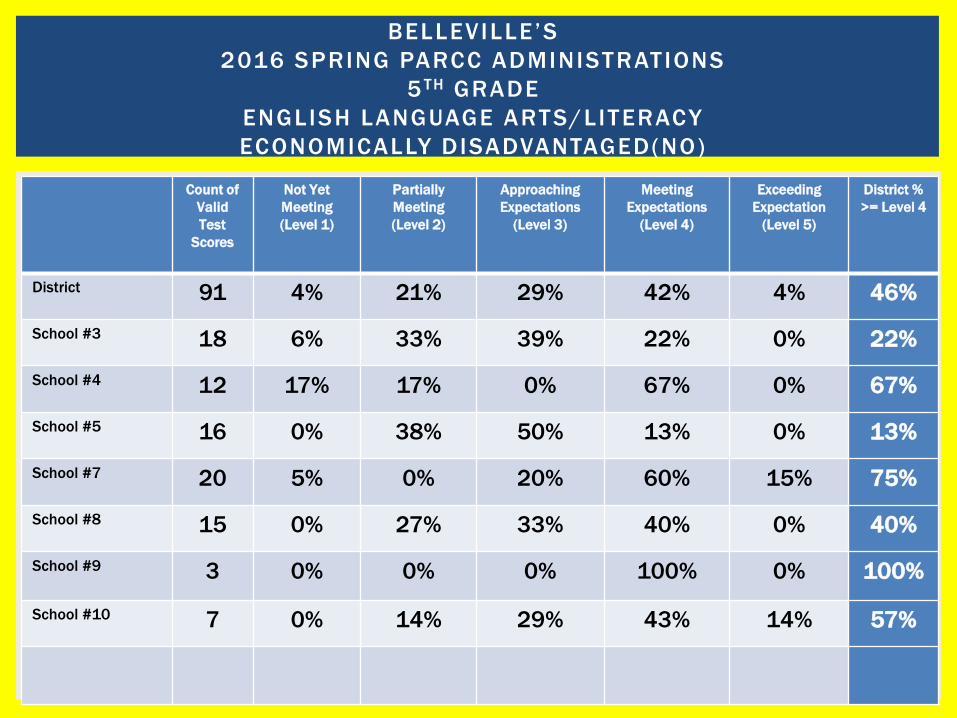
District 91 4% 21% 29% 42% 4% 46%
School #3 18 6% 33% 39% 22% 0% 22%
School #4 12 17% 17% 0% 67% 0% 67%
School #5 16 0% 38% 50% 13% 0% 13%
School #7 20 5% 0% 20% 60% 15% 75%
School #8 15 0% 27% 33% 40% 0% 40%
School #9 3 0% 0% 0% 100% 0% 100%
School #10 7 0% 14% 29% 43% 14% 57%
BELLEVILLE’S
2016 SPRING PARCC ADMINISTRATIONS
5 TH GRADE
ENGLISH LANGUAGE ARTS/LITERACY
ECONOMICALLY DISADVANTAGED(NO)

Count of
Valid
Test
Scores
Not Yet
Meeting
(Level 1)
Partially
Meeting
(Level 2)
Approaching
Expectations
(Level 3)
Meeting
Expectations
(Level 4)
Exceeding
Expectation
(Level 5)
District %
>= Level 4
District 215 8% 18% 30% 43% 1% 44%
School #3 33 9% 6% 36% 49% 0% 49%
School #4 30 3% 27% 37% 30% 3% 33%
School #5 33 12% 36% 12% 39% 0% 39%
School #7 35 17% 14% 29% 34% 6% 40%
School #8 54 6% 19% 44% 32% 0% 32%
School #9 15 0% 0% 20% 80% 0% 80%
School #10 15 0% 7% 7% 87% 0% 87%
BELLEVILLE’S
2016 SPRING PARCC ADMINISTRATIONS
5 TH GRADE
ENGLISH LANGUAGE ARTS/LITERACY
ECONOMICALLY DISADVANTAGED(YES)
Count of
Valid
Test
Scores
Not Yet
Meeting
(Level 1)
Partially
Meeting
(Level 2)
Approaching
Expectations
(Level 3)
Meeting
Expectations
(Level 4)
Exceeding
Expectation
(Level 5)
District %
>= Level 4
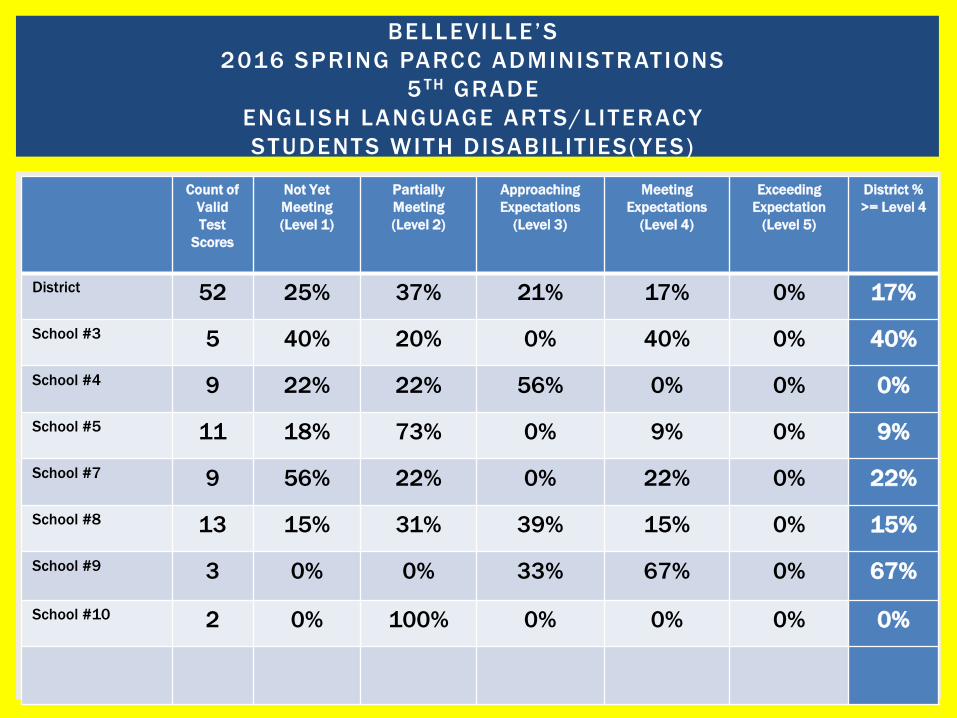
District 52 25% 37% 21% 17% 0% 17%
School #3 5 40% 20% 0% 40% 0% 40%
School #4 9 22% 22% 56% 0% 0% 0%
School #5 11 18% 73% 0% 9% 0% 9%
School #7 9 56% 22% 0% 22% 0% 22%
School #8 13 15% 31% 39% 15% 0% 15%
School #9 3 0% 0% 33% 67% 0% 67%
School #10 2 0% 100% 0% 0% 0% 0%
BELLEVILLE’S
2016 SPRING PARCC ADMINISTRATIONS
5 TH GRADE
ENGLISH LANGUAGE ARTS/LITERACY
STUDENTS WITH DISABIL IT IES(YES)

Count of
Valid
Test
Scores
Not Yet
Meeting
(Level 1)
Partially
Meeting
(Level 2)
Approaching
Expectations
(Level 3)
Meeting
Expectations
(Level 4)
Exceeding
Expectation
(Level 5)
District %
>= Level 4
District 254 3% 15% 32% 48% 3% 50%
School #3 46 4% 15% 41% 39% 0% 39%
School #4 33 3% 24% 18% 52% 3% 55%
School #5 38 5% 26% 32% 37% 0% 37%
School #7 46 4% 7% 30% 48% 11% 59%
School #8 56% 2% 18% 43% 38% 0% 38%
School #9 15 0% 0% 13% 87% 0% 87%
School #10 20 0% 0% 15% 80% 5% 85%
BELLEVILLE’S
2016 SPRING PARCC ADMINISTRATIONS
5 TH GRADE
ENGLISH LANGUAGE ARTS/LITERACY
STUDENTS WITH DISABIL IT IES(NO)
Count of
Valid
Test
Scores
Not Yet
Meeting
(Level 1)
Partially
Meeting
(Level 2)
Approaching
Expectations
(Level 3)
Meeting
Expectations
(Level 4)
Exceeding
Expectation
(Level 5)
District %
>= Level 4
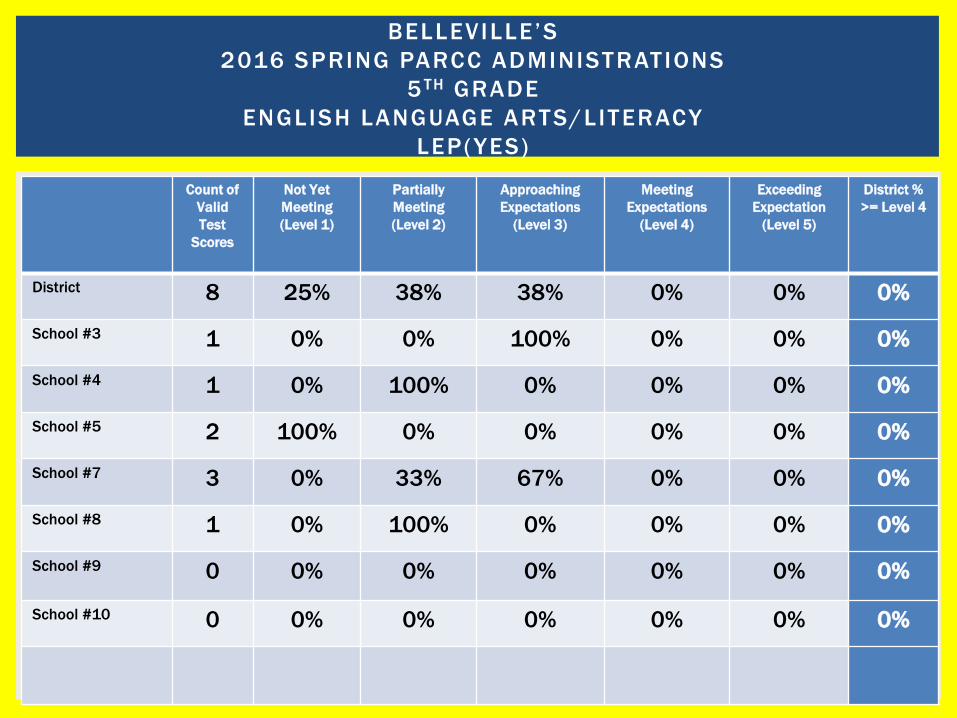
District 8 25% 38% 38% 0% 0% 0%
School #3 1 0% 0% 100% 0% 0% 0%
School #4 1 0% 100% 0% 0% 0% 0%
School #5 2 100% 0% 0% 0% 0% 0%
School #7 3 0% 33% 67% 0% 0% 0%
School #8 1 0% 100% 0% 0% 0% 0%
School #9 0 0% 0% 0% 0% 0% 0%
School #10 0 0% 0% 0% 0% 0% 0%
BELLEVILLE’S
2016 SPRING PARCC ADMINISTRATIONS
5 TH GRADE
ENGLISH LANGUAGE ARTS/LITERACY
LEP(YES)

Count of
Valid
Test
Scores
Not Yet
Meeting
(Level 1)
Partially
Meeting
(Level 2)
Approaching
Expectations
(Level 3)
Meeting
Expectations
(Level 4)
Exceeding
Expectation
(Level 5)
District %
>= Level 4
District 298 6% 18% 30% 44% 2% 46%
School #3 50 8% 16% 36% 40% 0% 40%
School #4 41 7% 22% 27% 42% 2% 44%
School #5 47 4% 38% 26% 32% 0% 32%
School #7 52 13% 8% 23% 46% 10% 56%
School #8 68 4% 19% 43% 34% 0% 34%
School #9 18 0% 0% 17% 83% 0% 83%
School #10 22 0% 9% 14% 73% 5% 78%
BELLEVILLE’S
2016 SPRING PARCC ADMINISTRATIONS
5 TH GRADE
ENGLISH LANGUAGE ARTS/LITERACY
LEP(NO)

Count of
Valid
Test
Scores
Not Yet
Meeting
(Level 1)
Partially
Meeting
(Level 2)
Approaching
Expectations
(Level 3)
Meeting
Expectations
(Level 4)
Exceeding
Expectation
(Level 5)
District %
>= Level 4
District 172 8% 22% 29% 40% 2% 42%
School #3 30 3% 17% 33% 43% 3% 47%
School #4 25 24% 20% 32% 24% 0% 24%
School #5 31 3% 26% 26% 45% 0% 45%
School #7 30 7% 17% 23% 47% 7% 53%
School #8 34 9% 29% 32% 29% 0% 29%
School #9 9 0% 11% 33% 56% 0% 56%
School #10 13 0% 23% 15% 54% 8% 62%
BELLEVILLE’S
2016 SPRING PARCC ADMINISTRATIONS
3 RD GRADE
MATHEMATICS
FEMALES

Count of
Valid
Test
Scores
Not Yet
Meeting
(Level 1)
Partially
Meeting
(Level 2)
Approaching
Expectations
(Level 3)
Meeting
Expectations
(Level 4)
Exceeding
Expectation
(Level 5)
District %
>= Level 4
District 199 7% 24% 28% 36% 5% 41%
School #3 26 0% 23% 39% 39% 0% 39%
School #4 29 10% 35% 24% 28% 3% 31%
School #5 38 3% 11% 32% 45% 11% 55%
School #7 27 11% 19% 30% 33% 7% 40%
School #8 45 13% 33% 27% 27% 0% 27%
School #9 18 6% 28% 17% 50% 0% 50%
School #10 16 0% 19% 25% 38% 19% 56%
BELLEVILLE’S
2016 SPRING PARCC ADMINISTRATIONS
3 RD GRADE
MATHEMATICS
MALES

Count of
Valid
Test
Scores
Not Yet
Meeting
(Level 1)
Partially
Meeting
(Level 2)
Approaching
Expectations
(Level 3)
Meeting
Expectations
(Level 4)
Exceeding
Expectation
(Level 5)
District %
>= Level 4
District 241 9% 26% 30% 32% 2% 34%
School #3 38 0% 24% 40% 37% 0% 37%
School #4 38 21% 26% 29% 21% 3% 24%
School #5 44 5% 21% 34% 39% 2% 41%
School #7 24 8% 25% 29% 29% 8% 38%
School #8 62 15% 31% 29% 26% 0% 26%
School #9 21 5% 24% 24% 48% 0% 48%
School #10 14 0% 36% 14% 43% 7% 50%
BELLEVILLE’S
2016 SPRING PARCC ADMINISTRATIONS
3 RD GRADE
MATHEMATICS
HISPANIC

Count of
Valid
Test
Scores
Not Yet
Meeting
(Level 1)
Partially
Meeting
(Level 2)
Approaching
Expectations
(Level 3)
Meeting
Expectations
(Level 4)
Exceeding
Expectation
(Level 5)
District %
>= Level 4
District 39 0% 13% 15% 54% 18% 72%
School #3 8 0% 0% 38% 50% 13% 63%
School #4 4 0% 0% 0% 100% 0% 100%
School #5 7 0% 14% 0% 57% 29% 86%
School #7 6 0% 17% 17% 50% 17% 67%
School #8 4 0% 75% 0% 25% 0% 25%
School #9 3 0% 0% 33% 67% 0% 67%
School #10 7 0% 0% 14% 43% 43% 86%
BELLEVILLE’S
2016 SPRING PARCC ADMINISTRATIONS
3 RD GRADE
MATHEMATICS
ASIAN

Count of
Valid
Test
Scores
Not Yet
Meeting
(Level 1)
Partially
Meeting
(Level 2)
Approaching
Expectations
(Level 3)
Meeting
Expectations
(Level 4)
Exceeding
Expectation
(Level 5)
District %
>= Level 4
District 23 13% 39% 22% 26% 0% 26%
School #3 3 33% 33% 0% 33% 0% 33%
School #4 4 25% 50% 25% 0% 0% 0%
School #5 4 0% 25% 25% 50% 0% 50%
School #7 4 25% 0% 50% 25% 0% 25%
School #8 6 0% 50% 17% 33% 0% 33%
School #9 1 0% 100% 0% 0% 0% 0%
School #10 1 0% 100% 0% 0% 0% 0%
BELLEVILLE’S
2016 SPRING PARCC ADMINISTRATIONS
3 RD GRADE
MATHEMATICS
BLACK
Count of
Valid
Test
Scores
Not Yet
Meeting
(Level 1)
Partially
Meeting
(Level 2)
Approaching
Expectations
(Level 3)
Meeting
Expectations
(Level 4)
Exceeding
Expectation
(Level 5)
District %
>= Level 4
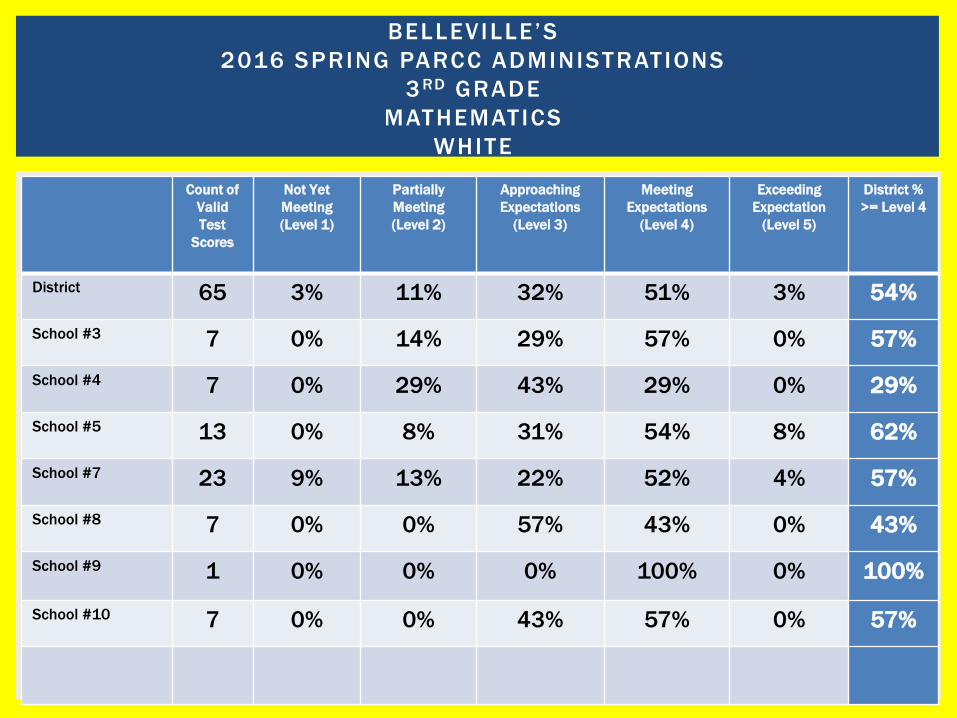
District 65 3% 11% 32% 51% 3% 54%
School #3 7 0% 14% 29% 57% 0% 57%
School #4 7 0% 29% 43% 29% 0% 29%
School #5 13 0% 8% 31% 54% 8% 62%
School #7 23 9% 13% 22% 52% 4% 57%
School #8 7 0% 0% 57% 43% 0% 43%
School #9 1 0% 0% 0% 100% 0% 100%
School #10 7 0% 0% 43% 57% 0% 57%
BELLEVILLE’S
2016 SPRING PARCC ADMINISTRATIONS
3 RD GRADE
MATHEMATICS
WHITE
Count of
Valid
Test
Scores
Not Yet
Meeting
(Level 1)
Partially
Meeting
(Level 2)
Approaching
Expectations
(Level 3)
Meeting
Expectations
(Level 4)
Exceeding
Expectation
(Level 5)
District %
>= Level 4
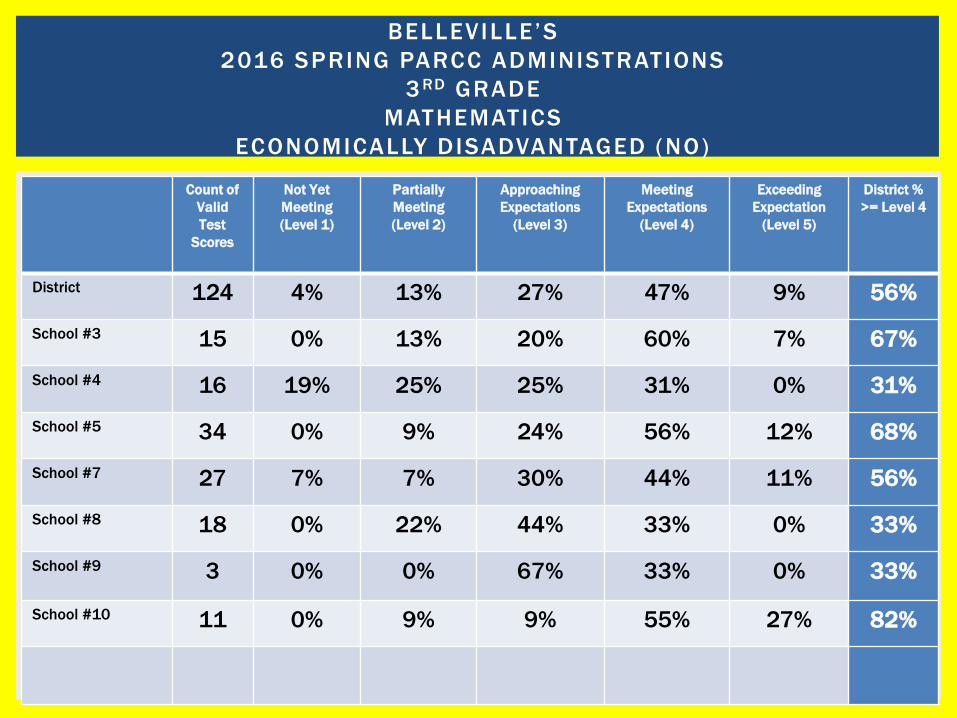
District 124 4% 13% 27% 47% 9% 56%
School #3 15 0% 13% 20% 60% 7% 67%
School #4 16 19% 25% 25% 31% 0% 31%
School #5 34 0% 9% 24% 56% 12% 68%
School #7 27 7% 7% 30% 44% 11% 56%
School #8 18 0% 22% 44% 33% 0% 33%
School #9 3 0% 0% 67% 33% 0% 33%
School #10 11 0% 9% 9% 55% 27% 82%
BELLEVILLE’S
2016 SPRING PARCC ADMINISTRATIONS
3 RD GRADE
MATHEMATICS
ECONOMICALLY DISADVANTAGED (NO)

Count of
Valid
Test
Scores
Not Yet
Meeting
(Level 1)
Partially
Meeting
(Level 2)
Approaching
Expectations
(Level 3)
Meeting
Expectations
(Level 4)
Exceeding
Expectation
(Level 5)
District %
>= Level 4
District 247 9% 28% 29% 33% 1% 34%
School #3 41 2% 22% 42% 34% 0% 34%
School #4 38 16% 29% 29% 24% 3% 26%
School #5 35 6% 26% 34% 34% 0% 34%
School #7 30 10% 27% 23% 37% 3% 40%
School #8 61 15% 34% 25% 26% 0% 26%
School #9 24 4% 25% 17% 54% 0% 54%
School #10 18 0% 28% 28% 39% 6% 44%
BELLEVILLE’S
2016 SPRING PARCC ADMINISTRATIONS
3 RD GRADE
MATHEMATICS
ECONOMICALLY DISADVANTAGED (YES)

Count of
Valid
Test
Scores
Not Yet
Meeting
(Level 1)
Partially
Meeting
(Level 2)
Approaching
Expectations
(Level 3)
Meeting
Expectations
(Level 4)
Exceeding
Expectation
(Level 5)
District %
>= Level 4
District 47 32% 26% 30% 13% 0% 13%
School #3 1 0% 100% 0% 0% 0% 0%
School #4 13 54% 15% 8% 23% 0% 23%
School #5 7 14% 14% 57% 14% 0% 14%
School #7 6 50% 17% 33% 0% 0% 0%
School #8 12 25% 42% 33% 0% 0% 0%
School #9 5 20% 40% 20% 20% 0% 20%
School #10 3 0% 0% 67% 33% 0% 33%
BELLEVILLE’S
2016 SPRING PARCC ADMINISTRATIONS
3 RD GRADE
MATHEMATICS
STUDENTS WITH DISABIL IT IES (YES)

Count of
Valid
Test
Scores
Not Yet
Meeting
(Level 1)
Partially
Meeting
(Level 2)
Approaching
Expectations
(Level 3)
Meeting
Expectations
(Level 4)
Exceeding
Expectation
(Level 5)
District %
>= Level 4
District 324 4% 23% 28% 41% 4% 46%
School #3 55 2% 18% 36% 42% 2% 44%
School #4 41 5% 32% 34% 27% 2% 29%
School #5 62 2% 18% 26% 48% 7% 55%
School #7 51 4% 18% 26% 45% 8% 53%
School #8 67 9% 30% 28% 33% 0% 33%
School #9 22 0% 18% 23% 59% 0% 59%
School #10 26 0% 23% 15% 46% 15% 62%
BELLEVILLE’S
2016 SPRING PARCC ADMINISTRATIONS
3 RD GRADE
MATHEMATICS
STUDENTS WITH DISABIL IT IES (NO)
Count of
Valid
Test
Scores
Not Yet
Meeting
(Level 1)
Partially
Meeting
(Level 2)
Approaching
Expectations
(Level 3)
Meeting
Expectations
(Level 4)
Exceeding
Expectation
(Level 5)
District %
>= Level 4
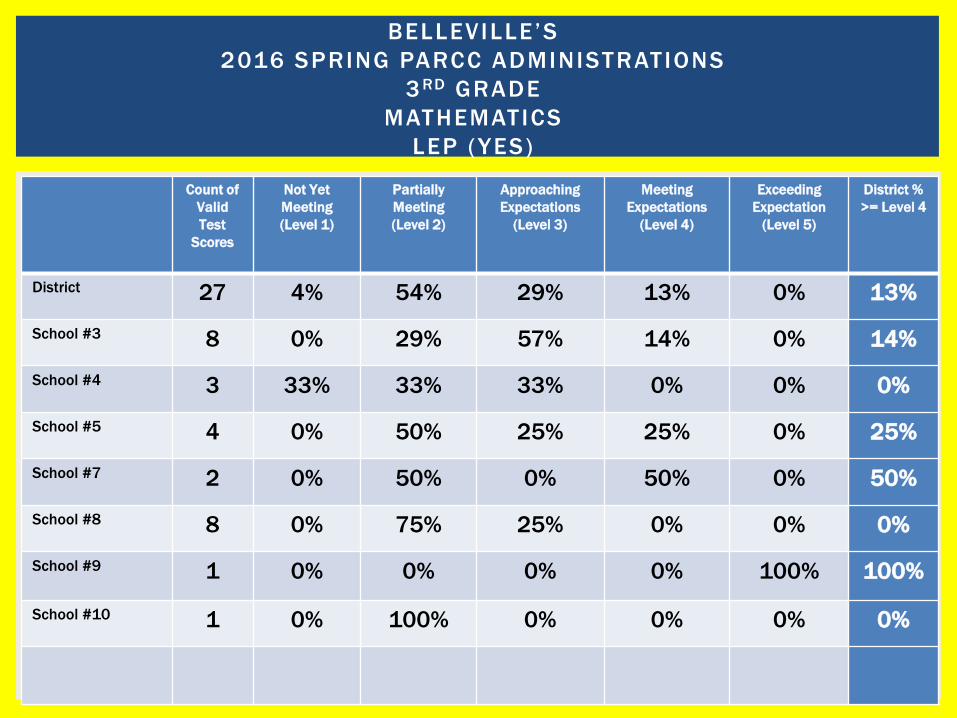
District 27 4% 54% 29% 13% 0% 13%
School #3 8 0% 29% 57% 14% 0% 14%
School #4 3 33% 33% 33% 0% 0% 0%
School #5 4 0% 50% 25% 25% 0% 25%
School #7 2 0% 50% 0% 50% 0% 50%
School #8 8 0% 75% 25% 0% 0% 0%
School #9 1 0% 0% 0% 0% 100% 100%
School #10 1 0% 100% 0% 0% 0% 0%
BELLEVILLE’S
2016 SPRING PARCC ADMINISTRATIONS
3 RD GRADE
MATHEMATICS
LEP (YES)

Count of
Valid
Test
Scores
Not Yet
Meeting
(Level 1)
Partially
Meeting
(Level 2)
Approaching
Expectations
(Level 3)
Meeting
Expectations
(Level 4)
Exceeding
Expectation
(Level 5)
District %
>= Level 4
District 344 7% 21% 28% 40% 4% 44%
School #3 49 2% 18% 33% 45% 2% 47%
School #4 49 14% 27% 29% 29% 2% 31%
School #5 65 3% 15% 29% 46% 6% 52%
School #7 55 9% 16% 27% 40% 7% 47%
School #8 71 13% 27% 30% 31% 0% 31%
School #9 26 4% 23% 23% 50% 0% 50%
School #10 28 0% 18% 21% 46% 14% 60%
BELLEVILLE’S
2016 SPRING PARCC ADMINISTRATIONS
3 RD GRADE
MATHEMATICS
LEP (NO)

Count of
Valid
Test
Scores
Not Yet
Meeting
(Level 1)
Partially
Meeting
(Level 2)
Approaching
Expectations
(Level 3)
Meeting
Expectations
(Level 4)
Exceeding
Expectation
(Level 5)
District %
>= Level 4
District 129 16% 28% 36% 21% 0% 21%
School #3 18 0% 28% 50% 22% 0% 22%
School #4 18 0% 39% 56% 6% 0% 6%
School #5 17 41% 18% 12% 29% 0% 29%
School #7 25 28% 16% 44% 12% 0% 12%
School #8 30 17% 43% 20% 20% 0% 20%
School #9 10 10% 0% 60% 30% 0% 30%
School #10 11 0% 36% 18% 46% 0% 46%
BELLEVILLE’S
2016 SPRING PARCC ADMINISTRATIONS
4 TH GRADE
MATHEMATICS
FEMALES
Count of
Valid
Test
Scores
Not Yet
Meeting
(Level 1)
Partially
Meeting
(Level 2)
Approaching
Expectations
(Level 3)
Meeting
Expectations
(Level 4)
Exceeding
Expectation
(Level 5)
District %
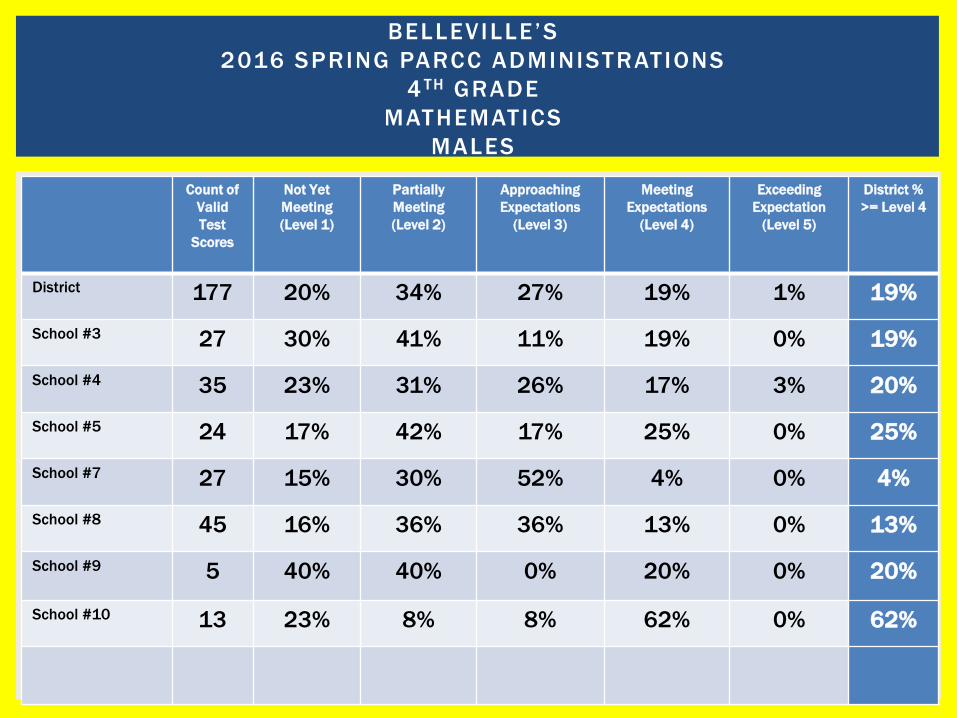
>= Level 4
District 177 20% 34% 27% 19% 1% 19%
School #3 27 30% 41% 11% 19% 0% 19%
School #4 35 23% 31% 26% 17% 3% 20%
School #5 24 17% 42% 17% 25% 0% 25%
School #7 27 15% 30% 52% 4% 0% 4%
School #8 45 16% 36% 36% 13% 0% 13%
School #9 5 40% 40% 0% 20% 0% 20%
School #10 13 23% 8% 8% 62% 0% 62%
BELLEVILLE’S
2016 SPRING PARCC ADMINISTRATIONS
4 TH GRADE
MATHEMATICS
MALES
Count of
Valid
Test
Scores
Not Yet
Meeting
(Level 1)
Partially
Meeting
(Level 2)
Approaching
Expectations
(Level 3)
Meeting
Expectations
(Level 4)
Exceeding
Expectation
(Level 5)
District %
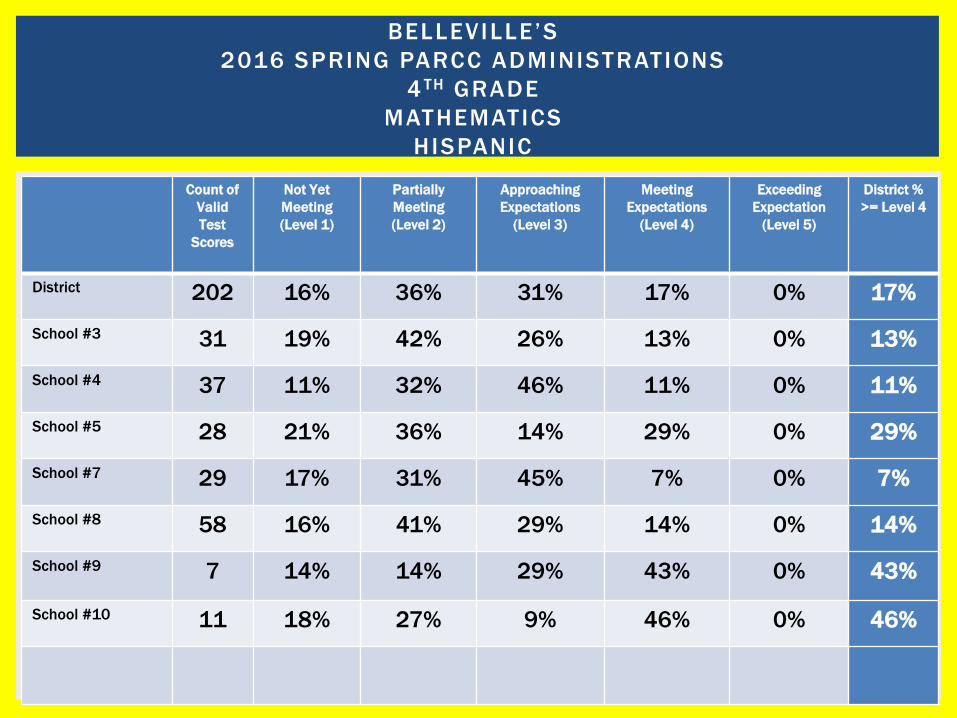
>= Level 4
District 202 16% 36% 31% 17% 0% 17%
School #3 31 19% 42% 26% 13% 0% 13%
School #4 37 11% 32% 46% 11% 0% 11%
School #5 28 21% 36% 14% 29% 0% 29%
School #7 29 17% 31% 45% 7% 0% 7%
School #8 58 16% 41% 29% 14% 0% 14%
School #9 7 14% 14% 29% 43% 0% 43%
School #10 11 18% 27% 9% 46% 0% 46%
BELLEVILLE’S
2016 SPRING PARCC ADMINISTRATIONS
4 TH GRADE
MATHEMATICS
HISPANIC

Count of
Valid
Test
Scores
Not Yet
Meeting
(Level 1)
Partially
Meeting
(Level 2)
Approaching
Expectations
(Level 3)
Meeting
Expectations
(Level 4)
Exceeding
Expectation
(Level 5)
District %
>= Level 4
District 22 9% 5% 27% 55% 5% 59%
School #3 5 0% 20% 20% 60% 0% 60%
School #4 3 0% 0% 0% 67% 33% 100%
School #5 3 67% 0% 0% 33% 0% 33%
School #7 3 0% 0% 100% 0% 0% 0%
School #8 2 0% 0% 50% 50% 0% 50%
School #9 0 0% 0% 0% 0% 0% 0%
School #10 6 0% 0% 17% 83% 0% 83%
BELLEVILLE’S
2016 SPRING PARCC ADMINISTRATIONS
4 TH GRADE
MATHEMATICS
ASIAN

Count of
Valid
Test
Scores
Not Yet
Meeting
(Level 1)
Partially
Meeting
(Level 2)
Approaching
Expectations
(Level 3)
Meeting
Expectations
(Level 4)
Exceeding
Expectation
(Level 5)
District %
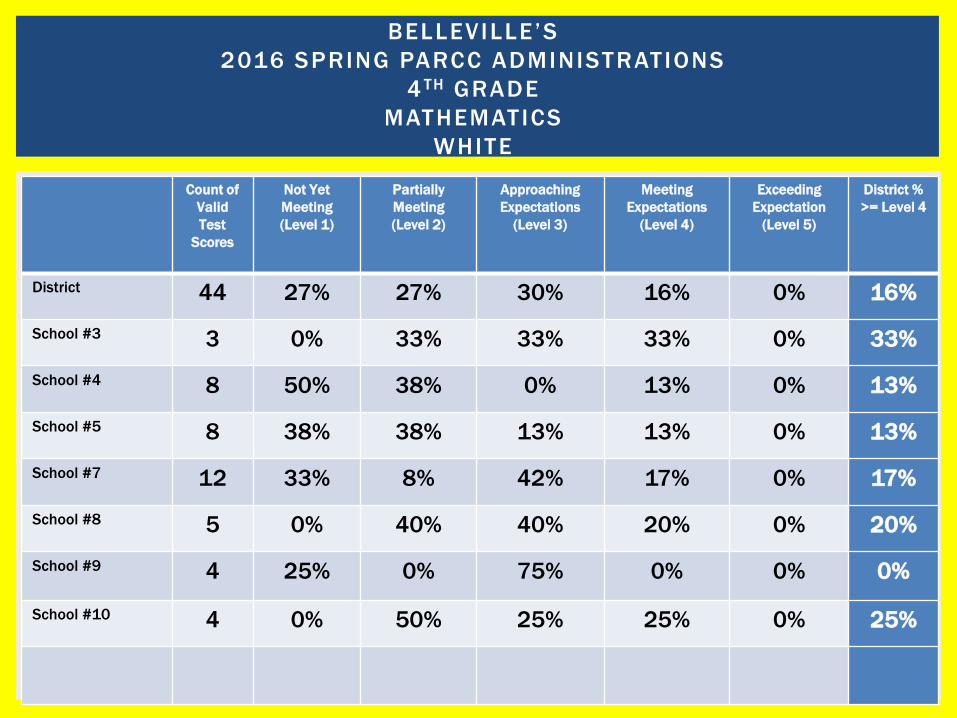
>= Level 4
District 36 25% 28% 31% 17% 0% 17%
School #3 6 33% 17% 33% 17% 0% 17%
School #4 5 0% 60% 40% 0% 0% 0%
School #5 2 0% 0% 50% 50% 0% 50%
School #7 7 29% 29% 43% 0% 0% 0%
School #8 9 33% 33% 22% 11% 0% 11%
School #9 4 25% 25% 25% 25% 0% 25%
School #10 3 33% 0% 0% 67% 0% 67%
BELLEVILLE’S
2016 SPRING PARCC ADMINISTRATIONS
4 TH GRADE
MATHEMATICS
BLACK
Count of
Valid
Test
Scores
Not Yet
Meeting
(Level 1)
Partially
Meeting
(Level 2)
Approaching
Expectations
(Level 3)
Meeting
Expectations
(Level 4)
Exceeding
Expectation
(Level 5)
District %
>= Level 4
District 44 27% 27% 30% 16% 0% 16%
School #3 3 0% 33% 33% 33% 0% 33%
School #4 8 50% 38% 0% 13% 0% 13%
School #5 8 38% 38% 13% 13% 0% 13%
School #7 12 33% 8% 42% 17% 0% 17%
School #8 5 0% 40% 40% 20% 0% 20%
School #9 4 25% 0% 75% 0% 0% 0%
School #10 4 0% 50% 25% 25% 0% 25%
BELLEVILLE’S
2016 SPRING PARCC ADMINISTRATIONS
4 TH GRADE
MATHEMATICS
WHITE

Count of
Valid
Test
Scores
Not Yet
Meeting
(Level 1)
Partially
Meeting
(Level 2)
Approaching
Expectations
(Level 3)
Meeting
Expectations
(Level 4)
Exceeding
Expectation
(Level 5)
District %
>= Level 4
District 101 18% 18% 32% 32% 1% 33%
School #3 11 18% 36% 27% 18% 0% 18%
School #4 19 11% 16% 37% 32% 5% 37%
School #5 16 38% 19% 13% 31% 0% 31%
School #7 21 14% 24% 52% 10% 0% 10%
School #8 16 25% 13% 25% 38% 0% 38%
School #9 3 33% 0% 67% 0% 0% 0%
School #10 15 0% 7% 20% 73% 0% 73%
BELLEVILLE’S
2016 SPRING PARCC ADMINISTRATIONS
4 TH GRADE
MATHEMATICS
ECONOMICALLY DISADVANTAGED (NO)

Count of
Valid
Test
Scores
Not Yet
Meeting
(Level 1)
Partially
Meeting
(Level 2)
Approaching
Expectations
(Level 3)
Meeting
Expectations
(Level 4)
Exceeding
Expectation
(Level 5)
District %
>= Level 4
District 205 19% 38% 30% 14% 0% 14%
School #3 34 18% 35% 27% 21% 0% 21%
School #4 34 18% 44% 35% 3% 0% 3%
School #5 25 20% 40% 16% 24% 0% 24%
School #7 31 26% 23% 45% 7% 0% 7%
School #8 59 14% 46% 31% 10% 0% 10%
School #9 12 17% 17% 33% 33% 0% 33%
School #10 9 33% 44% 0% 22% 0% 22%
BELLEVILLE’S
2016 SPRING PARCC ADMINISTRATIONS
4 TH GRADE
MATHEMATICS
ECONOMICALLY DISADVANTAGED (YES)

Count of
Valid
Test
Scores
Not Yet
Meeting
(Level 1)
Partially
Meeting
(Level 2)
Approaching
Expectations
(Level 3)
Meeting
Expectations
(Level 4)
Exceeding
Expectation
(Level 5)
District %
>= Level 4
District 58 48% 40% 5% 7% 0% 7%
School #3 11 36% 55% 9% 0% 0% 0%
School #4 12 67% 33% 0% 0% 0% 0%
School #5 8 50% 38% 0% 13% 0% 13%
School #7 10 50% 20% 20% 10% 0% 10%
School #8 12 33% 58% 0% 8% 0% 8%
School #9 3 33% 33% 0% 33% 0% 33%
School #10 2 100% 0% 0% 0% 0% 0%
BELLEVILLE’S
2016 SPRING PARCC ADMINISTRATIONS
4 TH GRADE
MATHEMATICS
STUDENTS WITH DISABIL IT IES (YES)

Count of
Valid
Test
Scores
Not Yet
Meeting
(Level 1)
Partially
Meeting
(Level 2)
Approaching
Expectations
(Level 3)
Meeting
Expectations
(Level 4)
Exceeding
Expectation
(Level 5)
District %
>= Level 4
District 12 40% 20% 30% 10% 0% 10%
School #3 4 33% 33% 33% 0% 0% 0%
School #4 1 0% 0% 100% 0% 0% 0%
School #5 1 100% 0% 0% 0% 0% 0%
School #7 1 100% 0% 0% 0% 0% 0%
School #8 5 20% 40% 20% 20% 0% 20%
School #9 0 0% 0% 0% 0% 0% 0%
School #10 0 0% 0% 0% 0% 0% 0%
BELLEVILLE’S
2016 SPRING PARCC ADMINISTRATIONS
4 TH GRADE
MATHEMATICS
LEP (YES)

Count of
Valid
Test
Scores
Not Yet
Meeting
(Level 1)
Partially
Meeting
(Level 2)
Approaching
Expectations
(Level 3)
Meeting
Expectations
(Level 4)
Exceeding
Expectation
(Level 5)
District %
>= Level 4
District 294 18% 32% 31% 20% 0% 20%
School #3 42 17% 36% 26% 21% 0% 21%
School #4 52 15% 35% 35% 13% 2% 15%
School #5 40 25% 33% 15% 28% 0% 28%
School #7 51 20% 24% 49% 8% 0% 8%
School #8 70 16% 39% 30% 16% 0% 16%
School #9 15 20% 13% 40% 27% 0% 27%
School #10 24 13% 21% 13% 54% 0% 54%
BELLEVILLE’S
2016 SPRING PARCC ADMINISTRATIONS
4 TH GRADE
MATHEMATICS
LEP (NO)

Count of
Valid
Test
Scores
Not Yet
Meeting
(Level 1)
Partially
Meeting
(Level 2)
Approaching
Expectations
(Level 3)
Meeting
Expectations
(Level 4)
Exceeding
Expectation
(Level 5)
District %
>= Level 4
District 146 12% 24% 30% 31% 3% 34%
School #3 25 16% 36% 36% 12% 0% 12%
School #4 18 17% 28% 22% 33% 0% 33%
School #5 20 10% 35% 30% 25% 0% 25%
School #7 32 13% 9% 22% 47% 9% 56%
School #8 35 14% 26% 40% 20% 0% 20%
School #9 10 0% 10% 20% 60% 10% 70%
School #10 6 0% 17% 17% 50% 17% 67%
BELLEVILLE’S
2016 SPRING PARCC ADMINISTRATIONS
5 TH GRADE
MATHEMATICS
FEMALES
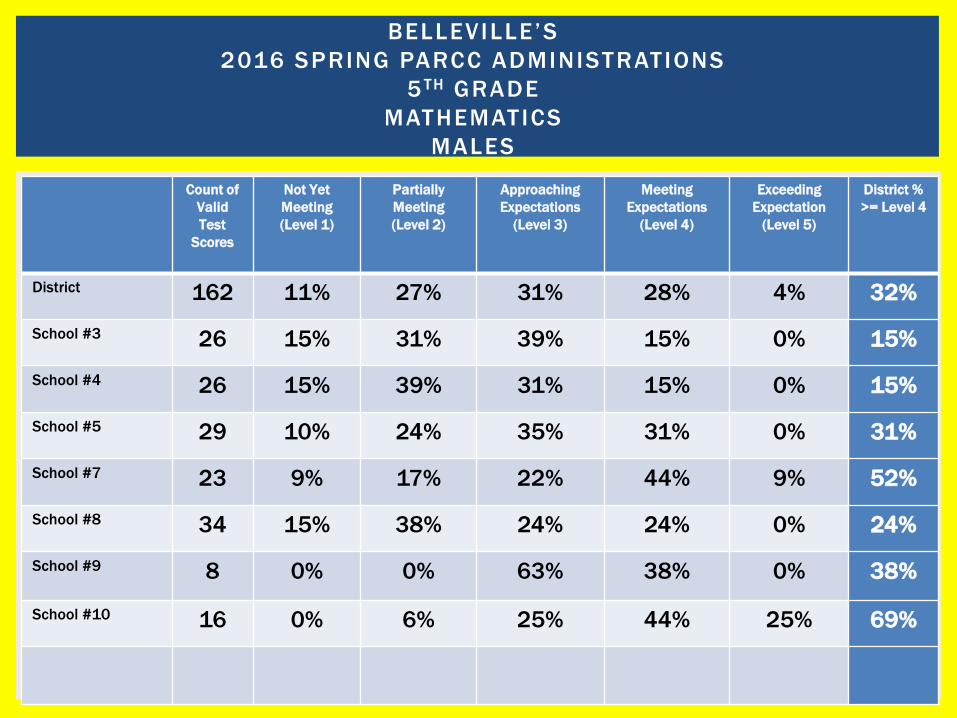
Count of
Valid
Test
Scores
Not Yet
Meeting
(Level 1)
Partially
Meeting
(Level 2)
Approaching
Expectations
(Level 3)
Meeting
Expectations
(Level 4)
Exceeding
Expectation
(Level 5)
District %
>= Level 4
District 162 11% 27% 31% 28% 4% 32%
School #3 26 15% 31% 39% 15% 0% 15%
School #4 26 15% 39% 31% 15% 0% 15%
School #5 29 10% 24% 35% 31% 0% 31%
School #7 23 9% 17% 22% 44% 9% 52%
School #8 34 15% 38% 24% 24% 0% 24%
School #9 8 0% 0% 63% 38% 0% 38%
School #10 16 0% 6% 25% 44% 25% 69%
BELLEVILLE’S
2016 SPRING PARCC ADMINISTRATIONS
5 TH GRADE
MATHEMATICS
MALES

Count of
Valid
Test
Scores
Not Yet
Meeting
(Level 1)
Partially
Meeting
(Level 2)
Approaching
Expectations
(Level 3)
Meeting
Expectations
(Level 4)
Exceeding
Expectation
(Level 5)
District %
>= Level 4
District 202 9% 29% 33% 26% 3% 29%
School #3 30 10% 47% 40% 3% 0% 3%
School #4 27 11% 33% 41% 15% 0% 15%
School #5 28 7% 36% 29% 29% 0% 29%
School #7 28 7% 18% 29% 40% 7% 46%
School #8 58 14% 33% 31% 22% 0% 22%
School #9 16 0% 6% 38% 50% 6% 56%
School #10 15 0% 6% 27% 53% 13% 67%
BELLEVILLE’S
2016 SPRING PARCC ADMINISTRATIONS
5 TH GRADE
MATHEMATICS
HISPANICS

Count of
Valid
Test
Scores
Not Yet
Meeting
(Level 1)
Partially
Meeting
(Level 2)
Approaching
Expectations
(Level 3)
Meeting
Expectations
(Level 4)
Exceeding
Expectation
(Level 5)
District %
>= Level 4
District 26 8% 4% 19% 50% 19% 69%
School #3 7 0% 0% 29% 71% 0% 71%
School #4 3 33% 0% 0% 67% 0% 67%
School #5 5 20% 20% 20% 40% 0% 40%
School #7 5 0% 0% 20% 40% 40% 80%
School #8 0 0% 0% 0% 0% 0% 0%
School #9 1 0% 0% 100% 0% 0% 0%
School #10 5 0% 0% 0% 40% 60% 100%
BELLEVILLE’S
2016 SPRING PARCC ADMINISTRATIONS
5 TH GRADE
MATHEMATICS
ASIAN
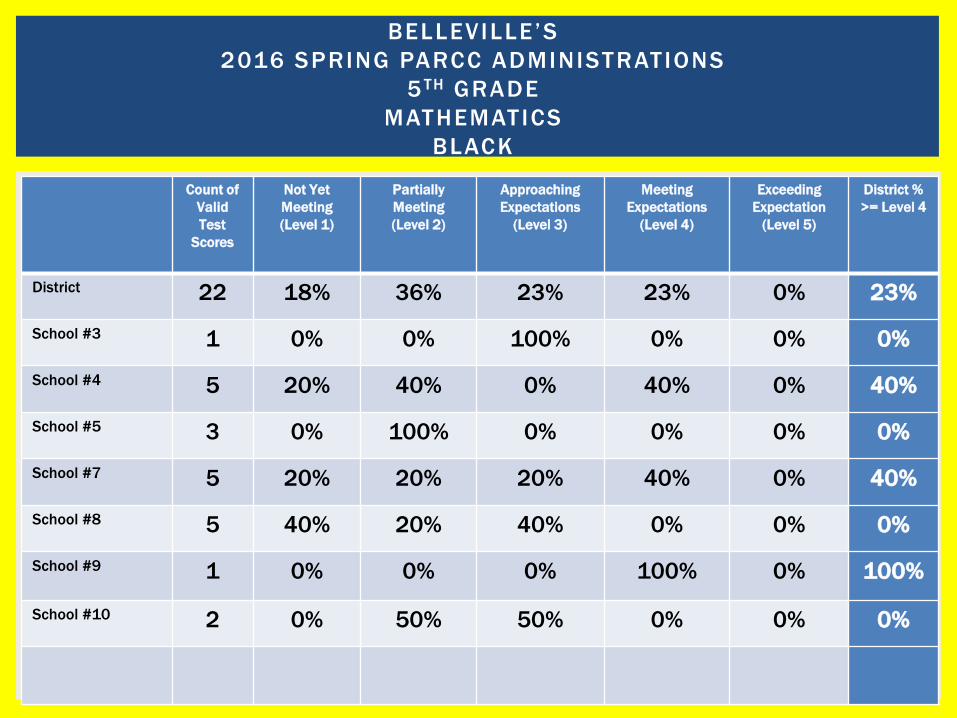
Count of
Valid
Test
Scores
Not Yet
Meeting
(Level 1)
Partially
Meeting
(Level 2)
Approaching
Expectations
(Level 3)
Meeting
Expectations
(Level 4)
Exceeding
Expectation
(Level 5)
District %
>= Level 4
District 22 18% 36% 23% 23% 0% 23%
School #3 1 0% 0% 100% 0% 0% 0%
School #4 5 20% 40% 0% 40% 0% 40%
School #5 3 0% 100% 0% 0% 0% 0%
School #7 5 20% 20% 20% 40% 0% 40%
School #8 5 40% 20% 40% 0% 0% 0%
School #9 1 0% 0% 0% 100% 0% 100%
School #10 2 0% 50% 50% 0% 0% 0%
BELLEVILLE’S
2016 SPRING PARCC ADMINISTRATIONS
5 TH GRADE
MATHEMATICS
BLACK

Count of
Valid
Test
Scores
Not Yet
Meeting
(Level 1)
Partially
Meeting
(Level 2)
Approaching
Expectations
(Level 3)
Meeting
Expectations
(Level 4)
Exceeding
Expectation
(Level 5)
District %
>= Level 4
District 56 21% 18% 29% 30% 2% 32%
School #3 13 39% 23% 31% 8% 0% 8%
School #4 9 22% 44% 11% 22% 0% 22%
School #5 13 15% 0% 54% 31% 0% 31%
School #7 16 19% 6% 13% 56% 6% 63%
School #8 5 0% 40% 40% 20% 0% 20%
School #9 0 0% 0% 0% 0% 0% 0%
School #10 0 0% 0% 0% 0% 0% 0%
BELLEVILLE’S
2016 SPRING PARCC ADMINISTRATIONS
5 TH GRADE
MATHEMATICS
WHITE

Count of
Valid
Test
Scores
Not Yet
Meeting
(Level 1)
Partially
Meeting
(Level 2)
Approaching
Expectations
(Level 3)
Meeting
Expectations
(Level 4)
Exceeding
Expectation
(Level 5)
District %
>= Level 4
District 91 4% 24% 39% 24% 9% 33%
School #3 18 17% 33% 50% 0% 0% 0%
School #4 12 0% 33% 25% 42% 0% 42%
School #5 16 0% 38% 50% 13% 0% 13%
School #7 20 0% 10% 20% 45% 25% 70%
School #8 15 7% 20% 53% 20% 0% 20%
School #9 3 0% 0% 33% 67% 0% 67%
School #10 7 0% 14% 29% 14% 43% 57%
BELLEVILLE’S
2016 SPRING PARCC ADMINISTRATIONS
5 TH GRADE
MATHEMATICS
ECONOMICALLY DISADVANTAGED (NO)
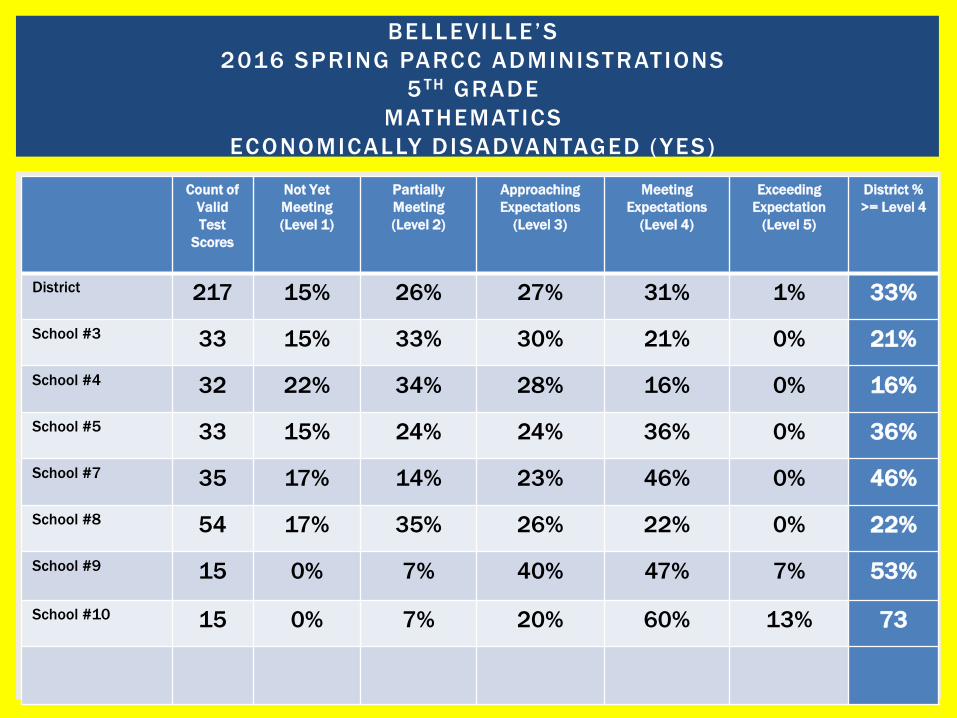
Count of
Valid
Test
Scores
Not Yet
Meeting
(Level 1)
Partially
Meeting
(Level 2)
Approaching
Expectations
(Level 3)
Meeting
Expectations
(Level 4)
Exceeding
Expectation
(Level 5)
District %
>= Level 4
District 217 15% 26% 27% 31% 1% 33%
School #3 33 15% 33% 30% 21% 0% 21%
School #4 32 22% 34% 28% 16% 0% 16%
School #5 33 15% 24% 24% 36% 0% 36%
School #7 35 17% 14% 23% 46% 0% 46%
School #8 54 17% 35% 26% 22% 0% 22%
School #9 15 0% 7% 40% 47% 7% 53%
School #10 15 0% 7% 20% 60% 13% 73
BELLEVILLE’S
2016 SPRING PARCC ADMINISTRATIONS
5 TH GRADE
MATHEMATICS
ECONOMICALLY DISADVANTAGED (YES)
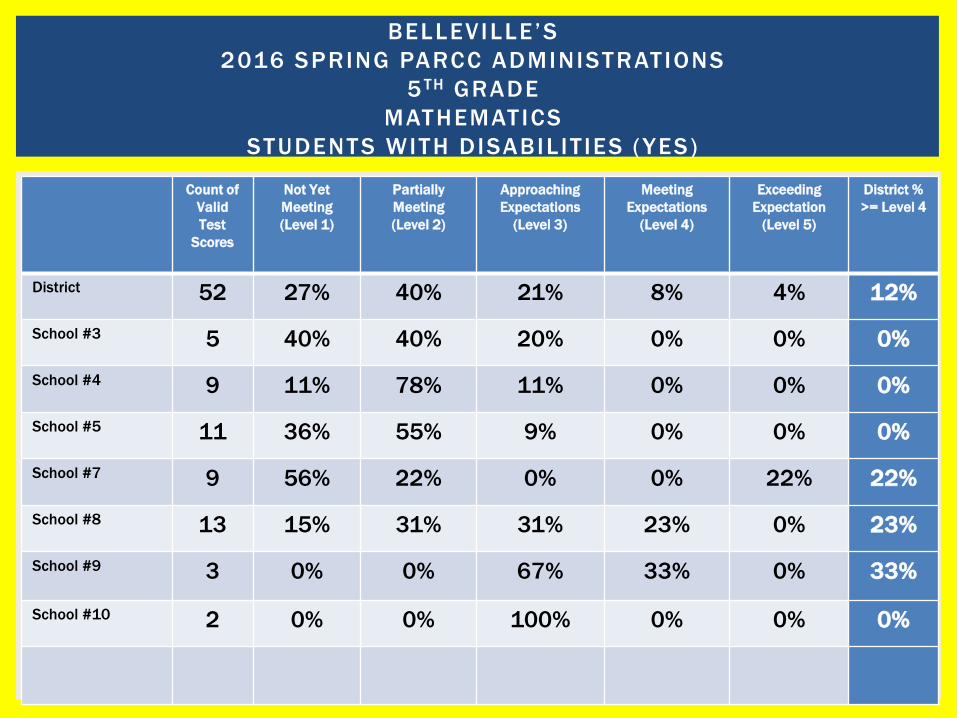
Count of
Valid
Test
Scores
Not Yet
Meeting
(Level 1)
Partially
Meeting
(Level 2)
Approaching
Expectations
(Level 3)
Meeting
Expectations
(Level 4)
Exceeding
Expectation
(Level 5)
District %
>= Level 4
District 52 27% 40% 21% 8% 4% 12%
School #3 5 40% 40% 20% 0% 0% 0%
School #4 9 11% 78% 11% 0% 0% 0%
School #5 11 36% 55% 9% 0% 0% 0%
School #7 9 56% 22% 0% 0% 22% 22%
School #8 13 15% 31% 31% 23% 0% 23%
School #9 3 0% 0% 67% 33% 0% 33%
School #10 2 0% 0% 100% 0% 0% 0%
BELLEVILLE’S
2016 SPRING PARCC ADMINISTRATIONS
5 TH GRADE
MATHEMATICS
STUDENTS WITH DISABIL IT IES (YES)

Count of
Valid
Test
Scores
Not Yet
Meeting
(Level 1)
Partially
Meeting
(Level 2)
Approaching
Expectations
(Level 3)
Meeting
Expectations
(Level 4)
Exceeding
Expectation
(Level 5)
District %
>= Level 4
District 256 9% 22% 32% 34% 4% 37%
School #3 46 13% 33% 39% 15% 0% 15%
School #4 35 17% 23% 31% 29% 0% 29%
School #5 38 3% 21% 40% 37% 0% 37%
School #7 46 2% 11% 26% 54% 7% 61%
School #8 56 14% 32% 32% 21% 0% 21%
School #9 15 0% 7% 33% 53% 7% 60%
School #10 20 0% 10% 15% 50% 25% 75%
BELLEVILLE’S
2016 SPRING PARCC ADMINISTRATIONS
5 TH GRADE
MATHEMATICS
STUDENTS WITH DISABIL IT IES (NO)
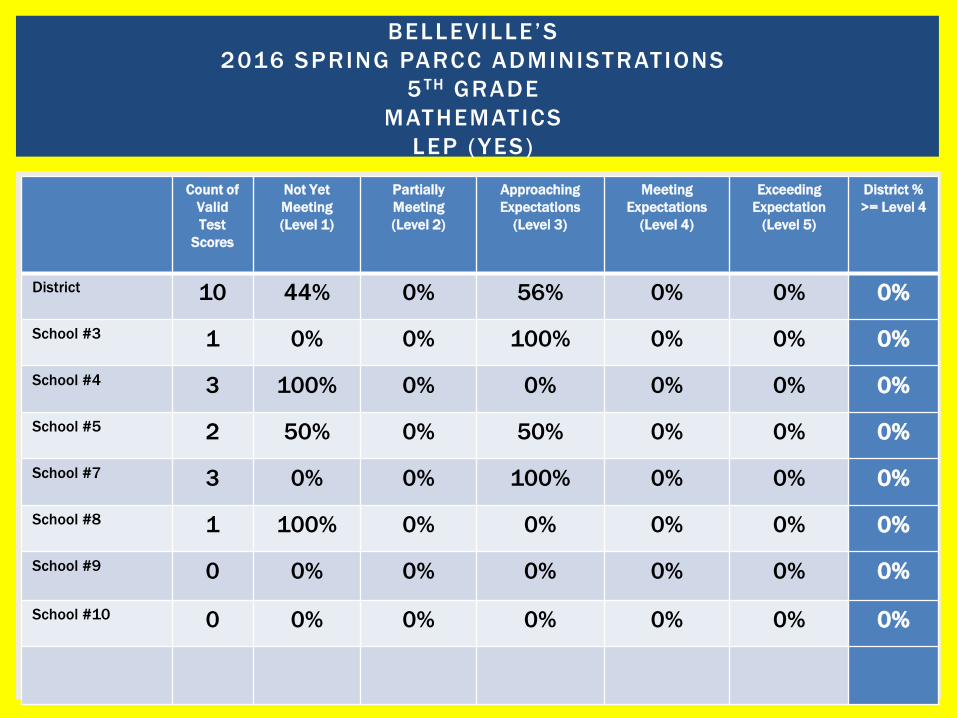
Count of
Valid
Test
Scores
Not Yet
Meeting
(Level 1)
Partially
Meeting
(Level 2)
Approaching
Expectations
(Level 3)
Meeting
Expectations
(Level 4)
Exceeding
Expectation
(Level 5)
District %
>= Level 4
District 10 44% 0% 56% 0% 0% 0%
School #3 1 0% 0% 100% 0% 0% 0%
School #4 3 100% 0% 0% 0% 0% 0%
School #5 2 50% 0% 50% 0% 0% 0%
School #7 3 0% 0% 100% 0% 0% 0%
School #8 1 100% 0% 0% 0% 0% 0%
School #9 0 0% 0% 0% 0% 0% 0%
School #10 0 0% 0% 0% 0% 0% 0%
BELLEVILLE’S
2016 SPRING PARCC ADMINISTRATIONS
5 TH GRADE
MATHEMATICS
LEP (YES)

Count of
Valid
Test
Scores
Not Yet
Meeting
(Level 1)
Partially
Meeting
(Level 2)
Approaching
Expectations
(Level 3)
Meeting
Expectations
(Level 4)
Exceeding
Expectation
(Level 5)
District %
>= Level 4
District 298 10% 26% 30% 30% 4% 34%
School #3 50 16% 34% 36% 14% 0% 14%
School #4 41 10% 37% 29% 24% 0% 24%
School #5 47 9% 30% 32% 30% 0% 30%
School #7 52 12% 13% 17% 48% 10% 58%
School #8 68 13% 32% 32% 22% 0% 22%
School #9 18 0% 6% 39% 50% 6% 56%
School #10 22 0% 9% 23% 45% 23% 68%
BELLEVILLE’S
2016 SPRING PARCC ADMINISTRATIONS
5 TH GRADE
MATHEMATICS
LEP (NO)
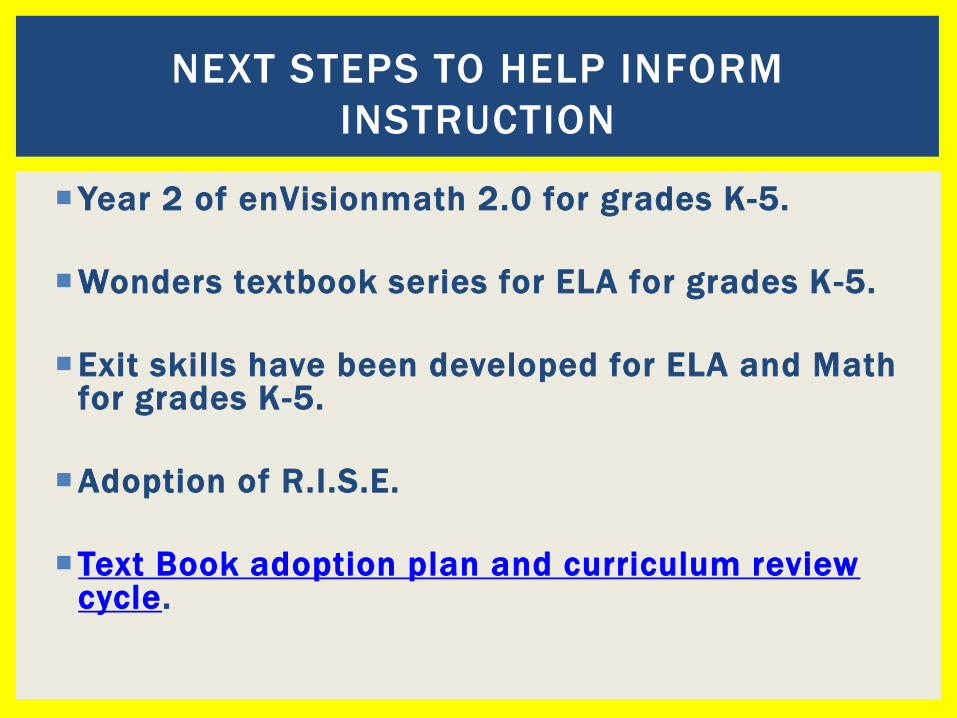
NEXT STEPS TO HELP INFORM
INSTRUCTION
Year 2 of enVisionmath 2.0 for grades K-5.
Wonders textbook series for ELA for grades K-5.
Exit skills have been developed for ELA and Math for grades K-5.
Adoption of R.I.S.E.
Text Book adoption plan and curriculum review cycle.
QUESTIONS TO GUIDE PARCC DATA
REFLECTION
How will we use PARCC data to identify strengths and gaps that exist in our curriculum and instruction?
How will we use PARCC data as a tool to address areas in need of improvement or enhancement?
How can we provide additional resources and support for our educators to meet the learning needs of all our students?
111
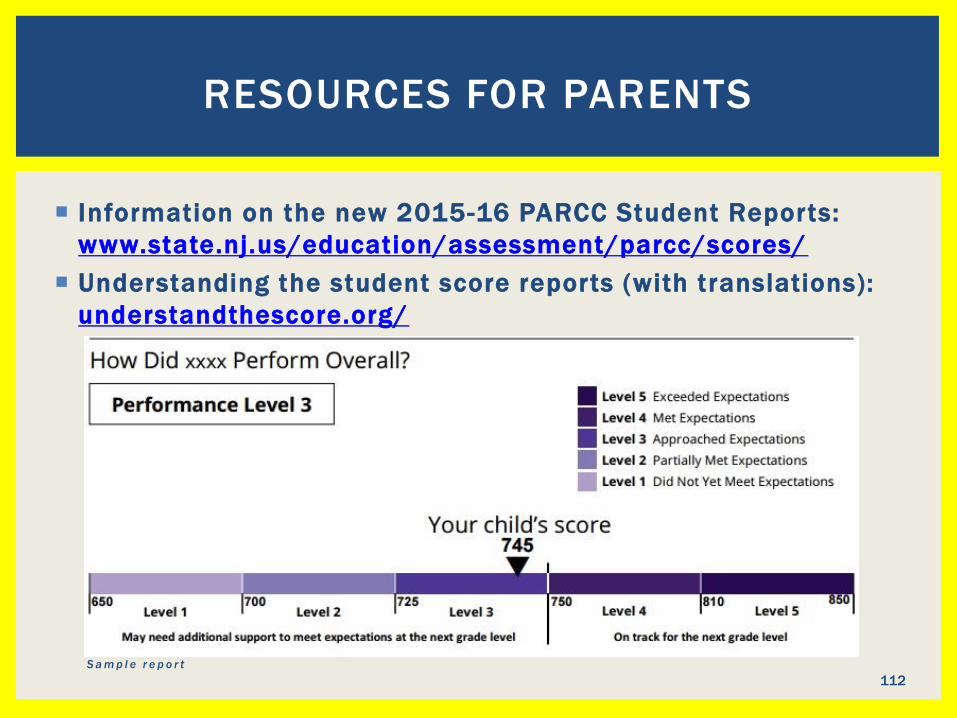
RESOURCES FOR PARENTS
Information on the new 2015-16 PARCC Student Reports:
www.state.nj.us/education/assessment/parcc/scores/
Understanding the student score reports (with translations):
understandthescore.org/
S a m p l e r e p o r t
112